
Imaging network level language recovery after left PCA stroke
Abstract
Purpose: The neural mechanisms that support aphasia recovery are not yet fully understood. Our goal was to evaluate longitudinal changes in naming recovery in participants with posterior cerebral artery (PCA) stroke using a case-by-case analysis.
Methods: Using task based and resting state functional magnetic resonance imaging (fMRI) and detailed language testing, we longitudinally studied the recovery of the naming network in four participants with PCA stroke with naming deficits at the acute (0 week), sub acute (3–5 weeks), and chronic time point (5–7 months) post stroke. Behavioral and imaging analyses (task related and resting state functional connectivity) were carried out to elucidate longitudinal changes in naming recovery.
Results: Behavioral and imaging analysis revealed that an improvement in naming accuracy from the acute to the chronic stage was reflected by increased connectivity within and between left and right hemisphere “language” regions. One participant who had persistent moderate naming deficit showed weak and decreasing connectivity longitudinally within and between left and right hemisphere language regions.
Conclusions: These findings emphasize a network view of aphasia recovery, and show that the degree of inter- and intra- hemispheric balance between the language-specific regions is necessary for optimal recovery of naming, at least in participants with PCA stroke.
1Introduction
A major body of research has been dedicated to understanding how language recovers after a stroke. Structural and functional imaging studies indicate that recovery of language after a stroke is a complex process, and distinct mechanisms are operative at different times during recovery and vary across individuals. These mechanisms include restoration of blood flow, recovery from diaschisis (i.e., impairment caused by loss of input due to a cortical area remote to the lesion), and reorganization of structure-function relationships. Reorganization is assumed to reflect neuroplasticity. Early recovery from vascular aphasia syndromes is likely attributable to restoration of blood flow (Hillis & Heidler, 2002; Jacquin et al., 2014; Marsh & Hillis, 2006), whereas later recovery may be attributable to reorganization in which other areas of the brain take over the functions of the damaged region (Fridriksson, Richardson, Fillmore, & Cai, 2012; Hillis, 2007; Jarso et al., 2013; Saur et al.,2006). For a detailed review see (Anglade, Thiel, & Ansaldo, 2014).
The functional neuroimaging literature on post stroke language recovery indicates that recovery is supported by either recruitment of areas surrounding the lesion in the language-dominant left hemisphere (LH), or altered activity of intact homologues language areas in the non-dominant right hemisphere (RH), or both. The functional relevance of the enhanced recruitment of the RH during language processing in individuals with aphasia is, however, still under debate. Some studies support that good recovery is accompanied by greater perilesional than RH reorganization (e.g., Fridriksson, 2010; Perani et al., 2003; Postman-Caucheteux et al., 2010; Saur et al., 2006; Winhuisen et al., 2007), whereas other studies have emphasized the compensatory role of RHrecruitment (eg., Abo et al., 2004; Blank, Bird, Turkheimer, & Wise, 2003; Blasi et al., 2002; Turkeltaub et al., 2012).
These heterogeneous findings regarding the recruitment of RH in language recovery, at least in terms of fMRI activity, could be related to differences in the degree of impairment, time after stroke, site and size of lesion, and nature of the imaging task (e.g., Sebastian & Kiran, 2011). A majority of the studies have investigated patterns of activation in the chronic stage of stroke, starting after about 6 months post stroke. The focus of these studies is not on the ‘recovery process’ per se, but rather on cross sectional investigations of specific language functions of patients who have continued to have deficits but have recovered to various degrees. To date, only a few studies have investigated longitudinal functional neuroimaging changes with a focus on language recovery (e.g., Heiss, Kessler, Thiel, Ghaemi, & Karbe, 1999; Jarso et al., 2013; Saur et al., 2006). Furthermore, most studies on aphasia recovery have included patients with lesions of different sizes and distributions in the left middle cerebral artery territory, an artery that supplies to key language regions in the LH. In addition, most have only examined task-evoked responses of individual regions; limited attention has been paid to the functional interactions among brain regions in aphasia recovery.
In contrast with the majority of functional neuroimaging studies on aphasia recovery, this study focuses on a group of individuals with posterior cerebral artery (PCA) stroke. Understanding recovery in PCA stroke has advantages because lesion volume is often smaller than middle cerebral artery (MCA) stroke (for patients with similar degrees of naming impairment), and many of the core language regions such as frontal and superior and middle temporal regions are not affected. For example, a 1 cc infarct in the left thalamus (usually in the PCA territory) can cause marked language deficits (Cox & Heilman, 2011; Raymer, Moberg, Crosson, Nadeau, & Gonzalez Rothi, 1997a; Sebastian, et al., 2014a, for a review see De Witte et al., 2011). Strokes in the PCA territory, including inferior temporal, fusiform, thalamus, hippocampus, and occipital plus splenium lesions often lead to language deficits, along with concurrent memory and visual field deficits (e.g., Cals, Devuyst, Afsar, Karapanayiotides, & Bogousslavsky, 2002; Karussis, Leker, & Abramsky, 2000; Llano, 2013; Marsh & Hillis, 2005; Price & Devlin, 2003; Raymer et al., 2007a, 2007b; Sebastian et al., 2014b; Servan, Verstichel, Catala, Yakovleff, & Rancurel, 1995). Importantly, however, patients with PCA strokes do not have damage to the “language cortex” regions of interest, allowing evaluation of changes in activation in these regions and connectivity between regions as possible markers of aphasia recovery. Also, they do not have hypoperfusion (on the basis of vascular stenosis) of MCA language cortex, which can complicate analysis of the BOLD response in fMRI studies.
The goal of this study is to evaluate neural mechanisms underlying longitudinal changes in naming performance in aphasia due to left PCA stroke, using a case-by-case analysis of multimodality imaging. Understanding longitudinal changes with specific emphasis on individual differences in recovery pattern will be key to developing maximally effective neuromodulatory treatments. Because left PCA stroke can acutely cause perturbation of the language network, assessments of the changes in functional interactions among language network brain areas with recovery, using connectivity analysis may provide novel insights about language recovery. Using participants without lesions to the network itself simplifies the analysis and may yield more similar patterns across individuals. However, the basic findings, about the relationships between connectivity and recovery, may also apply to patients with lesions to components of the language network itself.
To that end, we conducted longitudinal MRI (task based and resting state) along with repeated behavioral testing after left PCA stroke, and examined changes in whole brain activation patterns and for potential correlations between the patterns of functional connectivity changes within the language network and recovery of language skills. Thus (1) we aimed to identify changes in neural activation associated with naming at the acute time point (0 week), sub acute time point (3–5 weeks), and chronic time point (5–7 months) in patients with PCA stroke, and (2) to characterize the dynamics of functional connectivity changes (resting state connectivity) within the bilateral language network. We hypothesized that (1) even individuals whose strokes do not involve “language cortex” regions of interest (left inferior frontal gyrus-IFG, inferior temporal gyrus-ITG, middle temporal gyrus-MTG, superior temporal gyrus-STG, supramarginal gyrus-SMG, or angular gyrus-AG) would show different patterns of activation change over time in these “language cortex” regions of interest, (2) recovery of naming skills is associated with strengthening of functional connectivity between these language cortex regions and their right hemisphere homologues.
2Methods
2.1Participants
Four right-handed participants with acute ischemic left hemisphere PCA stroke and naming deficits were recruited from the inpatient units or the Emergency Department at Johns Hopkins Hospital for this longitudinal study. These participants are part of an ongoing longitudinal project on the Stroke Cognitive Outcome and REcovery (SCORE) study. Participants ranged in age from 46–60 years (mean age = 53.5 years). All participants obtained at least 12th grade education and gave informed consent according to the Human Subjects Protocol for Johns Hopkins University. All participants were admitted and received clinical MRI within 24 hours of symptom onset. Additional exclusion criteria were as follows: (i) contraindication for MRI (e.g., implanted ferrous metal, claustrophobia); (ii) allergy to Gadolinium; (iii) hemorrhage on initial CT or MRI; (iv) impaired arousal or agitation requiring ongoing sedation; and (v) history of global intellectual deterioration (e.g., dementia); (vi) previous neurological disease involving the brain including any previous symptomatic stroke; (vii) uncorrected visual acuity or hearing acuity.
One right-handed healthy control (59 years/F) also participated in longitudinal imaging and language testing. The healthy control had normal hearing and normal vision. Exclusion criteria included neurological disorders such as stroke, transient ischemic attacks, Parkinson’s disease, Alzheimer’s disease, psychological illness, learning disability, seizures, and attention deficit disorders. Demographic data of participants are provided in Table 1.
Participant 1’s (P1) acute lesion involved the left occipital cortex, fusiform, lingual gyrus, and splenium and hypoperfusion surrounding the lesion in the PCA territory. The other three participants’ (P2, P3, and P4) acute lesions involved the left thalamus. P2 had an old asymptomatic chronic lacune at baseline. In addition to naming deficits, participants also presented with right-sided hemianopsia (P1), blurry vision (P4), mild right dysmetria (P2), right sensory loss (P2), right-sided weakness (P3 and P4), confusion (P3 and P4), and ataxia (P4). See Fig. 1 for lesion information and supplemental material S1 for perfusion imaging data.
2.2Language testing
Participants underwent detailed language testing at the acute stage and follow up time points. Follow up time points include subacute (3–5 weeks), and chronic time point (5–7 months). The following language tests were administered: short version of the Boston Diagnostic Aphasia Examination (BDAE-3, Goodglass, Kaplan, & Barresi, 2000), Boston Naming Test (BNT-2, Kaplan, Goodglass, & Weintraub, 2001), Pyramids and Palm Trees: Short Form (PPT; Breining et al., 2015a), and HANA (Hopkins Action Naming Test, Breining et al., 2015b). See Table 2 for percentage of accurate responses on each of the language tests.
2.3Imaging
All participants with stroke underwent clinical and research scans at the acute time point. Research scans were administered for participants with stroke at the follow up time points and for the normal controls at all time points. Clinical scans were obtained within 24 hours from admission to the hospital. Participants with stroke had T2, fluid attenuation inversion recovery (FLAIR; to evaluate for old lesions), susceptibility weighted images (to evaluate for hemorrhage), Perfusion Weighted Imaging (PWI; to evaluate for areas of hypoperfusion), Diffusion Weighted Imaging (DWI; to evaluate for acute ischemia), and MR angiography (to evaluate for stenosis, occlusion, aneurysm). Clinical scans were acquired on a Siemens 3-T Magnetom Trio scanner, equipped with a 8-channel head coil. DWI was acquired using a single-shot echo-planar imaging (EPI) pulse sequence with the following parameters [(field of view (FOV) =220 × 220 mm, matrix = 160 × 160, time to repetition (TR) = 5700 ms, echo time (TE) = 87 ms, slice thickness = 4 mm]. PWI was acquired using EPI with the following parameters: (FOV = 230 × 230 mm, TR =1640 ms, TE = 35 ms, matrix = 128 × 128). 20 cc of gadolinium was administered, using a power injector, with a 10-s delay, at a rate of 5 cc s–1. Areas of hypoperfusion in PWI were determined with Time to Peak (TTP) maps, using ImageJ (http://imagej.nih.gov/ij/). Regions of hypoperfusion were delineated by analysis of 20 color TTP maps. Hypoperfusion was defined as >4 s mean delay in TTP arrival of contrast across voxels in the region of interest (ROI) relative to the homologous region in the non-ischemic hemisphere.
Research scans were acquired on a 3-T Philips Achieva MRI scanner, equipped with a 32-channel head coil. Research scans at the acute time point were obtained between 48–72 hours from admission to the hospital. The MRI acquisition protocol was 70 minutes long. A subset of data pertaining to this paper includes the following: magnetization prepared rapid gradient echo (MPRAGE) and blood oxygen level dependent (BOLD) imaging. BOLD imaging included task based and resting state acquisitions. The language paradigm timing was synchronized to the BOLD acquisition using the radio frequency (RF) signal from the RF trigger box. BOLD task based images were acquired using EPI and the following scan parameters were used: TR = 2000 ms, TE = 30 ms, flip-angle = 90°, matrix = 64 × 64, FOV = 240 × 240 mm, 35 3 mm parallel axial slices covering the whole brain (158 volumes with an additional 8 s dummy scans).Resting state images were acquired using EPI and the following scan parameters were used: TR = 2000 ms, TE = 30 ms, flip-angle = 90°, matrix = 64 × 64, FOV =240 × 240 mm, 35 3 mm parallel axial slices covering the whole brain, 210 volumes. 3D MPRAGE was acquired in the sagittal plan utilizing a multishot, turbo field echo pulse sequence with 256 × 256 matrix, FOV = 256 × 240 × 204 mm, TR/TE/TI = 6800/31/850 ms, and 170 1 mm slices. During resting state BOLD fMRI scans, participants were instructed to keep their eyes open and maintain fixation at a point on the display screen inside the magnet.
2.4fMRI task
The experiment consisted of a cued picture naming task (Holland et al., 2011). Participants were instructed to overtly name the picture presented on the screen. Each picture was presented concurrently with an auditory cue, which was either: (i) a whole word (ii) an initial phoneme or (iii) an unintelligible auditory noise (Holland et al., 2011). This task was selected based on the premise that successful functional imaging in participants with aphasia requires the selection of tasks that are achievable given their level of impairment (Price & Friston, 1999). The picture naming task consisted of 60 grey-scaled pictures taken from the international picture-naming project database (Bates et al., 2003). The control condition consisted of passively viewing grey-scaled scrambled pictures. The scrambled pictures were derived by pixellating photographs from the naming task using Adobe PhotoShop7.0. All pictures were concrete nouns controlled for syllable length, frequency of occurrence (Frances & Kucera, 1983), imageability (Gilhooly & Logie, 1980), familiarity (Gilhooly & Logie, 1980; Toglia & Battig, 1978) and concreteness (Gilhooly & Logie, 1980). The order of pictures and accompanying cues was counterbalanced to ensure that the same picture and cue pairing was not presented during the runs. The order of presentation of each stimulus was randomized with each block. Each picture was preceded by a fixation cross for 0.5 seconds and displayed for 3.5 seconds. Each scrambled picture was presented for 7 seconds. The task conditions were presented in a block design, with 6 picture trials in one block (24 seconds) followed by a block of scrambled picture (7 seconds). Participants completed two functional runs (i.e., 10 blocks of naming and 10 blocks of scrambled picture viewing in each run).
The stimuli were presented with Psychtoolbox in conjunction with Matlab using an Optimo PK320 pico-projector system. Noise cancelling microphone output from the scanner room was run through the penetration panel and connected to a Macintosh Laptop Computer in the scanner control room. The AudacityTM software on the computer recorded verbal responses from each scanning run. These responses were scored for accuracy and reaction time off-line. Participants were trained outside the scanner prior to the task to ensure that they understood the task and are able to perform the task.
2.5Data analyses
2.5.1Behavioral
The data were analyzed in terms of accuracy and reaction times. Naming latencies were measured from recorded sound files as the duration between the onset of the stimulus and the onset of the participant’s response. Only correct responses were entered into the reaction time (RT) analysis. Analysis of variance (ANOVA) was used to examine potential differences in task performance (mean accuracy, mean RT) between time points. Statistica software was used to perform the ANOVAs.
2.5.2Whole brain analyses
All fMRI data were analyzed using the Oxford Centre for Functional MRI of the Brain (FMRIB)—FMRIB’s software library (FSL) version 5.9 (Smith et al., 2004; Woolrich et al., 2009). Pre-statistical processing included motion correction (MCFLIRT); non-brain removal (BET); spatial smoothing (FWHM = 5 mm); and high-pass temporal filtering. Individual fMRI data were registered to the high-resolution MPRAGE using Boundary-Based Registration (BBR) implemented in FSL (Greve & Fischl, 2009) and the high resolution MPRAGE was registered to the MNI standard space using FMRIB’s nonlinear image registration tool (FNIRT), a fast and accurate nonlinear registration program (Anderson, Jenkinson, & Smith, 2007; Jenkinson et al., 2012). Lesion masking was also applied to the patient data during this step to ensure good registration. Registration quality was checked by visual inspection. Task related BOLD images were analyzed using the general linear model. Each condition was modeled separately, with each correct trial modeled in its entirety in a block design fashion. Motion parameters were entered as covariates to correct for head motion artifacts. The average motion values were less than 0.5 mm across the three time points for all the participants. In all analyses the contrasts between conditions were estimated on the first level for each run, and then the two runs for each participant were combined using a fixed effects model in order to produce an average activation map for each individual. The contrasts included: all cue picture naming versus scrambled pictures, phonemic+word cued naming versus scrambled pictures, phonemic cued naming versus scrambled pictures, word cued naming versus scrambled pictures, and noise cued naming versus scrambled pictures. We used cluster level thresholding as implemented in FSL FEAT, with an initial z value of 3.0 (corrected) and p < 0.05 in all analyses.
Longitudinal analyses was carried out to investigate whether or not the patterns of activation differed significantly between the acute scan and follow up time points for each participant. We contrasted 6 months (5–7M) activation to that of acute (0W) and subacute (3–5W) and between subacute and acute. Change in BOLD signal over time during phonemic+word cued naming versus scrambled pictures and noise cued naming versus scrambled pictures were estimated.
2.5.3Task based regions of interest analyses
Regions of interest (ROI) analyses were done in order to examine the longitudinal changes in the patterns of mean BOLD signal change in the language regions. The ROI included regions in the LH “language cortex” and RH homologues: inferior frontal gyrus (IFG, pars opercularis, pars triangularis, and pars orbitalis), superior temporal gyrus (STG), middle temporal gyrus (MTG), inferior temporal gyrus (ITG), supramarginal gyrus (SMG), angular gyrus (AG). These ROI were chosen on the basis of previous fMRI studies of language that have demonstrated activation of these regions in a variety of language tasks (e.g., Bartels & Zeki, 2005; Parker Jones et al., 2012; Prabhakaran et al., 2007; Segaert, Menenti, Weber, Petersson, & Hagoort, 2012). The anatomical mask for each ROI was generated from multiple atlases (45 adult brain atlases, segmented on 289 parcels) and is available at BrainGPS (https://braingps.mricloud.org). Each participant’s high resolution MPRAGE was segmentted by using the multi-atlas mapping and parcellation approach based on the large deformation diffeomorphic metric mapping, LDDMM (Beg, Miller, Trouvé, & Younes, 2005; Tang et al., 2013, 2015). The whole procedure was performed automatically in BrainGPS. This highly accurate diffeomorphic algorithm, associated with multiple atlases, minimizes the mapping inaccuracies due to the atrophy or local shape deformations. In addition, we used “artificial” images for the brain mapping, where the stroke was masked out and substituted by the normal tissue of the contra lateral hemisphere. This helped to minimize inaccuracies caused by the focal changes in intensity due to the stroke. ROIs were registered to each participant’s functional coordinate space and then used to extract BOLD percentage signal changes from fMRI data using Featquery (part of FSL) for the main contrast of interest (phonemic+word cued naming versus scrambled pictures) for the 3 time points. It should be noted that no percentage of the voxels defining the language ROIs were damaged in the patients.
2.5.4Resting state functional connectivity analysis
In the current study, we investigated the intra-hemispheric and inter-hemispheric connectivity of the language ROIs. For the resting state functional connectivity analysis, the resting state dynamics were coregistered, motion and slice timing corrected based on SPM routines. The high resolution MPRAGE and respective parcellation map obtained in the previous step (ROI analyses) were coregistered to the functional dynamics and time courses were obtained for more than 289 ROIs (we only report time courses for the specific language ROIs). The gray matter time courses from 78 ROIs (including the language ROIs) were regressed for physiological nuisance by applying CompCor (Behzadi, Restom, Liau, & Liu, 2007) and ART, an SPM toolbox to identify the motion and intensity outliers. We performed global and motion correction with respective thresholds of 2 and 9 with ART. Cerebro spinal fluid and white matter signals that carry information about breathing and pulsation were regressed out using CompCor. From the “nuisance-corrected” time courses we obtained the parcel-by-parcel correlation matrices, z-transformed by Fisher’s method. The whole procedure was performed automatically in BrainGPS (Li et al., 2015). For more details on the processing pipeline, please read (Faria et al., 2012). In total, the correlation was assessed across 12 ROIs in the language network corresponding to the left and right IFG, STG, MTG, ITG, SMG, and AG. The connectivity score for an ROI pair (e.g. between left and right IFG) is the Fisher z-score that is computed from the correlation coefficient for the temporal correlation between the two ROIs. This analysis was repeated for all the participants at all the three time periods (0 week, 3–5 weeks, and 5–7 months).
3Results
3.1Behavioral
3.1.1Language battery
The results of the battery of language tests administered longitudinally are shown in Table 2. Language assessment revealed severely impaired picture naming and oral reading and mild to moderate word retrieval deficits in conversation for P1. It should be noted that P1 had relatively spared tactile naming and recognition of orally spelled words. Example of errors on the BNT include explosion for volcano; something to ride for camel. Consistent with the hypothesis that she had optic aphasia, rather than aperceptive visual agnosia, she was 100% accurate on a 40-item object decision task, with non-objects that were chimeric figures of two objects (e.g a cow’s body with a buck’s head). Follow up imaging and language testing at 3 weeks demonstrated reperfusion of the hypoperfused tissue in the PCA territory that was present at the acute time point (see supplemental material S1 for perfusion imaging data). P1 made improvements in her language skills but continued to have word retrieval deficits on picture naming task and conversation at 3 weeks. At 5 months follow up time point she recovered to normal language skills. This participant continued to have episodic memory deficits.
Language assessment for P2 revealed mild word retrieval deficits in naming at the acute time point. He made semantic paraphasias. Follow up testing at 4 weeks revealed a slight improvement in naming skills on the BNT and HANA as well as in conversation. At 6 months, a slight decline was noted on his performance on the naming task; however, no decline in naming skills was noted during conversation.
P3’s speech was mostly fluent and grammatical with frequent word finding pauses at the acute time point. Language assessment revealed well-articulated but anomic speech, with frequent word-finding pauses and circumlocutions, and both semantic and phonemic paraphasias in conversation and naming tasks. Examples of paraphasias on the BNT include “elevator” for escalator and “hamlet” for hammock. P3 also had mild difficulty with comprehension; he had difficulty following 3 step commands and comprehension of stories. At 3 weeks P3 showed some improvement in his language skills; however, he continued to have anomic speech with frequent word-finding pauses and circumlocutions and also mild difficulty with story comprehension. At 7 months P3 had increased word retrieval deficits in conversation compared to the 3W time point. He showed slight improvement on BNT score but showed a decline on the HANA. He continued to have a moderate aphasia.
Language assessment for P4 revealed mild action naming deficits on the HANA and word retrieval deficits in conversation including circumlocutions and semantic paraphasias at the acute time point. He also had mild comprehension deficits based on the BDAE. P4 is a professional writer and was extremely concerned about his word retrieval deficits in conversation. At 4 weeks P4 reported an improvement in his motor and visual skills. Language assessment revealed normal performance on naming and comprehension tests; however, occasional circumlocutions and semantic paraphasias were noted during conversation. At 6 months P4 reported that he was back at work, and language assessment revealed normal language skills.
It should be noted that even though participants presented with visual field deficits or extraocular motor deficits at the acute time point, naming deficits were not due to impairment in vision. Their errors were circumlocutions or semantic and phonemic paraphasias, not visual errors in naming. Also, P1 was the only patient who made more errors in naming visual stimuli than naming to definition at the first time point. P1 performed with 100% accuracy on object decision test in the acute stage, indicating that she did not have impaired visual recognition of objects (aperceptive visual agnosia). Rather, it was postulated that P1 had difficulty accessing lexical and semantic representations from vision. In summary, P1 had a severe naming deficit and improved to normal naming. P3 had moderate to severe naming deficit at onset and showed some improvement over time; however, he had persistent moderate naming deficit at the chronic time point. P2 and 4 had mild naming deficits at onset. Both improved slightly, although P2 showed slight decline on testing after his initial improvement.
3.1.2Reaction time analysis
Trials in which participants gave an incorrect response were excluded from the analysis. Reaction times and accuracy analyses were conducted separately. A repeated measures ANOVA was conducted on the RT means with time (0W, 3–5W and 5–7M) and cue type (word, initial, final and noise) as a within subject variable and participants as a between subject factor.
Reaction time analysis showed a significant effect for participant (F (4,15) = 19.98, p = 0.0000) and cue (F (2,0.76) = 7.34, p = 0.0000) but not significant for time (F (2,1.0) = 0.98, p = 0.400). Irrespective of participant and time, naming responses were significantly faster when pictures were accompanied by word cues compared to initial cue (p-values <0.001). Irrespective of time and cue, naming responses were significantly faster for the normal control compared to participants with aphasia (p-values <0.001). Among participants with aphasia, P4 was significantly faster than the other three participants (p-values <0.001). Interaction effects were also significant for time*participant (F (8,5.52) = 46.57, p = 0.00), cue*participant (F (8,0.3) = 2.86, p = 0.005), and time*cue*participant (F (16, 412) = 3.76, p = 0.000). Please see supplementary material S2 for participant reaction time data.
3.1.3Accuracy analysis
A repeated measures ANOVA was conducted on the accuracy means with time (acute, 3–5W and 5–7M) and cue type (word, phonemic, and noise) as a within subject variable and participants as a between subject factor. Accuracy analysis showed was a significant effect for time (F (2, 1.17) = 44.00, p = 0.000), participant (F (4, 2.8) = 168.28, p = 0.00) and cue (F (2, 0.15) = 6.38, p = 0.001). Overall, accuracy was lowest at the acute time point, followed by 3W and 6 M (p = 0.001. Further, P1 had significantly lowest accuracy compared to all other participants (p = 0.000), followed by P3 (p = 0.000). The normal control, P2 and P4 had 100% naming accuracy for the task inside the scanner. Interaction effects were also significant for time*participant (F (8,0.7) = 26.9, p = 0.00), cue*participant (F (8,0.2) = 8.47, p = 0.000), and time*cue*participant (F (16, 0.15) = 6.02, p = 0.000). (Please see supplementary material S3 for accuracy data).
3.2Imaging analyses
3.2.1Normal control
Whole brain analysis for successful overt noise-cued and phonemic+word cued picture naming in the initial scan involved an extensive bilateral frontal, temporal, and parietal neural networks. The largest cluster was identified bilaterally in precentral gyrus, followed by clusters in the posterior region with peaks in superior temporal gyrus and supramarginal gyrus. Bilateral occipital activation was also noted (contrast: noise cued naming versus scrambled images, phonemic+word cued naming versus scrambled images). Analyses at 4 Weeks and 5 Months revealed similar activation patterns to that seen at the first time point (see supplementary Tables S3 and S4 for activation coordinates in MNI space). Overall reduced activations in the frontal cortex were noted during the 5th month scanning. Direct comparison of two conditions (contrast: phonemic+word cued naming versus noise cued naming) revealed no significant difference over time in the areas activated in association with correct naming responses. All images are thresholded using clusters determined by Z > 3.0 and a (corrected) cluster significance threshold of P = 0.05. Direct comparison between the time points revealed no significant between 0 week and 4 weeks. Slightly decreased activation was noted in the bilateral frontal network at 6 months compared to 4 weeks (see Fig. 2 and see supplementary materials S4 and S5 for activation coordinates in MNI space).
3.2.2Participants with stroke
Whole brain analyses for all participants with stroke (with the exception of P3) for successful phonemic+word cued picture naming showed bilateral activation in the frontal, temporal and parietal network at the acute time point (see Fig. 2 and see supplementary Table S3 and S4 for activation coordinates in MNI space). All images were thresholded using clusters determined by Z > 3.0 and a (corrected) cluster significance threshold of P = 0.05.
Participant P1: P1’s lesion involved the left occipital, fusiform, lingual gyrus and splenium. P1 had severe naming deficits at the acute time point followed by improvement at the subacute time point and normal naming skills at chronic time point. For P1 at the acute time point only phonemic+word cued naming trials compared to scrambled images were analyzed. Noise-cued trials were not analyzed for P1 due to very low accuracy. At the acute time point, the largest cluster was identified in the bilateral occipital region with peak activation in the left lateral occipital cortex. The second largest cluster was noted in the bilateral temporal cortex with peaks in the superior temporal gyrus. At 3 weeks and 6 months, P1 activated similar regions for phonemic+word cued picture naming trials compared to the acute time point; however, higher intensity of activation was noted in the posterior regions (temporal, parietal and occipital). At 3 weeks time point the largest activation cluster was centered in the bilateral occipital cortex followed by temporal cortex. Noise-cued trials were not analyzed at 3 weeks due to low accuracy. Phonemic+word cued activation at 6 months was similar to 3 weeks. Direct contrast analysis between 6 months compared to acute point revealed an overall increase in activation bilaterally. The largest cluster was predominately in the bilateral occipital and temporal/parietal regions followed by frontal (peaks centered in bilateral precentral gyrus, lateral occipital cortex, left supramarginal gyrus, and right inferior frontal gyrus). Results at 6 months compared to 3 weeks showed a restricted increase in activation in the left temporal cortex (peak in the left superior temporal gyrus). All images were thresholded using clusters determined by Z > 3.0 and a (corrected) cluster significance threshold of P = 0.05
Participant P2: P2’s lesion involved the left thalamus. He had mild naming deficits at the acute time point. He showed slight improvement at the subacute phase followed by slight decline in the chronic phase. Robust bilateral activation was noted across the three time points. At the acute time point (contrast: phonemic+word cued naming compared to scrambled picture viewing), the largest clusters were identified in the bilateral precentral gyrus and left temporo-parietal cortex (peak: left superior temporal gyrus), followed by bilateral occipital region (peak: lateral occipital cortex), right temporal cortex (peak: right inferior temporal gyrus), and the left frontal cortex (peak: left inferior frontal gyrus). At 4 weeks, the activation patterns were very similar to that of the acute time point. The largest cluster was noted in the frontal region with peak activation in the left precentral gyrus followed by left superior temporal gyrus. At 6 months, there was overall reduction in activation biaterally. The largest cluster was located in the left temporo-parietal region with peak in the left superior temporal gyrus. Other activation clusters included bilateral occipital and right temporo-parietal regions. Cluster in the bilateral frontal regions were smaller in size compared to the 4-week time point. Direct contrast analysis between the time points revealed increased activation in bilateral occipital regions at 4 weeks compared to acute and 6 months.
Participant P3: P3 sustained a lesion in the left thalamus and had moderate-severe naming deficits at the acute time point and continued to have moderate deficits at later time points. P3’s activation patterns were strikingly different from that of P2 and P4 even though all the three had lesions involving the left thalamus. At the acute time point, phonemic+word cued condition showed overall reduced activation in the left hemisphere compared to the other participants. Right hemisphere regions included right frontal cortex and temporal cortex. The largest cluster was in the right frontal cortex (peak: right middle frontal gyrus). Activation in the left hemisphere included a cluster in the frontal cortex (peak: left middle frontal gyrus), a small cluster in the parietal region (peak: left middle temporal gyrus). At 3 weeks, there was an increase in activation pattern bilaterally in the frontal, temporal, occipital regions. The largest cluster was identified in the right frontal cortex (peak: right precentral gyrus), followed by right temporal cortex (peak: right superior temporal gyrus). The largest cluster in the left hemisphere was located in the left frontal cortex (peak: precentral gyrus). At 6 months, there was robust activation in the left hemisphere with peak activations noted in the left precentral gyrus, left superior temporal gyrus, and lateral occipital cortex. Activation was also noted in right frontal (peak: precentral gyrus) and temporo-parietal cortex with peak in right superior temporal gyrus. Robust activation was seen in the left occipital cortex as well. Direct contrast analysis revealed bilateral increase intemporal activation (R > L), occipital and frontal for 3 weeks compared to acute time point, and increased frontal and temporal (L > R) for 6 months compared to 3 weeks.
Participant P4: P4’s lesion involved the left thalamus. P4 had mild deficits at the acute time point, particularly in verb naming, and improved to the point that he reached 100% accuracy on verb naming and returned to work as a professional writer. P4 showed robust activation in the fronto-temporo-parietal network at all the three time points for both phonemic+word cued naming and noised cued naming conditions. Bilateral occipital cortex was activated at all the three time points; however, a reduced level of activation was noted at 3 weeks compared to the acute and 6 month time points. Direct contrast analysis between the time points did not reveal any significant difference between the time points.
Interim conclusions: Whole brain activation analyses showed the greatest change (with an initial increase in RH activation, followed by later increase in LH activation) in the participant who continued to have moderate naming deficits at the chronic stage. Other participants did not show this trend. These results contrast with longitudinal changes in average activation patterns reported in association with changes in auditory comprehension in individuals with a variety of left MCA strokes (Saur et al., 2006).
3.3Task based regions of interest analyses
ROI analyses were done in order to examine the longitudinal changes in patterns of mean percent BOLD signal change in the language cortex ROI. The results of the mean BOLD percent signal change are presented in Fig. 3 and are compared statistically using non-parametric Wilcoxon signed-rank test. Table 3 shows the coefficient of variation (CV) in the mean percent BOLD signal change across language ROIs for each participant. The CV reflects the variability in signal change across ROI for each individual. The change in CV (across the ROIs) across the time points corresponds to the participants’ change in naming (Table 3). The change in CV in the mean percent BOLD signal from acute time point (0W) to subacute time point (3–5W) shows a trend to improve (decrease) in both the left and right hemispheres (LH, Z = 1.826, p = 0.067; RH, Z = 1.826, p = 0.067). The change in CV in the mean percent BOLD signal from sub acute time point to chronic time point significantly improved (decreased) in right hemisphere (Z = 2.02, p = 0.04), and decreased most in the participant who improved the most in naming. This result indicates that as participants’ naming improved there was a significant decrease in the CV (variability) in the mean percent BOLD signal across ROIs. These findings indicate that there is an increase in thebalance of activity across the language ROIs in the left and right hemisphere as participants’ recover from their naming deficits. For example, P4 showed a decreased mean percent BOLD signal change in bilateral temporal regions (MTG and ITG) at the acute time point reflected in a high CV across the ROIs. At the follow up time points, P4 showed a greater balance in the BOLD signal change across the ROIs (reflected in lower CV) that corresponded with improvement in his naming skills. P1 showed greater percent BOLD signal change in the left temporal regions (MTG and ITG) at the acute time point and negative BOLD signal change in the left parietal regions (SMG and AG) reflected in a high CV at the acute time point. As P1’s naming ability improved there was a decrease in the CV across the ROIs. P3, who showed some improvement but continued to have moderate deficits, showed the least decrease in CV and highest CV across ROI at the final time point (Table 3).
3.4Functional connectivity analysis
The results of the resting state functional connectivity analysis are shown in Figs. 4 and 5 and in supplementary material S6. The results of the functional connectivity analysis presented here indicate that strokes in the PCA territory associated with naming deficits cause an acute disruption of functional connectivity between the language ROI within each hemisphere and between the LH and RH. The results of the functional connectivity analyses are line with the results of the task based ROI analyses. For the functional connectivity analysis, correlations were assessed across 12 ROIs in the language network corresponding to the left and right IFG, STG, MTG, ITG, SMG, and AG. ROIs are ordered within the correlation matrices according to each region with left first followed by right. For the normal control there was good inter- and intra-hemisphere correlations between the language ROIs (as indicated by orange on the graph in supplementary materials S6). Participants with aphasia generally have smaller z-scores for correlations across the ROI in the left and right hemisphere in the language network at the acute time point. Correlations improved over time in participants who showed good recovery in naming skills (e.g., P1), where as no marked change in connectivity was noted in participants who continued to have moderate aphasia (e.g., P3). Figure 4 shows the resting state functional connectivity analysis for P1 at the three time points, and the fourth panels shows the difference in correlation between the chronic time point (5–7M) and acute time point (0W). This figure shows consistently weak correlations within and between the hemispheres as indicated by blue and green colors for P1 at the acute time point. For example, P1 showed weak connectivity between the left IFG and left STG at the acute time point (indicated by green color, 3rd cell from top left), whereas there was marked improvement in connectivity between the left IFG and left STG at the 6M time point (indicated by orange). Increased correlations are noted at the follow up time points as indicated by orange color. The difference map shows stronger correlations within and between hemispheres as indicated by mostly orange and light green color.
Figure 5 shows the resting state functional connectivity analysis for P3 at the three time points and the fourth panels shows the difference in correlations between the chronic time point and acute time point. Difference map for P3 shows mostly weak correlations as indicated by blue color. For example, P3 showed weak connectivity between the left IFG and left STG at the acute time point (indicated by green color, 1st column 3rd cell from top left), where as good connectivity was seen between the right IFG and right STG (indicated by orange color, 2nd column 4th cell from the top left). Connectivity was weak between homologues correlations (e.g., left IFG and right IFG). No improvement in connectivity was noted at follow up time points; in fact, the connectivity between the right hemisphere ROIs which was high at the acute time point showed a reduction at the follow up time points. The connectivity patterns for P2 and P4 were very different from that of P3 despite similar lesions in the left thalamus. Both P2 and P4 showed weak connectivity at the acute stage. The change in functional connectivity within and between the left and right hemisphere ROIs is less pronounced than the change for P1 and P3 possibly due to overall milder deficits at the acute time point (see supplementary material S6).
4Discussion
We utilized task based and resting state analyses together with behavioral testing to longitudinally assess changes in the language network, in relation to changes associated with naming function in individuals with naming deficits after left PCA stroke, who had preserved frontal, temporal and parietal language areas. Behavioral analyses indicated that the greatest change in performance outside the scanner (as measured by language tests) and inside the scanner (as measured by reaction time and accuracy) was noted for P1. Imaging data revealed robust activation in the bilateral language network in the acute phase in participants with varying degrees of naming deficits. Only one participant (P3) had decreased activation in the left hemisphere language network at the acute time point. Resting state functional connectivity analysis revealed that impaired naming function was paralleled by loss of coherence of low-frequency BOLD fluctuations in ipsilesional and contralesional language cortex at the acute stage after stroke. Ipsilesional and contralesional hemispheric functional connectivity improved in the following weeks only in participants who showed good naming recovery. Further, the task based ROI analyses indicated that as participants demonstrated recovery from stroke, gradual improvement (decrease) in CV across left and right hemisphere ROIs in the percent BOLD signal change was noted within the language network in participants whose naming performance improved, supporting the findings of resting state fMRI.
These findings emphasize a network view of aphasia recovery in PCA stroke. Further, the results of task based and resting state fMRI provide support regarding the importance of examining network level interactions, and not just focal level of activation to characterize naming recovery. For example, the results of task based whole brain analyses showed robust activation at the acute stage bilaterally for all participants with the exception of P3. Participants continued to show bilateral activation despite good language performance and right hemisphere activation persisted even in recovered participants. In fact, the participant (P3) who showed the most change in activation patterns on the naming task from limited activation at the acute time point to an increase in peak activation in the right hemisphere regions at the sub acute time point to a return in the peak activation in the left hemisphere regions continued to have moderate language deficits. Resting state functional connectivity analysis showed that this participant continued to have weak functional connectivity within the left hemisphere ROIs and also between the left and right hemisphere ROIs at the chronic time point. Another illustrative example comes from P1 who had severe naming deficits at the acute time point and who showed complete recovery by 6 months. Although this participant showed improvement in naming both inside the scanner and on behavioral tasks outside the scanner, this change was not reflected in her whole brain activation patterns. Direct contrast analysis between the time points revealed greater activation in bilateral language regions at the sub acute time point compared to the acute time point. However, 6M compared to 3W showed a restricted increase in activation in the left temporal cortex, whereas she showed a dramatic improvement in her naming skills. In contrast, her functional connectivity analysis revealed weak correlations at the acute time point with increasing strength in functional connectivity as her naming skills improved.
Functional connectivity analysis can reveal changes in the network associated even with subtle changes in naming. For example, P4 had only very mild naming deficits at the acute time point and made complete recovery at chronic time point. P4’s fMRI activation patterns were very similar across the three time points; whereas his functional connectivity analysis revealed decreased connectivity between the ROIs at the acute time point that improved as his language skills improved. However, the change in functional connectivity within and between the left and right hemisphere ROIs is less pronounced than the change for P1 possibly due to overall milder deficits at the acute time point.
Our findings contrast with previous finding that show right hemisphere compensation occurs in sub acute recovery, but not in the chronic phase (e.g., Saur et al., 2006). Additionally, it has also been suggested that right hemisphere activation in the chronic stage could be associated with poor language recovery following stroke (e.g., Postman-Caucheteux et al., 2010; Szaflarski, Allendorfer, Banks, Vannest, & Holland, 2013). There are several reasons why our results might be different from previous findings: (1) our study examined language recovery in PCA stroke patients, whereas prior studies have examined language recovery in patients with MCA stroke, (2) our study utilized a task that results in bilateral activation in healthy controls; and (3) there may be considerable individual differences in patterns of recovery which could result in different patterns of ipsilesional and contralesional compensations.
Our work is in line with previous findings in numerous clinical conditions including stroke that have shown an association between behavioral deficits, recovery and changes in resting state fMRI (Carter et al., 2010; Grefkes & Fink, 2011; He et al., 2007; van Meer et al., 2010; Westlake & Nagarajan, 2011). In a recent study, Zhu and colleagues (Zhu et al., 2014), examined the recovery of language skills in participants with aphasia at the subacute stage. Using resting state connectivity analysis, the authors found that decreased left fronto-parietal network (LFPN) connectivity in stroke patients was significantly associated with the impairment in comprehension ability at 1 month post stroke, and there was a significant association between recovery of comprehension ability and the mean changes in intrinsic LFPN connectivity at 2 months post stroke. Similarly, Park et al. (2011) reported dynamic changes in the lateralization of functional connectivity of motor networks in the first 6 months post stroke, where measures of functional connectivity at stroke onset were found to be positively correlated with motor outcomes.
In summary, robust left hemisphere activation alone does not always sustain good recovery; what seems to be more important, at least in participants with PCA stroke, is the degree of inter- and intra-hemispheric balance between the language cortex ROIs. The significance of inter-hemispheric interactions may reflect the importance of proper equilibrium between excitation and inhibition across hemispheres for optimal function (e.g., Bloom & Hynd, 2005; Manson et al., 2008). Our findings are in line with the results from He et al. (2007), who reported initial disruption of inter-hemispheric functional connectivity in the structurally intact posterior parietal cortex in patients with spatial neglect, which correlated with impaired attentional processing, followed by improvement in both the inter-hemispheric connectivity and attentional processing at the chronic stage. In addition, our results show that even small lesions such as the thalamic lacunar infarcts can lead to extensive functional disconnection in the brain, and complete recovery of function may require the restoration of balance of bilateral language networks.
5Limitations
There are several limitations to this study. First, we used a relatively small sample size to characterize the dynamic functional reorganization of the language network from stroke onset to 7 months.Second, none of our participants had lesions involving the temporal or frontal language areas; therefore, it is unclear if patients with lesions involving temporal or frontal regions would have similar patterns of recovery. However, the general principle that connectivity between undamaged language cortex ROIs and their RH homologues is associated with recovery of naming may apply also to individuals with direct damage to the language cortex ROIs. This hypothesis requires empirical testing. Third, in this study we identified dynamic changes in language network connectivity; however, we did not examine the structural connectivity. For example, a study by He et al. (2007) indicated that disrupted functional connectivity was related to injuries of white matter tracts measured by diffusion tensor imaging. In future studies it will be important to investigate whether disruptions in functional connectivity acutely after stroke shown here are associated with the anatomical changes inconnectivity.
Acknowledgments
The research reported in this paper was supported by the National Institutes of Health (NIDCD) through awards R01 DC05375, R01 DC03681, and P41 EB015909. The content is solely the responsibility of the authors and does not necessarily represent the views the National Institutes of Health.
Appendices
The supplementary information is available in the electronic version of this article: http://dx.doi.org/10.3233/RNN-150621.
References
1 | Abo M. , Senoo A. , Watanabe S. , Miyano S. , Doseki K. , Sasaki N. , & Yonemoto K. ((2004) ). Language-related brain function during word repetition in post-stroke aphasics. Neuroreport, 15: (12), 1891–1894. |
2 | Andersson J.L. , Jenkinson M. , & Smith S. ((2007) ). Non-linear registration, aka Spatial normalisation FMRIB technical report TR07JA2. FMRIB Analysis Group of the University of Oxford 2. |
3 | Anglade C. , Thiel A. , & Ansaldo A.I. ((2014) ). The complementary role of the cerebral hemispheres in recovery from aphasia after stroke: A critical review of literature. Brain Injury, 28: (2), 138–145. |
4 | Bartels A. , & Zeki S. ((2005) ). Brain dynamics during natural viewing conditions—A new guide for mapping connectivity. NeuroImage, 24: (2), 339–349. |
5 | Bates E. , D’Amico S. , Jacobsen T. , Székely A. , Andonova E. , Devescovi A. , & Tzeng O. ((2003) ). Timed picture naming in seven languages. Psychonomic Bulletin & Review, 10: (2), 344–380. |
6 | Beg M.F.M. , Miller M.I. , Trouvé A. , & Younes L. ((2005) ). Computing large deformation metric mappings via geodesic flows of diffeomorphisms. International Journal of Computer Vision, 61: (2), 139–157. |
7 | Behzadi Y. , Restom K. , Liau J. , & Liu T.T. ((2007) ). A component based noise correction method (CompCor) for BOLD and perfusion based fMRI. NeuroImage, 37: (1), 90–101. |
8 | Blank S.C. , Bird H. , Turkheimer F. , & Wise R.J.S. ((2003) ). Speech production after stroke: The role of the right pars opercularis. Annals of Neurology, 54: (3), 310–320. |
9 | Blasi V. , Young A.C. , Tansy A.P. , Petersen S.E. , Snyder A.Z. , & Corbetta M. ((2002) ). Word retrieval learning modulates right frontal cortex in patients with left frontal damage. Neuron, 36: (1), 159–170. |
10 | Bloom J.S. , & Hynd G.W. ((2005) ). The role of the corpus callosum in interhemispheric transfer of information: Excitation or inhibition? Neuropsychology Review, 15: (2), 59–71. |
11 | Breining B.L. , Lala T. , Martínez Cuitiño M. , Manes F. , Peristeri E. , Tsapkini K. , & Hillis A.E. ((2015) a). A brief assessment of object antics in primary progressive aphasia. Aphasiology 29: (4), 488–505 sem. |
12 | Breining B.L. , Tippett D.C. , Ds C. , Posner J. , Sebastian R. , Oishie K. , & Hillis A.E. ((2015) b). Assessing dissociations of object and action naming in acute stroke. Paper presented at the Clinical Aphasiology Conference, Monterey, CA. |
13 | Cals N. , Devuyst G. , Afsar N. , Karapanayiotides T. , & Bogousslavsky J. ((2002) ). Pure superficial posterior cerebral artery territory infarction in The Lausanne Stroke Registry. Journal of Neurology, 249: (7), 855–861. |
14 | Carter A.R. , Astafiev S.V. , Lang C.E. , Connor L.T. , Strube M.J. , Pope D.L.W. , & Corbetta M. ((2010) ). Resting Inter-hemispheric fMRI Connectiviyt Predicts Performance after Stroke. Annals of Neurology, 67: (3), 365–375. |
15 | Cox D.E. , & Heilman K.M. ((2011) ). Dynamic-intentional thalamic aphasia: A failure of lexical-semantic self-activation. Neurocase, 17: (4), 313–317 . |
16 | De Witte L. , Brouns R. , Kavadias D. , Engelborghs S. , De Deyn P.P. , & Mariën P. ((2011) ). Cognitive, affective and behavioural disturbances following vascular thalamic lesions: A review. Cortex, 47: (3), 273–319 . |
17 | Faria A. V. , Joel S.E. , Zhang Y. , Oishi K. , van Zjil P.C.M. , Miller M.I. , & Mori S. ((2012) ). Atlas-based analysis of resting-state functional connectivity: Evaluation for reproducibility and multi-modal anatomy–function correlation studies. NeuroImage, 61: (3), 613–621. |
18 | Frances N. , & Kucera H. ((1982) ). Frequency Analysis of English Usag. Houghton Mifflin: Boston, MA . |
19 | Fridriksson J. ((2010) ). Preservation and modulation of specific left hemisphere regions is vital for treated recovery from anomia in stroke. The Journal of Neuroscience, 30: (35), 11558–11564. |
20 | Fridriksson J. , Richardson J.D. , Fillmore P. , & Cai B. ((2012) ). Left hemisphere plasticity and aphasia recovery. NeuroImage, 60: (2), 854–863. |
21 | Gilhooly K.J. , & Logie R.H. ((1980) ). Age-of acquisition, imagery, concreteness, familiarity, and ambiguity measures for 1,944 words. Behavioral ResearchMethods and Instrumentation, 12: , 395–427 . |
22 | Goodglass H. , Kaplan E. , Barresi B. ((2000) ). Boston Diagnostic Aphasia Examination-(BDAE-3). San Antonio. TX: Psychhological Cor. |
23 | Grefkes C. , & Fink G.R. ((2011) ). Reorganization of cerebral networks after stroke: New insights from neuroimaging with connectivity approaches. Brain, 134: (5), 1264–1276. |
24 | Greve D.N. , & Fischl B. ((2009) ). Accurate and robust brain image alignment using boundary-based registration. NeuroImage, 48: (1), 63–72. |
25 | He B.J. , Snyder A.Z. , Vincent J.L. , Epstein A. , Shulman G.L. , & Corbetta M. ((2007) ). Breakdown of functional connectivity in frontoparietal networks underlies behavioral deficits in spatial neglect. Neuron, 53: (6), 905–918 . |
26 | Heiss W.D. , Kessler J. , Thiel A. , Ghaemi M. , & Karbe H. ((1999) ). Differential capacity of left and right hemispheric areas for compensation of poststroke aphasia. Annals of Neurology, 45: (4), 430–438. |
27 | Hillis A.E. ((2007) ). Aphasia: Progress in the last quarter of a century. Neurology, 69: (2), 200–213. |
28 | Hillis A.E. , & Heidler J. ((2002) ). Mechanisms of early aphasia recovery. Aphasiology, 16: (9), 885–895. |
29 | Holland R. , Leff A.P. , Josephs O. , Galea J.M. , Desikan M. , Price C.J. , & Crinion J. ((2011) ). Speech Facilitation by Left Inferior Frontal Cortex Stimulation. Current Biology, 21: (16), 1403–1407. |
30 | Jacquin A. , Virat-Brassaud M.-E. , Rouaud O. , Osseby G.-V. , Aboa-Eboulé C. , Hervieu M. , & Béjot Y. ((2014) ). Vascular aphasia outcome after intravenous recombinant tissue plasminogen activator thrombolysis for ischemic stroke. European Neurology, 71: (5-6), 288–295 . |
31 | Jarso S. , Li M. , Faria A. , Davis C. , Leigh R. , Sebastian R. , & Hillis A.E. ((2013) ). Distinct mechanisms and timing of language recovery after stroke. Cognitive Neuropsychology, 30: (7-8), 454–475. |
32 | Jenkinson M. , Beckmann C.F. , Behrens T.E. , Woolrich M.W. , & Smith S.M. ((2012) ). Fsl. NeuroImage, 62: (2), 782–790. |
33 | Kaplan E. , Goodglass H. , & Weintraub S. ((2001) ). Boston Naming Test. Austin: TX: Pro-ed. |
34 | Karussis D. , Leker R.R. , & Abramsky O. ((2000) ). Cognitive dysfunction following thalamic stroke: A study of cases and review of the literature. Journal of the Neurological Sciences, 172: (1), 25–29. |
35 | Li Y. , Ceritoglu C. , Jiang H. , Kolsany A.E. , Brown T.J.A. , Tang X. , & Miller M.I. ((2015) ). BrainGPS: A Cloud-based Platform for Neuroimage Analysis and Neuroradiological Studies. Paper presented at the 23th ISMRM meeting, Toronto, Canada. |
36 | Llano D.A. ((2013) ). Functional imaging of the thalamus in language. Brain and Language, 126: (1), 62–72. |
37 | Manson S.C. , Wegner C. , Filippi M. , Barkhof F. , Beckmann C. , Ciccarelli O. , & Smith S. ((2008) ). Impairment of movement-associated brain deactivation in multiple sclerosis: Further evidence for a functional pathology of interhemispheric neuronal inhibition. Experimental Brain Research, 187: (1), 25–31. |
38 | Marsh E.B. , & Hillis A.E. ((2005) ). Cognitive and neural mechanisms underlying reading and naming: Evidence from letter-by-letter reading and optic aphasia. Neurocase, 11: (5), 325–337. |
39 | Marsh E.B. , & Hillis A.E. ((2006) ). Recovery from aphasia following brain injury: The role of reorganization. Progress in Brain Research, 157: , 143–156. |
40 | Park C.H. , Chang W.H. , Ohn S.H. , Kim S.T. , Bang O.Y. , Pascual-Leone A. , & Kim Y.H. ((2011) ). Longitudinal changes of resting-state functional connectivity during motor recovery after stroke. Stroke, 42: (5), 1357–1362. |
41 | Parker Jones O. , Green D.W. , Grogan A. , Pliatsikas C. , Filippopolitis K. , Ali N. , & Price C.J. ((2012) ). Where, When and Why Brain Activation Differs for Bilinguals and Monolinguals during Picture Naming and Reading Aloud. Cerebral Cortex, 22: (4), 892–902. |
42 | Perani D. , Cappa S.F. , Tettamanti M. , Rosa M. , Scifo P. , Miozzo a , … Fazio F. ((2003) ). A fMRI study of word retrieval in aphasia. Brain and Language, 85: (3), 357–368. |
43 | Postman-Caucheteux W.A. , Birn R.M. , Pursley R.H. , Butman J.A. , Solomon J.M. , Picchioni D. , & Braun A.R. ((2010) ). Single-trial fMRI shows contralesional activity linked to overt naming errors in chronic aphasic patients. Journal of Cognitive Neuroscience, 22: (6), 1299–1318. |
44 | Prabhakaran V. , Raman S.P. , Grunwald M.R. , Mahadevia a , Hussain N. , Lu H. , & Hillis A.E. ((2007) ). Neural substrates of word generation during stroke recovery: The influence of cortical hypoperfusion. Behavioural Neurology, 18: (1), 45–52. |
45 | Price C.J. , & Friston K.J. ((1999) ). Scanning patients with tasks they can perform. Human Brain Mapping, 8: (2-3), 102–108. |
46 | Price C.J. , & Devlin J.T. ((2003) ). The myth of the visual word form area. NeuroImage, 19: (3), 473–481. |
47 | Raymer A.M. , Moberg P. , Crosson B. , Nadeau S. , & Gonzalez Rothi L.J. ((1997) a). Lexical-semantic deficits in two patients with dominant thalamic infarction. Neuropsychologia 35: (2), 211–219. |
48 | Raymer A.M. , Foundas A.L. , Maher L.M. , Greenwald M.L. , Morris M. , Rothi L.J. , & Heilman K.M. ((1997) b). Cognitive neuropsychological analysis and neuroanatomic correlates in a case of acute anomia. Brain and Language 58: (1), 137–156. |
49 | Saur D. , Lange R. , Baumgaertner A. , Schraknepper V. , Willmes K. , Rijntjes M. , & Weiller C. ((2006) ). Dynamics of language reorganization after stroke. Brain, 129: (6), 1371–1384. |
50 | Sebastian R. , & Kiran S. ((2011) ). Task-modulated neural activation patterns in chronic stroke patients with aphasia. Aphasiology, 25: (8), 927–951. |
51 | Sebastian R. , Schein M. , Davis C. , Gomez Y. , Newhart M. , Oishi K. , & Hillis A.E. ((2014) a). Aphasia or Neglect after Thalamic Stroke: The Various Ways They may be Related to Cortical Hypoperfusion. Frontiers in Neurology 5: , 231. |
52 | Sebastian R. , Gomez Y. , Leigh R. , Davis C. , Newhart M. , & Hillis A.E. ((2014) b). The roles of occipitotemporal cortex in reading, spelling, and naming. Cognitive Neuropsychology 31: (5-6), 511–528 . |
53 | Segaert K. , Menenti L. , Weber K. , Petersson K.M. , & Hagoort P. ((2012) ). Shared syntax in language production and language comprehension-an fMRI study. Cerebral Cortex, 22: (7), 1662–1670. |
54 | Servan J. , Verstichel P. , Catala M. , Yakovleff A. , & Rancurel G. ((1995) ). Aphasia and infarction of the posterior cerebral artery territory. Journal of Neurology, 242: (2), 87–92. |
55 | Smith S.M. , Jenkinson M. , Woolrich M.W. , Beckmann C.F. , Behrens T.E.J. , & Johansen-Berg H. , et al ((2004) ). Advances in functional and structural MR image analysis and implementation as FSL. NeuroImage, 23: , 208–219. |
56 | Szaflarski J.P. , Allendorfer J.B. , Banks C. , Vannest J. , & Holland S.K. ((2013) ). Recovered vs. not-recovered from post-stroke aphasia: The contributions from the dominant and non-dominant hemispheres. Restorative Neurology and Neuroscience, 31: (4), 347–360. |
57 | Tang X. , Oishi K. , Faria A. V. , Hillis A.E. , Albert M.S. , Mori S. , & Miller M.I. ((2013) ). Bayesian Parameter Estimation and Segmentation in the Multi-Atlas Random Orbit Model. PloS One, 8: (6), e65591. |
58 | Tang X. , Crocetti D. , Kutten K. , Ceritoglu C. , Albert M.S. , Mori S. , & Miller M.I. ((2015) ). Segmentation of brain magnetic resonance images based on multi-atlas likelihood fusion: Testing using data with a broad range of anatomical and photometric profiles. Frontiers in Neuroscience, 9: , 61. |
59 | Toglia M.P. , & Battig W.F. , ((1978) ). Handbook of antic Word Norms. Hillsdale, NJ: Lawrence Erlbaum Associates Inc . |
60 | Turkeltaub P.E. , Messing S. , Norise C. , & Hamilton R.H. ((2011) ). Are networks for residual language function and recovery consistent across aphasic patients? Neurology, 76: (20), 1726–1734. |
61 | van Meer M.P.A. , van der Marel K. , Wang K. , Otte W.M. , el Bouazati S. , Roeling T.A.P. , & Dijkhuizen R.M. ((2010) ). Recovery of sensorimotor function after experimental stroke correlates with restoration of resting-state interhemispheric functional connectivity. Journal of Neuroscience, 30: (11), 3964–3972. |
62 | Westlake K.P. , & Nagarajan S.S. ((2011) ). Functional connectivity in relation to motor performance and recovery after stroke. Frontiers in Systems Neuroscience, 5: , 8. |
63 | Winhuisen L. , Thiel A. , Schumacher B. , Kessler J. , Rudolf J. , Haupt W.F. , & Heiss W.D. ((2007) ). The right inferior frontal gyrus and poststroke aphasia: A follow-up investigation. Stroke, 38: (4), 1286–1292. |
64 | Woolrich M.W. , Jbabdi S. , Patenaude B. , Chappell M. , Makni S. , & Behrens T. , et al ((2009) ). Bayesian analysis of neuroimaging data in FSL. NeuroImage, 45: , 173–186. |
65 | Zhu D. , Chang J. , Freeman S. , Tan Z. , Xiao J. , Gao Y. , & Kong J. ((2014) ). Changes of functional connectivity in the left frontoparietal network following aphasic stroke. Frontiers in Behavioral Neuroscience, 8: , 167. |
Figures and Tables
Fig.1
DWI scans at the acute time point for P1with a lesion in the left occipital, fusiform, lingual gyrus, and splenium; P2, P3, and P4 with lesions in the left thalamus.
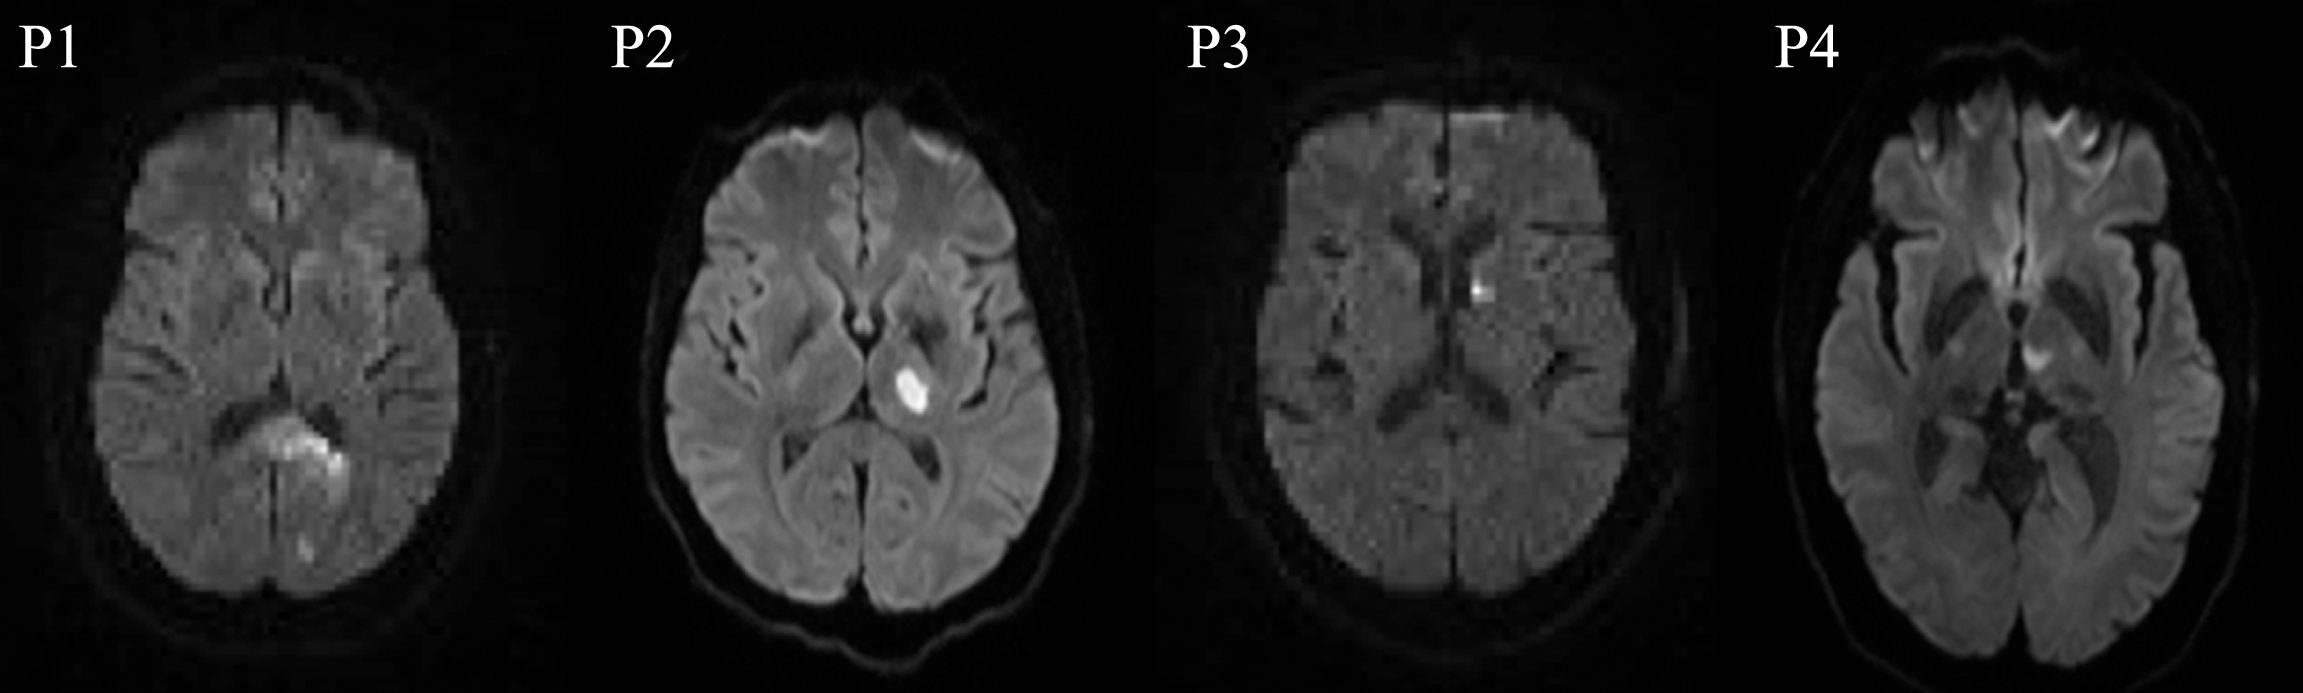
Fig.2
FMRI data registered in MNI space shows areas of activation associated with correct picture naming (phonemic+word cued naming) compared to viewing scrambled pictures at 0W (acute time point), 3–5W (sub acute time point), and 5–7M (chronic time point) for the normal control and participants with aphasia. Z (Gaussianised T/F) statistic images were thresholded using clusters determined by Z > 3.0 and a (corrected) cluster significance threshold of P = 0.05. All images are shown in radiological convention (left in image is right in the brain).
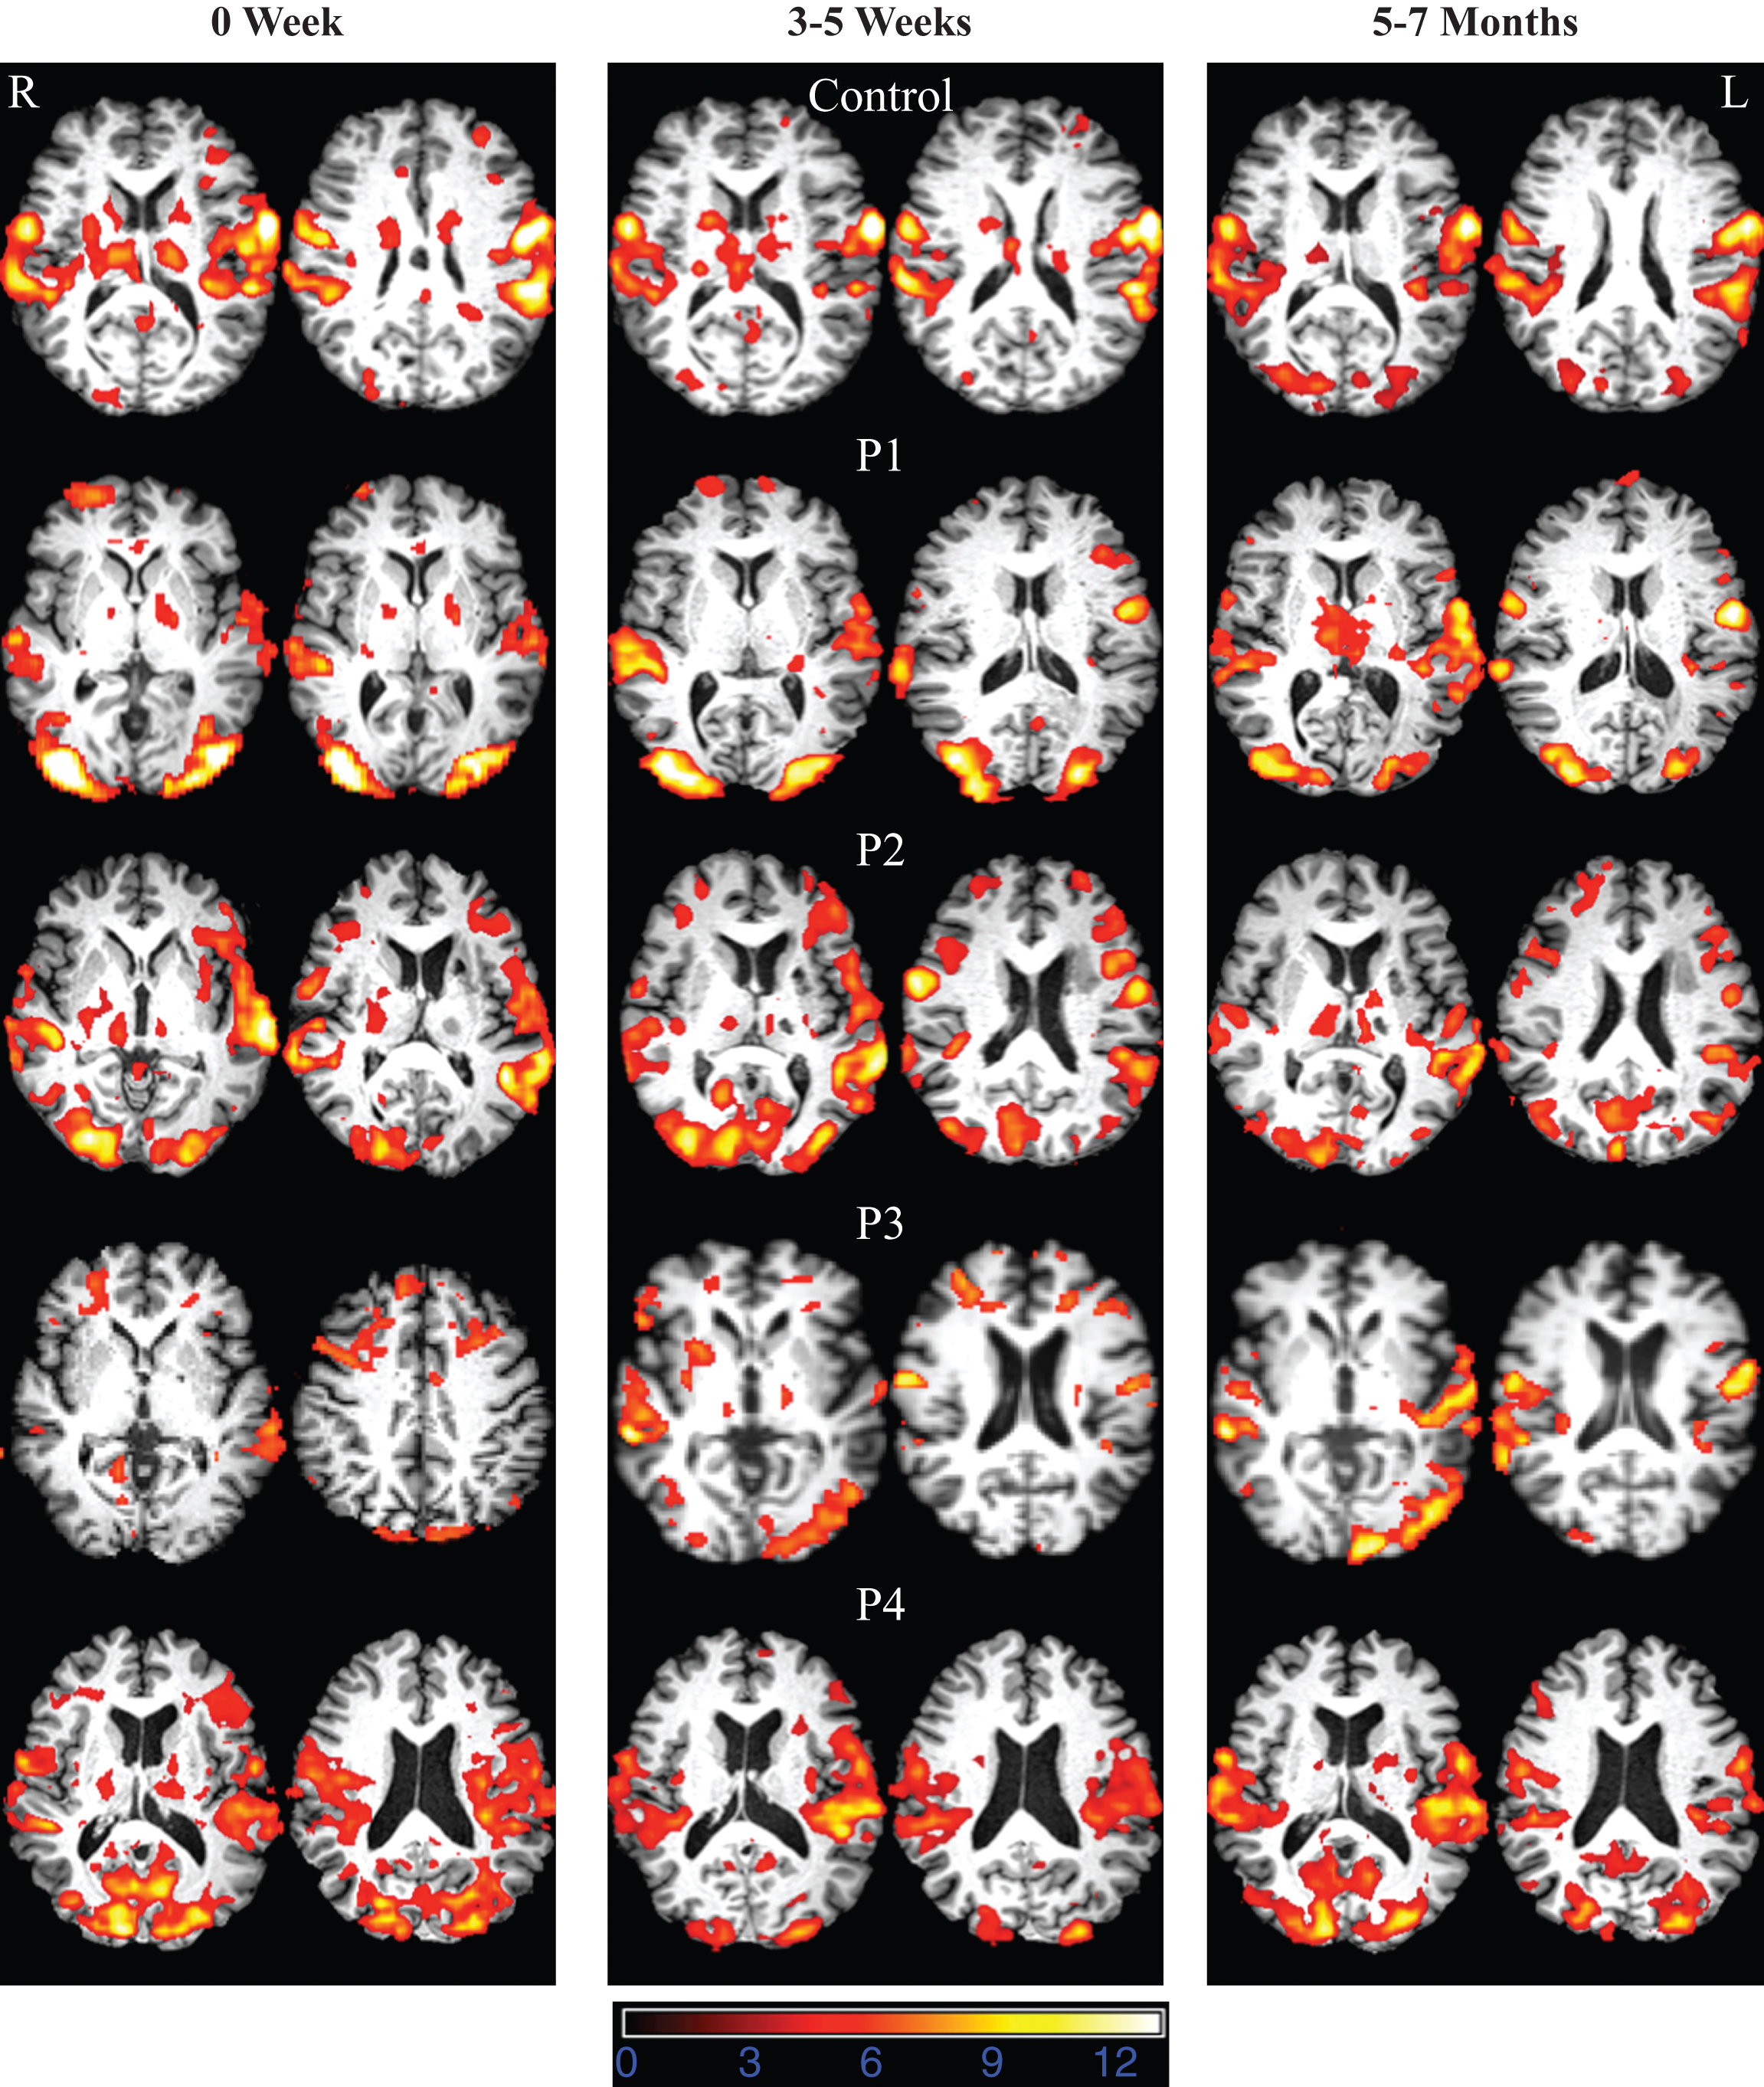
Fig.3
Mean percent BOLD signal change for participants with aphasia at 0W (acute time point), 3–5W (sub acute time point), and 5–7M (chronic time point). Regions include: inferior frontal gyrus (IFG), superior temporal gyrus (STG), middle temporal gyrus (MTG), inferior temporal gyrus (ITG), supramarginal gyrus (SMG), and angular gyrus (AG).
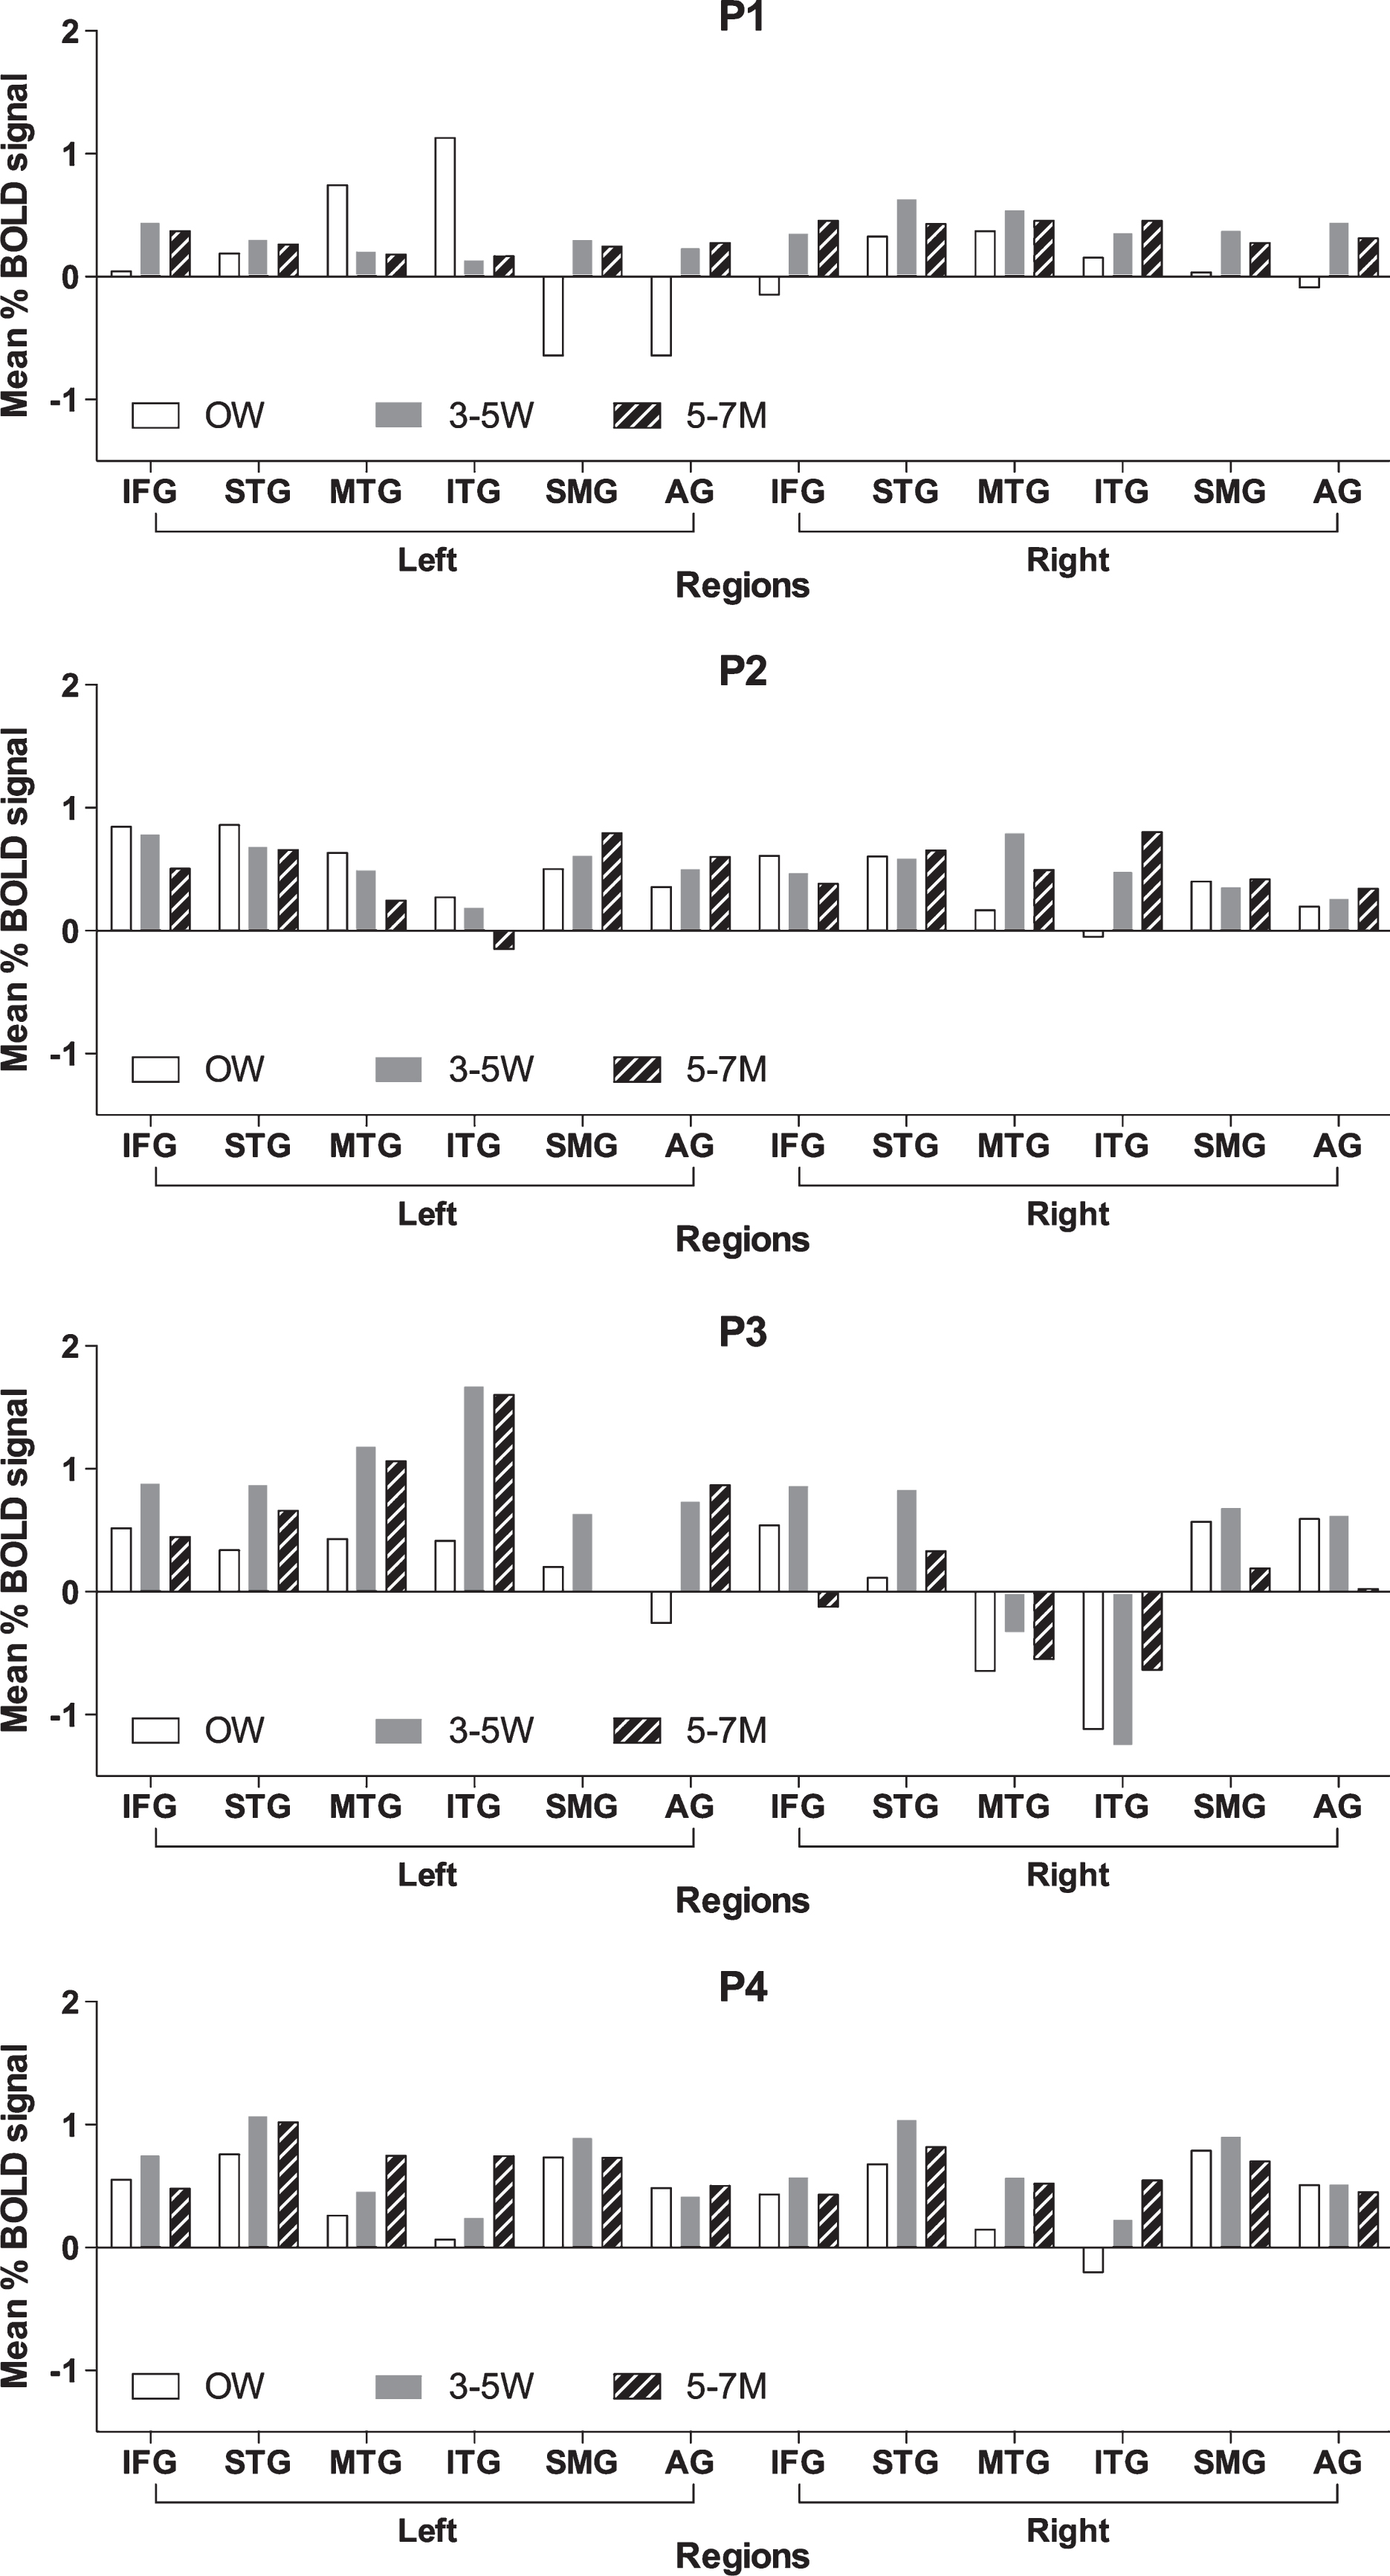
Fig.4
Fisher-transformed correlation matrix for the resting state data for P1 (who showed the most improvement) at each time point. Difference map shows the difference in correlation between the 5–7 month scan and the 0 week scan for the resting state data. Correlations were assessed across 12 ROIs in the language network corresponding to the left and right inferior frontal gyrus (IFG), superior temporal gyrus (STG), middle temporal gyrus (MTG), inferior temporal gyrus (ITG), supramarginal gyrus (SMG), and angular gyrus (AG).
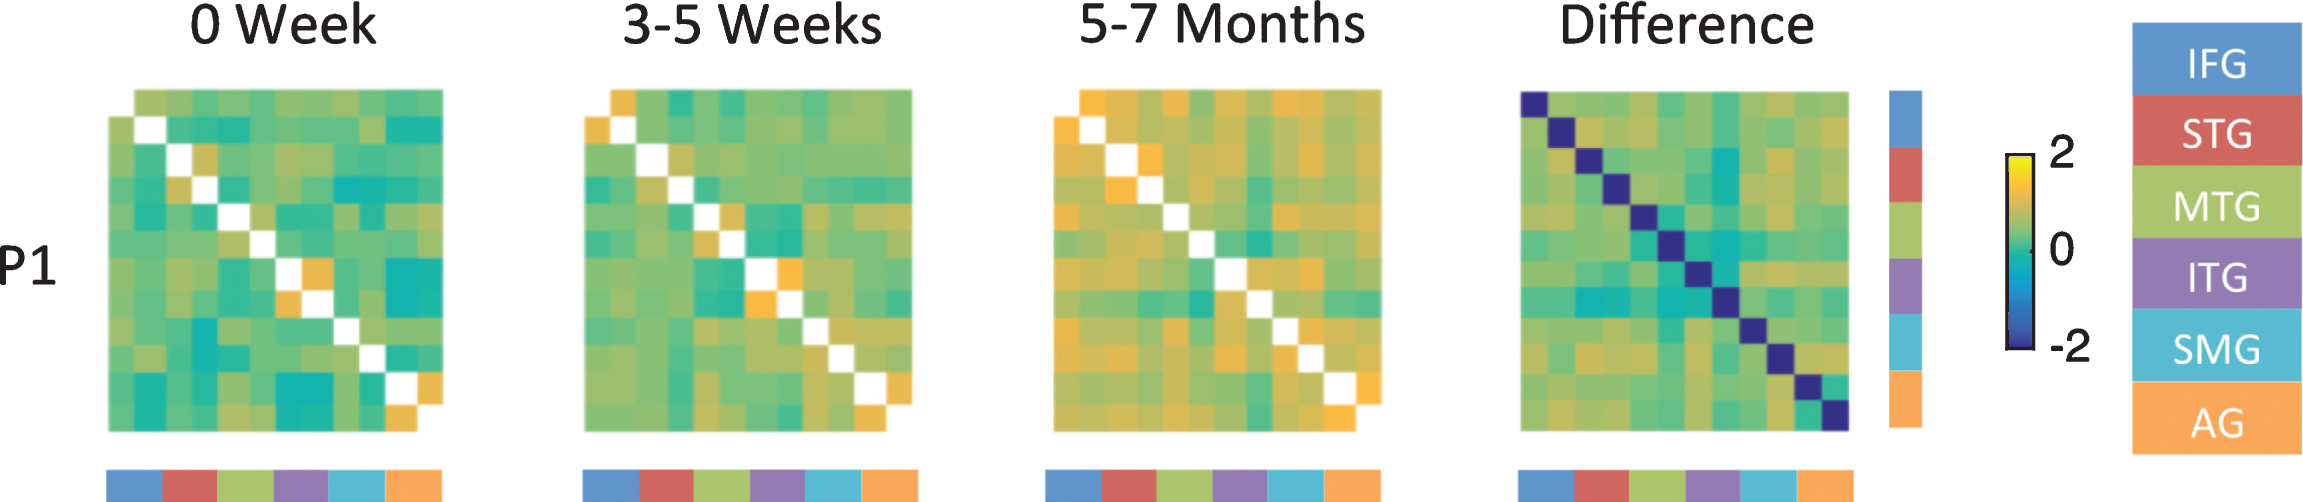
Fig.5
Fisher-transformed correlation matrix for the resting state data for P3 (who showed persistent moderate naming deficit) at each time point. Difference map shows the difference in correlation between the 5–7 month scan and the 0 week scan for the resting-state data. Correlations were assessed across 12 ROIs in the language network corresponding to the left and right inferior frontal gyrus (IFG), superior temporal gyrus (STG), middle temporal gyrus (MTG), inferior temporal gyrus (ITG), supramarginal gyrus (SMG), and angular gyrus (AG).
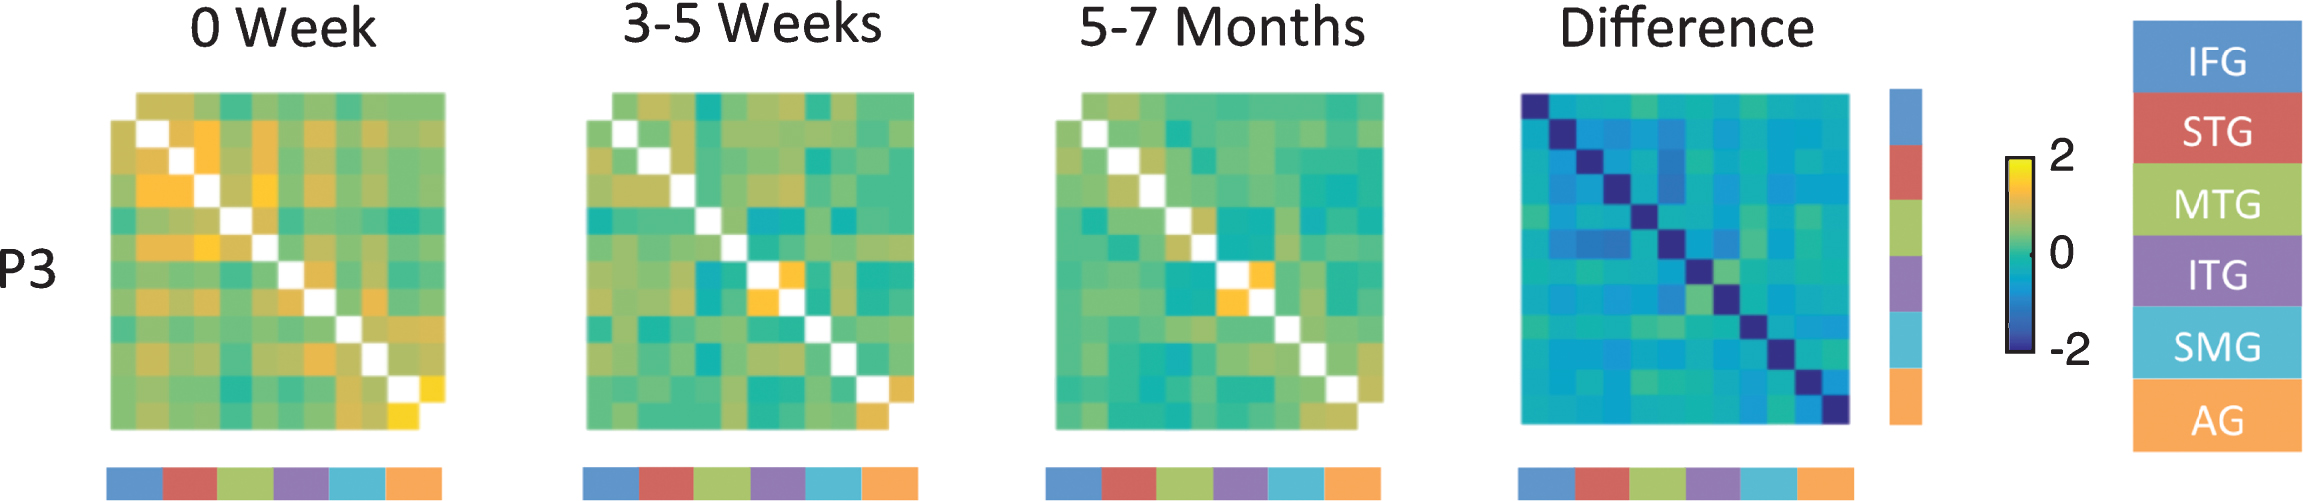
Table 1
Demographic information
| Participant | Age/Gender | Education | Site of Lesion |
| P1 | 54/F | 14 years | Left occipital, fusiform, lingual gyrus, and splenium |
| P2 | 46/M | 12 years | Left thalamus |
| P3 | 54/M | 12 years | Left thalamus |
| P4 | 60/M | 14 years | Left thalamus |
| Normal control | 59/F | 14 years | – |
Table 2
Results of language tests
| Patient ID | Time point | BNT | HANA | PPT | BDAE Comprehension | BDAE Repetition | |||
| Words | Commands | Complex | Words | Sentences | |||||
| P1 | Acute | 10 | 60 | 62.5 | 100 | 100 | 100 | 100 | |
| 3W | 47 | 71 | 100 | 100 | 100 | 100 | 100 | 100 | |
| 6M | 100 | 94 | 100 | 100 | 100 | 100 | 100 | 100 | |
| P2 | Acute | 83.3 | 71.4 | 100 | 100 | 100 | 100 | 100 | 100 |
| 4W | 86.6 | 82.8 | 100 | 100 | 100 | 100 | 100 | 100 | |
| 6M | 80 | 77.14 | 100 | 100 | 100 | 100 | 100 | 100 | |
| P3 | Acute | 37 | 88 | 66 | 83 | 80 | 100 | ||
| 3W | 57 | 57 | 100 | 93.7 | 100 | 83 | 100 | 100 | |
| 7M | 63 | 43 | 93 | 93.7 | 100 | 100 | 100 | 100 | |
| P4 | Acute | 100 | 88.6 | 100 | 100 | 100 | 83.3 | 100 | 100 |
| 4W | 96.6 | 94.2 | 100 | 100 | 100 | 100 | 100 | 100 | |
| 6M | 93.3 | 100 | 100 | 100 | 100 | 100 | 100 | 100 | |
| Control | 0W | 97 | 97 | 100 | 100 | 100 | 100 | 100 | 100 |
| 4W | 100 | 97 | 100 | 100 | 100 | 100 | 100 | 100 | |
| 5M | 100 | 97 | 100 | 100 | 100 | 100 | 100 | 100 | |
BNT: Boston Naming Test, HANA: Hopkins Action Naming Assessment, PPT: Pyramids and Palm Trees, BDAE: Boston Diagnostic Aphasia Examination.
Table 3
Coefficient of variation (CV) in the mean percent BOLD signal across language ROIs for each participant with aphasia. The CV reflects the variability in signal change across ROI for each individual
| CV0-L | CV0-R | CV3-L | CV3-R | CV20-L | CV20-R | Improved in naming | Naming Test Score* 0W | Naming Test Score 3W | Naming Test Score 6M | |
| P1 | 5.2 | 1.9 | 0.39 | 0.26 | 0.29 | 0.21 | 1 | 10 | 47 | 100 |
| P2 | 0.42 | 0.82 | 0.38 | 0.38 | 0.77 | 0.34 | 0 | 83 | 86 | 80 |
| P3 | 1 | 0.72 | 0.38 | 3.5 | 0.7 | –3.1 | 0 | 47 | 57 | 63 |
| P4 | 0.57 | 0.93 | 0.49 | 0.45 | 0.28 | 0.26 | 1 | 89 | 94 | 100 |
*Test score indicate performance on the Boston Naming Test (BNT) for P1, P2, P3 and Hopkins Action Naming Assessment (HANA)for P4.


