
Predictive models for independence after stroke rehabilitation: Maugeri external validation and development of a new model
Abstract
BACKGROUND:
Many efforts have been devoted to identify predictors of functional outcomes after stroke rehabilitation. Though extensively recommended, there are very few external validation studies.
OBJECTIVE:
To externally validate two predictive models (Maugeri model 1 and model 2) and to develop a new model (model 3) that estimate the probability of achieving improvement in physical functioning (primary outcome) and a level of independence requiring no more than supervision (secondary outcome) after stroke rehabilitation.
METHODS:
We used multivariable logistic regression analysis for validation and development. Main outcome measures were: Functional Independence Measure (FIM) (primary outcome), Functional Independence Staging (FIS) (secondary outcome) and Minimal Clinically Important Difference (MCID).
RESULTS:
Patients with stroke admitted to a rehabilitation center from 2006 to 2019 were retrospectively studied (N = 710). Validation of Maugeri models confirmed very good discrimination: for model 1 AUC = 0.873 (0.833–0.915) and model 2 AUC = 0.803 (0.749–0.857). The Hosmer–Lemeshow χ2 was 6.07(p = 0.63) and 8.91(p = 0.34) respectively. Model 3 yielded an AUC = 0.894 (0.857–0.929) (primary outcome) and an AUC = 0.769 (0.714–0.825) (MCID).
CONCLUSIONS:
Discriminative power of both Maugeri models was externally confirmed (in a 20 years younger population) and a new model (incorporating aphasia) was developed outperforming Maugeri models in primary outcome and MCID.
1Introduction
Stroke remains one of the leading causes of disability worldwide, with the majority of stroke survivors requiring specialized inpatient rehabilitation (Harari et al., 2020). Prediction of functional outcome after stroke rehabilitation can be used by clinicians to improve the accuracy of prognoses, set attainable goals, reach shared decisions, personalize rehabilitation plans and inform patients and relatives (Bates et al., 2015). Thus, many efforts have been devoted to identify such predictors (Meyer et al., 2015). Unfortunately, most prediction research focuses on model development and there are relatively few external validation studies (Riley et al., 2019). Besides, a clear distinction should also be made between reporting a model’s external performance done by the authors who developed the prediction model and done by independent investigators. Only a small fraction of the predictive models ever get evaluated on its performance by other authors using external data (Collins et al., 2014).
As recently reported by Stinear and colleagues in a topical review addressing prediction tools for stroke rehabilitation, further work is needed to externally validate the majority of prediction tools currently available (Stinear et al., 2019). Specifically addressing functional independence, Stinear et al. identify only three studies (Scrutinio et al., 2017; Douiri et al., 2017 and de Ridder et al., 2018) that consider several types of factors (e.g. history of diabetes mellitus, stroke lesion location, unilateral neglect, aphasia, previous stroke, dyslipidemia, NIHSS severity, etc.) and finally combine a small number of them in an easy to use way).
In the present study we conduct an external validation of the Scrutinio et al. Maugeri models, after considering their higher discrimination power (retained when restricting to patients admitted within 30 days after stroke onset), all their patients were recruited in inpatient rehabilitation Italian centers (with southern European lifestyle similar to our case), their longer reported length of stay (LOS) (when compared e.g. to Dutch settings, but similar to ours) and the availability of a free online easy-to-use calculator.
As shown in Table 1, Scrutinio et al. used a derivation data set (n = 717) and a validation data set (n =875). The primary outcome measure was the achievement of an M-FIM score of > 61 points at discharge. The secondary outcome measure was a physical independence grade ≥5, as defined in the Functional Independence Staging (FIS) system developed by Stineman and colleagues (Stineman et al., 2003). A derivation dataset was used to build two separate models: model 1 for the primary outcome and model 2 for the secondary outcome. Model 1 included age, time from stroke occurrence to rehabilitation admission, admission motor and cognitive Functional Independence Measure scores and neglect. Model 2 included age, male gender, time since stroke onset, and admission motor and cognitive Functional Independence Measure score.
Table 1
Top three functionality models reported by Stinear et al.
| Model | Scrutinio et al. | Douiri et al. | De Ridder et al. |
| Predicted outcome | Probability of a M-FIM score > 61 points | BI score | Probability of each of 5 categories based on BI score |
| Included predictors | Age, sex, neglect, FIM at admission, time to admission to inpatient rehabilitation | Age, sex, GCS, NIHSS, stroke type | Age, NIHSS, previous stroke, atrial fibrillation, diabetes mellitus |
| Externally validated | YES | YES | NO |
| Predicted time point | Discharge from inpatient rehabilitation | Any week up to 1 y poststroke | Discharge from Inpatient rehabilitation |
| Derivation | n = 717 | n = 495 | n = 1227 |
| Validation | n = 875 | n = 1049 | n = 1589 (no BI) |
| Discrimination power | AUC = at least 0.85 | AUC = 0.76 | R2 = 0.83 |
| Main limitations | Predicting outcome only at discharge, only Italian centers with homogeneous standards of care, large LOS | Imprecise final graphical recovery curves, effectiveness and usefulness of recovery curves need to be confirmed, no online tool | Predicting outcome only at discharge, only ischemic, only Dutch centers with homogeneous standards of care, no BI validation (only mRS), no online tool |
| Strengths | Free online calculator, excellent discrimination, predicts mild stroke impairment using FIM, easily remembered cutoff scores, high discriminative ability even when applied to patients admitted≤30 days | 8 time points during the first-year poststroke, population-based cohort (no hospital-based population) | Provide a simple scoring system, large sample |
LOS: length of stay; BI: Barthel Index; NIHSS: National Institutes of Health Stroke Scale FIM: Functional independence measure; M-FIM: motor FIM; AUC: Area Under Curve; GCS: Glasglow Comma Scale.
The aims of the present study are i) to externally validate Maugeri model 1 and model 2, ii) to develop and internally validate a modified version of these models (model 3) iii) to provide a free online calculator of model 3 and deliver a public version of it that can be easily tailored to other predictive models by updating only their main parameters.
2Methods
The study population consisted of 1419 patients consecutively admitted for stroke rehabilitation from March 2006 to September 2019. Patients were included in the study if they had been admitted within 90 days of onset of an ischemic or hemorrhagic stroke and had an admission FIM score of < 80 points and a motor (M)-FIM score of < 61 points.
Patients who were admitted > 90 days after stroke (n = 209; 29%), with no FIM assessment within a week since stroke rehabilitation admission (n = 198; 28%), had missing data (n = 156; 22%), had an admission FIM score of ≥80 points (n = 58; 8%), a M-FIM score of ≥61 points (n = 45; 6%) and were transferred to an acute care facility or discharged against medical advice (n = 43; 6%) were excluded. Therefore, 710 patients were available for analysis.
The setting was the inpatient Acquired Brain Injury rehabilitation unit of Institut Guttmann, certified in quality of care and patient safety (Joint Commission International since 2005, consecutively recertified in 2009, 2012 and 2018) (Joint Commission International, 2020).
At admission, each patient is assigned a medical doctor, who coordinates the rehabilitation team (a nurse, a physiotherapist, an occupational therapist, a social worker, and a clinical psychologist or neuropsychologist -speech specialist if required, based on the characteristics of the case). Therefore, trained physiotherapists recorded admission and discharge FIM scores, as a part of the rehabilitation program. All the data were extracted from the electronic Hospital Information System.
This is a STROBE compliant study and follows the Helsinki Declaration of 1975, as revised in 2008 and was approved by the Ethics Committee of Clinical Research of Institut Guttmann. The participants were anonymized and non-identifiable.
2.1Statistical analyses
All statistical analyses were performed in R-v3.5.1 (64 bits), level of significance was set at P = 0.05. Data are reported as mean and SD or median with 25th and 75th percentiles for continuous variables or percentages for categorical variables. As in Scrutinio et al., in order to prevent the potential loss of prognostic information associated with categorization, all continuous variables were treated as such. Odds ratios with their 95% confidence intervals (CIs) and β coefficients were calculated. Atrial fibrillation was diagnosed based on admission ECG. Standardized tools were used to assess the presence of unilateral neglect when clinically suspected. The final logistic regression model for each outcome was developed by using a forward stepwise selection approach with p < 0.05 to add covariates in the models. Then, we prospectively evaluated the performance of each model by assessing discrimination and calibration. Discrimination was assessed using the area under the receiver operating characteristics curve (AUC). Calibration was assessed using the Hosmer–Lemeshow test.
2.1.1Validation of model 1 and model 2 (the Maugeri models)
We used the 710 patients available for analysis to validate model 1 primary outcome and model 2 secondary outcome. Multivariable logistic regression analysis was used to derive the best-fitting prediction model and 10 fold cross validation repeated 10 times (in a 70–30 training and testing set independent partitions) using the same independent variables as in Scrutinio et al.
2.1.2Derivation of model 3
The following candidate predictor variables were considered for potential inclusion to derive model 3 to predict primary and secondary outcomes: age, sex, marital and employment status, hypertension, diabetes mellitus, dyslipidemia, body mass index, atrial fibrillation, time from stroke occurrence to rehabilitation admission, type of stroke (ischemic or hemorrhagic), side of impairment, aphasia, unilateral neglect, motor FIM score and cognitive FIM score at admission.
2.1.3Sensitivity analysis
Sensitivity analyses were performed to assess the performance of model 3 in i) patients admitted ≤30 days after stroke occurrence, ii) patients with severe stroke defined by an admission M-FIM score of < 37 points and iii) patients’ LOS ≤66 days.
2.1.4Additional analyses
In model 3 we conducted two exploratory analysis, in order to i) examine the predictors of Minimal Clinically Important Difference (MCID) for motor-FIM score and ii) predictors of motor FIM at six months after discharge
3Results
3.1Patient characteristics and outcomes
Table 2 shows the baseline characteristics of the patients (after obtaining written permission from the Authors (Scruitinio et al., 2017), the Maugeri derivation and validation could be added to Table 2 to facilitate comparison). Three hundred and two patients (42.5%) achieved primary outcome and one hundred and forty eight (20.8%) achieved the secondary outcome. Supplementary Figure 1 shows radar plots for admission and discharge mean M-FIM scores in patients who achieved the primary or the secondary outcome.
Table 2
Baseline characteristics of the included participants (n = 710)
| Age, y, mean (SD) | 52 (10) |
| Age > 75 y, % | 1.8 |
| Males, % | 61.8 |
| Marital status | |
| Married, % | 66.5 |
| Not married, % | 33.5 |
| Hypertension, % | 50.8 |
| Diabetes mellitus, % | 15.4 |
| Atrial fibrillation, % | 2.3 |
| TSO, d, median (IQR) | 37 (23–56) |
| Type of stroke | |
| Ischemic, % | 53.0 |
| Hemorrhagic, % | 47.0 |
| Side of impairment | |
| Right, % | 38.9 |
| Left,% | 48.6 |
| Aphasia,% | 33.7 |
| Neglect, % | 35.9 |
| NIHSS, median (IQR) | 14 (10–17) |
| Admission FIM score | |
| Total-FIM, median (IQR) | 47 (30–63) |
| Motor-FIM, median (IQR) | 25 (16–38) |
| Cognitive-FIM, median (IQR) | 19 (11–27) |
| Discharge FIM score | |
| Total-FIM, median (IQR) | 81 (57–98) |
| Motor-FIM, median (IQR) | 57 (35–70) |
| Cognitive-FIM, median (IQR) | 25 (17–31) |
| Motor-FIM gain, median (IQR) | 24 (11–38) |
| Admission FIS grade | |
| Grade I-total assistance, % | 16.8 |
| Grade II-maximal assistance, % | 72.5 |
| Grade III-modified assistance. % | 9.4 |
| Grade IV- minimal assistance, % | 1.3 |
| Discharge FIS grade | |
| Grade I-total assistance, % | 5.1 |
| Grade II-maximal assistance, % | 34.5 |
| Grade III-modified assistance. % | 12.4 |
| Grade IV- minimal assistance, % | 27.2 |
| Grade V-supervision, % | 14.2 |
| Grade VI-modified independence,% | 5.8 |
| Grade VII-total independence, % | 0.8 |
| Length of hospital stay, d, mean (SD) | 75 (31) |
| Achieved the primary outcome, % | 42.5 |
| Achieved the secondary outcome, % | 20.8 |
| MCID for motor-FIM ≥25 points, % | 49.3 |
MCID: Minimal Clinically Important Difference; TSO:Time from stroke occurrence to rehabilitation admission; FIM: Functional Independence Measure; FIS: Functional Independence Staging system; IQR: interquartile range; NA: not assessed; and NIHSS: National Institutes of Health Stroke Scale.
Mean age at lesion of the included participants was 52(10) years meanwhile in Maugeri derivation was 72(12) and validation was 70(12). The proportion of participants aged > 75 was 1.8% in our dataset meanwhile it was 46.2% and 41% in Maugeri.
In relation to sex, in our dataset the proportion was 62% men 38% women (similar to Maugeri). When considering the 709 excluded participants the proportion of men and women was almost the same. Similarly, the mean age of the excluded participants was 50(10), details of excluded patients are presented in Supplementary Table 1.
Additional baseline information is presented in Supplementary Table 2 for our participants, e.g. 90.7% of participants were aged < 65 years; NIHSS severity is further detailed in Table 1 stratified in three groups (73.1% of participants present severe stroke (NIHSS > 10)).
3.2Validation of model 1 and model 2 and derivation of model 3
Table 3 shows multivariable predictors of the primary and secondary outcomes for model 1, model 2 and for model 3 using our dataset. Model 3 includes a new predictor (aphasia) and removes Cognitive FIM score, as result of the stepwise procedure of variables selection presented in Section 2.
Table 3
Multivariable predictors of the primary and secondary outcomes for models 1, 2 and 3 for our dataset
| Variables | β coefficients | Odds ratio (95% CI) | p value | Outcome |
| Model 1 | Primary | |||
| Age | –0.042 | 0.95 (0.94–0.97) | < 0.0001 | |
| TSO | –0.026 | 0.97 (0.96–0.98) | < 0.0001 | |
| Unilateral neglect | –0.680 | 0.50 (0.34–0.74) | 0.0007 | |
| Motor-FIM score | 0.080 | 1.08 (1.06–1.10) | < 0.0001 | |
| Cognitive FIM score | 0.023 | 1.02 (1.00–1.04) | 0.0494 | |
| Model 2 | Secondary | |||
| Age | –0.016 | 0.98 (0.96–1.00) | 0.0776 | |
| TSO | –0.022 | 0.97 (0.96–0.98) | < 0.0001 | |
| Male gender | 0.151 | 1.16 (0.77–1.77) | 0.4726 | |
| Motor-FIM score | 0.054 | 1.05 (1.03–1.07) | < 0.0001 | |
| Cognitive FIM score | 0.025 | 1.02 (1.00–1.05) | 0.0398 | |
| Model 3 | Primary | |||
| Age | –0.041 | 0.95 (0.94–0.97) | < 0.0001 | |
| TSO | –0.027 | 0.97 (0.96–0.98) | < 0.0001 | |
| Unilateral neglect | –0.711 | 0.49 (0.32–0.72) | 0.00046 | |
| Motor-FIM score | 0.083 | 1.08 (1.07–1.10) | < 0.0001 | |
| Aphasia | –0.466 | 0.62 (0.41–0.94) | 0.0272 | |
| Constant = 0.99 | ||||
| Model 3 | Secondary | |||
| Age | –0.013 | 0.98 (0.96–1.00) | 0.1574 | |
| TSO | –0.024 | 0.97 (0.96–0.98) | < 0.0001 | |
| Unilateral neglect | –0.601 | 0.54 (0.34–0.85) | 0.0089 | |
| Motor-FIM score | 0.052 | 1.05 (1.03–1.07) | < 0.0001 | |
| Aphasia | –0.914 | 0.40 (0.24–0.64) | 0.00028 |
TSO: Time from stroke occurrence to rehabilitation admission; FIM: Functional Independence Measure.
3.3Discrimination and calibration (model 3)
Table 4 presents AUC and calibration results using our dataset for model 1, model 2 and model 3. For model 3 primary outcome, AUC was 0.894 (95% CIs, 0.857–0.929), detailed in Supplementary Figure 2, the Hosmer–Lemeshow χ2 statistic was 10.40 (p = 0.23). For model 3 secondary outcome, AUC was 0.845 (95% CIs, 0.789–0.900), detailed in Supplementary Figure 3, the Hosmer–Lemeshow χ2 statistic was 6.94 (p = 0.54). Table 4 may also show AUC and calibration results for model 1 and model 2 using Maugeri derivation and validation datasets for the primary and secondary outcomes after obtaining written permission from the Authors (Scruitinio et al., 2017), to facilitate comparison of results.
Table 4
Performance (discrimination and calibration) of models 1, 2 and 3 using our dataset (for primary and secondary outcomes)
| Model | Outcome | AUC (95% CI) | χ2 |
| Model 1 | Primary | 0.873 (0.833–0.915) | 6.07 (P = 0.63) |
| Model 2 | Secondary | 0.803 (0.749–0.857) | 8.91 (P = 0.34) |
| Model 3 | Primary | 0.894 (0.857–0.929) | 10.40 (P = 0.23) |
| Model 3 | Secondary | 0.845 (0.789–0.900) | 6.94 (P = 0.54) |
Figure 1 presents the calibration plots using our dataset for model 1 primary outcome (top left), model 2 secondary outcome (bottom left), model 3 primary outcome (top right) and model 3 secondary outcome (bottom right).
Fig. 1
Calibration plots using our dataset for model 1 primary outcome (top left), model 2 secondary outcome (bottom left), model 3 primary outcome (top right) and model 3 secondary outcome (bottom right).
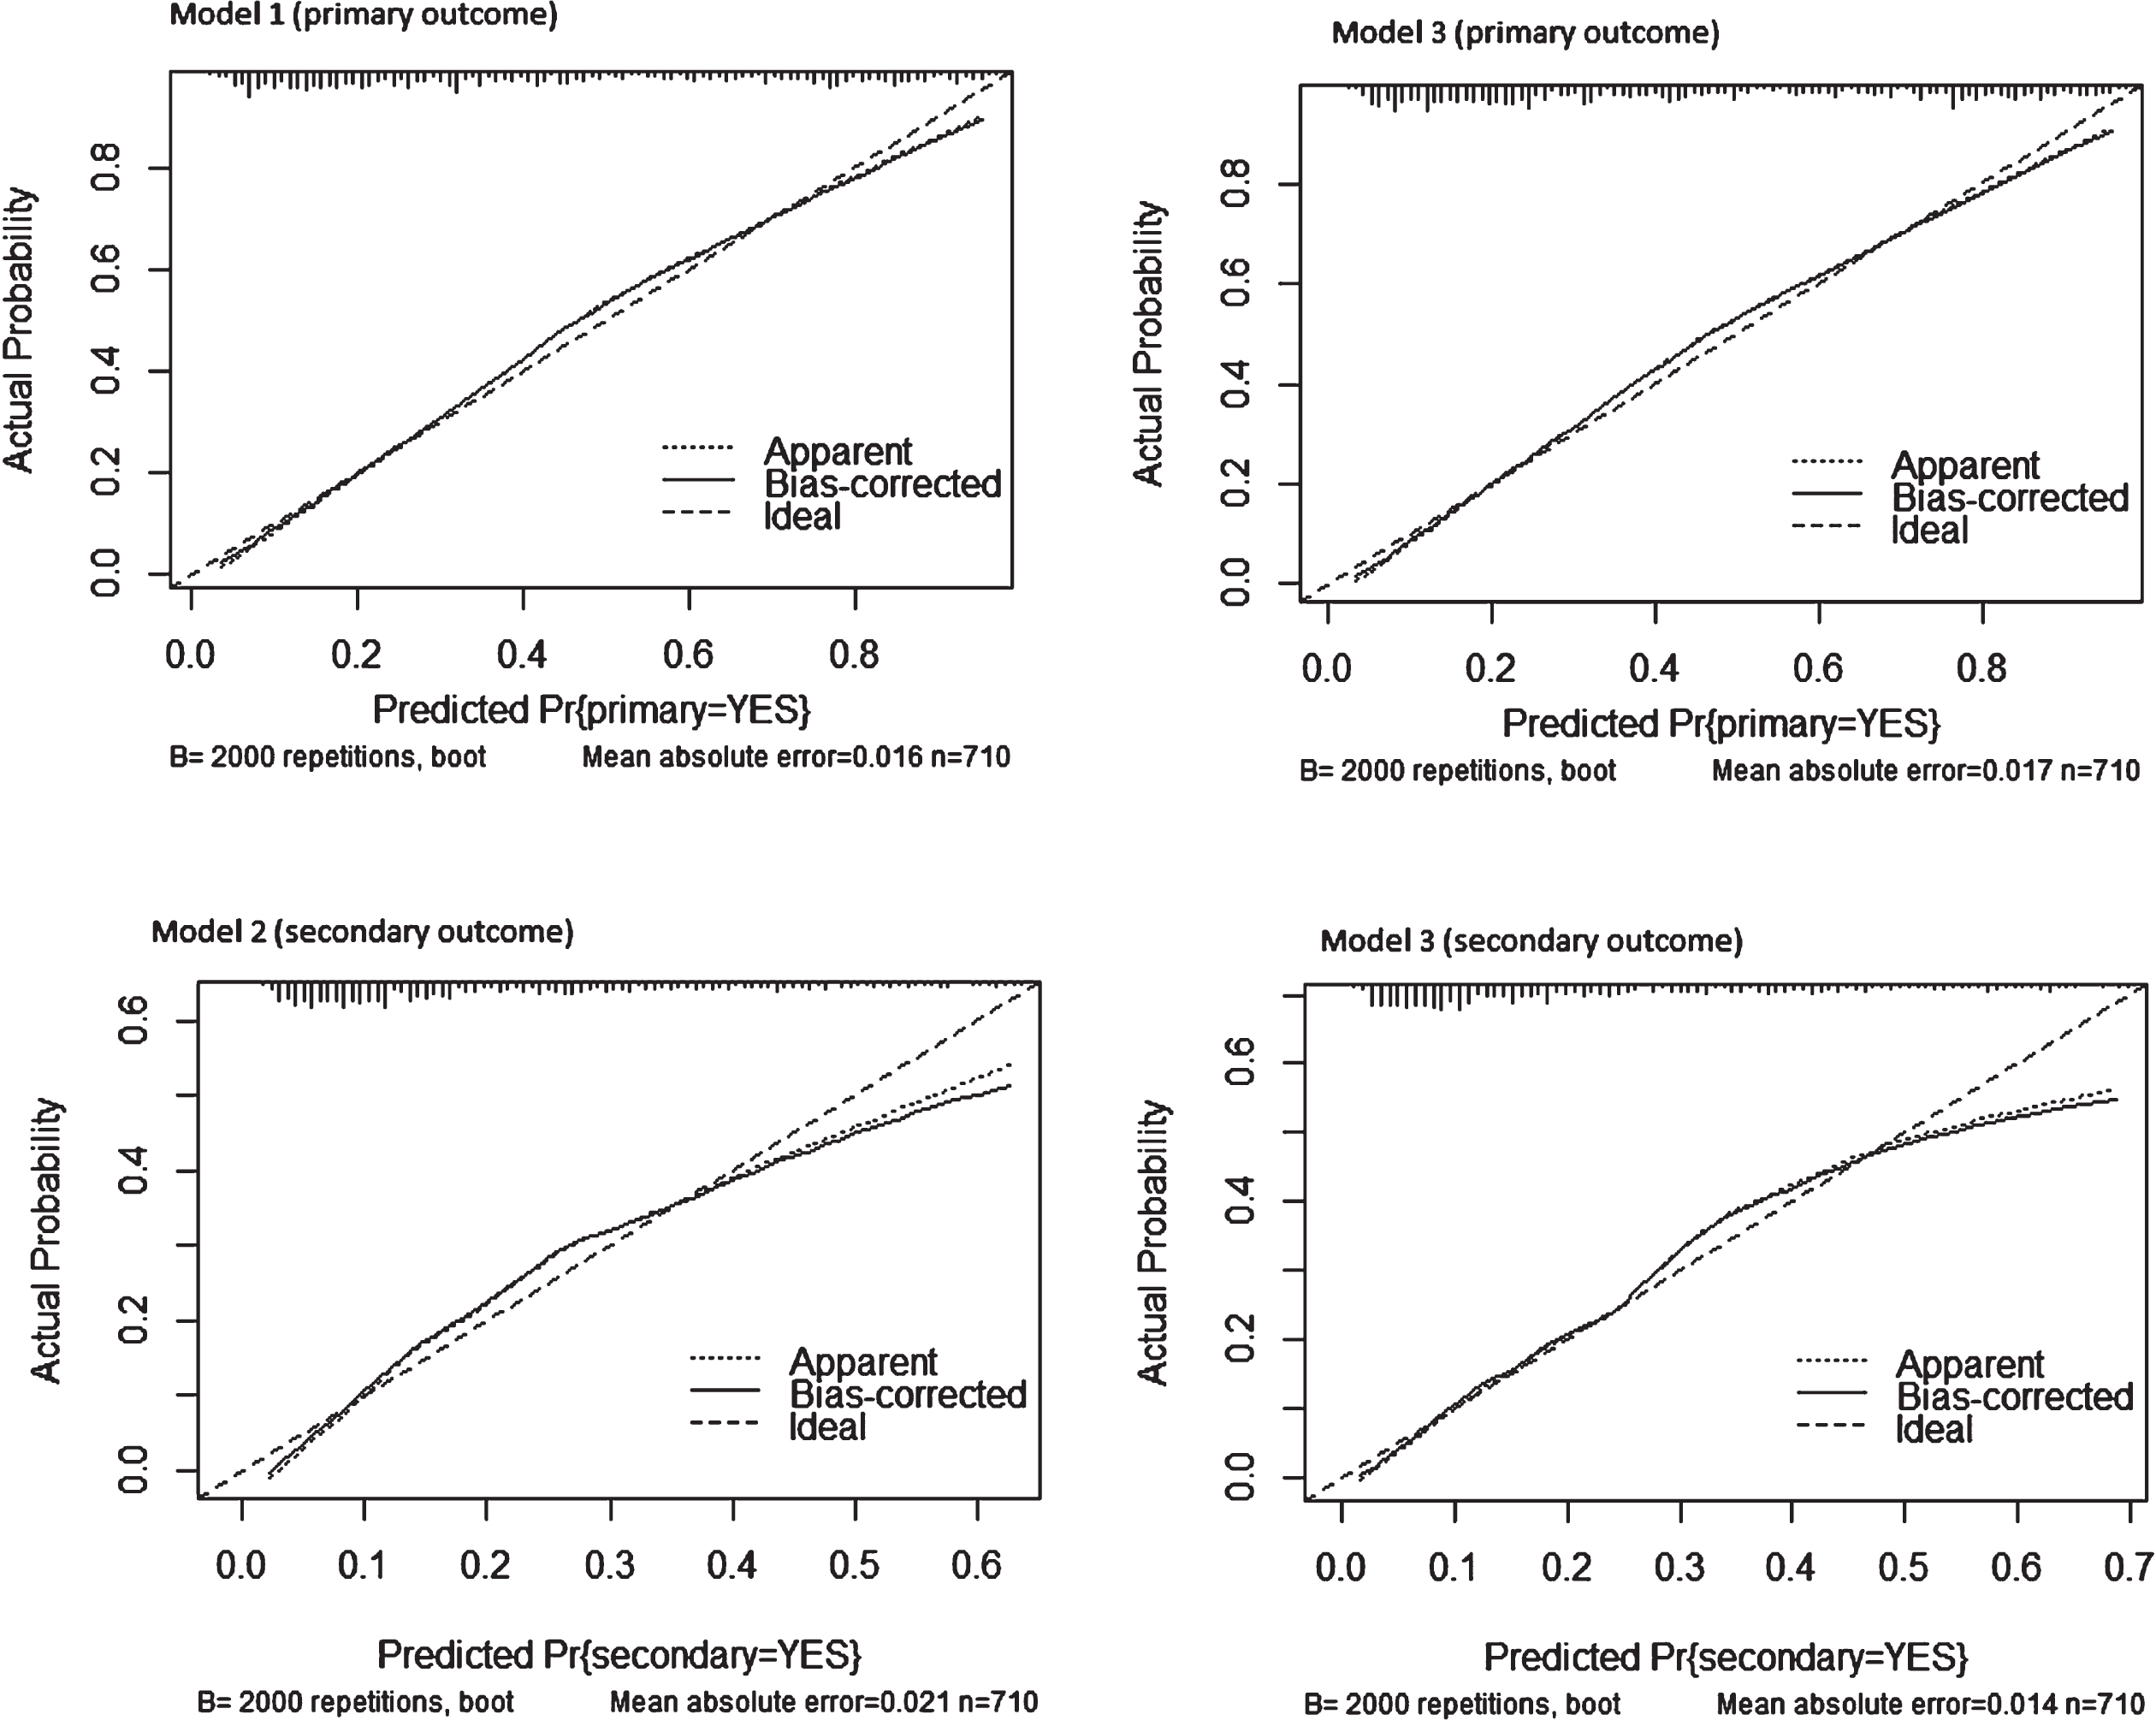
The “Ideal” line represents perfect prediction as the predicted probabilities equal the observed probabilities. The “Apparent” line is the in-sample calibration. The “Bias Corrected” line is derived via a resampling procedure (bootstrap 2000 repetitions) to help add uncertainty to the calibration plot to get an idea of how this might perform out-of-sample and adjusts for optimistic (better than actual) calibration that is in fact an artifact of fitting a model to the data at hand. This line provides a measure of generalization (until we have new data to try the model on). When either of the two lines is above the “Ideal” line, this tells us the model underpredicts in that range of predicted probabilities. When either line is below the “Ideal” line, the model overpredicts in that range of predicted probabilities. All four models appear to be reasonably well calibrated based on the Bias-Corrected line closely following the Ideal line; nevertheless there is some underprediction at lower predicted probabilities of model 2 secondary outcome because the Bias-Corrected line is below the Ideal line around < 0.1 predicted probability and above it < 0.3 when compared to model 3 secondary outcome which performs better at < 0.3.
The ticks across the x-axis represent the frequency distribution (a rug plot) of the predicted probabilities. This is a way to see where there is sparsity in our predictions and where there is a relative abundance of predictions in a given area of predicted probabilities. Model 2 secondary outcome and model 3 secondary outcome present higher frequency along < 0.3 predicted probability, remarking the better calibration of model 3 secondary outcome when compared to model 2 secondary outcome.
3.4Sensitivity analysis
Two hundred and sixty one patients had been admitted ≤30 days from stroke occurrence in our dataset (36.8% of the 710 total) as shown in Table 5. Of these patients, 57.4% achieved the primary outcome and 29.5% achieved the secondary outcome.
Table 5
Sensitivity analysis for model 3 using our dataset
| Outcome | n (%) | AUC (95%CI) |
| Admitted≤30 days Primary outcome | 261 (36.8) | 0.876 (0.81–0.94) |
| Admitted≤30 days Secondary outcome | 261 (36.8) | 0.8082 (0.72–0.89) |
| Admission M-FIM < 37 Primary outcome | 507 (71.4) | 0.862 (0.810–0.914) |
| Admission M-FIM < 37 Secondary outcome | 507 (71.4) | 0.865 (0.790–0.940) |
| MCID M-FIM≥25 | 350 (49.3) | 0.769 (0.714–0.825) |
| LOS≤66 Primary outcome | 342 (48.2) | 0.901 (0.849–0.952) |
| LOS≤66 Secondary outcome | 342 (48.2) | 0.844 (0.776–0.913) |
| 6 months after injury Primary outcome | 372 (52.4) | 0.938 (0.90–0.97) |
MCID: Minimal Clinically Important Difference; FIM: Functional independence measure; LOS: length of stay.
Model 3 yielded an AUC of 0.875(0.81–0.94) for the primary outcome (detailed in Supplementary Figure 4), and 0.8082 (0.72–0.89) for the secondary outcome (detailed in Supplementary Figure 5). Model 1 and model 2 sensitivity results may be included in Table 5 after obtaining written permission from the authors to facilitate comparison of results.
Five hundred and seven patients (71.4%) had initial severe motor impairment defined by an admission M-FIM score of < 37 points. Their median admission M-FIM was 19 (interquartile range, 14–27) points. Supplementary Table 3 shows selected baseline characteristics. Of these patients, 29.2% achieved the primary outcome and 13.2% achieved the secondary outcome. Model 3 yielded an AUC of 0.862 (0.810–0.914) for the primary outcome (detailed in Supplementary Figure 6) and 0.865(0.790–0.940) for the secondary outcome (detailed in Supplementary Figure 7).
Three hundred and forty two patients had a LOS ≤66 days in our dataset (48.2% of the 710 total) as shown in Table 5. Their median LOS was 52 (interquartile range, 39–60) days. Of these patients, 53.5% achieved the primary outcome and 28.1% achieved the secondary outcome. Model 3 yielded an AUC of 0.901 (0.849–0.952) for the primary outcome (detailed in Supplementary Figure 8) and 0.844 (0.776–0.913) for the secondary outcome (detailed in Supplementary Figure 9).
3.5Additional analyses
Table 5 presents two additional analyses. First, we examined the predictors of Minimal Clinically Important Difference (MCID) for motor-FIM score. The MCID for motor-FIM was set at ≥25 points as in Scrutinio et al. Three hundred and fifty (49.3%) patients achieved the MCID in our dataset. Model 3 yielded an AUC of 0.769 (0.714–0.825), as detailed in Supplementary Figure 10.
In a second additional analysis, we identified 372 patients who had a third FIM assessment between 6 to 8 months after injury. Their median number of days since injury to third FIM assessment was 196 (interquartile range, 169–244) days. Model 3 yielded an AUC of 0.938 (0.90–0.97) for the primary outcome. In this case the primary outcome measure was the achievement of an M-FIM score of > 61 points at 6 to 8 months after injury. Adding NIHSS to model 1, 2 and 3 in both primary and secondary outcomes did not improve AUCs reported in Tables 4 and 5.
3.6Online calculator
An HTML implementation was developed to allow calculation of the estimated probability of achieving the primary and/or secondary outcomes. Supplementary Figure 11 shows an example for model 3 primary outcome. The HTML code implementation allows for a direct identification of the involved variables and their β coefficients, therefore adapting it to future models is straightforward.
4Discussion
We developed model 3 and validated Maugeri model 1 and model 2 to estimate the probability of achieving functional improvement, as defined by the achievement of an M-FIM > 61 points (primary outcome), or a level of independence requiring no more than supervision according to the FIS system (secondary outcome) after stroke rehabilitation. Maugeri model 1 and model 2 were selected for external validation after considering the recently reported state of the art in functional predictors of rehabilitation outcomes (Stinear et al., 2019).
Model 3 incorporates age, time from stroke occurrence to inpatient rehabilitation admission, admission M-FIM score, neglect and aphasia. Aphasia was included as candidate predictor in both Maugeri models but it was not found significant, as opposed to our case. Supplementary Figure 12 presents the 95% CI of motor FIM scores at discharge for patients with aphasia and patients without aphasia by age range. Supplementary Figure 12 allows us to visualize differences in motor FIM at discharge between patients with aphasia and patients without aphasia, regardless of the age group that patients belong to. When considering primary outcome, model 3 (AUC = 0.894 (0.857–0.929)) outperformed Maugeri model 1 in both derivation (AUC = 0.883 (0.858–0.910)) and validation (AUC = 0.866 (0.840–0.892)) datasets.
In relation to secondary outcome, model 3 (AUC =0.845 (0.789–0.900)) performed almost equal to Maugeri model 2 validation (AUC = 0.850 (0.815–0.885)) but was outperformed by Maugeri model 2 derivation (AUC = 0.913 (0.884–0.942)). Nevertheless, the Maugeri derivation dataset presents the lowest proportion of participants achieving the secondary outcome (13.9%), meanwhile these proportions were higher in the Maugeri validation (18.3%) and in our dataset (20.8%).
When considering only participants presenting an initial severe motor impairment (defined by an admission M-FIM score of < 37 points), model 3 primary outcome (AUC = 0.862 (0.810–0.914)) outperformed both Maugeri model 1 derivation (AUC = 0.833 (0.796–0.870)) and Maugeri model 1 validation (AUC = 0.826 (0.790–0.861)). Similarly, when considering initial severe motor impairment, secondary outcome, model 3 (AUC = 0.865(0.790–0.940)) outperformed Maugeri model 2 derivation (AUC = 0.857 (0.805–0.909)) and Maugeri model 2 validation (AUC = 0.789 (0.735–0.844)).
When examining the predictors of MCID for motor-FIM score. (set as ≥25 points), model 3 (AUC = 0.769 (0.714–0.825)) outperformed Maugeri model 4 (presented in Scrutinio et al., Supplementary Materials) for both derivation dataset (AUC = 0.754 (0.718–0.790)) and validation dataset (AUC = 0.757 (0.726–0.789)).
A reported limitation of the study by Scrutinio et al. (also presented in Table 1) was in relation to LOS, quite longer than comparable populations in other countries. Mean or median LOS varies considerably, ranging from 17 days in the United States (Reistetter et al., 2010) to 35 in Canada (Grant et al., 2014), to 44–66 in Europe (De Wit et al., 2007). Therefore, as presented in Table 5, we conducted an additional analysis considering only participants with LOS≤66 (48.2% of participants) in which model 3 yielded an AUC = 0.901 (0.849–0.952) for primary outcome and AUC = 0.844 (0.776–0.913) for secondary outcome. Another reported limitation of the study by Scrutinio et al. was the prediction of outcomes only at discharge, without considering specific time-points. Therefore, we conducted an additional analysis for model 3 to predict primary outcome at 6 months (up to 8 months) after injury, in this case we were able to include 52.4% of the initial 710 participants and model 3 yielded an AUC of 0.938 (0.90–0.97).
As stratified medicine research examines whether a treatment works better or worse for some subgroups than others (Hingorani et al., 2013), the use of external datasets allows prediction model research to examine whether a model is more accurate for some subgroups than others. As extensively reported in previous research, two of the main predictors of stroke rehabilitation outcomes are age and stroke severity (Forlivesi et al., 2020). Both of them mainly characterize the subgroup of participants included in our study. In Scrutinio et al., 46.2% of participants in the derivation cohort and 41% in the validation cohort were aged > 75 years, the mean age of participants were 72 and 70 years respectively. Meanwhile, in our study only 1.8% of participants were aged > 75 years, 90.7% of participants were aged < 65 and the mean age of our participants was 52 years. Scrutinio et al. reported 42.1% of severe stroke participants (NIHSS > 10) in the derivation dataset, meanwhile in our case it is 73.1%, as presented in Supplementary Table 4.
Besides, associations between factors for ischemic or hemorrhagic stroke and clinical outcomes have been analyzed predominantly in older rather than younger patients (e.g. Scrutinio et al., 2017, Douiri et al., 2017 and de Ridder et al., 2018). Nevertheless, the incidence of any stroke in the young (18–44 years) has increased by 23% during the past ten years (Ekker et al., 2019). Stroke incidence rates have increased in adults aged 55 years and under in the United States (Ramirez et al., 2016) and in Europe (Tibaek et al., 2016).
Although the current recommendations for treatment of young and old patients with stroke are similar, the optimal management of young adult patients with stroke is unknown. (Ekker et al., 2018). They are usually not included in trials, and specific sub-analyses limited to young adult patients with stroke are usually not done (Ekker et al., 2018).
Following the onset of stroke, spontaneous mechanisms of recovery at the cellular, molecular, and systems levels occur. These mechanisms are often compensatory and incomplete since chronic disabilities persist for many individuals. Restorative therapies that rely on neuroplasticity have been developed to ultimately improve motor, sensory, language, and cognitive impairments (Cramer et al., 2011). Often, the mechanisms underlying these therapies rely on similar mechanisms as observed in spontaneous recovery (Cassidy et al., 2017).
4.1Study limitations
The data for this study was collected in one single tertiary center, suggesting that the generalization of these results should be considered carefully. Median time from stroke occurrence until admission to rehabilitation, as well as LOS was longer than comparable populations. However, it is noteworthy that the models retained a strong predictive value even when the analysis was restricted to the patients admitted within 30 days or≤66 days LOS. Model 3 could be strengthened further if it was to be validated in a completely independent holdout population in a different rehabilitation setting.
5Conclusions
We developed a new model and contributed to the validation of Maugeri model 1 and model 2 in a southern European setting (similar to Maugeri) but with specific characteristics, such as age and severity of participants. Our external validation and the development of the new model contribute to supporting researchers and clinicians with easy-to-use, accurate, and validated predictive tools that may be applied in rehabilitation research and stroke management.
Acknowledgments
This research was partially funded by PRECISE4Q Personalised Medicine by Predictive Modelling in Stroke for better Quality of Life - European Union’s Horizon 2020 research and innovation programme under grant agreement no. 777107.
Conflict of interest
Dr. Madai reported receiving personal fees from ai4medicine outside the submitted work. There is no connection, commercial exploitation, transfer or association between the projects of ai4medicine and the results presented in this work.
Supplementary data
[1] The supplementary files are available from https://dx.doi.org/10.3233/NRE-201619.
References
1 | Bates, B. E. , Xie, D. , Kwong, P. L. , Kurichi, J. E. , Ripley D. C. , Davenport, C. , et al. ((2015) ). Development and validation of prognostic indices for recovery of physical functioning following stroke: part 2. PM R, 7: , 699–710. doi: 10.1016/j.pmrj.2015.01.012 |
2 | Cassidy, J. M. , Cramer, C.S. ((2017) ). Spontaneous and Therapeutic-Induced Mechanisms of Functional Recovery After Stroke. Transl Stroke Res, 8: (1), 33–46. doi: 10.1007/s12975-016-0467-5 |
3 | Cramer, S. C. , Sur, M. , Dobkin, B. H. , O’Brien C. , Sanger, T. D. , Trojanowski, J. Q. , et al. ((2011) ). Harnessing neuroplasticity for clinical applications, Transl Stroke Res, 134: (Pt 6), 1591–1609. doi: 10.1093/brain/awr039 |
4 | Collins, G. S. , de Groot, J. A. , Dutton, S. , Omar, O. , Shanyinde, M. , Tajar, A. , Voysey, M. , Wharton, R. , Yu, L. M. , Moons, K. G. , Altman, D. G. ((2014) ). External validation of multivariable prediction models: a systematic review of methodological conduct and reporting. BMC Med Res Methodol, 14: , 40–10.1186/1471-2288-14-40. PMID: 24645774; PMCID: PMC3999945 |
5 | Douiri, A. , Grace, J. , Sarker, S. J. , Tilling, K. , McKevitt, C. , Wolfe, C. D. , et al. ((2017) ). Patient-specific prediction of functional recovery after stroke. Int J Stroke, 12: , 539–548. doi: 10.1177/1747493017706241 |
6 | de Ridder, I. R. , Dijkland, S. A. , Scheele, M. , den Hertog, H. M. , Dirks, M. , Westendorp, W. F. , et al. ((2018) ). Development and validation of the dutch stroke score for predicting disability and functional outcome after ischemic stroke: a tool to support efficient discharge planning. Eur Stroke J, 3: , 165–173. doi: 10.1177/2396987318754591 |
7 | De Wit, L. , Putman, K. , Schuback, B. , Komárek, A. , Angst, F. , Baert, I. , et al. ((2007) ). Motor and functional recovery after stroke: a comparison of 4 European rehabilitation centers. Stroke, 38: , 2101–2107. doi: 10.1161/STROKEAHA.107.482869 |
8 | Ekker, M. S. , Boot, E. M. , Singhal, A. B. , Tan, K. S. , Debette, S. , Tuladhar, A. M. , de Leeuw, F. E. ((2018) ). Epidemiology, aetiology, and management of ischaemic stroke in young adults. Lancet Neurol, 17: (9), 790–801. doi: 10.1016/S1474-4422(18)30233-3. PMID: 30129475 |
9 | Ekker, M. S. , Verhoeven, J. I. , Vaartjes, I. , et al. ((2019) ). Stroke incidence in young adults according to age, subtype, sex, and time trends. Neurology, e2444–e2454. |
10 | Forlivesi, S , Cappellari, M , Bonetti, B. (2020). Obesity paradox and stroke: a narrative review. Eat Weight Disord. doi:10.1007/s40519-020-00876-w. Epub ahead of print. PMID: 32124408. |
11 | Grant, C. , Goldsmith, C. H. , Anton, H. A. ((2014) ). Inpatient stroke rehabilitation lengths of stay in Canada derived from the National Rehabilitation Reporting System, and. Arch Phys Med Rehabil, 95: , 74–78. doi: 10.1016/j.apmr.2013.08.014 |
12 | Harari, Y. , O’Brien, M. K. , Lieber, R. L. , Jayaraman, A. ((2020) ). Inpatient stroke rehabilitation: prediction of clinical outcomes using a machine-learning approach. J Neuroeng Rehabil, 17: (1), 71–10.1186/s12984-020-00704-3. PMID: 32522242; PMCID: PMC7288489 |
13 | Hingorani, A. D. , Windt, D. A. , Riley, R. D. , et al. PROGRESS Group. Prognosis research strategy (PROGRESS) 4: stratified medicine research. BMJ2013;346: :e5793. doi:10.1136/bmj.e5793 pmid:23386361 |
14 | Joint Commission Interntational (last access Sept 2020) https://www.jointcommissioninternational.org/accreditation/. |
15 | Meyer, M. J. , Pereira, S. , McClure, A. , Teasell, R. , Thind, A. , Koval, J. , et al. ((2015) ). A systematic review of studies reporting multivariable models to predict functional outcomes after post-stroke inpatient rehabilitation. Disabil Rehabil, 37: , 1316–1323. doi: 10.3109/09638288.2014.963706 |
16 | Ramirez, L. , Kim-Tenser, M. A. , Sanossian, N. , Cen, S. , Wen, G. , He, S. , et al. (2016). Trends in acute ischemic stroke hospitalizations in the United States. J Am Heart Assoc, 510.1161/JAHA.116.003233. |
17 | Reistetter, T. A. , Graham, J. E. , Deutsch, A. , Granger, C. V. , Markello, S. , Ottenbacher KJ. ((2010) ). Utility of functional status for classifying community versus institutional discharges after inpatient rehabilitation for stroke. Arch Phys Med Rehabil, 91: , 345–350. doi: 10.1016/j.apmr.2009.11.010 |
18 | Riley, R. D , Ensor, J. , Snell, K. I. , Debray, T. P. , Altman, D. G. , Moons, K. G. , Collins, G. S. ((2016) ). External validation of clinical prediction models using big datasets from e-health records or IPD meta-analysis: opportunities and challenges. BMJ, 353: , i3140. doi: 10.1136/bmj.i3140. Erratum in: BMJ, 2019 Jun 25;365:l4379. PMID: 27334381; PMCID: PMC4916924. |
19 | Scrutinio, D. , Lanzillo, B. , Guida, P. , Mastropasqua, F. , Monitillo, V. , Pusineri, M. , Formica, R , Russo, G. , Guarnaschelli, C. , Ferretti, C. , Calabrese, G. ((2017) ). Development and Validation of a Predictive Model for Functional Outcome After Stroke Rehabilitation: The Maugeri Model. Stroke, 48: (12), 3308–3315. doi: 10.1161/STROKEAHA.117.018058. Epub 2017 Oct 19. PMID: 29051222. |
20 | Stineman, M. G. , Ross, R. N. , Fiedler, R. , Granger, C. V. , Maislin, G. ((2003) ). Staging functional independence validity and applications. Arch Phys Med Rehabil, 84: , 38–45. doi: 10.1053/apmr.2003.50060 |
21 | Stinear, C. M. , Smith, M. C. , Byblow, W. D. ((2019) ). Prediction Tools for Stroke Rehabilitation. Stroke, 50: (11), 3314–3322. doi: 10.1161/STROKEAHA.119.025696. Epub 2019 Oct 15. PMID: 31610763 |
22 | Tibaek, M. , Dehlendorff, C. , Jørgensen, H. S. , Forchhammer, H. B. , Johnsen, S. P. , Kammersgaard, L. P. Increasing incidence of hospitalization for stroke and transient ischemic attack in young adults: a registry-based study. J Am Heart Assoc (2016), 510.1161/JAHA.115.003158. |


