
A national benchmark investigation of return-to-work outcome rates between African American, Native American or Alaskan Native, Latino, Asian American or Pacific Islander, and Non-Latino White veterans served by state vocational rehabilitation agencies: Application of bootstrap data expansion
Abstract
BACKGROUND: Research examining the provision of effective state vocational rehabilitation agency (SVRA) sponsored services is pertinent to improving successful return-to-work outcomes among veterans of color (i.e., African Americans, Native Americans or Alaska Natives, Latinos, and Asian Americans or Pacific Islanders versus non-Latino Whites). To date, however, scant attention has been paid to examining these target groups’ outcome patterns.
OBJECTIVE: This study employed a stratified bootstrap data expansion approach to assess the relationship between race/ethnicity, gender, level of educational attainment at closure and return-to-work among veterans with a signed individualized plan for employment (IPE).
METHODS: National fiscal year (FY) 2013 Rehabilitation Services Administration (RSA)-911 case records (N = 11,603) were extracted and re-sampled across multiple trials using bootstrap procedures to increase logistic regression model accuracy.
RESULTS: The findings indicated that African American and female veterans were statistically significantly less likely to return-to-work compared to non-Latino White and female veterans, respectively. Return-to-work probabilities were ‘poorest’ for African American veterans followed by Native Americans or Alaska Natives, Asian Americans or Pacific Islanders, Latinos, and then non-Latino Whites.
CONCLUSIONS: These findings warrant new service (e.g., greater SVRA and U.S. Department of Veterans Affairs’ (VA) co-service provision) and policy initiatives.
1Background
The reintegration of veterans to occupational function and prevention of job loss is perhaps the most important aspect of success for veterans with disabilities (Frain, Bishop, & Bethel, 2010; Moran, Schmidt, & Burker, 2013). No issue is more important to veterans of color with disabilities than finding a good job. Determining the most effective means by which to assist them to obtain employment and secure career pathways is perhaps one of the most preeminent issues of today’s times. Despite the countless sacrifices of these service men and women, their existence beyond their military career is sometimes fraught with bleak employment and economic challenges, and such issues are especially problematic for young veterans of color returning from war (Feist-Price & Khanna, 2011). Some of these challenges are directly associated with service-connected mental and physical disabilities, while other barriers are related to the limitations they experience with employment and career outcomes.
Veterans of color (i.e., African Americans, Native Americans or Alaskan Natives, Latinos, and Asian Americans or Pacific Islanders) comprise about 18% (N = 4,019,090) of all veterans (N = 22,328,279) residing in the U.S. (National Center for Veterans Analysis and Statistics, 2013). Of the total universe of minority veterans, an estimated 10.8% (N = 2,411,454) are African Americans, 0.6% (N = 133,970) are Native Americans or Alaskan Natives, 6% (N = 1,339,697) are Latinos, and 1.3% (N = 290,258) are Asian Americans or Pacific Islanders. Overall, female veterans make up about 7% (N = 1,562,979) of all living veterans while males comprise the residual 93% (N = 20,765,300) of the total population. Of these female veterans, an estimated 30.4% (N = 475,146) are either African American (20.1% or N = 314,160), Native American or Alaskan Native (0.7% or 10,940), Latina (7.8% or N = 121,912), or Asian American or Pacific Islanders (1.8% or 28,134). Saliently, almost 1 in every 3 veterans serving in Gulf War II (post-September 11, 2001 to present) and Gulf War I (also referred to as the Persian Gulf War) were African American and 1 in 5 was Latino (National Center for Veterans Analysis and Statistics, 2013).
Many of these minority veterans enlist in the U.S. Armed Forces as a means of securing a better life and escaping some of the harsh realities of poverty and unemployment that are pervasive in their daily existence (Feist-Price & Khanna, 2011). Unfortunately, significant numbers return home and are discharged from active duty with various physical and mental disabilities. Post-traumatic stress disorder (PTSD), traumatic brain injury (TBI), and major depression are described as the “signature injuries” of the most recent conflicts (Ainspan, 2011). Other documented prevalent disabilities include substance use disorders (Grossman, 2009; Twamley et al., 2013), chronic pain (Cifu et al., 2013), and hearing and vision impairments (Grossman, 2009; Tennant, 2012). Further, the comorbidity of disabilities has been labeled as polytrauma because of the combined functional limitations of each disability (Cifu et al., 2013). Combat related disabilities oftentimes result in self-care limitations, difficulty with independent living, and work limitations (Tennant, 2012; Twamley et al., 2014). African American and Latino veterans report significantly greater odds of disability when compared to non-Latino White veterans (Sheehan et al., 2012). They are also more likely to develop PTSD; Asian veterans have higher rates of diagnosed schizophrenia; and Native American Vietnam War era veterans still experienced PTSD more than 25 years after that war (National Alliance on Mental Illness, 2014).
Research that examines the provision of effective state vocational rehabilitation agency (SVRA) sponsored services to veterans of color with disabilities desiring to reintegrate into competitive employment and careers is indeed pertinent. SVRAs are eligibility programs mandated to provide various services that assist veterans with disabilities with employment and job placement needs (Alston, Lewis, & Loggis, 2014). To be eligible, a person must have a physical or mental impairment that substantially impedes employment, which is considered a major life activity, can benefit from VR services, and require VR services to become gainfully employed (U.S. Department of Education, 2014). In a recent study, Moore, Wang, Johnson, Manyibe, Washington, and Muhammad (2015) examined the relationship between race and employment outcomes. They found that (a) the odds of White veterans successfully returning to work were nearly 1½ times the odds of African American veterans returning to work, and (b) African American female veterans had the lowest probability for return-to-work success. While their inquiry included African Americans and Whites as the 2 sole levels of the manipulation or independent variable, relatively few studies have included Native Americans, Asian Americans, Pacific Islanders and Latino veterans in such comparison analysis. Thus, little information is available to assist SVRAs in discerning which target groups might warrant additional attention through training and development.
1.1Disability public policy context
Section 21 of the Rehabilitation Act Amendments of 1998 documented patterns of inequitable treatment of minorities (i.e., African Americans, Native Americans, Latinos, and Asian Americans) across all stages of the VR process. More specific, congress found that: (a) persons from these traditionally underrepresented populations possessed higher rates of disability, (b) they were underrepresented in the public VR system, and (c) they were less likely to achieve positive employment outcomes when compared to Whites (Lewis et al., 2007). Findings could lead to future scaled-up inquiries and subsequent new policy and promising service initiatives and strategies aimed at eradicating differential experiences.
2Purpose of the study
To date, scant attention has been paid to examining African American, Native American or Alaskan Native, Latino, and Asian American or Pacific Islander veterans’ access and return-to-work outcomes within the SVRA context. This ex-post-facto analysis will contribute toward filling this apparent void of VR research involving these under-explored target populations. The purpose of this analysis was to address Section 21 by examining, discovering, and describing new service outcome patterns and disparities in successful return-to-work outcomes rates based on race/ethnicity, gender, and level of educational attainment at closure among veterans with a signed Individualized Plan for Employment (IPE). The generated national profile was broken out by Rehabilitation Services Administration (RSA) Regions. We compared return-to-work-outcomes between African American, Native American or Alaskan Native, Latino, Asian American or Pacific Islander, and non-Latino White veterans across the 10 RSA regions, and the national fiscal year (FY) 2013 RSA-911 database benchmark. RSA regional cataloging was accessed through the following website; http://www2.ed.gov/students/college/aid/rehab/catrcep.html. For the purposes of this study, the national benchmark was calculated as the return-to-work outcome rate for all persons regardless of race or ethnicity closed in statuses 26 and 28. The following research questions were addressed:
Research Question 1: What is the national and RSA regional profile (i.e., racial/ethnic cohort frequencies and percentages) of return-to-work outcomes for and between African American, Native American or Alaskan Native, Latino, Asian American or Pacific Islander, and non-Latino White veterans with a signed Individualized Plan for Employment (IPE)?
Research Question 2: What are the return-to-work probabilities for and between African American, Native American or Alaskan Native, Latino, Asian American or Pacific Islander, and non-Latino White veterans with a signed Individualized Plan for Employment (IPE)?
Research Question 3: Are gender, race, and level of educational attainment at closure significantly related to successful return-to-work outcomes among veterans?
3Method
3.1Sample
The overall sample for this study consisted of 11,603 VR consumers who were served by the 56 state and territorial VR agencies across the nation during Fiscal Year (FY) 2013 (October 1, 2012, through September 30, 2013), and were (a) reported as being a veteran (veteran status = 1), (b) identified as Latino (ethnicity status = 1), non-Latino and White only (ethnicity status = 0 and race code = 100000), African American only (ethnicity status = 0 and race code = 010000), Native American or Alaskan Native only (ethnicity status = 0 and race code = 00100), or Asian American or Pacific Islander only (ethnicity status = 0 and race code = 00010 or 00001), and (c) reported as having a developed and signed Individualized Plan for Employment (IPE); i.e., closed status 26 (successfully rehabilitated) or 28 (not successfully rehabilitated). Of these 11,603 veterans, 3,072 (26.48%) were African American, 124 (1.07%) were Native American or Alaskan Native, 723 (6.23%) were Latino, 86 (0.74%) were Asian American or Pacific Islander, and 7,598 (65.48%) were non-Latino White. Overall, males accounted for 10,126 (87.27%) of participants while there were 1,477 (12.73%) females in the study sample.
A race by gender breakout indicated that the sample included 630 Latino male veterans (5.43%) and 93 Latina veterans (0.8%); 105 (0.90%) Native American or Alaskan Native male veterans and 19 (0.16%) Native American or Alaskan Native female veterans; 74 (0.64%) Asian American or Pacific Islander male veterans, and 12 (0.10%) Asian American or Pacific Islander female veterans; 2,602 (22.42%) African American male veterans and 470 (4%) African American female veterans; 6,715 (57.87%) non-Latino White male veterans and 883 (7.6%) non-Latino White female veterans. A plurality of these veterans (N = 4,781 or 41.20%) possessed a high school diploma/equivalency or less while those with some post-secondary education (N = 2,895 or 24.95%), an associate’s degree/vocational technical certificate (N = 2,297 or 19.80%), and a bachelor’s degree or higher comprised the residual of the sample. The total sample was utilized to generate the profile and analysis of VR service access and successful return-to-work outcomes.
The employment of a single regression analysis absent resample procedures is oftentimes problematic for accurately predicting the analysis to the population (Bleeker et al., 2003; Harrell, Lee, & Mark, 1996; Kromrey & Hines, 1996; Pedhazur, 1982; Steyerberg et al., 2001). Moreover, resample procedures by themselves can be inadequate for addressing unbalanced populations with small sample sizes for respective study target groups (Dupret & Koda, 2001; He & Garcia, 2009). To address the issue of resample or the lack thereof, several approaches (i.e. cross validation and split sampling techniques) have been recommended that help to estimate a model’s optimism (Bleeker et al., 2003; Efron & Tibshirani, 1997; Efron & Tibshirani, 1994). For example, Moore et al. (2015) employed a randomized split-half cross-model validation research approach to develop and test of a series of logistic regression models across two samples to identify the best fitting final predictive model. Although applicable, this model may not be optimally suited for producing stable results in the case of unbalanced or small comparison group sample sizes (see Table 1).
The stratified bootstrap method addresses both concerns; resample issues as well as small comparison group sample sizes. The concept of resampling data, more commonly referred to as bootstrapping, has been in use for over three decades although it is increasingly being used in medical fields (Henderson, 2005). This technique involves taking a large number of samples with replacement from the original sample by strata and is useful for analyzing small datasets where prior information is sparse (Zhu, 1997). In contrast to cross-validation or split-sample approaches, bootstrap methods are very efficient, as the entire dataset is used for model development, and no new data have to be collected for validation (Steyerberg et al., 2001). The technique provides nearly unbiased estimates of predictive accuracy that are of relatively low variance (Bleeker et al., 2003; Harrell et al., 1996). Moreover, applied bootstrap data expansion has been shown to have good performance in building and testing models for validation across unbalanced sample populations (Gelman et al., 2014). The benefits of this computer-intensive technique is freedom from two major limiting factors that have dominated classical statistical theory from the beginning: (a) the assumption that the data conform to a bell-shape curve, and (b) the need to focus on statistical measures whose theoretical properties can be analyzed mathematically (Zhu, 1997).
The national FY 2013 RSA-911 database (N = 589,402) was used in this analysis. It is important to note that this database does not differentiate between veterans by “wartime” era. For example, the “veteran” variable in the database does not distinguish between a Wounded Warrior, a Vietnam War Era, a Persian Gulf War veteran, or non-war time veteran. The “veteran” variable only indicates whether the consumer was a veteran (code = 1) or not a veteran (code = 0). The two data categories for the criterion included statuses 26 (i.e., exited with an employment outcome) and 28. The RSA data in the type of closure category labeled 4 and 5 were combined to reflect status 28, which indicates that a veteran was not successful in returning to work. The category labeled 4 (“exited without an employment outcome, after receiving services”) included statuses 14, 16, 18 and 20. The category labeled 5 (“Exited without an employment outcome, after a signed IPE, but before receiving services”) included status 12 only.
3.2Data analysis
Descriptive and multivariate statistics were utilized to analyze data. Access frequencies and return-to-work percentage rates were generated, compared, and reported for the five comparison groups. Next, bootstrap resample techniques were applied to increase the efficiency of validation procedures for predictive logistic regression analyses, and the final predictive model was used to evaluate the return-to-work rates across racial/ethnic target groups, gender, and level of educational attainment at closure. The Statistical Analysis System (SAS), desktop version 9.4, was used in these calculations (SAS Institute, 2014).
3.3Key observations-profile
Several observed differences across RSA Regions and the nation emerged as key findings and could have future implications for veterans of color with disabilities, and the state-federal VR program that serves them. Many of these differences can be observed in the tables and figures presented and do not require additional response. As such, we will discuss only a select number of key observations. First, as shown in Table 2, nationally African American, Native American or Alaska Native, Latino, and Asian American or Pacific Islander veterans with signed IPEs were less likely to return-to-work successfully than non-Latino White veterans with signed IPEs. More specific, we found that 42.12%, 43.55%, 47.16%, and 48.84% of African American, Native American or Alaskan Native, Latino, Asian American or Pacific Islander veterans, respectively, with a signed IPE successfully returned to work nationally compared to 52.25% of non-Latino White veterans with a signed IPE. This finding represents a remarkable 10.13% and 8.70% national disparity for African Americans and Native Americans or Alaskan Natives, and a 5.09% and 3.41% difference between such outcomes for Latinos and Asian Americans or Pacific Islanders and non-Latino Whites. Second, as shown in Fig. 1, stark differences in return-to-work outcome benchmark comparisons between target groups across RSA Regions can be gleaned from the results. The national FY 2013 RSA-911 database benchmark for successful return-to-work outcomes was calculated to be 50.89%. Remarkably, African American, Native American or Alaskan Native, Latino, and Asian veterans’ return-to-work outcome rates were found to be below this benchmark across 7, 6, 7, and 5, respectively, of the 10 regions while such outcomes for Whites were below this criterion in only 2 of the 10 regions.
3.4Consumer characteristics and return-to-work outcomes
The association between select characteristics (i.e., race/ethnicity, gender, education level at closure) was tested using multinomial logistic regression and applied bootstrap resample techniques to increase the efficiency of interval validation procedures (Gude et al., 2009; Steyerberg et al., 2001). The procedures are reflected broadly in Fig. 2. The algorithm and detailed description of the procedures employed to bootstrap replicate, resample, build, and test models follow.
Procedure 1. We stratified and selected case records (n = 50, 100, 500 each stratum), based on the overall inclusion criteria, representing the total sample (N = 11,603) with replacement as a sample. The PROC SURVERYSELECT procedure with ethnicity as the strata in SAS version 9.4 was applied in this procedure (SAS Institute, 2012).
Procedure 2. Sample sizes 5*n with B replicate were created, and then a logistic regression with variable selection procedure was applied to each replicate. Logistic regression is a form of statistical modeling and is appropriate for analyzing categorical outcome variables (Agresti, 2013; Chatterjee & Hadi, 2013; Hosmer Jr & Lemeshow, 2004). The PROC LOGISTIC procedure in SAS version 9.4 was applied in these procedures (Stokes, Davis, & Koch, 2012). The data description of the three explanatory variables and the dependent variable is provided in Table 3.
A logistic regression model (1) was conducted on the selected sample with selected predicted variables to find the best fitting model and to estimate thevector
(1)
where βi (i = 1, 2, ... , p) are the coefficients estimated using maximum likelihood estimation., Xi (i = 1, 2, ... , p) are explanatory variables, andɛ is error. A predicted logit was obtained from the solved logistic regression equation by substituting the explanatory variables’ value into the sample estimate of the logistic regression equation
(2)
The predicted probability is given by
(3)
This value which represents veterans’ successful return-to-work serves as the binomial distribution of Yat values ofX.
Next, we used a three step model selection process to determine the relationship of the independent variables to the dependent variables of intention. The following steps, as reflected in the scenario presented in Table 4, (sample size = 250 (50*5), and B = 50) with replicate = 10 (table 4) were used to develop and test the models.
Step 1. To develop Model 1, the following null hypothesis H0 was tested: There is no significant difference in successful return-to-work outcome rates between racial and ethnic target groups. If the p-value of the Wald Chi-square test was less than 0.10 then the null hypothesis would be rejected, otherwise we would remove the race/ethnicity variable from Model 1. The logistic regression results, χ2 = 9.82, df = 4 p < 0.10, indicated that race/ethnicity was a significant predictor in Model 1 for this bootstrap sample.
Step 2. To develop Model 2, the gender variable was entered in Model 1. The following null hypothesis H0 was tested: Model 1 (reduce model) is an adequate model. The alternative hypothesis H1 was: Model 2 (full model) is an adequate model. If the p-value in the Wald Chi-square test was less than 0.10, yielded significance would provide the research team with the confidence to reject null hypothesis, and Model 2 would be a more adequate fit to the data. The logistic regression results, χ2 = 3.16, df = 1, p < 0.10, indicated that gender was a significant predictor in Model 2.
Step 3. To develop Model 3, the level of education attainment at closure (Edu) variable was entered in Model 2. The following null hypothesisH0was assessed: Model 2 (reduce model) is an adequate model. The alternative hypothesisH1was: Model 3 (full model) is an adequate model. Similar to step 2, if the p-value of the Chi-square test was less than 0.10 then we would reject the null hypothesis and Model 3 would be a more adequate to fit the data. Chi-square results, χ2 = 14.92, df = 3, p < 0.10, yielded significant confidence to reject the null hypothesis indicating that Model 3 made the best fit to the data when compared with Model 2. Overall, Model 3 made the best fit to the data in comparison with Models 1 and 2 in this bootstrap sample.
Through this process we identified the best fitting model in this bootstrap sample, and then recorded the coefficient of the best model.
Procedure 3. We repeated the above procedure B (30, 50 and 100) times to obtain the bootstrap estimates of parameters. We then computed the mean of each of the parameter estimates, which was denoted as
Procedure 4. We estimated model validation as the next procedure. The c-statistics were located in the same area under the receiver operating characteristic curve and was used to measure how well the model discriminated between observed data at different levels of the outcome. The following steps were used to model validate each scenario (Efron & Tibshirani, 1994; Harrell et al., 1996; Ye & Zhao, 2010).
Step 1: We fitted the logistic regression model into the original data, and estimated the c-statistic, denote as Capp.
Step 2: For b = 1, 2, ... B:
1. We stratified and selected a bootstrap sample with replacement from the original data using race/ethnicity as a stratum with size n for each stratum.
2. We fitted the logistic regression model in the bootstrap dataset, and estimated C using this fitted model and this bootstrap dataset. We denoted the estimate C by Cb,boot .
3. We estimated C (Cb,orig) by applying the fitted model from the bootstrap dataset to the original dataset.
Step 3: We calculated the estimate of optimism
Step 4: We calculated the optimism adjusted measure of predictive ability as Capp - O.
Procedure 5. We selected the biggest C statistic as best scenario (see table 5), then calculated the
3.5Analysis results
Logistic regression results indicated that race, African American versus White, (OR = 0.686; 95% confidence interval [CI] = [0.630– 0.747], p < 0.05) and gender, male versus female, (OR = 1.186; CI = [1.061– 1.325], p < 0.05) were significant predictors of successful return-to-work. The odds ratios (OR) or effect sizes for the final predictive model are shown in Table 6 and provide the estimated coefficients that predict successful return-to-work outcomes. The coefficients (B) were the log odds of the event occurring (i.e., change in the log odds associated with one-unit change in the independent variable). All things being equal, the OR coefficient indicated that a White veteran was 1.5 (1/0.686) times more likely to successfully return-to-work compared to an African American veteran. Similarly, a male veteran was 1.19 times more likely to achieve successful rehabilitation compared to female veteran. In addition, results yielded significance for level of educational attainment and return-to-work success; high school diploma/equivalency or less versus bachelor’s degree or higher (OR = 0.702; CI = [0.626– 0.788], p < 0.05), some post-secondary education versus bachelor’s degree or higher (OR = 0.549; CI = [0.485– 0.621], p < 0.05), associate’s degree/vocational technical certificate versus bachelor’s degree or higher (OR = 0.814; CI = [0.715– 0.925], p < 0.05). In short, a veteran who had bachelor’s degree or higher was 1.42 (1/0.702) times more likely to successful return-to-work compared to a veteran who had high school diploma/equivalency or less. Similarity, a veteran with bachelor’s degree or higher was 1.82 (1/0.549) times more likely to successfully return-to-work compared to a veteran who had some post-secondary education (no degree or certificate). Finally, a veteran with bachelor’s degree or higher was 1.23 (1/0.814) times more likely to successful return-to-work compared to a veteran with associate’s degree/vocational technical certificate.
The predicted probabilities for the race/ethnicity, gender, and level of educational attainment at closure variables are presented in Fig. 3. Overall, the analysis yielded the following successful return-to-work probabilities:
1. Non-Latino White veterans had the highest probability for successful return-to-work followed by Latinos, Asian Americans or Pacific Islands, Native Americans or Alaska Natives, and African Americans for fixed gender and educational attainment at closure level variables.
2. Male veterans possessed a higher probability for achieving successful return-to-work outcomes compared to female veterans.
3. For all racial/ethnic target groups, veterans who had an associate’s degree/vocational technical certificate or bachelor’s degree or higher had the highest probability for successful return-to-work followed by those with some post-secondary education and or a high school diploma or less.
3.6Discussion
This study examined the relationship between race/ethnicity, gender, and level of educational attainment and return-to-work outcomes among African American, Native American or Alaskan Native, Latino, and Asian American or Pacific Islander veterans with a signed IPE. The findings indicated that veterans who are African American, female, and those with an educational attainment below a bachelor’s degree were statistically significantly less likely to return-to-work successfully compared to non-Latino Whites, males, and those who have achieved a bachelors’ degree or higher, respectively. Moreover, generated predictive probability results for minority veterans represent new field information and point out that (a) African American veterans had the ‘poorest’ return-to-work probabilities followed by Native American or Alaska Native, Latino, Asian American or Pacific Islander, and non-Latino White veterans, (b) female veterans had lower return-to-work probabilities than their male counterparts, and (c) regardless of the race/ethnicity and gender, those with some post-secondary education had the lowestprobability followed by those with a high school diploma or less, associate’s degree/vocational technical certificate, and bachelor’s degree or higher.
Several plausible explanations exist for these results. First differential physical and mental health condition incidence among minority veterans with disabilities may contribute to the findings on race/ethnicity. Health disparities are defined as systematic, socially produced, and important differences in health between groups that are not only unnecessary and avoidable but, in addition, unjust and unfair (Goode et al., 2014). In general, adult Latinos, Native Americans or Alaska Natives, and African Americans with disabilities more often report fair or poor health (55.2%, 50.5%, and 46.6%, respectively) compared to non-Latino Whites with disabilities (36.9%) (Wolf, Armour, & Campbell, 2008). Sheehan and colleagues (2012) reported that being a Latino veteran is associated with a 1.32 increase in the odds of being in poor health relative to White veterans. They also found that being a Black veteran is associated with a statistically significant 2.91 increase in odds of being in poor or very poor health. In addition to physical health concerns, mental health issues such as Post-Traumatic Stress Disorder (PTSD) represents a unique challenge for many minority veterans, and the lack of employment itself can act as a trigger for occurrence (Atkins, 2011). Health disparities, whether physical or mental, can have a profound impact on minority veterans’ with disabilities potential to obtain or maintain integrated competitive employment (Feist-Price & Khanna, 2011).
Given the devastating effects of poor health realities and negative return-to-work implications for these veterans, proper interventions and treatments are of extreme importance. However, adequate treatment is not always easily obtained. Although the U.S. Veterans Administration (VA) has significantly increased the size and scope of nationwide health services; many African American veterans remain underserved (Moore, Johnson, & Uchegbu, 2011). Furthermore, many who experience lower socioeconomic status cannot afford health insurance, which is especially problematic because they are sometimes employed at small independent businesses or temporary employment agencies that fail to provide coverage (Feist-Price & Khanna, 2011). As such, SVRA and VA counselors should consider developing IPEs for these consumers that include effective health improvement (i.e., physical and mental) objectives. Health improvement among these consumers could result in greater physical and mental functioning, which could ultimately lead to an increase in their successful return-to-work rates.
Transferrable skills and military occupational specialty (MOS) mix-match might also account for the finding on racial and gender differences in return-work outcomes. For example, many minority veterans often obtain their MOS in areas such as infantrymen, weapons specialties, munitions handlers, and door gunners on helicopters (Feist-Price & Khanna, 2011) although the skills gained from these occupations are not easily transferable to jobs or careers in the U.S. civilian sector (National Coalition of Homeless Veterans, 2010). The occupation of infantryman is problematic because although law enforcement is a great option, job availability is insufficient compared to the large number of job-seeking combat veterans of color who have returned from Iraq and Afghanistan. Also, many law enforcement professional positions require college credits to be eligible for consideration (Feist-Price & Khanna, 2011). Additionally, female veterans often compete with male and female civilians who have more site-based training or more personal contacts with potential employers and their existing workers (National Coalition of Homeless Veterans, 2010). Among veterans who are hired, especially females, they are often at the low end of the wage scale and health benefits can be limited or non-existent. From a policy perspective, these results may warrant a renewed focus on developing new funding priorities that promote the modification of existing job-training programs, especially in urban areas, that can respond more rapidly to the needs of the constantly changing industry market demands and opportunities. The match between minority veterans’ competitive skill sets and market demands should remain a policy focal point at the state (SVRAs) and federal (VA Vocational Rehabilitation & Employment Programs) level.
The finding that veterans with an bachelor’s degree or higher were more likely to return-to-worksuccessfully compared to those with a high school diploma/equivalency, associate’s degree/vocational technical certificate, or some post-secondary education is not surprising. In short, those who are gaining skills and knowledge that prepare them for the workforce are more likely to be successful at obtaining employment. One explanation for this finding is that veterans of color may not be as aware of resources available to support their educational aspirations (Moore et al., 2015). One such research initiative grows out of the Post-911 Veterans Educational Assistance Act of 2008 or what is commonly referred to the as The New Government Issue (G.I.) Bill. This initiative is an effort to pay for veterans’ college expenses similar to the extent of the original G.I. Bill after World War II (Madaus, Miller, & Vance, 2009). Veterans are eligible to receive the full amount of tuition and fees charged by a college or university, not to exceed the most expensive in-state public institution (Grossman, 2009). Perhaps SVRA and VA Vocational Rehabilitation & Employment (VR&E) Programs need to develop new initiatives and strategies aimed at reaching into communities of color to educate veterans and their family members about programs that can assist them in pursuing a bachelor’s degree or higher or some sort of re-training that matches with the current job market skill demands.
Overall, there is also a need for SVRA counselors to provide culturally appropriate services to veterans of color to address disparate return-to-work outcome rates. Culture, as defined by the 38th Institute on Rehabilitation Issues (IRI) Prime Study Group, is “a system of language, values, and supports that extend and distinguish a group’s sense of necessary identify” (IRI, 2015). Service delivery should be grounded in the cultural humility model as described by Tervalon and Murray-Garcia (1998) for the health care field. Applicatin of this model to VR requires counselors to be respectful of consumers’ customs and traditions and committed to self-critique to develop mutually beneficial and non-paternalistic service relationships. Technical Assistance and Continuing Education (TACE) Centers and relevant Rehabilitation Research and Training Centers (RRTCs) can provide training resources to SVRAs and their counselors in this regard.
4Conclusion
This study examined the relationship between race/ethnicity, gender, and level of educationalattainment among veterans of color with a signed IPE. Overall findings indicated that African American, female, and veterans with educational attainment below a bachelor’s degree are significantly less likely to achieve return-to-work successfully compared to non-Latino White, male and veterans with a bachelor’s degree or higher. Moreover, results indicated that veterans of color (i.e., African Americans, Native Americans or Alaska Natives, Latinos, Asian Americans or Pacific Islanders) return-to-work probabilities were lower than those for non-Latino Whites. Finally, African American, Native American or Alaskan Native, Latino, and Asian veterans’ successful rehabilitation rates were below the national benchmark across 7, 6, 7, and 5 of the 10 regions, respectively, while such rates for White veterans were below this criterion in only 2 of the 10 regions. These findings may warrant greater SVRA and VA co-service provision efforts and new policy initiatives targeting veterans of color. To date, scant attention has been paid to understanding and relatively little information is available as to how SVRA and VA co-service practices enhance return-to-work outcomes. As such, there may be a need to examine this phenomenon in an effort to improve overall service provision and outcomes for these veterans.
5Limitations
Several limitations are inherent in the study due to the nature of the research design. First, the design of this study represents a snapshot of the phenomena rather than an elongated analysis or multi-method approach aimed at observing and identifying meaningful trends. There may be a need for future researchers to address the same research questions in this study while employing a trends analysis approach to assess whether the findings are accurate. In this regard, for example, RSA-911 data could be examined across fiscal years (FY) 2008 through 2013(5 year trends analysis) to ascertain whether the results are consistent or an apparition of the analysis. There may also be a need for future investigators to employ exploratory and mixed-methods designs (i.e., qualitative and quantitative) in an effort to triangulate the data from multiple data sources to address curiosities and consequently increase the field’s understanding return-to-work contributors among veterans of color. For example, multiple data sources such as focus groups discussions and mixed-method (i.e., qualitative and quantitative) surveys designed to elicit key informant perspectives on return-to-work barriers could be used by future researchers to address worthy research questions. Second, the RSA-911 database does not delineate wartime veterans from non-wartime veterans, or distinguish between those who have served in different combat tours. There may be a need for future research to assess outcomes from those veterans who have solely served during wartime, or to compare them to non-wartime veterans on the criterion. Third, the current study failed to break out and assess outcomes across specific disability type groups and thus did not control for this variable as a possible proxy. Consequently, we cannot rule out the possibility that disability type is responsible for differences on the criterion variable, rather than race and ethnicity. This concern may warrant future research that controls for disability type when assessing the relationship between race and ethnicity and return-to-work outcomes. Finally, information contained in the RSA-911 database is not impervious to counselor errors, and thus we cannot be sure that all data is accurate. The findings, however, may be helpful to SVRA leaders and others as they develop and plan strategically for meeting the needs of veterans with disabilities.
Conflict of interest
The authors have no conflict of interest to report.
Acknowledgments
The contents of this article were developed under a grant from the National Institute on Disability, Independent Living, and Rehabilitation Research (NIDILRR grant number 90RT5024-01-00). NIDILRR is a Center within the Administration for Community Living (ACL), Department of Health and Human Services (HHS). The contents of this article do not necessarily represent the policy of NIDILRR, ACL, HHS, and one should not assume endorsement by the federal government.
References
1 | Agresti A. ((2013) ). Categorical data analysis (Third ed.) Hoboken, New Jersey: John Wiley & Sons. |
2 | Ainspan N. D. ((2011) ). From deployment to employment. U. S. Naval Institute Proceedings, 137: (2), 44–50. http://bbi.syr.edu/events/2011/docs/052511_shaheen/deployment_employment.pdf |
3 | Alston R. , Lewis A. , & Loggis S. ((2014) ). Assistive technology and veterans with severe disablities: Examining the relationship among race, personal factors, medical support, income support, and use. Medical Care, 52: (10), 17–24. |
4 | Atkins B. J. ((2011) ). African American veterans, post-traumatic stress disorder (PTSD) and Employment. In Moore C. L., Johnson J. E., & Washington A. L. (Eds.),Improving vocational rehabilitation access and return to work and career outcomes among African American Wounded Warriors, Gulf War and Vietnam War era veterans with disabilities (pp. 71–94). Oklahoma City: Dept. of Rehabilitation Counseling and Disability Studies/LU. |
5 | Bleeker S. , Moll H. , Steyerberg E. , Donders A. , Derksen-Lubsen G. , Grobbee D. , & Moons K. ((2003) ). External validation is necessary in prediction research: A clinical example. Journal of clinical epidemiology, 56: (9), 826–832. |
6 | Chatterjee S. , & Hadi A. S. ((2013) ). Regression analysis by example. Hoboken, New Jersey: John Wiley & Sons. |
7 | Cifu D. X. , Taylor B. C. , Carne W. F. , Bidelspach D. , Sayer N. , Scholten J. , & Campbell E. H. ((2013) ). Traumatic brain injury, posttraumatic stress disorder, and pain diagnoses in OIF/OEF/OND veterans. Journal of Rehabilitation Research & Development, 50: (9), 1169–1176. |
8 | Dupret G. , & Koda M. ((2001) ). Bootstrap re-sampling for unbalanced data in supervised learning. European Journal of Operational Research, 134: (1), 141–156. |
9 | Duwe G. , & Freske P. J. ((2012) ). Using logistic regression modeling to predict sexual recidivism: The Minnesota sex offender screening tool-3 (MnSOST-3). Sexual abuse: A journal of research and treatment, 24: (4), 350–377. doi:10.1177/1079063211429470 |
10 | Efron B. , & Tibshirani R. ((1997) ). Improvements on Cross-Validation: The.632+Bootstrap Method. Journal of the American Statistical Association, 92: (438), 548–560. doi:10.2307/2965703 |
11 | Efron B. , & Tibshirani R. J. ((1994) ). An introduction to the bootstrap. New York: Chapman & Hall. |
12 | Feist-Price S. , Khanna N. ((2011) ). Improving vocational rehabilitation access and employment success for African American homeless veterans with disabilities. In Moore C. L., Johnson J. E., & Washington A. L. (Eds.), Improving vocational rehabilitation access and return to work and career outcomes among African American Wounded Warriors, Gulf War and Vietnam War era veterans with disabilities (pp. 26–44). Oklahoma City: Dept. of Rehabilitation Counseling and Disability Studies/LU. |
13 | Frain M. , Bishop M. , & Bethel M. ((2010) ). A roadmap for rehabilitation counseling to serve military veterans with disabilities. J Rehabil, 76: (1), 13–21. |
14 | Gelman A. , Carlin J. B. , Stern H. S. , & Rubin D. B. ((2014) ). Bayesian data analysis (Vol. 2): Taylor & Francis. |
15 | Goode T. D. , Carter-Pokras O. D. , Horner-Johnson W. , & Yee S. ((2014) ). Parallel tracks: Reflections on the need for collaborative health disparities research on race/ethnicity and disability. Medical Care, 52: , S3–S8. |
16 | Grossman P. D. ((2009) ). Foreword with a challenge: Leading our campuses away from the perfect storm. Journal of Postsecondary Education and Disability, 22: (1), 4–9. |
17 | Gude J. A. , Mitchell M. S. , Ausband D. E. , Sime C. A. , & Bangs E. E. ((2009) ). Internal validation of predictive logistic regression models for decision-making in wildlife management. Wildlife Biology, 15: (4), 352–369 . doi:http://dx.doi.org/10.2981/08-057 |
18 | Harrell F. , Lee K. L. , & Mark D. B. ((1996) ). Tutorial in biostatistics multivariable prognostic models: Issues in developing models, evaluating assumptions and adequacy, and measuring and reducing errors. Statistics in medicine, 15: , 361–387. |
19 | He H. , & Garcia E. A. ((2009) ). Learning from imbalanced data. Knowledge and Data Engineering, IEEE Transactions on, 21: (9), 1263–1284 . doi:10.1109/TKDE.2008.239 |
20 | Henderson A. R. ((2005) ). The bootstrap: A technique for data-driven statistics. Using computer-intensive analyses to explore experimental data. Clinica Chimica Acta, 359: (1), 1–26. |
21 | Hosmer Jr D. W. , Lemeshow S. ((2004) ). Applied logistic regression. John Wiley & Sons. |
22 | Kromrey J. D. , & Hines C. V. ((1996) ). Estimating the coefficient of cross-validity in multiple regression: A comparison of analytical and empirical methods. The Journal of Experimental Education, 64: (3), 240–266 . doi:10.1080/00220973.1996.9943806 |
23 | Lewis A. N. , Shamburger A. , Head C. , Armstrong A. J. , & West S. L. ((2007) ). Section 21 of the 1992 Rehabilitation Act Amendments and diversity articles. Journal of Vocational Rehabilitation, 26: (2), 89–96. |
24 | Madaus J. W. , Miller W. K. , & Vance M. L. ((2009) ). Veterans with disabilities in postsecondary education. Journal of Postsecondary Education and Disability, 22: (1), 10–17. |
25 | Moore C. L. , Johnson J. , & Uchegbu N. ((2011) ). Barriers to VR service access and return to work outcomes among African American Veterans: The need for evidence-based research and service strategies. Improving vocational rehabilitation access and return to work and career outcomes among African American wounded warriors, Gulf War and Vietnam era veterans with disabilities. Langston University. |
26 | Moore C. L. , Wang N. , Johnson J. , Manyibe E. O. , Washington A. L. , & Muhammad A. ((2015) ). Return-to-work outcome rates of African American versus White veterans served by state vocational rehabilitation agencies: A randomized split-half cross-model validation research design. Rehabilitation Counseling Bulletin, 58: (3), 1–14 . doi:10.1177/0034355215579917 |
27 | Moran S. , Schmidt J. , & Burker E. J. ((2013) ). Posttraumatic Growth and Posttraumatic Stress Disorder in Veterans. J Rehabil, 79: (2), 34–43. |
28 | National Alliance on Mental Illness. ((2014) ). Veterans of culturally diverse populations. www.nami.org/Content/NavigationMenu/Find_Support/Veterans_Resources/Multi-cultural_Issues/Veterans_of_Culturally_Diverse_Populations.html |
29 | National Center for Veterans Analysis and Statistics. ((2013) ). Minority Veterans: 2011. http://www.va.gov/VETDATA/docs/SpecialReports/Minority_Veterans_2011.pdf |
30 | National Coalition of Homeless Veterans. ((2010) ). Facts and media page. http://www.nchv.org/background.cfm#facts |
31 | Pedhazur E. J. ((1982) ). Multiple regression in behavioral research (Second ed.). Fort Worth, TX: Harcourt Bace Jovanovich,Inc. |
32 | SAS Institute. ((2012) ). SAS/STAT. 12.1 User’s Guide: Survey Data Analysis (Book Excerpt). Cary, NC: SAS Institute. |
33 | SAS Institute. ((2014) ). Base SAS® 9.4 Procedures Guide: Statistical Procedures. Cary, NC: SAS Institute. |
34 | Sheehan C. M. , Hummer A. R. , Moore B. L. , & Butler J. C. ((2012) ). Duty, honor, country, disparity: Race/ethnicity difference in self-reported health and disability among veterans. Austin: Department of Sociology and Population Research Center/ University of Texas at Austin. |
35 | Steyerberg E. W. , Harrell F. E. , Borsboom G. J. , Eijkemans M. , Vergouwe Y. , & Habbema J. D. F. ((2001) ). Internal validation of predictive models: Efficiency of some procedures for logistic regression analysis. Journal of clinical epidemiology, 54: (8), 774–781. |
36 | Stokes M. E. , Davis C. S. , & Koch G. G. ((2012) ). Categorical data analysis using SAS (Third ed.). Cary, NC: SAS institute. |
37 | Taylor J. M. , Ankerst D. P. , & Andridge R. R. ((2008) ). Validation of biomarker-based risk prediction models. Clinical cancer research, 14: (19), 5977–5983. |
38 | Tennant J. ((2012) ). Disability, Employment, and Income: Are Iraq/Afghanistan-Era U.S. Veterans Unique? Monthly Labor Review, 135: , 3–10. |
39 | Tervalon M. , & Murray-Garcia J. ((1998) ). Cultural humility versus cultural competence: A critical distinction in defining physician training outcomes in multicultural education. Journal of Health Care for the Poor and Underserved, 9: (2), 117–125. |
40 | Thirty-eight Institute on Rehabilitaion Issues. ((2015) ). A monograph from the 38th Institute on Rehabilitation Issues to address underserved populations, including individuals who are deaf-blind. Hot Springs, AR: University of Arkansas CURRENTS. |
41 | Twamley E. W. , Baker D. G. , Norman S. B. , Pittman J. O. , Lohr J. B. , & Resnick S. G. ((2013) ). Veterans Health Administration vocational services for Operation Iraqi Freedom/Operation Enduring Freedom Veterans with mental health conditions. Journal of rehabilitation research and development, 50: , 663–670 . doi:10.1682/JRRD.2012.08.0137 |
42 | Twamley E. W. , Jak A. J. , Delis D. C. , Bondi M. W. , & Lohr J. B. ((2014) ). Cognitive Symptom Management and Rehabilitation Therapy (CogSMART) for Veterans with traumatic brain injury: Pilot randomized controlled trial. Journal of rehabilitation research and development, 51: (1), 59–70 . doi:10.1682/JRRD.2013.01.0020 |
43 | Wolf L. A. , Armour B. S. , & Campbell V. A. ((2008) ). Racial/ethnic disparities in self-rated health status among adults wih and without disabilities. Morbility and mortality Weekly Report (MMWR). Retrieved from http://www.cdc.gov/mmwr/preview/mmwrhtml/mm5739a1.htm |
44 | Ye F. , & Zhao A. ((2010) ). What You See May Not be What You Get– A Brief Introduction to Overfitting, Cancer Biostatistics Workshop. Retrieved from https://medschool.vanderbilt.edu/cqs/files/cqs/media/2010Overfitting_0416.pdf |
45 | Zhu W. ((1997) ). Making bootstrap statistical inferences: A tutorial. Research quarterly for exercise and sport, 68: (1), 44–55. |
Figures and Tables
Fig.1
National benchmark and RSA regional successful return-to-work outcomes (status 26 only) among African American, Native American or Alaskan Native, Latino, Asian American or Pacific Islander and White veterans. Note. RSA = Rehabilitation Services Administration (RSA-911) FY 2013 data source.
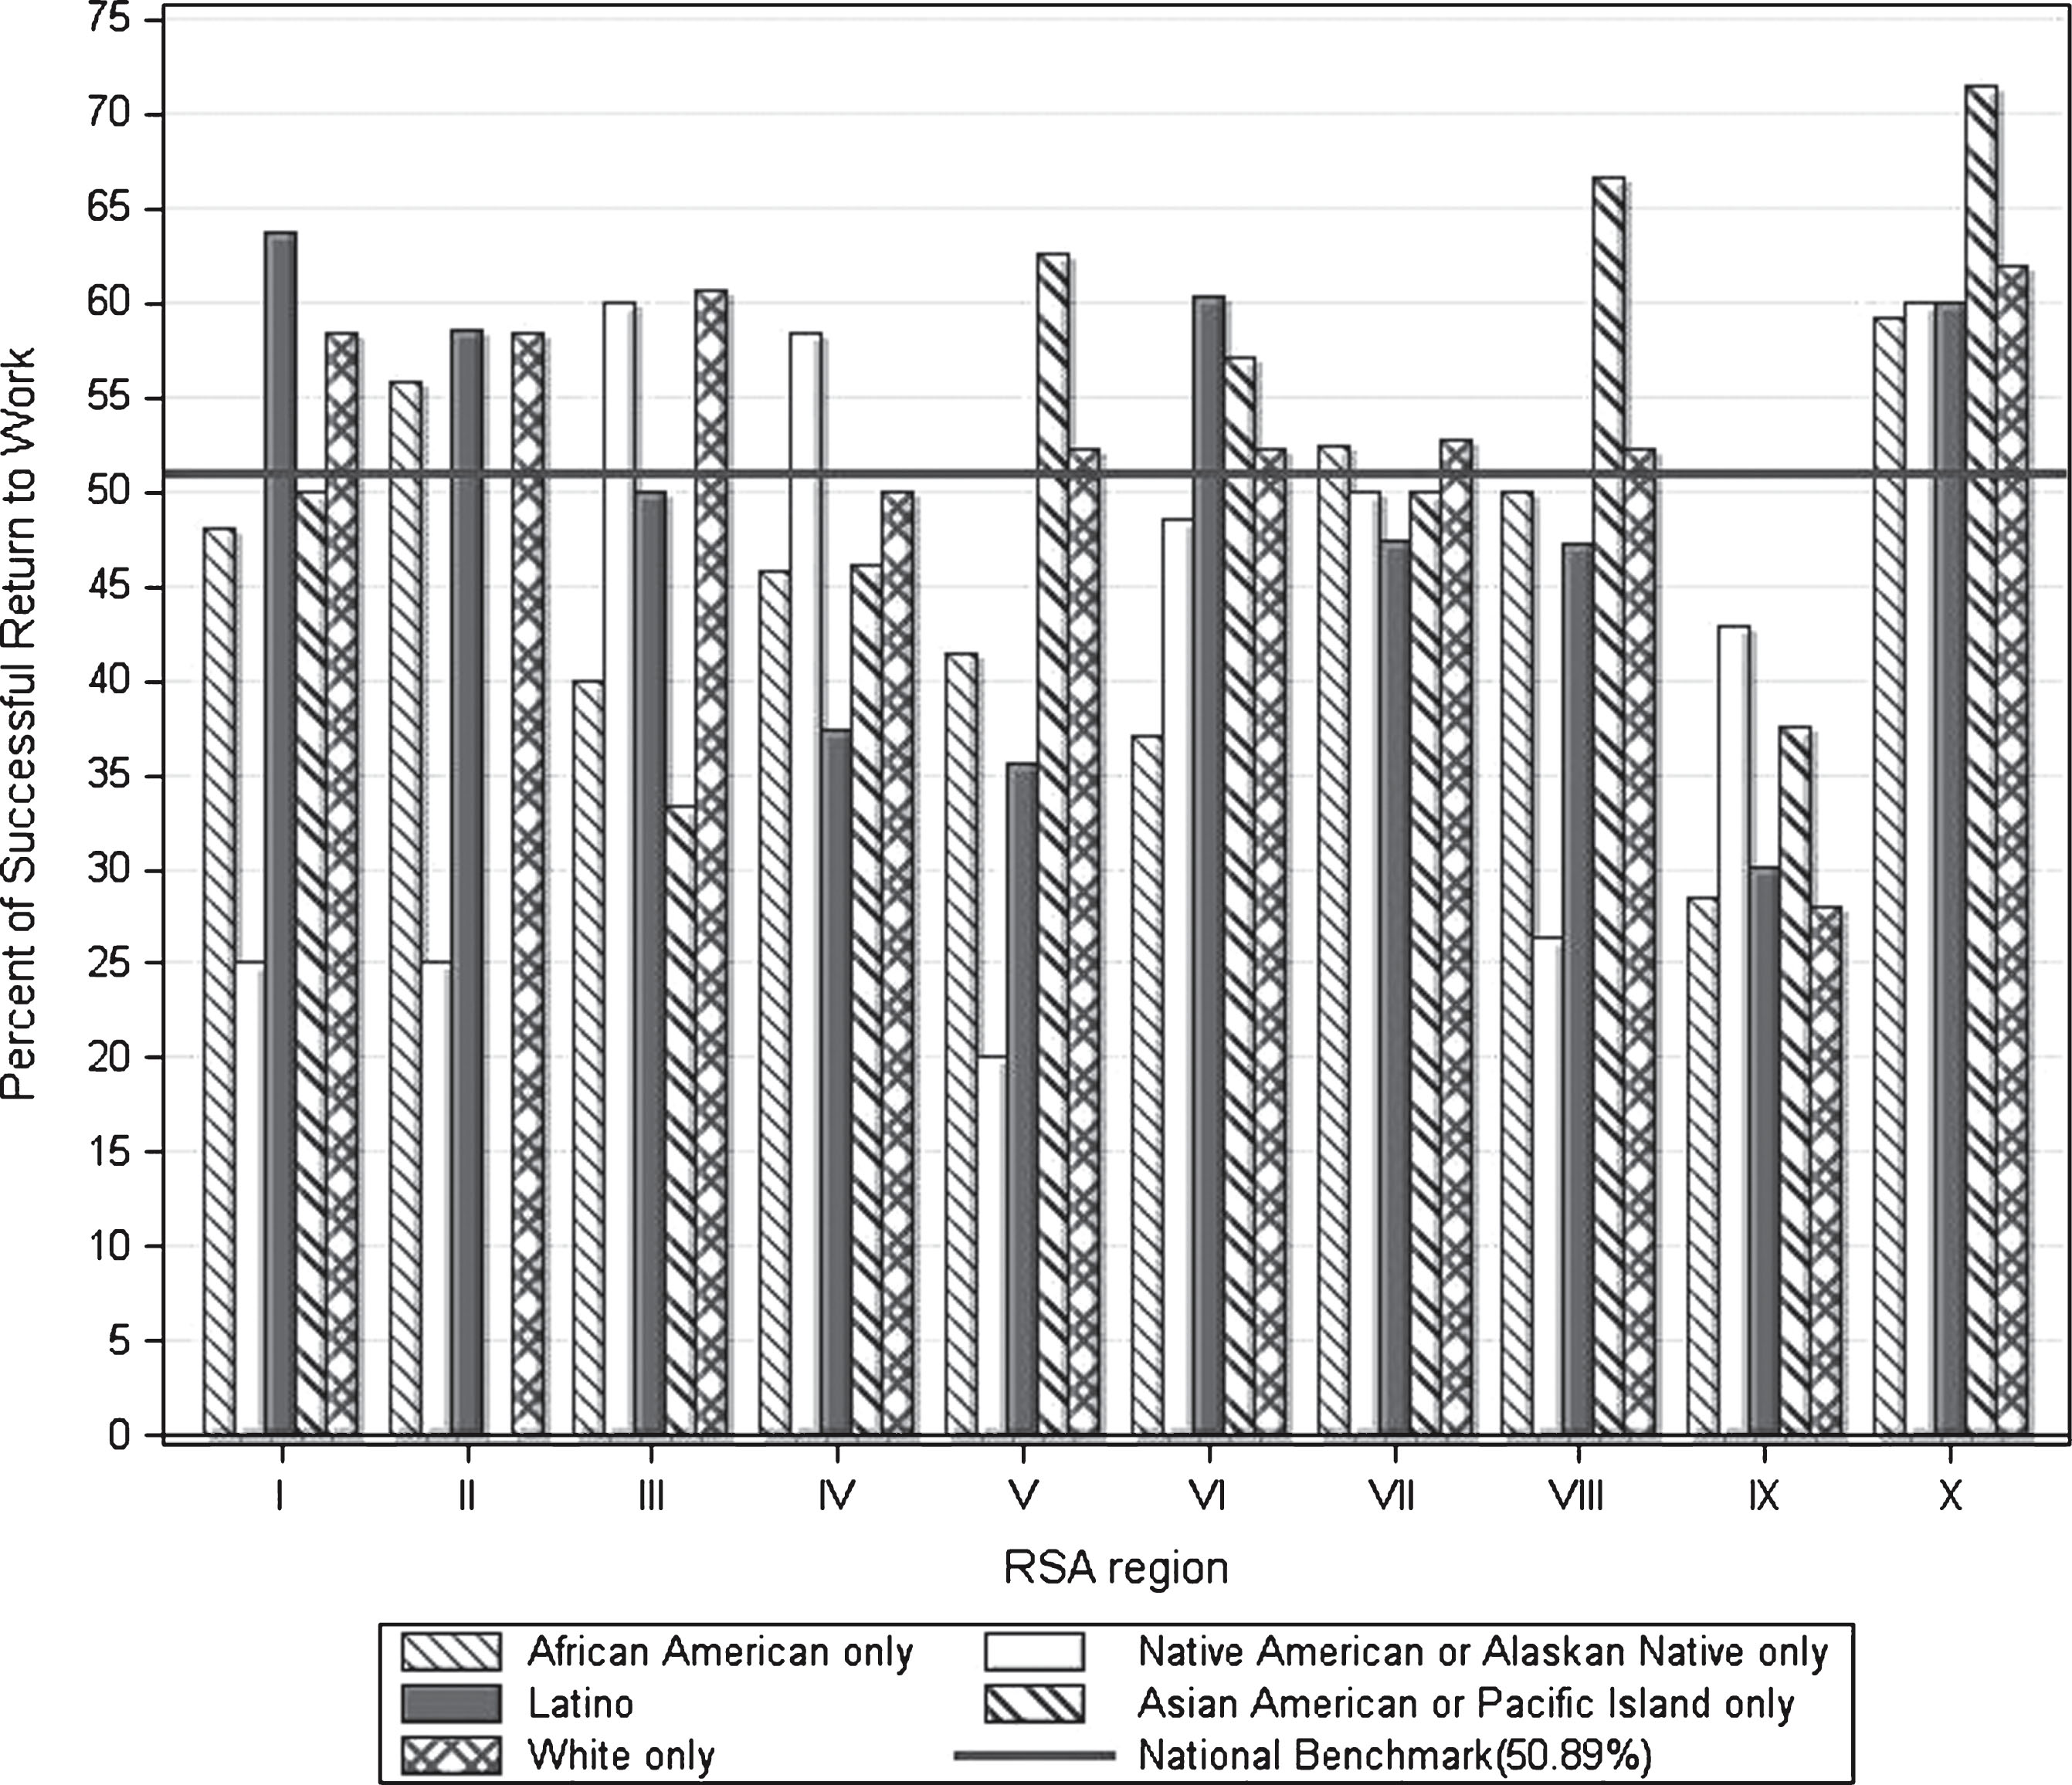
Fig.2
Research paradigm for stratified bootstrap research design.
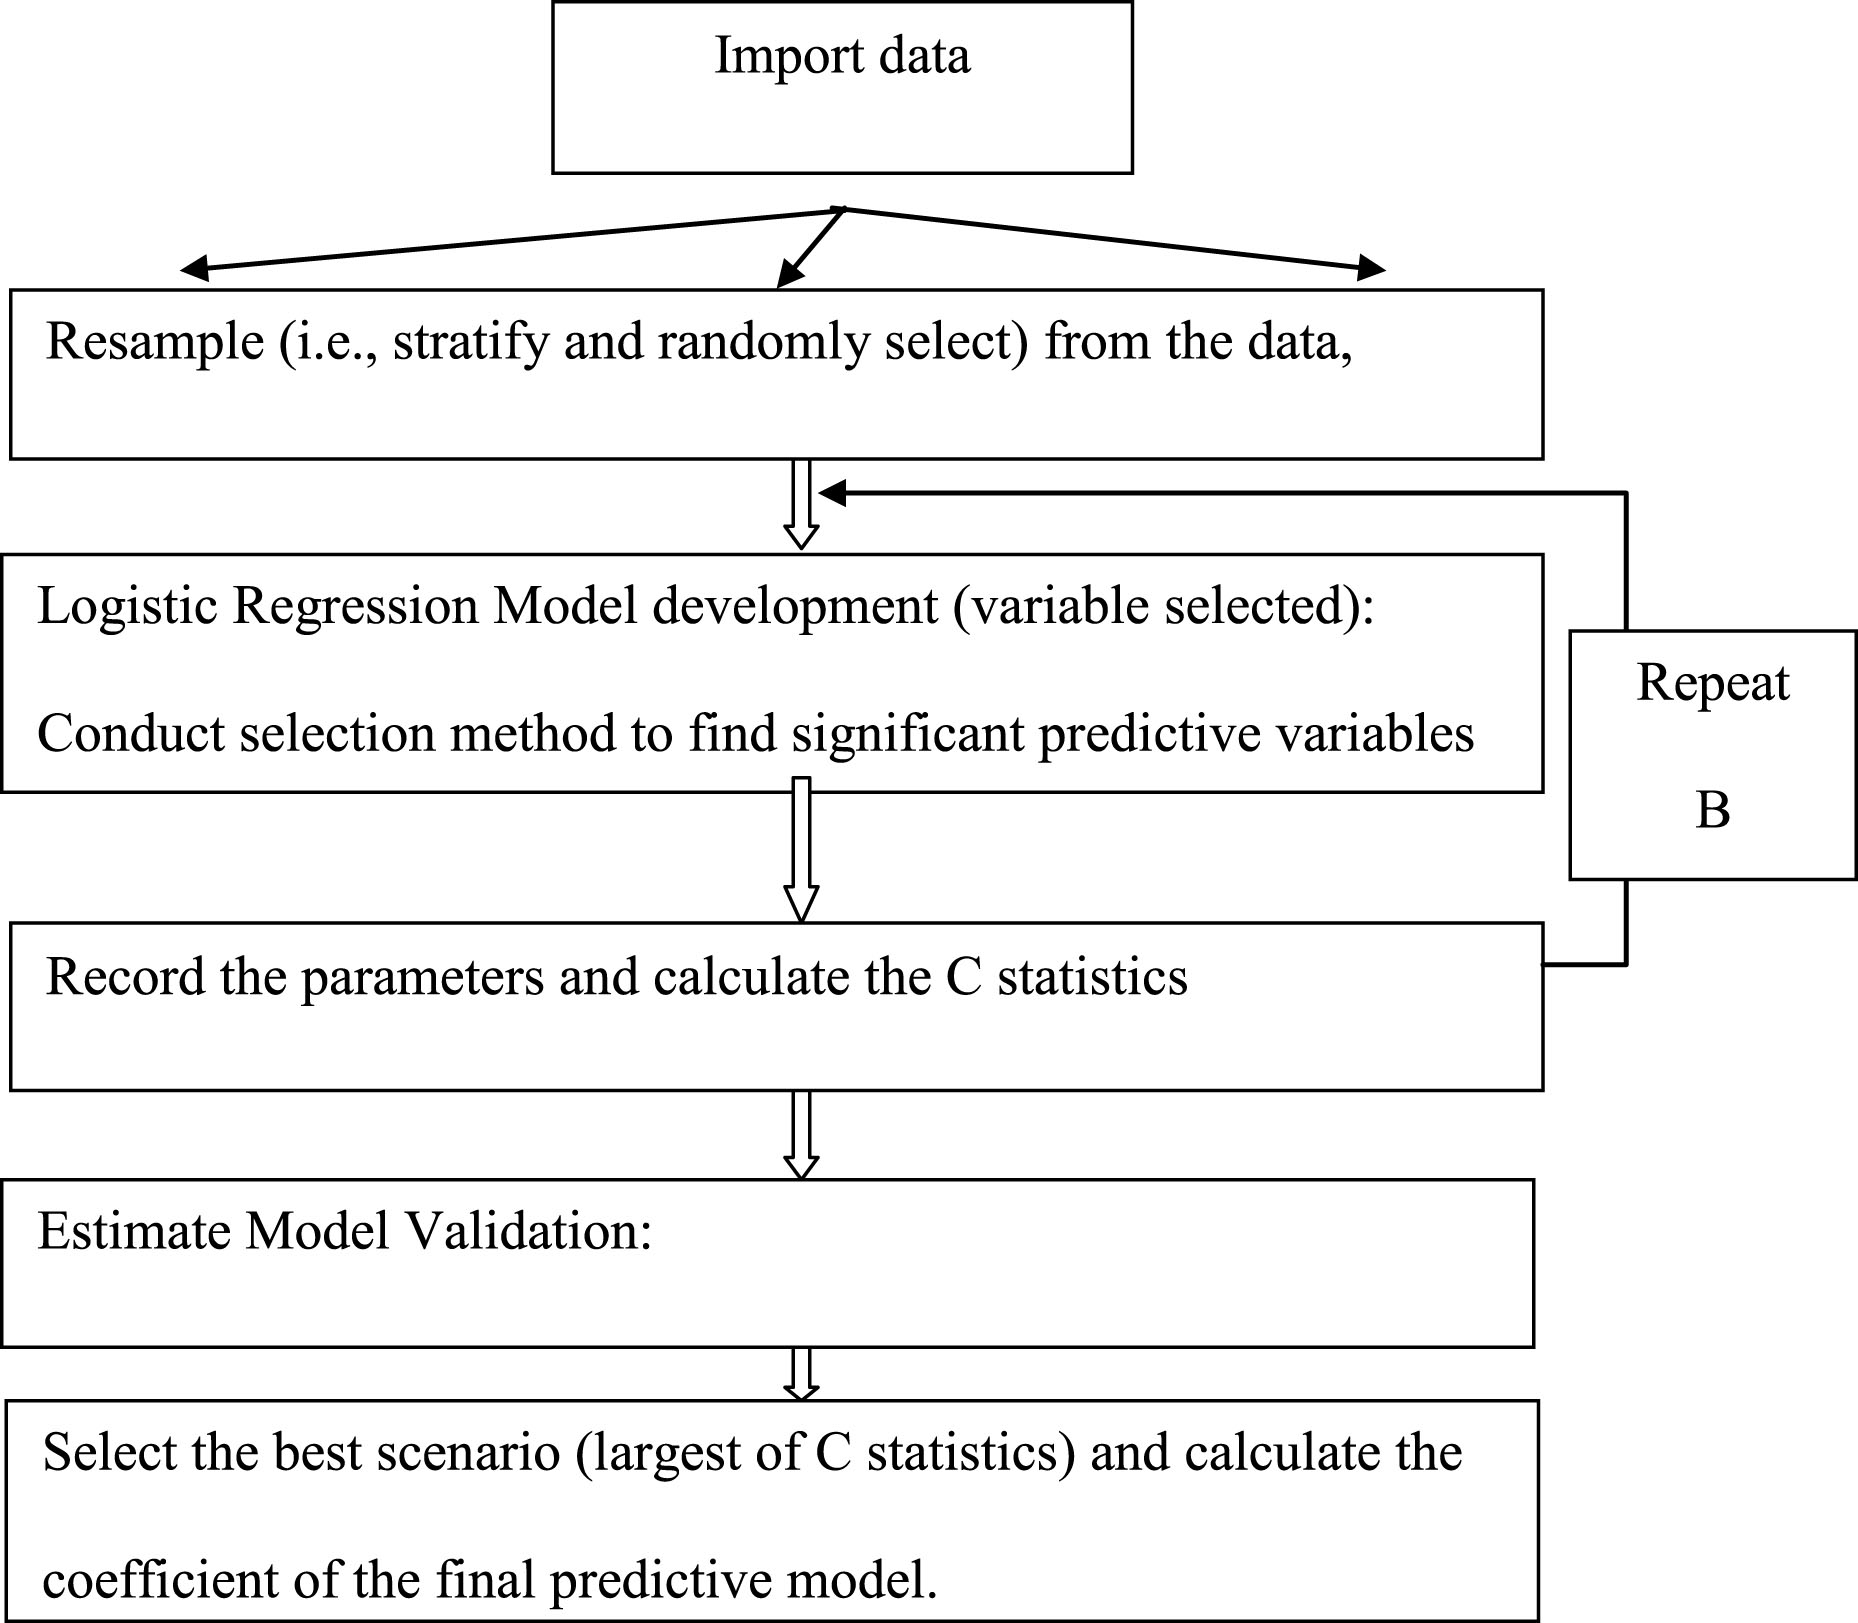
Fig.3
Predicted probability to successful return-to-work.
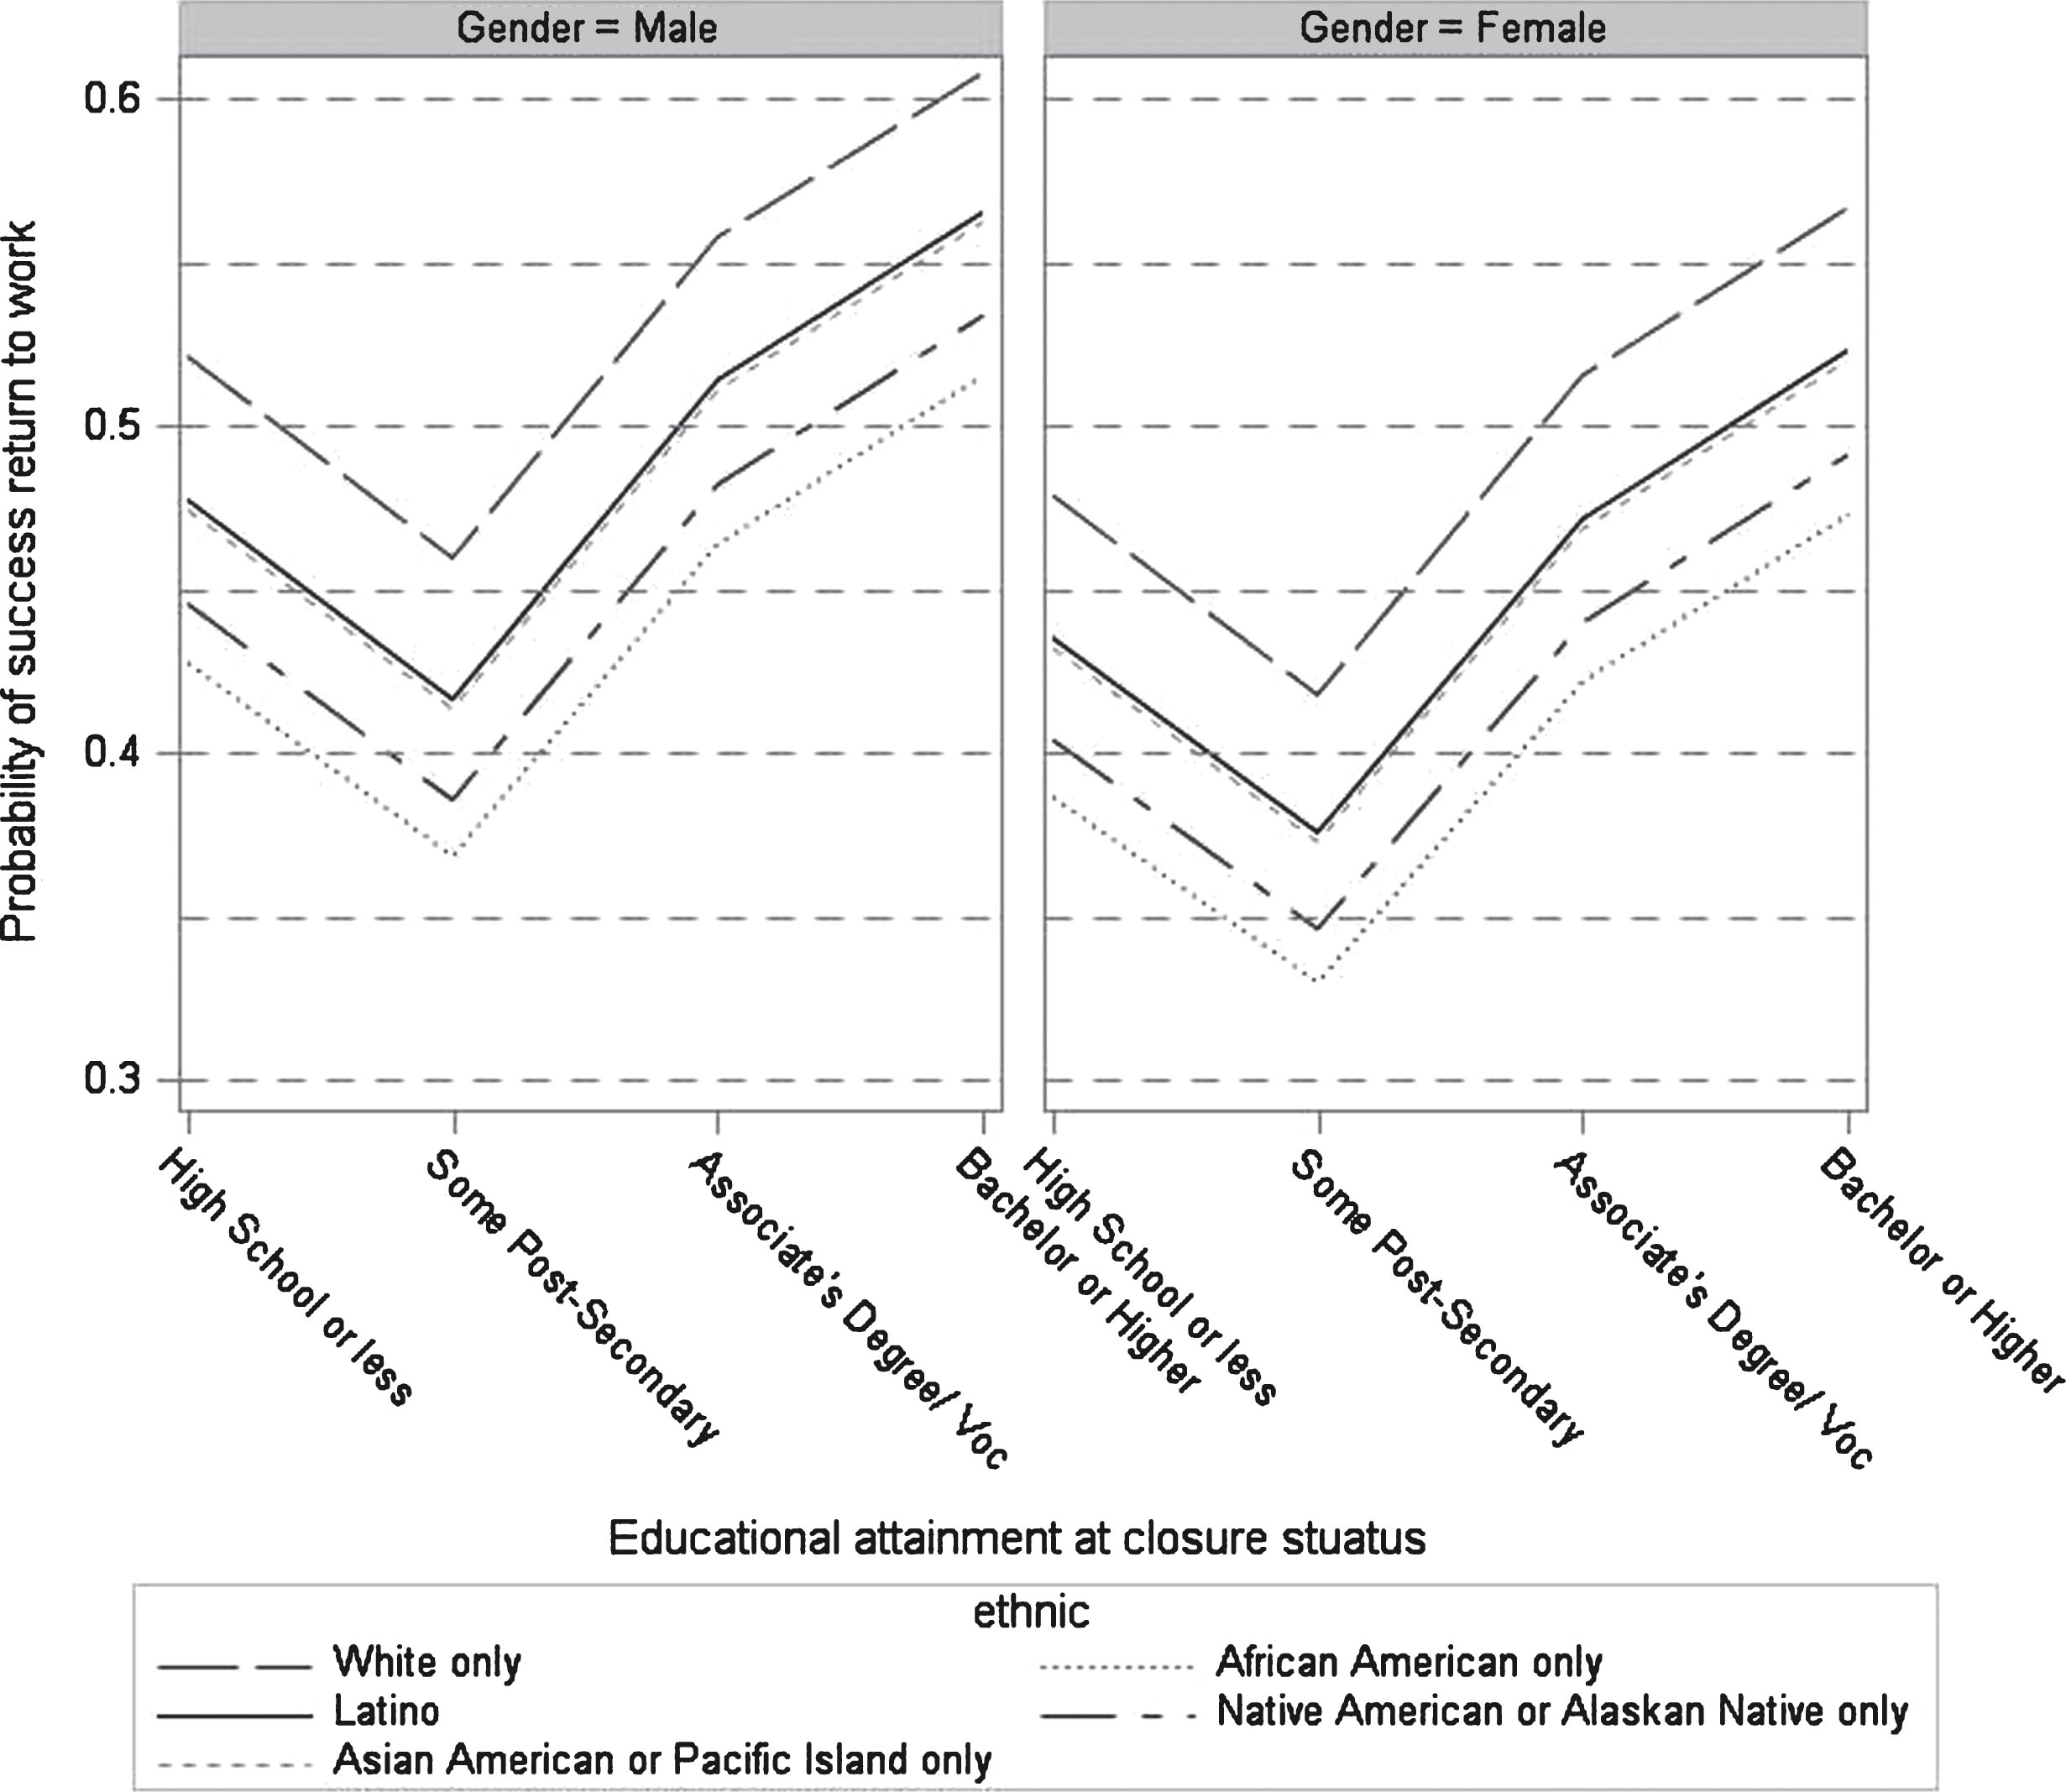
Table 1
Demographic and outcomes of RSA-911
| Demographic information | Successfully rehabilitated | Not successfully rehabilitated |
| Closed status 26 | Closed status 28 | |
| Race or Ethnicity | ||
| Latino | 341 | 382 |
| White Only | 3970 | 3628 |
| African American | 1294 | 1778 |
| Native American/Alaskan Native only | 54 | 70 |
| Asian American/Pacific Islander only | 42 | 44 |
| Gender | ||
| Female | 673 | 804 |
| Male | 5028 | 5902 |
| Education at Closure status | ||
| High School Diploma or less | 2323 | 2458 |
| Some Post-Secondary Education | 1228 | 1667 |
| Associate’s Degree/Voc Tech | 1208 | 1089 |
| Bachelor’s Degree or higher | 942 | 688 |
Table 2
National RSA-911 data on veterans’ access and return-to-work outcome
| State/Territory (VR) Region | Race/Ethnicity | Access Comparison | RTW successful | ||
| after IPE sign | |||||
| f | % | f | % | ||
| Region I | African American | 25 | 5.19 | 12 | 48.00a b |
| NA/AN | 4 | 0.83 | 1 | 25.00a b | |
| Latino | 11 | 2.28 | 7 | 63.64 | |
| AA/PI | 2 | 0.41 | 1 | 50.00a b | |
| White | 440 | 91.29 | 257 | 58.41 | |
| Region II | African American | 181 | 30.73 | 101 | 55.80b |
| NA/AN | 4 | 0.68 | 1 | 25.00a b | |
| Latino | 77 | 13.07 | 45 | 58.44b | |
| AA/PI | 1 | 0.17 | 0 | 0.00a b | |
| White | 326 | 55.35 | 190 | 58.28 | |
| Region III | African American | 388 | 24.56 | 155 | 39.95a b |
| NA/AN | 5 | 0.32 | 3 | 60.00b | |
| Latino | 28 | 1.77 | 14 | 50.00a b | |
| AA/PI | 12 | 0.76 | 4 | 33.33a b | |
| White | 1147 | 72.59 | 695 | 60.59 | |
| Region IV | African American | 979 | 42.00 | 448 | 45.76a b |
| NA/AN | 12 | 0.51 | 7 | 58.33 | |
| Latino | 75 | 3.22 | 28 | 37.33a b | |
| AA/PI | 13 | 0.56 | 6 | 46.15a b | |
| White | 1252 | 53.71 | 625 | 49.92 | |
| Region V | African American | 495 | 25.65 | 205 | 41.41a b |
| NA/AN | 10 | 0.52 | 2 | 20.00a b | |
| Latino | 45 | 2.33 | 16 | 35.56a b | |
| AA/PI | 8 | 0.41 | 5 | 62.50 | |
| White | 1372 | 71.09 | 716 | 52.19 | |
| Region VI | African American | 514 | 28.72 | 190 | 36.96a b |
| NA/AN | 35 | 1.96 | 17 | 48.57a b | |
| Latino | 214 | 11.96 | 129 | 60.28 | |
| AA/PI | 7 | 0.39 | 4 | 57.14 | |
| White | 1020 | 56.98 | 532 | 52.16 | |
| Region VII | African American | 124 | 16.45 | 65 | 52.42b |
| NA/AN | 18 | 2.39 | 9 | 50.00a b | |
| Latino | 19 | 2.52 | 9 | 47.37a b | |
| AA/PI | 2 | 0.27 | 1 | 50.00a b | |
| White | 591 | 78.38 | 311 | 52.62 | |
| Region VIII | African American | 32 | 5.31 | 16 | 50.00a b |
| NA/AN | 19 | 3.15 | 5 | 26.32a b | |
| Latino | 53 | 8.79 | 25 | 47.17a b | |
| AA/PI | 3 | 0.50 | 2 | 66.67 | |
| White | 496 | 82.26 | 259 | 52.22 | |
| Region IX | African American | 312 | 27.71 | 89 | 28.53a |
| NA/AN | 7 | 0.62 | 3 | 42.86a | |
| Latino | 176 | 15.63 | 53 | 30.11a | |
| AA/PI | 24 | 2.13 | 9 | 37.50a | |
| White | 607 | 53.91 | 170 | 28.01 | |
| Region X | African American | 22 | 5.26 | 13 | 50.09a b |
| NA/AN | 10 | 2.39 | 6 | 60.00b | |
| Latino | 25 | 5.98 | 15 | 60.00b | |
| AA/PI | 14 | 3.35 | 10 | 71.43 | |
| White | 347 | 83.01 | 215 | 61.96 | |
| Total | African American | 3072 | 26.48 | 1294 | 42.12a b |
| NA/AN | 124 | 1.07 | 54 | 43.55a b | |
| Latino | 723 | 6.23 | 341 | 47.16a b | |
| AA/PI | 86 | 0.74 | 42 | 48.84a b | |
| White | 7598 | 65.48 | 3970 | 52.25 | |
Note. National benchmark/average for successful RTW rate—all veterans = 50.89%. RSA = Rehabiliation Services Administration; VR = Vocational Rehabiliation; IPE = Individualized Plan for Employment; f = Frequency; RTW = Return-to-Work. NA/AN = Native American or Alaskan Native only; AA/PI = Asian American or Pacific Islander only. aMinority veteran return-to-work percentages below national benchmark return-to-work averages (50.89%). bMinority veteran return-to-work percentages below non-Latino White veteran return-to-work percentages. For region details see the website. http://www2.ed.gov/students/college/aid/rehab/catrcep.html
Table 3
Description on variables
| Variable | Type & Definition | Characteristic |
| Y | Dependent variable | 26 = successfully return-to-work |
| 28 = did not successfully return-to-work | ||
| Gender | Dummy variable | 1 = Male |
| 2 = Female | ||
| Ethnic | Categorical variable | 1 = Latino |
| Race/Ethnicity | 2 = White only | |
| 3 = African American only | ||
| 4 = Native American or Alaskan Native only | ||
| 5 = Asian American or Pacific Island only | ||
| Edu | Categorical variable | 1 = high school diploma/equivalency or less |
| Level of educational attainment at closure | 2 = some post-secondary education | |
| 3 = associate’s degree/vocational technical certificate | ||
| 4 = bachelor’s degree or higher |
Table 4
Multinomial logistic regression models selection in scenario (sample size = 250, and B = 50) with replicate = 10
| Model | Model Effects | Chi-square | Degrees of Freedom | P-value |
| Model 1 | intercept, Ethnic | 9.82 | 4 | 0.04 |
| Model 2 | intercept, Gender | 3.16 | 1 | 0.08 |
| Model 3 | intercept, Ethnic, Gender and Edu | 14.92 | 3 | 0.002 |
Table 5
Bootstrap measures of predictive
| Sample size for | B = 30 | B = 50 | B = 100 |
| each stratum | |||
| 50 | 0.5347 | 0.5350 | 0.5342 |
| 100 | 0.5652 | 0.5654 | 0.5641 |
| 500 | 0.5723 | 0.5723 | 0.5725 |
Table 6
Parameter estimates
| Closed status | B | Odd Ratio | 95% Confidence Limit | p-value | |
| Intercept | – 0.146 | ||||
| Ethnic = 1 vs Ethnic = 2 | 0.033 | 0.839 | 0.719 | 0.978 | 0.69 |
| Ethnic = 3 vs Ethnic = 2 | – 0.1682 | 0.686 | 0.630 | 0.747 | 0.01 |
| Ethnic = 4 vs Ethnic = 2 | – 0.0949 | 0.738 | 0.515 | 1.057 | 0.53 |
| Ethnic = 5 vs Ethnic = 2 | 0.0210 | 0.829 | 0.540 | 1.271 | 0.90 |
| Gender = 1 vs Gender = 2 | 0.085 | 1.186 | 1.061 | 1.325 | 0.003 |
| Edu = 1 vs Edu = 4 | – 0.0632 | 0.702 | 0.626 | 0.788 | 0.03 |
| Edu = 2 vs Edu = 4 | – 0.3105 | 0.549 | 0.485 | 0.621 | <0.0001 |
| Edu = 3 vs Edu = 4 | 0.0837 | 0.814 | 0.715 | 0.925 | 0.02 |


