
Pre-employment transition and vocational rehabilitation services: Experiences in response to Vermont’s work-based learning program
Abstract
BACKGROUND:
State vocational rehabilitation (VR) agencies offer pre-employment transition services (pre-ETS) and other VR services to high school students, but the literature has not documented differences in pre-ETS use by individual characteristics or across individual services.
OBJECTIVE:
We describe variation in how high school students used services from the Vermont VR agency and how a demonstration program emphasizing work-based learning experiences affected that use.
METHOD:
The study uses a descriptive approach to explore patterns in youth’s pre-ETS and VR services and outcomes two years after enrolling in a demonstration program. It compares youth with access to demonstration services (the treatment group) to those using usual services (the control group).
RESULTS:
Among all control group youth, more than half only used pre-ETS during a 24-month period, while about one-quarter used VR services and the remainder used no services from the VR agency. In contrast, nearly all treatment group youth used some VR services, with a majority (59 percent) using both VR services and pre-ETS. Control group youth who used pre-ETS and VR services differed from those who did not use these services by gender, disability type, employment, and service receipt characteristics; treatment group youth had fewer such differences. Earnings outcomes did not vary in consistent or interpretable ways.
CONCLUSION:
The findings demonstrate how an intervention designed to promote work-based learning experiences increased pre-ETS and VR use and decreased subgroup differences in service utilization. VR administrators might consider collecting information on potentially eligible students to increase access to and use of services.
1Introduction
The Workforce Innovation and Opportunity Act (WIOA; Pub. Law. 113–128, 128 Stat. 1425, July 22, 2014), enacted in 2014, significantly changed how state vocational rehabilitation (VR) agencies worked with students with disabilities. Before WIOA, federal regulations limited VR agencies to serving students only after the agency deemed them eligible for VR services. Since WIOA, VR agencies can offer pre-employment transition services (pre-ETS) to students who have not yet applied but are potentially eligible for VR services and can offer these services to groups of students. In addition, agencies must allocate at least 15 percent of their federal grant funds to pre-ETS for students with disabilities (RSA, 2020). Such a shift is warranted by the perennially low employment outcomes for this population. In 2020, for example, 17 percent of youth with disabilities ages 16 to 19 and 35 percent of youth ages 20 to 24 worked; the corresponding numbers for youth without disabilities were 29 percent and 61 percent (Bureau of Labor Statistics, 2021).
We have little information thus far on how students use pre-ETS, whether those who use pre-ETS go on to apply for VR services, and how their outcomes differ from those of youth who do not use these services. These gaps in the knowledge base are problematic because VR agencies have pivoted toward students and youth with disabilities in recent years and done so with little evidence about the demand for VR services among youth. In program year 2020, more than half of those using services from VR agencies were age 24 or younger (RSA, 2021).
This study fills gaps in the field’s knowledge about pre-ETS. We comprehensively describe how high school students used services from a single VR agency as part of a state-wide demonstration project funded by the Rehabilitation Services Agency (RSA), which is part of the U.S. Department of Education. We leveraged the administrative data from the VR agency to identify how students were typically connected to the agency’s services. Because the VR agency offered additional services to help youth transition to young adulthood on top of the agency’s usual services as part of the demonstration, we also observed whether that program increased VR involvement and its resultant outcomes, including earnings.
1.1Pre-ETS implementation and challenges
Pre-ETS include five required services: counseling on opportunities for enrollment in comprehensive transition or postsecondary educational programs, instruction in self-advocacy, counseling on job exploration, work-based learning experiences (WBLEs), and workplace readiness training. These services stand apart from the services that VR agencies offered historically. People who apply to VR, are assessed as eligible for services, and establish an individualized plan for employment can use VR services to achieve their specific employment goals. Pre-ETS offers a broad but limited set of services to encourage youths’ transition from school to employment and education during young adulthood. The evidence supporting these five services is positive, though much of the research is derived from correlational or qualitative analyses or reflects an intervention that included the service as a package of other services (Frentzel et al., 2021).
Pre-ETS has strengthened the role of VR agencies in the transition process. Recent studies show the shifts toward serving youth and young adults that VR agencies have made by providing pre-ETS. Before WIOA, the percentage of VR users younger than age 24 was roughly one-third (RSA, 2020). In program year 2018 (after WIOA implementation), the percentage increased to more than half of VR service users, and students with disabilities represented more than one-third of VR caseloads. Moreover, that share of students with disabilities did not reflect potentially eligible students who used pre-ETS (those students who had not applied for VR services, but are presumed eligible), which may establish a gateway for students to apply to VR agencies for additional services. Pre-ETS are often provided directly by VR agency staff, though agencies more frequently use purchased services for WBLEs (Honeycutt et al., 2019). A review of state plans intended to identify content related to pre-ETS showed that agencies, in their attempt to address WIOA requirements, have focused on improving the employment skills of students; developing opportunities that emphasize community-based employment; and building partnerships with employers, local education agencies, postsecondary education institutions, and families (Taylor et al., 2021).
VR agency staff have encountered numerous challenges in offering pre-ETS to students. The roles of VR counselors can involve working more with youth and schools than with adults, and the increased number of students who are potentially eligible has had corresponding effects on caseloads, paperwork burdens, and time management (Fabian et al., 2018). RSA (2020) documented other fiscal and operational challenges of implementing pre-ETS requirements, including agencies moving into an order of selection because of increased demands in serving youth and shifting resources to students with disabilities from the broader adult population (limiting VR services to all people with disabilities within a state).
1.2The Linking Learning to Careers demonstration program
The Vermont Division of Vocational Rehabilitation (DVR) (which recently changed its name to HireAbility Vermont) built on its existing transition program to offer services to high school students through the Linking Learning to Careers (LLC) demonstration program. DVR designed the program to emphasize work-based learning experiences (WBLE) and provide an individualized approach to promoting students’ confidence and planning for their futures. RSA funded DVR to implement and evaluate LLC as one of five RSA-sponsored demonstration projects that evaluated models of early work experiences for students with disabilities.
LLC leveraged DVR’s usual services for high school students to emphasize unpaid and paid WBLEs in integrated environments. Usual services comprise those services that are typically available to students, such as pre-employment transition services and (for those who are eligible) employment and training services. LLC also provided college exploration and coursework opportunities at the Community College of Vermont, team-based guidance and support from VR staff, dedicated assistive technology support, and additional transportation funding to support participation. To facilitate WBLE opportunities and service delivery, DVR funded transition counselors, career consultants, and youth employment specialists, some of whom only worked LLC caseloads, in each of its 12 district offices. Only LLC participants (treatment group youth) could access LLC-specific services and staff, and they could use other pre-ETS and services as VR clients. (All participants could access pre-employment transition services, but only participants with an open DVR case were eligible for other DVR services). Youth in the control group could access usual DVR services but did not have access to LLC-specific services or the dedicated staff who were part of the program. Table 1 shows the DVR services available to treatment group youth (LLC services) and control group youth (that is, usual services) (Martin et al., 2021; Sevak et al., 2021).
Table 1
DVR services available to LLC treatment and control group youth
| Services available to the treatment group | Services available to the control group |
| WBLEs | |
| LLC’s goal was to provide each treatment group member with three WBLEs during their involvement in the program, including one job shadow experience, one unpaid internship or volunteer experience, and one employer-paid WBLE. Youth could also obtain competitive integrated employment. LLC staff used assessment tools to align youth’s interests with job opportunities. | Control group youth were eligible to pursue WBLEs as part of pre-employment transition services and could use online assessment tools, but completion of three WBLEs was not a goal. |
| Pre-employment transition services | |
| Pre-employment transition services were available for treatment and control group youth, but pre-employment transition services for treatment group youth were embedded within the LLC framework and provided by the LLC team. | All students with disabilities, including those with an individualized education program, section 504 plan, or documented disability, were eligible for pre-employment transition services. Such services help students with disabilities advocate for themselves, gain employment experience, and prepare for life after high school. |
| VR services | |
| Services for VR clients were the same for treatment and control group youth. | Students determined eligible for VR could receive a range of services as identified in their individualized plan for employment, including career and training services, transportation, AT, and financial education counseling. |
| Planning tools | |
| LLC staff used optional planning tools developed specifically for LLC, including the LLC Career Pathway Plan, to gather treatment group youth’s short- and long-term career goals for their transition after high school. | Staff who provided services to control group youth could use other non-LLC planning tools. |
| AT services | |
| LLC staff referred treatment group youth to dedicated AT specialists as needed. AT services typically began with general information sessions to better understand the areas in which youth might benefit from AT, after which the AT specialists met individually with youth to demonstrate products and help them make informed choices. The LLC program then loaned or purchased the products for the youth, and the specialists provided ongoing follow-up support to monitor the youth’s progress. | VR staff could offer AT support to control group youth who were within six months of high school graduation. The VR program could not, however, purchase equipment or devices for control group youth, and any AT that high schools provided remained with the school, not the student, upon graduation. Control group youth would need to visit one of three AT Centers in the state for services. |
| Postsecondary education services | |
| In collaboration with the CCV system, LLC offered several enhanced postsecondary education services for treatment group youth, including campus tours, information sessions, specialized academic programs, multiple opportunities for dual-enrollment courses, and vouchers to cover the tuition for two courses (in addition to the two courses available through the state education agency). CCV staff worked with treatment group youth to better understand the links between their academics and career objectives. | Control group youth could receive vouchers to cover the tuition for two college courses worth up to four credits each at participating institutions. |
| Transportation services | |
| LLC offered additional funds to support treatment group youth’s transportation needs related to education or work opportunities. Transportation funds were intended to be flexible and cover the costs of public transportation options, taxis, and a wide range of personal expenses such as gas, reimbursed mileage, vehicle maintenance or purchase, and driver’s permit or license fees. | Control group youth with a VR case could obtain support for transportation services. Financial support could be requested from the case services funds, or VR staff could coordinate with schools to provide transportation. |
Note. AT = Assistive Technology; CCV = Community College of Vermont; DVR = Division of Vocational Rehabilitation; LLC = Linking Learning to Careers; VR = Vocational Rehabilitation; WBLE = Work-Based Learning Experience.
From April 2017 to December 2018, DVR recruited 803 students with disabilities to participate in the LLC demonstration. Using a random assignment process, DVR assigned 413 students to the treatment group with access to enhanced LLC services and 390 to a control group with access to usual services. DVR staff conducted initial outreach for LLC enrollment to high school students who were already using DVR services, whether eligible or presumed eligible for VR; these youth typically had individualized education programs or Section 504 plans. Later, they expanded the pool to high school students not yet enrolled with DVR but who met the same eligibility requirements. The LLC evaluation tracked services and outcomes through the first 24 months after enrollment, though students could continue to use DVR services after that point.
This paper does not present findings on the impacts of the LLC demonstration, but instead takes a closer look at service patterns of youth in the treatment and control groups to understand better how youth typically used pre-ETS and VR services. The LLC impact evaluation found that (1) LLC had a large impact on VR service use in the two years after youth enrolled, particularly those services that LLC intended; (2) LLC increased participation in postsecondary education by 8 percentage points; and (3) LLC did not affect employment for all participants within the first 24 months of program enrollment, though it increased the likelihood of earnings among later enrollees by 11 percentage points. These findings were limited in that they only used a 24-month window from enrollment, and many enrollees had not yet completed high school. Full details of the LLC evaluation can be found in Martin et al. (2021) and Sevak et al. (2021).
1.3Study objectives
This study relies on data from DVR and the LLC program evaluation to answer three questions related to patterns of service use and resulting outcomes:
• What were students’ typical service patterns with pre-ETS and VR services during a 24-month period?
• How did those service patterns differ for youth who had access to LLC?
• How did earnings outcomes vary by youth’s service patterns?
The answers to these questions fill gaps in our knowledge regarding how high school students access pre-ETS and VR services (that is, what are their service patterns), which youth use which services, how a transition program can affect the service patterns, and differences in early outcomes according to service patterns.
2Methods
This analysis uses data collected on DVR service delivery and outcomes from the LLC evaluation, which had a sample of 803 high school students. It uses descriptive analyses to explore how youth in the control group used the services offered by DVR and tracks their outcomes. It then contrasts those statistics with similar calculations for the youth in the treatment group to assess the differences between the two groups.
2.1Sample
This study examines the 803 high school students who signed up for the LLC demonstration. Participants’ characteristics at the time of random assignment to the treatment and control groups were largely similar (Table 2). A majority of participants were White, about 60 percent identified as male, and just over half were enrolled in grades 11 or 12. The most common disability types included learning disabilities and attention-deficit/hyperactivity disorder. Nearly a fifth of participants received income from the Supplemental Security Income or Social Security Disability Insurance programs. One-third of participants had a paid job when they enrolled. The few small differences in characteristics between the treatment and control groups (about 3 to 5 percentage points) were not statistically significant.
Table 2
Characteristics of Vermont LLC control and treatment group youth
| Characteristics at enrollment | Control group youth (%) | Treatment group youth (%) |
| Number of participants | 390 | 413 |
| Gender | ||
| Male | 59 | 62 |
| Female, non-binary, or other gender | 41 | 38 |
| Race and ethnicity | ||
| White alone and not Hispanic | 84 | 82 |
| Hispanic or non-White race | 16 | 18 |
| Grade level | ||
| 9 or 10 | 47 | 46 |
| 11 or 12, missing, and other | 53 | 54 |
| Has ever been identified as having | ||
| ADD or ADHD | 48 | 46 |
| Autism spectrum disorder | 16 | 16 |
| Emotional disorder | 39 | 35 |
| Intellectual disability | 10 | 11 |
| Learning disability | 50 | 49 |
| Sensory disability | 31 | 27 |
| Physical disability or other | 19 | 15 |
| When disability or condition was first identified | ||
| Before kindergarten | 38 | 37 |
| School age | 62 | 63 |
| Service receipt | ||
| Receives special education services | 83 | 80 |
| Receives SSI or SSDI benefits disability | 19 | 18 |
| Employment | ||
| Worked at time of enrollment | 33 | 34 |
| Parent or guardian characteristics | ||
| At least one parent has a college degree | 36 | 37 |
| Married or cohabitating | 62 | 62 |
| Any earned income in the past year | 82 | 81 |
Note. None of the differences between the treatment and control groups are statistically significant. ADD = Attention Deficit Disorder; ADHD = Attention-Deficit/Hyperactivity Disorder; DVR = Division of Vocational Rehabilitation; LLC = Linking Learning to Careers; SSDI = Social Security Disability Insurance; SSI = Supplemental Security Income.
Participants were similar to youth with disabilities ages 14 to 18 in Vermont and the United States across most characteristics, but they differed in potentially meaningful ways. Compared with youth with disabilities in Vermont, a slightly higher share of students in the demonstration were non-White or of Hispanic ethnicity. The percentage of participants reporting employment experience (33 percent) was substantially higher than the 24 percent employment rate among youth with disabilities in Vermont (based on our calculations from the 2017 and 2018 American Community Survey); this difference might reflect the motivations of youth interested in the LLC demonstration or youth who typically use pre-ETS and VR services (from which the program largely drew its sample). Differences by race and employment are even more pronounced when comparing demonstration participants with similarly aged youth with disabilities in the United States. The percentage of participants reporting a particular disability was higher than the percentage in published statistics on students with disabilities in Vermont (Vermont Agency of Education, 2016) and nationally (National Center for Education Statistics, 2021), but this finding could be because of measurement differences. The LLC baseline survey allowed students to report multiple disabilities, and education statistics report mutually exclusive categories, grouping students with multiple disabilities in one category.
2.2Data
This analysis draws on four data sources for information on demonstration assignment, youth and family characteristics, DVR involvement, and earnings outcomes. LLC enrollment data identify which participants LLC randomized to the treatment and control groups, their application dates, and the district office associated with their applications. Youth and families completed web-based baseline surveys at enrollment that contained almost 50 items. Along with the characteristics shown in Table 2, the surveys also collected information about other demographic and disability characteristics, employment history, expectations for the future, and information about their parents. DVR administrative data are service records input by DVR staff about application, service, and outcomes related to a person’s DVR involvement. From these data, we identified participants’ use of vocational and rehabilitative services from April 2017 to June 2021. These data include all 803 demonstration participants and represent services used by youth (including purchased services) and VR agency milestones (such as application and eligibility dates). Finally, we analyzed Vermont unemployment insurance data for earnings outcomes, which contain quarterly earnings as reported by employers to the state. DVR obtained these data from the Vermont Department of Labor for the 638 demonstration participants who provided Social Security numbers to DVR at the time of random assignment.
2.3Measures
We use three types of measures in our analysis: youth and family characteristics, DVR services and milestones, and earnings outcomes.
2.3.1Youth and family characteristics
From the baseline data, we coded the following indicators of whether they: identified as male, female, non-binary or other gender; identified as White, non-Hispanic, another race, or Hispanic ethnicity; were enrolled in (a) grades 9 or 10 or (b) grades 11 or 12 or had other education status at enrollment; had at least one parent or guardian with a college degree; received special education services (including having an individualized education program); received Supplemental Security Income or Social Security Disability Insurance because of a disability; and were working at the time of enrollment. We also coded the youth’s disability type (attention-deficit disorder or attention-deficit/hyperactivity disorder, autism spectrum disorder, emotional disorder [including behavioral disorder or emotional disturbance], intellectual disability, learning disability, sensory disability [speech, hearing, or visual], physical disability, or other disability not listed); when the youth’s disability or condition was first identified (before kindergarten or during school); whether the enrolling parent was married or cohabitating; and whether the enrolling parent earned any income in the past year.
2.3.2DVR services and milestones
From DVR’s service records, we captured various VR service measures and milestones for each student during the first 24 months after enrollment. These measures include students’ DVR status at the time of enrollment (pre-application student, DVR client, or no DVR involvement); whether students applied for DVR services and were found eligible; their use of pre-ETS (counseling on enrollment opportunities, instruction in self-advocacy, job exploration counseling, WBLEs, and workplace readiness training), including the number of service types; and their use of DVR services (career services, training services, or other services, excluding pre-employment transition services).
2.3.3Earnings outcomes
Using the state’s unemployment insurance wage records, we tracked whether a student had any earnings in each of eight quarters beginning the quarter after enrollment (representing a 24-month period). For each quarter, we created a binary indicator for any earnings. Across all eight quarters, we created a summary measure for the number of quarters with earnings.
2.4Analytical approach
This exploratory analysis relies on two analytical approaches to answer the study’s research questions. First, we use descriptive statistics, such as counts, means, and percentages, to document youth and family characteristics, DVR services and milestones, and earnings outcomes. Second, we use t-tests and chi-square tests to assess which youth and family characteristics are significantly associated with selected outcomes and whether the treatment and control groups differed in their service patterns.
3Results
3.1Service patterns for control and treatment group youth
Similar shares of control and treatment group youth began their involvement with the demonstration after having some exposure to DVR (Fig. 1). Most youth were pre-application students, so they had access to pre-ETS before enrollment. The remainder of enrollees had no prior DVR involvement or had an open VR case; the proportions of both groups were roughly similar, indicating that the control and treatment groups youth had comparable engagement with DVR before LLC enrollment.
Fig. 1
DVR involvement at enrollment and during the 24 months after enrollment. This figure shows the proportion of treatment (N = 413) and control (N = 390) youth according to their DVR service involvement at enrollment and 24 months after enrollment.
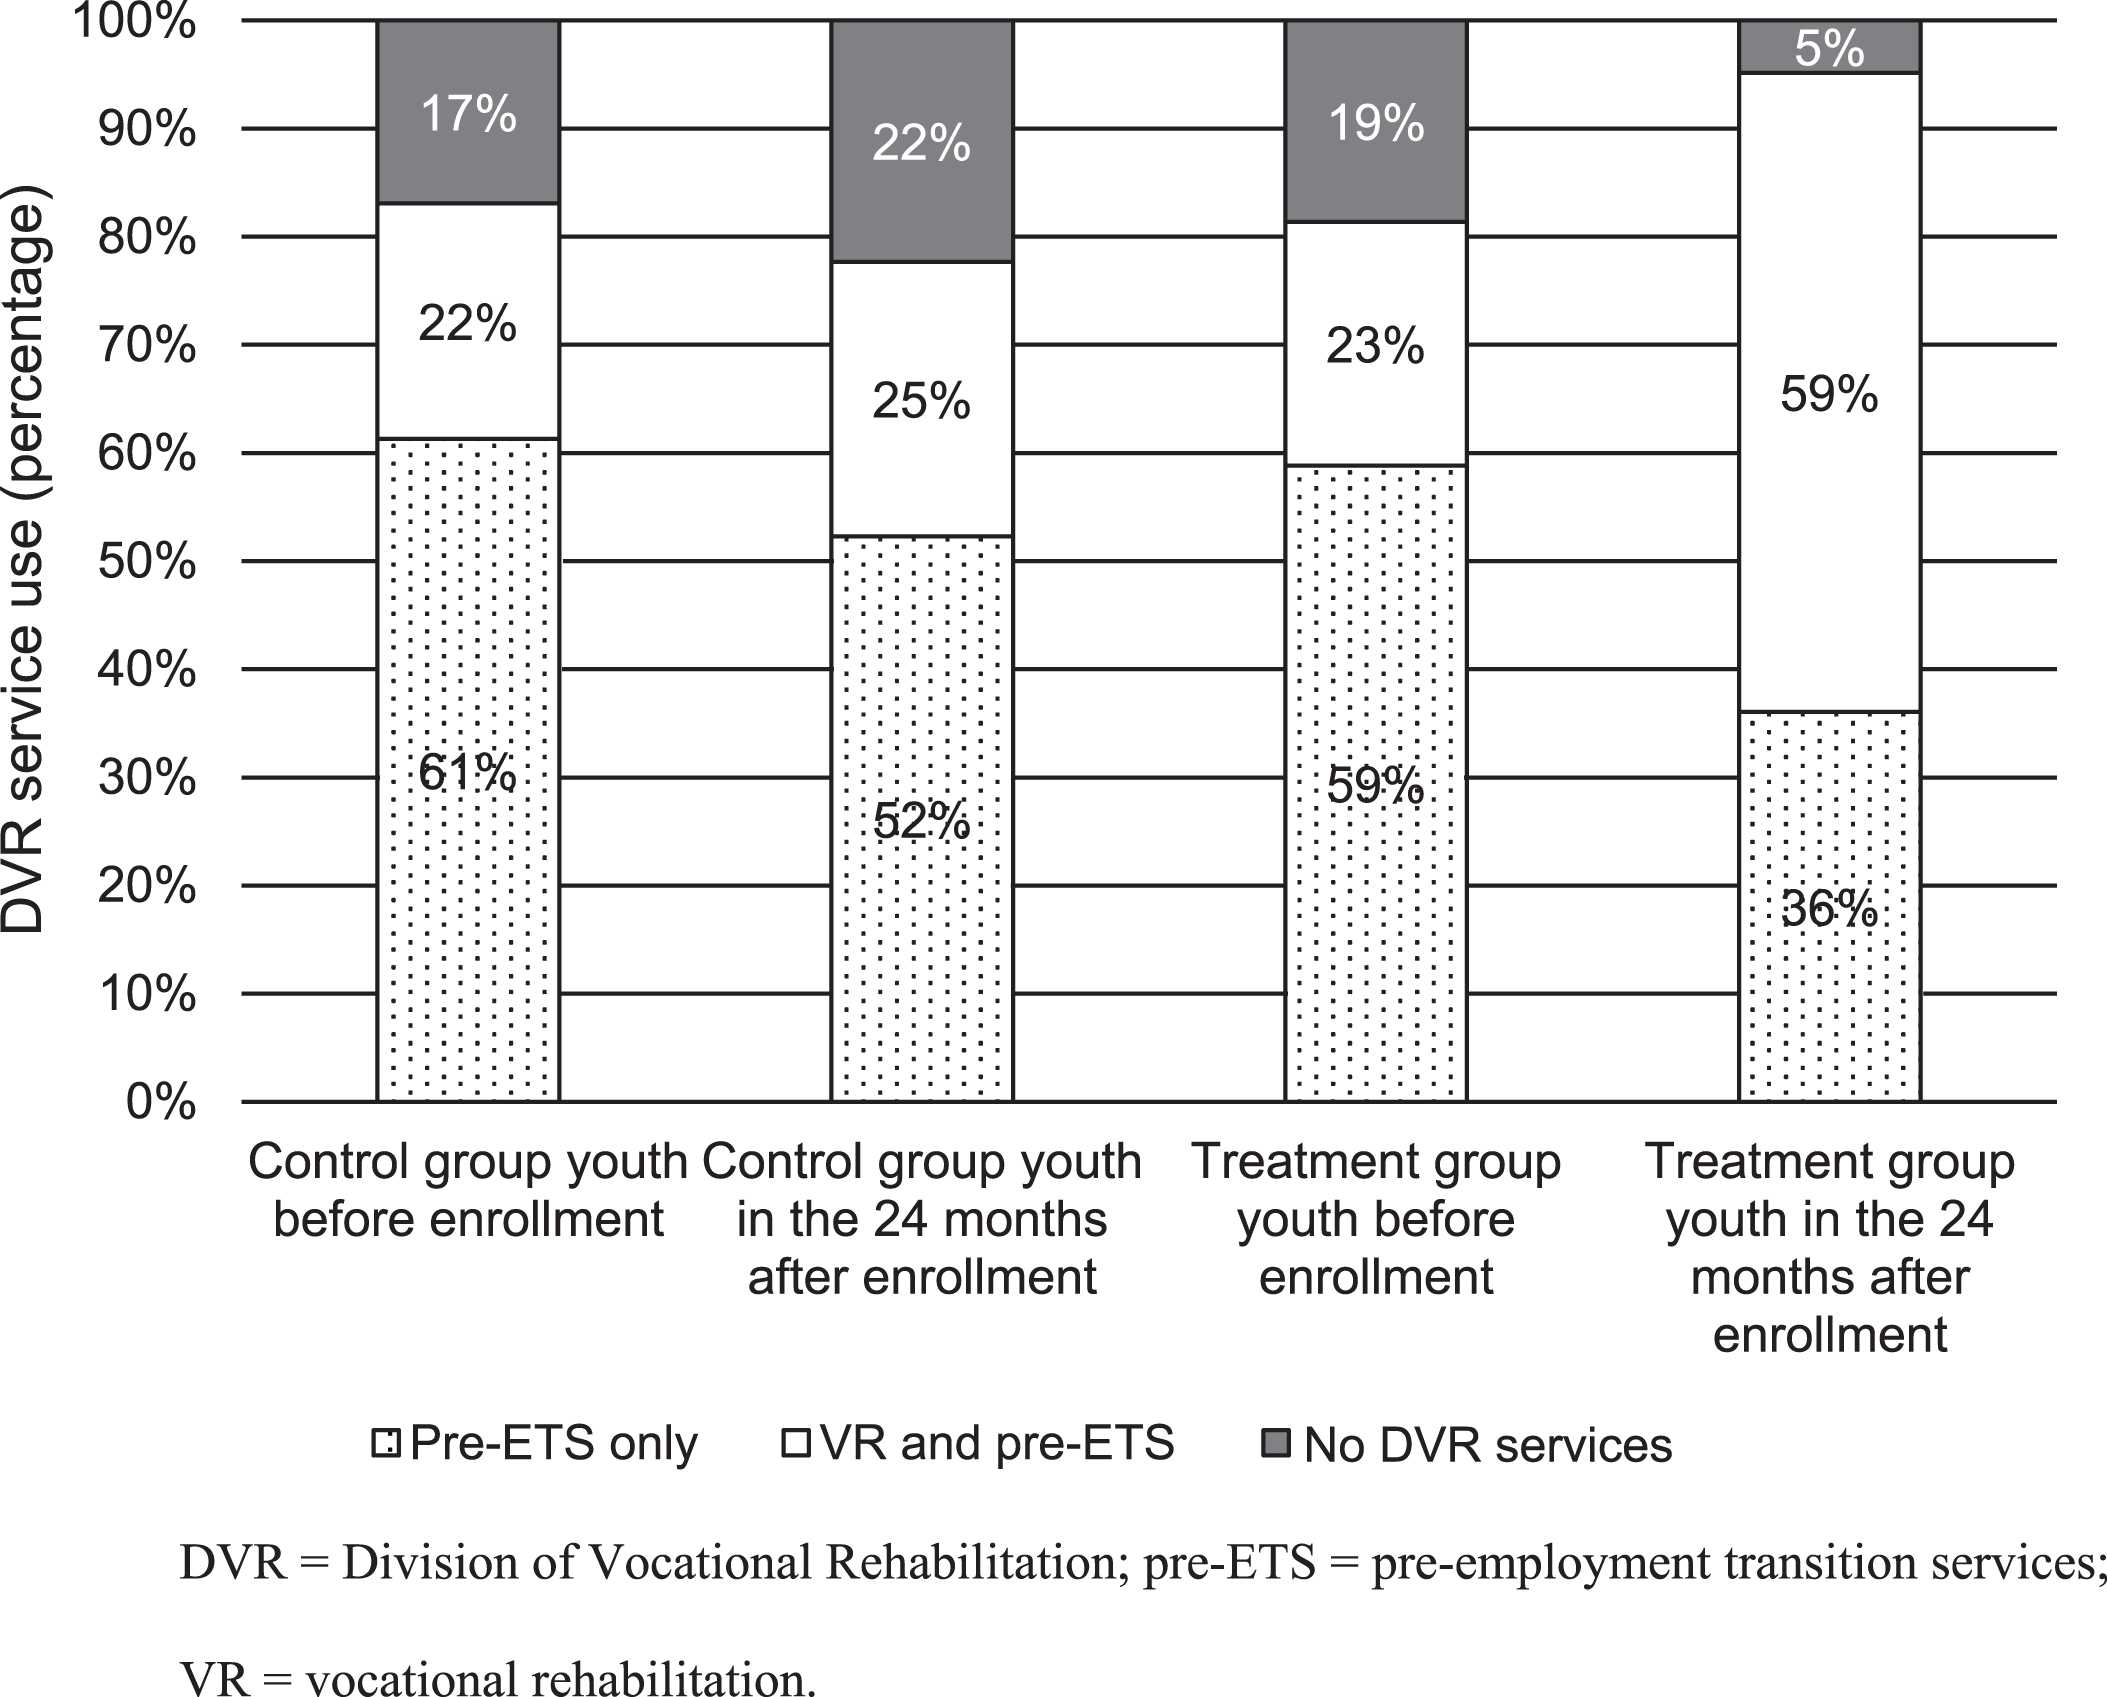
Though control and treatment group youth had similar DVR statuses at enrollment, more treatment group youth used pre-ETS and VR services in the 24 months after enrollment than did control group youth (Fig. 1). Among all control group youth, more than half only used pre-ETS, and one-quarter also received VR services under an individualized plan for employment (and might have also used pre-ETS). In addition, 22 percent did not use any VR services. In contrast, nearly all treatment group youth used some VR service, and a majority (59 percent) used both VR services and pre-ETS. Five percent of treatment group youth did not use any services from DVR. These results indicate that although the treatment and control groups had similar eligibility for VR services and pre-ETS at enrollment, LLC involvement brought with it greater engagement in pre-ETS and VR services relative to the control group.
3.2Individual characteristics related to pre-ETS
The pre-ETS usage rates for control group youth suggest substantial differences in the types of youth who used pre-ETS. Among control group youth, those who used pre-ETS differed from those who did not by gender, disability type, employment, and service receipt characteristics (Table 3). Males, for example, represented 71 percent of control group youth who did not use pre-ETS and 56 percent of those who did, a difference of 14 percentage points. Control group youth who used pre-ETS were 10 percentage points less likely to be employed at enrollment, 9 percentage points more likely to report an autism spectrum disorder, and 15 percentage points more likely to receive special education services, relative to their counterparts who did not use pre-ETS.
Table 3
Characteristics of youth who did and did not use pre-ETS
| Characteristics at enrollment | Control group | Control group | Treatment group | Treatment group |
| youth who did not | youth who used | youth who did not | youth who used | |
| use pre-ETS (%) | pre-ETS (%) | use pre-ETS (%) | pre-ETS (%) | |
| Number of participants | 88 | 302 | 28 | 385 |
| Gender | ||||
| Male | 70.5 | 56.3** | 57.1 | 61.8 |
| Female, non-binary, or other gender | 29.5 | 43.7** | 42.9 | 38.2 |
| Race and ethnicity | ||||
| White alone and not Hispanic | 81.8 | 85.1 | 78.6 | 82.6 |
| Hispanic or non-White race | 18.2 | 14.9 | 21.4 | 17.4 |
| Grade level | ||||
| 9 or 10 | 48.9 | 46.0 | 50.0 | 45.5 |
| 11 or 12, missing, and other | 51.1 | 54.0 | 50.0 | 54.5 |
| Has ever been identified as having | ||||
| ADD or ADHD | 47.7 | 48.3 | 42.9 | 45.7 |
| Autism spectrum disorder | 9.1 | 18.5** | 14.3 | 16.4 |
| Emotional disorder | 45.5 | 37.7 | 42.9 | 34.0 |
| Intellectual disability | 8.0 | 10.9 | 7.1 | 11.4 |
| Learning disability | 47.7 | 50.3 | 39.3 | 50.1 |
| Sensory disability | 25.0 | 32.1 | 25.0 | 27.5 |
| Physical disability or other | 19.3 | 18.5 | 14.3 | 15.3 |
| When disability or condition was first identified | ||||
| Before kindergarten | 35.2 | 39.1 | 35.7 | 36.6 |
| School age | 64.8 | 60.9 | 64.3 | 63.4 |
| Service receipt | ||||
| Receives special education services | 69.3 | 87.1*** | 71.4 | 80.8 |
| Receives SSI or SSDI benefits | 13.6 | 20.2 | 7.1 | 18.7 |
| Employment | ||||
| Worked at time of enrollment | 40.9 | 30.8* | 39.3 | 33.2 |
| Parent or guardian characteristics | ||||
| At least one parent has a college degree | 29.5 | 37.4 | 35.7 | 37.1 |
| Married or cohabitating | 59.1 | 62.9 | 50.0 | 62.3 |
| Any earned income in the past year | 85.2 | 81.1 | 71.4 | 82.1 |
Note. Pre-ETS use is based on youths’ DVR involvement in the 24 months after their enrollment. */**/*** Difference in percentage among youth using pre-ETS and youth not using pre-ETS is significantly different from zero at the .10/.05/.01 levels, respectively. ADD = Attention Deficit Disorder; ADHD = Attention-Deficit/Hyperactivity Disorder; DVR = Division of Vocational Rehabilitation; LLC = Linking Learning to Careers; SSDI = Social Security Disability Insurance; SSI = Supplemental Security Income.
Youth in the treatment group had no significant differences in the characteristics of those who used pre-ETS and those who did not (Table 3). The lack of differences reflects the LLC program’s intent to connect most program youth to pre-ETS, but it could also result from the small number of youth (N = 28) who used no services (that is, a few differences between those who did and did not use pre-ETS were 10 percentage points or higher, but were not statistically significant). The program’s additional resources, such as dedicated staff to connect with youth and service offerings, could have appealed more widely to the needs of youth, thus resulting in the large number of youth using pre-ETS.
3.3Patterns of pre-ETS use
Most pre-ETS users in the control group used job exploration counseling services, with the group evenly split between the number of pre-ETS types that they used (Table 4). Nearly four in five control group youth used job exploration counseling services, and about half received counseling on enrollment opportunities. Less than 40 percent of control group members used other pre-ETS types. Control group youth who used pre-ETS were roughly equally divided by whether they used a single pre-ETS type, two types, or three or more types.
Table 4
Type and intensity of pre-ETS among youth who used pre-ETS
| Control group youth | Treatment group youth | |||
| who used pre-ETS | who used pre-ETS | |||
| N | Percentage | N | Percentage | |
| Total | 302 | 100.0 | 385 | 100.0 |
| Pre-ETS type | ||||
| Counseling on enrollment opportunities | 143 | 47.4 | 250 | 64.9*** |
| Instruction in self-advocacy | 74 | 24.5 | 97 | 25.2 |
| Job exploration counseling | 242 | 80.1 | 334 | 86.8*** |
| WBLE | 108 | 35.8 | 284 | 73.8*** |
| Workplace readiness training | 111 | 36.8 | 125 | 32.5 |
| Number of pre-ETS types used | ||||
| 1 | 97 | 32.1 | 61 | 15.8*** |
| 2 | 95 | 31.5 | 94 | 24.4 |
| 3 or more | 110 | 36.4 | 230 | 59.7 |
Note. Pre-ETS use is based on youths’ DVR involvement in the 24 months after their enrollment. */**/*** Difference in percentages between control and treatment groups is significantly different from zero at the .10/.05/.01 levels. Chi-square test used for number of pre-ETS types used. DVR = Division of Vocational Rehabilitation; pre-ETS=pre-Employment Transition Services; WBLE = Work-Based Learning Experience.
LLC affected how youth used pre-ETS. Though the most frequent pre-ETS type remained job exploration counseling, most treatment group youth also used WBLEs or counseling on enrollment opportunities (Table 4). Treatment group youth were significantly more likely to use those three services than control group youth, which reflects LLC’s service model to connect youth with various kinds of pre-ETS. Rates for the use of instruction in self-advocacy and workplace readiness training were no different from the rates for control group youth. Nearly 60 percent of treatment group pre-ETS users engaged with three or more types of pre-ETS, a significantly larger share than that of control group youth.
3.4Individual characteristics related to VR service use
The composition of control group youth with VR service use differed from control group youth without VR service use by gender, grade level, and disability type. The largest difference occurred by grade level. Almost three-fourths (71 percent) of VR service users were in grades 11 or 12, whereas only 47 percent of those who did not use VR services were, a difference of 23 percentage points. Fewer VR service users were male (17 percentage points) or had a learning disability diagnosis (14 percentage points), and more VR service users had a sensory disability diagnosis (9 percentage points), relative to youth who did not use VR services (Table 5). Notably, there were no statistically significant differences between youth who did and did not use VR services by race or ethnicity, parent or guardian background, most disability types, Supplemental Security Income or Social Security Disability Insurance status, or employment.
Table 5
Characteristics of youth who did and did not use VR services
| Enrollment characteristics | Control group | Control group | Treatment group | Treatment group |
| youth who did not | youth who used | youth who did not | youth who used | |
| use VR services (%) | VR services (%) | use VR services (%) | VR services (%) | |
| Number of participants | 291 | 99 | 169 | 244 |
| Gender | ||||
| Male | 63.9 | 46.5*** | 60.4 | 62.3 |
| Female, non-binary, or other gender | 36.1 | 53.5*** | 39.6 | 37.7 |
| Race and ethnicity | ||||
| White alone and not Hispanic | 82.8 | 88.9 | 81.7 | 82.8 |
| Hispanic or non-White race | 17.2 | 11.1 | 18.3 | 17.2 |
| Grade level | ||||
| 9 or 10 | 52.6 | 29.3*** | 54.4 | 39.8*** |
| 11 or 12, missing, and other | 47.4 | 70.7*** | 45.6 | 60.2*** |
| Has ever been identified as having | ||||
| ADD or ADHD | 49.5 | 44.4 | 49.1 | 43.0 |
| Autism spectrum disorder | 15.1 | 20.2 | 13.0 | 18.4 |
| Emotional disorder | 38.1 | 43.4 | 31.4 | 36.9 |
| Intellectual disability | 9.6 | 12.1 | 13.6 | 9.4 |
| Learning disability | 53.3 | 39.4** | 47.3 | 50.8 |
| Sensory disability | 28.2 | 37.4* | 27.8 | 27.0 |
| Physical disability or other | 18.6 | 19.2 | 16.6 | 14.3 |
| When disability or condition was first identified | ||||
| Before kindergarten | 38.1 | 38.4 | 34.9 | 37.7 |
| School age | 61.9 | 61.6 | 65.1 | 62.3 |
| Service receipt | ||||
| Receives special education services | 82.1 | 85.9 | 76.9 | 82.4 |
| Receives SSI or SSDI benefits | 17.5 | 22.2 | 14.8 | 20.1 |
| Employment | ||||
| Worked at time of enrollment | 34.0 | 30.3 | 30.2 | 36.1 |
| Parent or guardian characteristics | ||||
| At least one parent has a college degree | 36.1 | 34.3 | 40.8 | 34.4 |
| Married or cohabitating | 62.2 | 61.6 | 60.9 | 61.9 |
| Any earned income in the past year | 82.5 | 80.8 | 83.4 | 79.9 |
Note. VR service use is based on youths’ DVR involvement in the 24 months after their enrollment. */**/*** Difference in percentage among youth using VR services and youth not using VR services within the control or treatment group is significantly different from zero at the .10/.05/.01 levels. ADD = Attention Deficit Disorder; ADHD = Attention-Deficit/Hyperactivity Disorder; DVR = Division of Vocational Rehabilitation; LLC = Linking Learning to Careers; SSDI = Social Security Disability Insurance; SSI = Supplemental Security Income.
Compared with control group youth, treatment group youth who did and did not use VR services only differed along one characteristic. More treatment group youth who used VR services were in grades 11 or 12 (by 14 percentage points) relative to those who did not use VR services; this difference is much smaller than that observed for control group members (Table 5). This pattern suggests that LLC led to an increase in service use among some groups who would otherwise have had lower participation rates.
3.5Earnings outcomes by service patterns
Most control group youth had earnings, no matter their pre-ETS and DVR involvement. Control group youth had an average of three earnings quarters across the first eight quarters after enrollment, and 61 percent had earnings in at least one quarter (Table 6). Among those using specific pre-ETS, youth who used WBLEs had the highest average quarters with earnings (3.6 quarters) and any quarters of earnings (71 percent). Other youth whose earnings outcomes were higher than average included those who used both pre-ETS and VR services, used counseling on enrollment opportunities, or used two of the five pre-ETS types.
Table 6
Earnings outcomes eight quarters after enrollment by DVR involvement and pre-ETS use
| Control group youth | Treatment group youth | |||||
| N | Any quarters | Number of | N | Any quarters | Number of | |
| with earnings | earnings | with earnings | earnings | |||
| (%) | quarters | (%) | quarters | |||
| Total | 299 | 61.0 | 2.99 | 339 | 66.0 | 3.06 |
| DVR involvement through 24 months | ||||||
| None | 60 | 62.3 | 3.12 | 15 | 59.0 | 2.78 |
| Pre-ETS only | 162 | 56.7 | 2.76 | 123 | 65.8 | 3.01 |
| Pre-ETS and VR services | 76 | 67.4 | 3.26 | 194 | 67.0 | 3.18 |
| Pre-ETS type | ||||||
| Counseling on enrollment opportunities | 113 | 63.0 | 3.13 | 208 | 69.8 | 3.35 |
| Instruction in self-advocacy | 65 | 51.6 | 2.45 | 85 | 61.1 | 2.53 |
| Job exploration counseling | 191 | 57.5 | 2.76 | 278 | 63.7 | 2.89 |
| WBLE | 87 | 70.8 | 3.60 | 237 | 70.7 | 3.42 |
| Workplace readiness training | 86 | 57.5 | 2.64 | 101 | 50.8 | 2.02 |
| Number of pre-ETS types used | ||||||
| 1 | 80 | 55.1 | 2.87 | 45 | 70.4 | 3.53 |
| 2 | 66 | 68.0 | 3.11 | 78 | 65.9 | 2.99 |
| 3+ | 92 | 59.2 | 2.86 | 195 | 65.3 | 3.08 |
Note. Number of participants is limited to youth who shared Social Security numbers with LLC at enrollment. Earnings observed within eight quarters after the quarter of LLC enrollment. One control group youth and seven treatment group youth used only VR services; we omitted this category from the DVR and pre-ETS calculations. DVR = Division of Vocational Rehabilitation; LLC = Linking Learning to Careers; pre-ETS = pre-Employment Transition Services; VR = Vocational Rehabilitation; WBLE = Work-Based Learning Experience.
Treatment and control group youth had similar earnings outcomes (Table 6). Treatment group youth had an average of three earnings quarters, and 66 percent had earnings in at least one of the eight quarters after the enrollment quarter. Treatment group youth who used WBLEs or who only used one pre-ETS type had among the highest earnings outcomes relative to other types of DVR involvement. Unlike the control group youth, treatment group youth had similar earnings outcomes for those who used both pre-ETS and VR services and those who used pre-ETS only. (Among control group youth, the former group had higher rates than the latter group.)
The variation in earnings outcomes across youth with different DVR involvement should not be interpreted as causal. The observed relationships between service use and outcomes might be attributable to the observable and unobservable characteristics of youth, such as need, opportunity, motivation, or parental support, as well as local labor markets that are correlated with service use and outcomes.
4Discussion
This study adds to the growing literature on pre-ETS by leveraging the rich information DVR collected on youth at baseline to illuminate whether use of pre-ETS differed across groups. To our knowledge, this study is the first to explore the characteristics of high school youth who use pre-ETS and VR services. Most VR agencies collect minimal information on youth who use pre-ETS and have little or no information on students who do not use pre-ETS, making it difficult or impossible to study differential use patterns by race and ethnicity, gender, disability type, or other characteristics. The study has the advantage of examining the experiences of youth exposed to a transition program focused on WBLEs (the treatment group) and youth who were interested in the program but received usual services from the VR agency (the control group). The results document outcomes for youth by patterns of service use, though most youth were still in high school when we measured these outcomes.
4.1Limitations
Readers should consider four limitations as they interpret the findings of this study. First, this study uses data from a single VR agency, which could limit the generalizability of some results. Second, the LLC program emphasized WBLEs and so likely attracted students with disabilities whose interest in employment was stronger than the interests of the broader group of all students with disabilities. Most students were connected to DVR in some manner before enrolling in LLC, and one-third had previous employment experience. The findings may not generalize to a broader group of students with disabilities that includes those with no previous VR agency engagement. Third, we examine service patterns and outcomes only for the first 24 months after LLC enrollment. Because most youth were still enrolled in high school, this window might be too short to draw firm conclusions about how the patterns relate to earnings outcomes. The final limitation reflects our descriptive analytic approach to answering its research questions and the relatively small sample for some subgroups, which affects the interpretation of the results (that is, the results are not causal and we have limited power to detect effects).
4.2Policy and program implications
VR agency administrators, staff, and clients, along with community members and advocates interested in VR, face multiple decisions regarding the programs and services for students and other youth with disabilities. The findings from this study provide some insight into three core questions that VR administrators and others interested in youth transition might ask.
4.2.1Differences in who uses pre-ETS and VR services
An intentional, comprehensive approach to offering VR services to youth, similar to LLC, can increase youth’s involvement with a VR agency. In Vermont, different types of youth with disabilities used VR services under typical conditions. These differences raise questions about who takes up the offer of VR services. For example, despite all youth being interested enough in signing up for LLC, the male control group youth were less likely to use pre-ETS or VR services, and control group youth in higher grades were more likely to access VR services. These two findings are consistent with another study that examined the characteristics of youth and VR service use (Honeycutt et al., 2017), though that study and another (Yin et al., 2021) found differences in service use by race and ethnicity that were not observed in Vermont. We can only speculate on the reasons for the differences in Vermont and elsewhere, such as a lack of interest in usual VR services, motivation for employment, opportunities to find employment through other means, or outreach by VR staff. Regardless of the reason, after youth received the offer of LLC, we no longer observed most differences in youth’s characteristics and their VR involvement.
Other VR agencies might have differences in which youth use their services, yet they may not be aware of those differences because they have limited information on the characteristics of potentially eligible youth. VR administrators might consider ways to collect information on potentially eligible students that is similar to that which they collect for youth who apply for VR services and track their involvement. Such information could identify whether some youth use services at higher or lower rates than might be expected. If so, then administrators could investigate why and whether the agency could improve its connections to services for youth who are potentially underserved.
Another aspect of this question reflects the reach of VR agencies in the community and the types of youth who come to the VR door. With LLC, roughly a third of control and treatment group youth were employed at the time they enrolled in the demonstration. This rate is higher than the national employment rate of transition-age youth with disabilities. The prevalence of prior work history could reflect either the youth who signed up for pre-ETS and VR more broadly or the outreach conducted specifically for the LLC demonstration. Regardless, this group might not be the ones most in need of pre-ETS and so be better served by other VR services focused on career advancement or higher education.
4.2.2Program features to promote pre-ETS and VR service use and eliminate differences across subgroups
LLC highlights potential ways to better engage high school students. Many control group youth did not use services from DVR despite their eligibility and interest, whereas treatment group youth followed a different path. The fact that youth in the treatment group used more services suggests that the program offered services in such a way as to interest youth and thus lead to higher VR engagement, particularly with youth applying for and using VR services. In contrast to usual VR services, LLC had dedicated staff for the program with smaller caseloads than those of DVR transition counselors and employment specialists offering usual services (Martin et al., 2021). It also emphasized employment and work-based learning, which is appealing to many high school students. These aspects of the program, plus the offer of specific services such as postsecondary education and assistive technology, might have led treatment group youth to increase their engagement with DVR. Although this resource-intensive approach might not be cost-efficient for usual transition programming, VR administrators might consider how staffing and service offerings can improve youth engagement.
4.2.3The relationship between VR services and better outcomes
The descriptive results shown in this article for specific types of VR involvement reveal a range of outcomes 24 months after enrollment into LLC without a consistent pattern. The receipt of more services was not indicative of better outcomes, and receiving fewer (or no) services did not necessarily reflect poorer outcomes.
However, youth who used WBLEs had higher rates of any earnings across eight quarters as well as more quarters with earnings, relative to youth using the other pre-ETS. The finding was consistent for both treatment and control group members. This pattern is not causal, as youth who engaged in WBLEs could have had characteristics that would have led them to paid employment in the absence of their use of WBLEs, but it is consistent with the wide body of evidence that youth’s work experiences lead to paid work (such as the review by Frentzel et al. (2021)).
The inconsistent evidence on outcomes for this study is in-line with the mixed results on the effectiveness of VR services from other studies. A study of Oklahoma youth (Osmani et al., 2022) found no relationship between participation in programs that offered work experiences and VR case closure, relative to youth who used typical VR services. Other studies, however, identify positive relationships between specific work-related VR services (such as job search and job placement services) and VR case closure (Alsaman et al., 2016; Awsumb et al., 2020) and between successful VR case closure and earnings six years after case closure (Martin et al., 2020).
The mixed evidence might reflect the idiosyncratic nature of services and youths’ specific needs. Findings from the LLC impact evaluation (Sevak et al., 2021) showed that, in addition to increased service use broadly, LLC youth had higher postsecondary education enrollment and, for the later cohort of enrollees, greater earnings. Though these findings from the LLC evaluation indicate a positive relationship between VR services and intended outcomes, more evidence is required to observe education and employment after youth leave high school, as most youth were still in high school two years after enrollment.
5Conclusion
This study provides evidence from one state VR agency on the characteristics of high school youth who used VR services, including pre-ETS. Most youth, under usual conditions, were relatively light users of pre-ETS, and most did not seek VR services through an individualized plan for employment. When youth had access to a transition program that emphasized WBLEs, their engagement with the VR agency increased. Differences in the characteristics of youth using pre-ETS and VR services suggest that some youth might be more or less interested in what VR agencies offer. VR agency administrators and others interested in youth transition might seek ways to understand which youth are and are not using VR services as a means to improve service access and use across groups. Vermont’s experience also shows that agencies can successfully connect youth with specific services and programs.
Acknowledgments
The authors are grateful for the input of three anonymous reviewers, along with the contributions of Richard Tulikangas, Brian Guy, Tara Howe, and Alice Porter from the Vermont Division of Vocational Rehabilitation, who provided data and comments on earlier drafts, and Gina Livermore, Donovan Griffin, and Sharon Clark of Mathematica.
Conflict of interest
The authors have no conflict of interest to report.
Ethics statement
The Linking Learning to Careers project and its evaluation were approved by the Vermont Agency of Human Services Institutional Review Board (AHS-IRB-# 248).
Funding
Funding for this study was provided by the Vermont Division of Vocational Rehabilitation under a grant (H421B160002) from the U.S. Department of Education. The contents do not necessarily represent the policy of the U.S. Department of Education and do not imply endorsement by the federal government (Authority: 20 U.S.C. 1221e-3 and 3474). The views and opinions expressed here are those of the authors, who are solely responsible for any errors.
Informed consent
Participants in the Linking Learning to Careers demonstration provided written informed consent to participate in the study.
References
1 | Alsaman, M. A. , Lee, C.-L. ((2017) ). Employment outcomes of youth with disabilities in vocational rehabilitation: A multilevel analysis of RSA-911 Data. Rehabilitation Counseling Bulletin, 60: (2), 98–107. https://doi.org/10.1177/00343552166323 |
2 | Awsumb, J. M. , Balcazar, F. E. , Keel J. M. ((2020) ). Youth with disabilities: Are vocational rehabilitation services improving employment outcomes? Journal of Vocational Rehabilitation, 52: (1), 61–73. DOI: 10.3233/JVR-191060. |
3 | Bureau of Labor Statistics. (2021). 17.9 percent of people with a disability employed in 2020. The Economics Daily. https://www.bls.gov/opub/ted/2021/17-9-percent-of-people-with-a-disability-employed-in-2020.htm |
4 | Connor, A. , Tilman, A. , Isaacs, M. , Sung, C. ((2021) ). Parental and professional perspectives on comprehensive post-secondary transition needs of youth with disabilities: An interagency case study. Journal of Vocational Rehabilitation, 55: (1), 1–13. DOI: 10.3233/JVR-211142. |
5 | Fabian, E. , Neubert, D. , Luecking, R. (2018). State VR agency counselors’ perceptions of their role in implementing transition services under WIOA. TransCen. https://www.transcen.org/wp-content/uploads/2020/07/10.27.2018 Study4 Res earchBrief StateVRAgencyCounselorsPerceptions.pdf |
6 | Frentzel, E. , Geyman, Z. , Rasmussen, J. , Nye, C. , Murphy, K. M. ((2021) ). Pre-employment transition services for students with disabilities: A scoping review. Journal of Vocational Rehabilitation, 54: (2), 103–116. DOI: 10.3233/JVR-201123. |
7 | Honeycutt, T. , Martin, F. , Wittenburg D. ((2017) ). Transitions and vocational rehabilitation success: Tracking outcomes for different types of youth. Journal of Vocational Rehabilitation, 46: (2), 137–148. DOI: 10.3233/JVR-160850. |
8 | Honeycutt, T. , Sevak, P. , Rizzuto, A. (2019). Provision of pre-employment transition services: vocational rehabilitation agency variation in the first program year of reporting. Mathematica. https://www.mathematica.org/publications/provision-of-pre-employment-transition-services-vocational-rehabilitation-agency-variation |
9 | Martin, F. , Feeney, K. , Honeycutt, T. , Sevak, P. (2021). Vermont’s Linking Learning to Careers Demonstration: Final implementation evaluation report. Mathematica. https://www.mathematica.org/publications/vermonts-linking-learning-to-careers-demonstration-final-implementation-evaluation-report |
10 | Martin, F. H. , Honeycutt, T. C. , Hemmeter, J. ((2020) ). Six-year earnings and disability benefit outcomes of youth vocational rehabilitation applicants. Journal of Vocational Rehabilitation, 52: (1), 75–88. DOI: 10.3233/JVR-191061. |
11 | National Center for Education Statistics. (2021). Digest of Education Statistics, 2019, Chapter 2. https://nces.ed.gov/programs/digest/d19/ch2.asp |
12 | Oertle, K. M. , Plotner, A. J. , Trach, J. S. ((2013) ). Rehabilitation professionals’ expectations for transition and interagency collaboration. Journal of Rehabilitation, 79: (3), 25–35. |
13 | Oertle, K. M. , Bobroff, S. , Sax, C. L. ((2021) ). Organizational policies and personnel factors that are incentives for and challenges to collaboration as identified by statewide transition supervisors. Journal of Disability Policy Studies, 32: (1), 36–50. https://doi.org/10.1177/1044207320943544 |
14 | Office of Special Education and Rehabilitative Services. (2020). A transition guide to postsecondary education and employment for students and youth with disabilities. https://sites.ed.gov/idea/files/postsecondary-transitionguide-august-2020.pdf |
15 | Osmani, K. J. , DeBacker, T. K. , Crowson, H. M. , Williams-Diehm, K. L. ((2022) ). Effects of work experiences on the post-school employment outcomes of youth with disabilities: A study of one state vocational rehabilitation agency’s transition program. Journal of Vocational Rehabilitation, 56: (2), 177–191. DOI: 10.3233/JVR-221181. |
16 | Rehabilitation Services Administration (RSA). (2020). The state vocational rehabilitation services program before and after enactment of the Workforce Innovation and Opportunity Act in 2014. https://www2.ed.gov/about/offices/list/osers/rsa/wioa/state-of-vr-program-after-wioa.pdf |
17 | Rehabilitation Services Administration (RSA). (2021). ETA-9159 Annual Report PY2020 National. https://rsa.ed.gov/wioa-resources/wioa-annual-reports |
18 | Sevak, P. , Feeney, K. , Honeycutt, T. , Peterson, P. (2021). Vermont’s Linking Learning to Careers Demonstration: Impacts 24 months after enrollment. Mathematica. https://www.mathematica.org/publications/linking-learning-to-careers-demonstration-impacts-24-months-after-enrollment |
19 | Social Security Administration (SSA). (2021). What you need to know about your Supplemental Security Income (SSI) when you turn 18. https://www.ssa.gov/pubs/EN-05-11005.pdf |
20 | Taylor, J. P. , Whittenburg, H. N. , Rooney-Kron, M. , Gokita, T. , Lau, S. J. , Thoma, C. A. , Scott, L. A. ((2021) ). Implementation of pre-employment transition services: A content analysis of Workforce Innovation and Opportunity Act state plans. Career Development and Transition for Exceptional Individuals, 45: (2), 60–70. https://doi.org/10.1177/2165143421993027 |
21 | Vermont Agency of Education. (2016). Child count report by supervisory unions – 2015. https://education.vermont.gov/documents/child-count-report-by-su-2015 |
22 | Yin, M. , Pathak, A. , Lin, D. , Dizdari, N. (2021). Identifying Racial Differences in Vocational Rehabilitation Services. Rehabilitation Counseling Bulletin, online first. https://doi.org/10.1177/00343552211048218 |


