
The resiliency of employees with intellectual and developmental disabilities during the COVID-19 pandemic and economic shutdown: A retrospective review of employment files
Abstract
BACKGROUND:
While the health and economic impact of COVID-19 is becoming better known among the general population, little is known about the impact of the pandemic and recession on employees with intellectual and developmental disability (IDD).
PURPOSE:
The purpose of this paper is to examine the impact of the COVID-19 pandemic and subsequent recession on individuals with IDD.
METHODS:
The present paper described the impact of COVID-19 pandemic and recession on the employment status, hours worked, and hourly wage of 156 individuals with IDD who work in competitive integrated employment for February to July 2020. These findings are compared with a similar group receiving services from the same agency in February to July 2019.
RESULTS:
Findings indicate that these employees were not able to work from home and experienced furlough or lay off instead. Further, the number of hours worked monthly was also significantly affected. Wages were not affected by the pandemic and recession. Employees in some industries, notably health care and distribution and supplies, were less affected than employees in other industries like food service, retail, and entertainment. Finally, and surprisingly, black, indigenous, and other people of color worked more hours monthly than their white peers in both 2019 and 2020.
CONCLUSION:
Implications of these findings are discussed.
1Introduction
The first documented case of COVID-19 in the United States was identified in Snohomish County, Washington on January 19, 2020. As the disease continued to spread internationally, the World Health Organization declared the infection as a global pandemic on March 11, 2020 (American Journal of Managed Care, 2020). By mid-March of 2020, there was widespread community transmission in the United States and many governors required the temporary cessation of all but essential businesses (Holshue et al., 2020; Schuchat, 2020). Because of this temporary shutdown of non-essential businesses in an effort to stem transmission of the virus, workers across all employment sectors experienced significant changes in their work schedules and lives (Long et al., 2020). According to Bick and colleagues (2020), by May, 2020, 35.2% of the United States workforce worked entirely from home. On June 8, 2020, the effects of the COVID-19 pandemic and subsequent economic shutdown resulted in the National Bureau of Economic Research officially declaring the United States economy in recession (2020). In addition to the health and economic impacts, the COVID-19 crisis has also had differential impact on various sectors of the population. Specifically, both the health and economic harms caused by the crisis have differentially impacted Black, Indigenous and People of Color (BIPOC) more so than white people (Gravlee, 2020; Long et al., 2020). While analysis of large employment data sets has been used to measure the effect of the pandemic and recession on the general workforce, little is known about the effect of these events on individuals with intellectual and developmental disabilities, especially those working in competitive integrated employment (CIE; Courtenay & Perera, 2020; Turk et al., 2020). The purpose of this paper is to explore the impact of the COVID-19 pandemic and subsequent recession on individuals with IDD who were employed in competitive integrated employment through a retrospective review of service data provided by a research university-based employment services organization (ESO) at Virginia Commonwealth University for people with IDD.
1.1Literature review
The employment rate of individuals with IDD remains discouragingly low despite federal legislation and state initiatives specifically designed to encourage CIE over sheltered employment and disability specific non-work day centers and sheltered workplaces have proven to be ineffective at increasing the rate of CIE (Wehman et al., 2018). To wit, the Workforce Innovation and Opportunity Act (WIOA) of 2014 which was enacted to increase access to CIE, high quality training, and job support services (U.S. Department of Labor, 2018; WIOA, 2014). Further, the Federal Medicaid Waiver Programs enable states to allocate funding toward employment intervention programs targeting individuals with IDD (Centers for Medicare and Medicaid Services, 2016). Despite these initiatives, individuals with IDD are still not gaining access to employment. Winsor et al., (2018) reported that the number of individuals with IDD accessing CIE has actually decreased from a high of 25% in 2001 to 18.8% in 2016. For individuals with IDD who attain CIE, careers remain elusive (Heyman et al., 2009). This is particularly true for BIPOC youth or other minorities with IDD who are also disadvantaged by minority and/or poverty status in addition to disability (Dutta et al., 2019).
There are evidenced based practices that have proven to be effective in supporting individuals with IDD to obtain and maintain CIE. One such evidence-based intervention is supported employment (SE). This practice seeks to assist individuals with the most significant disabilities to locate and maintain long-term, meaningful, competitive integrated employment (Schall et al., 2020). The supported employment model is a four-phase approach. Of particular relevance to this paper are the two phases of supports provided on the job site. They include job site training (JST) and long-term supports services (LTSS; Schall, et al., 2015). Another pathway to securing CIE is through customized employment (CE). CE supports individuals with IDD who may not have all the necessary skills required for an existing job description, so a new position is negotiated to fit the needs of the company and the individual job seeker (Brooke et al., 2018). The Workforce Innovation and Opportunity Act of 2014 included CE in the definition of Supported Employment, and federally defined CE as “based on individual determination of the strengths, needs and interests of the person with a disability, and is designed to meet the specific needs of the employer.” Both SE and CE continue to provide support to the new employee with a disability through JST and LTSS to ensure job satisfaction and career advancement. The goal with both SE and CE is establishing a successful and positive relationship between the employer and the new employee with IDD. The employment specialist (ES) maintains a relationship with both that is synergetic, collaborative, and benefits all parties involved.
State vocational rehabilitation agencies fund both SE and CE through the WIOA (WIOA, 2014). In order to qualify for either SE or CE, the job seeker with a disability must require intensive services as these services are designed for those with the most significant disabilities. While these practices are most helpful to individuals with IDD seeking CIE, their funding structure provides a view of the impact of the COVID-19 crisis on the employment of individuals with IDD. Namely, ES who provide services are responsible for reporting the time they provided supports, the phase of supports they are providing, and the workplace, hours worked, and wage of the individual they support for each month services are provided.
The purpose of this paper is to describe how CIE was impacted for employees with IDD during the COVID-19 pandemic and recession using data collected by ES who provided SE or CE. The overarching research question was; how did the COVID-19 pandemic and recession impact the employment of employees with IDD?
This study was guided by the following sub research questions:
1. What was the monthly employment status, hours worked weekly, and hourly wage of employees with IDD in CIE for the 6-month period from February to July 2020 compared to February to July 2019 for a similar group of individuals with IDD receiving SE services from the same agency?
2. Did the impact of the COVID pandemic and recession vary by the individual characteristics of age, gender, race, industry, or type of disability?
2Method
2.1Design
In order to address the research questions posed by this study, the researchers conducted a retrospective review of records of individuals with IDD who were receiving on-the-job supports through JST or LTSS. All services were provided by Business Connections employment services organization (ESO) based at Virginia Commonwealth University that exclusively works with individuals with disabilities seeking CIE. While this is a university-based ESO, referrals for services come from the general population of individuals seeking VR services from the community. All services are funded through the state vocational rehabilitation agency. In order to track the impact of the COVID-19 pandemic and subsequent recession, the authors compared the month-by-month employment status of individuals with IDD employed in CIE and receiving services from the ESO from Feb. to July 2019 and Feb. to July 2020. Inclusion criteria for this records review was, 1) presence of an intellectual or developmental disability, 2) full or part time employment in CIE on Feb. 28, 2019 or 2020, 3) receiving either JST, or LTSS from the ESO. The researchers used an honest broker system and did not see the records or have access to any identifying information. The university IRB determined that this study was ‘not human research’ due to the lack of human subject interaction.
2.2Data collection and verification
The researchers used existing records of employment services to document disability, industry where the individual was employed, average weekly hours worked, hourly wage, gender, age, race, and employment status at the end of each month during the two periods reviewed (February–July 2019 and February–July 2020). To further clarify employment status and input missing data, the honest brokers contacted individual employment specialists to confirm and clarify findings. Finally, as the data is collected prospectively for the purposes of billing for services, and the data set was reviewed and updated through individual interviews between the honest brokers and employment specialists, the researchers determined the data set to be complete and accurate. The brokers, who are responsible for collecting such data for billing purposes, transferred data in de-identified aggregate form for analysis.
3Results
3.1Demographic description
Using the three inclusion criteria for the two time periods selected, resulted in the identification of 156 individuals with IDD who were employed in CIE while receiving JST or LTSS on February 28, 2019 and, again, 156 with IDD who were employed in CIE while receiving JST or LTSS on February 28, 2020. Across the two time periods reviewed, 133 individuals who received JST or LTSS services in 2019 were still receiving services in 2020, while 23 individuals were unique to the 2019 and 2020 records review. All participants represented in these records received either SE or CE. This is an indication that all of the records reviewed represented individuals with significant impact from their disability. Table 1 presents the demographic descriptions of these samples by age, gender, race, and disability for each set of records reviewed.
Table 1
Demographic characteristics of individuals
| Feb. – July 2019 | Feb. – July 2020 | |
| (n = 156) | (n = 156) | |
| m (sd) or frequency (%) | m (sd) or frequency (%) | |
| Age | 26.9 (6.151) | 25.97 (4.979) |
| Gender | ||
| Male | 110 (70.5%) | 110 (70.5%) |
| Female | 46 (29.5%) | 46 (29.5%) |
| Race | ||
| Black | 63 (40.4%) | 64 (41%) |
| Asian-American | 5 (3.2%) | 5 (3.2%) |
| Hispanic | 3 (1.9%) | 3 (1.9%) |
| BIPOC (Total of Black, Hispanic, and Asian American) | 71 (45.5%) | 72 (46.2%) |
| Caucasian | 85 (54.5%) | 84 (53.8%) |
| Primary disability | ||
| Autism | 89 (57.1%) | 94 (60.3%) |
| Intellectual disability | 43 (27.6%) | 42 (26.9%) |
| Learning disability | 7 (4.5% | 7 (4.5%) |
| Cerebral palsy | 2 (1.3%) | 1 (0.6%) |
| Traumatic brain injury | 3 (6.4%) | 1 (0.6%) |
| Hearing impairment | 2 (1.3%) | 1 (0.6%) |
| Other | 10 (6.4%) | 10 (6.4%) |
| Education prior to employment | ||
| Some college | 17 (10.9%) | 15 (9.6%) |
| College diploma | 1 (0.6%) | 2 (5.8) |
| Some high school | 3 (1.9%) | 2 (1.3%) |
| Finished high school with diploma or IEP certificate | 125 (80.1%) | 128 (82.1%) |
| Not reported | 10 (6.4%) | 9 (5.8%) |
| Prior employment experience | ||
| None | 110 (70.5%) | 111 (71.2%) |
| Short or intermittent | 33 (21.2%) | 34 (21.8%) |
| Long or extensive | 12 (7.7%) | 10 (6.4%) |
| Not reported | 1 (0.6%) | 1 (0.6%) |
Given that 133 of the 156 individuals in each time period were the same, it is not surprising to find that there were no significant differences between the 2019 and 2020 cohort with respect to age, gender, race, disability, prior education and prior employment experience. For both time periods, these individuals were in their mid-twenties, overwhelmingly male, with just less than half (45.5% in 2019 and 46.2% in 2020) being BIPOC, and just over half (54.5% in 2019 and 53.8% in 2020) being white. Autism was the most common primary disability reported following by intellectual disability. These two disabilities comprised 84.7% of 2019 and 87.2% of 2020 participants. The majority of these individuals completed high school, but the type of diploma earned was not reported by the ESO. Finally, the overwhelming majority had no prior employment history. Nevertheless, these individuals had to present with severe disabilities in order to qualify for SE or CE services.
3.2Baseline employment description
As of February 28, 2019, the individuals with IDD earned a mean wage of $9.88 per hour and worked a mean of 82.29 hours a month or approximately 20.57 hours weekly. Prior to the pandemic, on February 28, 2020 the individuals with IDD receiving services in that group earned a mean wage of $10.21 per hour and worked a mean of 85.79 hours a month or approximately 21.45 hours per week. The majority of these individuals at both time periods (2019 = 61.56%; 2020 = 64.73%) received disability benefits including Supplemental Security Income (40 [25.64%] in 2019, 44 [28.2%] in 2020), Social Security Disability Insurance (14 [9%] in 2019 and 13 [8.33%] in 2020), or two or more disability specific benefits (42 [26.92%] in 2019 and 44 28.2%] in 2020).
The majority of both of these groups worked in the following industries:
• Health care (2019 = 47/30.1%; 2020 = 47/30.1%)
• Food service (2019 = 30/19.2%; 2020 = 33/21.2%)
• Retail (2019 = 24/15.4%; 2020 = 22/14.1%)
• Hospitality (2019 = 11/7.1%; 2020 = 9/5.8%)
• These industries represented 71.8% (2019) and 71.2% (2020) of all jobs represented. The other industries in which individuals worked included academic/education, manufacturer/distributor/supplier, entertainment, government, IT/telecommunications, service provider, and transportation.
3.3Research question 1: Employment status by month Feb. to July in 2019 and 2020
In order to assess the impact of the COVID-19 pandemic and subsequent recession, we reviewed the hourly wage, hours worked per month and employment status for the 156 individuals with IDD employed in CIE on February 28, 2020 and again on March 31, April 30, May 31, June, 30, and July 31, 2020. To confirm changes in employment were due to the COVID crisis, we compared that data to the same time period in 2019. We used the following terms to identify an employee’s employment status:
Working on-site: In order to complete their job, the employee with IDD went to work at the employer’s workplace
COVID furlough: The employee was not working but would return to their job once the shutdown was lifted.
Seasonal furlough: The employee worked in a public school or public school supplier where there was a known regular furlough between June and August.
Laid off: The employee no longer had a job with the employer.
Ill/quarantined: The employee took sick leave more than one week, or was required to stay home in quarantine because of exposure to COVID-19.
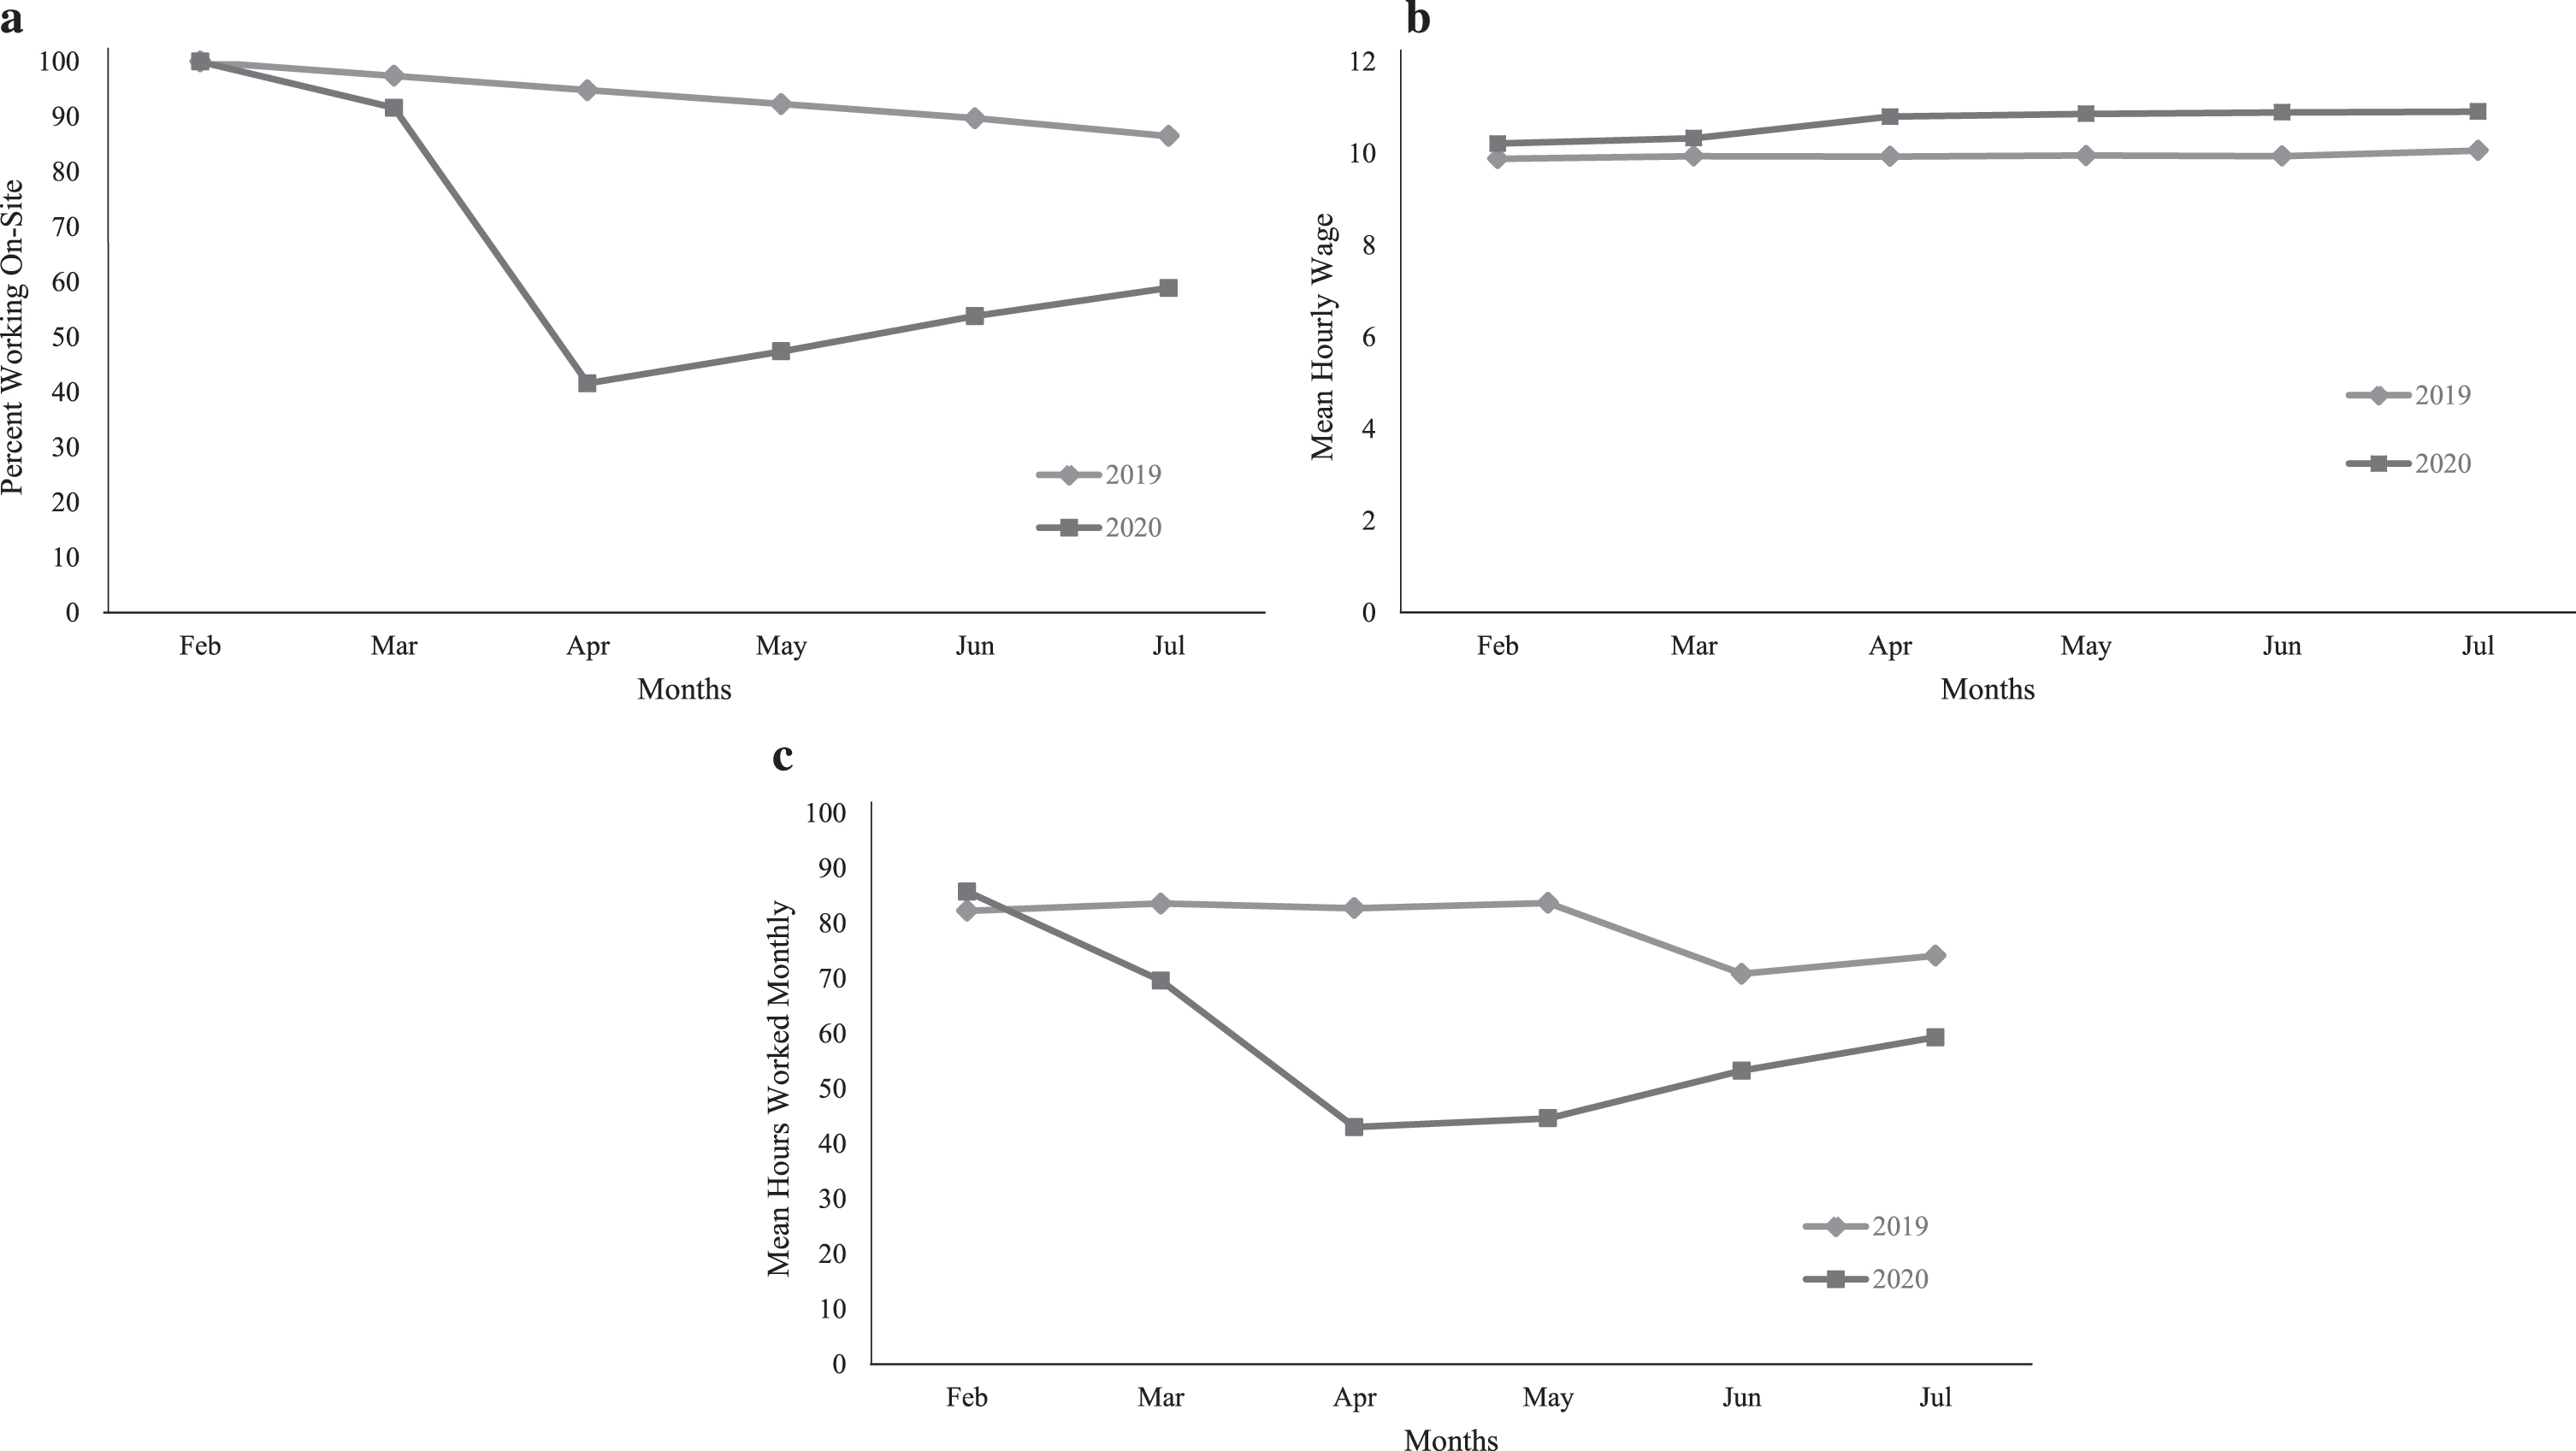
The frequency and percentage for each condition month-by-month for 2019 and 2020 are presented in Table 2. The month-by-month comparison of percentage working on site, mean hourly wage, and mean hours worked are presented in Fig. 1a, b, and c.
Table 2
Work status of employees with IDD by month: Frequency (percentage)
| Working on-site | COVID furlough | Regular seasonal furlough | Laid off | Ill/quarantine | ||||||
| 2019 | 2020 | 2019 | 2020 | 2019 | 2020 | 2019 | 2020 | 2019 | 2020 | |
| Feb | 156 (100%) | 156 (100%) | 0 | 0 | 0 | 0 | 0 | 0 | 0 | 0 |
| Mar | 152 (97.4%) | 143 (91.6%) | 0 | 9 (5.7%) | 0 | 0 | 4 (2.6%) | 3 (1.9%) | 0 | 0 |
| Apr | 148 (94.8%) | 65 (41.6%) | 0 | 83 (53.2%) | 0 | 0 | 8 (5.1%) | 6 (3.8%) | 0 | 1 (0.6%) |
| May | 144 (92.3%) | 74 (47.4%) | 0 | 75 (48%) | 1 (0.6%) | 0 | 11 (7%) | 6 (3.8%) | 0 | 0 |
| Jun | 140 (89.7%) | 84 (53.8%) | 0 | 54 (34.6%) | 5 (3.2%) | 9 (5.8%) | 11 (7%) | 6 (3.8) | 0 | 2 (1.3%) |
| Jul | 135 (86.5%) | 92 (58.9%) | 0 | 45 (28.8%) | 5 (3.2%) | 9 (5.8%) | 11 (7%) | 8 (5.1%) | 0 | 1 (0.6%) |
Fig.1
a. Month-by-month comparison of percentage of individuals working on site in 2019 and 2020. b. Month-by-month comparison of hourly wage for employed individuals with IDD in 2019 and 2020. c. Month-by-month comparison of hours worked monthly in 2019 and 2020.
3.4Illness
There was very little illness noted in this group of employees with only four of the 156 taking extended time for illness or quarantine. Two of the four individuals were out for medical procedures unrelated to COVID. Both returned once cleared by their doctor. One individual was sick with COVID symptoms but did not have access to a COVID test at the time of the illness. They returned to work once the symptoms resolved and their doctor cleared them. The fourth individual was required to quarantine due to exposure to a COVID-19 positive co-worker, but never developed symptoms and returned to work after 14 days of quarantine and a negative COVID test.
3.5Work status
Unlike the 35.2% of the United States workforce that worked entirely from home, none of these employees with IDD were afforded the opportunity to work from home (Bick et al., 2020). Instead, most employees who were unable to work due to business closure were furloughed. The month of highest impact was April 2020 where only 41.6% of employees worked on site in essential jobs. Each month following April showed an increase in the percentage of individuals working on site. By July, however, there were still substantially more employees furloughed, laid off, or quarantined due to COVID-19 (34.5%), versus those who were furloughed due to regular seasonal employment in 2020 (5.1%) or compared to the employment statuses for the same time period in 2019. Some of those who were furloughed in 2020 due to COVID-19 elected that option due to their own health concerns. While only one employee with IDD elected to take leave in March due to the pandemic (0.6%), this number remained steady, but relatively low for April through July with a range of 8 (5.13%) to 11 (7.05%) employees with IDD electing to refrain from working on-site during those months of the pandemic. A Pearson Chi-Square was completed to compare working on site versus not working between the records reviewed from the 2019 and 2020 periods. Overall, the differences between the 2019 and 2020 groups were significantly different based upon their work status for all months reviewed. Specifically, we found significant differences in March (χ2 = 4.271, df = 1, p = 0.034), April (χ2 = 100.953, df = 1, p = 0.000), May (χ2 = 73.688, df = 1, p = 0.000), June (χ2 = 48.767, df = 1, p = 0.000), and July (χ2 = 30.422, df = 1, p = 0.000) indicating that COVID-19 had a very significant impact on these individual’s employment status for all months studied.
3.6Wages
The COVID-19 crisis did not appear to have an effect on the wages of those who retained their positions. In fact, the mean hourly wage of these workers rose steadily from $10.21 per hour to $10.91 per hour from February to July 2020. This is similar to the pattern of wage growth observed in 2019 when the mean hourly wage increased from $9.88 per hour in February 2019 to $10.06 per hour in July 2019.
3.7Hours worked monthly
Nevertheless, it appears that the income for these individuals was impacted by the number of hours available to work. There was a significant impact on hours worked per month. Specifically, the drop in hours worked per month is evident with a 19.2% drop in March with the onset of mandated shutdowns of non-essential businesses. This loss of hours continued into April when the hours worked monthly was 49.84% of the hours worked in February. Beginning in May, employees increased the hours worked monthly through July with modest increases each month (3.69% from April to May, 19.64% from May to June and 11.36% increase from June to July). Even with these modest increases in hours per month, the mean hours worked per month in July remained 30.87% below the February mean hours worked per month. Independent t-tests indicated these differences were significant for all months compared as follows: March (t = 2.558, df = 309, p = 0.11), April (t = 6.567, df = 298, p = 0.000), May (t = 6.429, df = 300, p = 0.000), June (t = 2.936, df = 290, p = 0.004), and July (t = 2.507, df = 299, p = 0.013).
3.8Displaced worker benefits
There were two sources of paycheck support for workers during the period explored. They were extended unemployment insurance and the Paycheck Protection Program (PPP) provided through the CARES Act (Coronavirus Aid, Relief, and Economic Security [CARES] Act, 2020). Table 3 presents the number of furloughed and laid off employees who accessed compensation while unemployed via either program. While over half had access to some compensation while furloughed or laid off in March and April of 2020, access to these programs drops dramatically through May, June, and July. This provides a cause for concern for these workers as the CARES Act unemployment extension and PPP loans have closed.
Table 3
Accessing unemployment or Paycheck Protection Plan compensation frequency (percentage)
| Month | Furloughed/laid off | Received unemployment | Received paycheck through PPP | No compensation |
| March 2020 | 5 | 1 (20%) | 2 (40%) | 2 (40%) |
| April 2020 | 59 | 12 (20.3%) | 18 (30.5%) | 2 (49.1%) |
| May 2020 | 59 | 10 (16.9%) | 11 (18.6%) | 38 (64.4%) |
| June 2020 | 53 | 11 (20.8%) | 8 (15.1%) | 34 (64.2%) |
| July 2020 | 43 | 10 (23.2%) | 3 (7%) | 30 (69.8%) |
3.9Research question 2: Variability of impact of the COVID-19 pandemic by individual characteristics
The researchers analyzed four individual independent variables to determine their impact on the two dependent work variables most affected by COVID; work status and hours worked per month. The dependent variables analyzed were age, gender, primary disability, and race. Because of the low number of Hispanic and Asian American employees, researchers recoded the race variable as a dichotomous variable including white and BIPOC. The research team used the independent t-test analysis to identify the degree to which work status and hours worked was impacted by age, gender, primary disability, and race. The repeated independent t-tests were performed for the months affected by COVID-19, specifically March–July, 2020 for both work status and hours worked.
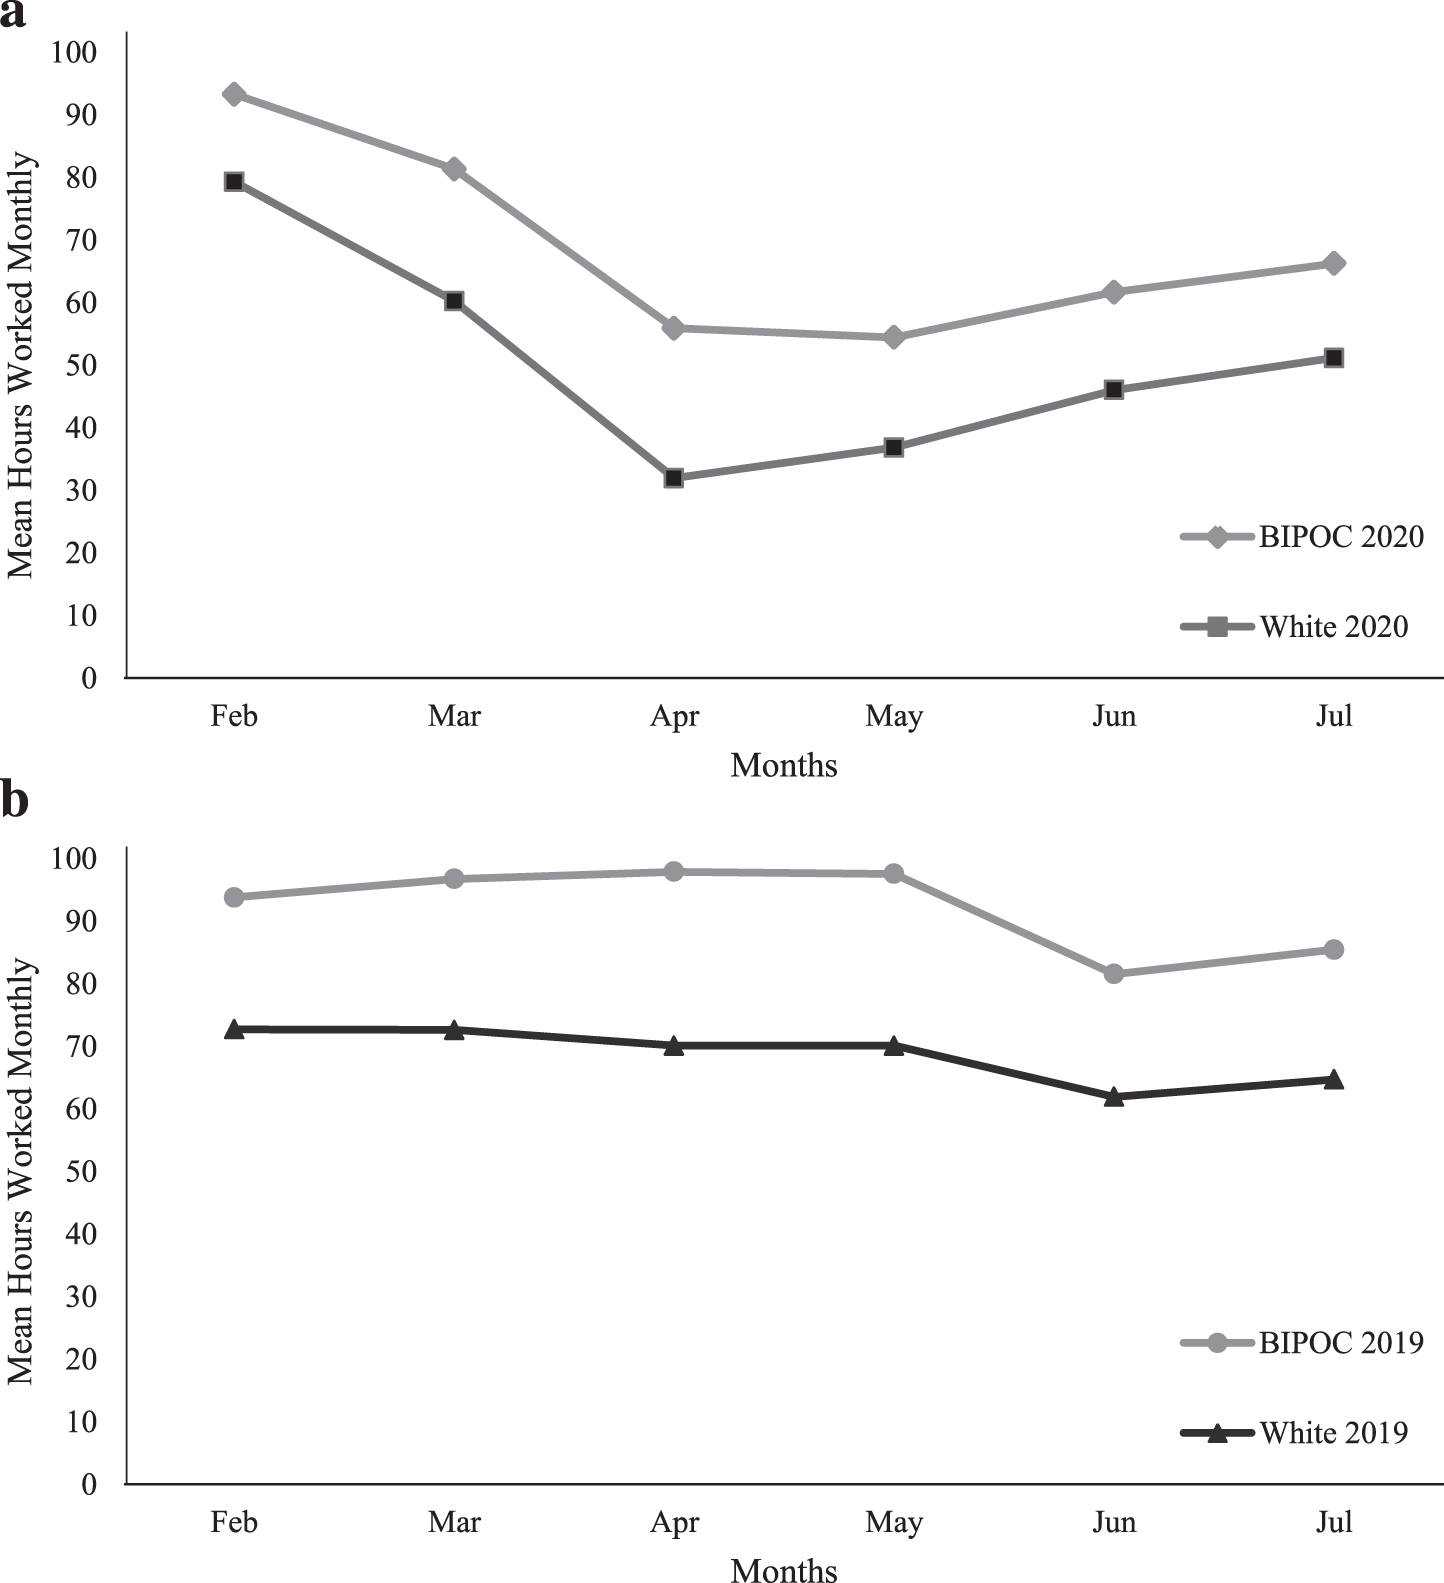
None of the independent t-tests were significant when comparing the dependent variables to working status at any time point. Thus, age, gender, race, nor primary disability appeared to have an impact on working status. The same was true of hours worked with one exception. There was a significant impact on hours worked by race in February, March, April, and a trend toward significance in May. This interesting finding prompted us to consider if this difference also existed in 2019. Thus, we completed the same analysis on the hours worked in 2019 and found similar significant differences with BIPOC individuals with IDD working significantly more hours per month than their white peers for Feb. – July 2019. Table 4 presents the means and p-values for these comparisons for 2019 and 2020 when evaluating the effect of race on hours worked using an independent t-test. Figure 2a and b presents the mean hours worked per month in 2020 and 2019 by BIPOC and White individuals.
Table 4
Comparison of hours worked by race
| Month | Race | Mean hours worked 2020 | 2-tailed p-value | Mean hours worked 2019 | 2-tailed p-value |
| Feb | |||||
| BIPOC | 93.32 | 93.77 | |||
| White | 79.34 | 0.029 | 72.71 | 0.001 | |
| Mar | |||||
| BIPOC | 81.37 | 96.72 | |||
| White | 60.26 | 0.008 | 72.62 | 0.000 | |
| Apr | |||||
| BIPOC | 55.93 | 97.89 | |||
| White | 31.97 | 0.013 | 70.11 | 0.000 | |
| May | |||||
| BIPOC | 54.47 | 97.55 | |||
| White | 36.83 | 0.057 | 72.12 | 0.001 | |
| Jun | |||||
| BIPOC | 61.70 | 81.54 | |||
| White | 46.03 | 0.104 | 61.91 | 0.007 | |
| Jul | |||||
| BIPOC | 66.26 | 85.45 | |||
| White | 51.16 | 0.127 | 64.72 | 0.012 |
Fig.2
a. Month-by-month comparison of hours worked monthly by BIPOC and white individuals in 2020. b. Month-by-month comparison of hours worked monthly by BIPOC and white individuals in 2019.
The final variable we considered was the differential impact of industry type on hours worked and work status. We analyzed this data with a Pearson Chi-Square procedure. In this case, there were significant differences between industry and work status in March (χ2 = 26.257, df = 12, p = 0.01), April (χ2 = 36.283, df = 12, p = 0.000), May (χ2 = 44.86, df = 12, p = 0.000), June (χ2 = 59.44, df = 12, p = 0.000), and July (χ2 = 43.61, df = 12, p = 0.000). It appears that individuals who worked in education, entertainment, food service, hospitality, and retail were more likely to be furloughed while individuals working in health care and distribution and supplies were less likely to be furloughed. This same difference was observed when analyzing the monthly hours worked by industry where individuals who worked in health care and distribution and supplies had higher mean hours worked over all other industries. This data was analyzed through the use of an analysis of variance and all p-values for each month of analysis were p = 0.000. The range of mean hours worked in distribution and supplies ranged from a high of 181.2 hours per month in April to a low of 160.8 hours per month in July. Likewise, the mean hours worked in health care ranged from a high mean of 87.97 hours per month in March to a low of 69.31 hours per month in April. By comparison, entertainment ranged from a high mean of 62 hours per month in March to a low of 0 hours per month in April while food service ranged from a high mean of 40 hours per month in March to a low of 12 hours per month in April. Likewise, retail saw similar losses in hours worked per month.
4Findings
It is clear that the COVID-19 pandemic and subsequent recession had a significant impact on these employees with IDD that appeared to differ from reported impacts to the general population during the same time. Specifically, the individuals with IDD included in this retrospective review were furloughed or laid off instead of having the opportunity to work from home. By June of 2020, however, more than half of them were working on-site again. Despite the dangers associated with public contact, only two of the 156 individuals in this sample were impacted directly by COVID-19 symptoms or exposure. While the COVID-19 health and economic crisis did not affect wages, there were large impacts on the hours worked by these employees significantly affecting their overall income. Some industries were spared the intensity of impact. Specifically, those working in health care and distribution and supplies were less affected than those working in other industries such as retail, entertainment, and food service.
Most surprising were the findings with respect to race. In this sample, BIPOC employees worked more hours monthly than their white peers in 2019 and 2020. This finding appears to diverge from reports of the general population where BIPOC workers are reported to be more disadvantaged than their white peers (Long et al., 2020). In prior research, we did not consider the impact of race on these employees. The current research only prompted this examination due to the differential impact of COVID-19 (Long et al., 2020). Yet there is clearly more research required in this area to understand this finding.
5Limitations
Given the quasi-experimental nature of this retrospective records review, there are important limitations to discuss with respect to the generalizability of these findings. Firstly, the individuals included in this records review were only those who self-selected services from the Business Connections ESO and who were eligible for supported employment or customized employment through the Virginia Department for Aging and Rehabilitative Services. As such, this group may have unique characteristics and not be representative of any other group. Such a selection bias may significantly limit external generalizability. We have attempted to provide a description of the characteristics of this sample so the reader may judge the degree to which their situation is similar. Secondly, it is also possible that there were unique aspects of response to COVID-19 that differentiated Virginia’s response to other states and locations. In fact, the lack of a national strategy and the degree to which states devised their own response may further decrease the generalizability of these findings. For example, it is possible that a state with less strict business shut down orders will have employees with IDD for whom COVID-19 had little impact. Thirdly, given that over 60% of these individuals received disability benefits may have affected their access to better health care and reduced their susceptibility to COVID-19 as an illness. Consequently, these findings may not be generalizable beyond the current context.
Nevertheless, the findings in this paper do provide an important view of the impact of the COVID-19 pandemic and subsequent recession on employees with IDD. Future research should consider many of the questions raised by the findings in this paper. For example, it is not clear what factors lead to the finding related to the significantly higher number of hours worked by BIPOC individuals with IDD versus their white peers with IDD. It is not clear if this was due to individual economic issues or perhaps a spurious correlation between industry and hours worked that was not apparent in this sample. Clearly, there is a need for further research regarding the intersectionality of race and disability in employment. Another question raised by these findings is related to the lack of these employees accessing unemployment insurance. It is unclear the degree to which these individuals with IDD were aware of their eligibility for unemployment benefits when furloughed or laid off. Finally, the differential impact of the recession on various industries highlights the need for more job development in unique fields and industries that may be “recession-proof.” Certainly, individuals with IDD would benefit from employment in such industries. Future research should explore pathways to employment for individuals with IDD into those industries.
6Discussion
Reflecting on the country’s reaction in the early days of COVID-19 it is clear that some employment sectors were hit much harder than others sectors due to the difficulty of social distancing. COVID-19 has certainly impacted the operation of most business with has resulted in businesses downsizing or completely closing their doors. Vavra (2020) has identified some of the hardest hit industries to include restaurants, bars, travel industry, entertainment, personal services, health clubs and manufacturing. Businesses that remained open, albeit with reduced staffing, started referring to their employees as essential workers. In fact, there were television advertisement encouraging viewers to thank these essential workers when they were buying their groceries, shopping for household supplies or using a medical facility. But who are these essential workers? Could individuals with disabilities possibly be included in this prestigious group?
There has been a great deal of research that associates individuals with disabilities with such negative stereotypes that it creates a societal image of pity or feeling sorry for individuals with disabilities (Payne, 2006). In fact, the entire premises of the medical model, once very prevalent in the fields of education and rehabilitation, assumes that individuals with disabilities are limited due to their disability and therefore limited in their ability to participate in society. This perspective has led to conscious and unconscious biases against individuals with disabilities and in some cases has resulted in social exclusion (Woodhams & Corby, 2003).
This research turns those old, outdated notions on their head. This paper documents the resilience of people with disabilities. As presented, some individuals with disabilities were furloughed, laid off or elected not to work, however most employees with IDD continued to work throughout the crisis and rapidly returned to work when given an opportunity. What is also most noteworthy among these data is that when comparing BIPOC and white employees with IDD, BIOPC employees worked significantly more hours than white employees with IDD. While we have discussed several ideas as to why this is might be true, we know that BIOPC employees with IDD are critical link to the economic well-being of their family. Clearly, these are not individuals that conjure stereotype type of limited ability rather we see all of these individuals as essential workers to the overall health of our country.
Conflict of interest
None to report.
Acknowledgments
The contents of the journal publication were developed under a grant from the National Institute on Disability, Independent Living, and Rehabilitation Research (NIDILRR grant number 90RTEM0003). NIDILRR is a Center within the Administration for Community Living (ACL), Department of Health and Human Services (HHS). The contents of this journal article do not necessarily represent the policy of NIDILRR, ACL, or HHS, and you should not assume endorsement by the Federal Government.
References
1 | The American Journal of Managed Care. (2020, July 3). A Timeline of COVID-19 Developments in 2020. https://www.ajmc.com/view/a-timeline-of-covid19-developments-in-2020. |
2 | Bick, A. , Blandin, A. , & Mertins, K. ((2020) ). Work from home after the COVID-19 outbreak. Centre for Economic Policy Research Discussion Paper Series. https://repec.cepr.org/repec/cpr/ceprdp/DP15000.pdf |
3 | The Coronavirus Aid, Relief, and Economic Security (CARES) Act of 2020, Pub.L. No.116-136 134 STAT. 281 (2020). https://www.congress.gov/116/plaws/publ136/PLAW-116publ136.pdf. |
4 | Courtenay, K. & Perera,B. ((2020) ) COVID-19 and people with indellectual disability: Impacts of a pandemic, Irish Journal of Psychological Medicine, 1–6. https://doi.org/10.1017/ipm.2020.45. |
5 | Gravlee C. C. ((2020) ) Systemic racism, chronic health inequities, and COVID-19: A syndemic in the making? American Journal of Human Biology, 32: (5), e23482. https://doi.org/10.1002/ajhb.23482. |
6 | Holshue, M. L. , DeBolt, C. , Lindquist, S. , Lofy,K. H. , Wiesman, H. , Bruce, H. , Spitters, C. , Ericson, E. , Wilkerson, S. , Tural, A. , Diaz, G. , Cohn, A. , Fox, L. , Patel, A. , Gerber, S. I. , Kim, L. , Tong, S. , Lu, X. , Lindstrom, S. , ... Pillai, S. K. ((2020) ) First case of 2019 novel coronavirus in the United States, New England Journal of Medicine, 382: (10), 929–936. https://doi.org/10.1056/NEJMoa2001191 |
7 | Individuals with Disabilities Education Improvement Act of 2004, Pub. L. No.108-446 118 STAT. 2647 (2004). https://www.congress.gov/108/plaws/publ446/PLAW-108publ446.pdf |
8 | Long,H. VanDam, A. Fowers,A. , & Shapiro,L. (2020, September 30). The COVID-19 recession is the most unequal in modern U.S. History. The Washington Post. https://www.washingtonpost.com/graphics/2020/business/coronavirus-recession-equality/?utm_campaign=wp_post_most&utm_medium=email&utm_source=newsletter&wpisrc=nl_most&carta-url=https%3A%2F%2Fs2.washingtonpost.com%2Fcar-ln-tr%2F2be1d14%2F5f75fcaa9d2fda0efb3ac48c%2F5eb42825ae7e8a43606ac1b1%2F8%2F72%2Fb59b7f7f6cd3c33d4f656e247e22b27b |
9 | Office of Disability Employment Policy. (n.d.). Integrated Employment. United States Department of Labor. Retrieved September 18, 2020, from https://www.dol.gov/agencies/odep/topics/integrated-employment |
10 | Schall, C. M. , Wehman, P. , Brooke, V. , Graham, C. , McDonough, J. , Brooke, A. , Ham, W. , Rounds, R. , Lau, S. , & Allen, J. ((2015) ) Employment interventions for individuals with ASD: The relative efficacy of supported employment with or without prior Project SEARCH training, Journal of Autism and Developmental Disorders, 45: , 3990–4001. http://doi.org/10.1007/s10803-015-2426-5 |
11 | Schuchat A. ((2020) ) Public Health Response to the Initiation and Spread of Pandemic COVID-19 in the United States, February 24-April 21, 2020, Morbidity and Mortality Weekly Report, 69: (18), 551–6. http://dx.doi.org/10.15585/mmwr.mm6918e2 |
12 | Turk, M. A. , Landes, S. D. , Formic, M. K. , & Goss, K. D. ((2020) ) Intellectual and developmental disability and COVID-19 case-fatality trends: TriNetX analysis, Disability and Health Journal, 13: (3), https://doi.org/10.1016/j.dhjo.2020.100942 |
13 | Vavra,J.(2020, March). Shutdown sectors represent large share of all US employment. Becker Frieman Institute for Economics at the University of Chicago. http://bfi.uchicago.edu/insight/blog/key-economics-facts-about-covid-19/#shutdown-sectors |
14 | Vocational Rehabilitation and Other Rehabilitation Services, 29 U.S. Code § 705. Definitions (n.d.). https://www.law.cornell.edu/uscode/text/29/705 |
15 | Wehman, P. , Taylor, J. , Brooke, V. , Avellone, L. , Whittenburg, H. , Ham, W. , Molinelli B.A. , & Carr, S. ((2018) ) Toward competitive employment for persons with intellectual and developmental disabilities: What progress have we made and where do we need to go, Research and Practice for Persons with Severe Disabilities, 43: (3), 131–144. https://doi.org/10.1177/1540796918777730 |
16 | Workforce Innovation and Opportunity Act of 2014, Pub. L. No.113-128 128 STAT. 1425 (2014). https://www.govinfo.gov/content/pkg/PLAW-113publ128/pdf/PLAW-113publ128.pdf |


