
Engaging SSI youth and families with ASPIRE services
Abstract
BACKGROUND:
Youth with disabilities receiving SSI experience economic disparities across the lifespan. PROMISE demonstrations strived to overcome these disparities by offering an array of services to improve long-term economic outcomes. Unfortunately, people living at or near poverty often focus energies on meeting basic needs rather than engaging in future-oriented activities.
OBJECTIVE:
This paper explores engagement with PROMISE services at one demonstration site (called ASPIRE) as a predictor of intermediary employment outcomes.
METHODS:
Study 1 uses youth survey data at enrollment and 36-months to compare intermediary outcomes between ASPIRE control and intervention youth (n = 1241). Study 2 uses participation data from case management records to construct a logistic regression to explore predictors of employment for ASPIRE intervention youth. Study 3 uses case management records about training participation to explore impacts of various ASPIRE engagement strategies.
RESULTS:
Study 1. There were few differences between intervention and control group participants in terms of self-determination, expectations, employment, and education 36-months after enrollment. Study 2. Intervention youth receiving higher rates of face-to-face case-management services (OR = 1.181) and career exploration activities in year 2 (OR = 1.516) and year 1 (OR = 1.426) become employed at higher rates in year 3, relative to those receiving fewer services. Study 3. Engagement with ASPIRE services was low across the project. A large incentive in the final 7-months of the project resulted in an exponential increase in financial literacy training participation.
CONCLUSIONS:
Future demonstrations focused on SSI youth with disabilities should utilize incentives early in the project to promote engagement with case-management services and future-oriented training and activities.
1Introduction
To receive Supplemental Security Income (SSI), youth under the age of 18 must meet income and resource requirements and have a disability expected to last more than 12 months that severely limits function. Parent or guardian resources also factor into youth resources for determining eligibility, such that most SSI youth live in families with incomes less than 200 percent of the poverty level (Committee to Evaluate the Supplemental Security Income Disability Program for Children with Mental Disorders et al., 2015).
The combination of limited resources and disability place SSI youth at a double disadvantage for positive education and employment outcomes. An Urban Institute study highlights disparities in adulthood based on childhood poverty status, where approximately 92.7% of “never poor” youth graduated from high school by age 20, compared to 63.5% of “persistently poor” (Ratcliffe, 2015). Similar outcomes are reported for youth with disabilities. Likewise, transition-aged youth receiving SSI experience worse downstream employment outcomes than non-SSI youth with disabilities in terms of employment outcomes, hours worked, and monthly incomes (Berry, 2000; Fabian, 2007; Honeycutt, Thompkins, Bardos, & Stern, 2017). Together, low rates of educational attainment, low rates of employment, and low wages over time (Bureau of Labor Statistics, n.d.) contribute to generational cycles of poverty.
Evidence suggests that limited opportunities to practice employment skills in high school (Benz, Linstrom, & Yovanoff, 2000), limited opportunities for developing autonomous decision making (Stewart et al., 2010), and low expectations for future work and independence (Papay & Bambara, 2014) undermine transition outcomes for youth with disabilities. To address this set of issues, the U.S. Department of Education (ED), Department of Health and Human Services (DHHS), Department of Labor (DOL), and Social Security Administration (SSA) jointly funded the Promoting Readiness of Minors in Supplemental Security Income (PROMISE) demonstration initiative. The goal of PROMISE was to test strategies for overcoming educational and employment disparities for SSI youth with disabilities and their families. Specifically, PROMISE demonstration sites were charged with delivering a consistent set of services to youth and their families to address significant personal and environmental barriers, including low family expectations regarding future employment and independence, low levels of self-actualization and motivation, confusion about benefits and financial options, and limited work exposure and experience (Honeycutt, Kauff, Mamun, Emenheiser, & Cobb, 2019).
In total, PROMISE funded six demonstration sites across the U.S. to study the effectiveness of these strategies. One of these sites consisted of a six state consortium including Arizona, Colorado, Montana, North Dakota, South Dakota, and Utah, called ASPIRE (Achieving Success by Promoting Readiness for Education and Employment). This paper builds on previously published results about the ASPIRE study in the areas of youth self-determination, parental expectations, and employment experiences, by extending analyses to include 36-month follow-up data (Ipsen, Kurth, McCormick, Hall, & Chambless, 2019). In addition, this paper explores strategies for increasing youth and family engagement in ASPIRE services through the use of non-monetary and monetary incentives.
1.1Predictors of positive transition outcomes
There are many predictors of post-school education and employment outcomes for transition students with disabilities. A systematic review of transition interventions reported that interagency collaboration, community experiences, paid employment/work experience, self-advocacy/self-determination training, transition programming, and work-study all had medium to large effect sizes in terms of employment outcomes (Test, et al., 2009). Other studies informed that paid and unpaid work during high school increased the odds of high school graduation, future employment, and post-secondary education or training for students with varied disabilities (Benz et al., 2000; Carter, Austin, & Trainor, 2012; Joshi, Bouck, & Maeda, 2012; Karpur, Clark, Caproni, & Sterner, 2005; Landmark, Ju, & Zhang, 2010; McDonnall & Crudden, n.d.; Wagner, Newman, Cameto, Garza, & Levine, 2005). Papay and Bambara (2014) reported that parental expectations for post-secondary employment significantly predicted employment and post-secondary education two-years after high school graduation and Daren, Gau, and Linstrom (2012) detailed that higher parent expectations were associated with higher levels of youth autonomy.
In alignment with these predictors, PROMISE demonstration sites were charged with providing a consistent set of services to intervention youth including case management, career and work-based learning experiences, benefits planning, self-determination training, parent transition training, and financial literacy training.
1.2Issues of engagement
People living in or near poverty often focus their energies on meeting basic needs around food, housing, and security (Pavetti & Stanley, 2016). Because of this, they are less likely to engage in opportunities that improve future conditions. Behavioral economics highlights this outcome in terms of finite cognitive capacity. In this framework, people can be classified into present- and future-orientations. If time and effort needs to be expended to meet basic needs in the present, this impacts the amount of energy left over for decision making focused on future outcomes (Anderson & Partch-Davies, 2018; Cooper, 2017).
Interventions aimed at improving outcomes for underserved groups need to consider cognitive orientation. If participants are largely oriented towards the present, they are less likely to engage in activities, behaviors, or training that offer more distal outcomes. In these situations, interventions need to be delivered in a manner that links the desired behavior with solving or addressing an immediate need (Pavetti & Stanley, 2016).
One strategy to increase motivation among present-oriented people is to use incentives to overcome participation costs. Incentives can come in many forms including direct and contingency payments, prizes, gift cards, non-monetary gifts, or swag. Incentives can also be used to reduce participation barriers, such as providing transportation, childcare, or coaching/support services. In general, incentives are most effective if they are immediately tied to the task (Dillman, Smyth, & Christian, 2014; Pavetti & Stanley, 2016). For instance, if an intervention includes a $20 payment for attending a one-hour workshop, a payment received at the workshop is usually more effective than a delayed payment sent in the mail. Additionally, larger incentives are needed for tasks that are longer in duration or have a longer time horizon associated with achieving an outcome (Pavetti & Stanley, 2016). In behavioral economics terms, both intensity and duration increase the opportunity costs of participation.
Research suggests a variety of intervention design principles for improving engagement in future-oriented activities. Programs should minimize monetary and non-monetary costs associated with participation; offer a high degree of flexibility to promote engagement; and help participants make the linkage between present action and future outcomes (Ingoldsby, 2010; Pavetti & Stanley, 2016). The ASPIRE program was developed to address these principles and evolved to meet them better.
1.3The ASPIRE study
A total of 2,051 youth aged 14 to 16 receiving SSI benefits were recruited into the ASPIRE study and were randomly assigned into control (n = 1,018) and intervention (n = 1,033) groups. Of these, 13 control and 126 intervention group participants withdrew from the study, leaving a study sample of n = 1,912. The intervention group received ASPIRE services, including case management, training, and benefits counseling. Sustained case management services focused on working toward future goals in employment, education, and independent living for youth and their families. ASPIRE trainings included youth self-determination/self-advocacy training, parent transition training, and family financial literacy training. The ASPIRE management team set intervention dosage targets of monthly face-to-face case management meetings and 6 hours of training per year for each training area.
1.4ASPIRE methods of engagement
Overall, participation in ASPIRE services fell well-below established targets. As a result, ASPIRE management modified practices throughout the project to increase engagement of youth and families. Case management evolved to increase family engagement by increasing program flexibility. Changes included modifying meeting schedules to accommodate family needs and preferences. Case managers met with families at their homes, public places, schools, in conjunction with other meetings, and at times outside regular business hours, such as on evenings and weekends. Additionally, case management often expanded to include helping families address short term crises so that families could move forward with future-oriented goals (Hall, Ipsen, Kurth, McCormick, & Chambless, nd).
To increase training participation, ASPIRE offered trainings in a variety of formats and introduced two incentive strategies during the study. The first incentive began in the first quarter of 2016, and consisted of monthly lottery-based payments for training attendance. Specifically, families who participated in any monthly training activity (youth self-determination, parent transition, or financial literacy) were entered into a drawing for a chance to win one of four $25 gift cards. Separate lotteries were held for each intervention, so families had a chance to win more than one gift card in a given month if they participated in more than one type of training activity.
The second incentive was launched in the third quarter of 2018 and consisted of an opportunity to receive up to two $2,500 cash deposits into an Achieving a Better Life Experience Act (ABLE) account for the youth or another family member with a disability. ABLE cash deposits were contingent on the account holder participating in Work Incentives Planning and Assistance (WIPA) benefits counseling, 6 hours of financial literacy training, and opening and activating an ABLE account in their name. Families were eligible to establish more than one ABLE account and up to two per family were allowed to receive the $2,500 cash deposits.
2Methods
To explore ASPIRE outcome and engagement strategies, we present three studies. Study 1 compares youth intervention and control groups in terms of intermediary predictors of positive employment and education outcomes, including self-determined decision-making, high expectations for self and from others, and employment and education experiences. Study 2 explores predictors of employment outcomes among intervention youth based on the dosage of ASPIRE services, and Study 3 examines the effectiveness of various engagement strategies for promoting participation in ASPIRE services. The study sample is confined to control (n = 593) and intervention (n = 648) youth who provided survey data at enrollment and at 36-months post enrollment, which represents approximately 65% of the ASPIRE study sample.
2.1Study participants
Control (n = 593) and intervention (n = 648) youth participants were similar at baseline in terms of age, gender, race, ethnicity, disability type, and having a proxy rater. At baseline, 39% of youth were age 14, 31% were age 15, and 30% were age 16. The majority were male (65.3%) with the following racial/ethnic composition: Caucasian (62.2%), Black (13.2%), Native American (7.2%), and of Hispanic/Latino(a) descent (36.1%). Common SSA disability determination categories for the study sample included developmental disorders (such as learning disabilities and speech and language delays; 16.8%), intellectual disabilities (13.9%), autistic disorders (13.6%), personality and impulse control disorders (13.4%), nervous system and sense organs (8.7%), and mood disorders (5.7%). Table 1 provides youth responses to the six American Community Survey (ACS) disability questions.
Table 1
Youth Responses to ACS Disability Questions
| ACS Item (n = 1241) | n | Percent |
| Are you deaf or do you have a serious hearing difficulty? | 100 | 8.1% |
| Are you blind or do you have serious difficulty seeing even when wearing glasses? | 145 | 11.7% |
| Because of a physical, mental or emotional condition, do you have serious difficulty concentrating, remembering or making decisions? | 840 | 67.7% |
| Do you have serious difficulty walking or climbing stairs? | 210 | 16.9% |
| Do you have difficulty dressing or bathing? | 214 | 17.2% |
| Because of a physical, mental or emotional conditions, do you have difficulty doing errands alone, such as shopping? | 487 | 39.2% |
Note: Totals more than 100%, as youth could answer yes to more than one question.
2.2Data sources
2.2.1Study 1: ASPIRE control and intervention comparisons
Study 1 focuses on group comparisons between ASPIRE control and intervention participants based on youth survey answers at enrollment and 36-months post-enrollment. We collected youth survey data at enrollment meetings and then through an external call center for follow-up surveys. Readers should reference an earlier publication for data collection procedures and full descriptions of survey measures (Ipsen et al., 2019). To orient the reader, however, we provide brief descriptions of study measures.
2.2.1.1 Self-determination:
To measure self-determination, we used the American Institute for Research’s Self-Determination Scale (AIR-SDS) student version – a 24-item scale measuring youth self-determination in two domains including internal capacity (things you do) and opportunity (what happens at home and school). The AIR-SDS factor structure and scale show good overall reliability (Cronbach’s a = .88; Wong, Wong, Zhuang, & Liu, 2017).
2.2.1.2 Expectations:
We measured expectations using (1) two Likert-type scaled questions about parent and school encouragement to find employment, (2) nine “yes” or “no” questions regarding conversations with family members, school personnel, and case managers about having a job after high school, going to college after high school, and how to manage money and finances, and (3) a Likert-type scale question about youth agreement with the statement “I see myself holding a paying job in the next year”
2.2.1.3 Employment and education:
We measured employment and education with a series of seven “yes” or “no” questions about work- and education-related activities in the past 30 days, including part-time work, full-time work, looking for a job, doing volunteer work, in job training or vocational school, going to college part-time, going to college full-time.
2.2.2Study 2: Levels of engagement and outcomes
Study 2 explores how different levels of engagement with ASPIRE services impacted employment outcomes, after controlling for disability and demographic variables. To explore this relationship, we aggregated data from youths’ ASPIRE case management records. Intervention case managers recorded case data on a monthly basis for all intervention youth, including number and type of successful and unsuccessful contacts, youth’s current education and employment status, and participation in ASPIRE and non-ASPIRE services (e.g. ASPIRE-sponsored self-determination training or meeting with a Vocational Rehabilitation counselor). To compare inputs and outcomes, we created yearly aggregated data in terms of in-person case management meetings, employment and pre-employment activities, and hours of participation in ASPIRE-related training, such as self-determination, parent transition, and financial literacy. We focused on the last three years of the project, when all youth were enrolled.
2.2.3Study 3: Motivating engagement
Study 3 explores the effectiveness of different incentive strategies in promoting family engagement with ASPIRE services. The data come from case management records that track training participation over time. For each intervention participant, we created a flag for 2 + hours of youth self-determination, parent transition, and financial literacy training received during that quarter. These flags were aggregated across case data to arrive at a total number of participants for each quarter (for each training) starting with the second quarter of 2015 when the majority of training contracts were in place and ending with the final quarter of ASPIRE services in 2019.
2.3Data analyses
We aggregated data sources into SPSS V. 22 (IBM Corp., 2013), which included baseline and 36-month control and intervention group data as well as aggregated case management data for intervention participants.
2.3.1Study 1
We used ANOVAs, Chi-square, repeated measures ANOVA, and Freidman test-statistics to compare baseline and 36-month intervention and control group data for study 1. We included Cramer’s V effect size measurements for Chi-square comparisons.
2.3.2Study 2
We used logistic regression to explore factors associated with intervention outcomes, and reported odds ratios and 95% confidence intervals to explore magnitude of effects. The dependent variable was participation in part- or full-time employment during the 12-month study period in year 3. Explanatory model variables included:
Block 1: Demographics
• Enrollment age 15; Enrollment age 16 – two indicator variables for being 15 or 16, relative to age 14 at enrollment.
• Female – indicator variable for being female, relative to male
• Nonwhite – indicator variable for non-white race, relative to white
• Hispanic – indicator variable for Hispanic, relative to non-Hispanic
• ACS1_hearing; ACS2_seeing; ACS3_remembering; ACS4_climbing stairs; ACS5_ADLs; ACS6_AIDLs – indicator variables for each of the six disability ACS questions including: difficulty hearing; difficulty seeing; difficulty remembering or making decisions; difficulty climbing stairs; difficulty with ADLs (bathing, toileting, etc.); and difficulty with IADLs (shopping, cleaning, etc.).
Block 2: Intervention Engagement Variables – Current
• Y3:F2f CM meetings - number of reported in-person case management meetings in year 3 (range = 1 to 12)
• Y3:Career Exploration - participation in career exploration activity by quarter in year 3 (range = 0 to 4)
• Y3 : 2 + hours of SD training - flag for participation in 2 + hours of self-determination training in year 3.
• Y3 : 2 + hours of PT training - flag for participation in 2 + hours of parent transition training in year 3.
• Y3 : 2 + hours of FL training - flag for participation in 2 + hours of financial literacy training in year 3
Block 3: Intervention Engagement Variables - Past
• Y2:F2f CM meetings – number of reported in-person meetings with case manager in year 2
• Y2:Career exploration - participation in career exploration activity by quarter in year 2
• Y2 : 2 + hours of SD training - flag for participation in 2 + hours of self-determination in year 2
• Y2 : 2 + hours of PT training - flag for participation in 2 + hours of parent transition training in year 2
• Y2 : 2 + hours of FL training - flag for participation in 2 + hours of financial literacy training in year 2
• Y1:F2f CM meetings – number of reported in-person meetings with case manager in year 1
• Y1:Career exploration - participation in career exploration activity by quarter in year 1
We report two measures of fit for the model. Nagelkerke pseudo R2 ranges from 0 to 1. Although it cannot be strictly interpreted as the proportion of explained variance, it can be used to proportionately compare the amount of variance explained between different models (Nagelkerke, 1991). The Chi-square statistic for each block of variables measures the contribution of each block against the null model. For both measures, a higher value implies more explanatory power in the block.
2.3.3Study 3
To explore engagement strategies, we plotted training participation flags over time to provide a visual analysis of training participation rates, with noted introductions of non-monetary and monetary incentive strategies.
3Results
3.1Study 1: Intervention and control group comparisons
We compared baseline and 36-month differences in the areas of self-determination, encouragement and expectations, and employment and educational activities.
3.1.1Self-determination
Repeated measures ANOVAs showed significant increases in self-determination capacity scores (Wilks’ Lambda = .960, F(1, 1149) = 48.0, p≤.001) and opportunity scores (Wilks’ Lambda = .860, F(1, 1095) = 178.0, p≤.001) over time, but no significant time by group differences. Table 2 reports ANOVAs for AIR capacity and opportunity change scores for the control and intervention groups.
Table 2
ANOVA comparisons on AIR change scores
| Control | Intervention | Comparison | ||||||
| 0-mo | 36-mo | Δ | 0-mo | 36-mo | Δ | F | p | |
| AIR capacity subscale | 43.1 | 44.9 | 1.75 | 42.6 | 45.3 | 2.63 | 1.96 | .162 |
| AIR opportunity subscale | 45.8 | 49.5 | 3.72 | 45.2 | 49.6 | 4.40 | 1.22 | .269 |
*Significant at p≤.05.
†Significant at p≤.01.
3.1.2Encouragement and expectations
Youth rated their agreement with statements about parent and school encouragement to have a job or career as an adult on a 5 point Likert-type scale where 1 = strongly disagree and 5 = strongly agree. Youth rated their own expectations about working at a job in the next year on a 4 point Likert type scale where 1 = disagree to 4 = agree. Repeated measures ANOVAs showed significant increases in family encouragement for employment (Wilks’ Lambda = .954, F(1, 1206) = 58.6, p≤.001), school encouragement for employment (Wilks’ Lambda = .925, F(1, 1199) = 97.4, p≤.001), and self-expectations for employment (Wilks’ Lambda = .981, F(1, 848) = 16.5, p≤.001) over time, but no significant time by group differences. Table 3 reports ANOVAs of encouragement change scores for the control and intervention groups.
Table 3
ANOVA Comparisons of Encouragement Change Scores
| Control | Intervention | Comparison | ||||||
| 0-mo | 36-mo | Δ | 0-mo | 36-mo | Δ | F | p | |
| I have been encouraged by my family to have a job or career as an adult. | 3.90 | 4.19 | .286 | 3.97 | 4.23 | .258 | .161 | .688 |
| At school, I have been encouraged to have a job or career as an adult. | 3.76 | 4.09 | .327 | 3.75 | 4.17 | .418 | 1.46 | .227 |
| I see myself working at a paying job in the next year | 2.80 | 3.03 | .227 | 2.86 | 3.04 | .178 | .245 | .621 |
*Significant at p≤.05.
†Significant at p≤.01.
Table 4 reports Chi-square group comparisons for nine yes/no questions about conversations between youth and parents, school personnel, and case managers about having a job, going on to college or further education, and managing money or finances. There were no group differences at 36-months for conversations between youth and parents. Relative to control youth, intervention youth reported increased conversations with school personnel about further education (p = .004) but effects were negligible. Intervention youth reported higher rates of case manager conversations at the 36-months in the areas of having a job (p≤. 001), further education (p≤.001), and money management (p≤.001).
Table 4
Future Discussions – Chi-Square Group Comparisons
| Baseline group comparisons | 36-month group comparisons | |||||||
| Control % | Int. % | P | Cramer’s V | Control % | Int. % | p | Cramer’s V | |
| Parents/guardians talked with youth about: | ||||||||
| Having a job or career after high school | 72.1% | 75.3% | .205 | .036 | 87.3% | 89.1% | .315 | .029 |
| Going to college or other education after high school | 71.9% | 74.1% | .400 | .024 | 82.0% | 83.4% | .539 | .018 |
| How to manage money or finances. | 63.2% | 66.7% | .200 | .037 | 78.2% | 79.8% | .487 | .020 |
| Teachers, guidance counselor or school talked with youth about: | ||||||||
| Having a job or career after high school | 69.4% | 69.4% | .995 | .000 | 84.2% | 87.8% | .065 | .053 |
| Going to college or other education after high school | 65.1% | 67.2% | .422 | .022 | 78.5% | 84.7% | .004 † | .081 |
| How to manage money or finances. | 44.3% | 48.0% | .191 | .038 | 62.4% | 67.2% | .079 | .050 |
| Caseworkers or case managers talked with youth about: | ||||||||
| Having a job or career after high school | 28.1% | 27.4% | .795 | .008 | 66.6% | 85.4% | .000† | .222s |
| Going to college or other education after high school | 26.1% | 26.7% | .828 | .006 | 59.5% | 78.8% | .000† | .210s |
| How to manage money or finances. | 14.2% | 16.1% | .360 | .027 | 46.0% | 64.2% | .000† | .183s |
We conducted non-parametric Friedman tests of differences among repeated measures for the control and intervention groups for the variables in Table 4. For all variables, conversations about jobs, education, and money management increased over time, showing a maturation effect (p≤.01).
3.1.3Employment and post-secondary education activities
Table 5 reports Chi-square group comparisons for seven yes/no questions about participation in employment and education related activities including working part-time, working full-time, looking for work, volunteering, participating in job training or vocational school, going to college part-time, and going to college full-time. We also computed a yes/no variable for a “yes” response to any of the participation variables, since participation in one activity may preclude participation in another activity. The table shows that with the exception of looking for work at 36-months, there were not significant differences between intervention and control youth. Relative to control youth, intervention youth reported higher participation rates in ‘any work or education activity’, but the effect size was negligible (Fort Collins Science Center, 2018).
Table 5
Employment Chi-Square Group Comparisons
| Baseline group comparisons | 36-month group comparisons | |||||||
| Control % | Int. % | P | Cramer’s V | Control % | Int. % | p | Cramer’s V | |
| Within the past 30 days or right now are you | ||||||||
| Working part-time (less than 30 hours per week) | 4.9 | 3.4 | .186 | .038 | 16.2 | 18.1 | .384 | .025 |
| Working full-time | .2 | .0 | .296 | .030 | 5.7 | 4.8 | .453 | .021 |
| Looking for a job | 20.0 | 23.8 | .111 | .045 | 33.1 | 40.4 | .007† | .076 |
| Doing volunteer work | 15.3 | 15.4 | .995 | .002 | 20.9 | 20.7 | .920 | .003 |
| Participating in job training or vocational school | 2.7 | 2.3 | .668 | .012 | 11.8 | 14.5 | .179 | .040 |
| Going to college part-time | .5 | .8 | .558 | .017 | 3.5 | 4.5 | .403 | .024 |
| Going to college full-time | – | – | – | – | 5.2 | 5.4 | .892 | .004 |
| Participating in any employment or education activity | 34.8 | 37.6 | .302 | .029 | 65.8 | 72.2 | .014* | .070 |
*Significant at p≤.05
†Significant at p≤.01.
3.2Study 2: Levels of engagement and outcomes
To explore issues of engagement, Study 2 focuses on the intervention group alone to determine if different levels of engagement predict 36-month part- or full-time employment. Because ASPIRE youth entered the program at various times, we focused on the last three years of ASPIRE services, which corresponded with enrollment of the full study sample.
Engagement variables included the number of face-to-face case management meetings in Year 1 (months 1–12), Year 2 (months 13–24) and Year 3 (months 25–36), career exploration activities for each year, and receipt of two or more hours of youth self-determination, parent transition, and financial literacy training in each year. ASPIRE intervention targets were for 6 + hours of youth self-determination, parent transition, and financial literacy training in each year of the study, and face-to-face case management meetings every month. Very few intervention participants met this threshold, making it difficult to explore dosage effects. Table 6 provides descriptive statistics for engagement variables.
Table 6
ASPIRE Service Engagement Variables (n = 648)
| Year 1 | Year 2 | Year 3 | Unique participants | |
| 2 + hrs self-determination training | n = 125, 19% | n = 135, 21% | n = 85, 13% | n = 238; 37% |
| 6 + hrs self-determination training | n = 41, 6% | n = 59, 9% | n = 25, 4% | n = 90; 14% |
| 2 + hrs parent transition training | n = 76, 12% | n = 67, 10% | n = 61, 9% | n = 143, 22% |
| 6 + hrs parent transition training | n = 23, 4% | n = 18, 3% | n = 15, 2% | n = 49; 8% |
| 2 + hrs financial literacy training | n = 41, 6% | n = 58, 9% | n = 362, 56% | n = 390, 60% |
| 6 + hrs financial literacy training | n = 7, 1% | n = 11, 2% | n = 340, 53% | n = 349; 54% |
| 6 + face-to-face case management mtgs | n = 328, 50% | n = 325, 50% | n = 360, 55% | n = 454, 70% |
| 9 + face-to-face case management mtgs | n = 167, 26% | n = 178, 28% | n = 215, 33% | n = 285, 44% |
| 1 + job exploration activities | n = 320, 49% | n = 356, 55% | n = 319, 49% | n = 503, 44% |
We used binary logistic regression to evaluate the contributions of demographics and intervention engagement variables to predict part- or full-time employment participation. Tables 7 and 8 report results of model statistics.
Table 7
Logistic Regression with 2 + hours of Training Engagement (n = 527)
| B | SE | Wald | df | Sig. | Exp (β) | 95% CI Lower | 95% CI Upper | |
| Block 1: Demographics | ||||||||
| Enrollment age 15 | 1.014 | .294 | 11.877 | 1 | .001† | 2.756 | 1.548 | 4.906 |
| Enrollment age 16 | .922 | .287 | 11.918 | 1 | .001† | 2.698 | 1.536 | 4.739 |
| Female | –.266 | .242 | 1.202 | 1 | .273 | .767 | .477 | 1.233 |
| Nonwhite | –.028 | .246 | .013 | 1 | .909 | .972 | .601 | 1.574 |
| Hispanic | –.540 | .279 | 3.762 | 1 | .052 | .583 | .338 | 1.006 |
| ACS1_hearing | –.359 | .465 | .595 | 1 | .441 | .699 | .281 | 1.738 |
| ACS2_seeing | .044 | .393 | .013 | 1 | .910 | 1.045 | .484 | 2.259 |
| ACS3_remembering | –.142 | .249 | .327 | 1 | .568 | .867 | .532 | 1.413 |
| ACS4_climbing stairs | .392 | .359 | 1.191 | 1 | .275 | 1.479 | .732 | 2.989 |
| ACS5_ADLs | –1.243 | .463 | 7.213 | 1 | .007† | .289 | .117 | .715 |
| ACS6_AIDLs | –.802 | .271 | 8.763 | 1 | .003† | .448 | .264 | .763 |
| Block 2: Engagement with Intervention Services – Current | ||||||||
| Y3: F2f CM meetings | .093 | .051 | 3.312 | 1 | .069 | 1.097 | .993 | 1.213 |
| Y3: Career Exploration | .013 | .123 | .012 | 1 | .914 | 1.013 | .796 | 1.290 |
| Y3 : 2 + hours of SD training | .040 | .369 | .011 | 1 | .915 | 1.040 | .505 | 2.145 |
| Y3 : 2 + hours of PT training | –.438 | .425 | 1.062 | 1 | .303 | .645 | .280 | 1.485 |
| Y3 : 2 + hours FL training | –.365 | .275 | 1.764 | 1 | .184 | .694 | .405 | 1.190 |
| Block 2: Engagement with Intervention Services – Past | ||||||||
| Y2: F2f CM meetings | .166 | .058 | 8.235 | 1 | .004† | 1.181 | 1.054 | 1.322 |
| Y2: Career exploration | .416 | .126 | 10.840 | 1 | .001† | 1.516 | 1.183 | 1.941 |
| Y2 : 2 + hrs of SD training | –.466 | .318 | 2.148 | 1 | .143 | .627 | .336 | 1.170 |
| Y2 : 2 + hrs of PT training | .579 | .390 | 2.202 | 1 | .138 | 1.785 | .830 | 3.837 |
| Y2 : 2 + hrs FL training | –.439 | .381 | 1.334 | 1 | .248 | .644 | .306 | 1.358 |
| Y1: F2f CM meetings | –.058 | .050 | 1.336 | 1 | .248 | .944 | .855 | 1.041 |
| Y1: Career exploration | .355 | .131 | 7.311 | 1 | .007† | 1.426 | 1.102 | 1.843 |
| Constant | –2.527 | .392 | 41.581 | 1 | .000 | .080 | ||
*Significant at p≤.05.
†Significant at p≤.01.
Table 8
Model Summary Statistics
| Δ in Nagelkerke R2 | χ2 | |
| Block 1 – Demographics | .146 | 57.32 |
| Block 2 – Current Intervention | .118 | 51.55 |
| Engagement | ||
| Block 3 – Past Intervention | .103 | 49.15 |
| Engagement | ||
| Full Model | .367 | 158.02 |
The odds ratios (OR) of employment were significantly higher for youth who enrolled in the ASPIRE program at age 15 (OR = 2.756) or age 16 (OR = 2.698), relative to those enrolled at age 14. Odds were significantly lower for youth reporting difficulties performing activities of daily living or self-care (OR = .289) and difficulties performing instrumental activities of daily living such as chores and errands (OR = .448), relative to not having these limitations. Current levels of engagement with services did not significantly predict employment. Past intensity of case management face-to-face meetings in year 2 (OR = 1.181) and career exploration activities in year 2 and year 1 (OR = 1.516; OR = 1.426), however, did significantly predict current or year 3 employment.
For the regression, we created indicator variables for youth or family members receiving 2 or more hours of each training because there were too few participants who reached 6 + hour training targets. We ran, but did not include, a comparable regression with indicators for those receiving 6 + hours of youth self-determination, parent transition, and financial literacy training. The model revealed similar results, with one notable difference. Parent transition training hours in year 2 significantly predicted year 3 youth employment outcomes, despite the fact that only 18 parents were included.
3.3Study 3: Motivating engagement
Data in Table 6 showed that participation in ASPIRE intervention activities fell far below established benchmarks for the program. One strategy to overcome low levels of engagement is to introduce external motivators, including incentives. ASPIRE provided two different incentives during the program. The first incentive included a chance to win a monthly prize drawing of four $25 gift cards per each ASPIRE training attended. This incentive was small, delayed, and not guaranteed. The second incentive included a $2,500 cash deposit into an ABLE account, provided the recipient met firm requirements to attend 6 + hours of financial literacy training, receive a Written Benefits Summary and Analysis plan, and open and activate an ABLE account. If requirements were met, the incentive was large, specific, and guaranteed. Figure 1 shows how the introduction of these programs impacted participation in ASPIRE trainings over time.
Fig.1
ASPIRE service engagement over time.
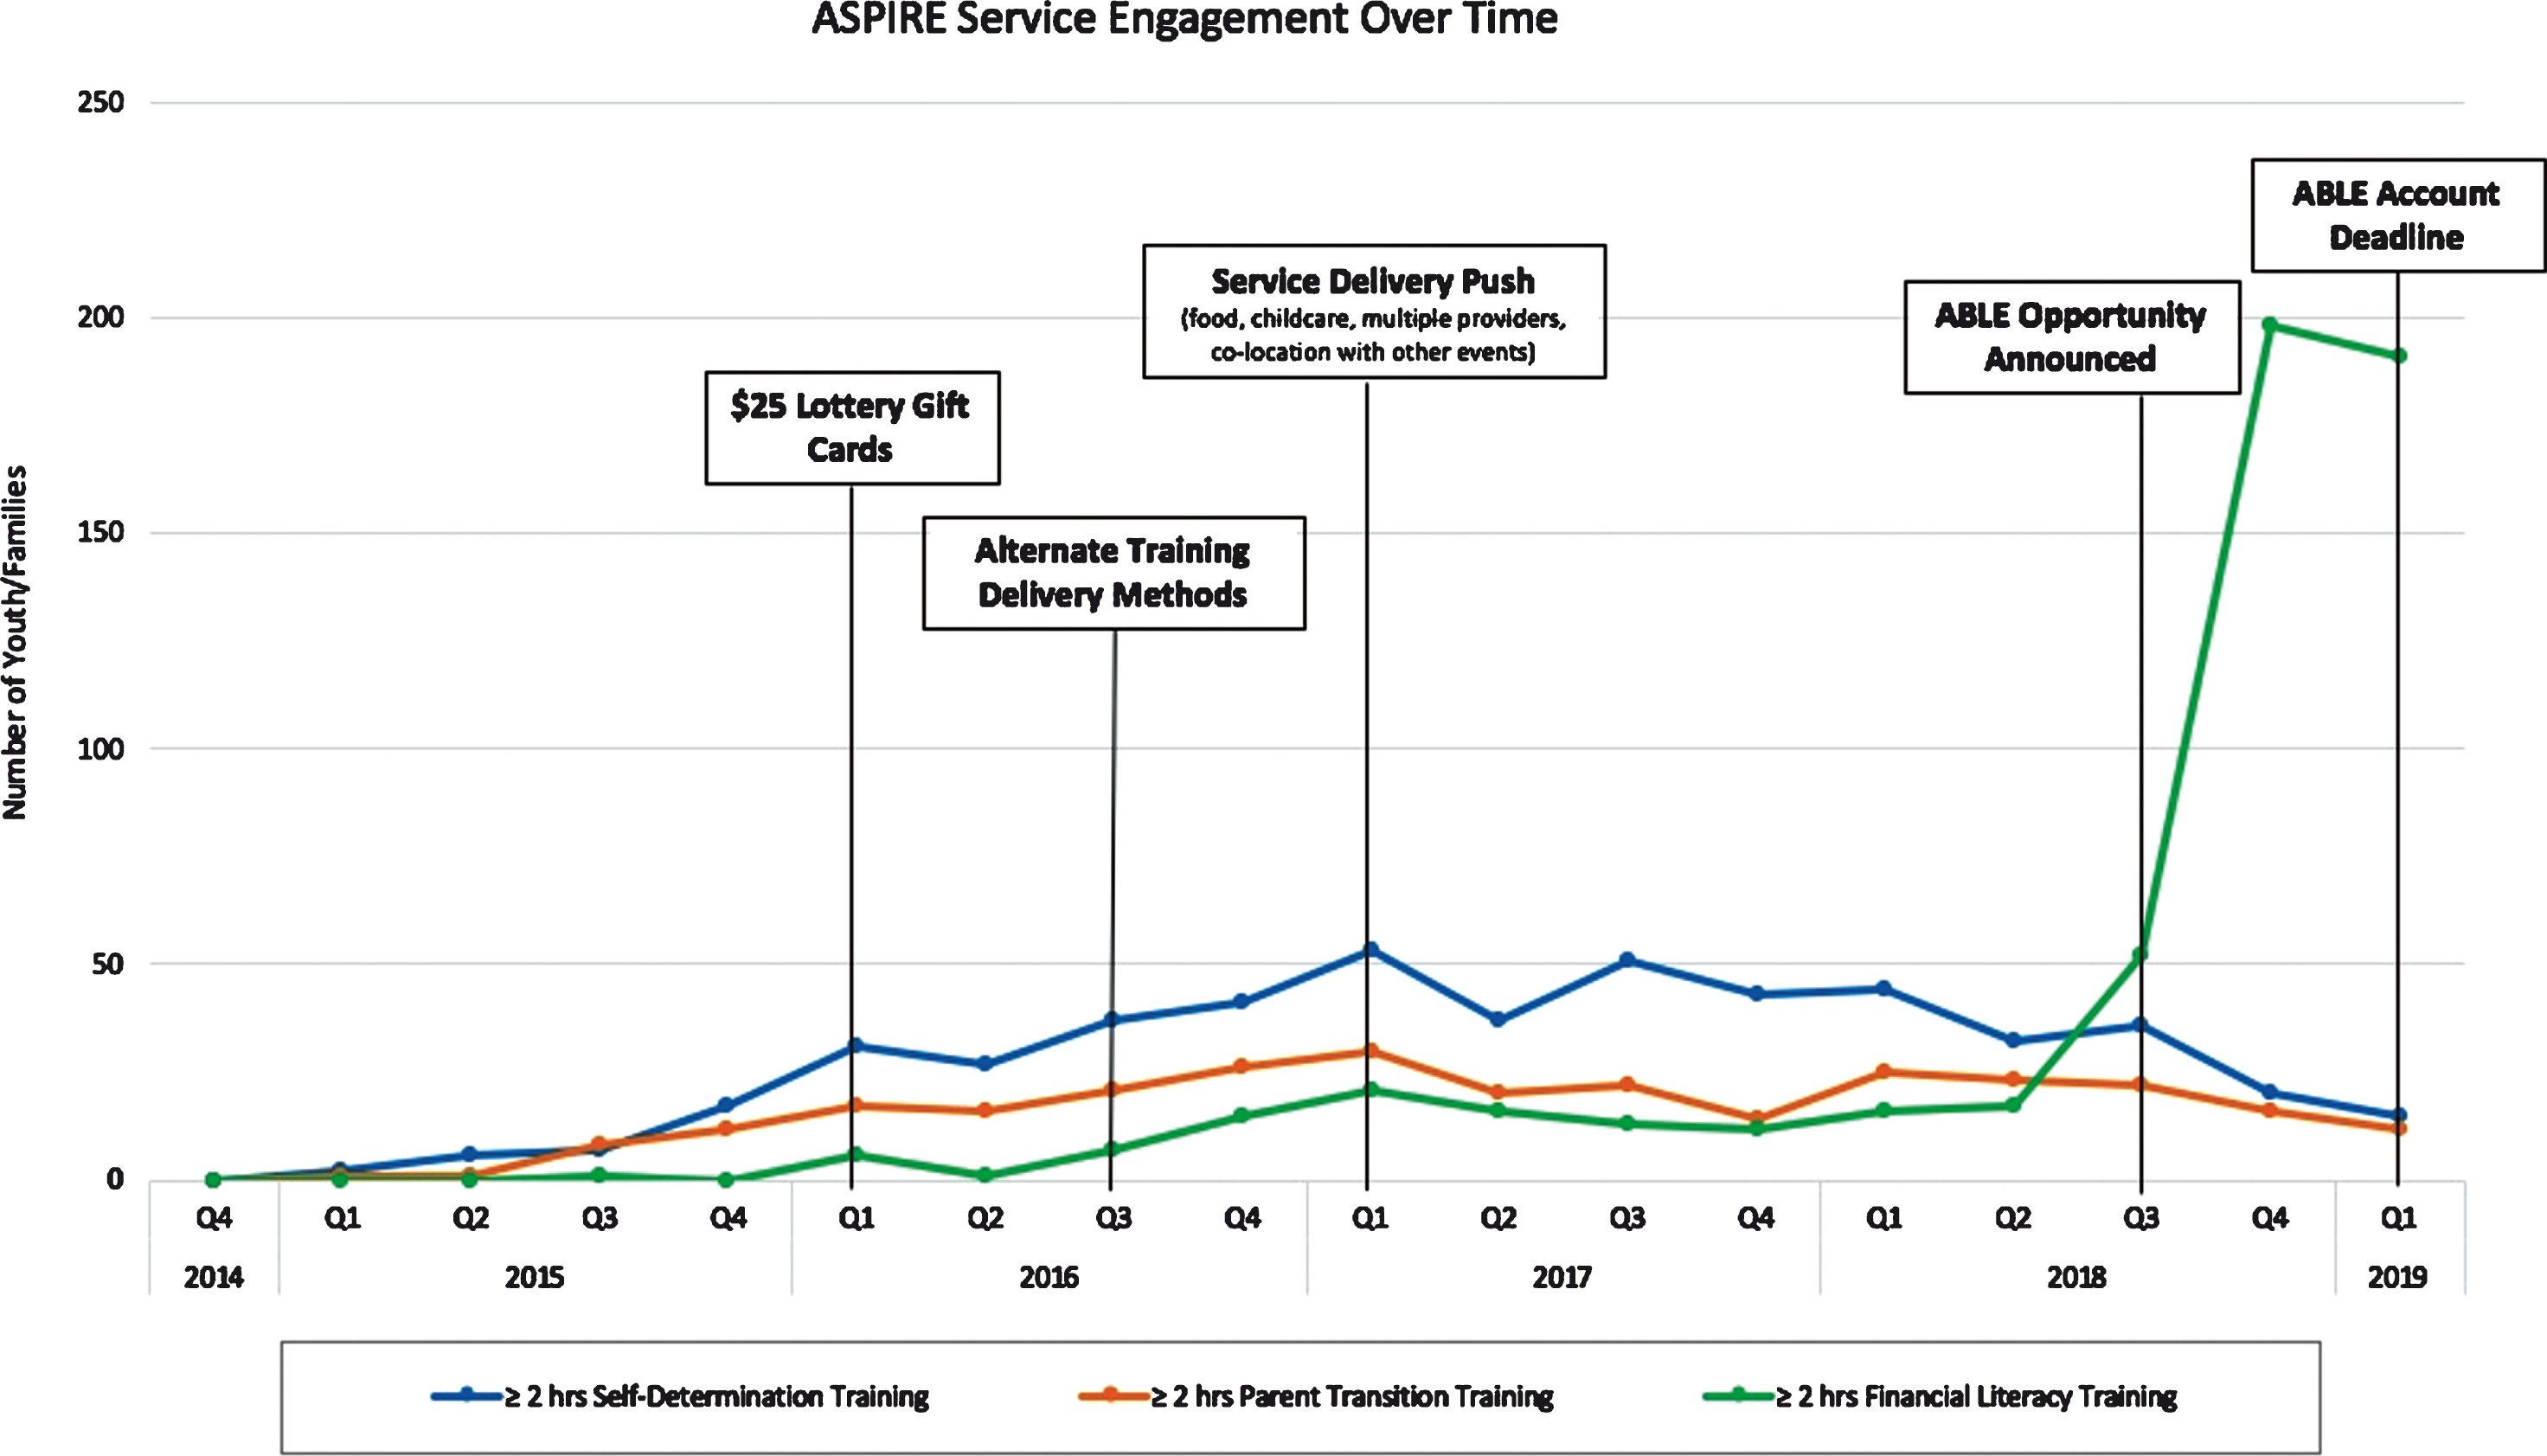
A small increase in intervention participation was associated with the introduction of the $25 lottery gift cards. Other small increases were associated with a service delivery push among intervention case managers, which included the introduction of increased flexibility in intervention delivery methods and strategies, such as online-webinars, food, prizes, and co-location with other events. A large increase in financial literacy training participation was associated with the ABLE deposit opportunity, a required component of receiving the ABLE incentive.
4Discussion
PROMISE demonstrations were required to provide services and supports associated with improved education and employment outcomes among transition youth. These included case management, career and work-based learning experiences, benefits planning, self-determination training, parent transition training, and financial literacy training. Unfortunately, very few ASPIRE intervention youth and families met participation targets for these services and supports, making it difficult to evaluate impacts.
4.1Study 1: Intervention and control group comparisons
Study 1 compared intervention and control groups in terms of intermediary outcomes including youth self-determination, future expectations, and participation in employment and education activities. There was a maturation effect for all intermediary outcomes for both control and intervention groups. As youth matured, they showed more self-determined behaviors, had more future-oriented discussions about post-secondary education and employment, and participated in more employment and education activities. Between group differences, however, were slight.
Changes in self-determination scores showed a maturation effect, but no group by time differences. Likewise, intervention and control group youth reported higher rates of parent and school encouragement for employment, and higher rates of discussions with parents and school about employment, further education, and finances over time, but group differences were negligible or non-existent. Findings were significant in terms of case manager discussions with youth about future employment, education, and finances. This probably related to the fact that control group youth lacked an assigned case manager for making this comparison, but builds the case for case management services to build future expectations. There was a significant difference between intervention and control groups in terms of seeking employment, but this difference had a negligible effect size.
One might assert that marginal impacts and negligible effects relate to low participation rates among ASPIRE youth and their families. There is quite a bit of evidence to this effect. For instance, only 6%, 9%, and 4% of intervention youth participated in the target of 6 + hours of self-determination training in years 1, 2, and 3 respectively. Likewise, only 4%, 3%, and 2% of parents attended 6 + hours of parent transition training and only 26%, 28%, and 33% of families participated in 9 or more face-to-face case management meetings in years 1, 2, and 3 respectively. Low engagement means that intervention and control group youth were functionally similar in terms of services received. With the exception of small effects regarding conversations with case managers about employment, post-secondary education, and finances, all other intermediary group differences were negligible or absent at 36-months. This outcome may be shaped by low rates of engagement with ASPIRE services, such that the intervention group resembled the control group in terms of services received.
4.2Study 2: Levels of engagement and outcomes
Study 2 used logistic regression to understand predictors of employment for the intervention group using case management data. Overall, results indicated that past engagement with ASPIRE intervention services was a better predictor of employment than current engagement. Specifically, engagement in terms of more face-to-face case management meetings in year 2 and career exploration activities in years 1 and 2 significantly predicted improved employment outcomes in year 3. Engagement variables in year 3 did not have similar effects on year 3 employment outcomes. This aligns with findings from a preliminary paper that reported lagged engagement variables predicted downstream outcomes (Ipsen, et al., 2019).
No ASPIRE self-determination, parent transition, or financial literacy trainings significantly impacted employment outcomes. This may relate to low dosages of any of these services. However, these results diverge with an earlier paper that showed youths’ past participation in 2 + hours of youth self-determination training increased the odds of employment at year 2 (Ipsen, et al., 2019). It is possible that early gains in self-determination created earlier employment opportunities, but as youth age these gains diminish due to natural maturation.
We ran a similar model with flags for 6 + hour training targets to explore dosage effects. We did not report results because very few participants met these training targets. Interestingly, however, parent transition training hours in year 2 significantly predicted year 3 youth employment outcomes, despite the fact that only 18 parents were included. Results such as this provide some support for the potential impact increased training intensity could have on important intermediary outcomes including self-determination, parent expectations, and employment.
4.3Study 3. Motivating engagement
Faced with low levels of engagement, the ASPIRE management team modified procedures to promote family engagement. Some modifications related to case management services. For instance, meetings in public places or family homes were cautioned early in the project due to confidentiality and safety issues. Procedures, however, were modified over time to make it less burdensome for the youth and family to participate, while still addressing safety and confidentiality concerns. The increased flexibility appears to have increased family engagement in case management over time.
Other modifications were made to increase engagement with ASPIRE training initiatives. Starting in the first quarter of 2016, youth and families had a chance each month to enter a drawing for one of four $25 gift cards for each ASPIRE training attended. In the second quarter of 2016, ASPIRE management introduced alternate delivery strategies including online trainings, pre-recorded webinar trainings, and opportunities for case-manager delivery of self-determination training. In the first quarter of 2017, many states rolled out additional engagement strategies such as weekend training events, where ASPIRE covered family stays at a hotel, allowing them to swim, eat, and attend intervention classes; co-located events, where ASPIRE-sponsored training occurred in conjunction with other transition or parent events; and sponsored open houses where families could attend training, win prizes, eat pizza, and receive recognition.
Unfortunately, early engagement efforts did little to improve training attendance. The literature highlights that immediate and guaranteed incentives are more effective than delayed and random incentives for promoting engagement among present-oriented thinkers (Dillman, Smyth, & Christian, 2014; Pavetti & Standley, 2016). It is likely that ASPIRE’s gift card lottery incentives were insufficient for overcoming participation costs. A better strategy might involve immediate cash payments in conjunction with training attendance, so that families could address a short term need (such as paying for groceries) through participation.
Introduction of the $2,500 ASPIRE ABLE Deposit Opportunity in the 3rd quarter of 2018, resulted in dramatic results for the targeted financial literacy training. Within the last six months of the project, 300 (46%) of the intervention study sample (n = 648) received 6 + hours of financial literacy training, and 151 (23%) secured a written Benefits Planning and Analysis Summary. Although the $2,500 ABLE deposit-incentive was large and expensive across participants, it was highly successful in motivating engagement. When one weighs other program costs such as paying for multiple trainings with low attendance, large incentives such as the ABLE deposit may be cost-efficient.
The $2,500 ASPIRE ABLE Deposit Opportunity was offered as a result of a one-year extension of funding to improve participants’ future outcomes. The deposit was not necessarily introduced as an engagement strategy, nor was it based on empirical evidence regarding an appropriate incentive amount. The incentive literature suggests that contingency payments must increase in proportion to the intensity and duration of the activity (Pavetti & Stanley, 2016). The deposit was large enough to promote engagement with the required level of 6 hours of financial literacy training. One wonders, however, if additional training components could have been built into the incentive, such as 6 hours of parent transition and youth self-determination, with similar outcomes.
Given results that show past engagement drives future outcomes, it is unfortunate that various incentive strategies were not tested earlier in the delivery process. The ABLE incentive occurred too late in the project to assess outcomes within the formative evaluation period. Hopefully, national PROMISE evaluators will be able to track educational and employment outcomes into the future to make this assessment.
4.3.1Limitations
There are limitations to the data and analyses presented. First, implementing the project across six states and corresponding number of agencies, created unique challenges. The ASPIRE consortium of states included a broad cross-section of agency relationships and protocols, training partners, and geographic considerations such as rural and reservation lands that introduced variations in implementation strategies. Additionally, in some sites, organizational issues resulted in significant impacts for the project, such as implementation delays. Together, these delivery variations made it hard to evaluate engagement efforts in a systematic way.
Second, participants were recruited and enrolled across a 20-month period. Although we constrained our analyses to the final three years of the project when the complete study sample was enrolled, some participants received additional services that were not captured. Additionally, results were shaped by low survey response rates across the study. We attempted to collect survey data from control and intervention participants at enrollment (baseline), 12-months, 24-months, and 36-months post enrollment. Survey response rates were 71% at 12-months, 56% at 24-months, and 65% at 36-months. Only 38% of participants provided data at all data collection points. To maintain the maximum sample size for making group comparisons about ASPIRE outcomes, we confined group comparisons to baseline and 36-month survey data, for a sample size of 1,241 participants. Utilizing baseline compared to 36-month post-enrollment survey data also allowed for the largest possible time period for interventions to occur and impact to be measured.
There were higher rates of non-white and male non-completers, but groups were similar on other key demographic variables and across intervention and control groups. Other limitations highlighted in an earlier manuscript include limitations introduced by proxy raters on youth surveys and geographic representativeness (Ipsen, et al., 2019). Together, these limitations impact interpretation of results.
4.3.2Reflection and conclusion
The PROMISE study targeted a group that is hard to reach with future-oriented services. Outcomes from the ASPIRE demonstration reinforced this complexity. Intervention youth remained similar, but slightly improved, despite monumental effort by ASPIRE case managers to engage families, adjust services, and overcome family crises. In part, this finding relates to issues of engagement, and future efforts should heed this issue. ASPIRE data showed that those receiving earlier and more intense case management services experienced better employment outcomes in year 3. If more effective motivators could be introduced early in a project, it is likely these types of engagement outcomes could be improved. Although incentives can be difficult to defend as part of standard delivery practice, they may be a necessary ingredient to address present-oriented thinking. The literature provides suggestions for how these incentives should be structured and incorporated into human service programs (e.g. Pavetti & Stanley, 2016). Building on these standards in concert with sustained case management services is a pathway worth exploring.
Conflict of interest
None to report.
Endnote
Study data were collected and managed using REDCap electronic data capture tools hosted at University of Utah. REDCap (Research Electronic Data Capture) is a secure, web-based application designed to support data capture for research studies, providing 1) an intuitive interface for validated data entry; 2) audit trails for tracking data manipulation and export procedures; 3) automated export procedures for seamless data downloads to common statistical packages; and 4) procedures for importing data from external sources.
Acknowledgments
The authors would like to acknowledge Carol Ruddell from Utah State Office of Rehabilitation for her leadership, as well as ASPIRE project staff in Arizona, Colorado, Montana, North Dakota, South Dakota and Utah for their collaboration and data collection efforts.
The contents of this paper were developed under a cooperative agreement with the U.S. Department of Education, Office of Special Education Programs, associated with PROMISE Award #H418P140002. David Emenheiser served as the project officer. The views expressed herein do not necessarily represent the positions or policies of the Department of Education or its federal partners. No official endorsement by the U.S. Department of Education of any product, commodity, service or enterprise mentioned in this publication is intended or should be inferred.
References
1 | Anderson, C. , & Partch-Davies, T. ((2018) , December). Poverty and Disability: an Overview - Free Webcast November 16, 2018. Retrieved from https://projecte3.com/poverty-disability-webcast/ |
2 | Benz, M. R. , Lindstrom, L. , & Yovanoff, P. ((2000) ). Improving graduation and employment outcomes of students with disabilities: Predictive factors and student perspectives. Exceptional Children, 66: (4), 509–529. https://doi.org/10.1177/001440290006600405 |
3 | Berry, H. G. ((2000) ). The Supplemental Security Income program and employment for young adults with disabilities: An analysis of the National Health Interview Survey on Disability. Focus on Autism and Other Developmental Disabilities, 15: (3), 176–181. https://doi.org/10.1177/108835760001500309 |
4 | Bureau of Labor Statistics. (n.d.). Unemployment rates and earnings by educational attainment. Retrieved May 31, 2018, from BLS - Employment Projections website: https://www.bls.gov/emp/chart-unemployment-earnings-education.htm |
5 | Carter, E. W. , Austin, D. , & Trainor, A. A. ((2012) ). Predictors of postschool employment outcomes for young adults with severe disabilities. Journal of Disability Policy Studies, 23: (1), 50–63. https://doi.org/10.1177/1044207311414680 |
6 | Committee to Evaluate the Supplemental Security Income Disability Program for Children with Mental Disorders, Board on the Health of Select Populations, Board on Children, Youth, and Families, Institute of Medicine, Division of Behavioral and Social Sciences and Education, & The National Academies of Sciences, Engineering, and Medicine. ((2015) ). Poverty and Childhood Disability ( Boat TF , Wu, JT , Eds.). Retrieved from https://www.ncbi.nlm.nih.gov/books/NBK332898/ |
7 | Cooper, C. ((2017) , April 20). Why poverty is like a disease - Emerging science is putting the lie to American meritocracy. Retrieved April 16, 2019, from Pocket website: https://getpocket.com/explore/item/why-poverty-is-like-a-disease |
8 | Dillman, D. A. , Smyth, J. D. , & Christian, L. M. ((2014) ). Internet, Phone, Mail, and Mixed-Mode Surveys: The Tailored Design Method (4th ed.). Hoboken, NJ: Wiley. |
9 | Doren, B. , Gau, J. M. , & Lindstrom, L. E. ((2012) ). The relationship between parent expectations and postschool outcomes of adolescents with disabilities. Exceptional Children, 79: (1), 7–23. https://doi.org/10.1177/001440291207900101 |
10 | Employment Disability Institute. (n.d.). 2013 Disability Status Report (p. 65). Retrieved from Cornell University website: http://www.disabilitystatistics.org/StatusReports/2013-PDF/2013-StatusReport_US.pdf?CFID=9515251&CFTOKEN=8f6bd6bd8116d433-2EC9BDF8-C8D5-871F-B3A674D3E3647565 |
11 | Fabian, E. S. ((2007) ). Urban youth with disabilities: Factors affecting transition employment. Rehabilitation Counseling Bulletin, 50: (3), 130–138. https://doi.org/10.1177/00343552070500030101 |
12 | Fort Collins Science Center. ((2018) , April 25). Statistical Interpretation. Retrieved August 8, 2018, from https://www.fort.usgs.gov/sites/landsat-imagery-unique-resource/statistical-interpretation |
13 | Hall, J. , Ipsen, C. , Kurth, N. , McCormick, S. , and Chambless, K. How family crisis may limit successful transition of youth with disabilities from SSI to self-sufficiency. Manuscript submitted for publication. |
14 | Honeycutt, T. , Kauff, J. , Mamun, A. , Emenheiser, D. , & Cobb, J. ((2019) , April). Improving transition outcomes for youth SSI recipients: Early findings from the PROMISE Evaluation. Presented at the Center for Studying Disability Policy Forum, Mathematica Policy Research. |
15 | Honeycutt, T. C. , Thompkins, A. V. , Bardos, M. E. , & Stern, S. N. ((2017) ). Youth with disabilities at the crossroads: The intersection of Vocational Rehabilitation and disability benefits for youth with disabilities. Rehabilitation Counseling Bulletin, 60: (3), 131–144. https://doi.org/10.1177/0034355215621897 |
16 | IBM Corp. ((2013) ). IBM SPSS Statistics for Windows, Version 22.0 (Version 22.0). Armonk, NY: IBM Corp. |
17 | Ingoldsby, E. M. ((2010) ). Review of Interventions to Improve Family Engagement and Retention in Parent and Child Mental Health Programs. Journal of Child and Family Studies, 19: (5), 629–645. https://doi.org/10.1007/s10826-009-9350-2 |
18 | Ipsen, C. , Kurth, N. , McCormick, S. , Hall, J. , & Chambless, C. ((2019) ). Exploring the PROMISE of transition services for youth with disabilities receiving SSI. Journal of Vocational Rehabilitation, 50: (1), 95–108. https://doi.org/10.3233/JVR-180991 |
19 | Joshi, G. S. , Bouck, E. C. , & Maeda, Y. ((2012) ). Exploring employment preparation and postschool outcomes for students with mild intellectual disability. Career Development and Transition for Exceptional Individuals, 35: (2), 97–107. https://doi.org/10.1177/0885728811433822 |
20 | Karpur, A. , Clark, H. B. , Caproni, P. , & Sterner, H. ((2005) ). Transition to adult roles for students with emotional/behavioral disturbances: A follow-up study of student exiters from steps-to-success. Career Development for Exceptional Individuals, 28: (1), 36–46. https://doi.org/10.1177/08857288050280010601 |
21 | Landmark, L. J. , Ju, S. , & Zhang, D. ((2010) ). Substantiated best practices in transition: Fifteen plus years later. Career Development for Exceptional Individuals, 33: (3), 165–176. https://doi.org/10.1177/0885728810376410 |
22 | McDonnall, M. C. , & Crudden, A. (n.d.). Factors affecting the successful employment of transition-age youths with visual impairments, 14. |
23 | Nagelkerke, N. J. D. ((1991) ). A note on a general definition of the coefficient of determination. Biometrika, 78: (3), 691–692. https://doi.org/10.1093/biomet/78.3.691 |
24 | Papay, C. K. , & Bambara, L. M. ((2014) ). Best practices in transition to adult life for youth with intellectual disabilities. Career Development and Transition for Exceptional Individuals, 37: (3), 136–148. https://doi.org/10.1177/2165143413486693 |
25 | Pavetti, L. , & Stanley, M. ((2016) ). Using Incentives to Increase Engagement and Persistence in Two-Generation Programs: (p. 25). |
26 | Powers, L. E. , Garner, T. , Valnes, B. , Squire, P. , Turner, A. , Couture, T. , & Dertinger, R. ((2007) ). Building a successful adult life: Findings from youth-directed research. Exceptionality, 15: (1), 45–56. https://doi.org/10.1080/09362830709336925 |
27 | Ratcliffe, C. ((2015) ). Child Poverty and Adult Success (p. 15). Urban Institute. |
28 | Stewart, D. , Freeman, M. , Law, M. , Healy, H. , Burke-Gaffney, J. , Forhan, M. , ... Guenther, S. ((2010) ). The transition to adulthood for youth with disabilities: Evidence from the literature. In International Encyclopedia of Rehabilitation (p. 26). Buffalo: NY: Center for International Rehabilitation Research Information and Exchange. |
29 | Test, D. W. , Mazzotti, V. L. , Mustian, A. L. , Fowler, C. H. , Kortering, L. , & Kohler, P. ((2009) ). Evidence-based secondary transition predictors for improving postschool outcomes for students with disabilities. Career Development for Exceptional Individuals, 32: (3), 160–181. https://doi.org/10.1177/0885728809346960 |
30 | Urban Alliance. ((2014) ). Youth employment matters! Strengthening the youth-to-work pipeline through high-quality youth employment opportunities (Policy Brief No. 4; p. 12). Retrieved from http://www.theurbanalliance.org/wp-content/uploads/2014/10/UA-Policy-Brief-4.pdf |
31 | Wagner, M. , Newman, L. , Cameto, R. , Garza, N. , & Levine, P. ((2005) ). National Longitudinal Transition Study 2: After High School: A First Look at the Postschool Experiences of Youth with Disabilities (No. 2) (p. 190). Menlo Park, CA: SRI International. Retrieved from https://nlts2.sri.com/reports/2005_04/nlts2_report_2005_04_complete.pdf |
32 | Wehmeyer, M. L. , & Palmer, S. B. ((2003) ). Adult outcomes for students with cognitive disabilities three-years after high school: The impact of self-determination. Education and Training in Developmental Disabilities, 38: (2). Retrieved from http://www.jstor.org/stable/23879591 |
33 | Wehmeyer, M. L. , Palmer, S. B. , Shogren, K. , Williams-Diehm, K. , & Soukup, J. H. ((2013) ). Establishing a causal relationship between intervention to promote self-determination and enhanced student self-determination. The Journal of Special Education, 46: (4), 195–210. https://doi.org/10.1177/0022466910392377. |


