
Regional differences in patient-reported outcomes as a proxy of healthcare practices for Americans living with vestibular symptoms
Abstract
BACKGROUND:
Geographical location is known to affect health outcomes; however, evidence regarding whether location affects healthcare for persons suspected to have vestibular dysfunction is lacking.
OBJECTIVE:
To investigate whether location affects healthcare seeking and outcomes for adults with symptoms of vestibular pathology.
METHODS:
We assessed for regional disparities associated with demographics, diagnosis, chronological factors, and financial expenditures from Americans who participated in the Vestibular Disorders Association registry (N = 905, 57.4±12.5 years, 82.7% female, 94.8% White, and 8.1% Hispanic or Latino). Respondents were grouped per geographical regions defined by the United States Census Bureau.
RESULTS:
There were no significant between-region differences for age (p = 0.10), sex (p = 0.78), or ethnicity (p = 0.24). There were more Asian respondents in the West versus the Midwest (p = 0.05) and more Black respondents in the South versus the West (p = 0.05). The time to first seek care was shorter in the Northeast (17.3 [SD = 49.5] weeks) versus the South (42.4 [SD = 83.7] weeks), p = 0.015. The time from the first healthcare visit to receiving a final diagnosis was shorter in the Northeast (46.5 [SD = 75.4] weeks) versus the South (68.9 [SD = 89.7] weeks), p = 0.015. Compared to the Midwest, fewer respondents in the Northeast reported “no” out-of-pocket financial impact, p = 0.039.
CONCLUSIONS:
Geographical location affects healthcare seeking and outcomes for persons suspected to have vestibular dysfunction.
1Introduction
In the United States (US), falls are the fifth leading cause of death among older individuals, yet Whites are more likely than Blacks to fall and experience fall-related injuries [20]. Moreover, it has been reported that women have higher chances than men at receiving a diagnosis for their dizziness/balance symptoms; and that Black Medicare beneficiaries with dizziness are less likely to receive vestibular testing than White Medicare beneficiaries [1, 3]. Contextual factors are believed to contribute to racial disparities in healthcare. For instance, financial hardship is an important risk factor for falls in Black older adults, while home disrepair and residence in a non-metropolitan county are risk factors important to White older adults [31]. Conversely Blacks and Whites alike that suffer dizziness and imbalance are associated with higher risks of falling [24, 31]. However, the chances of receiving a diagnosis for dizziness/balance symptoms are lower for Black compared to White persons [2].
Unfortunately, the aforementioned disparities represent a small amount of evidence for healthcare inequalities in patients with vestibular pathology. In fact, a PubMed search (4.22.2022) using the terms ‘vestibular AND healthcare AND disparity’ returned only three relevant publications, with two focused on vestibular schwannoma. Equally rare in the literature are references based on patient reported outcomes (PROs) related to health disparities in vestibular populations. PROs refer to the status of a patient’s health condition that come directly from the patient [28]. Such reports are valuable tools to inform patient-centered data, and directly contribute to patient engagement –a particularly important component in the management of chronic conditions [21]. The glaring absence of disparity research in vestibular care is surprising considering vestibular disorders are highly prevalent. An estimated one third of the US population experience disorders of balance and/or vestibular function [4]. Adults and children are both impacted [9], yet evidence suggests symptoms from vestibular pathology are more common in women than men, and more common in older versus younger individuals [11]. According to the National Ambulatory Medical Care Survey (NAMCS) [7], dizziness or vertigo represent one of the top ten principal reasons for emergency department visits involving older adults, with women accounting for almost twice as many visits as men. Although dizziness in aging is known to be a significant contributor to recurrent falls [42], young adults are not immune to falling or experiencing vertigo. In fact, it was recently confirmed than 12% of adults younger than 60 years have a positive fall history. This same study reported younger adults were more likely to complain of vertigo than those older than 60 years (58.0% vs. 50.9%) [30]. Finally, white persons account for up to 80% of the cases of dizziness reported in ambulatory settings in the US compared to other racial groups [19, 43].
Though healthcare disparities are well recognized to exist in the contexts of race, ethnicity, or sex, circumstances such as socioeconomic status and geographic location similarly serve as points of distinction in healthcare. It is possible that variability in regional culture and/or resources, e.g., demographics, insurance coverage, and healthcare infrastructure, may yield differences in how patients perceive and seek care for symptoms related to vestibular dysfunction. To investigate these critical topics, we used self-reported information available through an online registry to assess specific factors across regions of the US: 1) the duration of the time from onset of vestibular symptoms to the first clinical visit that specifically addressed those symptoms, 2) the time between that first visit and when a final vestibular-related diagnosis was provided by a clinician, 3) the frequency of vestibular diagnoses, 4) and the cost expenditure associated with care for a vestibular diagnoses.
2Methods
Data collection and recruitment included adults with a suspected vestibular diagnosis who participated in the Vestibular Disorders Association (VeDA) Patient Registry from March 2014 to November 2020. The registry was conducted by VeDA using its website (www.vestibular.org), list-serve, Facebook page, and fliers distributed through healthcare providers. Information regarding the purpose of the registry and how the data would be used was provided on the registry’s internet landing page (https://connect.invitae.com/org/veda). Prior to creating an account, interested participants were advised regarding who would have access to their information, how their privacy would be protected, and whom to contact with questions. Next, participants created an account with Patient Insights Network® (PIN) developed by INVITAEtrademark and provided basic health information, e.g., the health reason for registration, and demographic information, e.g., gender, race, and ethnicity. For race and ethnicity, the information collected was mapped to the National Institute of Health (NIH) and Clinical Data Interchange Standards Consortium (CDISC). The race categories included American Indian or Alaska Native, Asian, Black or African American, Native Hawaiian or Other Pacific Islander, and White. Other categories (e.g., Ashkenazi) were set to Unknown. The Ethnicity vales were Hispanic, Non-Hispanic, or Latino.
Participants were electronically consented regarding sharing 1) their email address with non-profit advocacy organizations that support the PIN, 2) de-identified data with public databases, 3) de-identified data with researchers, and 4) completing five questionnaires. The study protocol was approved by the Advarra Institutional Review Board (IRB). The “Dizziness” questionnaire was developed by a multi-disciplinary team of VeDA Medical, Scientific, and guest Advisers (e.g., physician, physical therapist). The other four questionnaires were created by INVITAETM Corp (San Francisco CA), a company specialized in questionnaires for health-related datasets. None of the questionnaires were validated against another questionnaire, but all were approved by the Advarra IRB. Completion of the five questionnaires was voluntary, and participants could submit partially completed questionnaires, which resulted in absence of some data. The Dizziness Questionnaire consisted of 18 questions pertaining to symptoms, e.g., history of dizziness and other associated symptoms, the evaluation of dizziness, and outcomes of the evaluation of dizziness. Questions related to specific diagnoses were structured to reflect whether the participant’s vestibular dysfunction was self- and/or clinician diagnosed. The Family History Questionnaire was comprised of 15 questions relating to birth history, as well as the health history of the participant’s parents, aunts/uncles, siblings, and children (e.g., participant is an adopted or biological child, parents and/or siblings have similar symptoms). The Diagnosis Questionnaire consisted of 13 questions pertaining to the diagnostic process, e.g., age at diagnosis, healthcare provider involved in the diagnosis, and testing that led to the diagnosis. The Medical Care Questionnaire was comprised of 13 questions relating to care seeking, e.g., the frequency of seeing a healthcare provider, types of healthcare providers seen, and the financial impact of seeking care. The General Health Questionnaire included 33 questions relating to whether the participant experiences problems with each of the major body systems (e.g., presence of eye or vision problems, history of fatigue or chronic pain). Participants who endorsed problems with a specific body system were presented with follow-up questions (e.g., questions focused on the muscular or digestive systems).
The registry data included responses to questions relating to specific topics, e.g., demographics (N = 1121), self-reported diagnosis of vestibular dysfunction (N = 1357), self-reported vestibular diagnosis from a healthcare provider (N = 1634), chronological factors (N = 713), and the financial impact of out-of-pocket related healthcare costs (N = 503). The data regarding chronological factors, that is specific times or duration of relevant events (e.g., age at diagnosis, time to receive care), was initially reported as epochs of time, e.g., 4 weeks, 6 months, etc. These data were re-coded as the corresponding number of weeks for the temporal analysis we report. We excluded respondents from outside the US, those below 18 years-old, and anyone with missing data for the questions analyzed.
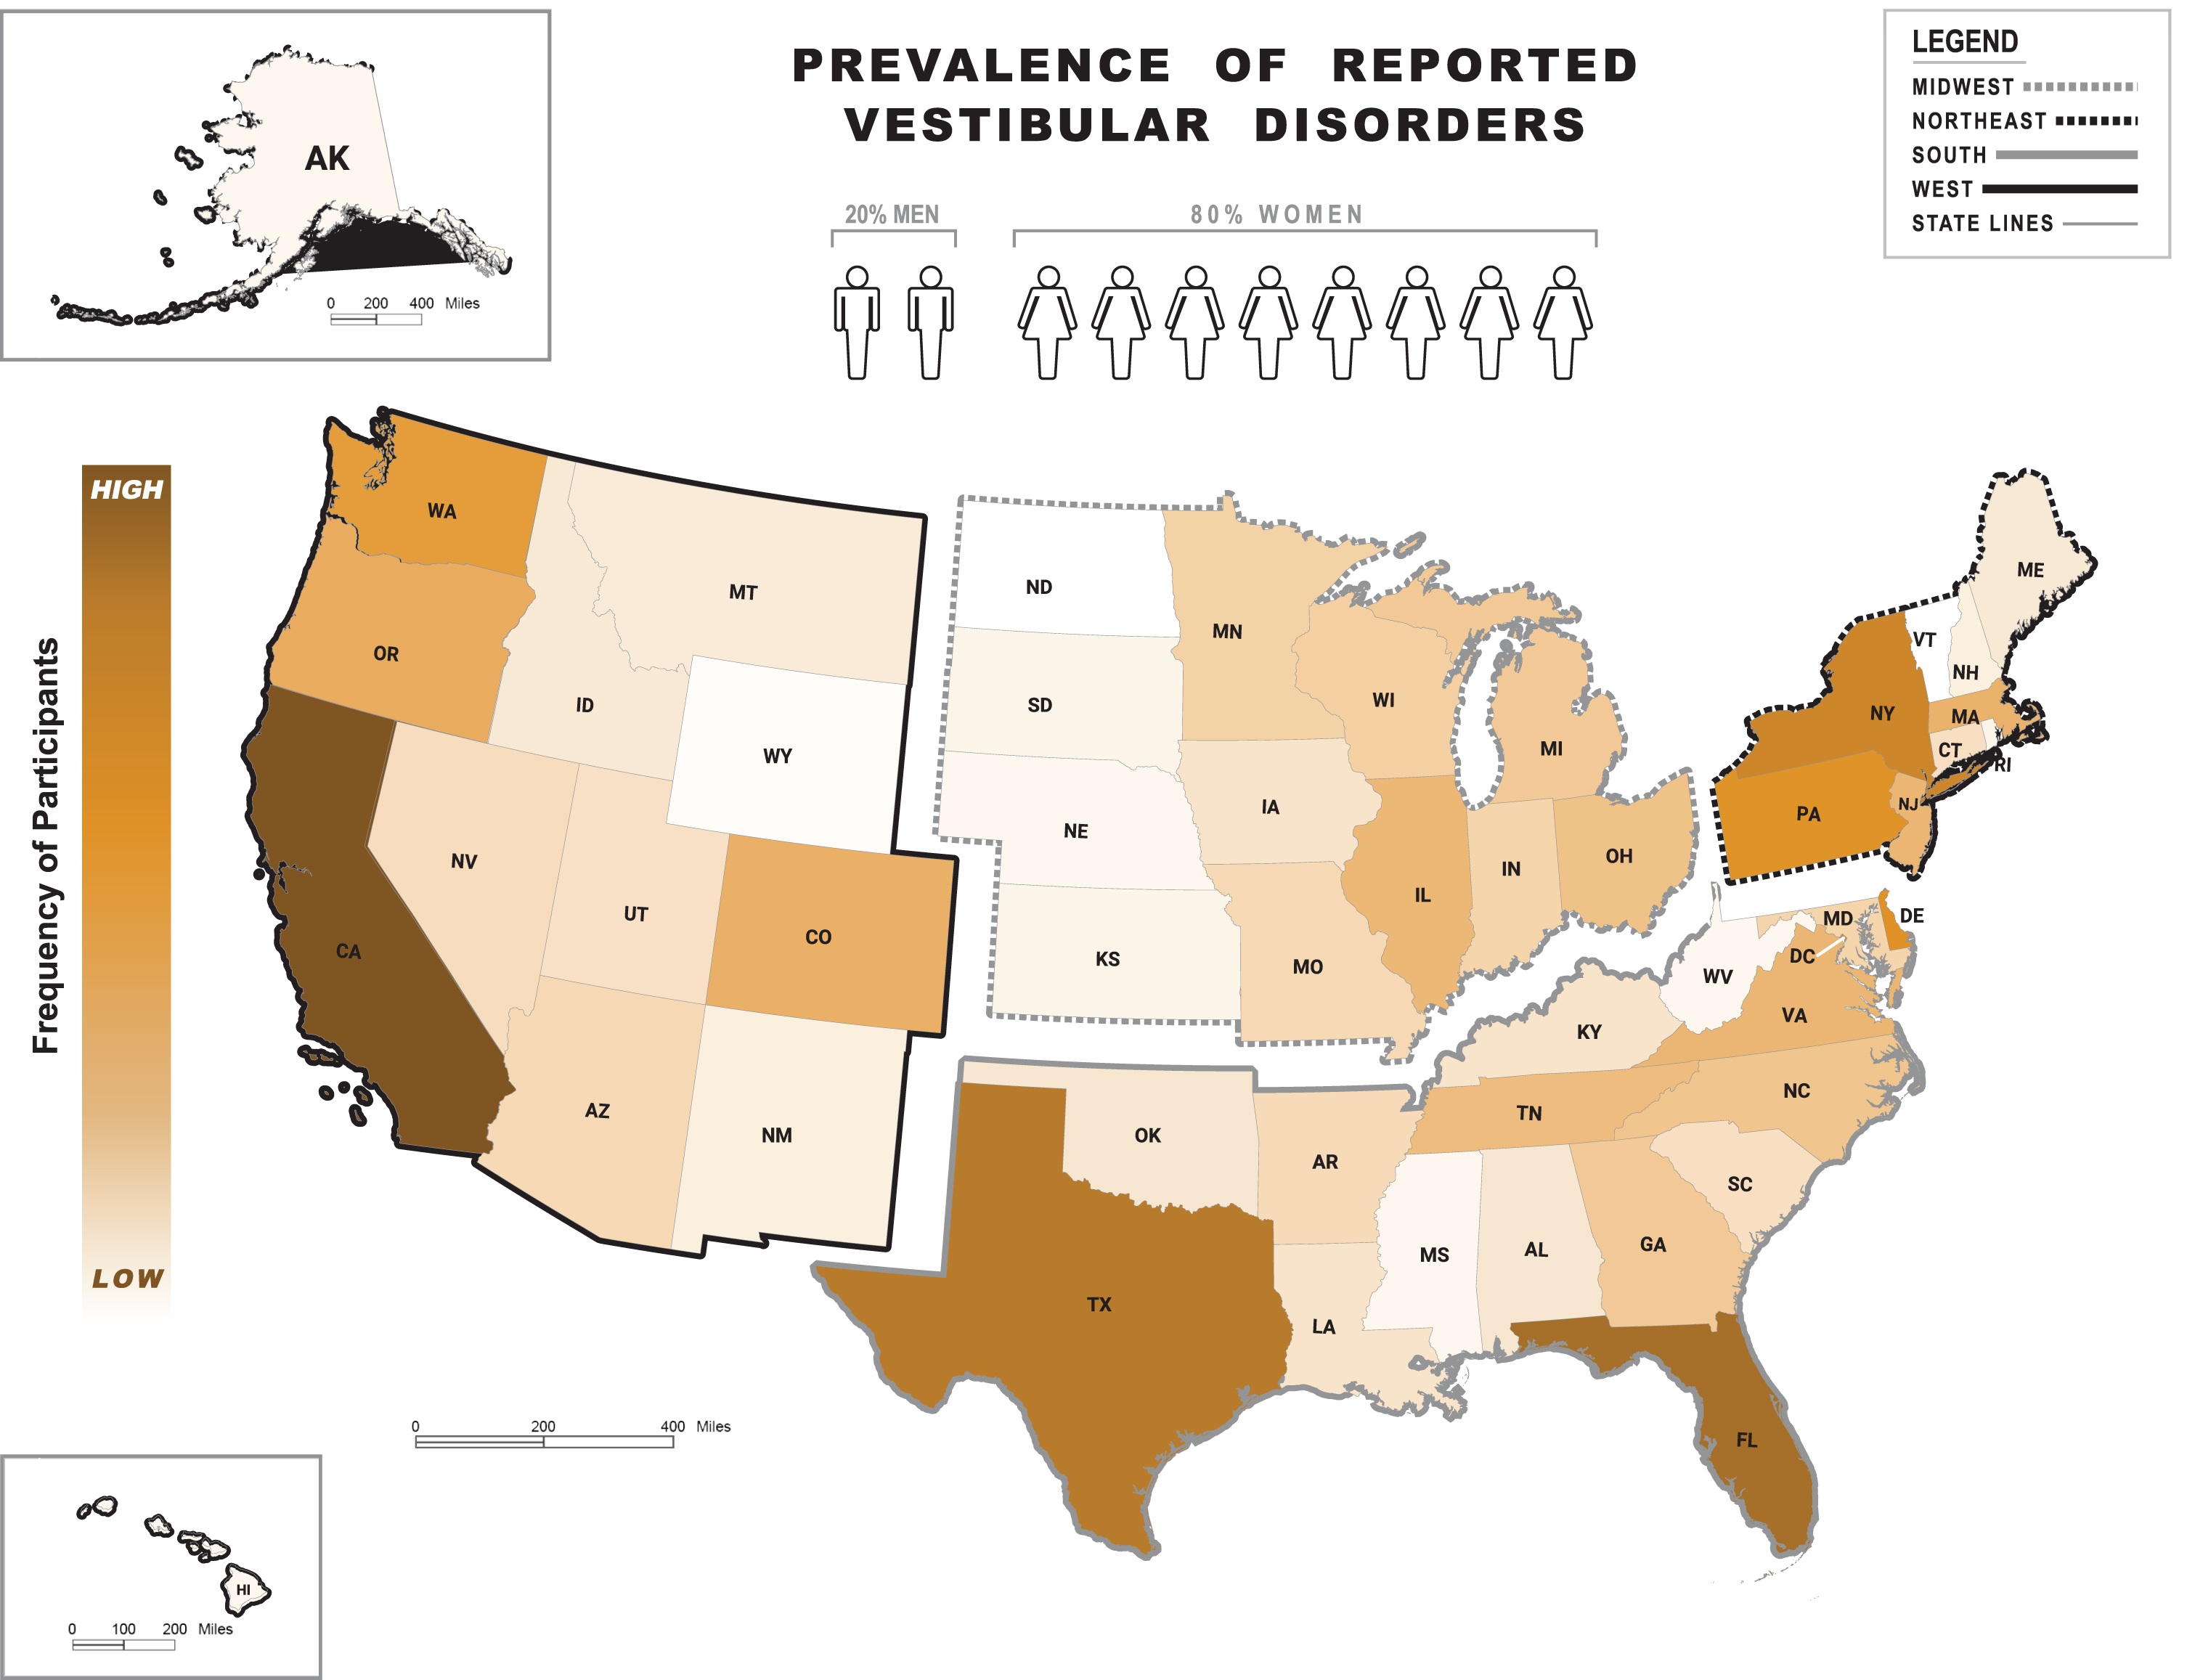
We performed cross-sectional analyses as all data from each registrant was collected at a single time point. Participants who did not submit data for a specific variable were excluded from the related analysis. All statistical analyses were conducted using R for Statistical Computing (Version 4.1.0) [34]. Each dataset was grouped using the 2020 United States Census Bureau geographical regions as depicted in Fig. 1: West, Midwest, Northeast and South [47]. One-way analyses of variance (ANOVA) and Fisher’s exact tests were used to assess between-region differences. The a priori alpha level was 0.05, and p-values were adjusted using Tukey’s Honestly Significant Difference (HSD) and Holm’s methods, respectively. Cohen’s Kappa values were computed to assess agreement between the self-reported health reason for registration and the reported final diagnosis rendered from a healthcare provider.
Fig. 1
Frequency of self-reported vestibular diagnoses. Heat map on the frequency of reported vestibular diagnoses across regions of the United States (US) as per the 2020 United States Census Bureau: West, Midwest, Northeast and South. Abbreviations shown refer to the following states (in alphabetical order): Alabama (AL), Alaska (AK), Arizona (AR), Arkansas (AK), California (CA), Colorado (CO), Connecticut (CT), Delaware (DE), Florida (FL), Georgia (GA), Hawaii (HI), Idaho (ID), Illinois (IL), Indiana (IN), Iowa (IA), Kansas (KS), Kentucky (KY), Louisiana (LA), Maine (ME), Maryland (MD), Massachusetts (MA), Michigan (MI), Minnesota (MN), Mississippi (MS), Missouri (MO), Montana (MT), Nebraska (NE), Nevada (NV), New Hampshire (NH), New Jersey (NJ), New Mexico (NM), New York (NY), North Carolina (NC), North Dakota (ND), Ohio (OH), Oklahoma (OK), Oregon (OR), Pennsylvania (PA), Rhode Island (RI), South Carolina (SC), South Dakota (SD), Tennessee (TN), Texas (TX), Utah (UT), Vermont (VT), Virginia (VA), Washington (WA), West Virginia (WV), Wisconsin (WI), Wyoming (WY). Color shade levels within states refer to the low-to-high (light-to-dark, respectively) frequency range of vestibular diagnoses. Shade levels are based on the percent of people with vestibular diagnoses in each state ranging from 0.1% (WY) to 10.1% (CA) out of the country’s total percentage. States with no shade (white color, e.g., ND and VT) had no respondents. The human symbols refer to the female (82%) versus male (18%) proportion in a sample of 905 participants based in the US and with complete information on the Dizziness Questionnaire*.
3Results
Only complete datasets relating to age at onset (n = 558), age at final diagnosis (n = 549), time from onset to first clinic visit (n = 592), time from first clinic visit to final diagnosis (n = 592), self-reported vestibular diagnoses (n = 886), self-reported vestibular diagnosis from a healthcare provider (n = 886), and related healthcare costs (n = 490) were analyzed. The distribution of participants across the US as per geographical region is illustrated in Fig. 1. There were no significant between-region differences for age (p = 0.10), sex (p = 0.78), or ethnicity (p = 0.24). Asians made up a significantly greater proportion of participants from the West (4.5%, n = 11) compared to the Midwest (0%, n = 0) (p = 0.05), and Blacks comprised a larger proportion of participants from the South (2.8%, n = 8) compared to the West (0%, n = 0) (p = 0.05). Table 1 shows demographic information, which were similar across datasets, e.g., respondents in the diagnosis dataset had a mean age of 57.4 (SD = 12.5) years and were 82.7% female, 94.8% White, and 8.1% Hispanic or Latino.
Table 1
Demographic Variables
| Variable | All | Midwest | Northeast | South | West | P-value(a) | P-value(b) | P-value(c) | P-value(d) | P-value(e) | P-value(f) | P-value(g) |
| Age (Years)* | 57.4 (12.5) n = 904 | 55.1 (12.2) | 57.6 (12.4) | 57.8 (12.2) | 58.1 (12.9) | 0.1 | 0.269 | 0.132 | 0.091 | 0.997 | 0.973 | 0.994 |
| Sex (Female)† | 748 (82.7%) n = 905 | 126 (82.9%) | 150 (80.6%) | 242 (82.9%) | 216 (84.4%) | 0.784 | 1 | 1 | 1 | 1 | 1 | 1 |
| RACE | ||||||||||||
| American Indian or Alaskan Native† | 16 (1.8%) n = 855 | 3 (2.0%) | 2 (1.1%) | 4 (1.4%) | 6 (2.4%) | 0.737 | 1 | 1 | 1 | 1 | 1 | 1 |
| Asian† | 15 (1.7%) n = 855 | 0 (0.0%) | 1 (0.6%) | 3 (1.1%) | 11 (4.5%) | 0.003‡ | 1 | 1 | 0.05‡ | 1 | 0.085 | 0.105 |
| Black† | 11 (1.3%) n = 855 | 1 (0.7%) | 1 (0.6%) | 8 (2.8%) | 0 (0.0%) | 0.012‡ | 1 | 0.816 | 1 | 0.816 | 1 | 0.05‡ |
| Native Hawaiian or Pacific Islander† | 3 (0.3%) n = 855 | 1 (0.7%) | 0 (0.0%) | 0 (0.0%) | 2 (0.8%) | 0.295 | 1 | 1 | 1 | 1 | 1 | 1 |
| White† | 824 (94.8%) n = 855 | 145 (96.7%) | 174 (97.8%) | 266 (94.7%) | 227 (92.3%) | 0.059 | 0.945 | 0.945 | 0.426 | 0.593 | 0.095 | 0.87 |
| Unknown† | 7 (0.8%) n = 862 | 1 (0.7%) | 1 (0.6%) | 2 (0.7%) | 3 (1.2%) | 0.911 | 1 | 1 | 1 | 1 | 1 | 1 |
| ETHNICITY | ||||||||||||
| Hispanic or Latino† | 39 (8.1%) n = 480 | 2 (2.7%) | 9 (8.3%) | 15 (9.4%) | 13 (9.9%) | 0.24 | 0.204 | 0.102 | 0.091 | 0.83 | 0.823 | 1 |
* = Data are reported as mean (SD) from analysis of variance. † = Data are reported as N (%) number available for analysis from Fisher’s Exact tests. ‡P-value <0.05. P-values are (a) for an overall Fisher’s Exact test, (b) for Northeast versus Midwest, (c) for South versus Midwest, (d) for West versus Midwest, (e) for South versus Northeast. (f) for West versus Northeast, and (g) for West versus South. The (b) –(g) P-values were adjusted for multiple comparisons using Holm’s method.
Chronological results are shown in Table 2. Overall, the mean (SD) times from the onset of symptoms to the first related healthcare visit (T1) and from the first related healthcare visit to receiving a final diagnosis (T2) were 31.9 (71.3) weeks and 62.3 (86.0) weeks, respectively. The mean (SD) for T1 was significantly shorter for participants from the Northeast compared to the South (Northeast = 17.3 [49.5] weeks versus South = 42.4 [83.7] weeks, p = 0.015). Similarly, the mean (SD) for T2 was significantly shorter for respondents from the Northeast compared to the South (Northeast = 46.5 [75.4] weeks versus South = 68.9 [89.7] weeks, p = 0.015). Overall, 96% of participants reported having diagnoses provided from a healthcare provider. The most common diagnoses reported in this registry of US adults were Meniere’s disease (21.0%), vestibular migraine (13.1%), labyrinthitis/vestibular neuritis (10.8%), benign paroxysmal positional vertigo (BPPV) (10.6%), and bilateral vestibular hypofunction (7.3%), Table 3. Agreement between the self-reported health reason for registration and the reported final diagnoses made by a healthcare provider was 0.67 (Meniere’s disease), 0.50 (vestibular migraine), 0.32 (labyrinthitis/vestibular neuritis), 0.36 (BPPV), 0.70 (bilateral vestibular hypofunction), 0.83 (superior canal dehiscence), and 0.53 (acoustic neuroma/vestibular schwannoma). The proportions of each vestibular diagnosis were similar across geographical regions.
Table 2
Chronological variables
| Variable | All | Midwest | Northeast | South | West | P-value(a) | P-value(b) | P-value(c) | P-value(d) | P-value(e) | P-value(f) | P-value(g) |
| Age at Symptoms Onset (Years)* | 43.7 (15.1) n = 558 | 40.0 (15.3) | 44.9 (14.7) | 43.4 (14.8) | 45.1 (15.2) | 0.054 | 0.094 | 0.303 | 0.049‡ | 0.846 | 0.999 | 0.729 |
| Age at Presentation to Healthcare Provider (Years)* | 44.6 (14.6) n = 479 | 41.1 (15.3) | 44.9 (14.3) | 44.4 (14.4) | 46.3 (14.2) | 0.09 | 0.27 | 0.362 | 0.056 | 0.991 | 0.887 | 0.7 |
| Age at Diagnosis (Years)* | 47.8 (12.9) n = 549 | 44.7 (12.9) | 47.5 (13.3) | 48.6 (12.2) | 48.9 (13.0) | 0.074 | 0.413 | 0.095 | 0.072 | 0.888 | 0.807 | 0.996 |
| Time from symptom onset to seek care (Weeks)* | 31.9 (71.3) n = 592 | 29.0 (68.9) | 17.3 (49.5) | 42.4 (83.7) | 33.0 (69.8) | 0.027‡ | 0.632 | 0.454 | 0.972 | 0.015‡ | 0.25 | 0.613 |
| Time from first healthcare visit to final diagnosis (Weeks)* | 62.3 (86.0) n = 592 | 71.3 (90.8) | 46.5 (75.4) | 68.9 (89.7) | 60.3 (84.6) | 0.027‡ | 0.632 | 0.454 | 0.972 | 0.015‡ | 0.25 | 0.613 |
* = Data are reported as mean (SD) from analysis of variance. † = Data are reported as N (%) number available for analysis from Fisher’s Exact tests. ‡P-value <0.05. P-values are (a) for an overall Fisher’s Exact test, (b) for Northeast versus Midwest, (c) for South versus Midwest, (d) for West versus Midwest, (e) for South versus Northeast. (f) for West versus Northeast, and (g) for West versus South. The (b) –(g) P-values were adjusted for multiple comparisons using Holm’s method.
Table 3
Diagnosis Variables
| Variable | All | Midwest | Northeast | South | West | P-value(a) | P-value(b) | P-value(c) | P-value(d) | P-value(e) | P-value(f) | P-value(g) |
| Meniere’s Disease† | 190 (21.0%) n = 886 | 41 (27.0%) | 38 (20.4%) | 58 (19.9%) | 48 (18.8%) | 0.241 | 0.785 | 0.468 | 0.376 | 1 | 1 | 1 |
| Vestibular Migraine† | 119 (13.1%) n = 886 | 17 (11.2%) | 22 (11.8%) | 36 (12.3%) | 44 (17.2%) | 0.239 | 1 | 1 | 0.689 | 1 | 0.689 | 0.689 |
| Labyrinthitis / Vestibular Neuritis† | 98 (10.8%) n = 886 | 12 (7.9%) | 25 (13.4%) | 35 (12.0%) | 22 (8.6%) | 0.224 | 0.703 | 0.791 | 1 | 1 | 0.703 | 0.791 |
| Benign paroxysmal positional vertigo† | 96 (10.6%) n = 886 | 24 (15.8%) | 22 (11.8%) | 28 (9.6%) | 21 (8.2%) | 0.102 | 1 | 0.311 | 0.132 | 1 | 1 | 1 |
| Bilateral Vestibular Hypofunction† | 66 (7.3%) n = 886 | 5 (3.3%) | 15 (8.1%) | 25 (8.6%) | 20 (7.8%) | 0.172 | 0.433 | 0.269 | 0.433 | 1 | 1 | 1 |
| Superior Canal Dehiscence† | 17 (1.9%) n = 886 | 3 (2.0%) | 3 (1.6%) | 6 (2.1%) | 5 (2.0%) | 1 | 1 | 1 | 1 | 1 | 1 | 1 |
| Acoustic Neuroma† | 14 (1.5%) n = 886 | 2 (1.3%) | 3 (1.6%) | 6 (2.1%) | 2 (0.8%) | 0.691 | 1 | 1 | 1 | 1 | 1 | 1 |
| Ototoxicity† | 8 (0.9%) n = 886 | 2 (1.3%) | 1 (0.5%) | 2 (0.7%) | 3 (1.2%) | 0.801 | 1 | 1 | 1 | 1 | 1 | 1 |
| Not Yet Diagnosed† | 28 (3.1%) n = 886 | 7 (4.6%) | 1 (0.5%) | 10 (3.4%) | 10 (3.9%) | 0.068 | 0.149 | 1 | 1 | 0.228 | 0.149 | 1 |
* = Data are reported as mean (SD) from analysis of variance. † = Data are reported as N (%) number available for analysis from Fisher’s Exact tests. P-value <0.05. P-values are (a) for an overall Fisher’s Exact test, (b) for Northeast versus Midwest, (c) for South versus Midwest, (d) for West versus Midwest, (e) for South versus Northeast. (f) for West versus Northeast, and (g) for West versus South. The (b)–(g) P-values were adjusted for multiple comparisons using Holm’s method.
Overall, 75.2% of respondents reported incurring $0–$5,000 in related out-of-pocket healthcare costs, Table 4. Across regions, 51.5% of respondents reported that insurance covered $0–$5,000 in related healthcare costs. Nationwide, the financial impact was reported as either “none” (7.5%), “minimal” (29.5%), “moderate” (24.9%), “major” (31.0%), or “unsure” (5.2%). Compared to those from the Midwest, more respondents in the Northeast reported “no” out-of-pocket financial impact (Midwest = 1.1% versus Northeast = 10.6%, p = 0.039). Conversely, compared to those from the Northeast, more participants in the Midwest reported a “major” out-of-pocket financial impact (Midwest = 36.0% versus Northeast = 20.2%), though this was not statistically significant after adjusting for comparisons.
Table 4
Financial Variables
| Variable | All | Midwest | Northeast | South | West | P-value(a) | P-value(b) | P-value(c) | P-value(d) | P-value(e) | P-value(f) | P-value(g) |
| Patient’s cost per year | ||||||||||||
| None† | 33 (6.7%) n = 490 | 6 (6.8%) | 9 (8.6%) | 8 (4.9%) | 10 (7.4%) | 0.647 | 1 | 1 | 1 | 1 | 1 | 1 |
| Less than $500† | 122 (24.9%) n = 490 | 19 (21.6%) | 28 (26.7%) | 42 (25.9%) | 33 (24.4%) | 0.852 | 1 | 1 | 1 | 1 | 1 | 1 |
| $500–$1,000† | 80 (16.3%) n = 490 | 20 (22.7%) | 19 (18.1%) | 23 (14.2%) | 18 (13.3%) | 0.238 | 1 | 0.6 | 0.6 | 1 | 1 | 1 |
| $1,000–$2,500† | 73 (14.9%) n = 490 | 14 (15.9%) | 14 (13.3%) | 26 (16.0%) | 19 (14.1%) | 0.923 | 1 | 1 | 1 | 1 | 1 | 1 |
| $2,500–$5,000† | 61 (12.4%) n = 490 | 12 (13.6%) | 14 (13.3%) | 17 (10.5%) | 18 (13.3%) | 0.815 | 1 | 1 | 1 | 1 | 1 | 1 |
| $5,000–$10,000† | 35 (7.1%) n = 490 | 4 (4.5%) | 6 (5.7%) | 12 (7.4%) | 13 (9.6%) | 0.514 | 1 | 1 | 1 | 1 | 1 | 1 |
| $10,000–$25,000† | 11 (2.2%) n = 490 | 1 (1.1%) | 1 (1.0%) | 8 (4.9%) | 1 (0.7%) | 0.076 | 1 | 0.664 | 1 | 0.467 | 1 | 0.259 |
| $25,000–$50,000† | 3 (0.6%) n = 490 | 1 (1.1%) | 0 (0.0%) | 2 (1.2%) | 0 (0.0%) | 0.407 | 1 | 1 | 1 | 1 | 1 | 1 |
| Unsure† | 66 (13.5%) n = 490 | 10 (11.4%) | 14 (13.3%) | 21 (13.0%) | 21 (15.6%) | 0.846 | 1 | 1 | 1 | 1 | 1 | 1 |
| Insurance covered cost per year | ||||||||||||
| None† | 51 (10.5%) n = 488 | 8 (9.1%) | 15 (14.3%) | 15 (9.3%) | 13 (9.7%) | 0.574 | 1 | 1 | 1 | 1 | 1 | 1 |
| Less than $500† | 62 (12.7%) n = 488 | 7 (8.0%) | 17 (16.2%) | 22 (13.7%) | 16 (11.9%) | 0.369 | 0.744 | 1 | 1 | 1 | 1 | 1 |
| $500–$1,000† | 47 (9.6%) n = 488 | 14 (15.9%) | 7 (6.7%) | 17 (10.6%) | 9 (6.7%) | 0.103 | 0.307 | 0.934 | 0.246 | 0.934 | 1 | 0.934 |
| $1,000–$2,500† | 53 (10.9%) n = 488 | 6 (6.8%) | 13 (12.4%) | 19 (11.8%) | 15 (11.2%) | 0.591 | 1 | 1 | 1 | 1 | 1 | 1 |
| $2,500–$5,000† | 38 (7.8%) n = 488 | 7 (8.0%) | 9 (8.6%) | 9 (5.6%) | 13 (9.7%) | 0.575 | 1 | 1 | 1 | 1 | 1 | 1 |
| $5,000–$10,000† | 50 (10.2%) n = 488 | 10 (11.4%) | 10 (9.5%) | 11 (6.8%) | 19 (14.2%) | 0.209 | 1 | 1 | 1 | 1 | 1 | 0.311 |
| $10,000–$25,000† | 29 (5.9%) n = 488 | 8 (9.1%) | 4 (3.8%) | 10 (6.2%) | 7 (5.2%) | 0.481 | 0.88 | 1 | 1 | 1 | 1 | 1 |
| $25,000–$50,000† | 9 (1.8%) n = 488 | 2 (2.3%) | 1 (1.0%) | 4 (2.5%) | 2 (1.5%) | 0.805 | 1 | 1 | 1 | 1 | 1 | 1 |
| $50,000–$75,000† | 3 (0.6%) n = 488 | 1 (1.1%) | 0 (0.0%) | 2 (1.2%) | 0 (0.0%) | 0.408 | 1 | 1 | 1 | 1 | 1 | 1 |
| $75,000–$100,000† | 1 (0.2%) n = 488 | 0 (0.0%) | 1 (1.0%) | 0 (0.0%) | 0 (0.0%) | 0.395 | 1 | 1 | 1 | 1 | 1 | 1 |
| Over $100,000† | 4 (0.8%) n = 488 | 0 (0.0%) | 1 (1.0%) | 3 (1.9%) | 0 (0.0%) | 0.36 | 1 | 1 | 1 | 1 | 1 | 1 |
| Unsure† | 136 (27.9%) n = 488 | 24 (27.3%) | 26 (24.8%) | 48 (29.8%) | 38 (28.4%) | 0.848 | 1 | 1 | 1 | 1 | 1 | 1 |
| Patient incurred costs for not seeking care | ||||||||||||
| Yes† | 155 (31.4%) n = 493 | 28 (31.5%) | 23 (21.7%) | 59 (36.2%) | 45 (33.3%) | 0.078 | 0.568 | 1 | 1 | 0.087 | 0.303 | 1 |
| No† | 327 (66.3%) n = 493 | 57 (64.0%) | 82 (77.4%) | 99 (60.7%) | 89 (65.9%) | 0.036 | 0.28 | 1 | 1 | 0.031‡ | 0.28 | 1 |
| Unsure† | 8 (1.6%) n = 493 | 2 (2.2%) | 1 (0.9%) | 4 (2.5%) | 1 (0.7%) | 0.661 | 1 | 1 | 1 | 1 | 1 | 1 |
| Perceived financial impact of vestibular disorder | ||||||||||||
| None† | 36 (7.5%) n = 478 | 1 (1.1%) | 11 (10.6%) | 13 (8.4%) | 11 (8.4%) | 0.035 | 0.039‡ | 0.102 | 0.12 | 1 | 1 | 1 |
| Minimal† | 141 (29.5%) n = 478 | 30 (33.7%) | 34 (32.7%) | 45 (29.2%) | 32 (24.4%) | 0.4 | 1 | 1 | 1 | 1 | 1 | 1 |
| Moderate† | 119 (24.9%) n = 478 | 20 (22.5%) | 30 (28.8%) | 34 (22.1%) | 35 (26.7%) | 0.564 | 1 | 1 | 1 | 1 | 1 | 1 |
| Major† | 148 (31.0%) n = 478 | 32 (36.0%) | 21 (20.2%) | 54 (35.1%) | 41 (31.3%) | 0.042 | 0.08 | 1 | 1 | 0.07 | 0.293 | 1 |
| Unsure† | 25 (5.2%) n = 478 | 5 (5.6%) | 7 (6.7%) | 6 (3.9%) | 7 (5.3%) | 0.755 | 1 | 1 | 1 | 1 | 1 | 1 |
* = Data are reported as mean (SD) from analysis of variance. † = Data are reported as N (%) number available for analysis from Fisher’s Exact tests. ‡P-value <0.05. P-values are (a) for an overall Fisher’s Exact test, (b) for Northeast versus Midwest, (c) for South versus Midwest, (d) for West versus Midwest, (e) for South versus Northeast. (f) for West versus Northeast, and (g) for West versus South. The (b)–(g) P-values were adjusted for multiple comparisons using Holm’s method.
4Discussion
We investigated differences in healthcare provision as reported by patients living with vestibular disorders across the US. Our results were mostly similar throughout the country, with few significant differences observed across the four regions. Overall, we found that individuals waited more than six months to first seek healthcare to address their symptoms, and clinicians needed more than a year to establish a diagnosis. Meniere’s disease, vestibular migraine, vestibular neuritis, BPPV and bilateral hypofunction were most frequently reported, in decreasing order. Most participants reported spending between $0–5,000 to address their vestibular symptoms, in line with a recent report of $2,658.72 as the mean incremental healthcare expenditure directly associated with vertigo and dizziness in the US [36]. Only half of the participants received insurance coverage in amounts equivalent to their own expenditure.
4.1Duration to seek care
Unlike other conditions that prompt immediate action to care (e.g., bone fracture), vestibular symptoms are tolerated beyond six months, on average, before seeking professional help. One reason may be that some of these symptoms are mistaken for other conditions. Vestibular migraine, for instance, is widely known as a “chameleon” disease that is difficult to diagnose and frequently mis-classified as either benign or sinister [23, 40]. Additionally, vestibular symptoms tend to be episodic or triggered only during specific positions [5]. As a result, individuals may initially adopt a “watch-and-wait” strategy or restrict behaviors to avoid episodes/symptoms [50]. This certainly is common in patients with BPPV, who experience position dependent episodes of symptoms lasting less than 60 seconds [16] and soon learn to avoid the provocative position. This restrictive approach, though not curative, is occasionally suggested by clinicians after canalith repositioning techniques [32, 44], which may reinforce the patient’s assumptions related to future episodes. Other possibilities for delaying care may include an inability to take time from work, not having insurance coverage, or difficulties in transportation to seek care.
The vestibular system is highly adaptable [12] with compensation for eighth cranial nerve section typically occurring within seven days [27]. Furthermore, individuals may learn how to cope with their symptoms by deploying strategies that allow them to remain functional despite their vestibular impairment [49]. This behavior, largely based on the apparent improvement of symptoms, is explicitly seen with vestibular schwannoma, in which patients demonstrate better postural control at intermediate stages of tumor development, only to observe further balance declines at later stages when the tumor is significantly larger and compensatory strategies are no longer effective [35].
Interestingly, our data revealed that the duration of time from onset of symptoms to first clinical visit, and from that 1st visit to the establishment of a diagnosis were three times shorter for individuals in the Northeast compared to the South. This difference may be associated with the greater availability of clinicians in the Northeast compared to the South [15]. In fact, according to the 2021 HRSA, the Northeast is the region in the US epxeriencing the lowest need for healthcare professionals, while the South constitutes one of the most medically underserved areas/populations of the country.
4.2Diagnoses
Our data revealed that patients reported Meniere’s disease as being the most common diagnosis associated with the symptoms of dizziness, followed by vestibular migraine, vestibular neuritis and BPPV. These patient-reported results only partially agree with a previous report on the prevalence of dizziness in the global population [6]. Apart from cardiovascular reasons, that report listed three of the same vestibular-related diagnoses, but the rank order was led by BPPV, followed by vestibular neuritis and Méniere’s disease. Moreover, only 16% of the studies in that report were conducted in the US, which may not generalize to the US population.
Variability between reports on the prevalence of vestibular diagnoses may be associated with the clinical environment from which data were acquired, e.g., primary versus specialized care. In Bösner’s study, results were based on information from primary care services overseen by general practitioners (GPs), and our study relied on self-reported diagnoses said to be confirmed by GPs and/or specialists, e.g., otolaryngologists and neuro-otologists. In assessments performed by GPs, BPPV is likely to be more readily diagnosed compared to other causes of dizziness, such as vestibular neuritis. This is because verification of BPPV is less complicated, e.g., bedside examination, whereas other diagnoses warrant more sophisticated testing that is atypical in primary care settings [13]. This may explain why BPPV leads the list of dizziness-related diagnoses in primary but not specialized care. It is noteworthy, however, that although GPs can be trained to assess and treat BPPV, canalith repositioning maneuvers are still widely underused in primary care [45, 48].
Additionally, as previously reported by Grill and colleagues [13], the criteria used for assessing and referring vestibular patients to specialists are not well established in the US, which may impede diagnostic accuracy even amongst specialists or contribute to variability in medical care. In turn, this may promote patients’ reported lack of confidence in their diagnoses, as well as lack of engagement with therapeutic interventions [8]. It is interesting that the agreement between self-reported health reason for registration and the diagnosis confirmed by a clinician was lower for labyrinthitis, BPPV and vestibular migraine than for superior canal dehiscence and Meniere’s disease. That may represent the terms labyrinthitis, BPPV and migraine are more widely known in the general population though not fully understood, and hence prone to be mistakenly labelled by patients with dizziness or vertigo. For instance, about 30% of vestibular migraine episodes are not accompanied by headache [39]. However, a diagnosis of vestibular migraine is often received with uncertainty from patients that do not experience headaches given the popular misconception that to have a migraine is to experience severe headache. Conversely, it is suggested that persons experiencing symptoms of less well-known diagnoses might research for more specific information, perhaps increasing the accuracy between their believed diagnosis and the one provided by a clinician [22].
4.3Costs
Nearly $4 billion per year in the US is spent on evaluating patients with dizziness in the emergency department –half of which is attributed to BPPV [37]. In addition to the US national costs, living with vestibular symptoms also represents a “major” personal financial impact as reported by over 30% of participants in the VeDA registry. This could be associated with the duration experienced to reach a final diagnosis, during which time patients may visit several specialists and received repeated, costly assessments [1, 36, 43]. Another potential contributor to costs is the fact that while not having a proper diagnosis, individuals may try multiple therapeutic strategies, e.g., alternative therapies, non-traditional medicines, novel devices, as an attempt to mitigate their symptoms [18, 38, 41].
Individuals from the Northeast were less likely to report a financial impact compared to those in the Midwest. Conversely, participants from the Midwest tended to classify their out-of-pocket expenditure as a major impact more often than those in the Northeast. These results disagree with a recent report on dizziness-related costs in the US that showed people from the Northeast incur expenditure ratios significantly higher than all other regions [36]. The discrepancy is likely related to the method of data collection. Ruthberg’s team assessed self-reported data from a broader practice environment of healthcare providers including costly emergency departments. Our study assessed the same regions but relied on fewer healthcare provider environments, e.g., inpatient and outpatient clinics. Considering that the Northeast has a significantly greater per capita amount of healthcare providers, and a higher population density compared to other US regions [46] –the inclusion of multiple services paid by so many users would justify the higher expenditure compared to other regions.
5Study limitations and conclusions
This registry was created with the intent of equitable access, yet older White women were the predominant responders. While this may be seen as a limiting factor for population generalizability, this result is in line with previous studies based on both patient-reported and directly measured outcomes that also show significantly higher involvement of vestibular disorders in older White women [2, 11, 19, 36]. Nevertheless, alternative rationales may explain the population homogeneity seen in our study. For example, women are known to better engage in initiatives for their health, while men tend to neglect healthcare, particularly at the preventive stages [33]. Additionally, given the self-reported nature of our data, it is plausible to infer that the current online surveys designed for the collection of self-generated health outcomes may not ideally foster the participation of traditionally less responsive populations such as men and people of color [17, 26]. Furthermore, it is possible that sampling of participants through online surveys was influenced by selection bias led by population characteristics such as educational level, social status, limited internet connectivity and both digital and health literacy [10, 14, 25, 29], which could have favored older female white participants over other populations, potentially also contributing to recall bias and limited generalizability of the reported outcomes. Finally, it is possible that white participants –who have significantly better access to vestibular healthcare [1–3] –enrolled more because they were not satisfied with how their case was managed and saw in the directory a way towards self-agency [51]. Conversely, some participants may have felt that they were in a position of privilege, and hence had to contribute by sharing their perception.
Altogether, this study adds to the very limited body of literature on how vestibular diagnoses are perceived and managed in association with regional variability in the United States. The predominantly white respondent population engaging with the registry model we presented suggests that online surveys could be a useful, albeit limiting strategy to assess healthcare seeking behaviors in the vestibular population. Future research on alternative methods for the virtual assessment of self-reported outcomes in individuals with vestibular symptoms should be conducted, particularly focused on the inclusion of non-white individuals, low-income groups and those living in non-metropolitan area, all of which are factors that could significantly impact the outcomes we investigated and further contribute to improved strategies for vestibular care more equitably delivered.
Acknowledgments
We thank Habib Rizk, MD Msc and Ryan Marquardt for insightful comments on the manuscript, and Michal Ogar for assisting with the design of Fig. 1.
References
[1] | Adams M.E. , Marmor S. Dizziness diagnostic pathways: Factors impacting setting, provider, and diagnosis at presentation, Otolaryngol Head Neck Surg (2021). |
[2] | Adams M.E. , Marmor S. , Yueh B. , Kane R.L. Geographic variation in use of vestibular testing among medicare beneficiaries, Otolaryngology-Head and Neck Surgery 156: (2), ((2017) ) 312–320. |
[3] | Adams M.E. , Yueh B. , Marmor S. Clinician use and payments by medical specialty for audiometric and vestibular testing among US medicare beneficiaries, JAMA Otolaryngology–Head & Neck Surgery 146: (2), ((2019) ) 143–149. |
[4] | Agrawal Y. , Carey J.P. , Della Santina C.C. , Schubert M.C. , Minor L.B. , Disorders of balance and vestibular function in US adults: Data from the national health and nutrition examination survey, -, Archives of Internal Medicine (1960) 169: (10), ((2009) ) 938–944. |
[5] | Bisdorff A.R. , Staab J.P. , Newman-Toker D.E. Overview of the international classification of vestibular disorders, Neurologic Clinics 33: (3), ((2015) ) 541–550. |
[6] | Bösner S. , Schwarm S. , Grevenrath P. , Schmidt L. , Hörner K. , Beidatsch D. , Bergmann M. , Viniol A. , Becker A. , Haasenritter J. Prevalence, aetiologies and prognosis of the symptom dizziness in primary care –a systematic review, BMC Family Practice 19: (1), ((2018) ) 33. |
[7] | Cairns C. , Kang K. , Santo L. National hospital ambulatory medical care survey: 2018 emergency department summary tables, (2021). https://www.cdc.gov/nchs/data/nhamcs/webtables/2018-ed-web-tables-508.pdf. |
[8] | Chiao W. , Krauter R. , Kirk L. , Steenerson K. , Pasquesi L. , Sharon J. Understanding dizzy patients a cross- sectional analysis of attitudes toward diagnosis, providers, and treatment, Annals of Otology, Rhinology & Laryngology (2021). |
[9] | Dasgupta S. , Mandala M. , Salerni L. , Crunkhorn R. , Ratnayake S. Dizziness and balance problems in children, Current Treatment Options in Neurology 22: (3), ((2020) ). |
[10] | Diviani N. , van B. den Putte, S. Giani and J.C. van Weert, Low health literacy and evaluation of online health information: A systematic review of the literature, Journal of Medical Internet Research 17: (5), ((2015) ) e4018. |
[11] | Dunlap P. , Khoja S. , Whitney S. , Freburger J. Assessment of health care utilization for dizziness in ambulatory care settings in the united states, Otology & Neurotology ((2019) ) 40: (9), e918–e924. |
[12] | Gimmon Y. , Migliaccio A.A. , Todd C.J. , Figtree W.V.C. , Schubert M.C. Simultaneous and opposing horizontal VOR adaptation in humans suggests functionally independent neural circuits, Journal of Neurophysiology 120: (4),((2018) ) 1496–1504. |
[13] | Grill E. , Penger M. , Kentala E. Health care utilization, prognosis and outcomes of vestibular disease in primary care settings: Systematic review, J Neurol 263: (S1), ((2016) ) 36. |
[14] | Hargittai E. , Piper A.M. , Morris M.R. From internet access to internet skills: Digital inequality among older adults, Universal Access in the Information Society 18: (4), ((2019) ) 881–890. |
[15] | Health Resources and Services Administration. Medically underserved areas and populations, 2021. |
[16] | Hunt W.T. , Zimmermann E.F. , Hilton M.P. , Hilton M.P. Modifications of the epley (canalith repositioning) manoeuvre for posterior canal benign paroxysmal positional vertigo (BPPV),, Cochrane Library 2012: (4), ((2012) ) CD008675. |
[17] | Jang M. , Vorderstrasse A. Socioeconomic status and racial or ethnic differences in participation: Web-based survey, JMIR Research Protocols 8: (4), ((2019) ) e11865. |
[18] | Jonas W.B. , Eisenberg D. , Hufford D. , Crawford C. The evolution of complementary and alternative medicine (CAM) in the USA over the last 20 years, Cmr 20: (1), ((2013) ) 65–72. |
[19] | Kerber K.A. , Callaghan B.C. , Telian S.A. , Meurer W.J. , Skolarus L.E. , Carender W. , Burke J.F. Dizziness symptom type prevalence and overlap: A US nationally representative survey, The American Journal of Medicine 130: (12), ((2017) ) 1465.e1–1465.e9. |
[20] | Kiely D.K. , Kim D.H. , Gross A.L. , Habtemariam D.A. , Leveille S.G. , Li W. , Lipsitz L.A. Fall risk is not black and white, J Health Dispar Res Pract 8: (3), ((2015) ) 72–84. |
[21] | Lavallee D.C. , Chenok K.E. , Love R.M. , Petersen C. , Holve E. , Segal C.D. , Franklin P.D. Incorporating patient-reported outcomes into health care to engage patients and enhance care, Health Affairs Web Exclusive 35: (4), ((2016) ) 575–582. |
[22] | Levine D.M. , Mehrotra A. Assessment of diagnosis and triage in validated case vignettes among nonphysicians before and after internet search, JAMA Network Open 4: (3), ((2021) ) e213287. |
[23] | Li M. , Xu X. , Qi W. , Liang Y. , Huang Y. , Huang H. Vestibular migraine: The chameleon in vestibular disease, Neurological Sciences 42: (5), ((2021) ) 1719–1731. |
[24] | Lin H.W. , Bhattacharyya N. Impact of dizziness and obesity on the prevalence of falls and fall-related injuries, The Laryngoscope 124: (12) ((2014) ), 2797–2801. |
[25] | Mackert M. , Mabry-Flynn A. , Champlin S. , Donovan E.E. , Pounders K. Health literacy and health information technology adoption: The potential for a new digital divide, Journal of Medical Internet Research 18: (10), ((2016) ) e264. |
[26] | Maddox K.E.J. , James C.V. How the biden administration can improve health equity for racial and ethnic minority populations, JAMA: The Journal of the American Medical Association 325: (14), ((2021) ) 1387–1388. |
[27] | Mantokoudis G. , Schubert M. , Saber T.A. , Wong A. , Agrawal Y. Early adaptation and compensation of clinical vestibular responses after unilateral vestibular deafferentation surgery, Otology & Neurotology 35: (1), ((2014) ) 148–154. |
[28] | Mercieca-Bebber R. , King M.T. , Calvert M.J. , Stockler M.R. , Friedlander M. The importance of patient-reported outcomes in clinical trials and strategies for future optimization, Prom 9: , ((2018) ) 353. |
[29] | Nayak , Prasad M.S.D. , Narayan K.A. , Strengths and weaknesses of online surveys, Technology 6: , ((2019) ) 7. |
[30] | Nimmo Z.M. , Hwa T.P. , Naples J.G. , Shah R. , Brant J.A. , Eliades S.J. , Bigelow D.C. , Ruckenstein M.J. Age-related patterns of vestibular dysfunction in dizziness and imbalance: A review of vestibular testing results among 1,116 patients, Otology & Neurotology 42: (6), ((2021) ) 897–905. |
[31] | Okoye S.M. , Samuel L.J. , Fabius C. , Mulcahy J. , Reider L.M. , Szanton S.L. , Wolff J.L. Home and neighborhood context of falls among black and white older americans, J Aging Health 33: (9), ((2021) ) 721. |
[32] | Papacharalampous G.X. , Vlastarakos P.V. , Kotsis G.P. , Davilis D. , Manolopoulos L. The role of postural restrictions after BPPV treatment: Real effect on successful treatment and BPPV’s recurrence rates, International Journal of Otolaryngology 2012: , ((2012) ) 932847–5. |
[33] | Pinkhasov R.M. , Wong J. , Kashanian J. , Lee M. , Samadi D.B. , Pinkhasov M.M. , Shabsigh R. Are men shortchanged on health? perspective on health care utilization and health risk behavior in men and women in the united states, International Journal of Clinical Practice (Esher)64: (4), ((2010) ) 475–487. |
[34] | R Core Team, R: A language and environment for statistical computing, R Foundation for Statistical Computing (2019). |
[35] | Ribeyre L. , Frère J. , Gauchard G. , Lion A. , Perrin P. , Spitz E. , Parietti-Winkler C. Preoperative balance control compensation in patients with a vestibular schwannoma: Does tumor size matter? Clinical Neurophysiology 126: (4),((2015) ) 787–793. |
[36] | Ruthberg J.S. , Rasendran C. , Kocharyan A. , Mowry S.E. , Otteson T.D. The economic burden of vertigo and dizziness in the united states, Ves 31: (2), ((2021) ) 81. |
[37] | Shah M.U. , Lotterman S. , Roberts D. , Eisen M. Smartphone telemedical emergency department consults for screening of nonacute dizziness, The Laryngoscope 129: (2), ((2019) ) 466 |
[38] | Sloane P.D. , Coeytaux R.R. , Beck R.S. , Dallara J. Dizziness: State of the science, Annals of Internal Medicine 134: (9 Part 2), ((2001) ) 823–832. |
[39] | Stolte B. , Holle D. , Naegel S. , Diener H. , Obermann M. Vestibular migraine, Cephalalgia 35: (3), ((2015) ) 262–270. |
[40] | Strupp M. , Dieterich M. , Brandt T. The treatment and natural course of peripheral and central vertigo,rzteblatt International, Deutsches Arzteblatt International ((2013) ) 110: (29-30), 505,15; quiz515. |
[41] | Tindle H. Improving the cardiovascular health of the population through standard and novel strategies, Curr Cardiovasc Risk Rep 6: (6), ((2012) ) 497–498. |
[42] | Tinetti M.E. , Williams C.S. , Gill T.M. Dizziness among older adults: A possible geriatric syndrome, Ann Intern Med 132: (5), ((2000) )s 337–344. |
[43] | To-Alemanji J. , Ryan C. , Schubert M. Experiences engaging healthcare when dizzy, Otology & Neurotology 37: (8), ((2016) ) 1122–1127. |
[44] | Toupet M. , Ferrary E. , Bozorg G.A. Effect of repositioning maneuver type and postmaneuver restrictions on vertigo and dizziness in benign positional paroxysmal vertigo, The Scientific World Journal 2012: , ((2012) ) e162123. |
[45] | Ulytė A. , Valancius D. , Masiliūnas R. , Paškonienė A. , Lesinskas E. , Jatužis D. , Ryliškienė K. , Diagnosis and treatment choices of suspected benign paroxysmal positional vertigo: Current approach of general practitioners, neurologists, and ENT physicians, Eur Arch Otorhinolaryngol 276: (4), ((2019) ) 985–991. |
[46] | United States Census Bureau. 2020 Historical population density data 2020. https://www.census.gov/data/tables/time-series/dec/density-data-text.html. |
[47] | United States Census Bureau. 2021 Census regions and divisions of the united states. https://www2.census.gov/geo/pdfs/maps-data/maps/rceference/usregdiv.pdf. |
[48] | Vugt V.A.V. , Nerio P.M.D. , van der Wouden J.C. , van der Horst H.E. , Maarsingh O.R , Use of canalith repositioning manoeuvres and vestibular rehabilitation: A GP survey, Scandinavian Journal of Primary Health Care 35: (1), ((2017) ) 19–26. |
[49] | Wang L. , Zobeiri O.A. , Millar J.L. , Souza S.W. , Schubert M.C. , Cullen K.E. Continuous head motion is a greater motor control challenge than transient head motion in patients with loss of vestibular function, Neurorehabil Neural Repair 35: (10), ((2021) ) 890–902. |
[50] | Yardley L. , Beech S. , Weinman J. Influence of beliefs about the consequences of dizziness on handicap in people with dizziness, and the effect of therapy on beliefs, Journal of Psychosomatic Research 50: (1), ((2001) ) 1–6. |
[51] | Zhang L. , Jung E.H. WeChatting for health: An examination of the relationship between motivations and active engagement, Health Commun 34: (14), ((2019) ) 1764–1774. |


