
Present and future of the labyrinth imaging: Focus on the use of T2-weighted and contrast-enhanced delayed FLAIR (1 h) sequences
Abstract
OBJECTIVE:
Part of the recent progress in the labyrinth imaging has been made possible by the rise of contrast-free T2-weighted and delayed (1h) FLAIR sequences. The aim of this article is to review evidence for the use of these two sequences to image the inner ear, especially the posterior membranous labyrinth.
MATERIAL AND METHODS:
We analyzed MRI-based papers (2007–2020)using high-resolution T2-weighted or contrast-enhanced FLAIR (1h) sequences to image the inner ear.
RESULTS:
T2-weighted sequences (3T MRI)enabled the visualization of the posterior membranous labyrinth with good correlation when compared to corresponding histological slices.Significant progress has been made, especially in terms of scanning time, aiming at reducing it, in order to decrease motions artifacts. The saccule is visible on a 3T MRI without significant motion artifacts. Its shape is ovoid, with a maximum height and width of 1.6 and 1.4 mm, respectively. An enlarged saccule was observed in 84%of patients with unilateral Meniere’s disease, in 28%of patients with vestibular schwannomas (VS) and 47%of patients with intralabyrinthine schwannomas. VS obstructing the internal auditory canal caused a decrease of the perilymphatic signal (more moderate decrease in meningiomas) on T2 gradient-echo images. Contrast-enhanced FLAIR sequences are useful to image vestibular/facial neuritis and inflammatory inner ear diseases.
CONCLUSION:
Precise analysis of the posterior membranous labyrinth, in terms of size, shape and signal intensity, is possible on a 3T MRI using high-resolution gradient-echo T2-weighted sequences. Such sequences are an interesting add-on to delayed (4h30) FLAIR-based protocols for labyrinth imaging.
1Introduction
The exploration of the membranous labyrinth began with intratympanic injection of contrast media [11], then relied on delayed contrast-enhanced sequences acquired 4 hours and 30 minutes after intravenous gadolinium injection [10]. Nowadays, delayed (4h30) contrast-enhanced FLAIR remains the sequence of choice for labyrinth imaging, especially in Meniere’s disease.
However, important progress has been made regarding non-enhanced sequences, such as the improvement of high-resolution (sub-millimetric) contrast-free T2-weighted 3D sequences. Such sequences are an interesting supplement to contrast-enhanced protocols, providing additional informations [13, 16]. They are especially useful to image inner ear fluids, including small endolymphatic structures, such as the utricle and the saccule. The utricle is a membranous structure occupying the upper part of the vestibule, roughly ovoid on an axial plane. The anterior quarter of its floor is the utricular macula, comprising an anterior vertical portion and an inferior horizontal one, surrounded by endolymph. Its inferior limitations are the perilymph (laterally) and the upper pole of the saccule (medially). The utricular nerve arises from the utricular macula and forms, together with the lateral semicircular canal ampullary nerve and the superior semicircular canal ampullary nerve, the utriculo-ampullar nerve (= superior vestibular nerve). It courses in the superior vestibular canal, ending in the internal auditory canal.Another important structure of the membranous labyrinth is the saccule. Its lateral wall is in contact with perilymphatic fluid and its medial portion (containing the saccular macula, with a vertical greater axis) is in contact with the medial wall of the vestibule. The saccular nerve arises from the saccule and reaches the saccular nerve’s canal from the lower pole of the saccule. It joins the posterior ampullary nerve to form the sacculo-ampullary nerve (= inferior vestibular nerve) in the internal auditory canal.In addition to T2-weighted sequences, contrast-enhanced FLAIR sequence, acquired 1h after intravenous gadolinium injection, also recently appeared interesting to image inflammatory nerves. The aim of this work is to review evidence regarding the use of high-resolution T2-weighted and delayed (< 1h) FLAIR sequences to image inner ear structures.
2Material and methods
2.1Data sources, study selection
Pubmed and Google Scholar databases were used to select the current literature (English language) for the review. All original articles were reviewed from 2017 to 2020, as featured in the Table 1. We selected all MRI-based papers with the use of high-resolution “T2-weighted” or contrast-enhanced “FLAIR” sequences to image inner ear structures (additional MeSH terms searched were “Meniere”; “Meniere’s Disease”; “vestibular schwannoma”; “inner ear”; “endolymphatic space”; “membranous labyrinth”; “perilymphatic fistula”; “internal auditory canal”; “saccule”; “utricle”; “temporal bone”, “perilymph”; “semicircular canals”).
Table 1
Current literature (2017–2020)on the use of T2-weighted sequences to image the temporal bone and inner ear. Major original articles using T2-weighted sequences to image the temporal bone and inner ear
| Author, year | Type of MR sequence | Sequence parameters | Acquisition time | Inner ear structure visualized | Inner ear pathology | Results |
| Ishikawa et al. 2013 | 3D FIESTA high-resolution T2-weighted three-dimensional gradient-echo steady state free precession (3T) | TR 7 ms TE 2.9 ms flip angle 70° slice thickness 0.8 mm matric 256×256 NEX 3 Bandwidth 31.25 kHz pixel size 0.47×0.47 mm | 4 min 29 s. | Innerear structures | Vestibular schwannomas (n = 21), cerebellopontine angle meningiomas (n = 6) and controls (n = 25) | •Decreased vestibular signal intensity on the af-fected side on 3D-FIESTA was observed in patients withVS, but not in those with CPAM or in normal subjects. |
| •The signal intensity change has the potential to be used in differentiating VS from CPAM. | ||||||
| Simon et al. 2017 | Three-dimensional (3D) heavy T2-weighted CISS (3T) | TR 6.53 ms TE 3.05 ms flip angle 50° slice thickness 0.4 mm | 5 min 35 s | Saccule | Meniere’s disease (n = 36) | •Saccular measurements were significantly different between symp-tomatic Menière ears compared to healthy ears (1.59 vs 1.32 mm, p < 0.001 for height; 1.13 vs 0.90 mm, p < 0.001 for width) |
| •Cut-off values for saccular height 1.51 mm, Se = 63%, Sp = 95% | ||||||
| •Cut-off values for width 1.05 mm, Se = 41%, Sp = 95%. | ||||||
| Venkatasamy et al. 2017 | 3D FIESTA high-resolution T2-weighted three-dimensional gradient-echo steady state free precession(3T) | TR 7 ms TE 2.8–1.2 ms FOV 220×198 mm; frequency×phase 484×484; flip angle 60° NEX = 1; Bandwidth 83.3 kHz voxel size 0.3×0.3×0.3 mm | 7 min 49 s | Saccule | Meniere’s disease (n = 64) | •The saccule is well observed on heavily T2-weighted sequences on the coronal plane |
| •MR findings match corresponding histological observations | ||||||
| •The saccule greater axis appears < 1.6 mm and its width < 1.4 mm | ||||||
| Venkatasamy et al.2017 | 3D FIESTA high-resolution T2-weighted three-dimensional gradient-echo steady state free precession(3T) | TR 7 ms TE 2.8–1.2 ms FOV 220×198 mm; frequency×phase 484×484; flip angle 60° NEX = 1; Bandwidth 83.3 kHz voxel size 0.3×0.3×0.3 mm | 7 min 49 s | Membranous labyrinth | Vestibular schwannomas (n = 190) / meningiomas (n = 13) of the IAC and their resultant changes on the inner ears | •Perilymphatic signal changes in obstructive IAC tumors |
| •Signal drop correlated to the degree of obstruction of the IAC by the tumor | ||||||
| •A signal intensitif of the vestibular cistern / CSF signal > 0.70, the tumour was more likely a meningioma. | ||||||
| Karol et al. 2018 | 3D FIESTA high-resolution T2-weighted three-dimensional gradient-echo steady state free precession(3T) | TR 7 ms TE 2.8–1.2 ms FOV 220×198 mm; frequency×phase 484×484; flip angle 60° NEX = 1; Bandwidth 83.3 kHz voxel size 0.3×0.3×0.3 mm | 7 min 49 s | Inner ear structures | Intralabyrinthine vestibular schwannomas (n = 28) visualisation | •A high resolution T2-weighted sequence diagnoses intralabyrinthine vestibular schwannomas with high sensitivity (95%) and specificity (100%) compared to T1-weighted sequences for specialized radiologists |
| •T2-weighted sequences especially useful for the follow-up of intralabyrinthine vestibular schwannomas | ||||||
| Eliezer et al. 2019 | 3D FIESTA high-resolution T2-weighted three-dimensional gradient-echo steady state free precession (3T) | TR 7 ms TE, 2.8 ms Matrix size, 484×484 FOV 20 flip angle, 60° NEX = 1 bandwidth, 83.3 kHz 0.3 mm slice thickness | 4 min 40 s | Utricle | Vestibular schwannomas (n = 23) and their resultant changes on the utricle | •The mean saccular volume was 3.17±1.1 (SD) mm3(range: 1.45—5.7 mm3) and the mean utricular volume was 14.4±5 (SD) mm3(range: 6.6—23.9 mm3) |
| •There was a moderate correlation between the utricularvolume and the degree of hearing loss | ||||||
| Karch-Georges et al. 2019 | 3D FIESTA high-resolution T2-weighted three-dimensional gradient-echo steady state free precession(3T) | TR 7 ms TE 2.8–1.2 ms FOV 220×198 mm; frequency×phase 484×484; flip angle 60° NEX = 1; Bandwidth 83.3 kHz voxel size 0.3×0.3×0.3 mm | 7 min 49 s | Saccule | Vestibular schwannomas (n = 183) of the IAC and their resultant changes on the saccule | •29%of vestibular schwannomas presented with homolateral enlargment of the saccul |
| •16%of vestibular schwannomas presented with bilateral enlargment of the saccule | ||||||
| Venkatasamy et al. 2020 | 3D FIESTA high-resolution T2-weighted three-dimensional gradient-echo steady state free precession (3T) | TR 7 ms TE 2.8–1.2 ms FOV 220×198 mm; frequency×phase 484×484; flip angle 60° NEX = 1; Bandwidth 83.3 kHz voxel size 0.3×0.3×0.3 mm | 7 min 49 s | Round and oval windows | Perilymphatic fistula (n = 17) | •On MR, the most common finding in periymphatic fistula is a fluid effusion of the round or oval window niche (especially is > 2/3 of the window niche) |
| •The combination of CT and MRI has a good sensitivity (>80%) | ||||||
| Venkatasamy et al. 2020 | 3D FIESTA high-resolution T2-weighted three-dimensional gradient-echo steady state free precession(3T) | TR 7 ms TE 2.8–1.2 ms FOV 220×198 mm; frequency×phase 484×484; flip angle 60° NEX = 1; Bandwidth 83.3 kHz voxel size 0.3×0.3×0.3 mm | 7 min 49 s | Saccule | Intralabyrinthine vestibular schwannomas (n = 28) their resultant changes on the saccule | •47%of intralabyrinthine vestibular schwannomas presented with homolateral enlargment of the saccule |
| •37%of intralabyrinthine vestibular schwannomas presented with bilateral enlargment of the saccule |
Abbreviations: TR = repetition time, TE = echo time, FOV = field of view, NEX = number of excitations, IAC = internal auditory canal.
2.2Data extraction
Every selected article was read and analyzed. Extracted data were:
- First author and study date
- MR sequences and parameters
- Type of inner ear structure studied
- Type of inner ear pathology with number of cases
- Most significant results
3Results
3.1Machines, protocols and ongoing research
3.1.1T2-weighted sequences
T2-weighted sequences acquired on a 3T MRI can be used to image the inner ear, especially posterior membranous labyrinth structures.Inner ear structures are also visible at 1.5T [2], but correctly visualizing the saccule with low-field MRI remains tricky, especially because of its small size. To image the temporal bone and the membranous labyrinth, different high-resolution T2-weighted sequences may be used (e.g., FIESTA (GE), CISS (Siemens) or FFE Balanced 3D (Philips)). Compared to spin-echo sequences, gradient-echo T2 weighted sequences are sensible to changes in fluid composition. The MR parameters of studies using T2-weighted sequences to image the inner ear are summarized in Table 1 [3, 7, 8, 15, 17, 20]. The major disadvantage of high-resolution T2-weighted sequences, as they have been performed over the past years, is their long acquisition time (∼ 8 minutes). Ongoing research and development is aiming at decreasing it, in order to reduce motions-related artifacts.
3.1.2Contrast-enhanced FLAIR sequence (<1h) in neuritis
Inflammations of cranial nerves (i.e., in case of facial or vestibular neuritis)can be diagnosed using a FLAIR sequence, acquired (∼1 h) after intravenous injection of 0.1 mmol/kg (0.2 mL/kg) of gadoterate meglumine (single dose, Dotarem®, Guerbet, Roissy, France). At 1.5 Tesla, the acquisition parameters of the delayed FLAIR sequence in vestibular neuritis were “echo time (TE): 546 ms, repetition Time (TR): 7000 ms, IR time: 2250 ms, FOV: 230×198×30 mm, Flip angle: 60°, Number of excitations (Nex): 6, Bandwidth: 189.9 kHz, voxel: 0.85×0.95×0.8 mm, slice thickness after reconstruction 0.4 mm,acquisition time of 9 minutes 20 seconds” [18]. At 3 Tesla, the parameters of the contrast-enhanced three-dimensional FLAIR sequence used by Hector et al.were as follows: “TE = 130 ms, TR = 10000 ms, TI = 2250 ms, FOV = 22×22 cm, frequency×phase = 320×256, FA = 0°, NEX = 1, band-width = 62.50 kHz, slice thickness = 4 mm, acquisition time was 2 min 41 s” [5]. Lim et al. used the following parameters for their 3D-FLAIR “TR, 8000 ms; TE,268 ms; TI, 2400 ms; modulation of flip angle for refocusing pulses; section thickness, 0.6 mm; over contiguous sections; 60 sections; FOV, 1818 cm; matrix size, 512512; NEX, 1; SENSE factor, 2; acquisition time, 6 minutes 6 seconds” [9].
3.2MRI of the normal saccule and utricle
The first studies on inner ear imaging using heavily T2-weighted sequences date back to the 90s, relying on low-field MR (1 or 1.5T). Recent progress in machines, such as the use higher magnetic fields (3T), together with technical improvements of MR sequences, refined the visualization of the endolymphatic structures of the membranous labyrinth. Posterior membranous labyrinth structures, such as the saccule and the utricle, are easily visualized on T2-weighted sequences, presenting with a fluid-like hyperintense signal on heavily T2-weighted images, contrasting with the hypointense T2 signal of the surrounding bone. What is observed on T2-weighted images at 3 Tesla is quite similar to corresponding histological slices, cut in the same plane as the MRI images ([17] & Fig. 1). The saccule is best seen on a coronal section, at the level of the lateral and superior semicircular canals. It has the ovoid shape of a rugby ball. Its greater craniocaudal axis is oriented in the same direction as the vestibule and the superior semicircular canal. Its upper pole is in contact with the internal portion of the utricular macula [17]. The vertical saccular macula (located close to the medial wall of the bony vestibule) is not visible on MRI, as it blends with the hypointense signal of the surrounding bony vestibule. In a study using radiological-histological correlations on normal ears, the normal saccule was always visible in the absence of significant motion artifacts. Its normal maximum height was 1.6 mm [17] vs1.53 mm for [15] and its normal maximum width was 1.4 mm, which corresponded to histological findings. On the other hand, the utricle has an ovoid shape (axial plane), with an anterior and lateral portion occupying all the external part of the vestibule and with a more tapered medial part, in contact with the perilymph. This particular area of perilymph is visible on an coronal plane and on an axial plane oriented in the axis of the lateral semicircular canal. On a sagittal plane, the utricle appears as an elongated structure (anteriorly to posteriorly). The utricular macula, presenting as a linear hyposignal on T2-weighted images, occupies the antero-inferior portion of the utricle. It has an initial vertical portion, which becomes axial in the anterior quarter of the utricular wall, then followed by an epithelial wall.
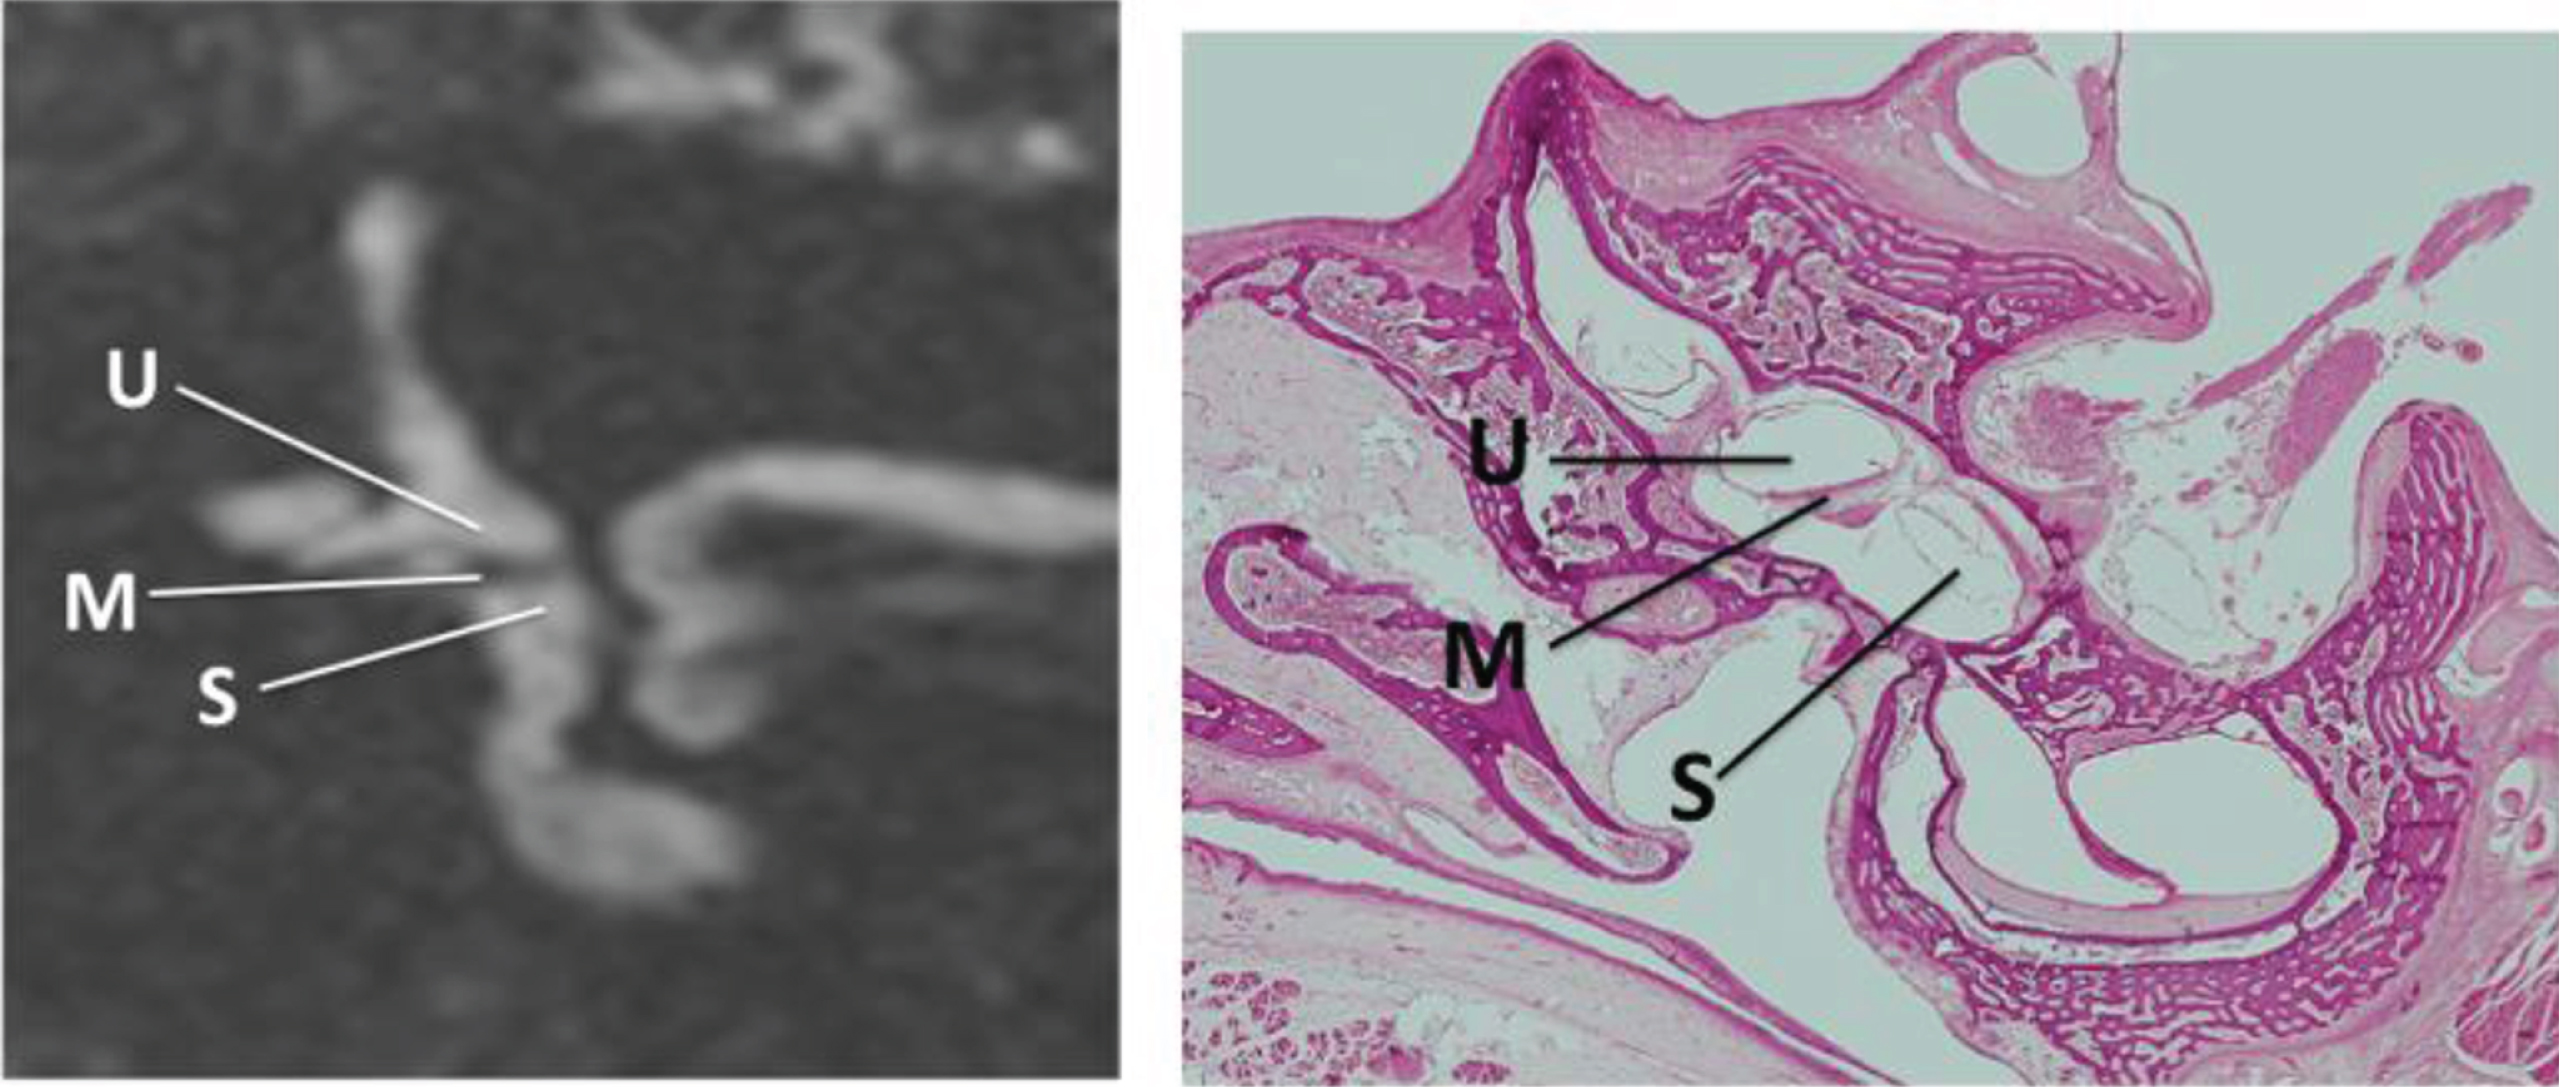
Fig. 1
A)MRI, Coronal 3D gradient-echo T2-weighted sequence (FIESTA) acquired at 3 Tesla. Inner ear structures have a hyperintense fluid-like signal on T2 images. The saccule (S), utricle (M) and the utricular macula (M) are well seen in the coronal image at the level of the lateral and superior semicircular canals. The medial wall of the vestibule appears as a thin black line (medially to the saccule). B)Corresponding coronal histological section of the inner ear (Hematoxilin eosin staining, magnification x40) showing the saccule (S) and the utricle (U) macula (M). The MRI aspect on T2-weighted images is similar to what is observed on histology.
3.3Imaging of the pathological membranous labyrinth
At 3T, normal membranous labyrinth structures are visualized using T2-weighted sequences, with good correlation when compared to histological sections. Therefore, this sequence can also be used to study changes to the membranous labyrinth (e.g, size, shape and/or signal intensity), resulting from various inner ear pathologies (e.g., Meniere’s disease, vestibular schwannomas. . .).
3.3.1Meniere’s disease
Simon et al. [15] and Venkatasamy et al. [19] used T2-weighted sequences (CISS and FIESTA, respectively) to observe saccular modifications in Meniere’s disease patients, in case-control studies at 3T. Both studies showed significant enlargement of the saccule in Meniere’s disease patients. For instance, in 52 patients meeting all criteria for unilateral definite Meniere disease (AAO-HNS 2015 classification provided by the American Academy of Otolaryngology-Head and Neck Surgery), 52/62 (84%) presented with an enlarged saccule (height > 1.6 mm and/or width > 1.4 mm). From those 52 patients with an enlarged saccule, 45/52 showed increased height (ranging from 1.7 to 2.2 mm) and 21/45 also presented with an increased width (1.5 to 1.8 mm). Additionally, increased isolated width was observed in 2/52 patients. The saccule was not visible in 5/52 despite the absence of significant motion artifacts. The absence of visualization of the saccule may be surprising, but the saccule was always visible at 3T in the absence of major motion artifacts in the control group of healthy volunteers.Similarly the non-visualization of the saccule on delayed (4 h30) FLAIR sequences was also described in hydropic ear diseases [1, 4]. All in all, the enlarged (dilated) saccule may be stretched with an increased height and a normal width; harmoniously expanded (Fig. 2) with an increased height/width giving it a “rugby ball” appearance; spherical with an increased width and a normal height giving the saccule a “soccer ball” appearance; or absent, as non-visualization of the saccule is considered pathological.The normal utricle usually occupies three quarters of the space of the upper vestibule. If the lateral utricular wall gets closer to the lateral wall of the vestibule and utricle occupies > 80%of the space, it can be considered as dilated.
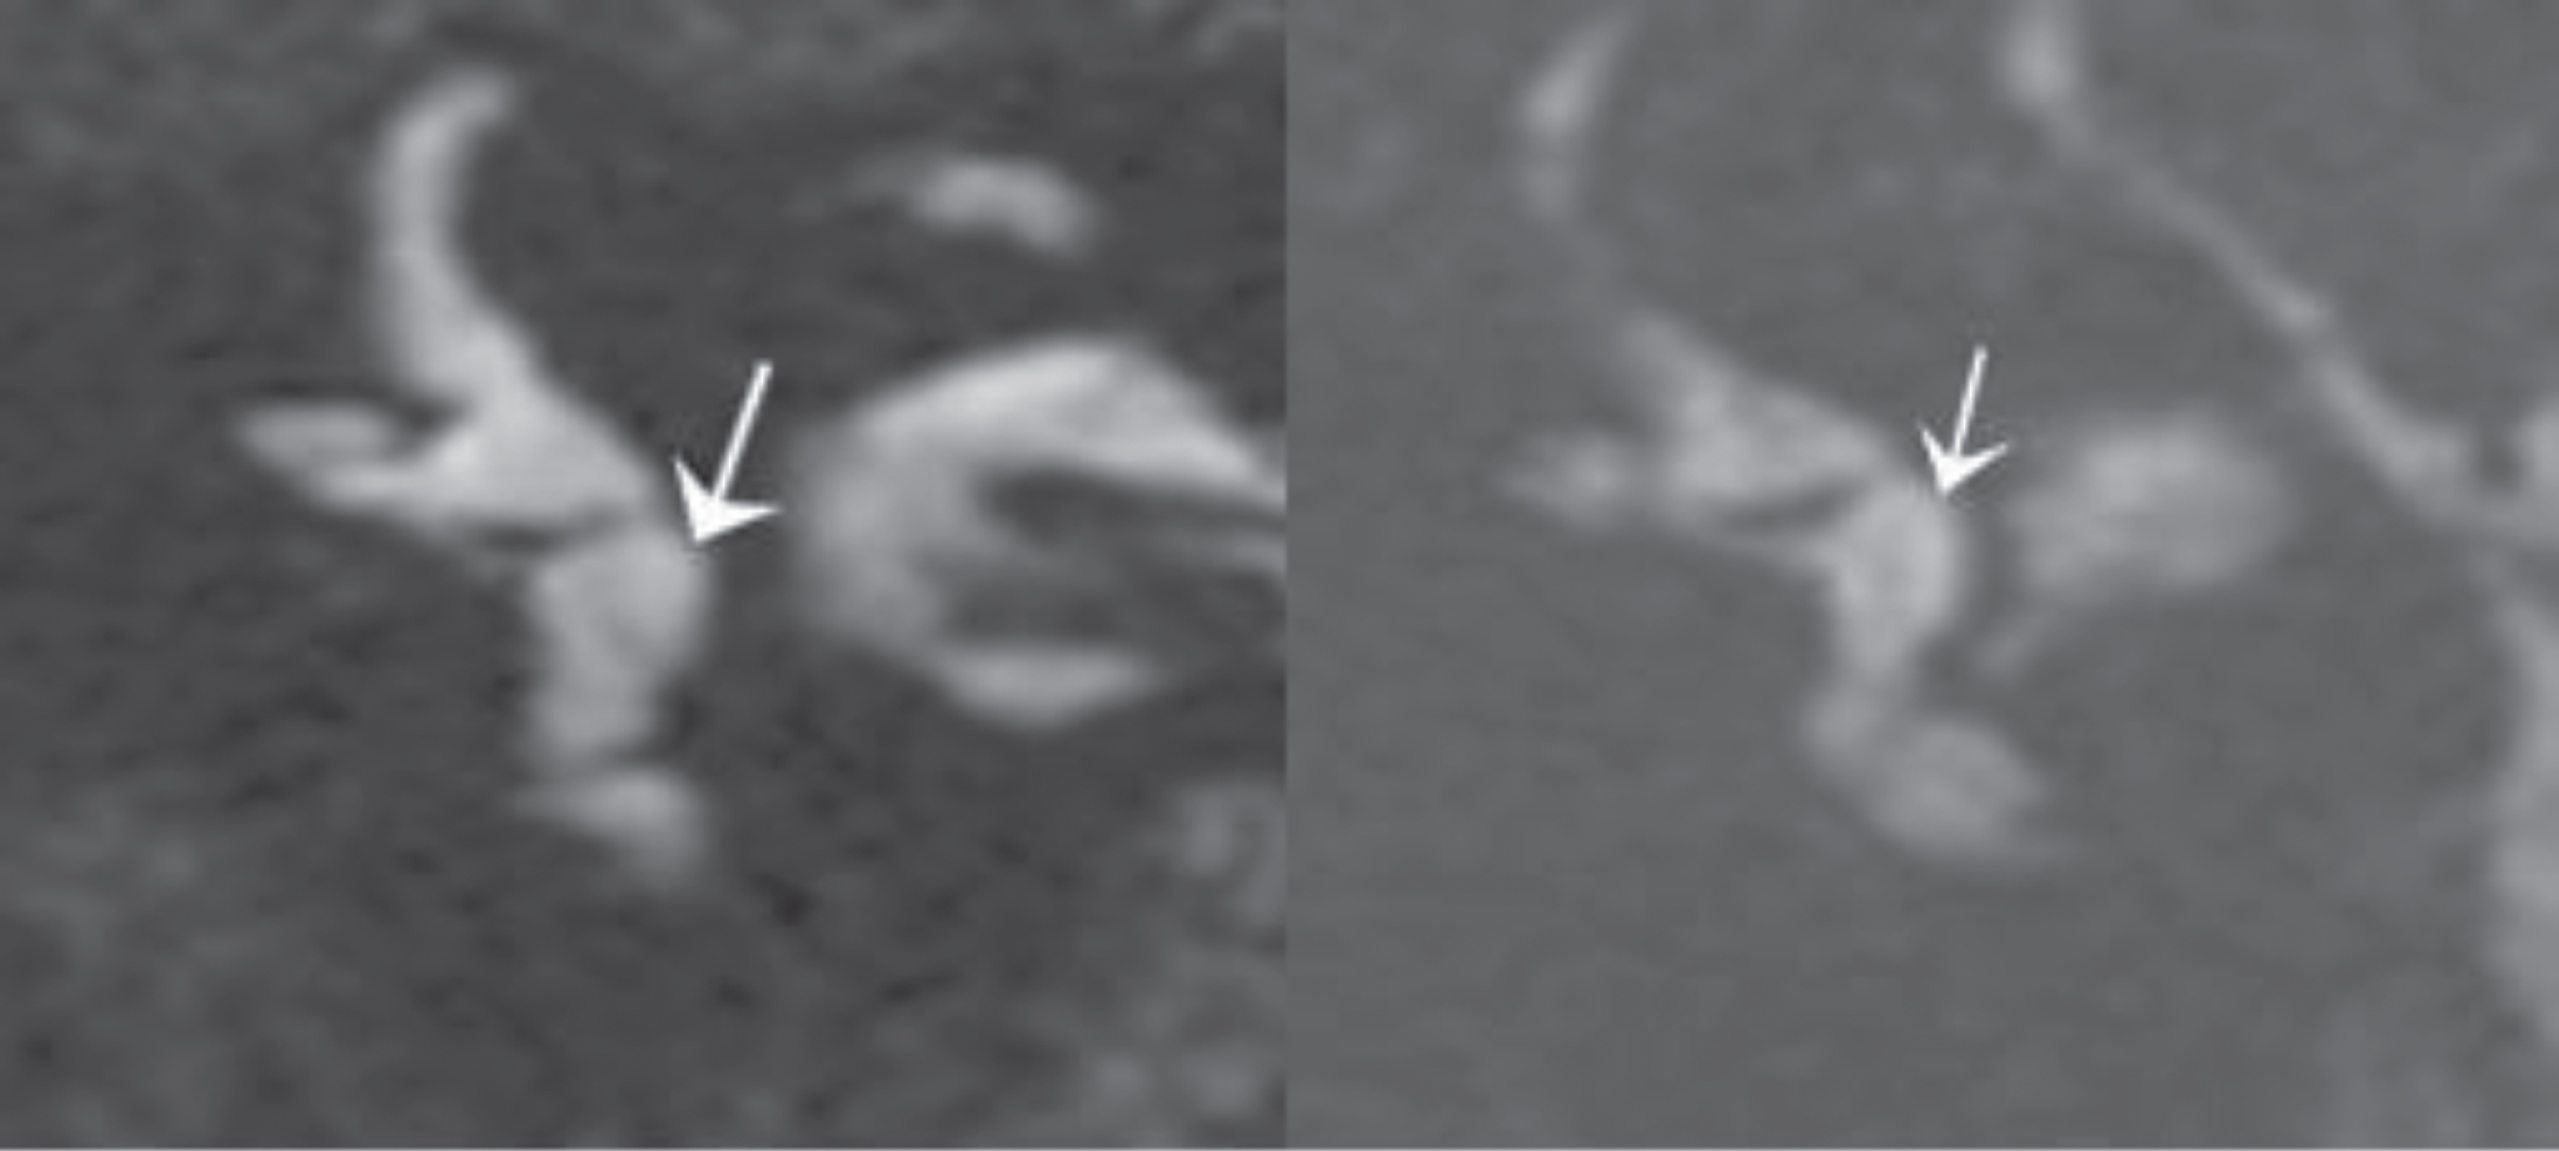
Fig. 2
A)MRI, Coronal 3D gradient-echo T2-weighted sequence, showing an enlarged saccule (arrow), with increased height and width. The medial wall of the vestibule appears as a thin black line. B)Similar finding in another patient.
3.3.2Inner ear and vestibular schwannomas
Signal intensity changes of the inner ear liquids can be observed with tumors of the internal auditory canal (e.g., vestibular schwannomas and meningiomas extending in the internal auditory canal) on gradient-echo T2-weighted sequences. When vestibular or facial nerve schwannomas obstructed the internal auditory canal (i.e., close contact ∼360° between the tumor and walls of the canal), a marked decrease of the perilymphatic signal (Fig. 3A) was observed on gradient-echo T2-weighted images [6, 19]. The suggested pathophysiological explanation for such finding was an increased protein concentration in the perilymph [12, 14], causing a decrease of the signal of those structures on gradient-echo T2-weighted sequences (e.g., FIESTA, CISS, B-FFE) as they are sensible to changes in changes in fluid protein concentration. Smaller non-obstructive schwannomas (i.e., with CSF still present between the tumor and the canal walls) did not cause any significant perilymphatic signal changes [19]. Therefore, the analysis of the perilymphatic signal was an effective additional tool to differentiate cerebellopontine angle meningiomas from schwannomas, as the decrease of the perilymphatic signal was more moderate in obstructive meningiomas than in obstructive schwannomas [6, 19]. The endolymphatic signal remained normal regardless of the tumor type [18]. In addition to changes of signal intensity of posterior membranous structures in the presence of VS, Karch-Georges et al. [7] observed changes in size/shape. They described enlarged saccules in 28%of the cases on the side of the tumor, in a series of 183 vestibular schwannomas of the internal auditory canal (Fig. 3B). Paradoxically, a contralateral enlargement of the saccule was also observed in 16%of VS cases [7]. Similarly, Eliezer et al. [3] described a dilation of the utricle in obstructive vestibular schwannomas, which correlated with sensorineural hearing loss. In their study, the mean saccular volume was “3.17±1.1 (SD) mm3 (range: 1.45—5.7 mm3) and the mean utricular volume was 14.4±5 (SD) mm3 (range: 6.6–23.9 mm3)”. For Karol et al. [8], the spatial resolution of T2-weighted sequences was sufficient to diagnose intra-labyrinthine schwannomas with high sensitivity (Se 95%)and specificity (Sp 100%), compared to contrast-enhanced T1-weighted images as gold standard. This finding was especially useful for follow-up imaging of such lesions [8]. Using this sequence, Venkatasamy et al. [20] also described an enlargement of the saccule in 46%of the cases of cochlear intralabyrinthine schwannomas. Seemingly, the contralateral enlargement of the saccule, observed in 16%of internal auditory canal vestibular schwannomas, was also observed in 37%of the cases of cochlear intralabyrinthine schwannomas [18].
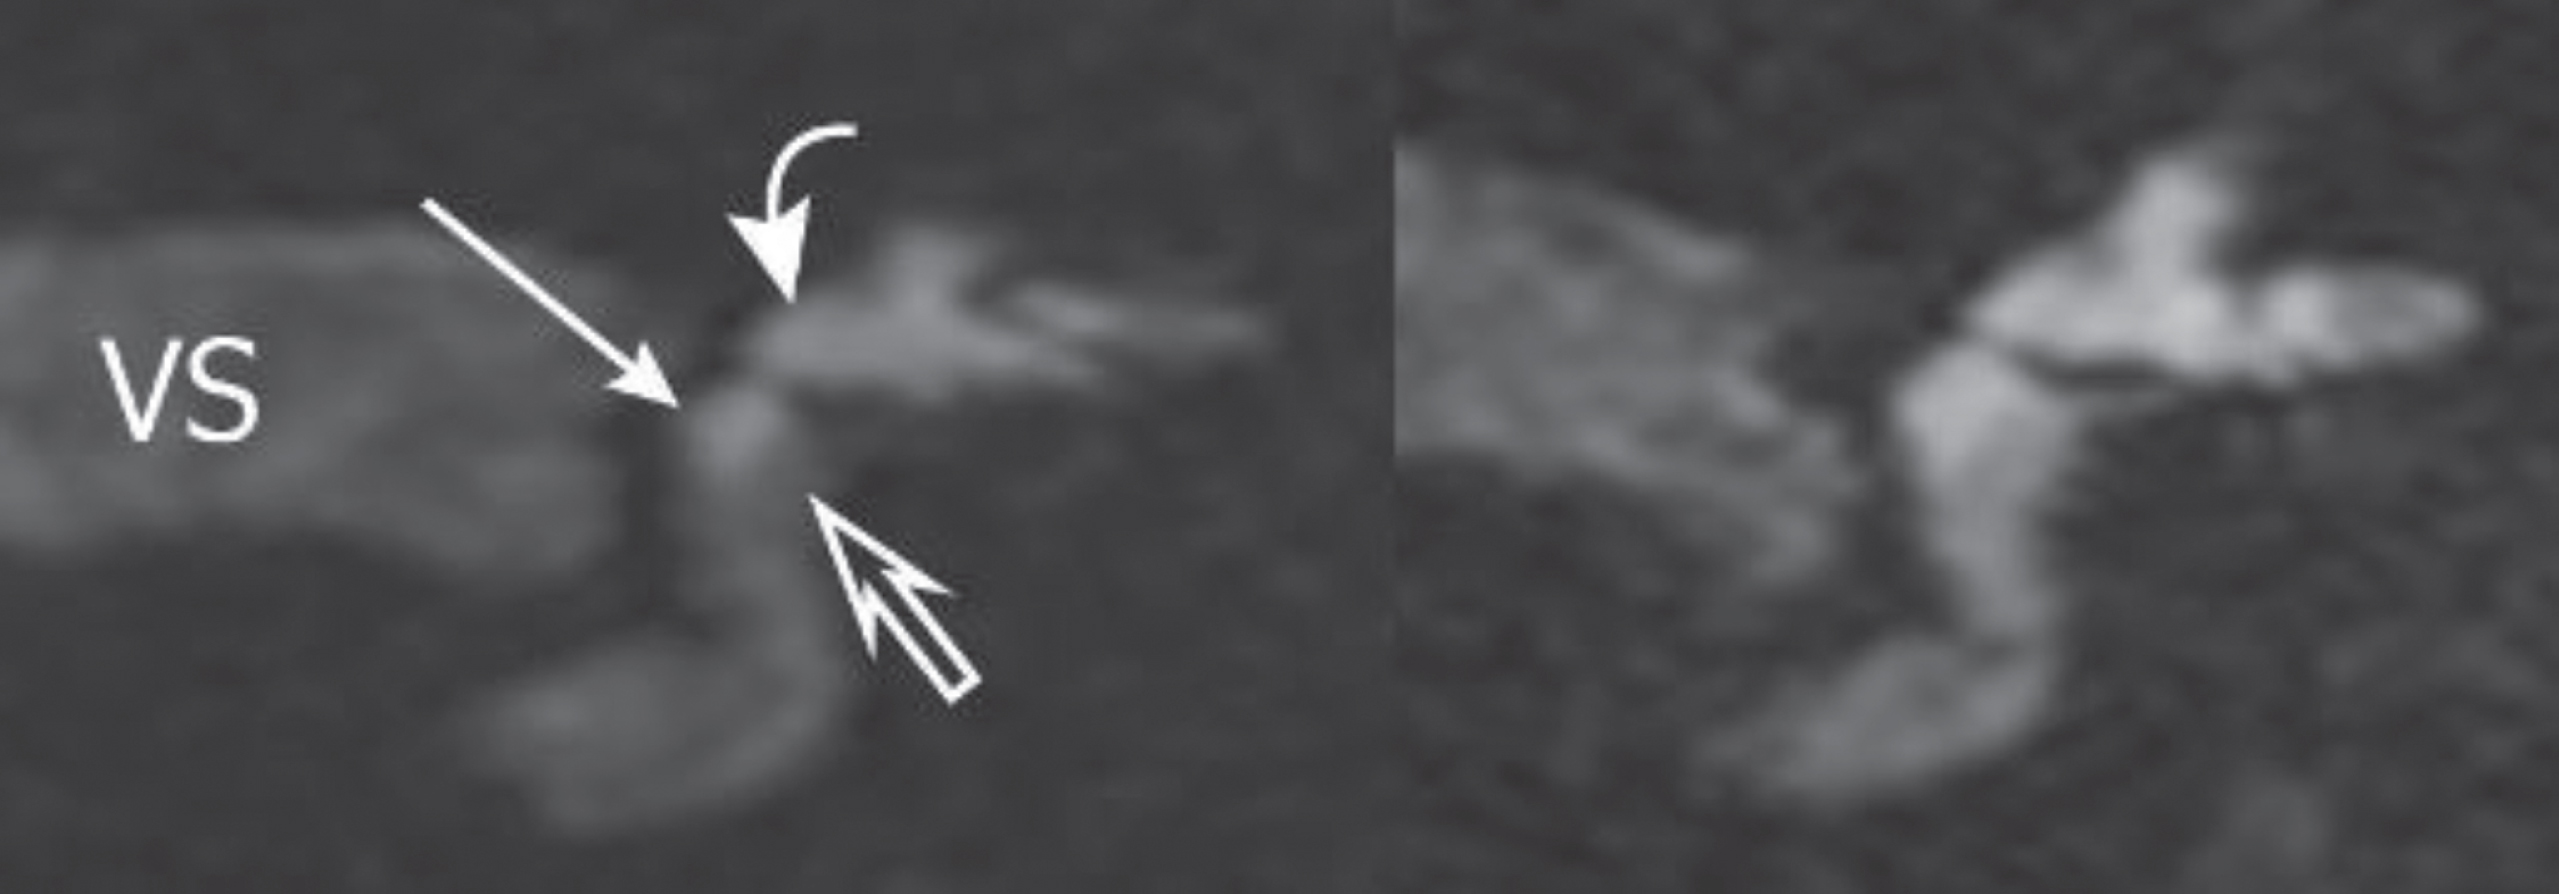
Fig. 3
A)MRI, Coronal 3D gradient-echo T2-weighted sequence, in a patient with a vestibular schwannoma (VS) of the internal auditory canal. The signal intensity of the perilymph is decreased (empty thick arrow).The signal of the endolymphatic space (saccule and utricle) remains normal (white). The size of the saccule (arrow) and utricle (curved arrow) are also normal. B)Another patient with a vestibular schwannoma of the internal auditory canal.As expected, the signal intensity of the perilymph is also decreased. In this case, the saccule and utricle appeared enlarged (but the signal intensity of the endolymphatic space remains normal).
3.3.3Inner ear & neural inflammation
Regarding facial nerve inflammation, FLAIR sequences have proven useful to image acute facial neuritis in patients with acute peripheral nerve palsy, with high sensitivity and specificity (> 90%) [5, 9]. The diagnostic performance of a high-resolution contrast-enhanced T2 sequence (Fig. 4) was slightly superior to the FLAIR sequence (higher sensitivity, respectively 94%vs 92%). The two sequences combined were100%specific [5]. Similarly, contrast-enhanced FLAIR sequence acquired at 1.5 T, 1 h after intravenous gadolinium injection, appeared useful to diagnose acute vestibular neuritis (Fig. 5)with or without hyperintens inflammatory signal of the ampullae [18]. In acute vestibular neuritis, enhancement of the superior vestibular nerve (> 71.5 units) was observed on the pathological side in 85%of the cases of vestibular neuritis. Additionally, this sequence could also useful for inner ear inflammations, as inflamed inner ear compartments would appear hyperintense on contrast-enhanced FLAIR images, as the does the inflamed ampullae in vestibular neuritis.
Fig. 4
MRI, axial 3D gradient-echo T2-weighted sequence, showing a hyperintense facial nerve (arrow) in acute facial neuritis in a patient with acute left peripheral facial nerve palsy.
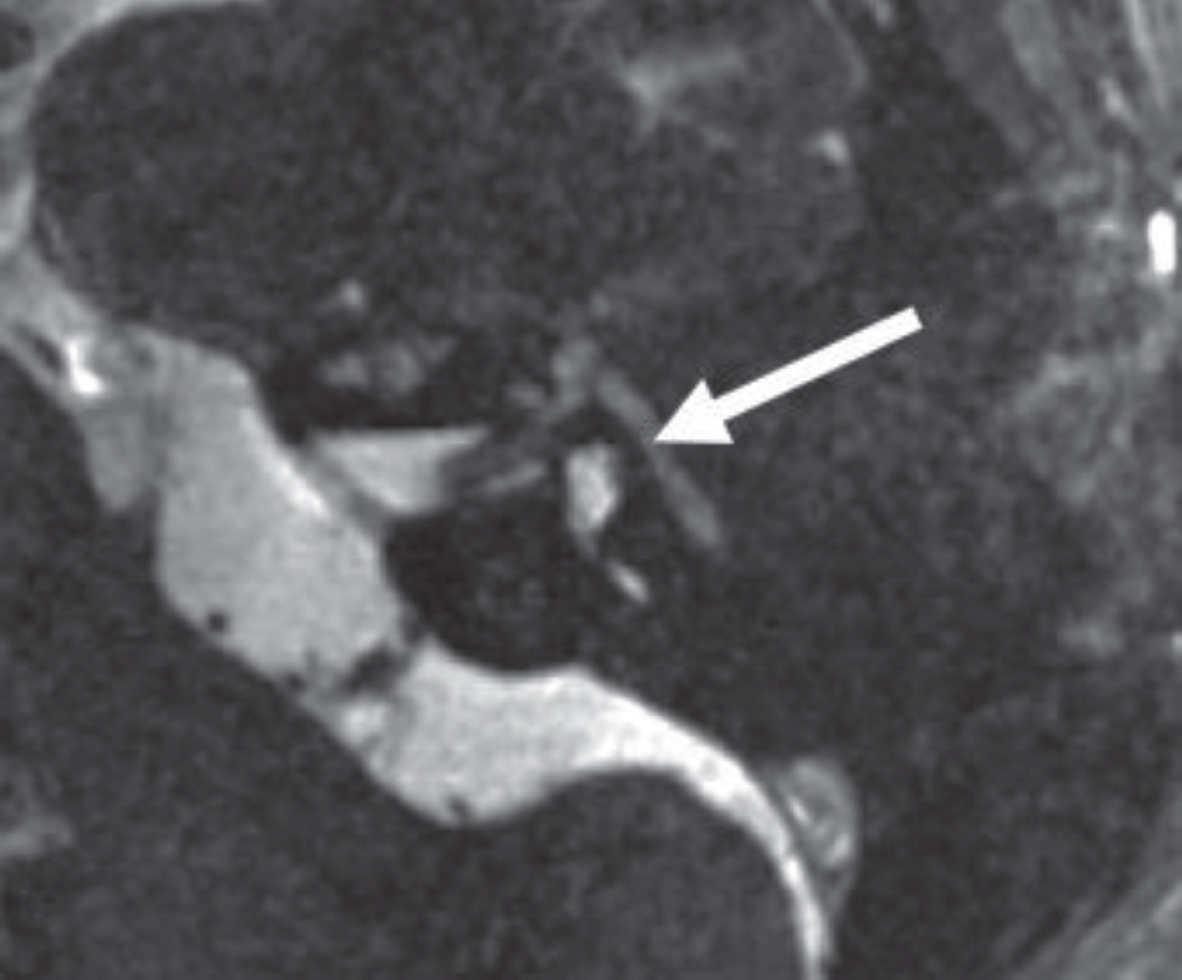
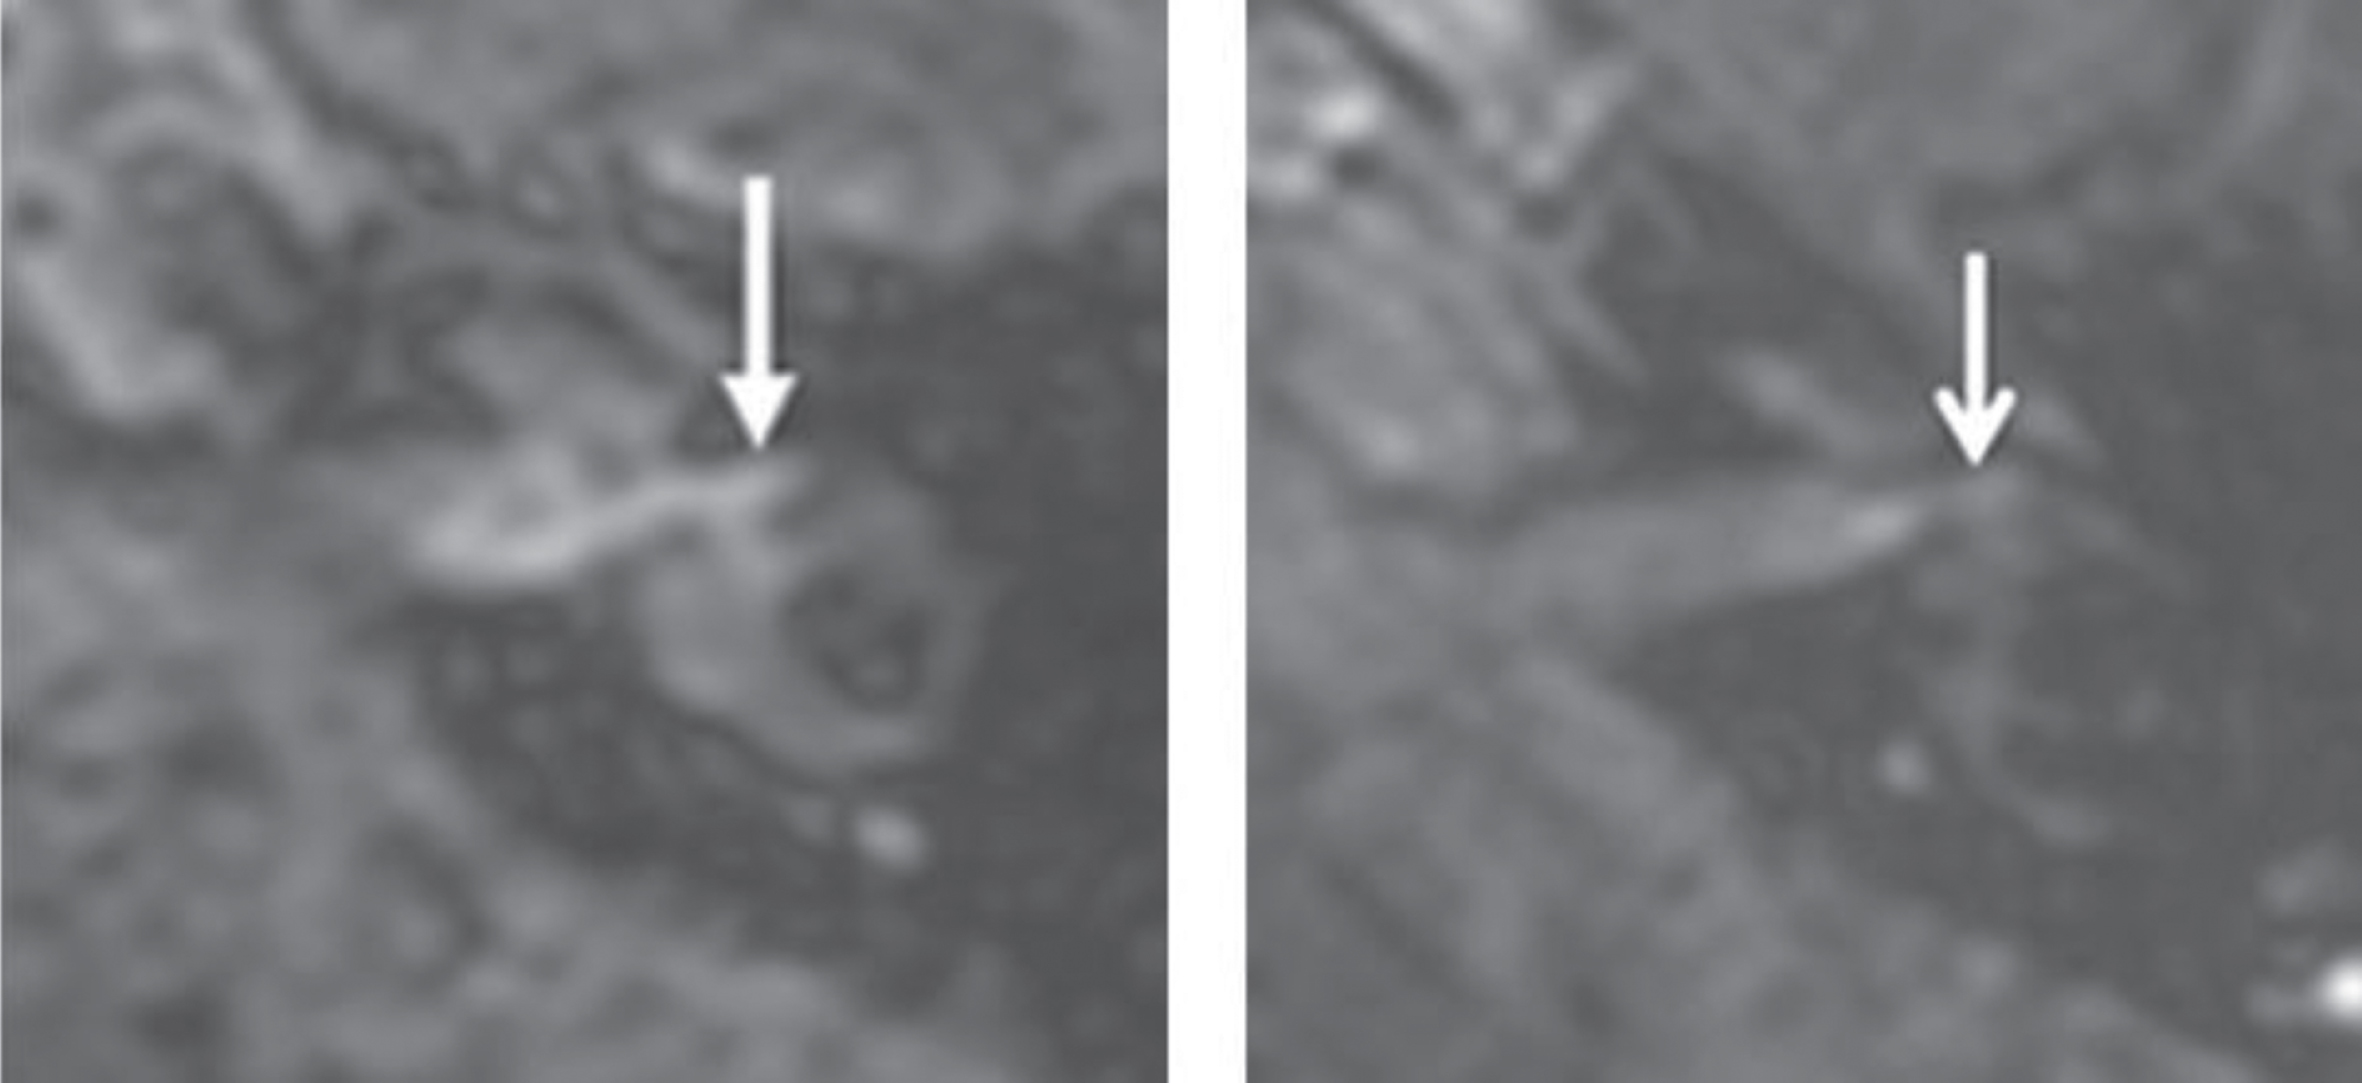
Fig. 5
A)Axial contrast-enhanced (∼1h) FLAIR sequence showing an enhancing superior vestibular nerve (> 71.5 units, arrow) in a patient with an acute vestibular neuritis. B) Normal enhancement of the superior vestibular nerve (arrow) in another patient.
4Conclusion
Inner ear structures, especially the saccule and the utricle, can be accurately analyzed in terms of size, shape and signal intensity, using high-resolution gradient-echo T2-weighted sequences, with a good correlation compared to histology. In Meniere’s disease and VS, changes in size and shape of the saccule and utricle have been described. Changes in the signal intensity of perilymphatic structures have also been observed with VS (more moderate with meningiomas). Therefore, gradient-echo T2-weighted sequences are an interesting add-on to any MRI exploration of the inner ear. The combination betweenT2-weighted sequences and the delayed-FLAIR (4h30) protocols should increase sensitivity, providing useful additional informations. The membranous labyrinth has not reveal all its secrets yet and remains a fascinating research aera for radiologists and otologists.
Acknowledgments
The authors would like to thank Michèle Utz for her non-ending support throughout all those years.This work was supported by French state funds managed within the “Plan Investissements d’Avenir” and by the ANR (reference ANR-10-IAHU-02).
References
[1] | Attyé A. , Eliezer M. , Boudiaf N. , Tropres I. , Chechin D. , Schmerber S. ,...and Krainik A. , MRI of endolymphatic hydrops in patients with Meniere’s disease: a case-controlled study with a simplified classification based on saccular morphology, European Radiology 27: (8) ((2017) ), 3138–3146. |
[2] | Casselman J.W. , Kuhweide R. , Delmling H. and Al. Constructive interference in study state MR imaging of the inner ear and cerebellopontine angle, AJNR Am J Neuroradiol 14: ((1993) ), 47–57. |
[3] | Eliezer M. , Poillon G. , Maquet C. , Gillibert A. , Horion J. , Marie J.P. ,... and Attyé A. , Sensorineural hearing loss in patients with vestibular schwannoma correlates with the presence of utricular hydrops as diagnosed on heavily T2-weighted MRI, Diagnostic and Interventional Imaging 100: (5) ((2019) ), 259–268. |
[4] | Eliezer M. , Poillon G. , Lévy D. , Guichard J.P. , Toupet M. , Houdart... E. ,... and Hautefort C. , Clinical and radiological characteristics of patients with collapse or fistula of the saccule as evaluated by inner ear MRI, Acta Oto-Laryngologica 140: (4) ((2020) ), 262–269. |
[5] | Hector M. , Alnadji A. , Veillon F. , Eid M.A. , Charpiot A. , Debry C. and Venkatasamy A. , Imaging of facial neuritis using T2-weighted gradient-echo fast imaging employing steady-state acquisition after gadolinium injection, European Archives of Oto-Rhino-Laryngology (2020), 1–9. |
[6] | Ishikawa K. , Haneda J. and Okamoto K. , Decreased vestibular signal intensity on 3D FIESTA in vestibular schwannomas differentiating from meningiomas, Neuroradiology 55: ((2013) ), 261–270. |
[7] | Karch-Georges A. , Veillon F. , Vuong H. , Rohmer D. , Karol A. , Charpiot...and A. ,...and Venkatasamy A. , MRI of endolymphatic hydrops in patients with vestibular schwannomas: a case-controlled study using non-enhanced T2-weighted images at 3 Teslas, European Archives of Oto-Rhino-Laryngology 276: (6) ((2019) ), 1591–1599. |
[8] | Karol A. , Veillon F. , Huynh T. , Severac F. , Charpiot A. and Venkatasamy A. , Is an Intravenous Injection of Gadolinium Really Necessary for Intralabyrinthine Schwannomas MR Examination? Otology & Neurotology 39: (7) ((2018) ), e579–e584. |
[9] | Lim H.K. , Lee J.H. , Hyun D. , Park J.W. , Kim J.L. , Lee... H.Y. ,... and Choi C.G. , MR diagnosis of facial neuritis: diagnostic performance of contrast-enhanced 3D-FLAIR technique compared with contrast-enhanced 3D-T1-fast-field echo with fat suppression, American Journal of Neuroradiology 33: (4) ((2012) ), 779–783. |
[10] | Naganawa S. , Yamazaki M. , Kawai H. , Bokura K. , Sone M. and Nakashima T. , Visualization of endolymphatic hydrops in Ménière’s disease with single-dose intravenous gadolinium-based contrast media using heavily T2-weighted 3D-FLAIR, Magnetic Resonance in Medical Sciences 9: (4) ((2010) ), 237–242. |
[11] | Nakashima T. , Naganawa S. , Sugiura M. , Teranishi M. , Sone M. , Hayashi...and H. ,...and Ishida I.M. , Visualization of endolymphatic hydrops in patients with Meniere’s disease, The Laryngoscope 117: (3) ((2007) ), 415–420. |
[12] | Palva T. and Raunio V. , Cerebrospinal fluid and acoustic neurinoma specific proteins in perilymph, Actaoto-Laryngologica 93: (1-6) ((1982) ), 201–203. |
[13] | Sick H. and Veillon F. , Atlas of Slices of the Temporal Bone and Adjacent Region: Anatomy and ComputedTomography Horizontal, Frontal, Sagittal Sections. JF Bergmann-Verlag. (2012). |
[14] | Silverstein H. , Inner ear fluid proteins in acoustic neuroma, Meniere’s disease and otosclerosis, Annals of Otology, Rhinology & Laryngology 80: (1) ((1971) ), 27–35. |
[15] | Simon F. , Guichard J.P. , Kania R. , Franc J. , Herman P. and Hautefort C. , Saccular measurements in routine MRI can predict hydrops in Menière’s disease, European Archives of Oto-Rhino-Laryngology 274: (12) ((2017) ), 4113–4120. |
[16] | Veillon F. , Casselman J.V. , Meriot P. , Cahen-Riehm S. , Sick H. , Harmsworth V. ,... and Nahum H. , Imagerie de l’oreille et de l’os temporal. Lavoisier, Paris, France (2013). |
[17] | Venkatasamy A. , Veillon F. , Fleury A. , Eliezer M. , Eid M.A. , Romain B. ,...and Riehm S. , Imaging of the saccule for the diagnosis of endolymphatic hydrops in Meniere disease, using a three-dimensional T2-weighted steady state free precession sequence: accurate, fast, and without contrast material intravenous injection, European Radiology Experimental 1: (1) ((2017) ), 14. |
[18] | Venkatasamy A. , Huynh T.T. , Wohlhuter N. , Vuong H. , Rohmer D. , Charpiot A. ,...and Veillon F. , Superior vestibular neuritis: improved detection using FLAIR sequence with delayed enhancement (1 h), European Archives of Oto-Rhino-Laryngology 276: (12) ((2019) ), 3309–3316. |
[19] | Venkatasamy A. , Le Foll D. , Karol A. , Lhermitte B. , Charpiot A. , Debry C. ,...and Veillon F. , Differentiation of vestibular schwannomas from meningiomas of the internal auditory canal using perilymphatic signal evaluation on T2-weighted gradient-echo fast imaging employing steady state acquisition at 3T, European Radiology Experimental 1: (1) ((2017) ), 8. |
[20] | Venkatasamy A. , Bretz P. , Karol A. , Karch-Georges A. , Charpiot A. and Veillon F. , MRI of endolymphatic hydrops in patients with intralabyrinthine schwannomas: a case controlled study using non-enhanced T2–weighted images at 3 T, European Archives of Oto-Rhino-Laryngology (2020), 1–7. |


