
Sport-specific differences in dynamic visual acuity and gaze stabilization in division-I collegiate athletes
Abstract
BACKGROUND:
The vestibular-ocular reflex (VOR) integrates the vestibular and ocular systems to maintain gaze during head motion. This reflex is often negatively affected following sport-related concussion. Objective measures of gaze stability, a function mediated by the VOR, such as the computerized dynamic visual acuity test (DVAT) and gaze stabilization test (GST), may have utility in concussion management. However, normative data specific to sport, sex, or concussion history have not been established in collegiate athletes.
OBJECTIVE:
The objective of this study was to establish normative values for the DVAT and GST in collegiate athletes and explore the effect of sport, sex, and concussion history on VOR assessments.
METHODS:
The DVAT and GST were completed by 124 collegiate athletes (72 male, 52 female, mean±SD, age: 19.71±1.74 years, height: 173.99±13.97 cm, weight: 80.06±26.52 kg) recruited from Division-I athletic teams (football, soccer and cheerleading). The DVAT and GST were performed in the rightward and leftward directions during a single session in a standardized environment. Normative values for DVAT and GST measures were expressed as percentiles. Non-parametric statistics were used to compare differences between groups based on sex, sport, and concussion history. Alpha was set a-priori at 0.05.
RESULTS:
Overall, the median LogMAR unit for 124 athletes completing the DVAT was 0 (IQR = 0.17) for both leftward and rightward. The median velocities achieved on the GST were 145 °/sec and 150 °/sec (IQR = 45 and 40) for the leftward and rightward directions respectively. Significant differences were observed between sports (p = 0.001–0.17) for the GST with cheerleading demonstrating higher velocities than the other sports. However, no significant differences were identified based on sex (p≥0.09) or history of concussion (p≥0.15).
CONCLUSIONS:
Normative estimates for the DVAT and GST may assist in the clinical interpretation of outcomes when used in post-concussion evaluation for collegiate athletes. Although sex and previous concussion history had no effect on the DVAT or GST, performance on these measures may be influenced by type of sport. Sport-related differences in the GST may reflect VOR adaptations based on individual sport-specific demands.
1Introduction
Sport-related concussions (SRC) present a significant public health burden [6, 7]. Although the true number of these injuries remains unknown, it is clear that the incidence of these injuries continues to rise [6, 7, 20, 21]. SRCs are unique injuries because they may not always be outwardly apparent and often rely on the patient to report their experienced symptoms. Self-reported symptoms are often used to help in the evaluation and diagnosis of SRCs [20, 27], however, clinical examinations that rely solely on the patient’s self-reported symptoms are not ideal [9, 27, 31] as they rely on the memory and biases of the individual report and thus only tell one part of the concussion story. With the increasing population at risk for SRC the need for better recognition, management, and treatment strategies is clearly needed.
One of the sensory systems commonly involved following concussion is the vestibular system [2, 3, 9, 10, 12, 34]. Comprised of small sensory organs in the inner ear, the brain stem, and cerebellum, the vestibular system is responsible for both sensory and motor function [10, 32, 34]. Through integration with the ocular system, the vestibular-ocular reflex (VOR) stabilizes retinal images during dynamic head motion [3]. Following concussion, 60% of patients report vestibular complaints while 30% report visual problems [19]. These complaints can result in a number of symptoms including dizziness, blurred vision and balance dysfunction [34]. Dizziness is one of the most commonly reported symptoms with 67–77% of collegiate and high school athletes who have suffered SRC reporting these symptoms [34]. Additionally, the presence of dizziness in the acute phase following SRC has been associated with a 6-fold greater risk for a prolonged recovery (greater than 21 days) [22]. Therefore, it is imperative that vestibular function be evaluated following SRC and that function has returned to a level equivalent to that before the injury was sustained, or returned to baseline before an athlete returns to full athletic participation.
Assessments of vestibular function, specifically the VOR, largely depend on the testing environment that includes; the type of examination (on-field or off), time availability, and resources. The Vestibular-Ocular Motor Screen (VOMS) was developed to serve as a brief clinical assessment tool to measure symptoms in response to several domains of function [27] and serves as a screening tool developed to identify the presence of oculomotor and vestibular deficits following concussion by assessing five domains (smooth pursuits, horizontal and vertical saccades, convergence, horizontal vestibular ocular reflex and visual motion sensitivity). It also measures the provocation of symptoms following each assessment via self-report of dizziness, nausea, headache and other related symptoms [27]. This test serves as a brief assessment that can be administered on the sideline to assess vestibular-ocular deficits following concussion. While the VOMS has been shown to be a useful clinical tool, the outcome of this test battery is based on symptom reporting. Objective measures of VOR function may further enhance post-concussion evaluation by providing a performance-based measure to inform clinical decision making.
To address this gap, instrumented strategies that objectively assess functional deficits that may exist following SRC are the Dynamic Visual Acuity Test (DVAT) and the Gaze Stabilization Test (GST). To accurately measure VOR function, the DVAT and GST require two baseline tests; the Baseline Visual Acuity (BLVA) and Visual Processing Time (VPT). The DVAT and GST may be used to assess VOR function following head injuries, specifically concussion and are able to discern or identify corresponding deficits if they exist [8, 26]. Therefore, these assessments may serve as objective clinical measures to monitor the VOR during SRC management.
Current practice management strategies often lack emphasis on the assessment of vestibular function following concussion. The DVAT and GST are promising clinical tests that may enhance SRC evaluation for athletes with suspected VOR involvement. There have been many investigations of these assessment strategies in athletic populations that suggest that these measures are reliable and valid [5, 14, 15, 18, 25, 28, 31, 33]. However, there is a lack of normative data in the athletic population using this more recent technology; previous studies utilized older systems while the current investigation is one of the first reported to use the Bertec® Vision Advantage™ (Bertec® Corporation, Columbus, Ohio, USA). Having normative values for clinical tests that are specific to the population a clinician is treating is critical for situations where they are returning athletes to participation without a baseline evaluation in these measures. It is important that along with normative estimates, clinicians have evidence that helps them understand the additional factors that may influence performance on objective VOR assessments. Therefore, the primary purpose of this study was to establish normative DVAT and GST values in collegiate athletes. The secondary purpose of the study was to explore the effect of sex, sport, concussion history, and baseline symptoms on the DVAT and GST to determine if differences exist within subgroups of athletes. The results of this study will provide baseline, normative data on VOR functioning to enhance the interpretation of these measures in clinical practice.
2Methods
A cross-sectional study design was used to establish normative estimates on the DVAT and GST in collegiate athletes. Additionally, the effects of sex, sport, concussion history, and baseline symptoms on the DVAT and GST were evaluated to determine how these variables may influence baseline assessments. The dependent variables included DVAT and GST scores.
2.1Participants
All participants provided written informed consent which was approved by the University Institutional Review Board. Volunteers were eligible to participate in the study if they were collegiate athletes between the ages of 18–24, medically cleared to participate in athletics without restrictions at the time of data collection, and reported no history of neurological/vestibular disorders (excluding concussion), motion sickness, vertigo, currently experiencing neck pain, or limited cervical range of motion, or were currently using allergy medications. Participants were recruited via access to the athletic departments and athletic training departments. Recruitment for this study placed a priority on football, soccer, and cheerleading athletes due to the higher incidence of concussion in these sports. Participants self-reported concussion history. Participants who had corrected vision were able to participate and completed testing with corrected vision. Due to the athletic population, athletes who needed vision correction wore contacts.
2.2Instrumentation
The Bertec® Vision Advantage™ (Bertec® Corporation, Columbus, Ohio, USA) was used to administer the DVAT and GST. The Bertec® Vision Advantage system included a wireless inertial measurement unit mounted in the center of the participant’s forehead using an elastic headband and a 15” Windows laptop equipped with Bertec® Balance Advantage™ software. The inertial measurement unit was used to quantify velocity and identify direction of head rotation during the head turn trials, with a sampling frequency of 175 Hz.
The measures of visual acuity were recorded in Logarithm of the Minimum Angle of Resolution (LogMAR) units. LogMAR units have replaced the traditional Snellen chart and offers a more standardized method of reporting visual acuity [11, 30]. The logarithmic scale takes into account adjustments in viewing distance during assessment and directly corresponds with the traditional Snellen chart [13]. The LogMAR value of zero corresponds the 20/20 which is also the standard for normal vision. The lower the LogMAR, the greater the visual acuity. A negative LogMAR unit represents better than 20/20 vision.
3Procedures
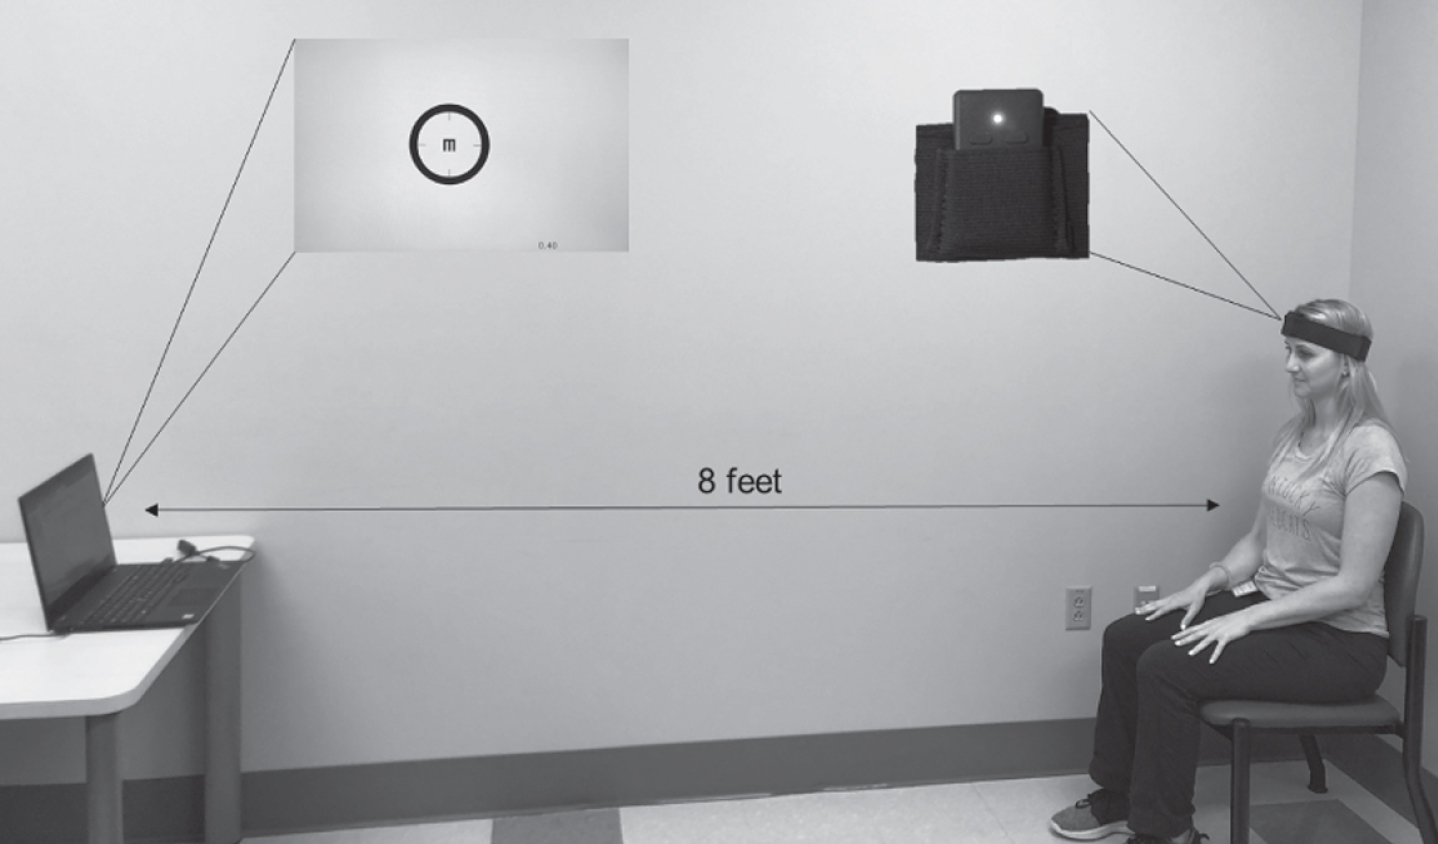
Prior to testing, participants completed a demographic questionnaire. The questionnaire included questions such as; age, height, weight, injury history, and previous concussion history. Participants self-reported concussion history. The research personnel did not verify the diagnosis of the previous concussion or how severe. Participants completed self-report baseline symptom inventories using the Post-Concussion Symptom Scale (PCSS) [24] and the Dizziness Handicap Inventory (DHI) [17]. Next, participants completed the DVAT and GST in a quiet, well-lit, standardized testing room which was free from distractions. The room set up was standardized for continuity across testing dates and locations and one assessor completed the assessments for all participants. Participants were seated in a stationary chair, 8-feet away from a table of adjustable height with a laptop. Based on each subject’s height the table height was adjusted to ensure the best view of the laptop screen.
3.1Assessments
For each of the BLVA, VPT, DVAT and GST, the software projected an optotype capital letter “E” on the center of the laptop screen in black print against a light blue background, as seen in Fig. 1. As the orientation of the letter “E” changed, the participant was responsible for verbally stating the orientation of the open side of the “E” (left, right, up, or down) during each of the four tasks. The testing procedures required two baseline assessments to measure BLVA and VPT to individualize the dynamic assessments to the individual being tested. These tests must be completed before DVAT and GST may be performed. During the BLVA, the optotype E appeared in varying sizes to test visual acuity with the head still. For the VPT, the optotype size remained constant while the time the “E” remained on the screen varied to determine processing time. These assessments were used to set the parameters for the DVAT and GST.
Fig. 1
BVA set-up with participant seated 8-feet from laptop screen.
3.1.1Dynamic visual acuity test (DVAT)
The DVAT provided a measure of visual acuity during a sustained head movement of 20° in each direction, at a target velocity of approximately 100 °/sec. The amount of time that the “E” was visible on the screen was based on the results of the VPT. To complete the DVAT, the examiner moved the participants head from left to right in the yaw plane (left/right head rotation) at a target velocity of 100°/sec on average, with a range of 15°/sec above or below the target velocity. The participant maintained their gaze on the screen and identified the “E” in varying orientation and sizes. The optotype stimulus presentation was adaptive such that it began at a difficulty level based on individual subject baseline measurements. Following correct subject responses, the stimuli became smaller and more challenging. Following incorrect responses, the stimuli became larger and less challenging. Once the head was rotating at the appropriate speed the letter would appear. The lowest optotype, or best level at which the participant correctly identified the orientation of the “E” at a rate of 60%, was identified as the cut-off point in which the assessment ended and that was the final score. This was completed on both the left and right side. The DVAT, on other commercial computerized systems, has demonstrated moderate to good test-retest reliability in athletic populations with an intraclass correlation coefficient of 0.770 in the yaw plane [18].
3.1.2Gaze stabilization test (GST)
For the GST, the test parameters included the VPT value calculated in the baseline test, individual test direction (left or right), and optotype set at 0.2 LogMAR above their BLVA. To complete the assessment the examiner moved the participants head from left to right, in a reciprocating motion, 20° in each direction, in the yaw plane. For this assessment, the starting direction was randomly selected by the software. Based on the population being assessed, participants were tested using the high-performance GST; testing velocity began at 120°/sec, opposed to the standard GST which begins at 80°/sec and does not reach velocities higher than 150°/sec. The velocity increased based on the individual’s ability to accurately denote the orientation of the E at a constant optotype. Once the participant was unable to successfully identify the orientation of the letter E correctly, the highest rotational velocity the orientation of the “E” was accurately identified at a rate of 60% was used as the GST score. This was completed on both the left and right side.
3.1.2.1. Statistical analysis. Distribution of the DVAT and GST variables were examined with a Kolmogorov-Smirnov non-parametric test (p > 0.05). Results indicated that all variables were not normally distributed. Therefore, non-parametric tests were utilized for all statistical analyses. Descriptive statistics including median, and interquartile range (IQR) were used to describe DVAT and GST scores presented in LogMAR units and °/sec respectively. Percentile scores were calculated for each assessment.
Kruskal-Wallis tests were used to compare differences across sports. When indicated, post-hoc Mann-Whitney U tests were used to examine pairwise differences between sports (football, soccer, cheerleading) and concussion history (0, 1, 2 or more concussions). Additionally, Mann-Whitney U tests were used to compare differences based on sex (male, female) across all sports. Preliminary analyses demonstrated lack of significant differences between sex, within sports, thus, sex was explored across the entire cohort. Spearman’s rho correlations were used to explore the relationship between the time since the last concussion, baseline symptoms, and DVAT and GST scores. Spearman’s correlations were interpreted as weak (r = 0.20–0.29), moderate (r = 0.30–0.39), strong (r = 0.40–0.69) and very strong (r≥0.70) [4]. Alpha was set a-priori to p < 0.05 for all analyses. IBM SPSS Statistics Version 25 (IBM, Corp., Armonk, NY, USA) was utilized for all statistical analyses.
4Results
A total of 124 athletes Division-I collegiate athletes from two University athletic departments participated in the study (Table 1). Participants were representative of intercollegiate sports including football (n = 44), soccer (n = 45), and cheerleading (n = 35). Cheerleaders reported higher symptom severity at baseline (mean±SD; 10.43±16.20) than both football (3.47±6.12) and soccer (3.77±5.52), however perceived handicap as a result of dizziness was similar across groups (range: 0.49–1.89). The results of the PCSS and DHI suggest a relatively minimal to no symptom burden for the sample. Within the sample, 26.6% reported a history of one concussion, 19.4% reported a history of two or more concussions. There was a range of 1–96 months (28.55±24.61) since the most recent concussion. Reported symptoms between the athletes without a history of previous concussion and with a history of previous concussion did not differ, suggesting recovery of those with a previous concussion injury. One participant was unable to complete the dynamic head movements due to lack of neck range of motion and was removed from analysis. Two participants were unable to complete the bilateral GST after experiencing dizziness with high velocities but were included in the analysis. For these participants the individual direction scores were used for the direction that was completed because they did not have results in each direction. However, these data were considered valid because bilateral comparison and asymmetries were not explored in the purpose of this study. The percentile scores on DVAT LogMAR units and GST °/sec in the rightward and leftward directions for all 124 athletes are displayed in Table 2.
Table 1
Descriptive Statistics for Subject Demographics, Patient Reported Outcomes, and Concussion History across Division-I Collegiate Athletes Participating in Football, Soccer, and Cheer
| Football (n = 44) | Soccer (n = 45) | Cheerleading (n = 35) | |
| Sex | 44 males | 13 male, 32 female | 15 male, 20 female |
| Age (years) | 20.32±1.44 | 18.91±1.04 | 20.26±1.38 |
| Height (m) | 1.86±0.08 | 1.69±0.08 | 1.65±0.15 |
| Mass (kg) | 108.52±18.49 | 63.87±7.52 | 65.10±20.33 |
| Post-Concussion Symptom Scale (PCSS)- Severity | 3.47±6.12 | 3.77±5.52 | 10.43±16.20 |
| Dizziness Handicap Inventory (DHI) | 1.36±6.26 | 0.49±1.96 | 1.89±3.18 |
| History of Concussion | 25 (56.8%) | 14 (31.1%) | 18 (51.4%) |
| Time since Last Concussion (months) | 6.56±31.47 | 5.84±21.83 | 3.56±15.09 |
Table 2
Distribution of DVAT (LogMAR) and GST (°/sec) Percentile Scores for All Participants
| Percentile | |||||||
| Condition | 5 | 10 | 25 | 50 | 75 | 90 | 95 |
| DVAT-R | 0.27 | 0.2 | 0.10 | 0 | –0.07 | –0.15 | –0.19 |
| DVAT-L | 0.25 | 0.22 | 0.09 | 0 | –0.07 | –0.15 | –0.20 |
| GST-R | 120 | 120 | 130 | 150 | 175 | 205 | 229 |
| GST-L | 120 | 120 | 130 | 145 | 170 | 205 | 231 |
4.1Effect of sex, sports participation and concussion history
There were no significant differences based on sex for any DVAT or GST variables (p≥0.15, Table 3). A significant main effect for sport was detected for DVAT-R (p = 0.008), DVAT-L (0.009), and GST-R (p = 0.010, Table 4). Cheerleading demonstrated worse DVAT-L and DVAT-R scores compared to football (p = 0.007) and soccer (p = 0.006). Despite worse DVAT scores, cheerleading demonstrated significantly better GST (higher rotational velocities) compared to soccer in GST-R (p = 0.003).
Table 3
DVAT (LogMAR) and GST (°/sec) Scores by Sex (median (IQR))
| Male | Female | P-Value | |
| DVAT- R | 0 (0.15) | 0 (0.17) | 0.675 |
| DVAT-L | 0 (0.14) | –0.03 (0.17) | 0.757 |
| GST-R | 150 (50) | 155 (40) | 0.191 |
| GST-L | 140 (40) | 150 (50) | 0.275 |
Table 4
DVAT (LogMAR) and GST (°/sec) Scores by Sport (median (IQR))
| Football | Soccer | Cheerleading | P-Value | |
| DVAT- R | –0.03(0.20) | 0 (0.15) | 0.06 (0.16) | 0.008 |
| DVAT-L | –0.03(0.14) | –0.03 (0.13) | 0.05 (0.24) | 0.009 |
| GST-R | 150 (40) | 145 (40) | 157.5 (66) | 0.010 |
| GST-L | 135 (50) | 145 (35) | 152.5 (66) | 0.110 |
No significant differences were identified in any DVAT or GST variables (p≥0.107) based on history of previous concussion (Table 5). Additionally, no significant relationships were demonstrated between the number of previous concussions and performance on the DVAT and GST (rs≤0.106, p≥0.437). All correlations between the time since last concussion (in months) and the DVAT and GST variables were weak and not statistically significant (rs≤0.265, p≥0.053).
Table 5
DVAT (LogMAR) and GST (°/sec) Scores by Concussion History (median (IQR))
| No History of Concussion | History of Concussion | P-Value | |
| DVAT- R | 0 (0.17) | 0 (0.17) | 0.738 |
| DVAT-L | –0.03 (0.85) | 0 (0.70) | 0.107 |
| GST-R | 150 (40) | 150 (45) | 0.819 |
| GST-L | 145 (35) | 145 (50) | 0.839 |
Similarly, the correlations between baseline symptoms and all other variables were weak and not statistically significant. Specifically, there was no relationship between the total DHI score and any of the DVAT and GST variables (rs≤0.165, p≥0.068). There were weak and not statistically significant relationships between the PCSS-symptom severity score and DVAT and GST scores. Symptom scores were collected prior to testing and were not repeated following testing.
5Discussion
This study provides normative data for the DVAT and GST in Division-I collegiate athletes. Additionally, the effects of sex, sport, and concussion history were explored to further understand factors which may influence DVAT and GST performance. Normative estimates within this population were defined and organized into percentiles. Despite the lack of statistically significant differences in any of the variables based on sex, there were differences based on sport. Cheerleading demonstrated poorer dynamic visual acuity and the fastest gaze stability velocities compared to football and soccer athletes. Additionally, it was determined that no significant differences in DVAT and GST performance were present based on concussion history and there were no significant relationships between self-reported baseline symptoms and DVAT or GST performance.
Previous investigations in the literature support the findings in this study and provide further information that is useful for clinicians treating these populations following concussion. Additionally, uniqueness of the performance in athletes has been highlighted. Similar to what our data suggested, Massingale et al., [25] demonstrated differences in gaze stability velocities between elite baseball athletes and the general population. Thus, normative values from healthy individuals cannot be applied to athletic populations who have demonstrated superior performance, even unique to sport, as demonstrated in the current study.
Kaufman et al., examined the reliability of the DVAT and GST in collegiate and high school football athletes. While these computerized assessments were completed on a different system, many of the results from the first testing session follow the same trends noted in the football cohort of the current study. The results of the DVAT in the collegiate athlete group were an average of –0.04±0.13 LogMAR units compared to the current group with a median performance of –0.03(0.20) LogMAR units. Similarly, the GST reported in the yaw plane was 187±39 deg/sec compared to a velocity of 147.5 deg/sec. The superior performance reported in the previous investigation may be attributed to the practice provided while the current study did not include a familiarization opportunity but rather reported on the initial performance. Additionally, Kaufman et al. [18], completed the DVAT at a different velocity than the current study which in addition to the instrumentation, may explain the slight variations. The GST scores presented in this study also closely match those presented by Honaker et al. [14], in collegiate football athletes, with mean velocities of 147 and 150 deg/sec, further providing confidence in the results of the current study.
Sport-related differences in DVAT and GST performance may reflect VOR adaptations based on the individual demands as a result of sport-specific activities. While cheerleaders exhibited the fastest rotational velocities on the GST, they demonstrated the worst dynamic visual acuity evaluated using the DVAT. This is supported by previous research which demonstrated figure skaters’ sports-specific adaptations in VOR function [1]. Additionally, differences in performance in DVAT have been identified between athletes and non-athletes further identifying the need for population specific norms [16]. Between sport differences are important to acknowledge when applying these results clinically so that appropriate standards are used when assessing function of athletes from different sports participation. While percentiles provide a general interpretation of GST and DVAT norms in an athletic population, it is apparent that these values may vary based on sport.
While there were no significant differences identified based on sex or concussion history, these are both important findings with clinical application. The lack of any differences based on sex potentially suggests that these measures are not affected by this biological factor. Thus, any observed differences may be attributed to specific training, or adaptations and habituation as a result of other activities. However, these results differ from previous reports. Dunlap et al., found significant differences in GST performance between sexes (p = 0.02, p = 0.01) in individuals’ post-concussion [6]. Given the differences in the populations examined, there may be factors that contributed to the concussion and recovery that explain these differences in performance by sex. Similarly, there were no observed differences based on concussion history or the number of previously experienced concussions and no significant relationships between athletes who had a history of one or more concussions and those without a history of concussion. It is important to note the wide range of time since previous concussion and the low level of symptoms in this group. With no differences between the group with a history of previous concussion and those without a history of previous concussion, it is possible that the group with previous history of concussion has fully recovered from concussion. Full recovery could include full resolution of symptoms and returning to previous levels of competition, making this a healthy cohort. While there were not differences based on concussion history, without understanding baseline performance, we are unable to definitively conclude whether or not this may demonstrate that athletes who have sustained a concussion may regain GST and DVAT performance within normal limits of their counterparts who have not sustained a concussion. While the current study did not evaluate asymmetries, a previous investigation of asymmetries elucidated differences based on concussion history [14].
Finally, there were no notable relationships between the self-report symptom scores on the PCSS and DHI, and the DVAT and GST. This means that self-reported symptoms and scores on functional assessments at baseline are two independent measures without significant correlations. However, it is important to recognize the potential bias introduced using self-report measures in the current investigation. There was limited variability within the number of symptoms reported and the overall severity or symptom impact via the PCSS (mean: 5.67±10.42). Similarly, the DHI scores were low with very low variability (≤1.89±3.18). This low variability in DHI scores was also evident in a cohort of football athletes without a history of concussion (0.64±1.70) [14]. This may suggest that experienced symptoms effect GST performance.
5.1Limitations
This study is not without limitations. This study explored the normative estimates of the DVAT and GST using the Bertec® Vision Advantage™ system and passive head movements. At the current time, the reliability of the system has not yet been explored. This presents a significant limitation for the understanding of the system and its psychometric properties. Additionally, the study explored the effect of previous concussions on the assessment scores. However, this presented a potential limitation as the information regarding concussion history, number of previous concussions, and time since concussion was collected based on retrospective recall of the participants. Thus, it is possible that this information was susceptible to recall bias. Additionally, it is possible that the athletes had previous concussions that were unreported or undiagnosed, and athletes may have experienced concussions that were not reflected in the data collected.
The lack of generalizability of this study serves as an additional limitation. Due to the limited number of sports included in this study and the identified differences based on sports, these findings cannot be generalized to other sports. However, these findings provide clinical significance in the advancement of concussion evaluation and management through the definition of normative values and baseline function in a specific athletic population. These data can be used for comparisons if baseline data is not available for concussed individuals as they recover and attempt to meet return to participation levels and criteria. It is important to emphasize that these findings are limited to baseline data and may not be generalized to post-concussion function. At this point, it is not possible to determine how sport-specific differences will manifest post-concussion. Future research should expand normative baseline measures to determine if the same baseline benchmark values can be used for other sports.
Further analyses within sport should be conducted with information regarding handedness, position played within their sport and other factors that would allow for further stratification and analysis. This information may provide explanation to better understand more specific VOR adaptions based on sport-specific activities. An additional limitation to this study was that specific player position within their sport was not recorded. Previous research has identified that “position players” in football scored higher than their lineman counterparts in an exploration of gaze stability in football athletes [23, 29]. This exploration could be replicated within football and other dynamic sports and activities.
5.2Clinical implications
It has been well documented that the vestibular and ocular systems are vulnerable to injury as a result of concussions and the consequences manifest in functional deficits as well as physical symptoms [2, 8, 19, 34]. It has also been recognized that current concussion management practices lack quality assessments of the vestibular system, most specifically the integration of the vestibular and ocular systems via the VOR [26]. The normative data provided by this study are a foundation for clinicians to interpret these measures within collegiate athlete patient populations. Additionally, it also highlights the need for individualized care and the recognition of sports participation and its effect on these measures. Thus, athletes who compete in sports with a higher rotary component may require different return to participation values than those who do not. For example, based on the current findings, cheerleaders may require their GST to return to a higher level compared to a football player to ensure a safe return to that sport.
5.3Future directions
While normative estimated for the DVAT and GST have been reported based on a cohort of colligate athletes, further research could expand these findings by reporting on larger sample sizes with a wider variety of sports included. Additionally, these measures should be used to evaluate athletes in the acute and return to participation phases following SRC to better understand the clinical recovery of gaze stabilization.
6Conclusion
This study presents normative estimates on objective VOR testing in Division-I collegiate athletes and the effect of different variables including, sex, sports participation and concussion history on these measures. Additionally, this study explored the relationships between self-reported symptoms and measures of dizziness and objective measures of vestibular function. The results of this investigation suggested that while there were no differences based on sex or concussion history, there are differences based on sports participation. Additionally, there are no significant relationships at baseline between self-reported symptoms and measures of function at baseline. While baseline performance data are not always available, the organization of normative data, and understanding the effect of these variables on performance, may provide clinicians with useful information to inform decision making based on post-injury data. Furthermore, contextual factors, such as sex, concussion history, and baseline symptoms, do not appear to influence performance on these assessments.
References
[1] | Alpini D. , Botta M. , Mattei V. and Tornese D. , Figure ice skating induces vestibulo-ocular adaptation specific to required athletic skills, J Sport Sciences for Health 5: ((2009) ), 129–134. |
[2] | Alsalaheen B.A. , Mucha A. , Morris L.O. , Whitney S.L. , Furman J.M. , Reddy Camiolo-C.E. , Collins M.W. , Lovell M.R. and Sparto P.J. , Vestibular rehabilitation for dizziness and balance disorders after concussion, J Neurol Phys Ther 34: ((2010) ), 87–93. |
[3] | Cullen K.E. , The vestibular system: multimodal integration and encoding of self-motion for motor control, Trends Neurosci 35: ((2012) ), 185–196. |
[4] | Dancey C.P. and Reidy J. , (2004). Statistics without Maths for psychology: Using SPSS for windows, London, UK: Prentice Hall. |
[5] | Faul M. , Wald M.M. , Xu L. and Coronado V.G. , Traumatic brain injury in the United States; emergency department visits, hospitalizations, and deaths 2002–2006, (2010). |
[6] | Finkelstein E. , Corso P.S. and Miller T.R. , The incidence and economic burden of injuries in the United States, Oxford University Press, USA, (2006) . |
[7] | Gottshall K.R. , Drake A. , Gray N. , McDonald E. and Hoffer M.E. , Objective vestibular tests as outcome measures in head injury patients, Laryngoscope 113: ((2003) ), 1746–1750. |
[8] | Guskiewicz K.M. , Ross S.E. and Marshall S.W. , Postural stability and neuropsychological deficits after concussion in collegiate athletes, J Athl Train 36: ((2001) ), 263. |
[9] | Hain T.C. and Helminski J.O. , Anatomy and physiology of the normal vestibular system, J Vestib Res 1: ((2007) ), 2. |
[10] | Hazel C.A. and Elliott D.B. , The dependency of logMAR visual acuity measurements on chart design and scoring rule, Optometry Vis Sci 79: ((2002) ), 788–792. |
[11] | Hoffer M.E. , Gottshall K.R. , Moore R. , Balough B.J. and Wester D. , Characterizing and treating dizziness after mild head trauma, J Otology Neurotology 25: ((2004) ), 135–138. |
[12] | Holladay J.T. , Proper method for calculating average visual acuity, J Refract Surg 13: ((1997) ), 388–391. |
[13] | Ishigaki H. and Miyao M. , Differences in dynamic visual acuity between athletes and nonathletes, Percept Mot Skills 77: ((1993) ), 835–839. |
[14] | Jacobson G. and Newman C. , The development of the dizziness handicap inventory, Arch Otolaryngol Head Neck Surg 116: ((1990) ), 424–427. |
[15] | Kaufman D.R. , Puckett M.J. , Smith M.J. , Wilson K.S. , Cheema R. and Landers M.R. , Test–retest reliability and responsiveness of gaze stability and dynamic visual acuity in high school and college football players, Phys Ther Sport 15: ((2014) ), 181–188. |
[16] | Kontos A. , Elbin R. , Schatz P. , Covassin T. , Henry L. , Pardini J. and Collins M. , A revised factor structure for the post-concussion symptom scale: baseline and postconcussion factors, Am J Sports Med 40: ((2012) ), 2375–2384. |
[17] | Kroshus E. , Garnett B. , Hawrilenko M. , Baugh C.M. and Calzo J.P. , Concussion under-reporting and pressure from coaches, teammates, fans, and parents, Social Science & Medicine 134: ((2015) ), 66–75. |
[18] | Langlois J. , Rutland-Brown W. and Wald M. , The epidemiology and impact of traumatic brain injury: a brief overview, J Head Trauma Rehabil 21: ((2006) ), 375–378. |
[19] | Lau B. , Kontos A. , Collins M. , Mucha A. and Lovell M. , Which on-field signs/symptoms predict protracted recovery from sport-related concussion among high school football players? Am J Sports Med 39: ((2011) ), 2311–2318. |
[20] | Lovell M. , Iverson G.L. , Collins M.W. , Podell K. , Johnston K.M. , Pardini D. , Pardini J. , Norwig J. and Maroon J.C. , Measurement of symptoms following sports-related concussion: reliability and normative data for the post-concussion scale, Neuropsychol 13: ((2006) ), 166–174. |
[21] | McDevitt J. , Appiah-Kubi K.O. , Tierney R. and Wright W.G. , Vestibular and oculomotor assessments may increase accuracy of subacute concussion assessment, J Sports Med 37: ((2016) ), 738–747. |
[22] | Mucha A. , Collins M.W. , Elbin R.J. , Furman J.M. , Troutman-Enseki C. , DeWolf R.M. , Marchetti G. and Kontos A.P. , A brief vestibular/ocular motor screening (VOMS) assessment to evaluate concussions: preliminary findings, Am J Sports Med 42: ((2014) ), 2479–2486. |
[23] | Pritcher M.R. , Whitney S.L. , Marchetti G.F. and Furman J.M. , The influence of age and vestibular disorders on gaze stabilization: a pilot study, Neurotol 29: ((2008) ), 982. |
[24] | Rosser D.A. , Laidlaw D.A.H. and Murdoch I.E. , The development of a “reduced logMAR” visual acuity chart for use in routine clinical practice, Br J Ophthalmol 85: ((2001) ), 432–436. |
[25] | Tascioglu A.B. , Brief review of vestibular system anatomy and its higher order projections, J Neuroanatomy 4: ((2005) ), 24–27. |
[26] | Valovich McLeod T.C. and Hale T.D. , Vestibular and balance issues following sport-related concussion, Brain Inj 29: ((2015) ), 175–184. |


