
Naive Bayes approach to predict the winner of an ODI cricket game
Abstract
This paper presents findings of a study to predict the winners of an One Day International (ODI) cricket game, after the completion of the first inning of the game. We use Naive Bayes (NB) approach to make this prediction using the data collected with 15 features, comprised of variables related to batting, bowling, team composition, and other. Upon the construction of an initial model, our objective is to improve the accuracy of predicting the winner using some feature selection algorithms, namely univariate, recursive elimination, and principle component analysis (PCA). Furthermore, we examine the contribution of the appropriate ratios of training sample size to testing sample size on the accuracy of prediction. According to the experimental findings, the accuracy of winner-prediction can be improved with the use of feature selection algorithm. Moreover, the accuracy of winner prediction becomes the highest (85.71%) with the univariate feature selection method, compared to its counterparts. By selecting the appropriate ratio of the sample sizes of training sample to testing sample, the prediction accuracy can be further increased.
1Introduction
Cricket is considered as a bat and ball game, which is becoming a popular team game on the global stage. Similar to most of the other sports, the development of cricket has gone through several stages to reach the current level. Present-day cricket comprises of three formats, namely, test cricket, one day international cricket (ODI), and twenty20 (T-20). Out of these different formats, the shorter versions, T-20 and ODI have gained more popularity due to the dynamic nature and the entertainment aspect of the game. Meanwhile, the experts of the game and the past legendary cricketers believe that the beauty of the game still lies in test cricket. Though our aim is not to argue which format of cricket is better, the focus of this study is towards the ODI format. With the enormous popularity of the ODI format and the rapid commercialization of the game, forecasting the outcome of the has gained a major importance. The existing demand and the abundance of available cricket data have motivated sports data analysts and researchers to conduct their research activities about this game. The progress towards an accurate prediction of the game has been hindered by the existence of obstacles such as the dynamic nature of the game and the wide range of associated variables of the game. Nonetheless, a clever review of the game prediction literature will help us to seek for an improved approach to predict the ODI game. Existing cricket literature exhibits multi- directional approaches used in game-prediction. All these game prediction procedures discussed in the literature can be broadly divided into two branches. They are either predicting the game before it starts or while the game is in progress (Yasir et al., 2017). Typical game-prediction algorithms use numerous inputs representing the player, the team, the cricket ground, the weather, and other off filed statistics. According to the literature, some of the most frequently used performance indicators in ODI game-prediction are home-field advantage (Bailey and Clearke, 2006; Paul and Stephen, 2002), the result of the coin toss (De Silva and Swartz, 1997; Dawson et al., 2009), day/night effect (De Silva and Swartz, 1997), the effect of bowling (Lemmer, 2008) and batting (Kimber and Hansford, 1993; Koulis et al., 2014; Lemmer, 2008; Lewis, 2005; Scarf et al., 2011; Tan and Zhang, 2001; Wickramasinghe, 2015). In addition to the incorporation of large volume of variables and factors used in game-prediction, the dynamic nature of the game makes the prediction process a daunting task. Furthermore, these involved dynamic variables often do not satisfy the required probabilistic assumptions. Under these circumstances, popular probabilistic models frequently exhibit inconsistencies. This is where the machine learning techniques perform better than the conventional counterparts. In this manuscript, we use NB classifier, which is a fast and accurate machine learning technique to predict the winner of an ODI game. This study brings novelty to the field of cricket data analytics in numerous ways. Unlike the available handful number of studies, this study considers higher number of performance indicators representing batting, bowling, and team composition in order to predict the winning team. Furthermore, we investigate ways to improve the predicting accuracy of the model by varying the involved parameters. Finally, this will contribute to the handful of studies conducted using NB classifier in cricket. The rest of this manuscript is organized as follows. At first, we embark the discussion with an over view of the existing literature. We infer into prior studies that were based on machine learning approach in game-prediction. Secondly, we present our NB model to predict the winning team by considering the statistics of the first inning of the ODI game. Finally, we use feature selection algorithms and seek for the best combination of parameters to improve the model.
2Machine learning in cricket
A glance at the literature indicates that the majority of the cricket related studies are based on standard statistical procedures. With the development of computing power and the availability of abundance of cricket data, machine learning techniques in game-prediction has become more and more popular. In order to achieve an optimal solution, conventional statistical requires the data to follow a set of tight assumptions. Typically, machine leaning techniques are relatively free of assumptions and learn from the data for the purpose of producing the best solution. In a study to predict English T-20 county cricket games, Kampakis and Thomas (2015) develop a machine learning model using the cricket-data collected from years 2009 to 2014. They adhere a multi-step approach to analyze the data, which comprised of over 500 features of both teams and players. Due to the high-level of uncertainty or randomness in T-20 format, the authors have failed to reach the level of accuracy that other sports usually reach. Using NB, logistic regression, random forests and gradient boosted decision trees, they find the simple NB learner as the best classifier to make prediction. Kumar and Roy (2018) predict the score of the ODI game after finishing the fifth over of the game. They also utilize machine leaning techniques such as kNN, Linear Regression and NB classifiers. When predicting the outcome of a game, prediction of individual player’s performance is important as a team comprises of individual players. Passi and Pandey (2018) in their study use several machine learning techniques such as Naive Bayes, Random Forest, Multi-class Support Vector Machines (SVM) and Decision Tree classifiers to predict the performance of individual players. This study focuses on forecasting the number of runs each batsman will score and the number of wickets each bowler will capture in a forthcoming game. According to their findings, they accurately predict the number of runs scored by a batsmen with an accuracy of 90.74% and the number of wickets taken by a bowler with an accuracy of 92.25%. Using batsmen-specific hidden Markov chain approach, Koulis and Muthukumarana (2014) model the individual batting performance of an ODI game. In another study to predict the team’s score, Nimmagadda et al. (2018) use random forest together with both multiple linear regression and logistic regression. They construct a model to predict the first innings score while the game is in progress, using run rates in T-20 games played in Indian Premier League (IPL) cricket tournament. Surprisingly, they exclude some predictive variables that most of other researchers use such as number of fallen wickets, the outcome of the toss, and the venue where the game is being played. Cricket, being a team sport the ultimate hope of a cricket fan is to see success of his or her. A glimpse of the literature gives evidences of such attempts to predict the winning team. In a study to predict the winner of an ODI game, Harshit and Rajkumar (2018) consider both batting and bowling performances together with four types of machine learning algorithms. This study relies on the classification algorithms namely, decision trees, support vector machines, logistic regression, and Bayes classifier. Using 5,000 records of ODI games, the author finds the Bayes classifier as the best classifier. In a another study to predict the result of a T-20 cricket game, Yasir et al. (2017) proposes a novice model based on multi-layer perception with adjustable weights of the used factors. This model predicts the outcome of the game, before the start of the game and while the game is in progress. In this model building, the researchers incorporate some statistics such as home ground advantage, result of the toss, team’s and player’s ranking, player’s strike rate, strike rate, remaining overs and wickets. According to their findings, the proposed model forecasts the winner with a performance rate of 85% prior to the start of the game and success rate of 89% while the the game is in progress. In another study, Sankaranarayanan et al. (2014) predict the outcome of the match by considering the historical and instantaneous match features. Attempt of Jhanwar and Pudi (2016) is to predict the outcome of an ODI game from the composition of the team’s perspective. In order to achieve this, the authors use several machine learning techniques together with both individual player’s batting and bowling statistics.
3Data collection
The International cricket Council (ICC), the governing body of cricket updated the existing ODI rules regarding fielding restrictions according to the item #28.7 in Rules and Regulations on September 30, 2018 (ICC, 2018). Furthermore, the number of runs collected by a team under the previous fielding restrictions cannot be compared with the current fielding restrictions. Therefore, in order to maintain the uniformity across all games, ODI series of games played from September 30, 2018 to January 01, 2020 was collected for this study. This study was conducted using all the ICC-ranked teams, namely Afghanistan (AF), Australia (AU), Bangladesh (BAN), England (ENG), India (IN), Ireland (IR), New Zealand (NZ), Pakistan (PK), South Africa (SA), Sri Lanka (SL), West Indies (WI), and Zimbabwe (ZM). As ODI game can be characterized by a collection of performance indicators (Bandulasiri, 2016) in this study we collected performance indicators representing four categories as displayed in Table 1. From batting points of view, inning’s total score, number of centuries, number of half-centuries, number of century and half-century partnerships were collected. From bowling department, total number of wickets fallen in the inning, the total number of dot balls and the total number of extra runs in the inning were collected. Bowlers who bowled at least three overs in the inning were considered in this data collection. Furthermore, team related statistics such as ranks of teams, number of bowlers, number of batsmen, and the number of all-rounders in the team were also collected. When considering team ranks, the rank value given by ICC was considered. Finally, after recording all the features displayed in 1, the winner of the game were also recorded.
Table 1
Descriptive statistics of the data
| Category | Variable | Mean (St.Dev) |
| Batting | Inning’s Score | 269.10 (70.18) |
| Number of Centuries | 0.37 (0.56) | |
| Number of Half-centuries | 1.35 (0.95) | |
| Number of Century Partnerships | 0.57 (0.61) | |
| Number of Half-Century Partnerships | 1.28 (1.04) | |
| Bowling | Number of Wickets | 7.87 (2.01) |
| Number of Dot Balls | 141.00 (23.53) | |
| Number of Extras | 12.46 (5.99) | |
| Team | Rank of the Team | 80.78 (38.15) |
| Rank of the Opposite Team | 94.49 (29.11) | |
| Number of Batters | 7.30 (0.59) | |
| Number of Bowlers | 5.43 (0.73) | |
| Number of All-rounders | 2.04 (0.90) | |
| Other | Playing at Home, Away, or Neutral | 0.95 (0.77) |
| Outcome of the Toss | 0.52 (0.50) |
4Methodology
When analyzing a data-set like this, which comprises of binary response variable and a collection of binary and continuous explanatory variables, logistic regression becomes the natural choice. Due to the lack of the required number of data-points to apply regression analysis, it is anecdotal and sought to an alternative technique henceforth (Allision, 1999; Bai and Pan, 2009). Unlike the conventional regression analysis requirements, NB works really well even with smaller sample sizes (Hand, 1992; Kuncheva, 2006).
4.1Naive Bayes (NB) Classifier
NB is a popular supervised learning technique used in machine learning. Due to the simplicity, speed and the accuracy, NB classifier is one of the most popular classification techniques in data science. NB is based on well-known Bayes’ theorem, which has vast number of applications in various domains such as error detection in software industry, disease identifications in health sector, malware detection in computer security, and students’ performance classification in education, and even in sports. One of the most exciting characteristics of NB classifier is its robustness. Furthermore, this classifier requires a small number of instances of data to train to estimate the necessary parameters (Hand, 1992; Kuncheva, 2006). Hence, unlike other classifiers, NB is capable of producing accurate results with relatively smaller samples. One of the main assumptions NB uses is the conditional independence, which states that for a given class, features are independent of each other. Interestingly, fundamental model comparison research show that NB performs exceptionally well even with the violation of it assumptions (George and Langley, 1995). Another reason behind the success of this model is that NB is less prone to over-training, especially with small sample size (Hand and Yu, 2001). Literature indicates a handful of studies for the use of NB in connection with cricket-data. A study conducted by Saikia and Bhattacharjee, 2010) measure the performance of all-rounders in T-20 format using Indian Premier League (IPL) data. In this study, players’ strike rate and economy rate are used as the performance indicators to build the NB model in order to predict the appropriate class of all-rounder. In another study, Singh et al. [38] use both linear regression classifier and NB to predict first innings score by considering the number of wickets fallen, venue of the match and batting team, and the current run rate. Furthermore, they use the same attributes to predict the outcome of the game by splitting the inning into five over intervals. According to their findings, NB predicts the outcome of the match with 68% accurately using the initially first five overs and the accuracy is 91% towards the end of 45th over.
4.2Model construction
Let X = (X1, X2, . . . . , Xn), where X1= Inning’s Score, X2= Number of centuries, X3= Number of half-centuries,..., Xn= Batting away, be a n = 15 -dimensional vector of random features from a domain DX and (x1, x2, . . . . , xn) be their corresponding instances. Let Y = (win, lose) be an unobserved random variable from domain DY = (0, 1). Though it is unknown, let’s assume that there is a function from DX to DY. Here our aim is to select the class Y, that maximizes the Posterior probability, P (Y = y|X = x). Here, P (Y = y|X = x), and P (X = x|Y = y) are Prior and class-conditional probabilities. Let C be the number of classes of Y. According to the Bayes’ theorem,
(1)
In practice, we are not interested about the P (X = x). Instead of estimating P (X = x), it is normalized in order to have the P (Y = y|X = x) = 1. From practical point if view, P (X = x|Y = y) is assumed to follow a Gaussian distribution, though the literature shows some exceptions. George and Langley (1995) replace the flexible Gaussian assumption with a kernel density estimation. In addition to the above Gaussian assumption, one of the main assumptions that NB uses is the Independence assumption. It assumes for a given class, the value of any given feature is independent of the value of any other feature. Therefore, due to the conditional independence, P (X1 = x1, X2 = x2,..., Xn = xn | Y = y) =
4.3Classification process
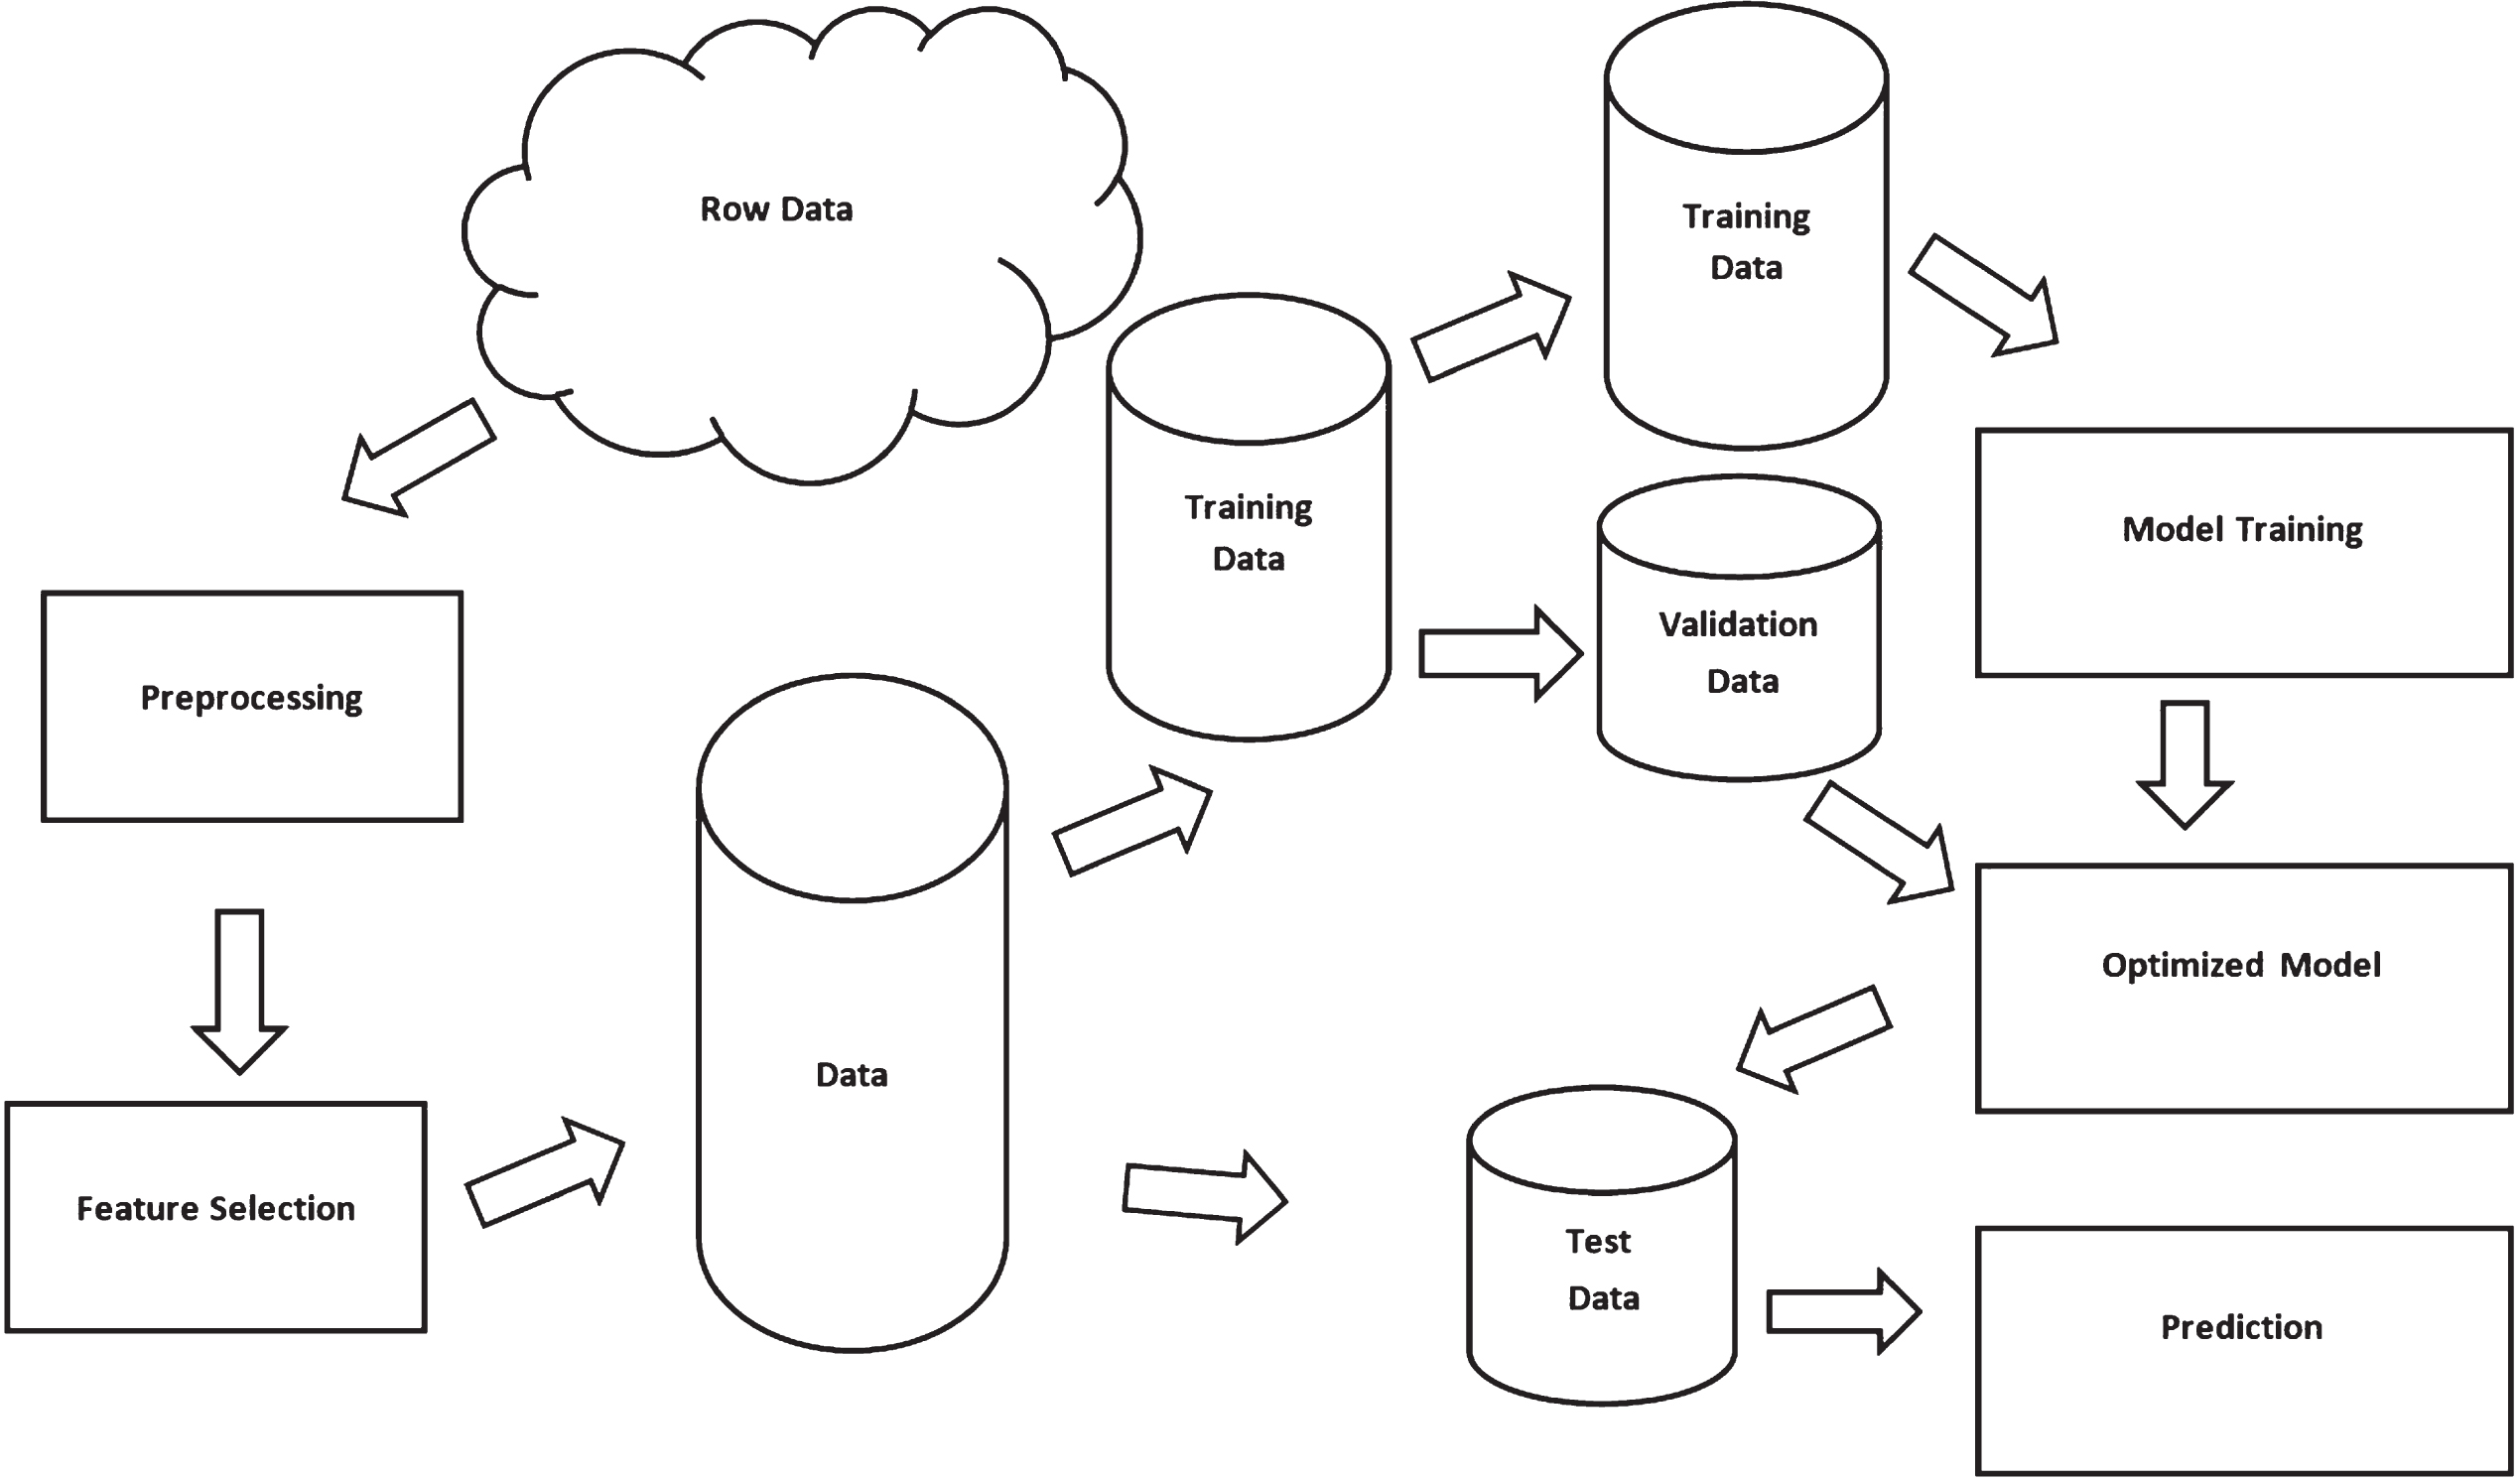
After the data collection, data were pre-processed. At this stage, all the data were converted into a format so that the analysis can be performed. All the features were checked for constancy and for missing values. Missing values were replaced with the average value of the relevant feature and the corresponding class. Next, we adhered to a feature selection algorithm, to enhance the prediction accuracy. The sole aim of the feature selection process is to identify significant features relevant to the outcome to be predicted. As stated before, NB performs exceptionally well when the assumptions are met. In situations where there is a doubt about the violation of independence assumption, reducing the number of features can minimize the above impact. In this study, we adhered three feature selection procedures by reducing the dimension of the original 15 features. Univariate (Chi-square), Recursive Elimination, and Principle Component Analysis (PCA) were the three feature selection algorithms used. Then we randomly divided the data into two samples, training and test as illustrated by Fig. 4. After that, the NB model was trained using the training sample and. When analyzing this data, it is not realistic to base the outcome only on a single sample. The model should be trained under various circumstances, as the prime aim of the fitted model is to make a good prediction based on an unseen data-set. Standard K-fold cross validation was used in this study so that the system randomly splits the original data into K disjoint samples to train the model.
4.4Quantifying the performance
In order to measure the accuracy predicting the winner, we use the following performance indicators that are based on the confusion matrix. Let’s introduce the following notations before defining the performance indicators. TP = Predicting the actual win as a win, FP = Predicting the actual lose as a win, FN = Predicting the actual win as a lose, and TN = Predicting the actual lose as a lose. Based on the above, we can define the classification accuracy and the error rate as the performance indicators to quantify prediction accuracy. Note that prediction accuracy is the complement of the error rate. Therefore, the perfect prediction indicates the value of the classification accuracy, 1.0 (or 100%) and error rate of 0 (or 0%). The entire algorithm is implemented using Python Anaconda 3.7.
(2)
5Results
According to the Fig. 1, Zimbabwe team has not recorded any win, while England team shows the maximum difference between the number of wins and the number of loses. Furthermore,
Fig. 1
Number of games wins and lose for each team.
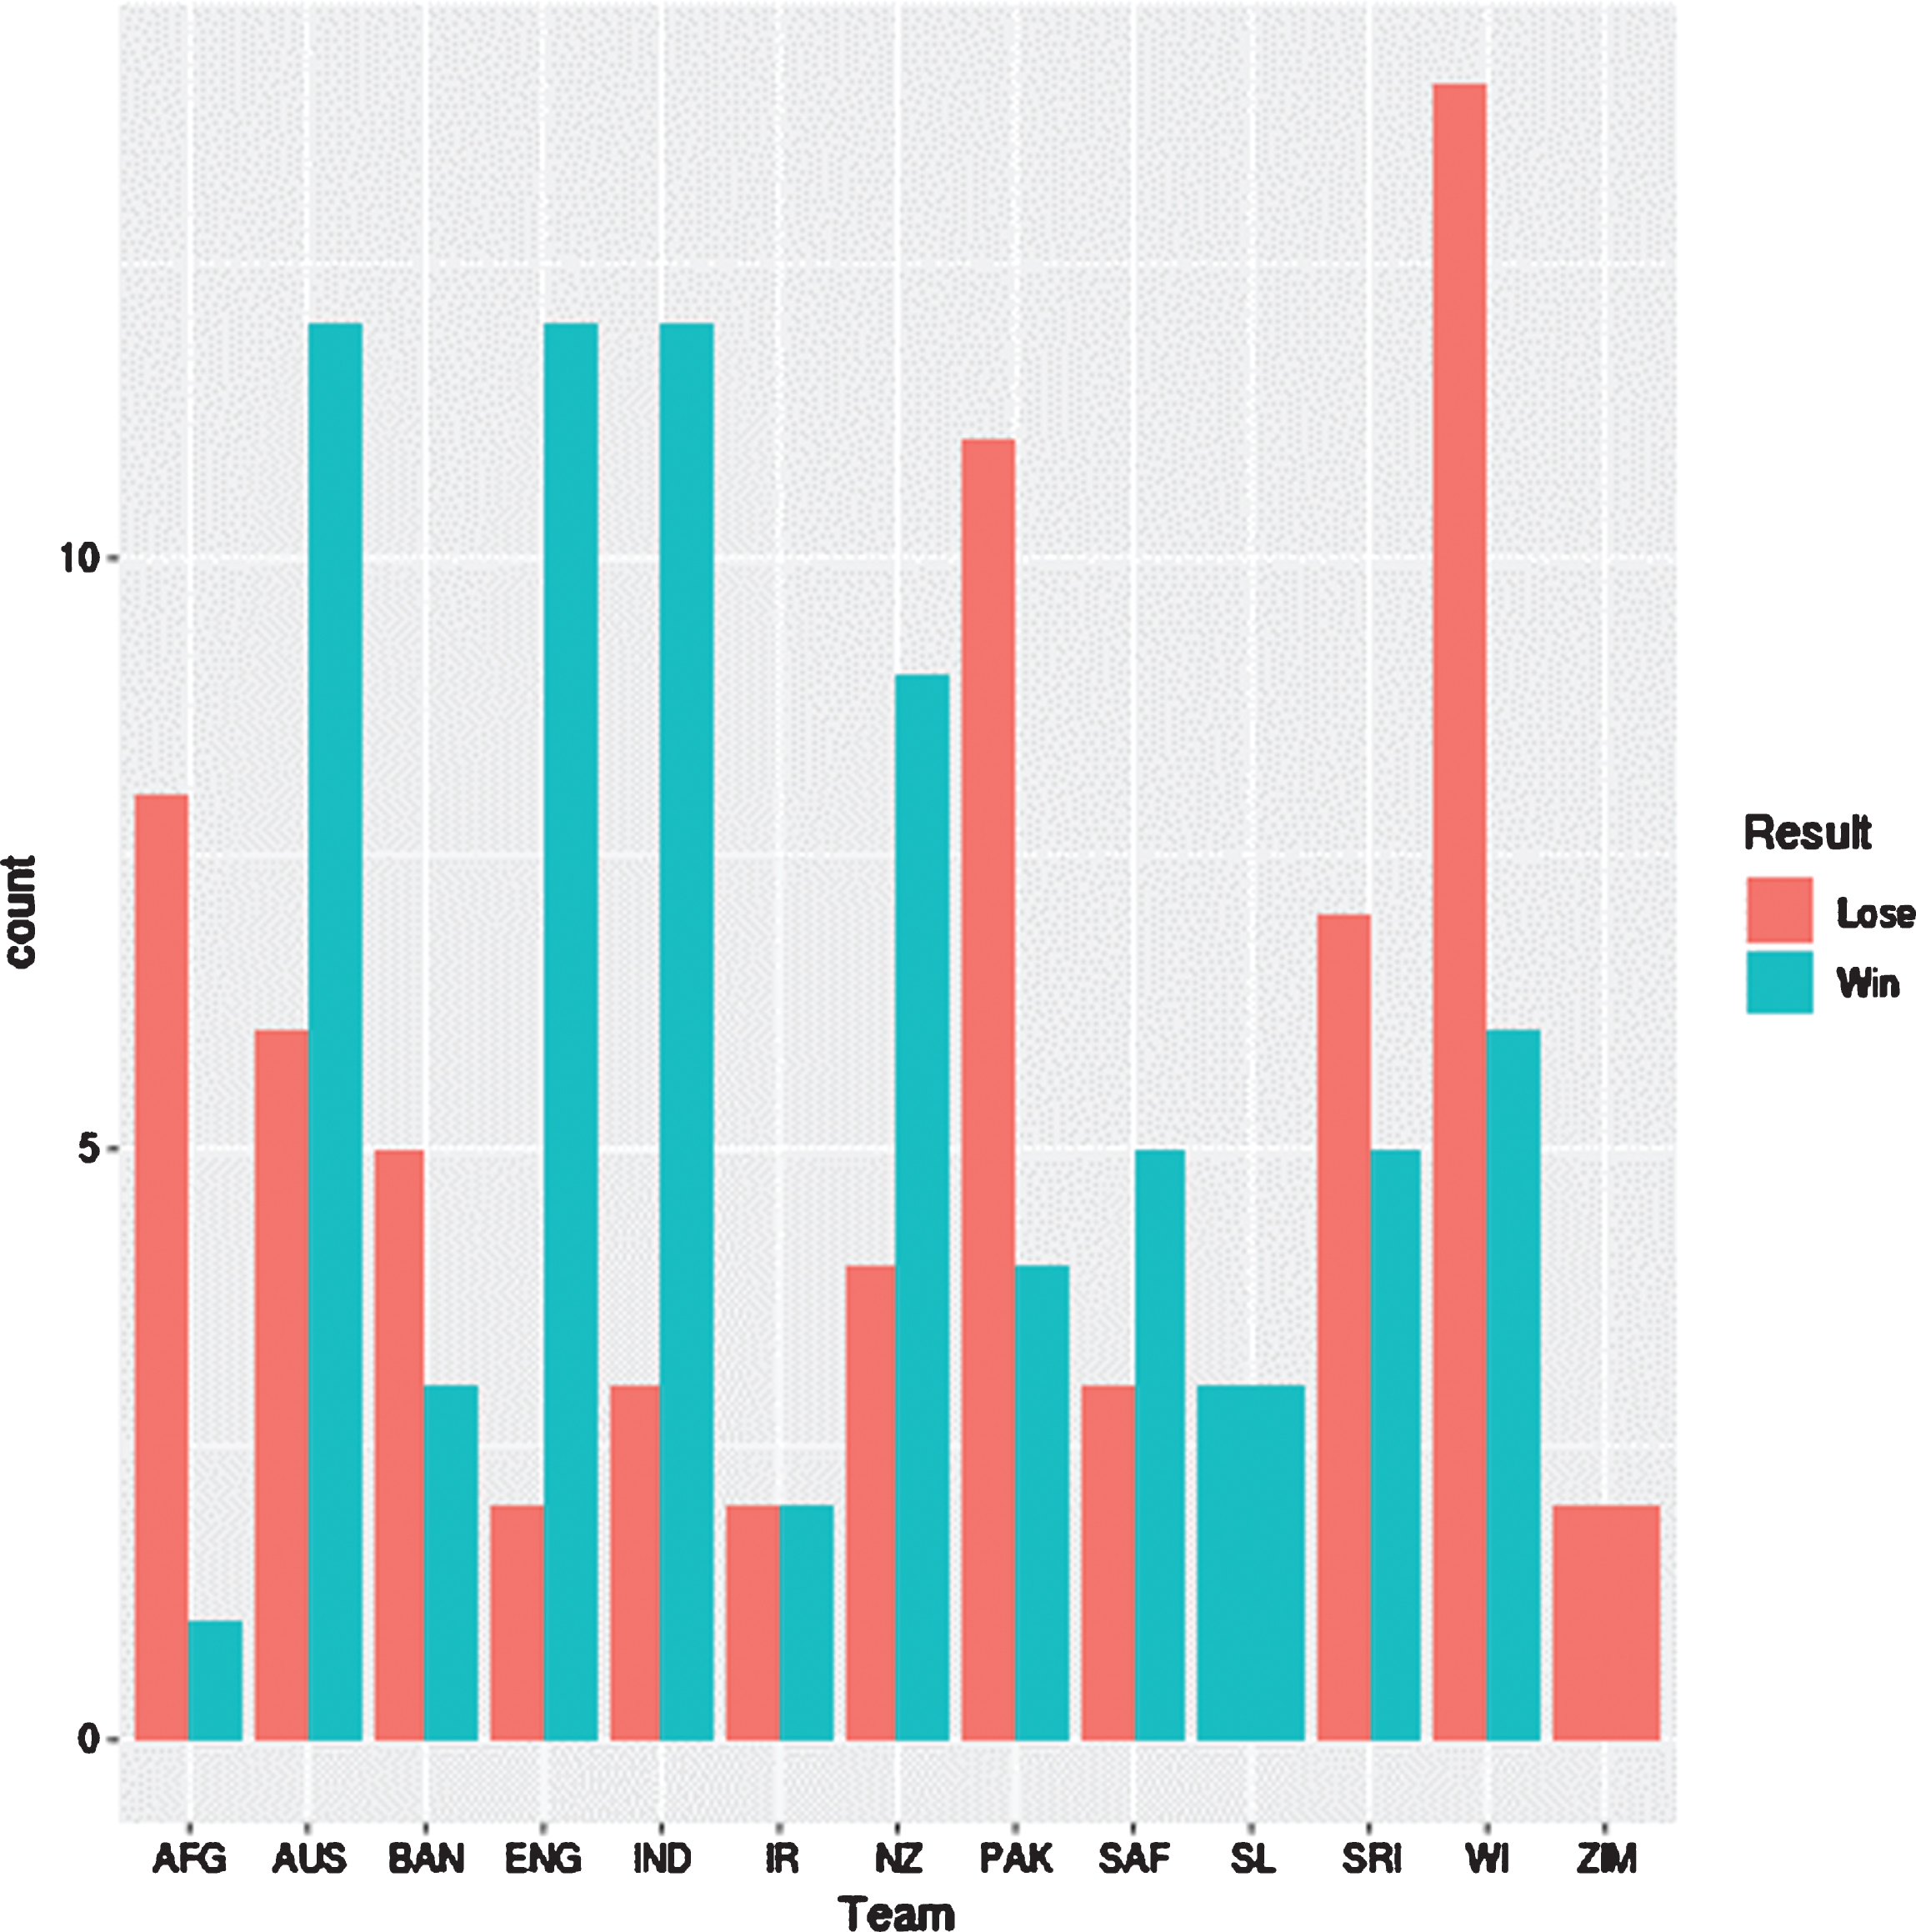
Afghanistan, Bangladesh, Pakistan, Sri Lanka, West Indies and Zimbabwe teams have lost more games than that they have won. Figure 2 illustrates the distribution of the number of half centuries in an inning by each of the 12 teams. As it displays, Australian, England, Indian and New Zealand teams have done a good job as far as the distribution of scoring half-centuries in an inning is concerned. When considering the first inning score by the team who bats first, according to the figure 3 the median score to win a game is about 300. Furthermore as this figure illustrates, the median score of games teams have lost is about 230. England team has always maintained higher median winning score (above 350) in an inning than other teams, while New Zealand has been able to maintain the lowest median score of winning games (about 275) than all the teams. Afghanistan team records the lowest median score of games that a team loses, while Pakistan has become the unlikeliest team for not winning the game having maintained a median score of above 275.
Fig. 2
Number of half centuries for each team.
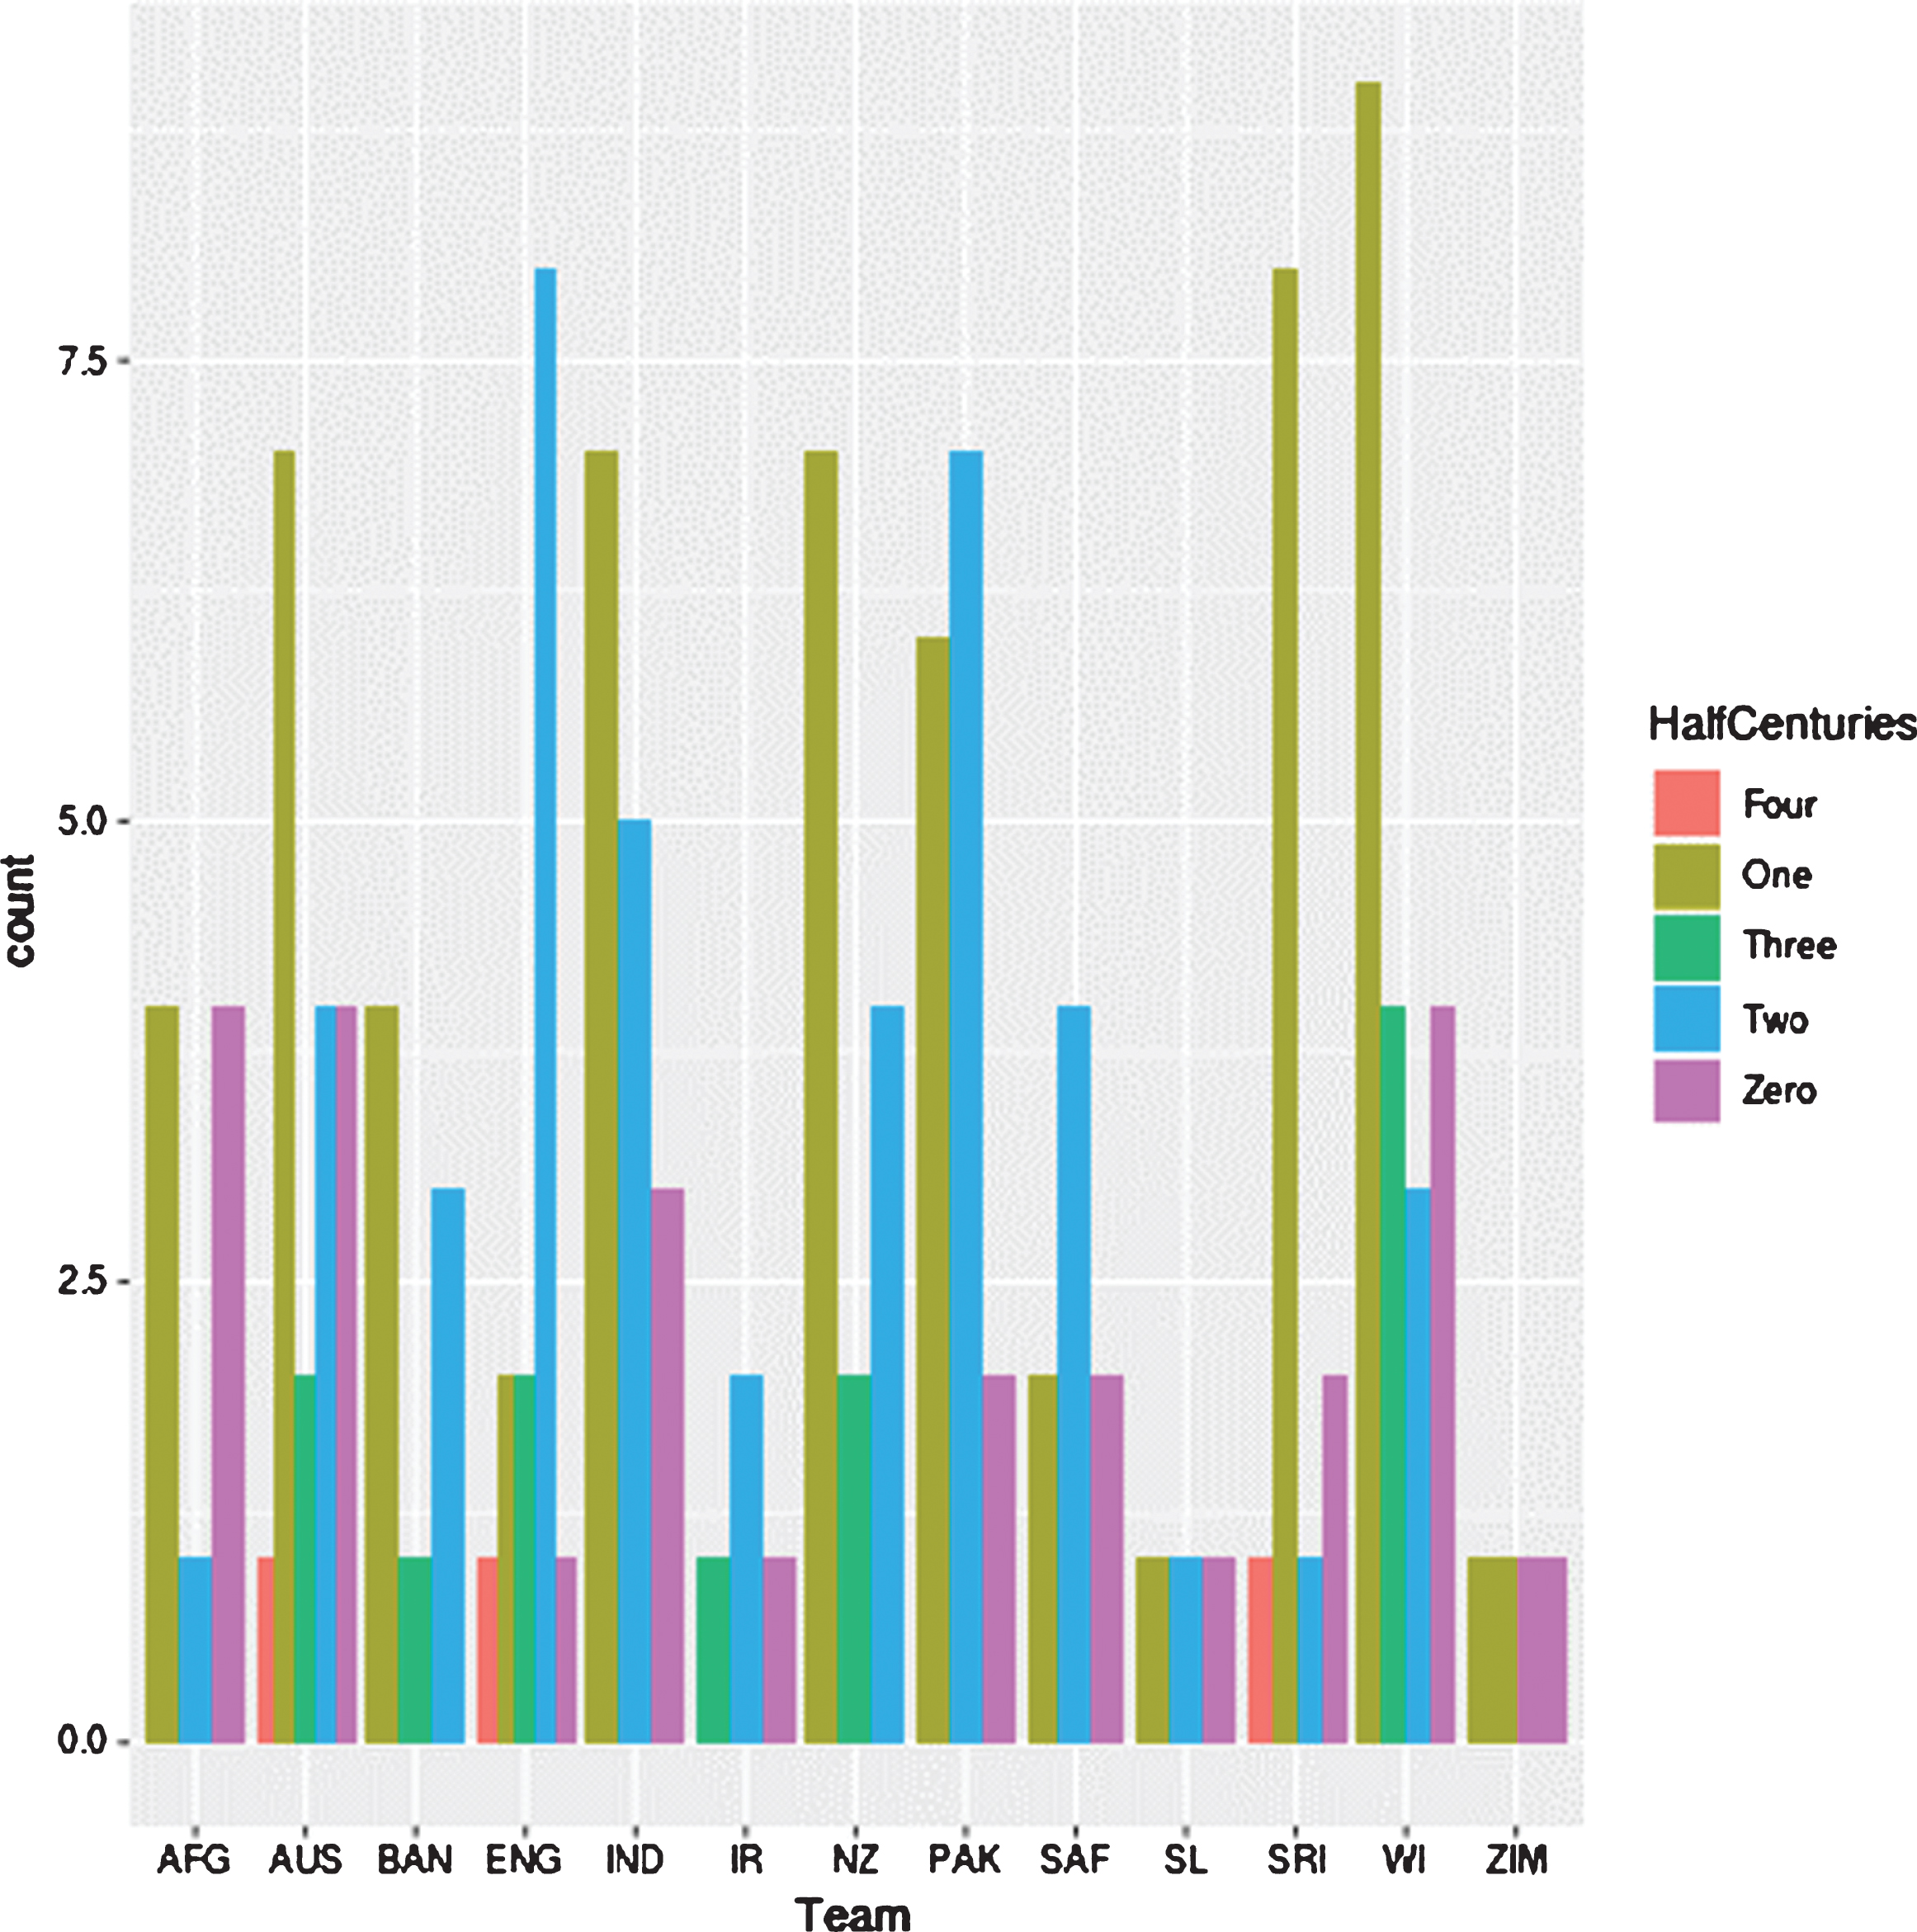
Fig. 3
Distribution of scores for winning and losing games.
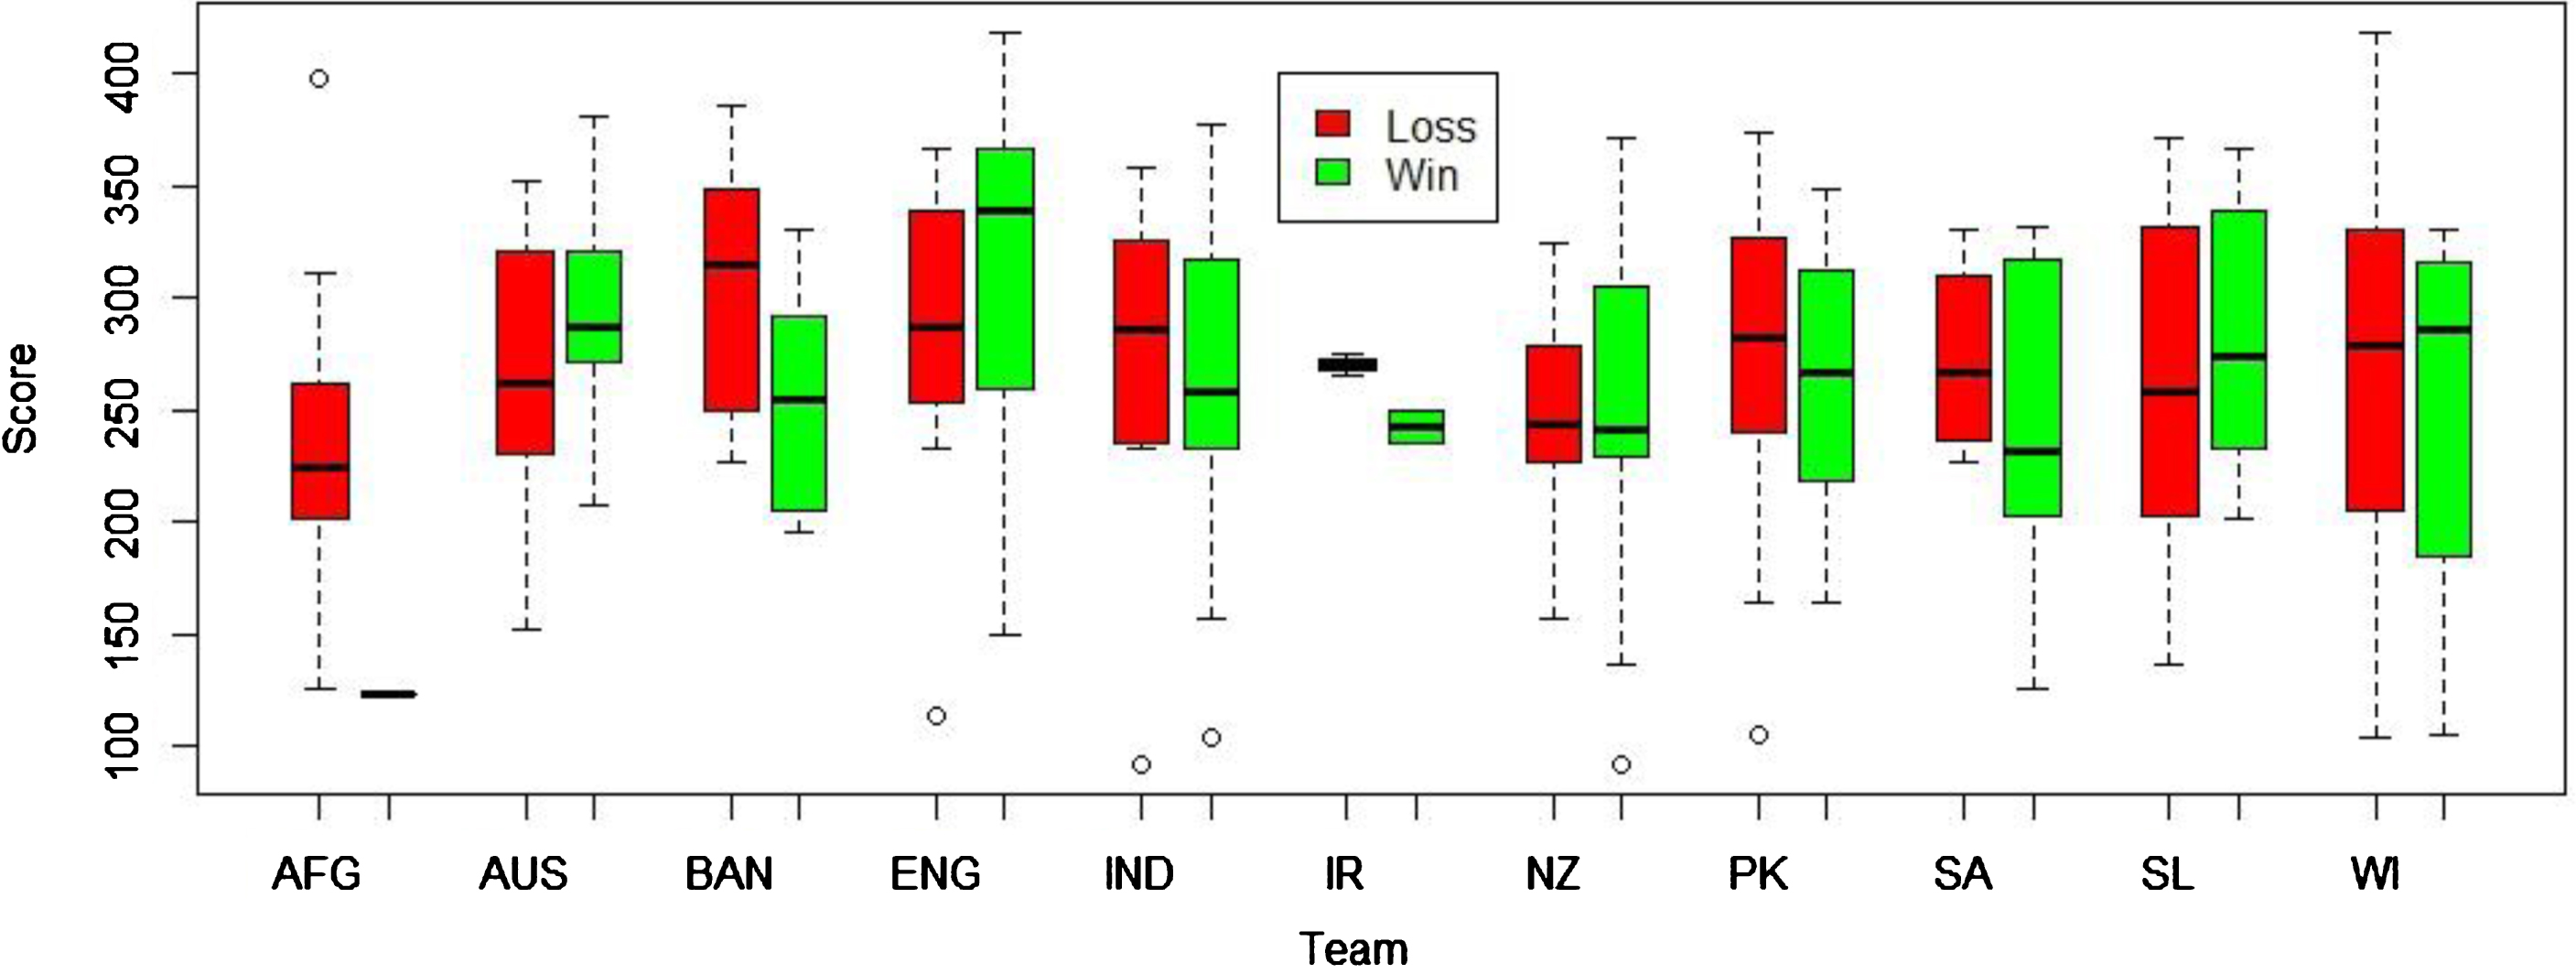
Fig. 4
Classification process.
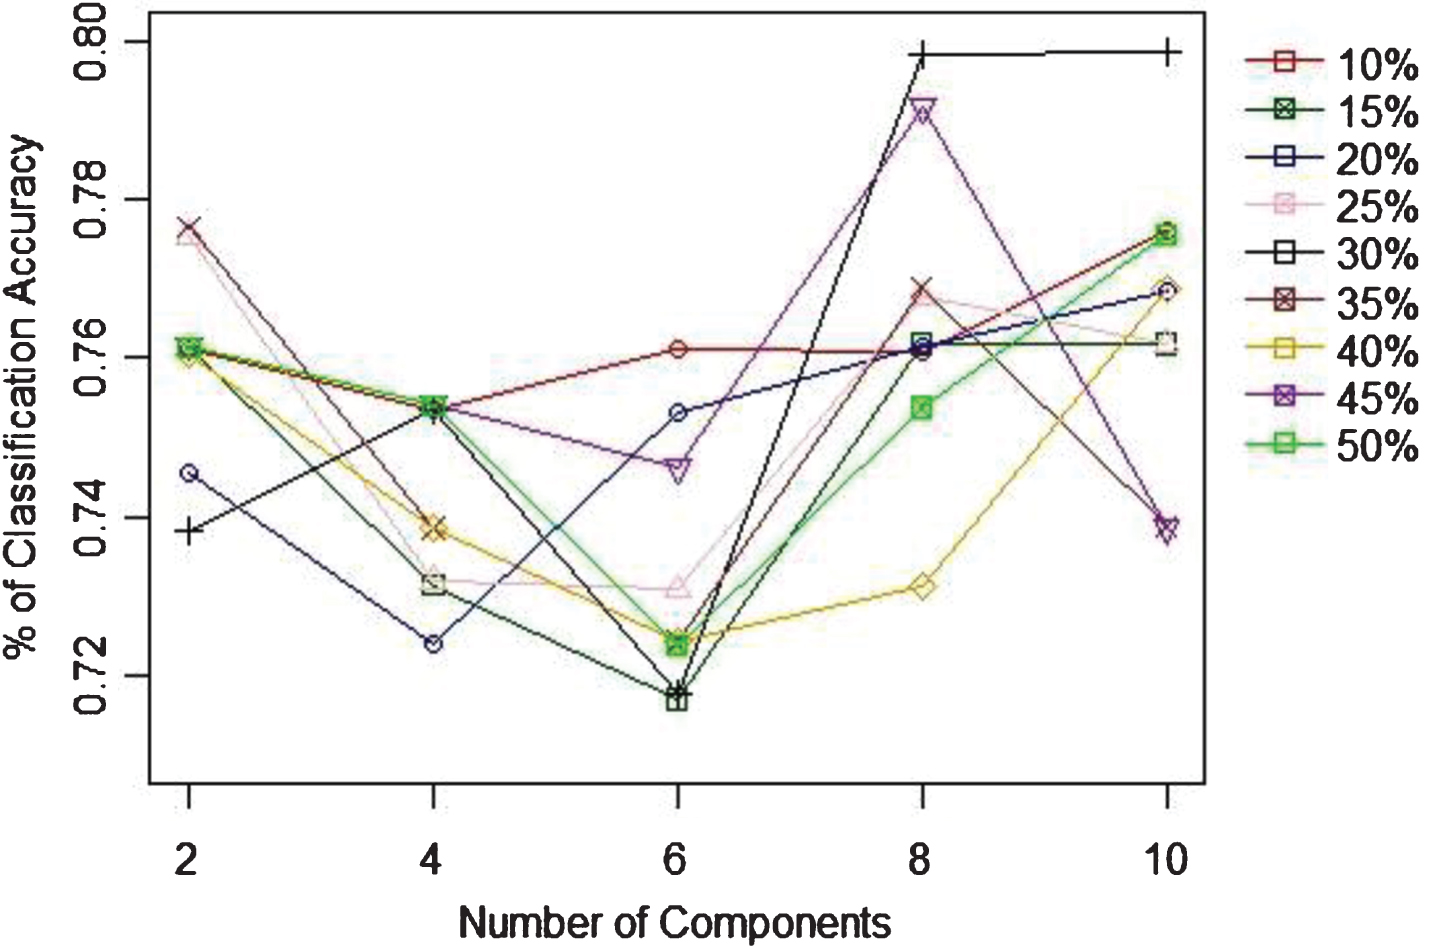
When identifying the appropriate ratio of training to test sample sizes, as Table 2 indicates the 85% to 15% is the best ratio to achieve the highest (80.71%) classification accuracy. Figure 6 shows the percentage of classification accuracy and the number of features to use with univariate feature selection method. According to this figure, the highest ratio of accuracies is achieved when there is 6 features. When the recursive feature selection technique is considered, according to the 7 the best performance accuracy is achieved with 6 features as well. Unlike with the univariate case, none of the sample ratios do not show a clear highest rate of accuracy, though the 6 or 7 features give higher accuracies. With PCA, the highest prediction accuracy is achieved with 8 components, which is achieved with training to test samples ratio of 60%:30%. Next, based on the recommendation given by each feature selection techniques, NB was applied. In addition, the accuracy of NB was tested without applying a feature selection technique as well. Figure 9 compares the best prediction accuracy for all the discussed approaches (No feature selection, Univariate, Recursive, and PCA) and the proportion of samples that gives highest accuracy for corresponding technique. Based on this figure, univariate method performs better (85.71%) than its counterparts irrespective of the ratios of sample sizes.
Table 2
Proportion of training vs testing sample sizes
| % of Training to Testing Sample Sizes | % of Classification Accuracy |
| 90%: 10% | 78.57 |
| 85%: 15% | 80.71 |
| 80%: 20% | 62.96 |
| 75%: 25% | 64.71 |
| 70%: 30% | 73.17 |
| 65%: 35% | 74.47 |
| 60%: 40% | 80.33 |
| 55%: 45% | 68.85 |
| 50%: 50% | 71.64 |
Fig. 5
Confusion matrix.
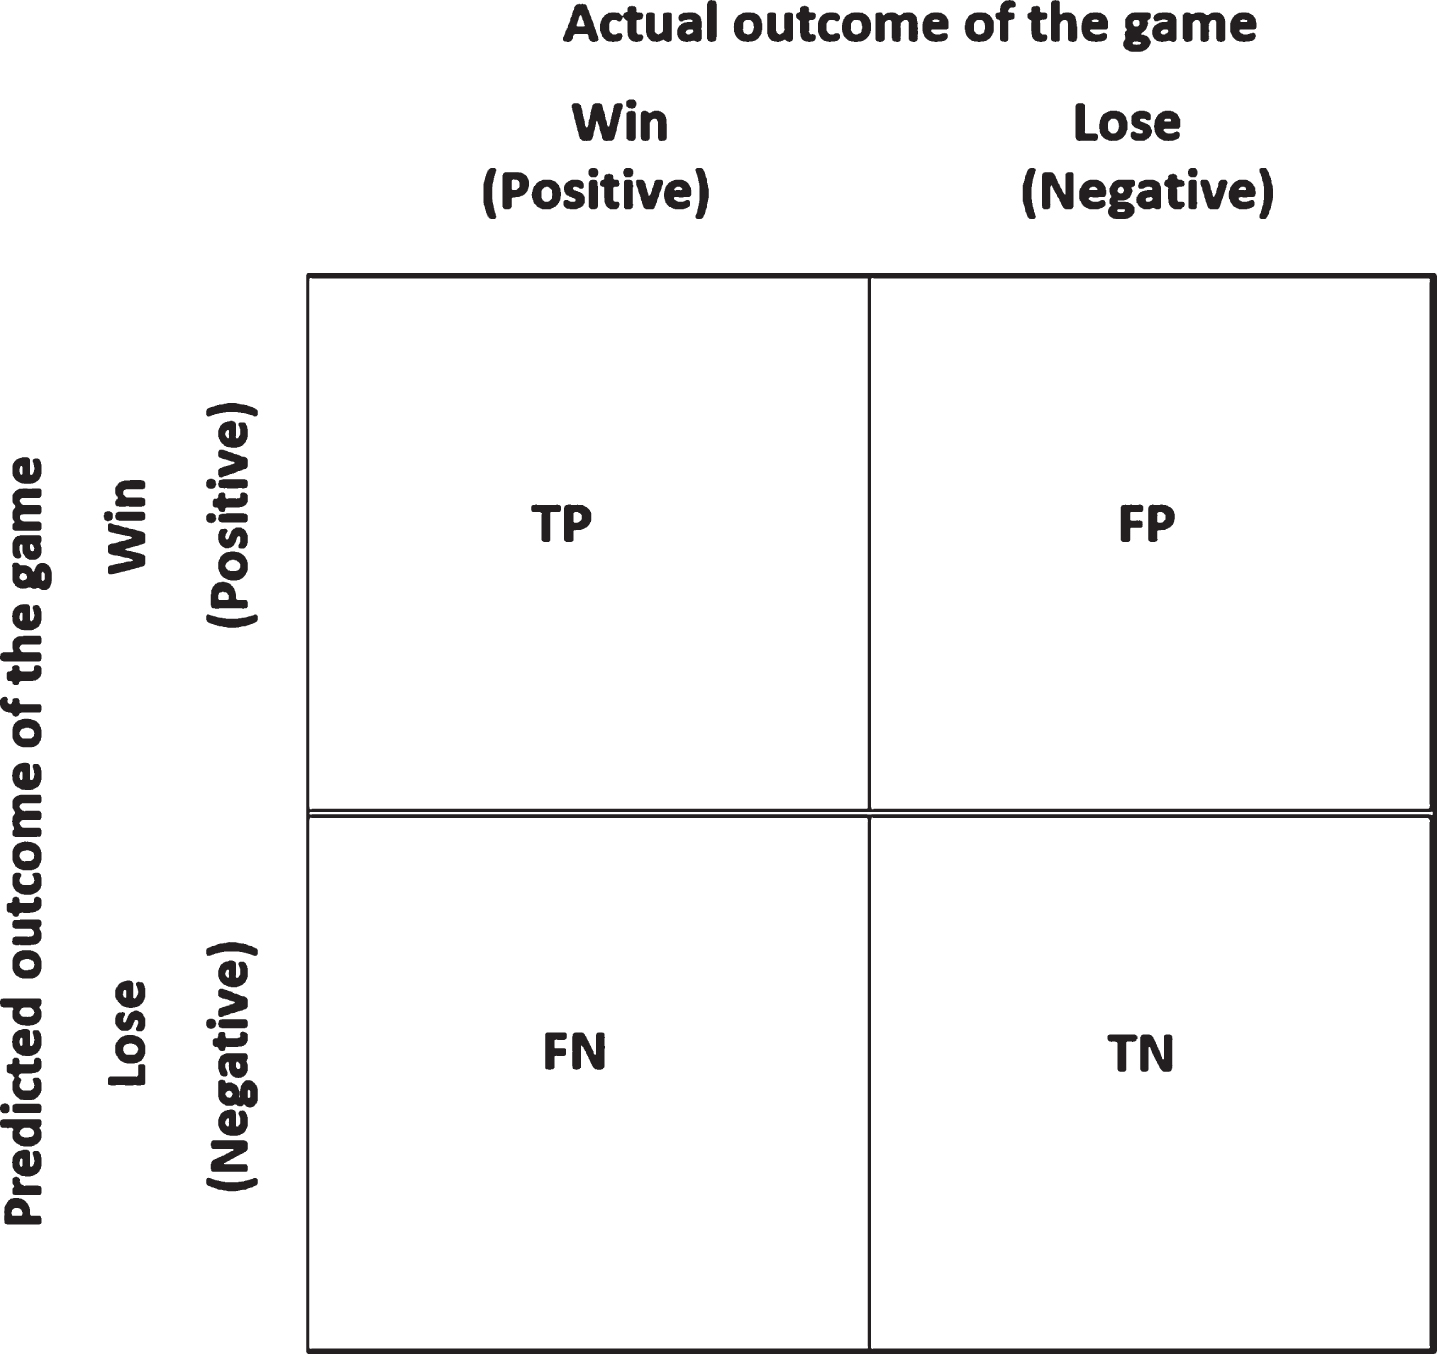
Fig. 6
Univariate feature selection and % of classification accuracy.
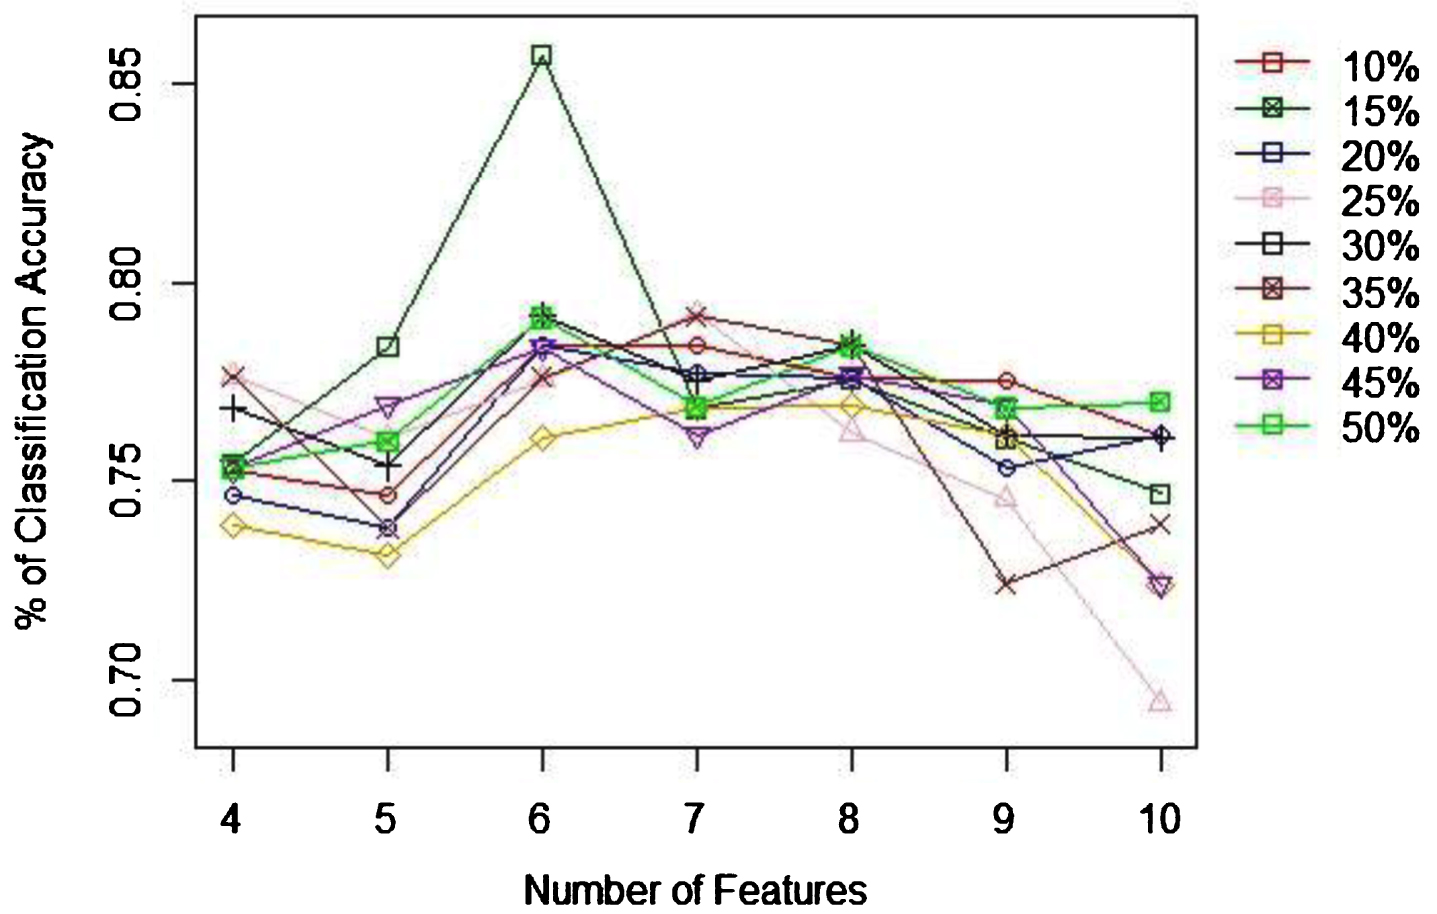
Fig. 7
Recursive elimination feature selection and % of classification accuracy.
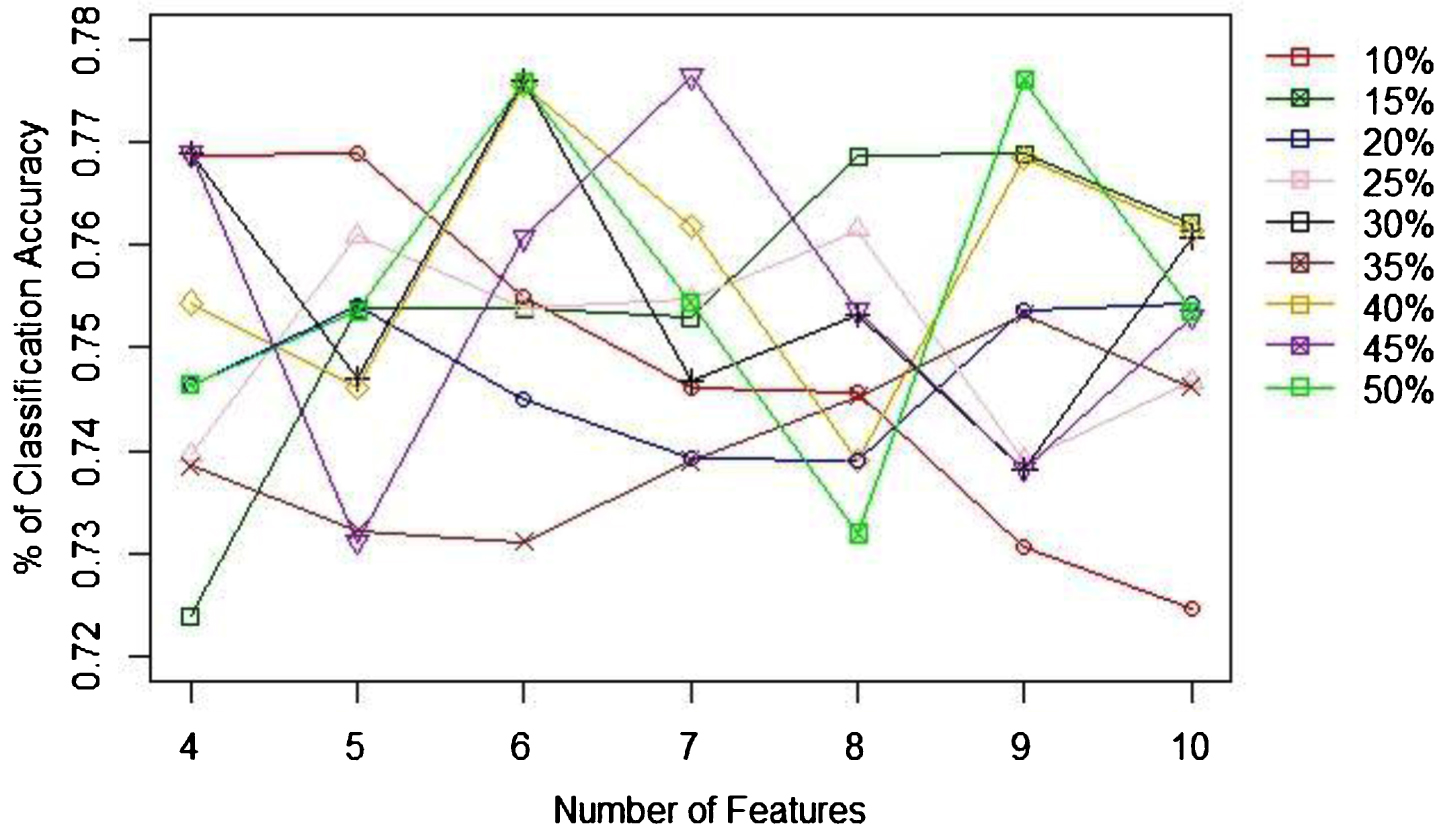
Fig. 8
PCA Feature selection and % of classification accuracy.
Conclusion and discussion
In this paper we applied NB algorithm for predicting the winner of an ODI cricket game, based on the performance of the first inning of the game. With the aim of achieving higher prediction accuracy, we investigated the best combination of training and testing sample sizes to train and test the Naive Bayes model. In that direction, we also employed some feature selection techniques (univariate, recursive, and PCA techniques) to improve the accuracy of the prediction. Based on the obtained experimental outcomes, we find the highest accuracy of predicting the winning team is achieved when univariate feature selection technique is used with 85%: 15% of training to testing sample sizes. The best prediction accuracy is 85.71% (i.e, the lowest error rate is 14.29%), which is very high prediction accuracy for an ODI cricket game, considering the highly unpredictable nature of the game. In this study, though we were unable to use very large sample size, this outcomes consolidate the literature findings regarding the success of NB for relatively small sample sizes (Hand, 1992; Kuncheva, 2006). Despite the fact that NB displayed significant performance in winner prediction, it is always recommended to have a large data-set to use with machine learning algorithms. In this study, we considered only 15 variables (features) to represent the cover the aspects of the game of cricket. It would have been better to consider some additional attributes such as handedness of the batsmen and the bowler, player ranking, types of bowlers (spinner, medium fast, or fast), and whether the game was played as a day game or a day and night game, for future studies. Finally, it is always recommended to use an appropriate feature selection algorithm, not only for the reduction of the dimension of the data, but also to minimize the impact from the violation of independent assumption.
References
1 | Allision,P. D , (1999) , Multiple Regression: A primer. Thousand Oaks, CA: Pine Forge Press. |
2 | Asif,M and McHale,I. G , (2016) In-play forecasting of win probability in One-Day International cricket: A dynamic logistic regression model. |
3 | Bai,H and Pan,W , (2009) , An Application of a New Multivariate Resampling Method to Multiple Regression, Multiple Linear Regression Viewpoints 35: (1). |
4 | Bailey,M , (2005) , Predicting Sporting Outcomes. A Statistical Approach, PhD thesis. Swinburne University, Melbourne. |
5 | Bailey,M and Clearke,S. R , (2006) , Predicting the match outcome in one-day international cricket matches, while the game is in progress, J Sports Sci Med 5: , 480. |
6 | Bandulasiri,A , Brown,T and Wickramasinghe,I , (2016) , Factors affecting the result of matches in the one day format of cricket, Operations Research and Decisions, Wroclaw University of Technology, Institute of Organization and Management 4: , pp. 21–32. |
7 | Brooks,R. D , Faff,R> W and Sokulsky,D , (2002) , An ordered response model of test cricket performance, Applied Economics 34: (18), 2353–2365, DOI: 10.1080/00036840210148085 |
8 | Clarke,S. R , (1998) , Dynamic programming in one-day cricket-optimal scoring rates, Journal the Operational Research Society 39: , 331–337. |
9 | Dawson,P , Morley,M , Paton,D and Thomas,D , (2009) , To bat or not to bat. An examination of match outcomes in day-night limited overs cricket, J Oper Res Soc 60: , 1786. |
10 | De Silva,B. M and Swartz,T. B , (1997) , Winning the coin toss and the home team advantage in one-day international cricket, Austr New Zeal J Statist 32: , 16–22. |
11 | Duckworth,F and Lewis,T , (1998) , A fair method for resetting the target in interrupted one-day cricket matches, J Oper Res Soc 49: , 22–28. |
12 | George,H. J and Langley,P , (1995) , Estimating continuous distributions in Bayesian classifiers, Proceedings of the Eleventh conference on Uncertainty in artificial intelligence, pp. 338–345, August 18-20, 1995, Montréal, Qué, Canada. |
13 | Hand,D. J and Yu,K , (2001) , Idiot’s Bayes— not so stupid after all?, Internat Statist Rev 69: , 385–398. |
14 | Hand,D. J , (1992) , Statistical methods in diagnosis, Scankticd Merhods in Medid Reseamh 1: , 49–67. |
15 | Harshit,G. J and Rajkumar,S , (2018) , A Review Paper on Cricket Predictions Using Various Machine Learning Algorithms and Comparisons Among Them, SYNERGY-2018, Conference, International Journal for Research in Applied Science and Engineering Technology (IJRASET) Page No:, ISSN : 2321-9653, www.ijraset.com |
16 | Hayhoe,M. M , Mennie,N , Gorgos,K , Semrau,J and Sullivan,B , (2004) , The role of prediction in catching balls, Journal of Vision 4: (8), 156, 156a, http://journalofvision.org/4/8/156/, doi:10.1167/4.8.156. |
17 | Jhawar,M. G and Pudi,V , (2016) , Predicting the Outcome of ODI Cricket Matches: A Team Composition Based Approach European Conference on Machine Learning and Principles and Practice of Knowledge Discovery in Databases, Riva del Garda, India 2016. |
18 | ICC., 2018. ICCMen’ One Day International Playing Conditions, https://icc-staticfiles.s3.amazonaws.com/ICC/document/2018/09/27/c9264750-2778-44df949f-d1a8dfbdc402/04-Mens-[ODI-Playing-Conditions-2018.pdf] |
19 | Kampakis,S and Thomas,B , (2015) , Using machine learning to predict the outcome of english county twenty over cricket matches. Arxiv: Machine Learning, pp. 1–17. |
20 | Kimber,A. C and Hansford,A. R , (1993) , A statistical analysis of batting in cricket, J Royal Stat Soc 156: , 443. |
21 | King,G and Zeng,L , (2001) , Logistic regression in rare events data, Political Analysis 9: (2), 137–163. |
22 | Koulis,T , Muthukumarana,S and Briercliffe,C. D , (2014) , A Bayesian stochastic model for batting performance evaluation in one-day cricket, J Quant Anal Sports 10: , 1. |
23 | Kumar,S and Roy,S , (2018) , Score Prediction and Player Classification Model in the Game of Cricket, Using Machine Learning International Journal of Scientific & Engineering Research 9: (8), AUGUST-2018 ISSN 22295518. |
24 | Kuncheva,L. I , (2006) , On the optimality of Naive Bayes with dependent binary features, Pattern Recogn Lett 27: , 830–837. |
25 | Lemmer,H , (2008) , An analysis of players’ performances in the first cricket Twenty20 World Cup Series, South Afr, J Res Sport, Phys Edu Recr 30: (2), 71. |
26 | Lemmer,H. H , (2006) , A measure of the current bowling performance in cricket, South African Journal for Research in Sport, Physical Education and Recreation 28: (2), 91–103. |
27 | Lewis,A. J , (2005) , Towards fairer measures of player performance in one-day cricket, J Oper Res Soc 56: , 804. |
28 | Morley,B and Thomas,D , (2005) , An investigation of home advantage and other factors affecting outcomes in English one-day cricket matches, J Sports Sci 23: (3), 261. |
29 | Nimmagadda,A , Kalyan,N. K , Venkatesh,M , Teja,N. N. S and Raju,C. J , (2018) , Cricket score and winning prediction using data mining, International Journal of Advance Research and Development, Ver (3). |
30 | Passi,K and Pandey,N , (2018) , Increased Prediction Accuracy in the Game of Cricket Using Machine Learning, International Journal of Data Mining & Knowledge Management Process 8: (2), 19–36. |
31 | Paul,A and Stephen,R , (2002) , Factors affecting outcomes in test match cricket, Proc. 6th Australian Conf. on Mathematics and Computers in Sport, Bond University, Queensland. |
32 | Stretch,R. A , Bartlett,R. M and Davids,K , (2000) , A review of batting in men’s cricket, Journal of Sports Sciences 18: , 931–949. |
33 | Saikia,H and Bhattacharjee,D , (2010) , A Bayesian Classification Model for Predicting the Performance of All-Rounders in the Indian Premier League (June 7, 2010). Available at SSRN: https://ssrn.com/abstract=1622060 or http://dx.doi.org/10.2139/ssrn.1622060 |
34 | Sankaranarayanan,V. V , Sattar,J and Lakshmanan,L. V , (2014) , Autoplay: A data mining approach to odi cricket simulation and prediction, Proceedings of the 2014 SIAM International Conference on Data Mining, SIAM, pp. 1064-1072. |
35 | Scarf,P , Shi,X and Akhtar,S , (2011) , On the distribution of runs scored and batting strategy in test cricket, J Royal Stat Soc A 174: , 471. |
36 | Tan,A and Zhang,D , (2001) , Distribution of batting scores and opening wicket partnerships in cricket, Math Spectrum, 2001/2002, 34: (1), 13. |
37 | Wickramasinghe,I. P , (2015) , Predicting the Performance of Batsmen in Test Cricket, Journal of Human Sport and Exercise 9: (4), doi: 10.14198/jhse.2014.94.01 |
38 | Singh,T , Singla,V and Bhatia,P , (2015) , Score and winning prediction in cricket through data mining. In 2015 International Conference on Soft Computing Techniques and Implementations (ICSCTI), pp. 60-66. |
39 | Wickramasinghe,I. P. , (2014) , Predicting the performance of batsmen in test cricket, Journal of Human Sport & Exercise 9: (4), 744–751. |
40 | Yasir,M , Chen,L , Shah,S. A , Akbar,K and Sarwar,M. U , (2017) , Ongoing Match Prediction in T20 International, IJCSNS International Journal of Computer Science and Network Security 17: (11). |


