
HighNESS conceptual design report: Volume I
Abstract
The European Spallation Source, currently under construction in Lund, Sweden, is a multidisciplinary international laboratory. Once completed to full specifications, it will operate the world’s most powerful pulsed neutron source. Supported by a 3 million Euro Research and Innovation Action within the EU Horizon 2020 program, a design study (HighNESS) has been completed to develop a second neutron source located below the spallation target. Compared to the first source, designed for high cold and thermal brightness, the new source has been optimized to deliver higher intensity, and a shift to longer wavelengths in the spectral regions of cold (CN, 2–20 Å), very cold (VCN, 10–120 Å), and ultracold (UCN, >500 Å) neutrons. The second source comprises a large liquid deuterium moderator designed to produce CN and support secondary VCN and UCN sources. Various options have been explored in the proposed designs, aiming for world-leading performance in neutronics. These designs will enable the development of several new instrument concepts and facilitate the implementation of a high-sensitivity neutron-antineutron oscillation experiment (NNBAR). This document serves as the Conceptual Design Report for the HighNESS project, representing its final deliverable.
1.Introduction and scientific motivations
1.1.List of acronyms
See the list of acronyms in the Table 1.
Table 1
List of acronyms
| Acronym/term | Meaning |
| BNV | Baryon number violation |
| BZ | Brillouin zone |
| BNC | Budapest Neutron Center |
| CAD | Computer Aided Design |
| COMSOL | A finite element analysis and simulation software package |
| CDR | Conceptual design report |
| CEF | Current ENDF Format |
| CMTF | Cold Moderator Test Facility |
| CN | Cold neutron |
| CNS | Cold neutron source |
| COSY | COoler SYnchrotron |
| DF-DND | Deagglomerated F-DND |
| DFPT | Density Functional Perturbation Theory |
| DFT | Density Functional Theory |
| DFTB | Density Functional Tight Binding |
| DOS | Density of States |
| DND | Detonation Nanodiamond |
| EDM | Electric dipole moment |
| EGO | Efficient global optimization |
| ESS | European Spallation Source |
Table 1
(Continued.)
| Acronym/term | Meaning |
| F-DND | Fluorinated DND |
| FOM | Figure of merit |
| FRM-II | Forschungsreaktor München II |
| FZJ | Forschungszentrum Jülich |
| GEANT4 | A Monte Carlo simulation program for GEometry ANd Tracking |
| HDPE | High-density polyethylene |
| HiCANS | High Current Accelerator-driven Neutron Source |
| HighNESS | High intensity Neutron Source at the European Spallation Source |
| IKP | Institute of Nuclear Physics |
| ILL | Institut Laue Langevin |
| JCNS | Jülich Centre for Neutron Science |
| JULIC | JUelich Light Ion Cyclotron |
| LANSCE | Los Alamos Neutron Science Center |
| LANL | Los Alamos National Laboratory |
| LBP | Large beamport |
| LD2 | Liquid deuterium |
| LH2 | Liquid hydrogen |
| MCB | Moderator cooling block |
| MCNP | Monte Carlo N Particle |
| MCPL | Monte Carlo Particle Lists |
| ML | Machine Learning |
| MSD | Mean squared displacement |
| MEF | Mixed Elastic Format |
| MP | Monoplanar reflector |
| NMO | Nested Mirror Optics |
| NNBAR | An experiment to search for neutrons converting to anti-neutrons at the ESS |
| ND | Nanodiamond |
| NW | North–west |
| PBE | Perdew–Burke–Ernzerhof |
| PHITS | Particle and Heavy Ion Transport code System |
| PMT | Photo-Multiplier Tube |
| PSI | Paul Scherrer Institut |
| R&D | Research and development |
| SiPM | Silicon photomultiplier |
| SANS | Small Angle Neutron Scattering |
| SD2 | Solid deuterium |
| SNR | Signal-to-Noise ratio |
| SW | South–west |
| TEM | Transmission electron microscopy |
| TMR | Target–Moderator–Reflector |
| SNS | Spallation Neutron Source |
| TSL | Thermal Scattering Library |
| UCN | Ultracold neutron |
| VCN | Very cold neutron |
| VDOS | Vibrational density of states |
| WP | Work package |
1.2.The European Spallation Source
The European Spallation Source (ESS) is a cutting-edge scientific research facility currently under construction in Lund, Sweden. When completed to full specifications, it will be the world’s most powerful accelerator-based source of neutrons for scientific research [71]. This unparalleled capability will open new scientific avenues across various disciplines, including materials science, life sciences, energy research, environmental technology, and fundamental physics.
Currently, the ESS is actively constructing 15 instruments, which represent a subset of the envisioned 22-instrument suite essential for fulfilling the facility’s scientific mission, as outlined in the ESS statutes. Notably, the ESS mandate encompasses a fundamental physics program and the absence of a dedicated beamline for fundamental physics has been identified as a critical gap [60].
The remarkable neutron flux produced by ESS is due to its housing the world’s most powerful linear accelerator and the high beam power directed on target. At full design capability, the proton beam operates at a current of 62.5 mA and is accelerated to 2 GeV, employing a 14 Hz pulse structure, with each pulse lasting 2.86 ms. Consequently, this configuration yields an average power of 5 MW and a peak power of 125 MW.
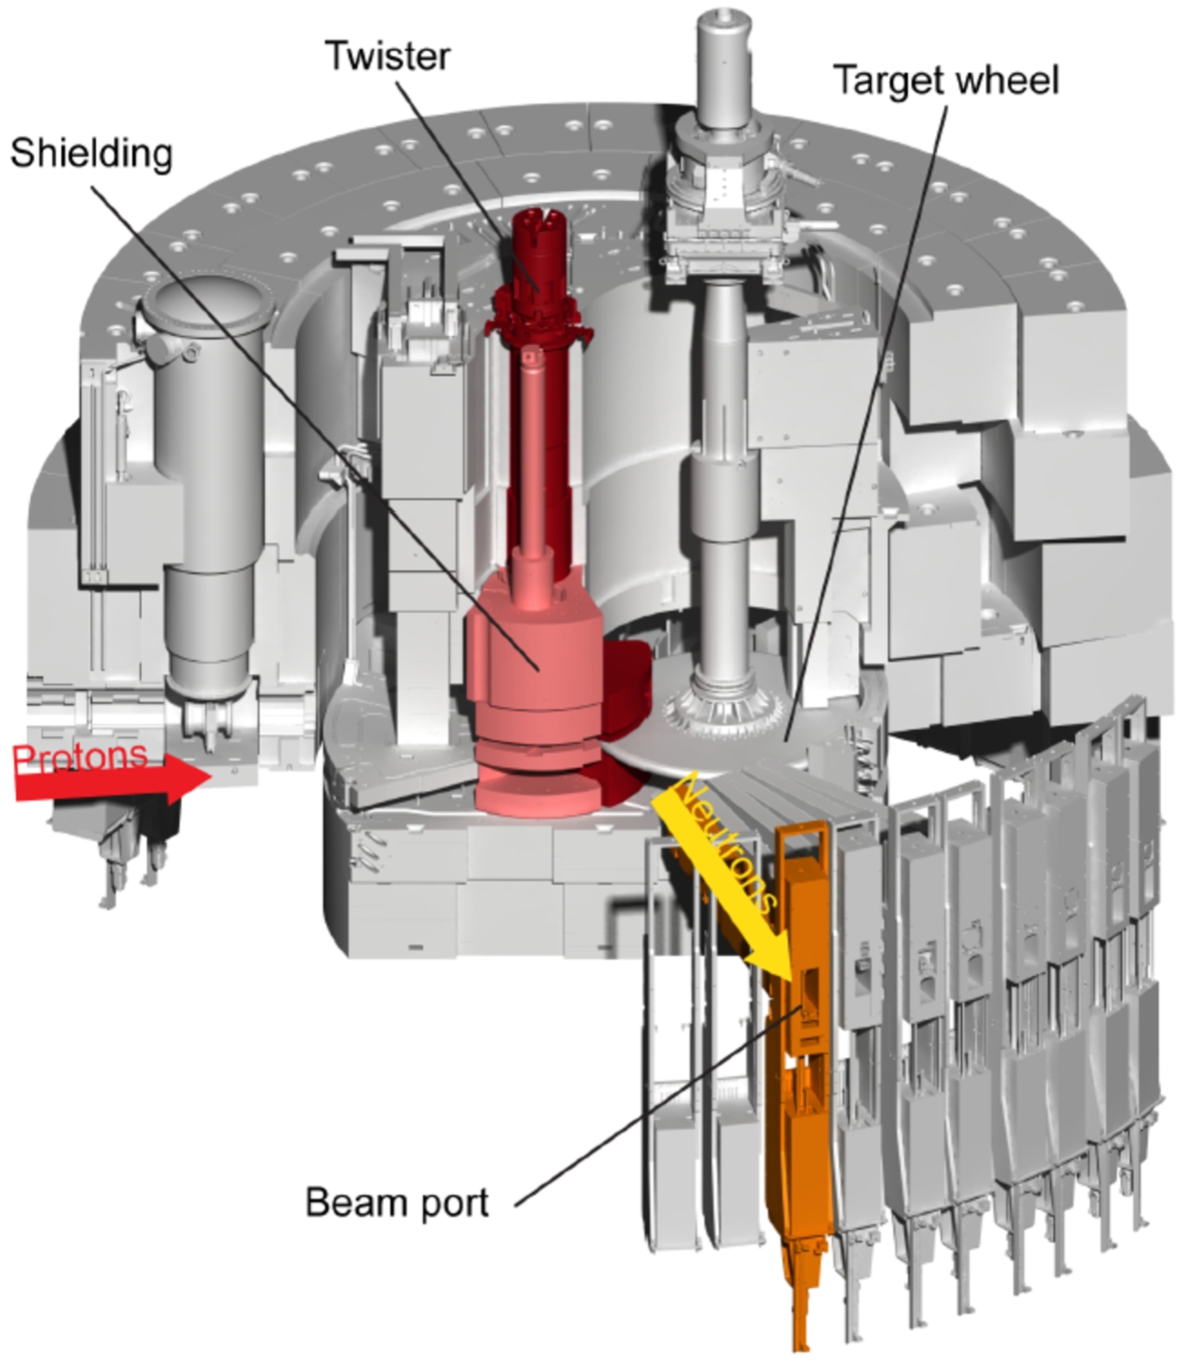
Once the proton beam reaches its final energy, it impacts a rotating tungsten target (see Fig. 1), inducing spallation and primarily generating evaporation neutrons with energies around 2 MeV. The high-energy spallation neutrons are decelerated within the neutron moderators situated inside the moderator-reflector plug, as described in Section 1.2.1 and shown in Fig. 2.
Fig. 1.
The ESS target monolith with key components indicated: moderator and reflector plug, spallation target, and one of the 42 neutron beam ports.
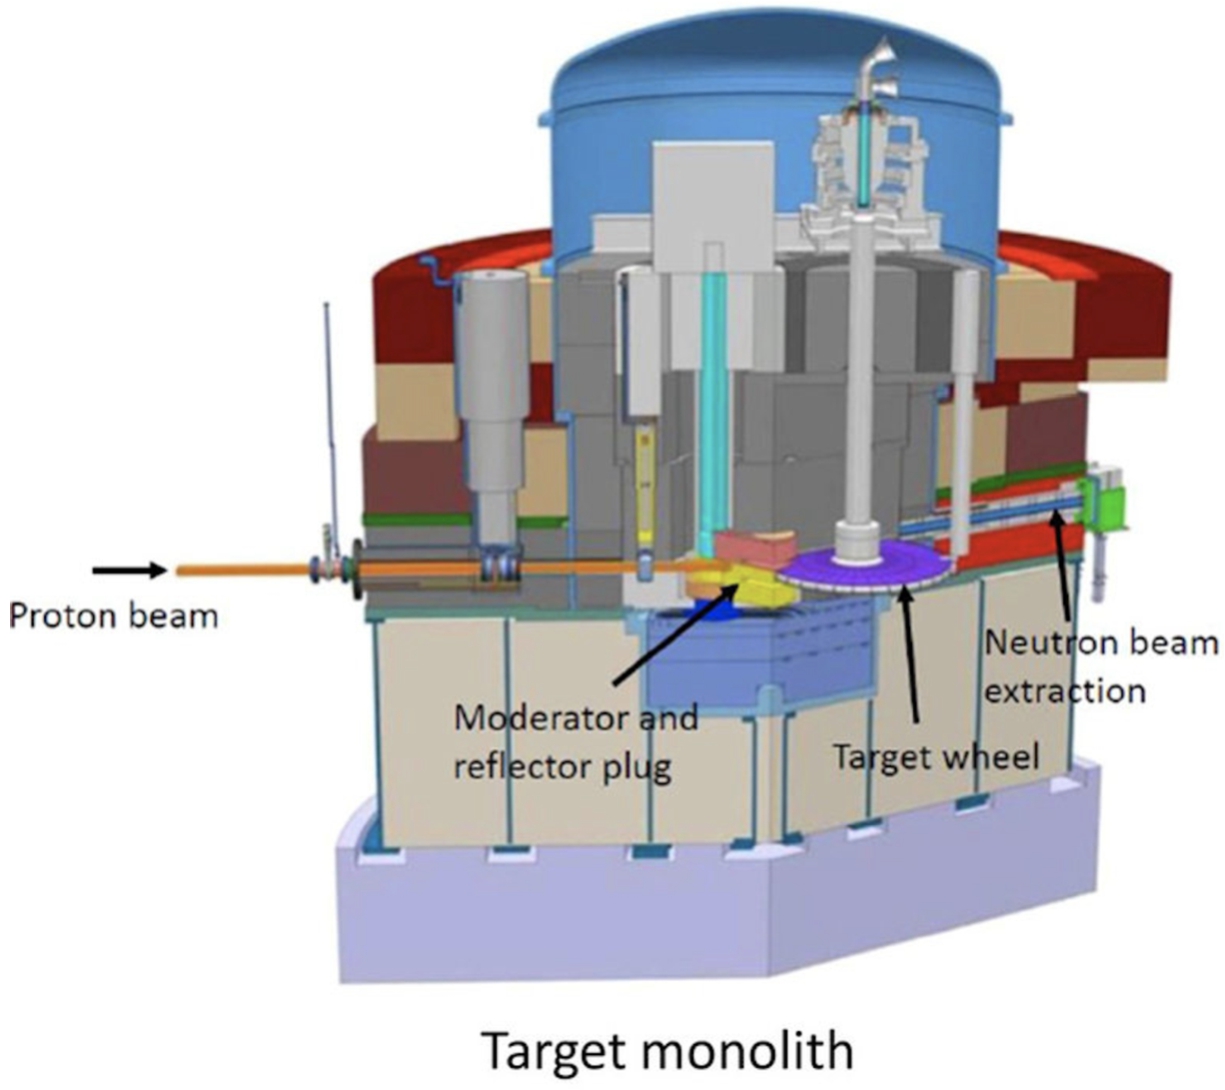
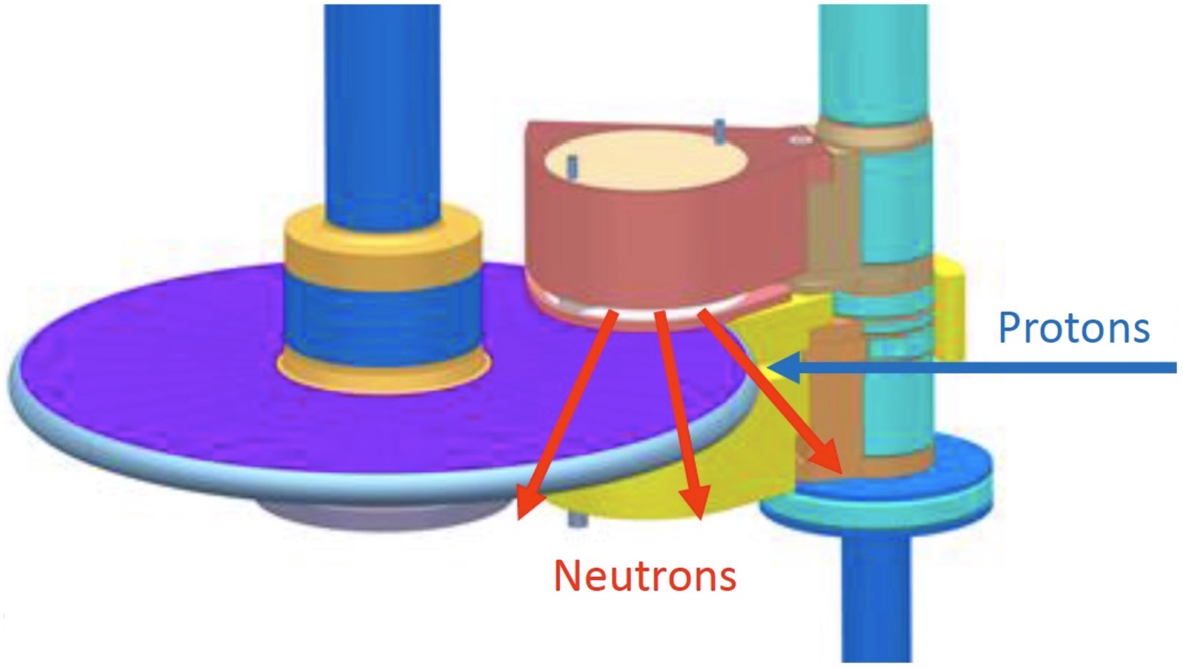
Fig. 2.
The ESS target-moderator system. The picture depicts the proton beam, the spallation target, the structure housing the moderator, and the neutron beam ports.
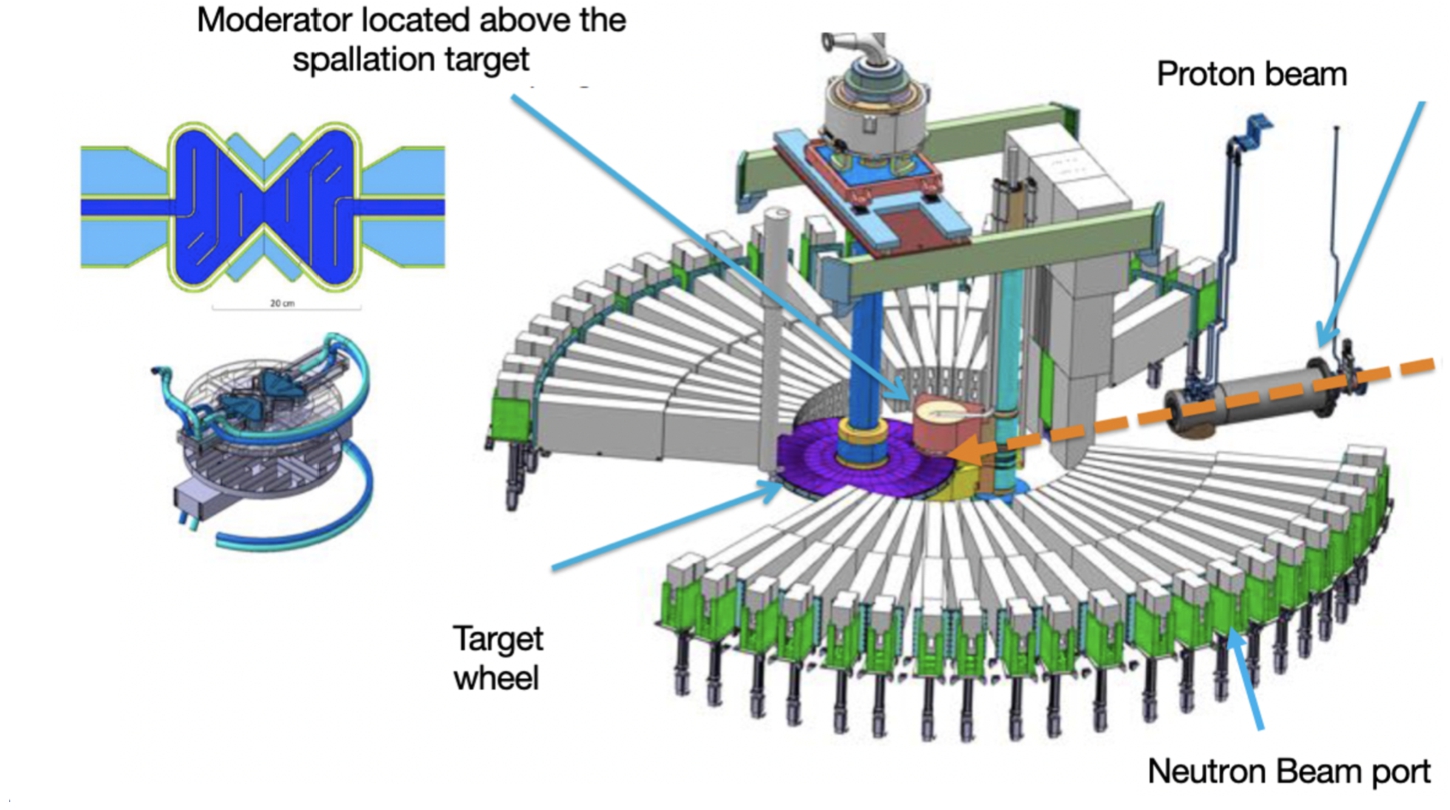
Fig. 3.
Cross-sectional view of the ESS target/moderator area and inner shielding. The figure displays the location of the ESS moderator above the spallation target, referred to as the “upper moderator”, and the moderator below the spallation target, referred to as the “lower moderator”. The NNBAR experiment (see Section 1.2.2) will utilize both moderators.
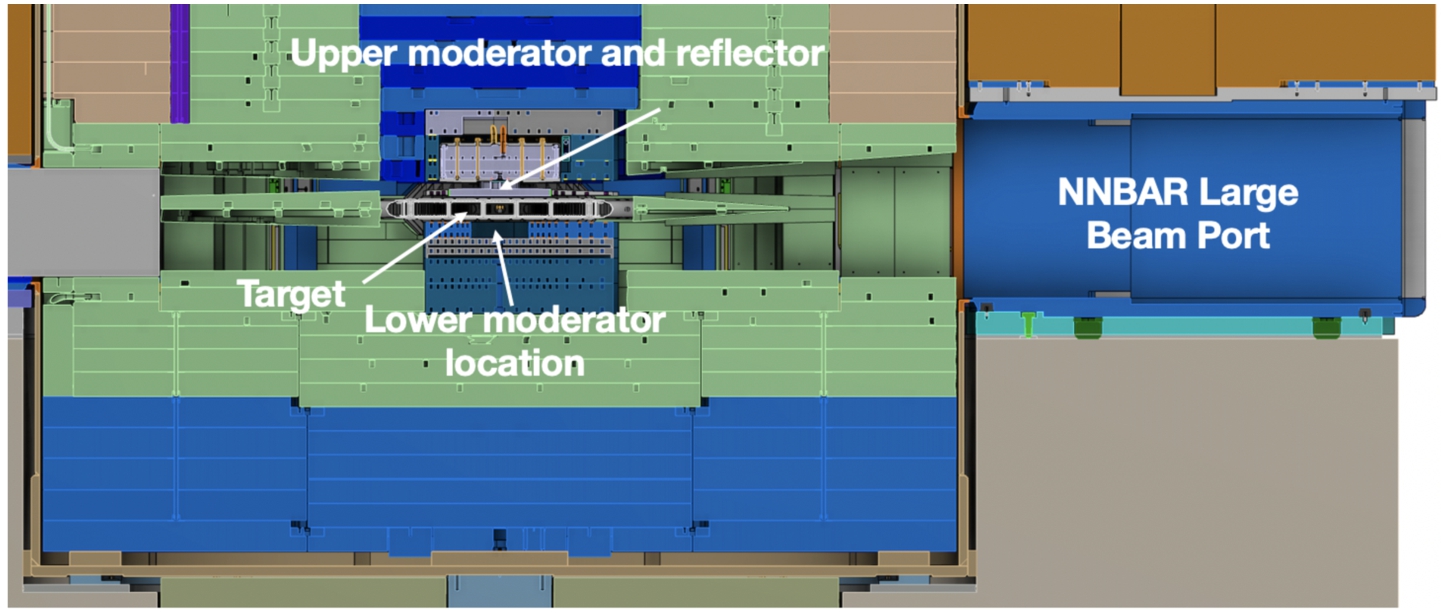
The target area is encircled by a cylindrical steel structure with an 11-meter diameter. This structure, consisting of 6000 tons of steel shielding, is known as the ‘monolith’. The monolith is designed to absorb most of the beam power and is capable of withstanding the heat generated during operations. Additionally, the monolith includes a cooling system that utilizes pressurized helium gas. This cooling system effectively reduces the peak temperature by 150°C between successive beam shots. This structure also houses the neutron beam ports, which are essential for extracting thermal and cold neutrons from the moderators. ESS has positioned its beam port system around the moderators, allowing for neutron extraction both above and below the target as shown in Fig. 3.
Beyond the ESS monolith, the beamlines reside in the bunker, as referenced in [224]. The bunker serves as a crucial shielding area, enveloping the ESS monolith and shielding the instrument area from the significant ionizing radiation generated during operation. The shielding structure of the bunker consists of 3.5-meter-thick walls (see Fig. 4) constructed from heavy magnetite concrete, complemented by a roof of variable thickness, also composed of heavy concrete.
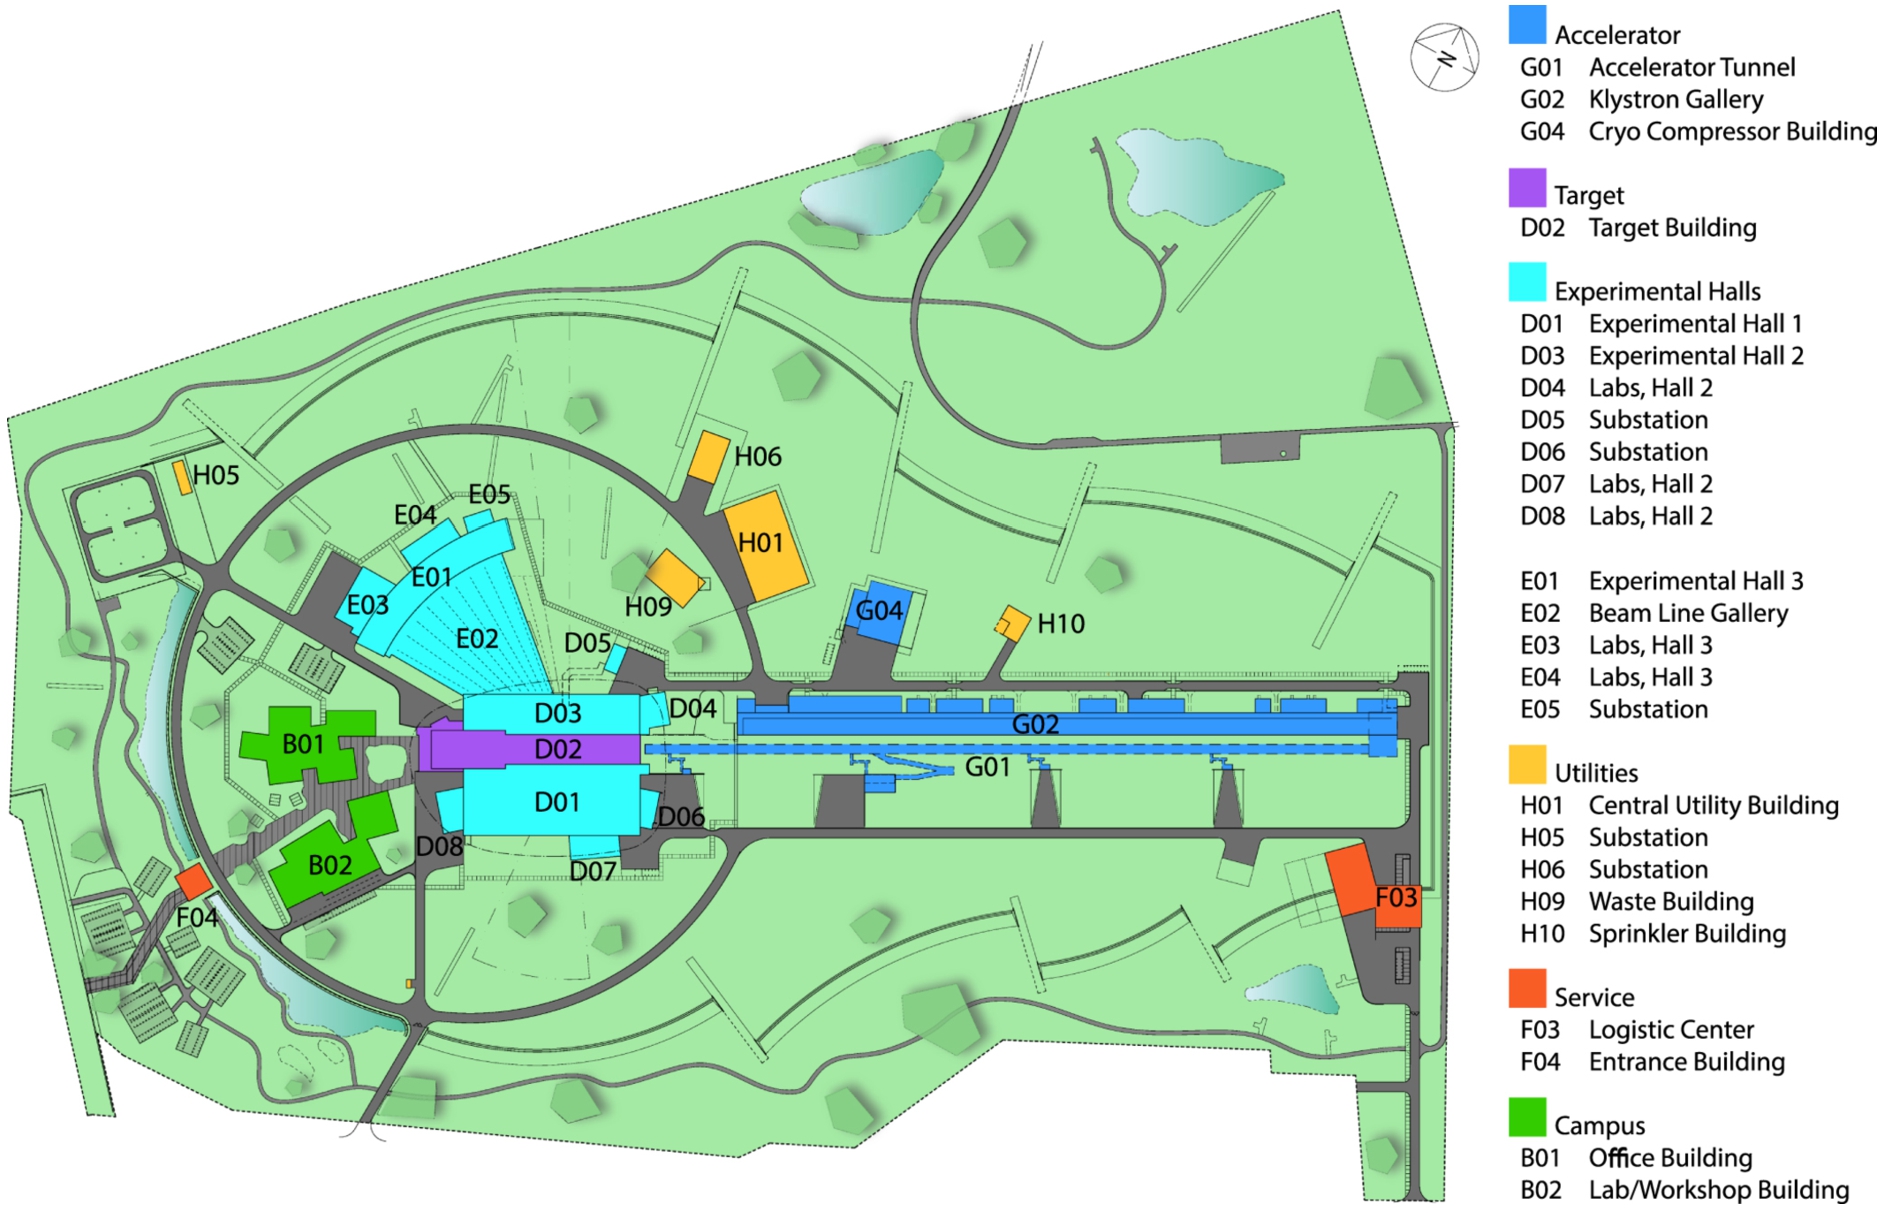
Figure 5 shows the completed bunker in one of the instrument hall. After the bunker, the neutron beamlines reach the instrument halls, as shown in Fig. 6. Figure 7 shows the complete layout of the facility. The instrument hall areas are located in the D01, D03, and E01 buildings.
Fig. 4.
CAD drawing of the ESS bunker, depending on the sector, the bunker has different lengths.
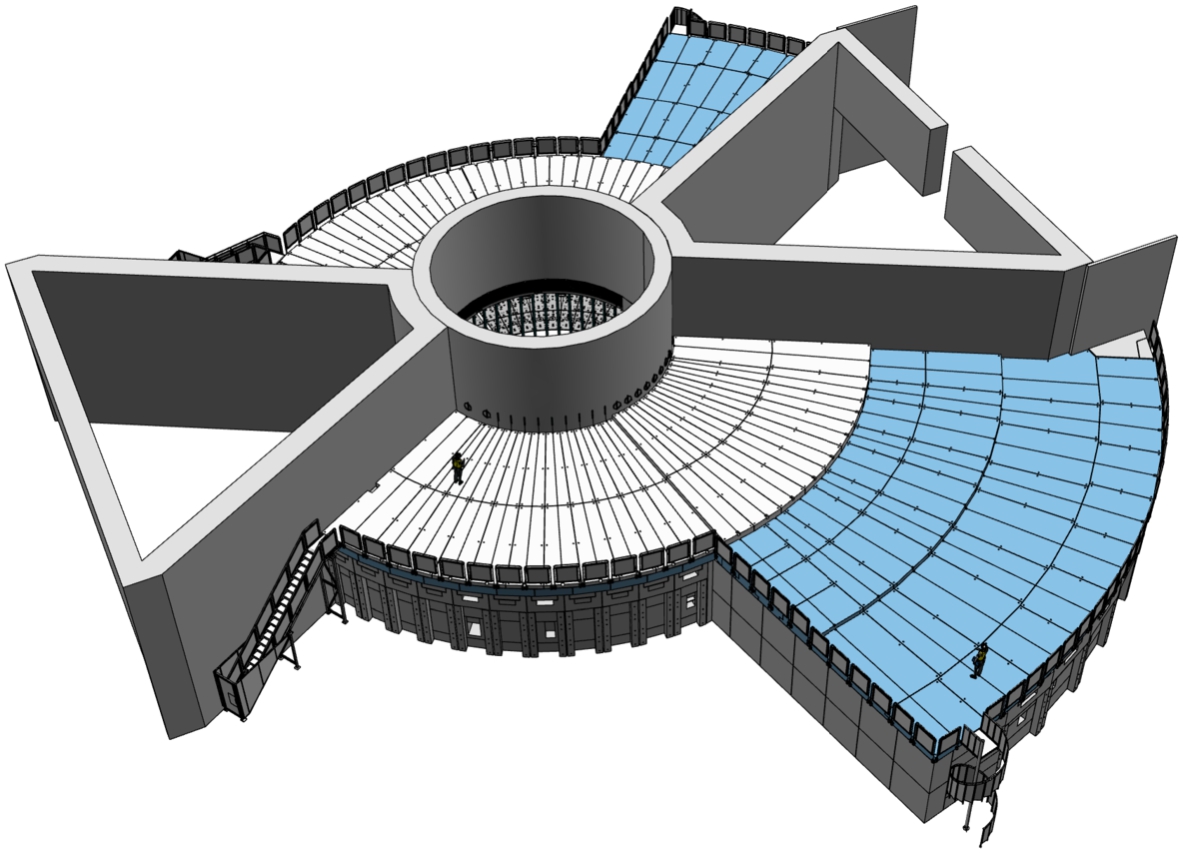
Fig. 5.
Overview of the complete bunker area in the ESS D03 instrument hall.
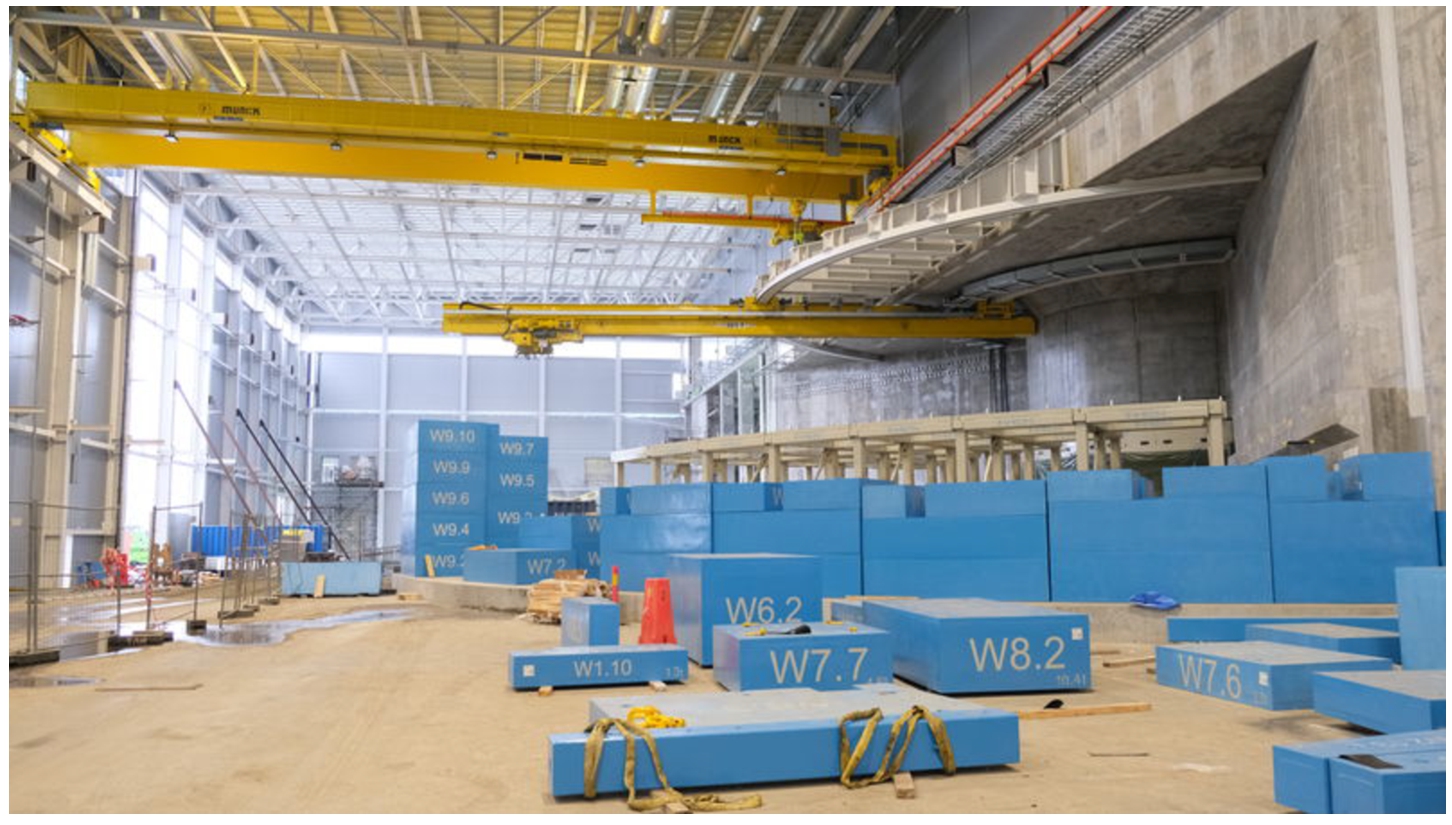
Fig. 6.
Overview of the 15 instruments currently under construction at the ESS and the instrument halls.
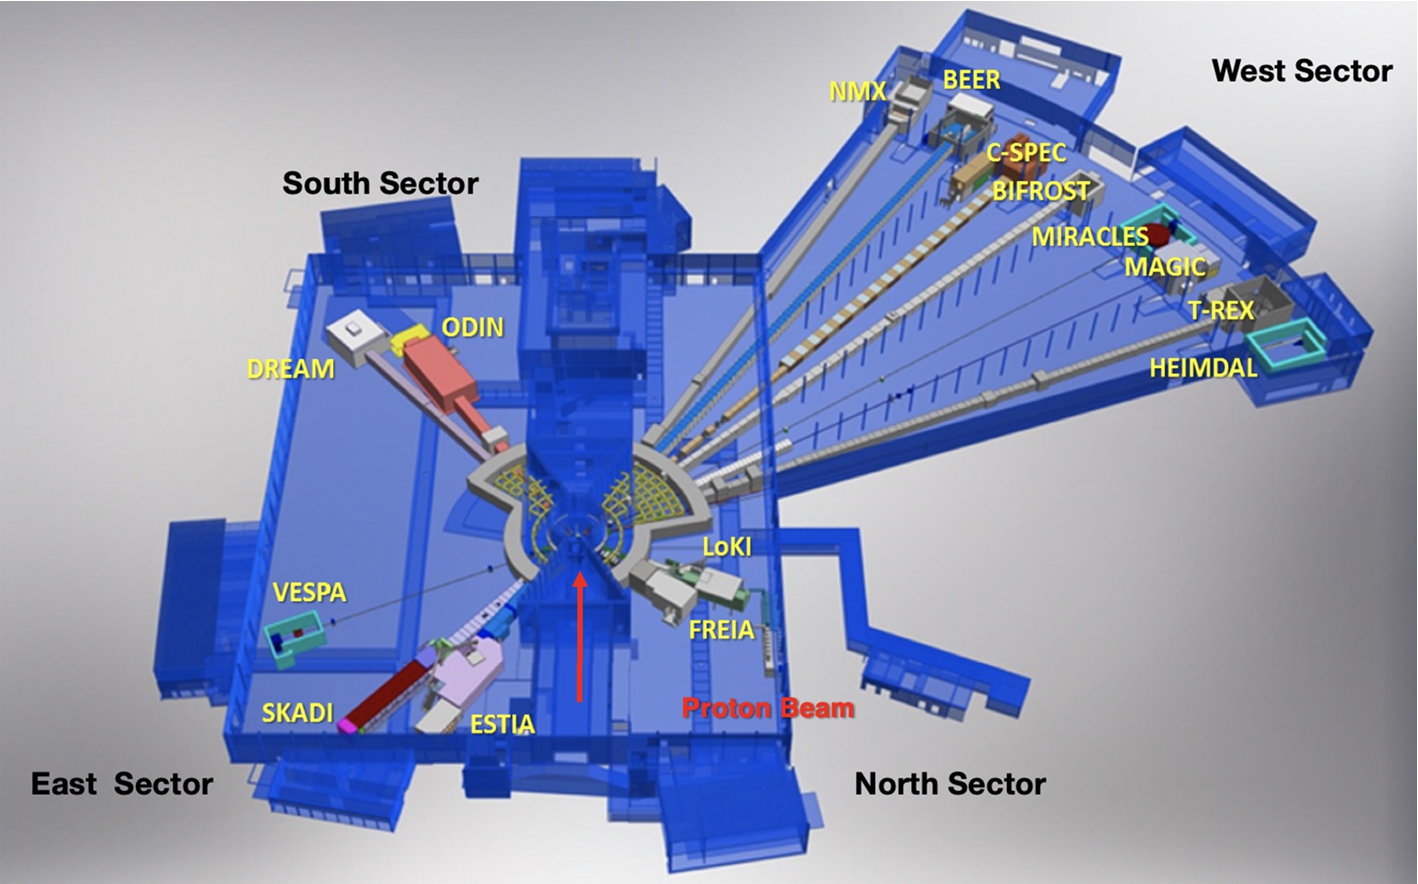
Fig. 7.
ESS layout and building description.
1.2.1.The ESS current moderator system
Initially, the spallation source will be equipped with a single compact, low-dimensional moderator specifically designed to produce high-brightness neutron beams for condensed matter experiments. This design is optimized for small samples and offers flexibility for parametric studies. In Fig. 2, the left side showcases the high-brightness moderator, while the right side illustrates the current configuration of the ESS target-moderator-reflector system.
The core neutron production at ESS happens in the upper and lower moderator, two moderator-reflector systems positioned both above and below the spallation target, as shown at the center of Fig. 8. A cylindrical steel structure (shown in dark red) located above the target houses the moderator and reflector, from which neutrons are extracted for the beamlines. A similar container (depicted in yellow) is positioned below the target.
Figure 2 shows the openings in the shielding, which are the beam extraction channels and are present above and below the spallation target. These channels allow for the extraction of neutrons from either or both moderators. The space shown in Fig. 3 below the spallation target is presently occupied by a steel plug and currently un-utilized. This space has the potential to accommodate an additional moderator-reflector system. The design of such a system constitutes one of the primary objectives of the HighNESS project.
Fig. 8.
Schematic view of the ESS target-moderator-reflector system. The proton beam impinges on a rotating target consisting of tungsten (purple target in the figure). A cylindrical steel structure (dark red) placed above the target contains the moderator and reflector from which neutrons are extracted to the beam lines (red arrows). A similar container (yellow) is placed below the target, and is the intended location for the placement of the high-intensity moderator in the HighNESS project. These two structures and the shaft (light blue) form the so-called twister (cf. Section 2.1).
1.2.2.The ESS upgrade area
In addition to utilizing the space beneath the spallation target for the placement of a second moderator system, the HighNESS project will take advantage of the availability of extra beam ports. Fig. 9 shows the available sectors of experimental zones, the distribution of the 15 instruments of the initial suite, and the additional beam ports and areas for additional future instruments that can be fed by a second moderator system. These areas, highlighted in green in Fig. 9, serve as the primary locations for designing instruments and experiments that will utilize the moderators developed in the HighNESS project.
ESS is also equipped with a special beam port located in the monolith for neutron extraction. This beam port, often referred to as the Large Beam Port (LBP), due to its size, is equivalent in size to three standard ESS beam ports and is illustrated in Figs 10 and 11. This infrastructure has been installed in anticipation of the neutron-antineutron oscillation experiment NNBAR [3,16], to allow the experiment to achieve its design goals. At the time of this writing, no other existing or planned neutron facility will have a beam port of similar dimensions, making ESS the best possible facility worldwide for the NNBAR experiment. The LBP also serves a broader purpose beyond the NNBAR experiment, since it can be used for various potential designs of Ultracold Neutron (UCN) sources, as detailed in Section 6.
Fig. 9.
The ESS facility. The location of the instruments of the initial suite is shown. In green the upgrade areas, where the HighNESS instruments and experiments could be placed, are highlighted.
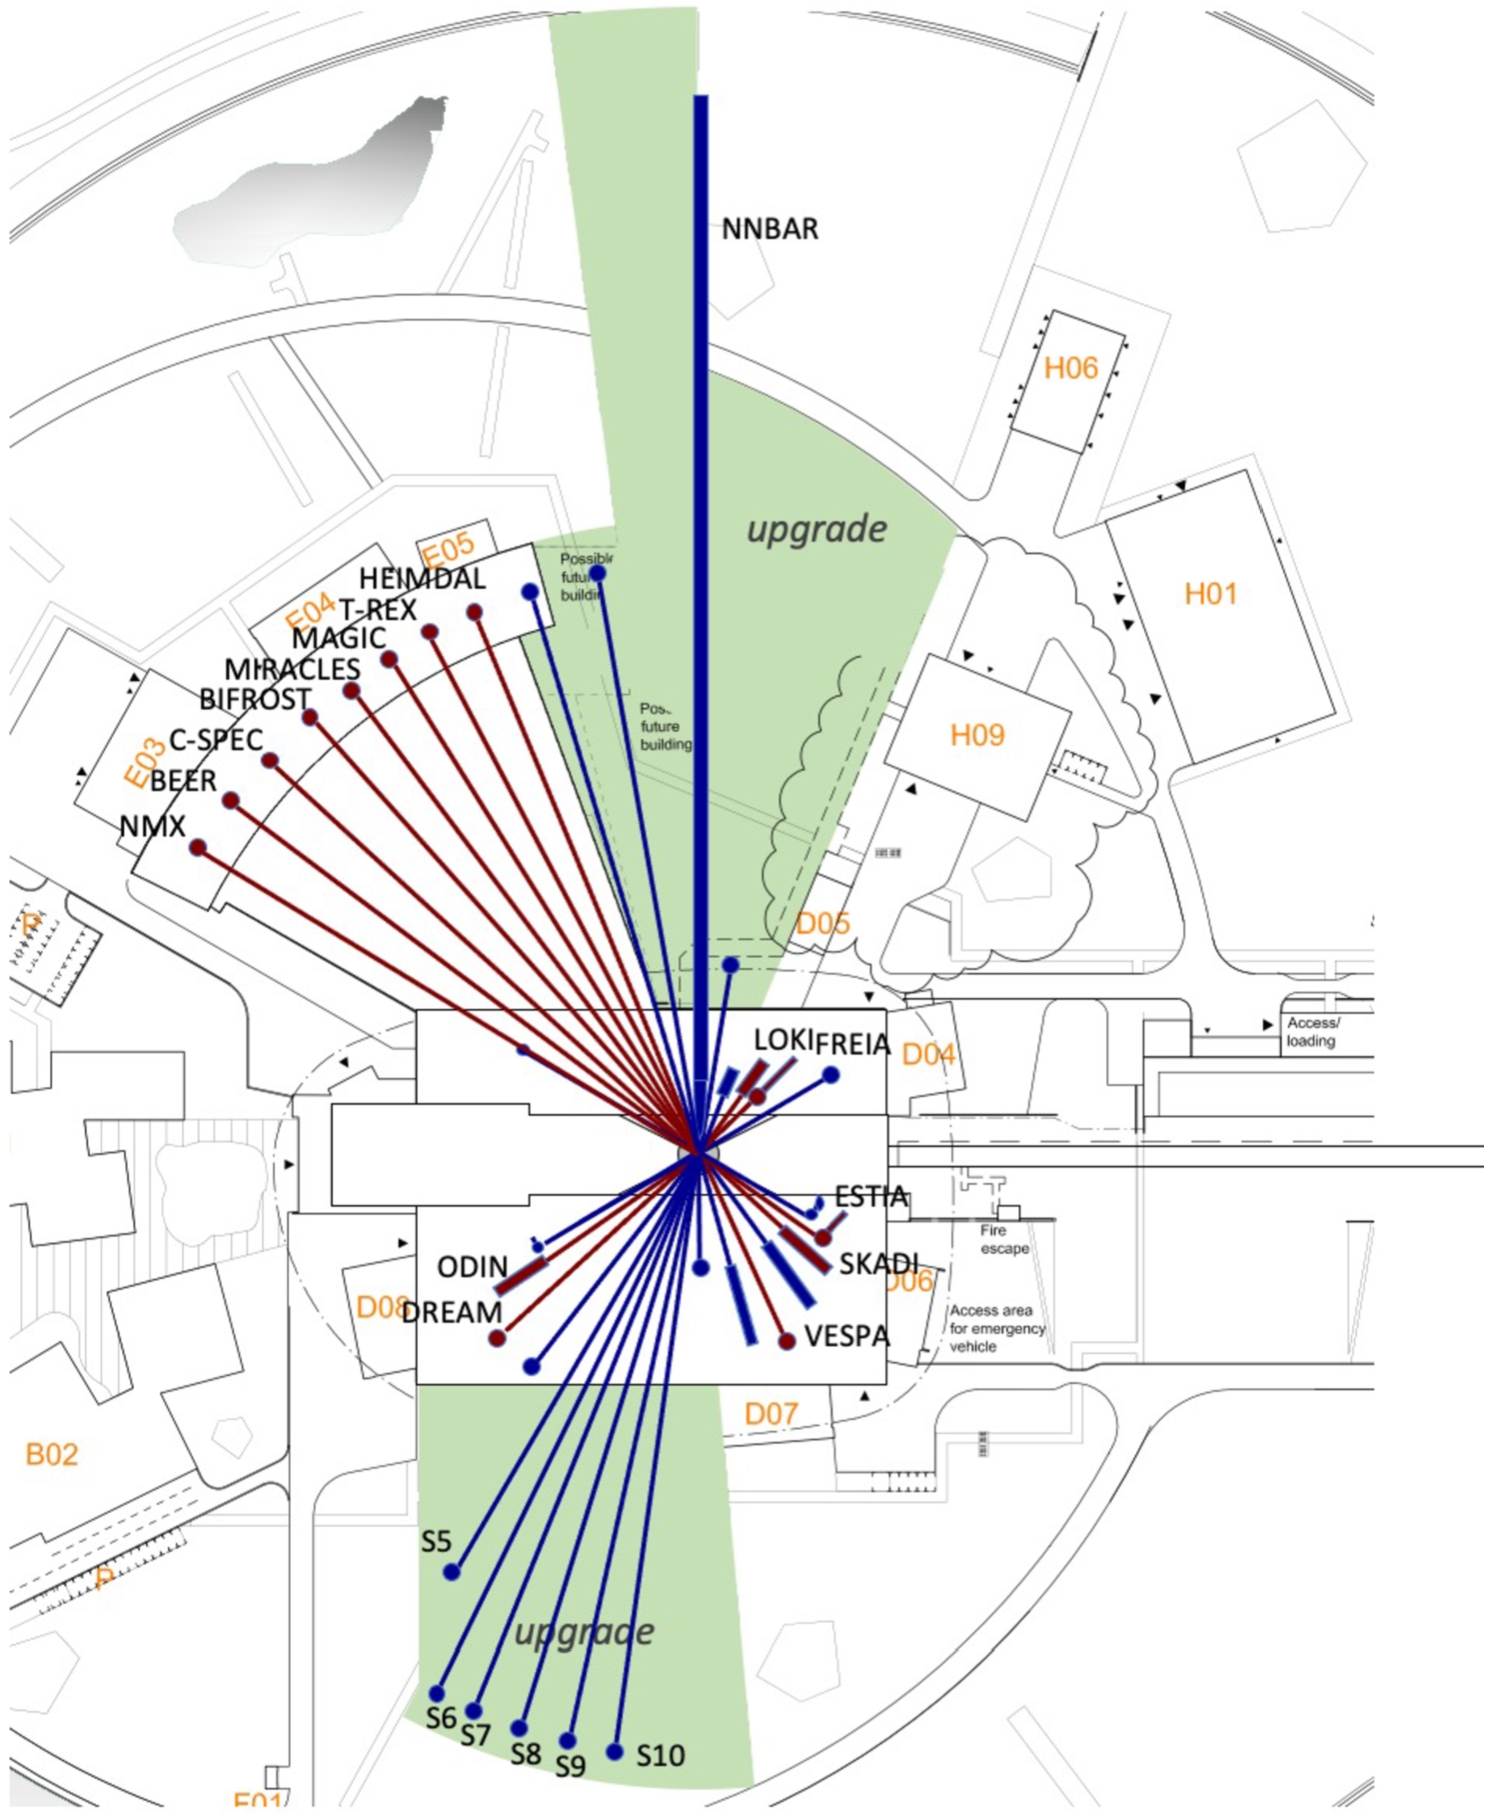
Fig. 10.
Photograph of the monolith beam ports around the ESS Large Beam Port. An overlaid drawing shows the visible surface of the upper and lower moderators, with a shielding block in between.
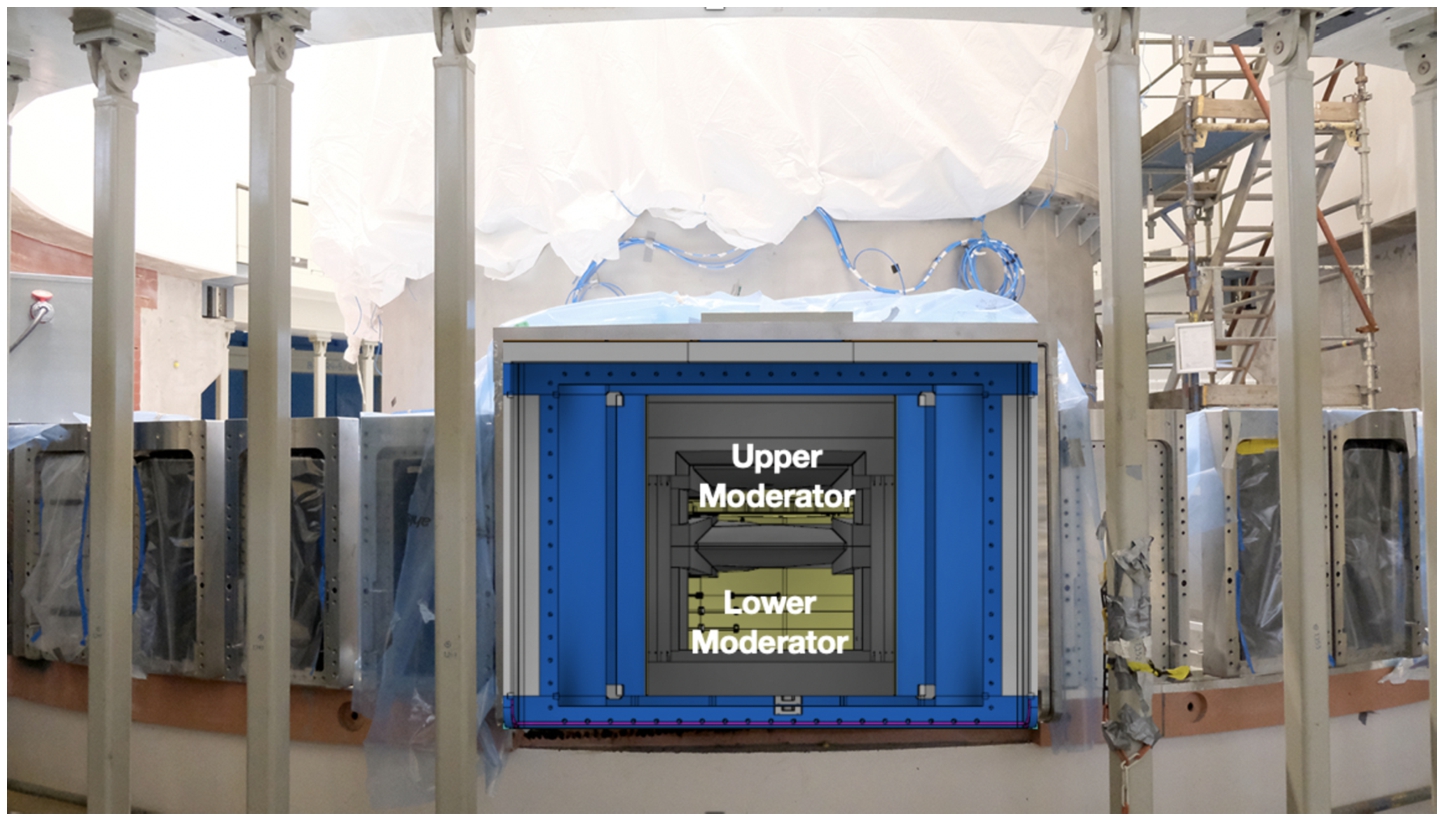
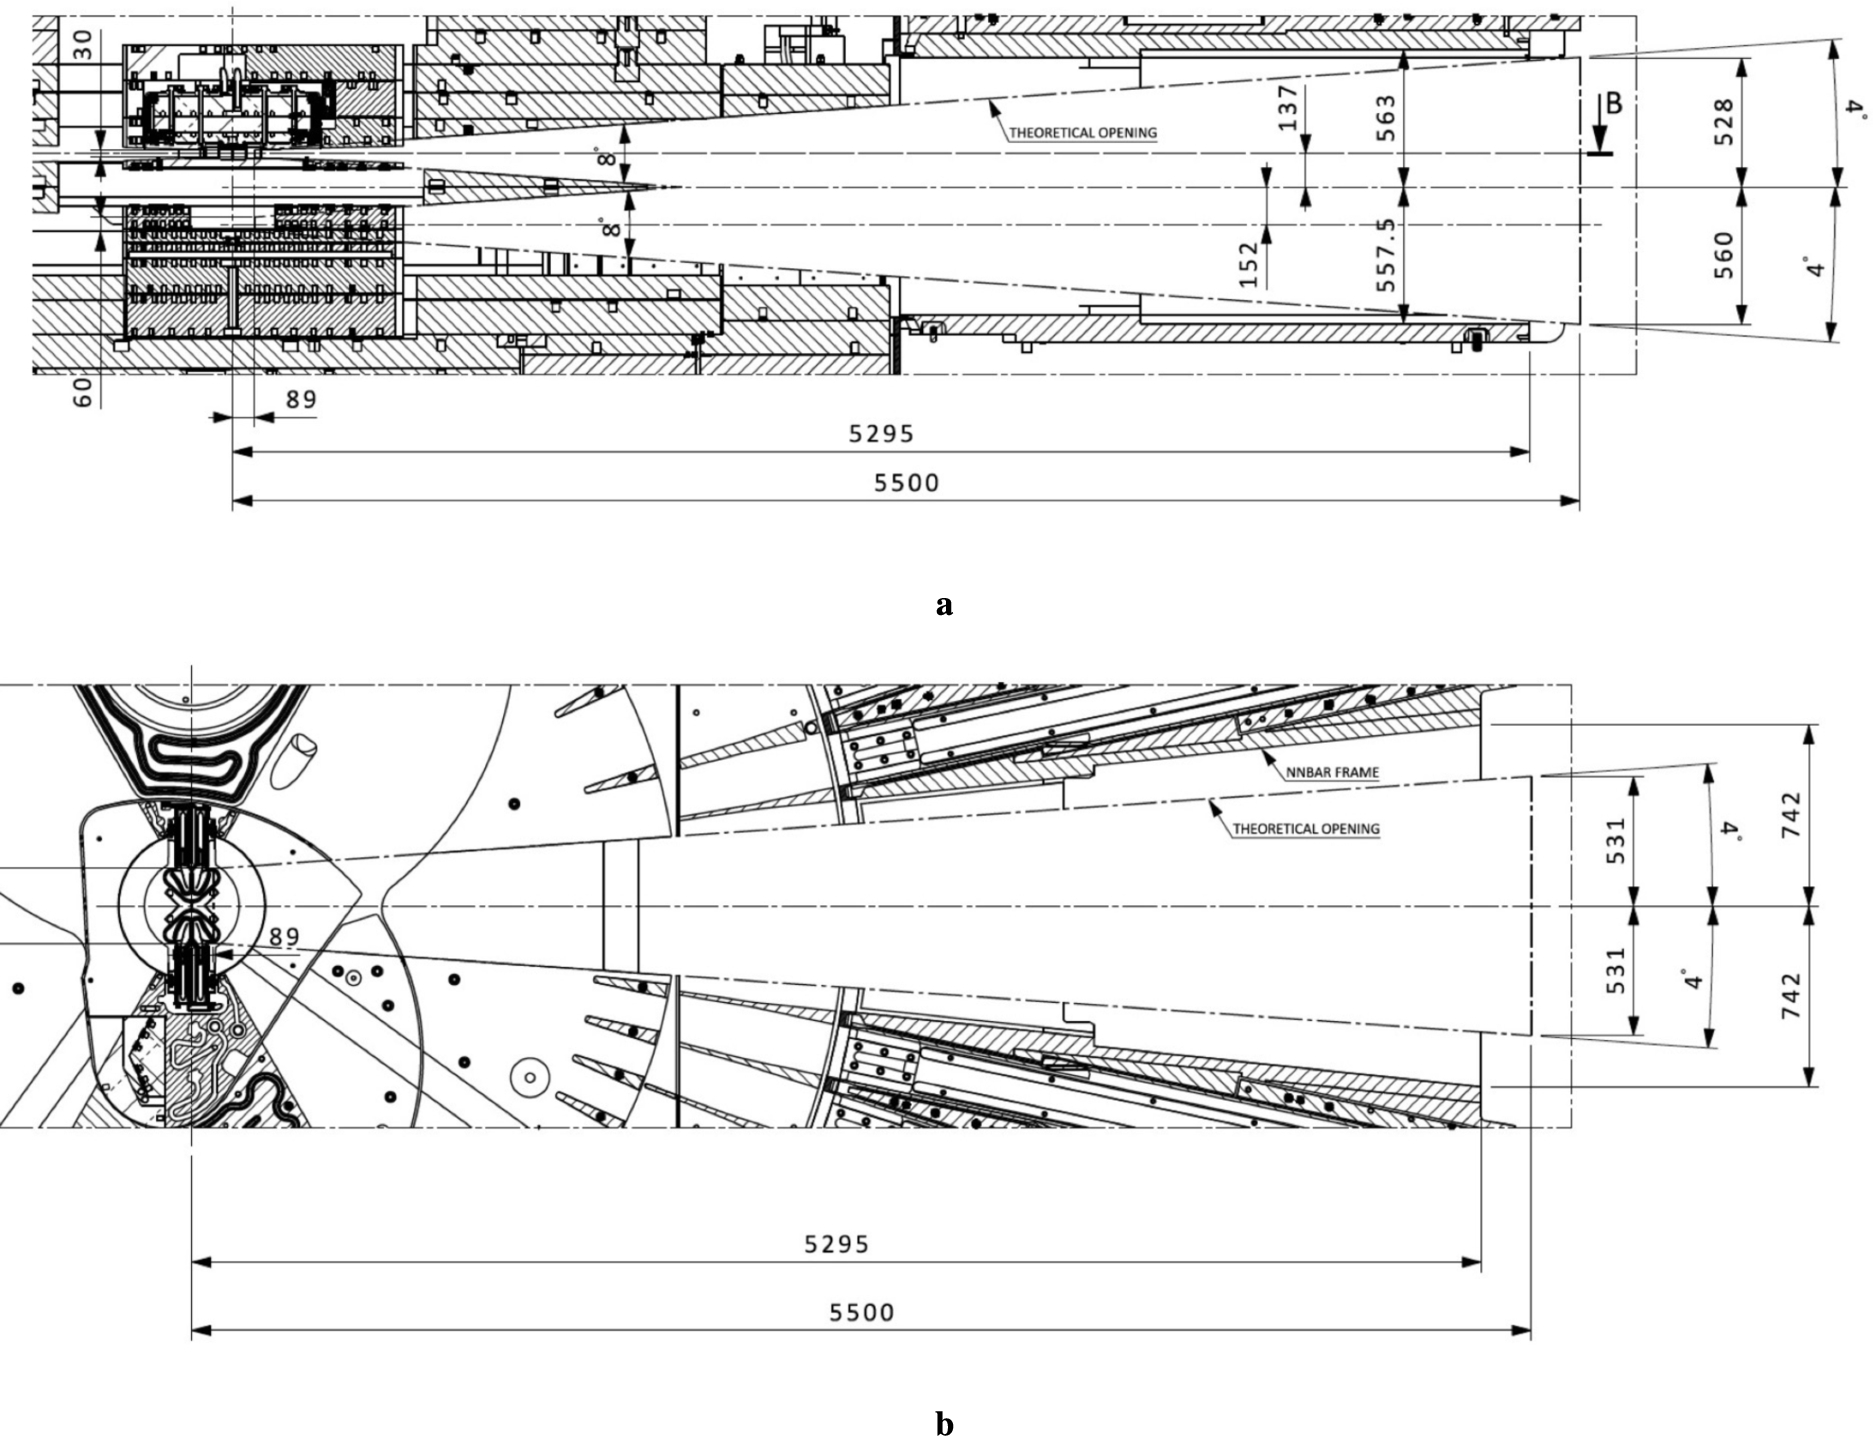
Fig. 11.
(A) side view of opening in correspondence of NNBAR. (B) top view of the large beam-port opening for NNBAR.
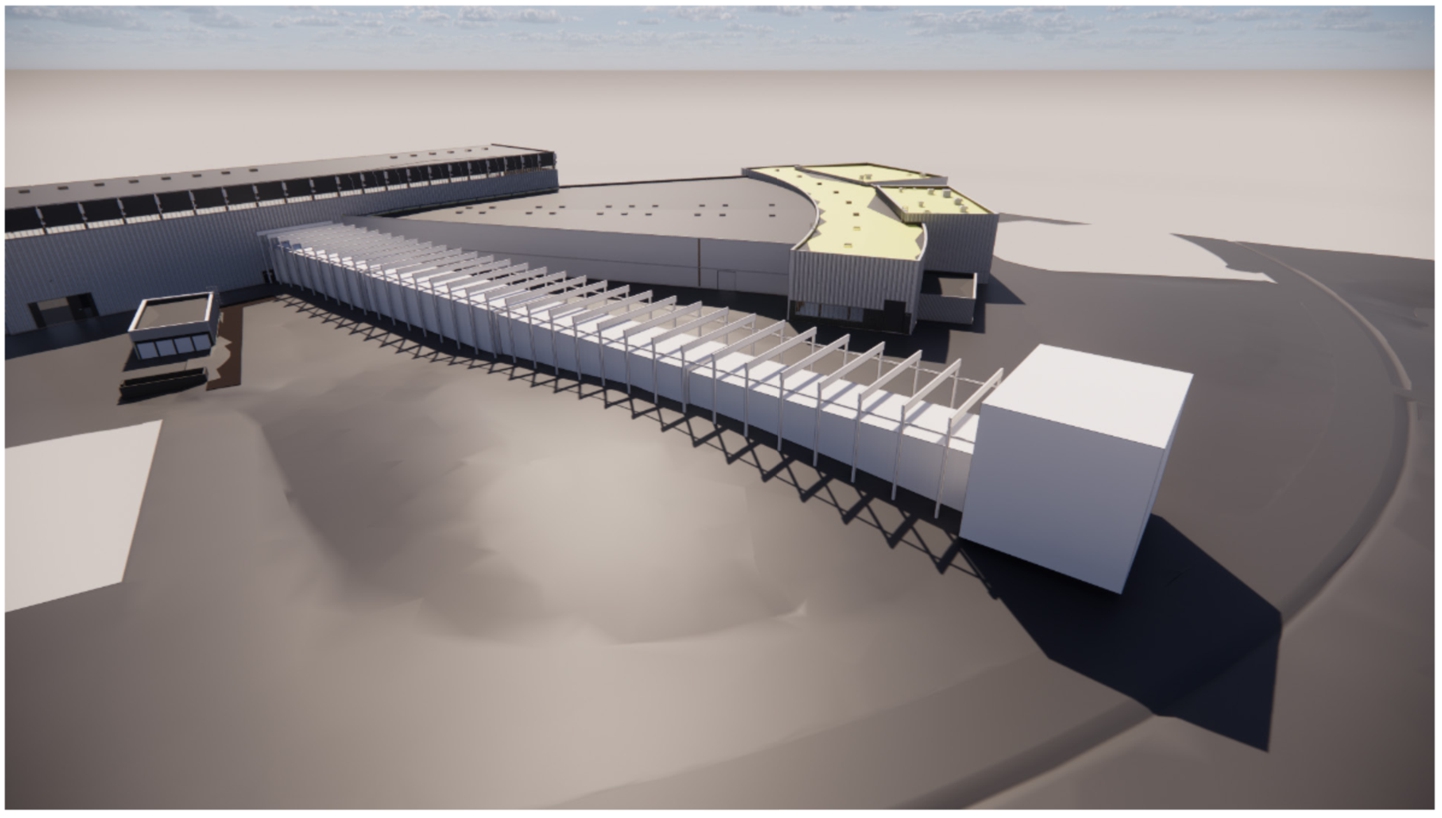
Figures 12 and 13 depict how the NNBAR experiment will require an extension of the instrument hall. The current building perimeter extends approximately 21 meters away from the moderator. This area is available for future upgrades and will be used by the NNBAR experiment described in HighNESS Conceptual Design Report Volume II.
Fig. 12.
Overview of the NNBAR beamline extension from the current ESS building.
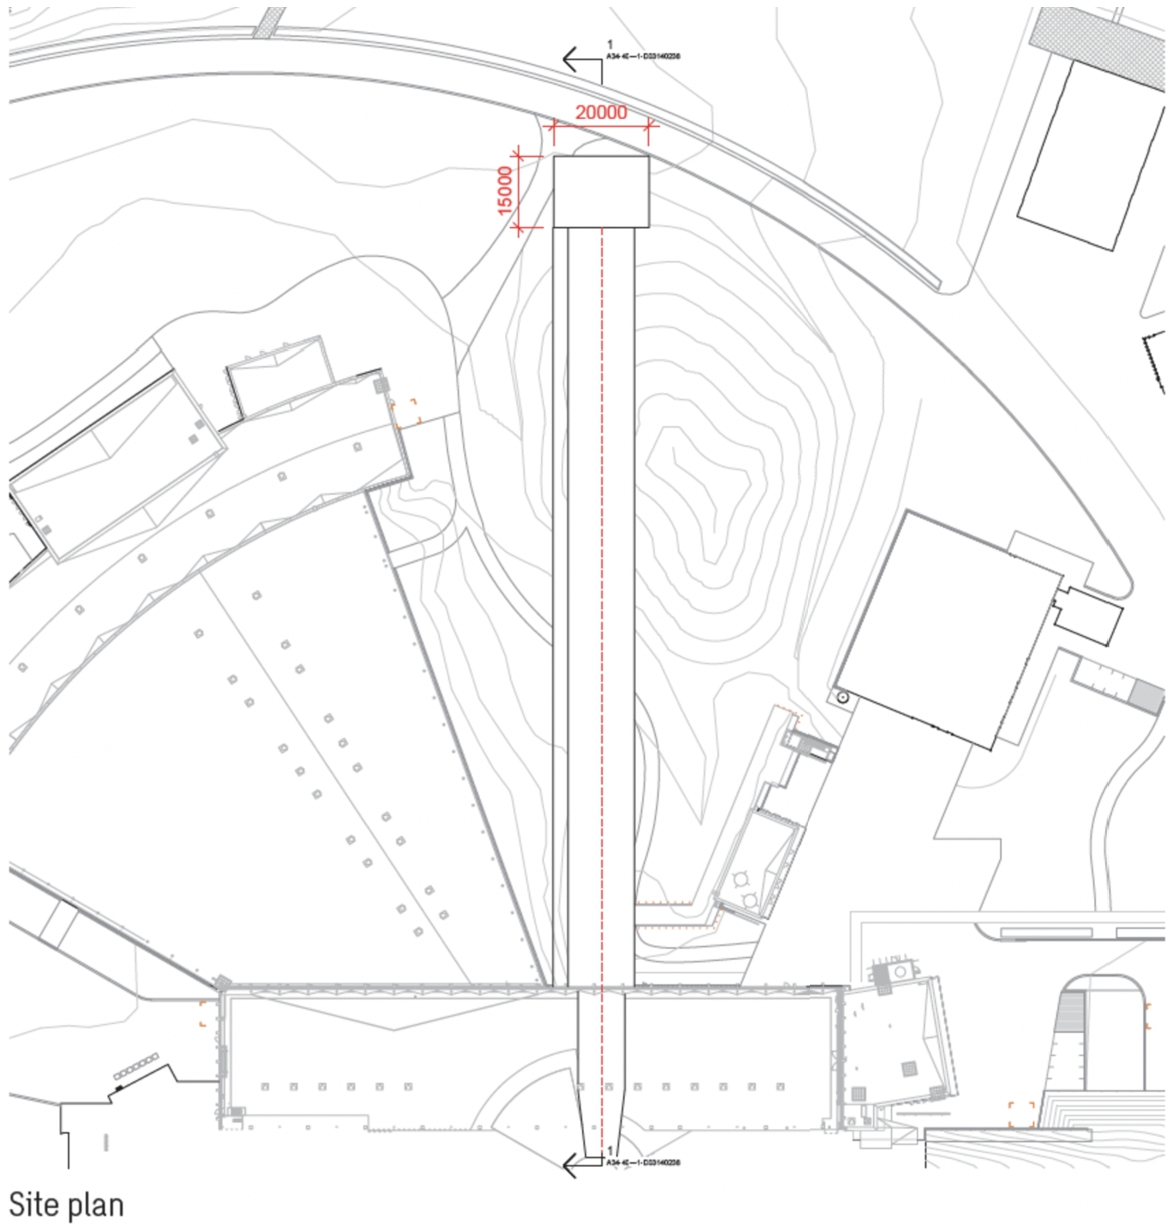
Fig. 13.
The NNBAR beamline and the detector hall located 200 m from the source.
1.2.3.ESS timeline and beam power projections
Owing to delays from the covid-19 pandemic and other technical challenges, the ESS in 2021 conducted a rebaseline exercise to revise its construction and commissioning schedule.11 The revised baseline plan introduces a two-year delay with respect to the previous schedule and will enable the ESS to start full operations and be open for scientific users working with up to fifteen instruments in late 2027. The maximum accelerator power and proton beam energies will be 2 MW and 800 MeV, respectively. The possibility of operating the accelerator at its nominal design power of 5 MW is taken as part of an ESS upgrade project.
1.3.HighNESS objectives
The HighNESS project, [171,172], is an EU-funded 3-year project, that commenced in October 2020. The primary objective of the project is to develop a second cold neutron source at ESS that complements the first source located above the spallation target. For the initial instrument suite, the emphasis was on creating a source capable of providing a high brightness of thermal and cold neutrons. In contrast, the new sources, designed as part of the HighNESS project, focused on two distinct aspects:
- Increase in source intensity: this entails boosting the total number of neutrons emitted from the source. Achieving a more intense source necessitates larger moderators and emission surfaces to enhance the count rate for instruments or experiments that require high flux.
- Shift toward colder neutrons: this shift has manifested in the development of a very cold neutron (VCN) source and an ultracold neutron (UCN) source, in addition to the second cold neutron source. To create a highly intense VCN source as part of the project, we have invested significant effort in extensively characterizing promising candidate materials. This comprehensive characterization is essential for fully developing the capabilities required to design a source utilizing these materials. The project has placed specific emphasis on distinct materials: solid deuterium and deuterated clathrate hydrates, suitable for use as dedicated VCN moderators. While nanodiamonds, graphite intercalation compounds, magnesium hydride, and clathrate hydrates (see Section 5) can serve as advanced reflectors to enhance the VCN flux.
The second source was designed as a liquid-deuterium (LD2) moderator, based on proven technology. One of the main results of this work is a complete engineering design of the LD2 moderator, taking into account the actual layout of the ESS target station. In addition to this, the project has explored several designs for VCN and UCN sources. These design possibilities are described in Section 4, and Section 6 respectively. Furthermore, the project has successfully developed a set of neutron scattering instruments (see Section 8) and conducted a conceptual design study for the NNBAR experiment.
As mentioned previously, the first 15 instruments for the user program of ESS will view the top moderator. The start of operation of ESS will be at low power, which will be increased stepwise to finally reach the time average power of 2 MW. It is planned to reach 2 MW power around 2028. Beyond 2030, a second moderator system, like the one proposed herein, could become available. Around that date the facility would ideally be equipped with two separate neutron sources with the following features:
- A high-brightness bi-spectral (thermal–cold) moderator, based on water and liquid para-hydrogen, placed above the spallation target, able to serve all the 42 beam ports of the ESS grid with brightness for thermal and cold neutrons higher than any other facility worldwide.
- A high-intensity LD2 moderator, placed below the target station, capable of directly serving instruments demanding a cold-neutron flux of unprecedented intensity or acting as a primary source for secondary VCN and UCN sources for experiments requiring sub-cold neutrons. In particular, the ESS would provide the first high-intensity VCN source in the world.
Thus, in this scenario of separate moderators optimized for different neutron characteristics, ESS would offer, with respect to the single-moderator case, a versatile neutron source of outstanding performance, spanning a larger neutron wavelength range, and delivering high brightness and intensity to the instruments according to their requirements. This will enable a plethora of multi-disciplinary activities which fit the original plan for ESS but offer many more possibilities beyond, for which there is strong topical scientific demand.
At the time of the writing, it is challenging to predict whether this moderator will be installed before ESS reaches the 5 MW design power. As a consequence, the majority of the findings presented in this work have been developed with consideration of both the 2 MW and 5 MW options.
1.4.The HighNESS project in the neutron landscape
Some examples of instruments and experiments HighNESS aims to make possible are already given in this introduction, but more are outlined in Section 4, Section 8, and in the HighNESS Conceptual Design Report Volume II that describes the NNBAR experiment. There is currently no alternative source with comparable parameters to ESS to enable the experiments mentioned. There are two other high-power, MW-class, pulsed spallation sources in the world, J-PARC in Japan and SNS in the USA. Both facilities have upgrade plans for the implementation of second target stations, and in both cases, the focus is on using low-dimensional high-brightness moderators, similar to the approach of the ESS first source.
These upgrades aim to achieve peak brightness superior to that of the ESS first source, with a potential increase of up to a factor of 5. However, the time-average brightness is expected to remain approximately 5 times lower than that of the first ESS source when operating at 5 MW, and for the majority of applications targeted by the HighNESS project, a high time-average intensity is essential. Furthermore, it is worth noting that the upgrades at SNS and J-PARC primarily focus on cold neutron ranges. Neither of these facilities have plans to install a VCN source near the spallation target. As a result, ESS, with its intense source and focus on delivering longer wavelengths, could provide intensities in the long-wavelength regime that are more than one order of magnitude higher. The installation of a long-wavelength facility at the ESS is uniquely favorable due to the high proton power and long-pulse time structure.
Finally, it is worth highlighting that no other facility houses a feature akin to ESS’s Large Beam Port, which opens exceptional opportunities not only for the NNBAR experiment but also for the development of world-leading UCN sources.
1.5.HighNESS project structure
Fig. 14.
HighNESS project work package structure.
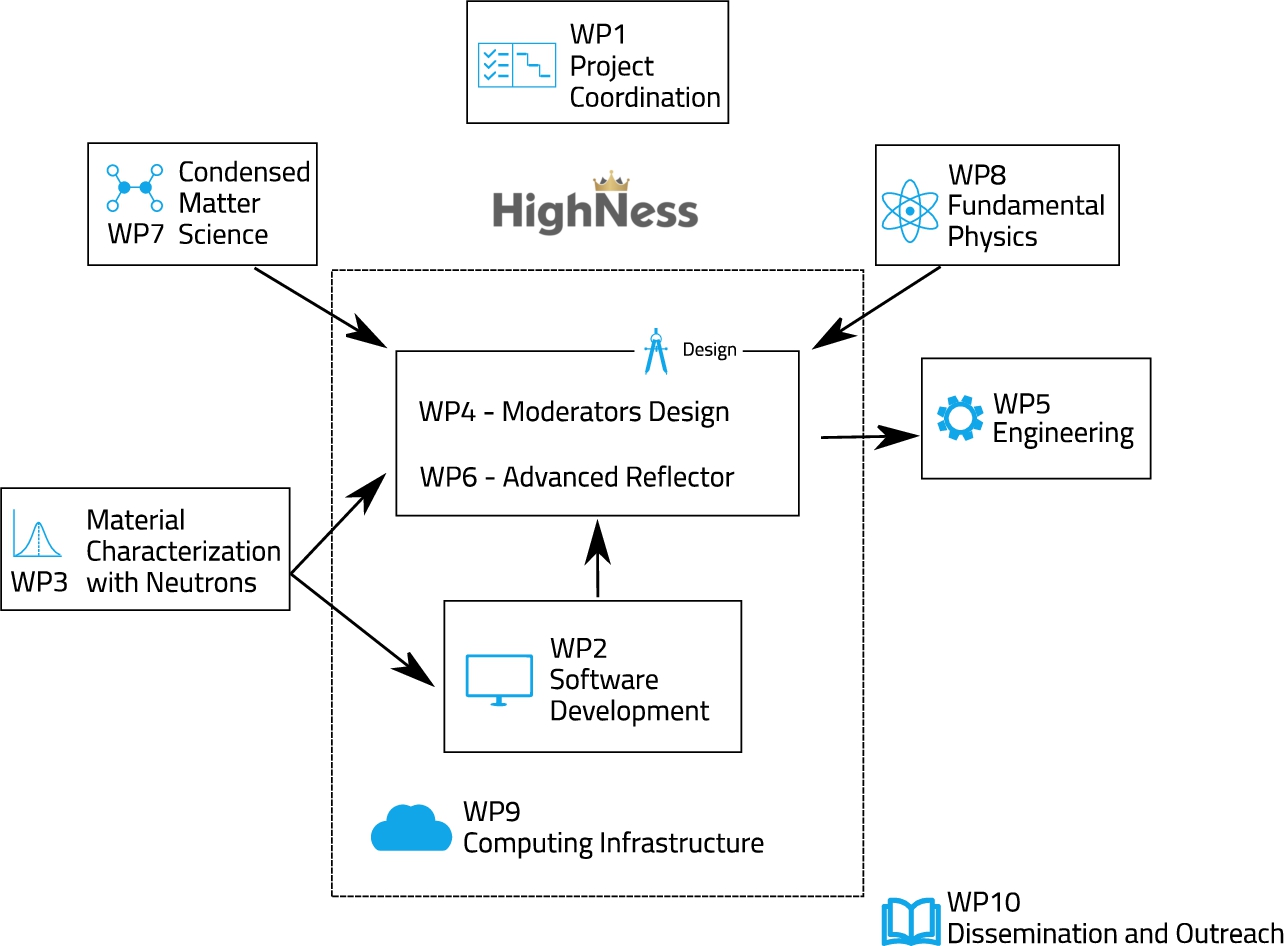
The HighNESS project is organized into ten distinct Work Packages (WPs), as illustrated in Fig. 14. WP1, titled “Project Coordination”, serves as the central hub for coordinating all project activities. WP2, known as “Software Development”, focuses on creating the necessary computational tools required for the analysis and design of high-intensity moderators.
The computational tools developed in WP2 rely on experimental measurements conducted in WP3, titled “Material Characterization with Neutrons”. This work package provides material-property data, essential for generating thermal-neutron scattering kernels and validating the required models.
WP4 and WP6, designated as “Moderator Design” and “Advanced Reflectors”, respectively, serve as the foundation for neutron design efforts, specifically the development of cold sources (CN), very cold neutron sources, and ultracold neutron sources. These two work packages require inputs and specifications from the scientific-oriented WPs, WP7 (“Condensed Matter Science”) and WP8 (“Fundamental Physics”). The inputs from these scientific WPs ensure that the source designs deliver the necessary neutron fluxes and spectra, enabling groundbreaking scientific experiments at ESS that are beyond the capabilities offered by the upper moderator. WP5 (“Engineering”) is responsible for handling all the engineering aspects related to the different sources.
The objective of WP9 (“Computing Infrastructure”) is to make software and data developments carried out by WP2 and WP6 accessible to the public through the creation of cloud computing resources. Subsequently, WP10 manages the distribution of all scientific content generated as part of this project.
2.Design of the cold source
The design of the LD2 moderator is one of the main objectives of the HighNESS project. This moderator should provide a significantly higher intensity than the low-dimensional moderator located above the spallation target, thus enabling new types of experiments in condensed matter research and fundamental physics.
The moderator design has been carried out using the MCNP6 [79] code. The work has been performed incrementally, considering initial, simple figures of merit (FOMs), and later more elaborated ones to account for the specific needs of instruments. Likewise, the work started considering a single opening (channel for neutron extraction), and then moved to a configuration closer to the one needed for ESS, with openings for both fundamental physics and condensed matter experiments. Engineering details were progressively added in the design process, following feedback from the engineering team.
2.1.General description of the ESS moderator area
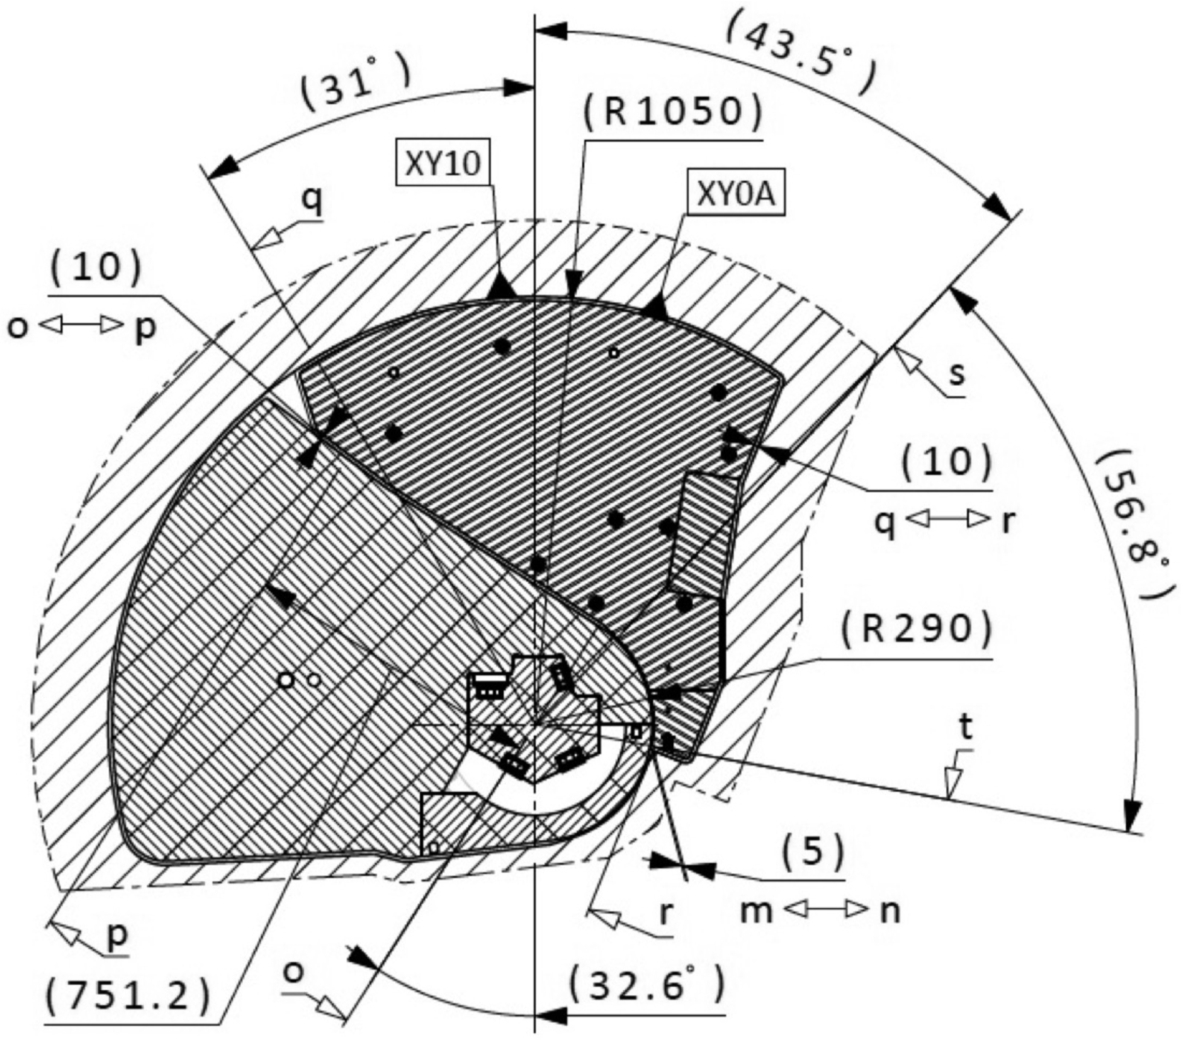
Figure 15 shows a horizontal cut in the geometry of the monolith, highlighting the available space below the target for the neutron extraction, consisting of two areas, each with an angle of 120°. These openings allow for the diffusion of slow neutrons towards beamlines starting outside the monolith, and arranged in four sectors which are conventionally labelled with their cardinal directions (cf. Fig. 6).
Fig. 15.
Horizontal cut in the geometry of the target monolith in correspondence to the center of the lower moderator, courtesy of R. Holmberg. The grey circle inside the twister represents the maximum available space for a Be reflector (maximum diameter 72 cm). The blue circle inside represents the location of the lower moderator. One of several candidate UCN source locations is indicated in the pciture by the red dotted circle. For more details see Section 6.
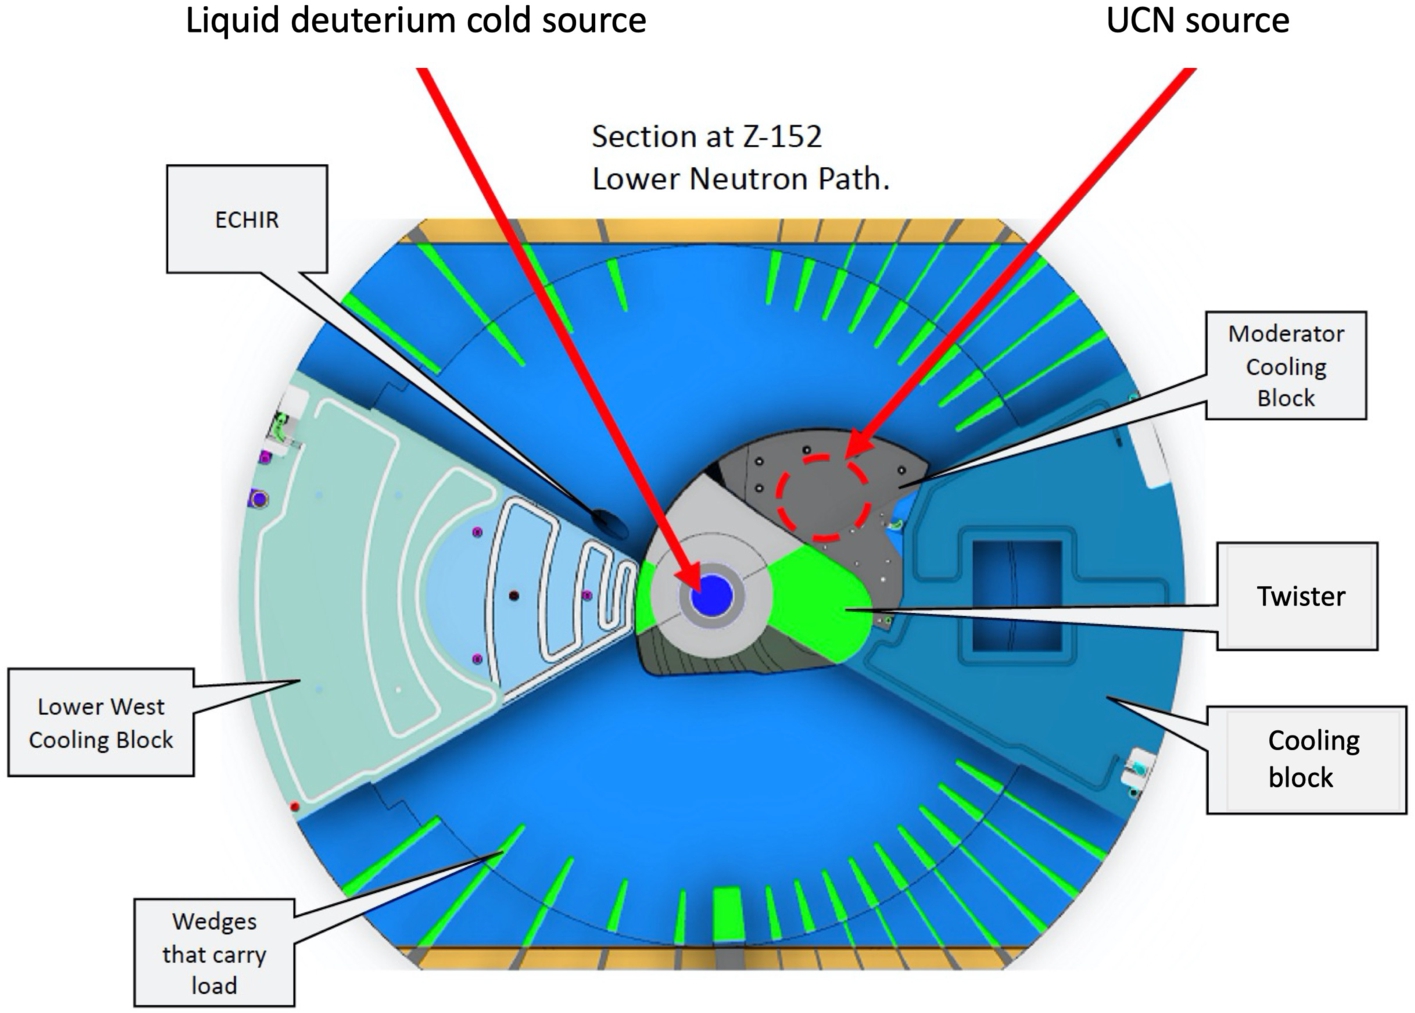
The lower moderator system will be installed inside the so-called twister, a steel structure containing the upper and lower moderator-reflector assemblies. Its name is derived from the fact that it is rotated around its shaft during the periodic exchange procedures. The coordinate system used to describe the geometry is the so-called TCS (Target Coordinate System) which has the origin inside the spallation target, with the vertical axis (
In addition to the space inside the twister structure, which contains the moderator and reflector below the spallation target, another potential location for a moderator system was identified during the early stages of the HighNESS project: the Moderator Cooling Block (MCB). The MCB, shown in Fig. 16, is essentially a removable and replaceable block of shielding material that is positioned adjacent to the twister and is water cooled. Its location has been considered for the placement of a secondary source, such as a UCN source (see Section 6). The placement of a source in that location would require a modification of the MCB. This possibility has been discussed with the ESS Target engineering team and is considered as feasible. It has therefore been explored, along with a variety of other UCN source candidate locations, as part of the HighNESS project (see Section 6). Figure 16 and Fig. 17 show the twister and the MCB next to each other. Such a source embedded in the MCB would be best suited to beamlines placed in the North sector.
Fig. 16.
Twister and moderator cooling block (MCB). Drawing courtesy of C. Jones, ESS. See explanation in the text.
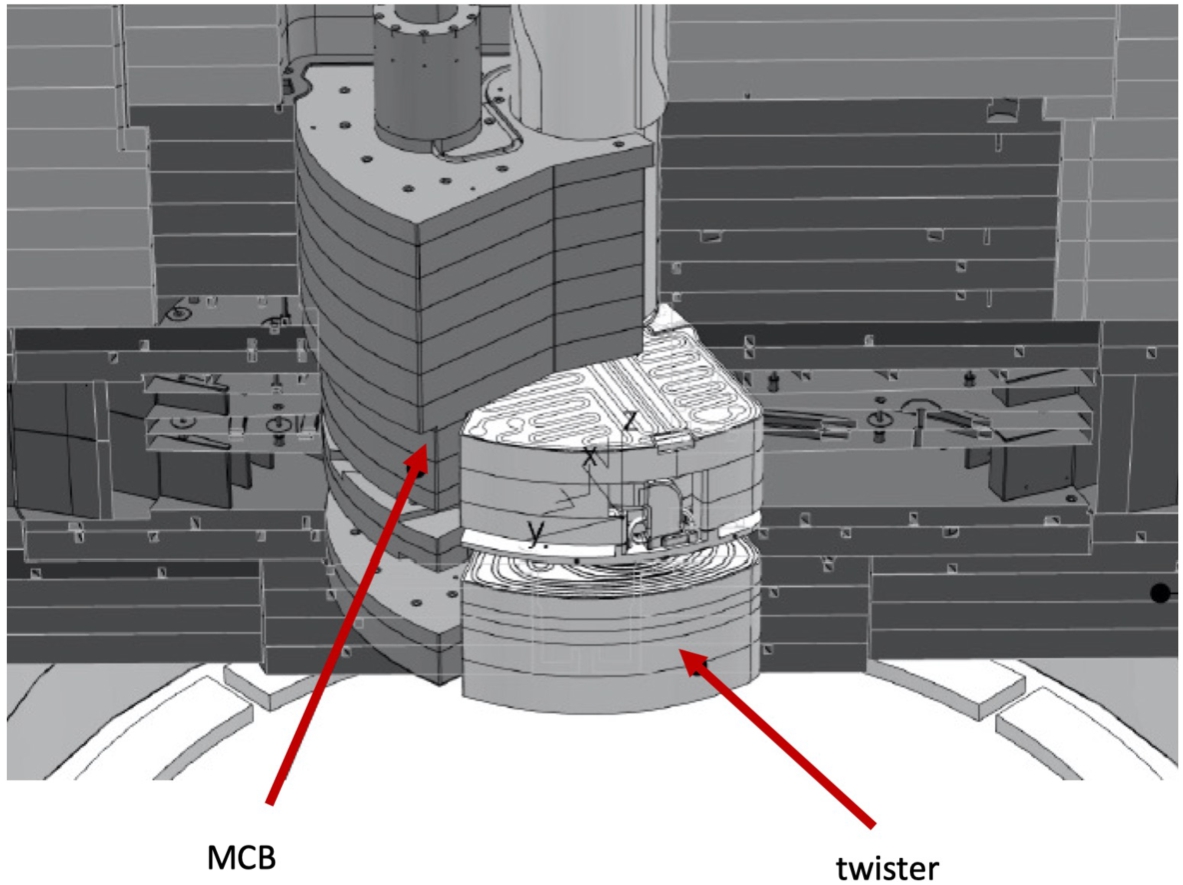
Fig. 17.
Twister (left block) and moderator cooling block (MCB, right block), top view. The twister is the location for both the upper high-brightness bispectral moderator and the lower liquid deuterium moderator. The MCB is a potential location for a UCN in-pile source.
2.2.Figures of merit
It is important to define the wavelength ranges for the three groups of neutrons of interest in HighNESS (Table 2). Cold Neutrons (CN) are defined in the range from about 2 Å to about 20 Å, which is the typical range for the instruments using the cold neutrons from the upper moderator [7]. VCNs, as defined in [34], are neutrons in the range between about 10 Å and 120 Å. It is worth noting that the lower range, 10–40 Å, is of particular interest for condensed matter research, while the upper range, 40–120 Å, is more applicable to fundamental physics experiments. Finally, UCNs are defined as neutrons with wavelengths above 500 Å. The present section reports on the design and optimization of the lower moderator in terms of cold neutron intensity; the neutronic design was performed using the Monte Carlo code MCNP version 6.2 [78]. The design of the VCN and UCN sources are discussed in Section 4 and Section 6, respectively. Finally, in Section 7 options for the integration of the different sources, aiming at providing the best possible solutions to deliver CNs, VCNs and UCNs to the users, are discussed.
Table 2
The wavelength range that defines cold, very cold, and ultracold neutrons
| Cold | 2–20 Å |
| Very cold | ∼10–120 Å |
| Ultracold | >500 Å |
The whole process from the neutron moderation to the neutron transport to an experimental area needs to be taken into account when designing a neutron source. This is because the sensitivity of an experiment is proportional to the count rate of neutrons in a given wavelength and divergence range at the location of experiment. Consequently, the design of the source must be done considering the initial cold neutron flux calculations at the emission surface of the source provided by MCNP as well as the subsequent neutron transport using ray-tracing Monte Carlo simulations using the McStas code [116].
The two processes are done at different stages. In the case of the HighNESS project, MCNP simulations are done by the neutronic team (Work Package 4 of the HighNESS project, see Section 1.5), while the McStas ones are mainly performed by instrument designers for both condensed matter instruments and fundamental physics experiments. In order to link the two parts, MCNP must provide a source file to be used in McStas. This can be done in several ways, such as by fitting neutron spectra from the moderator, or by writing individual neutron trajectories in a text file (MCPL format [104]), which is then read by McStas. The latter is the preferred option within HighNESS.
There is however an additional factor that complicates the work of the source designers in HighNESS, which is the use of advanced reflectors that are intended to increase the flux from the source to the instruments. Various options have been investigated, such as the use of nanodiamond layers at the exit of the moderator, which increase the flux towards the neutron guides via quasi-specular reflection. Other materials have also been considered. To investigate these options, thermal scattering libraries were developed and included in the MCNP simulations, as well as in other particle transport tools (see Section 10).
To optimize the moderator design it is necessary to define a metric, or figure of merit (FOM). Several FOMs are needed to accommodate the needs of the various instruments. Table 3 provides the summary of the FOMs used for the design of the moderators in WP4.
Table 3
List of FOMs.
| Cold source | |
| NNBAR | |
| Condensed matter |
| Very cold source | |
| Fundamental physics | |
| Condensed matter |
2.2.1.Figures of merit for condensed matter
For the neutron scattering instrument designs developed by HighNESS, the number of neutrons reaching the sample within the desired wavelength range and divergence is essential for the instrument optimization.
Choosing a FOM is not always as straightforward as, for instance, in the case of NNBAR discussed below. The reasons are as follows: first, there are three classes of instruments under study: SANS, imaging, and spin-echo. Second, for a given class of instruments, different solutions for the optics can be considered, which might work best for competing features of a moderator.
In general, however, a few guidelines have been established that can be used to define the way of working and a useful FOM. Since the neutron divergence at the sample can only be studied with McStas, and is not a parameter controlled with MCNP, it has been omitted from the FOM. The FOM to be used in designing the source should rather concentrate on the intensity and spectrum:
- Different emission surfaces from the moderator are of interest a priori for the relevant instruments. The reference emission surfaces are: 5 × 5 cm2, 10 × 10 cm2, 15 × 15 cm2, 20 × 20 cm2.
- For each of these surfaces, an optimization of the moderator can be done, using the integrated intensity in a given range of wavelengths as FOM.
- For some instruments, in particular spin-echo – and potentially future SANS instruments – the instrument design team (WP7) is also interested in a colder spectrum, i.e., an increase in the spectrum for wavelengths greater than 10 Å. For this purpose, the combined efforts of WP4 and the advanced reflector team, WP6, were needed (i.e., using advanced reflectors to enhance the coldest part of the spectrum from the cold moderator). It is likely that the greatest increase will be achieved using a smaller viewing surface than the reference ones under study by WP7. This could be obtained with a smaller extraction surface, such as 3 × 3 cm2, surrounded by a layer of advanced reflectors such as nanodiamonds. This option has also been investigated, and in this case smaller openings will also be considered, in addition to the larger openings mentioned above.
2.2.2.Figures of merit for fundamental physics
The NNBAR experiment will search for baryon number violation (BNV) via neutron (n) – antineutron (
Fig. 18.
Schematics of the NNBAR experiment (not to scale).
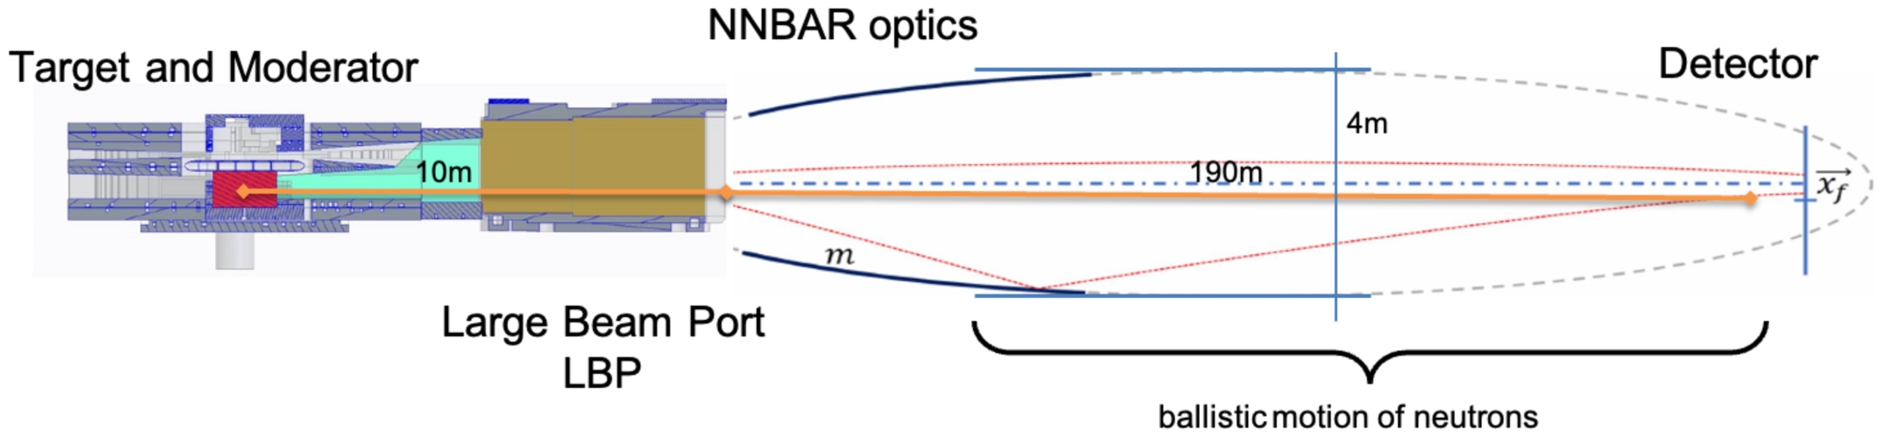
The probability of an oscillation is proportional to the (uninterrupted) flight time squared
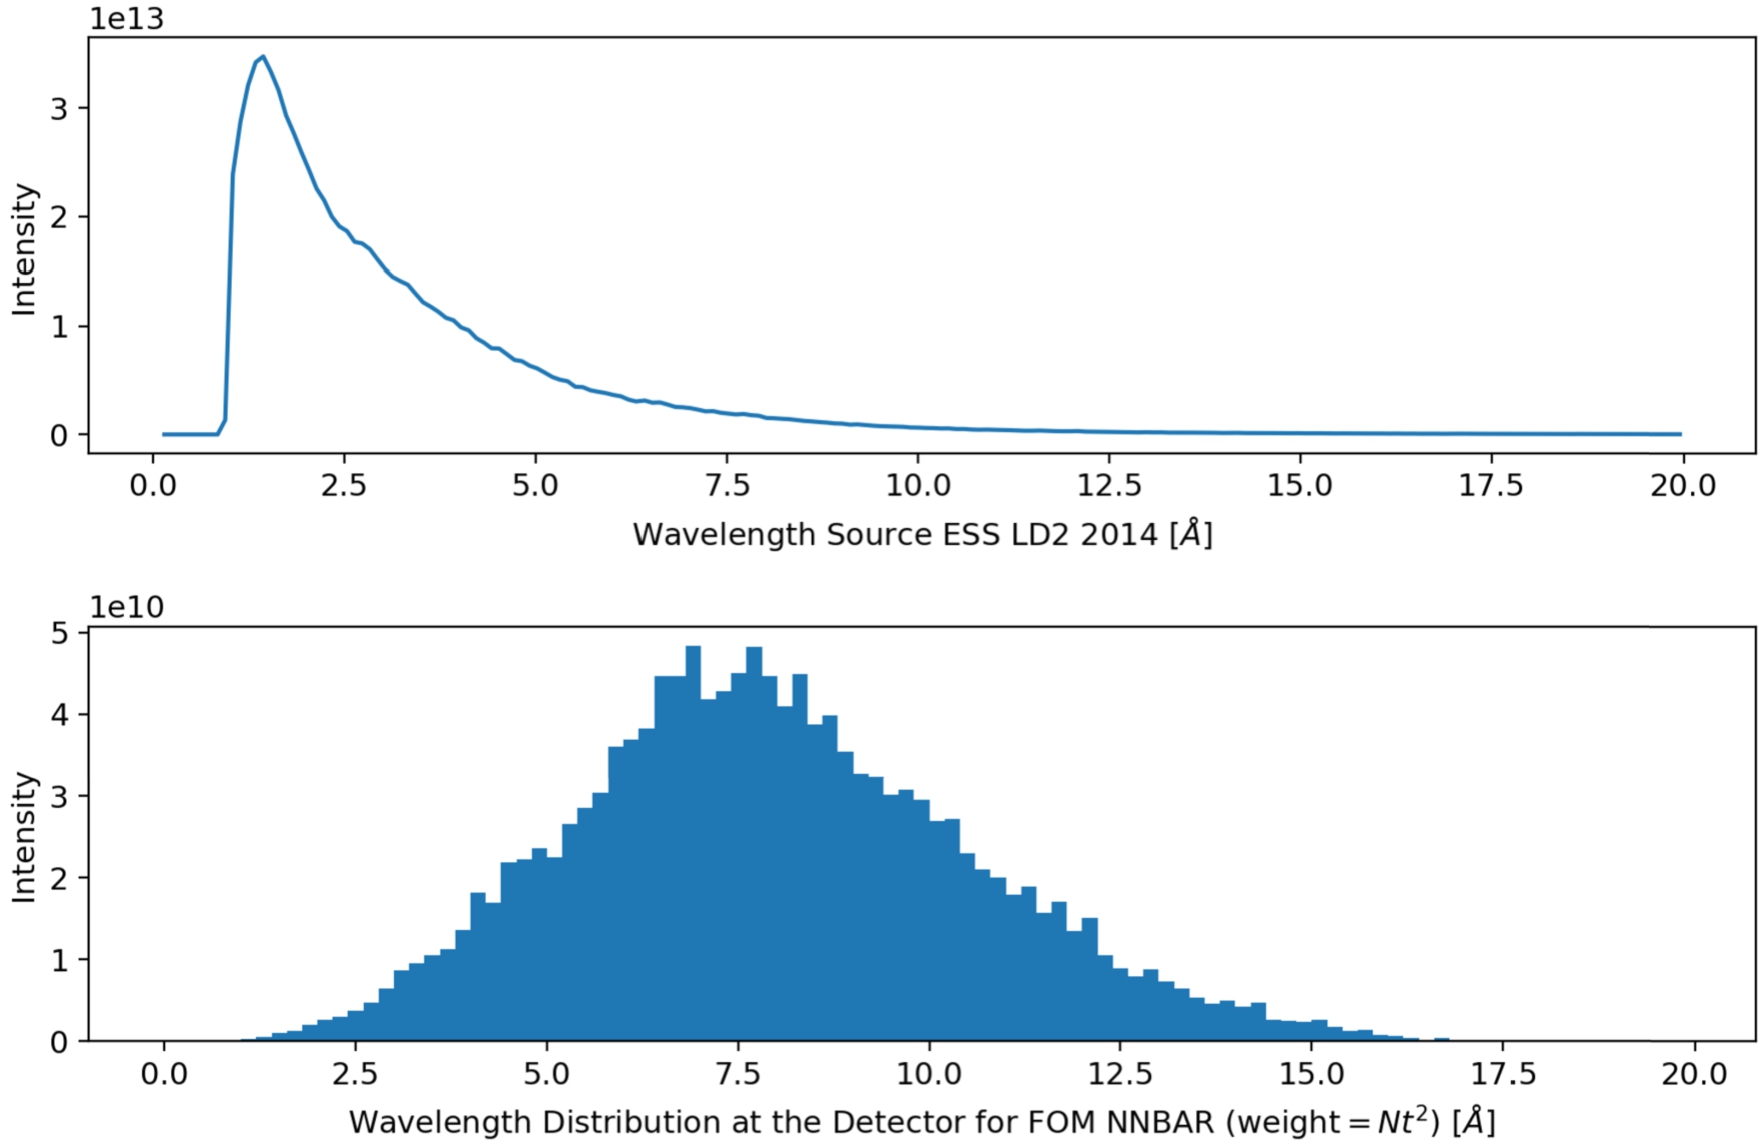
In the lower plot of Fig. 19, the distribution of wavelengths and how they contribute to the FOM is shown for a representative simulation result. The upper plot displays the wavelength distribution in the LD2 source for comparison.
A possible FOM for the moderator optimization can therefore be the wavelength intensity distribution that covers the solid angle defined by the exit of the LBP in the range above 5 Å (or alternatively, 2.5 Å) at the detector weighted with
The FOM used for the moderator design for NNBAR is therefore the intensity of neutrons, weighted with
Fig. 19.
Wavelength spectrum of the LD2 source (upper plot) and the distribution of wavelength contribution to FOM for NNBAR (lower plot).
2.2.3.Figure of merit for VCN
The emphasis on colder neutron spectra is one of the key aspects of HighNESS, and consequently a great effort has been devoted to the design of a source delivering high intensity of neutrons above 10 Å.
Concerning the FOM, for fundamental physics applications using VCNs, we are mostly interested in neutrons in the range 40–120 Å.
For condensed matter applications, the range of 10–40 Å is in general more useful (see Section 8), as neutron scattering experiments are interested in extending existing techniques such as SANS and spin-echo to the use of neutrons of longer wavelengths than traditionally used.
This distinction is however somewhat arbitrary and in the design described in Section 4 the intensity in both ranges was calculated by looking at two wavelength bins, 10–40 Å and above 40 Å.
2.2.4.Figure of merit for UCN
A further goal of the HighNESS project is to design a source of ultracold neutrons. This UCN source can be located in-pile or in-beam. The design work on the different concepts is described in detail in Section 6. Two materials have been considered in HighNESS as UCN converters: superfluid helium (He-II) and solid deuterium (SD2). In both materials, the UCN production happens via low-energy excitations induced by cold neutrons, primarily 8.9 Å for He-II, and neutrons in the range from 2.5–7 Å for SD2.
There are several quantities that can be used to characterize the performance of a UCN source, as discussed in Section 6.3. In this work we focused on the calculation of the production rate density
Calculating the production of UCN in the source is the first step in the study; the performance of the source depends on several factors that determine losses of UCNs either in the source or in the extraction. This makes it difficult to make reliable predictions and underlines the importance of benchmarking simulations to experiments.
2.3.Neutronic design
The purpose of the cold moderator is to provide cold neutrons to beamlines for fundamental physics and neutron scattering instruments. The “NNBAR opening” is intended for fundamental physics experiments in general and the NNBAR experiment in particular, while the opening for one or more neutron scattering instruments is referred to as the “WP7 opening”.
2.3.1.Iterative design process
The design of the cold moderator followed several iterations, which are summarized in the following sections. The design steps performed were:
- Preliminary neutronic studies using a cylindrical moderator shape and one opening for beam extraction (Section 2.3.2).
- First neutronic optimization (Section 2.3.4). In this step, a box shape for the moderator was selected, and the design was performed with two openings. The FOM used for the optimization was the intensity of cold neutrons above 4 Å.
- Second neutronic optimization (Section 2.3.5). The optimization from the previous step was repeated using the FOM from Table 3.
- Engineering study based on the model from second neutronic optimization resulting in new engineering requirement for adding aluminum into LD2.
- Third neutronic optimization, see Section 2.3.6, motivated by updated constraint on adding aluminum into LD2 and the effort to minimize heatload by reducing the volume of the moderator.
- Engineering design based on the model from the third neutronic optimization, see Section 3.
- Evaluation of the impact of the engineering design on neutronic performance, Section 2.3.10.
- Additional neutronic model with separated LD2 box and Be filter, U-shaped reentrant hole and rounded walls of the LD2 box based on new engineering studies which are in a preliminary stage, see Section 2.3.11.
2.3.2.Summary of the results with a single opening cylindrical moderator
The initial neutronic study of the LD2 moderator was meant to investigate its performance with respect to the variation of a large set of parameters. For this purpose, a simple geometry consisting of a cylindrical moderator with a single opening for neutron extraction was used.
Here we summarize the most important findings, which provide important indications for the design of the liquid deuterium moderator with two openings.
- Ortho-para deuterium fraction. A 100% orthodeuterium composition gives 7 % higher cold neutron intensity than the natural composition (67 % ortho–33% para). It may therefore be beneficial to use a catalyzer to increase the fraction of orthodeuterium.
- Temperature effect. A comparison of intensities was performed with scattering kernels at different temperatures, ranging from 19 K to 23 K, for a composition of (67% ortho – 33% para). The results indicate that the lower the temperature, the higher the intensity, as expected. A temperature of 20 K gives an intensity 7 % higher than at 23 K. It is therefore recommended to run at a temperature closer to 20 K.
- Top premoderator thickness. The top premoderator (i.e. the water layer between moderator and target) was found to have an ideal thickness of about 3 cm.
- Side and bottom premoderator thickness. The side and bottom premoderator (i.e. the water layer between moderator and reflector) has an ideal thickness of about 1 cm. There is a large (20–30%) difference between having a water layer, and having no layer at all. This effect is explained by Be reflector becoming semi-transparent to colder neutrons delivered by the LD2 moderator.
- Size of emission window. For a given, fixed moderator size, the intensity increases linearly with the height of the emission window opening, as expected.
- MgH2 as side and bottom premoderator. In the configuration considered, there is no gain in using a MgH2 side and bottom layer instead of the water layer.
- Effect of HD. With the tests performed, little (if any) gain in intensity was observed using a small amount of hydrogen in the liquid deuterium.
- Intensity vs moderator size for a fixed 24 × 24 cm2 opening. The general trend observed is that the intensity is increasing with the moderator size.
- Reentrant hole. A preliminary study of the effect of a reentrant hole on the intensity of a 10 × 10 cm2 emission window indicated a significant increase, at the level of 20–30 % in the intensity. A box-shaped reentrant hole was found a preferable option over the wedge-shaped one after assessing the neutronic performance of both options.
- Be filter/reflector. A first study of the effect of a Be filter/reflector on the intensity was performed. The study was also done with two openings. The first results, later investigated in more detail, indicate very promising gains, on the order of 20–30 % especially for the NNBAR experiment.
2.3.3.Design optimization
The design of the cold source is extremely important, as two objectives must be achieved: first, to provide high-intensity cold beams to the experiments; second, to serve as primary source for a secondary VCN or UCN source. Therefore, the design study of the cold source was performed throughout the whole duration of the HighNESS project.
2.3.4.First iteration
For the first baseline model, a box-shaped geometry was selected, which was found to have better neutronic performance than the cylindrical-shaped moderator. Two box-shaped geometries were initially investigated, giving a similar neutronic performance. The geometry with the lower heat load was selected in the continuation of the project.
For the selection of the dimensions, among the three optimization criteria chosen for input into the optimization code Dakota [2] (sum of intensities, sum of brightness, and NNBAR intensity), the sum of brightness for the two openings was selected. The reason for this choice is that, for a fixed dimension of the emission window (as was the case in all these optimizations), the sum of brightness gives equal weights to NNBAR and WP7, and is the de facto equivalent to optimizing for intensity for each of the two emission windows. However, among the many results provided by Dakota, with the criteria of maximization of the sum of brightness, in this first iteration a preference was given to the ones giving more intensity to NNBAR, while still having a high enough intensity to WP7.
The Be filter was introduced into the model adjacent to the NNBAR and WP7 emission surfaces as an efficient reflector of neutrons with wavelengths below about 4 Å, leading to a considerable gain in cold neutron intensity (see Section 2.3.7).
Below is the description of the “first iteration” model of the LD2 moderator. This model is illustrated in Fig. 20.
Fig. 20.
Graphical representation of the baseline design for the LD2 moderator submitted to WP5 for engineering studies. The color codes are the following: orange: steel (twister frame, inner shielding, etc); dark blue: liquid ortho-deuterium; blue: light water; light blue: beryllium; green: aluminum. Note that cold Be filters and ambient Be reflector are shown using the same color; the same note applies to Al. The direction of the incoming proton beam is indicated in the upper and lower left figures (for the upper left figure, the dashed arrow means that the proton beam is at a different vertical level).
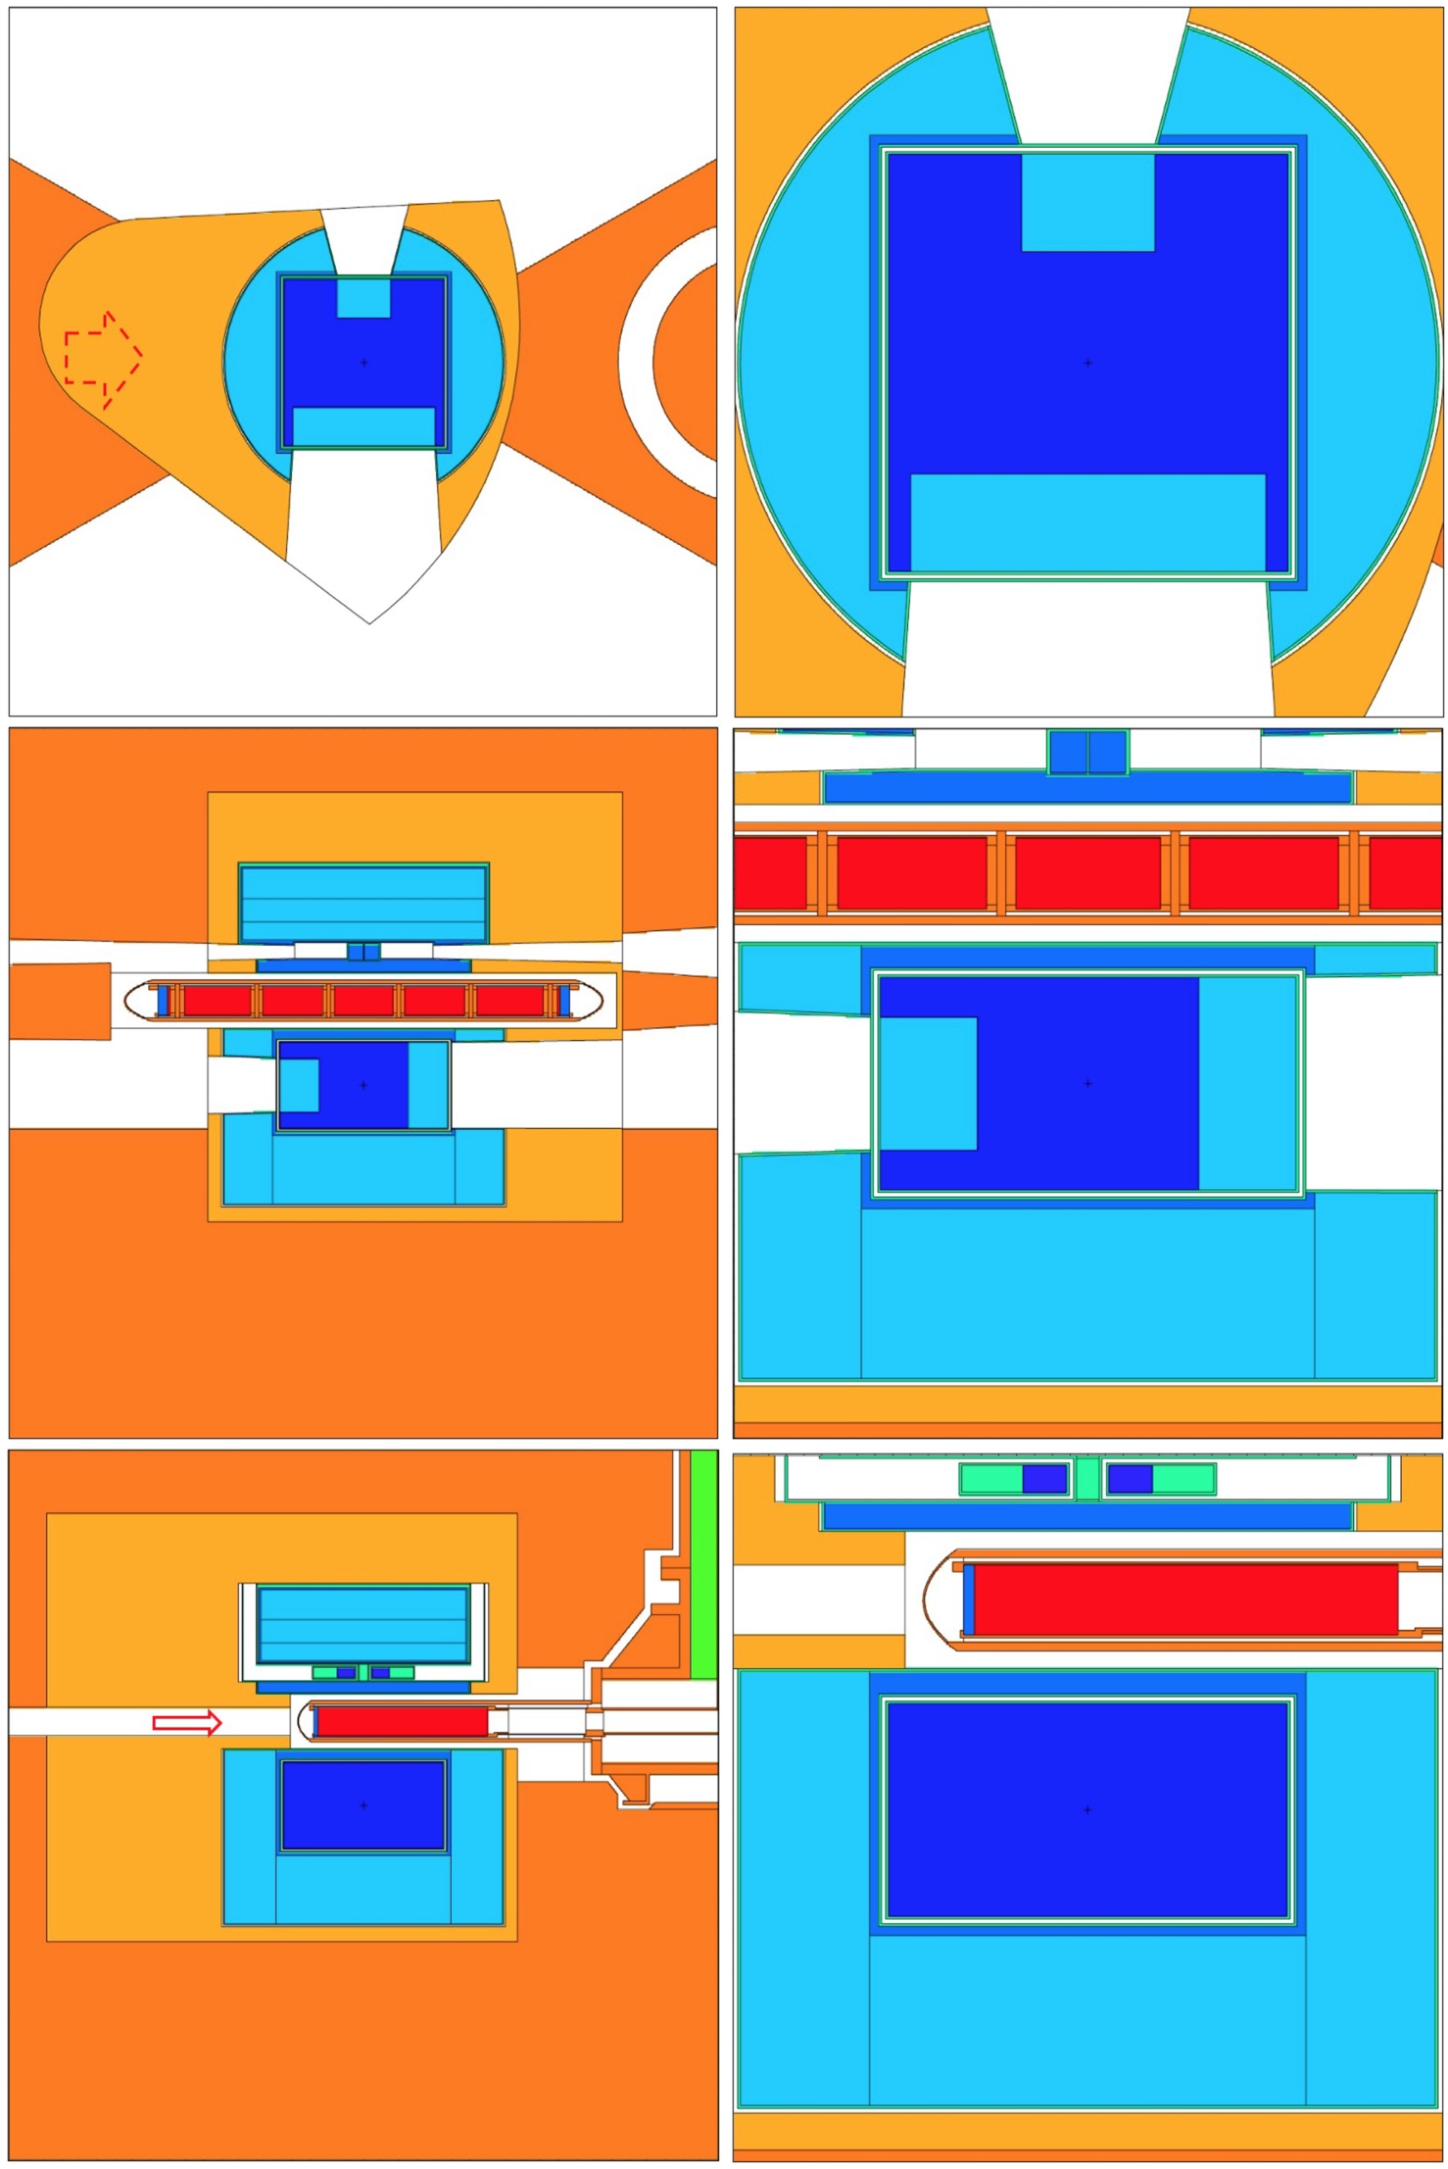
A. The LD2 moderator is represented by a rectangular vessel made of aluminum. Its inner dimensions are:
- 45 cm long in the proton beam direction (“width”),
- 47 cm long in the direction transverse to proton beam direction (“length”),
- 24 cm long in the vertical direction (“height”).
In neutronics calculations, the thickness of the vessel Al walls is set to 0.3 cm for the sake of consistency and comparison with work on the upper moderator. The vessel itself is filled with liquid ortho-deuterium at 20 K and the cold Be filters are immersed in deuterium.
B. There are two openings, both perpendicular to the incoming proton beam, but in opposite directions:
- NNBAR opening serving the North–West (NW) sector (see Fig. 6);
- WP7 opening serving the defined South–East (SE) sector.
The NNBAR opening has an emission surface of 40 cm width by 24 cm height, while the WP7 opening has an emission surface of 15 cm width by 15 cm height. The geometric centers of both emission surfaces and of the LD2 moderator are situated at the same level, −23.7 cm below the center of the spallation target.
The emission surfaces are covered from the inside by rectangular cold Be filters. The filters are 110 mm thick each, while their widths and heights correspond to those of their respective emission surfaces. Cold Be filters are in direct contact with deuterium, however, it is important to note that the bulk temperature of cold Be filters is not required to be 20 K: as long as their temperature is kept below about 80 K, they will provide the expected performance increase.
C. The LD2 moderator is placed inside a standard moderator-reflector plug, thus, surrounded by the following layers:
- 0.3 cm thick Al vessel around LD2 and Be filter at the same temperature as LD2;
- 0.5 cm vacuum gap between the Al vessel and premoderator (engineering constraint);
- 0.3 cm thick Al walls at ambient temperature surrounding the H2O premoderator and Be reflector;
- 1.0 cm thick layer of H2O at ambient temperature below and on the sides to serve as a premoderator;
- 2.5 cm H2O layer at ambient temperature above (between the moderator and the target);
- Be at ambient temperature below and on the side to serve as reflector, with as much volume as possible.
The summary of the expected performances, integrated over various wavelength ranges, is shown in Table 4.
Table 4
Neutronic performance and characteristics of the model from the first iteration of the design of the cold moderator. Brightness and intensity are integrated over different wavelength ranges (NNBAR and WP7 openings) and compared with the upper moderator. The values for the upper moderator are from ref. [222]. To calculate the intensity we considered the following size of the emission windows: NNBAR – 960 cm2 (40 cm × 24 cm); WP7 – 225 cm2 (15 cm × 15 cm); upper moderator – 42 cm2 (sum of two openings of the butterfly moderator of 7 cm × 3 cm for the beamline perpendicular to the proton beam, I.e., in the NNBAR direction, cf. also [222]). All values are for 5 MW average beam power. The heatload on Be filters accounts for both the contribution at NNBAR and WP7 openings. The moderator volume is the sum of the volumes of the LD2 box and Be filters
| Brightness [n/cm2/s/sr] | |||
| >2 Å | >4 Å | >10 Å | |
| NNBAR | |||
| WP7 | |||
| Upper moderator | |||
| Intensity [n/s/sr] | |||
| >2 Å | >4 Å | >10 Å | |
| NNBAR | |||
| WP7 | |||
| Upper moderator | |||
| NNBAR FOM | |||
| WP7 FOM | |||
| Heatload on LD2 moderator | 29.3 [kW] | ||
| Heatload on Be filter | 20.0 [kW] | ||
| Heatload on Al vessel | 7.1 [kW] | ||
| Total heatload | 56.4 [kW] | ||
| Moderator volume | 50.8 [liters] | ||
2.3.5.Second iteration
In the first iteration, all the optimizations and calculations were done using the intensity for neutrons above 4 Å as FOM. This was a FOM meant to generally target cold neutrons in the early optimization steps. The second round of optimization was performed using the more elaborate FOMs, cf. Table 3. The optimum size of the LD2 moderator was found to be similar (45 cm width, 48.5 cm length, 24 cm height). A reentrant hole (REH) of 12.5 cm depth was introduced at the emission surface of the WP7 opening replacing the Be filter, providing a considerable gain in cold neutron intensity and brightness (see Section 2.3.7)). The NNBAR opening is covered by an 11-cm thick Be filter.
The design of the moderator, optimized according to the procedure outlined above, gives the intensity of the source at the NNBAR side, integrated above 4 Å, of 6.7 × 10¹⁵ n/s/sr. This is the intensity of the emission window of 24 × 40 cm2, for 5 MW of beam power (i.e. 2 GeV for 2.5 mA average proton current). The intensity at the WP7 side is lower, because of the smaller size of the opening, although it has a greater brightness. For a beam power of 2 MW (800 MeV for 2.5 mA average proton beam current) the intensity is simply a factor of 2.5 lower, because as shown later in Fig. 31, the difference in emitted spectra from the moderator between 800 MeV and 2 GeV proton beam is negligible. Therefore, at 2 MW the intensity of the moderator is 2.7 × 10¹⁵ n/s/sr.
To have an idea of what these numbers mean in terms of performance of the experiments intended to use this moderator, we can compare with the original calculations done for the NNBAR experiment in [110]: at 5 MW beam power, the intensity was predicted to be 2.9 × 10¹⁵ n/s/sr. That calculation was the basis for the original estimate of the performance increase of NNBAR compared to the ILL measurement [17]. It would therefore mean that the NNBAR performance estimate of this second iteration of the moderator at 2 MW is practically equivalent to the previous estimate for 5 MW. We note however that a large part of this gain is due to the increase in the size of the emission window, which almost doubled; as neutrons are emitted from a more extended source, their transport towards the NNBAR detector is expected to be more challenging.
A summary of the expected performances for the moderator designed in this iteration, integrated in different wavelength ranges, is shown in Table 5. This model was sent to WP5 team for engineering design.
Table 5
Neutronic performance and characteristics of the model from second iteration of cold moderator. Brightness and intensity integrated over different wavelength ranges (NNBAR and WP7 openings) and compared with the upper moderator. The values for the upper moderator are from ref [222]. To calculate the intensity we considered the following size of emission windows: NNBAR – 960 cm2; WP7 – 225 cm2; upper moderator – 42 cm2. The moderator volume is the sum of volume of the LD2 box and Be filter
| Brightness [n/cm2/s/sr] | |||
| >2 Å | >4 Å | >10 Å | |
| NNBAR | |||
| WP7 | |||
| Upper moderator | |||
| Intensity [n/s/sr] | |||
| >2 Å | >4 Å | >10 Å | |
| NNBAR | |||
| WP7 | |||
| Upper moderator | |||
| NNBAR FOM | |||
| WP7 FOM | |||
| Heatload on LD2 moderator | 29.8 [kW] | ||
| Heatload on Be filter | 15.1 [kW] | ||
| Heatload on Al vessel | 7.2 [kW] | ||
| Total heatload | 52.1 [kW] | ||
| Moderator volume | 49.6 [liters] | ||
2.3.6.Third iteration
The third iteration of neutronic optimization of the moderator was performed using Dakota with the model from the second iteration updated by the engineering constraint of requiring a 2.5% volume of aluminium in LD2 to account for flow guides and support structures. Moreover, the third neutronic optimization was also motivated by an attempt to reduce the heat load in the moderator while preserving or even improving its performance. The temperature of LD2 in the moderator vessel was increased from 20 K to 22 K, following indications from the engineering team about the expected temperature of the liquid deuterium in the moderator.
For the purpose of the third iteration of optimization, a parametric model of the moderator was used with the following variable parameters:
- Moderator length;
- Moderator width;
- Be filter thickness;
- Reentrant hole depth.
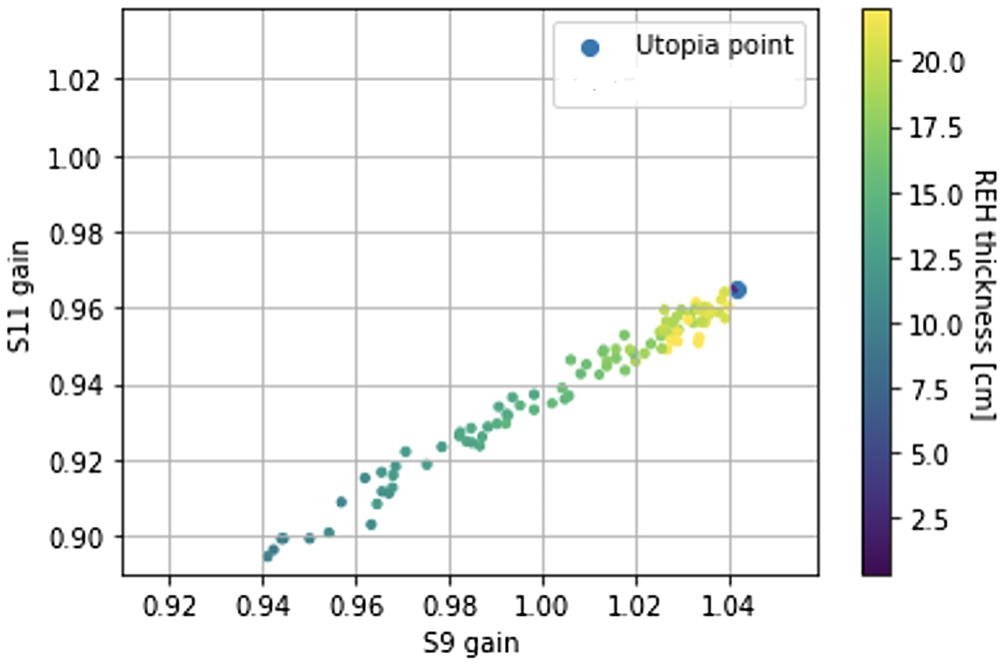
The height of the moderator was fixed at 24 cm. The listed parameters (see Fig. 21) were optimised with respect to NNBAR and WP7 FOMs. A multi-objective genetic algorithm (MOGA) [135] was implemented resulting in a set of solutions over a wide range of NNBAR and WP7 FOMs. These values were compared to the baseline model from the second optimization iteration; however the baseline model was modified adding 2.5 vol% Al in the liquid deuterium, and increasing the temperature of LD2 from 20 K to 22 K. In Fig. 22 the gains made over the second iteration FoMs for WP7 are shown as a function of gains for NNBAR. A Pareto front was fitted through points closest to Utopia point, an idealized point with highest possible NNBAR and WP7 gains. In the subsequent analysis of possible solutions, these gains in NNBAR and WP7 FOMs were analyzed with regards to moderator length (see Fig. 23), moderator width (see Fig. 24), Be filter thickness (see Fig. 25) and the depth of the reentrant hole (see Fig. 26). The following limits on variable parameters used in the optimisation to maximize NNBAR and WP7 FOMs were defined:
- 45 cm ⩽ moderator length ⩽ 50 cm;
- 40 cm ⩽ moderator width ⩽ 45 cm;
- 11 cm ⩽ Be filter thickness ⩽ 15 cm;
- 9 cm ⩽ depth of reentrant hole ⩽ 15 cm;
- Gain wrt to the model from second iteration (“baseline”) ⩾ 1.
Fig. 21.
Graphical representation of the design for the LD2 moderator after the third iteration. The color codes are the following: orange: steel (twister frame, inner shielding, etc); dark blue: liquid ortho-deuterium; blue: light water; light blue: beryllium; green: aluminum. Note that cold Be filters and ambient Be reflector are shown using the same color; the same note applies to Al.
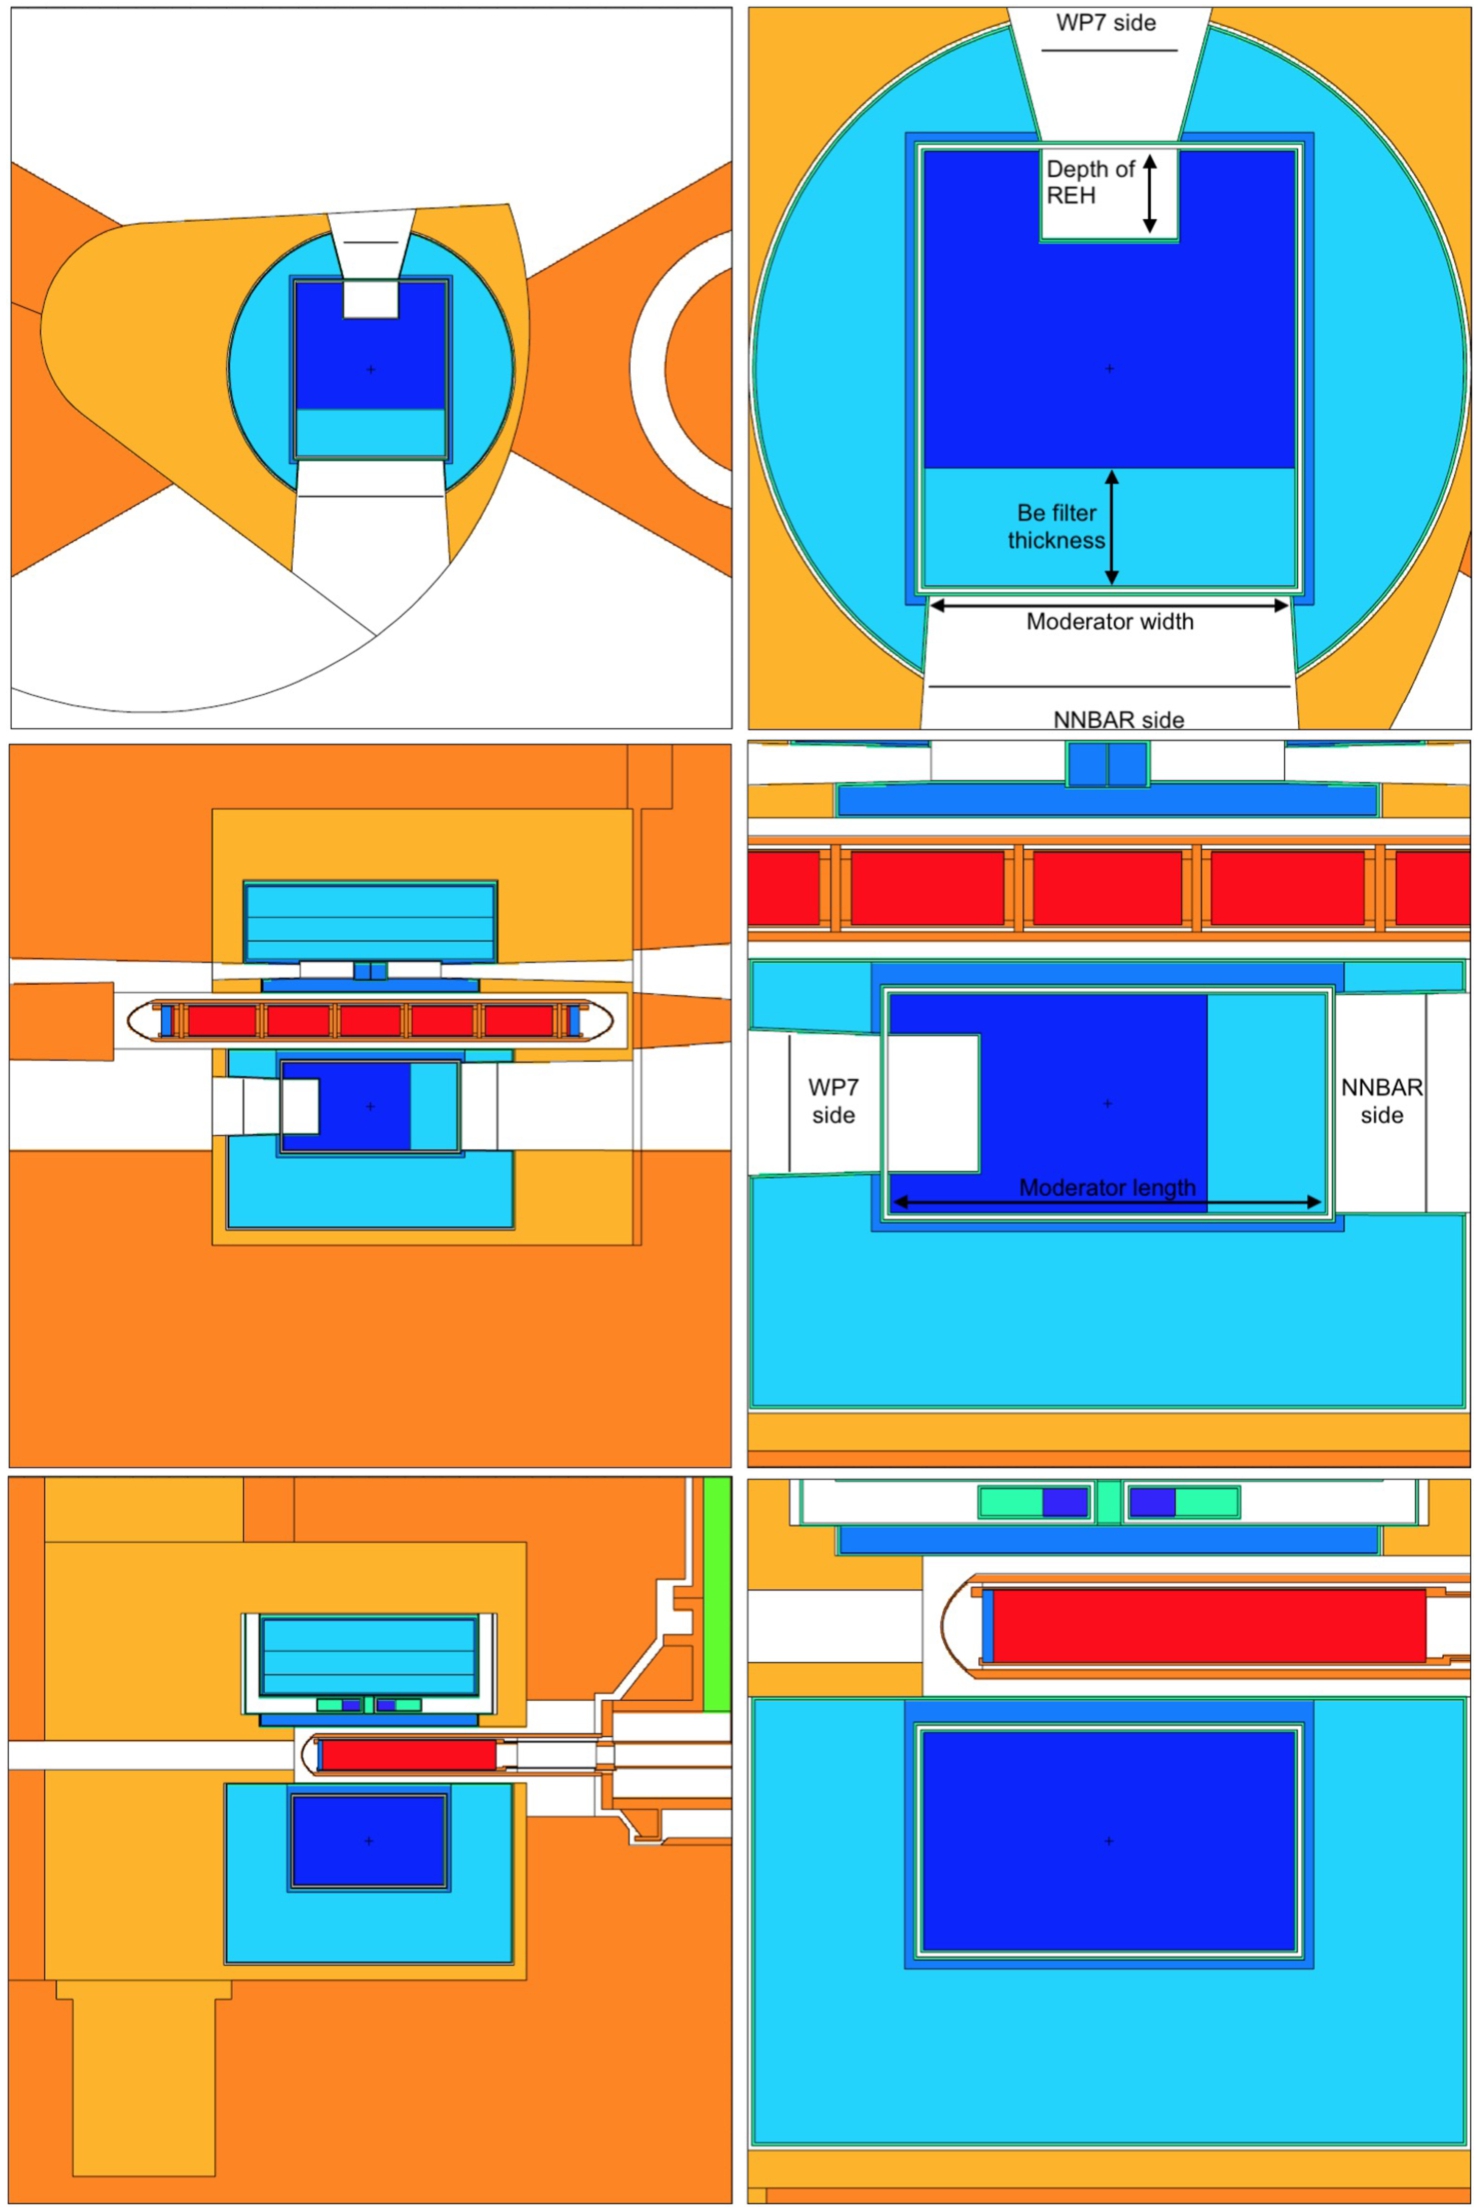
Fig. 22.
Third iteration of optimization: each point represents the gain in FoMs for NNBAR and WP7 with a given set of parameters with respect to the baseline model obtained in the second iteration. The Pareto front was fitted through points closest to Utopia point, an idealized point with highest possible NNBAR and WP7 gains. The aim was to select a model that lies as close as possible to the Utopia point. The moderator volume was calculated as the sum of volume of LD2 box and Be filter. The red circles depict models after applying the limits on moderator parameters.
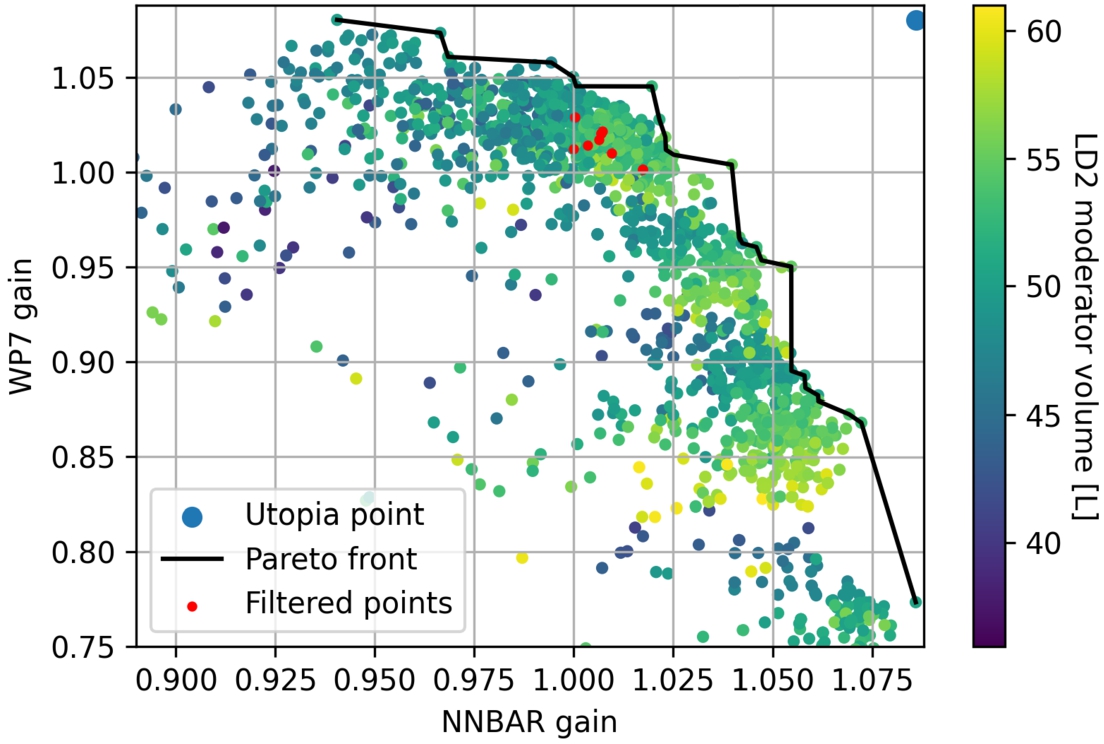
Fig. 23.
Performance of models with respect to moderator length. (A) gain in NNBAR and WP7 FOMs with respect to the baseline model. (B) average gain in NNBAR and WP7 FOM with respect to the baseline model.
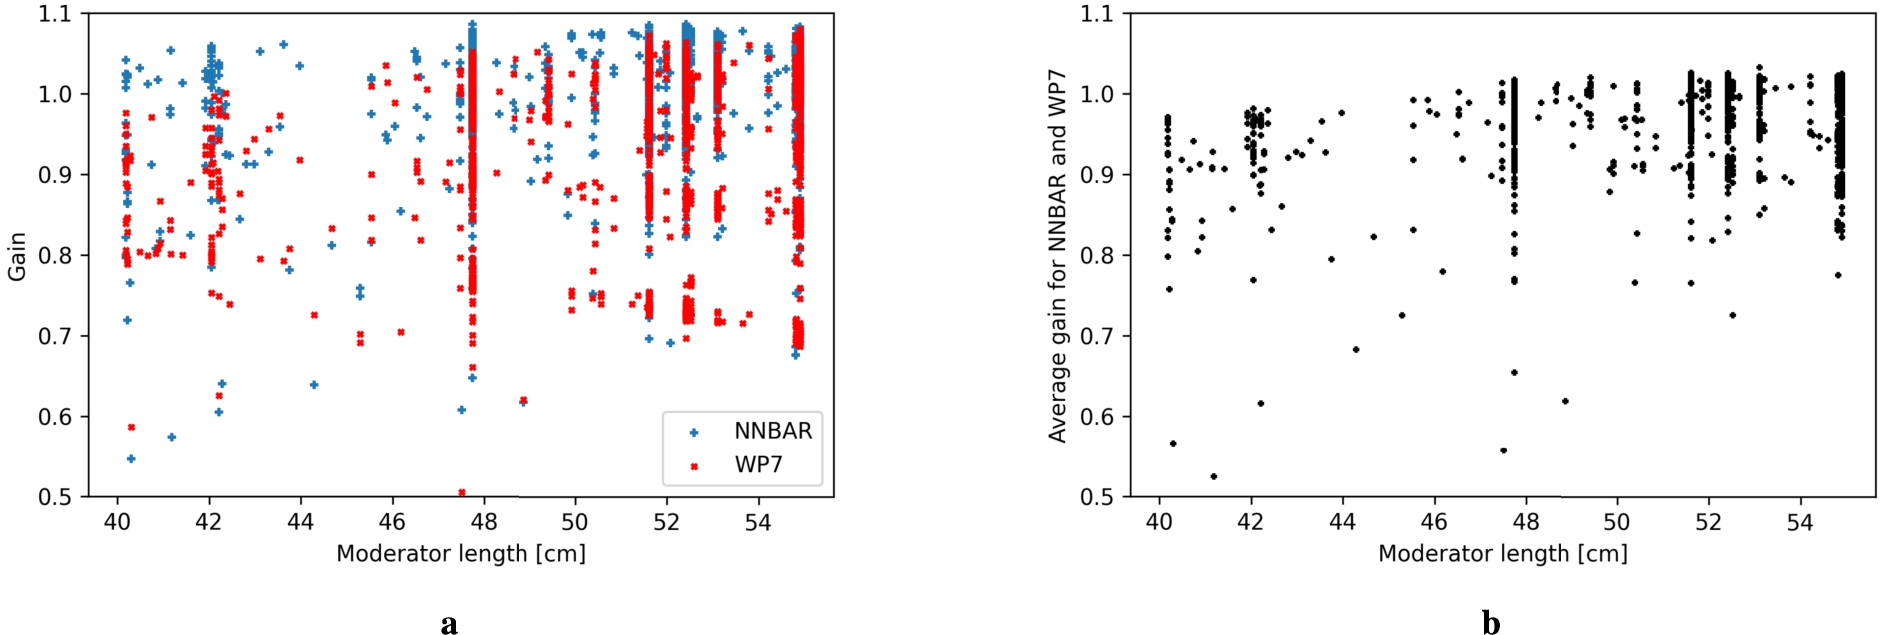
Fig. 24.
Performance of models with respect to moderator width. (A) gain in NNBAR and WP7 FOM with respect to the baseline model. (B) average gain in NNBAR and WP7 FOM with respect to the baseline model.
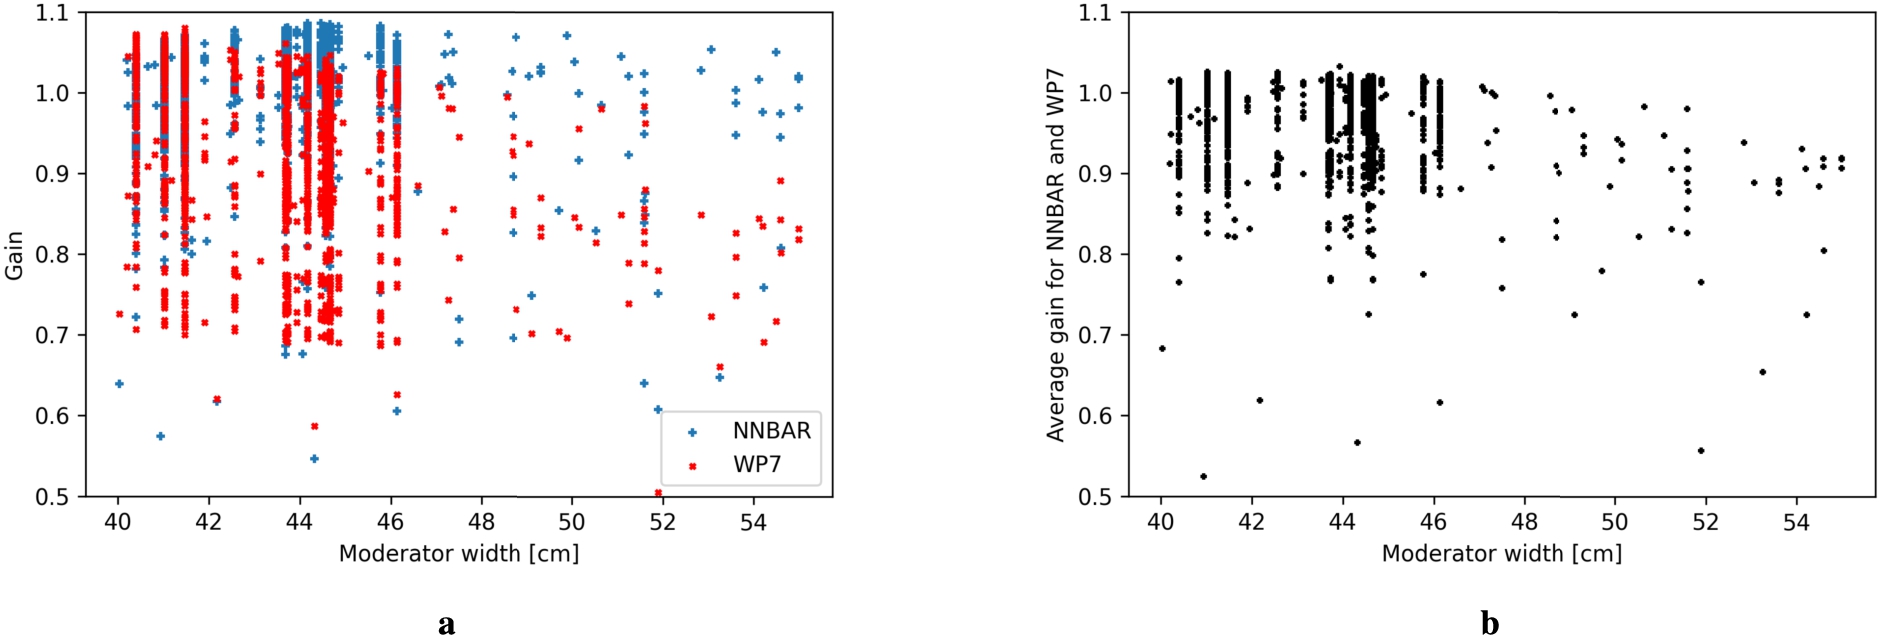
Fig. 25.
Performance of models with respect to Be filter thickness. (A) gain in NNBAR and WP7 FOM with respect to the baseline model. (B) average gain in NNBAR and WP7 FOM with respect to the baseline model.
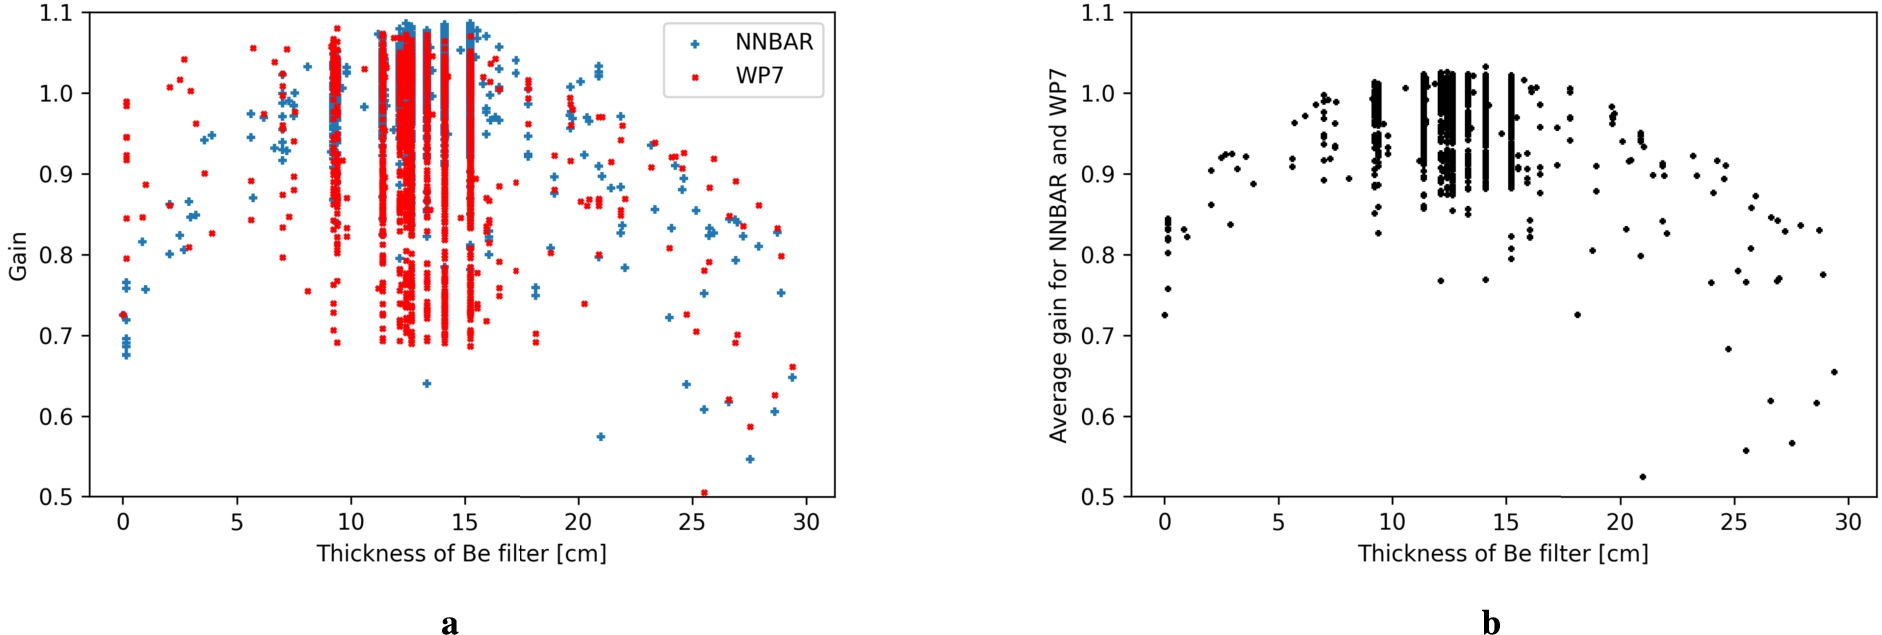
Fig. 26.
Performance of models with respect to the reentrant-hole depth. (A) gain in NNBAR and WP7 FOM with respect to the baseline model. (B) average gain in NNBAR and WP7 FOM with respect to the baseline model.
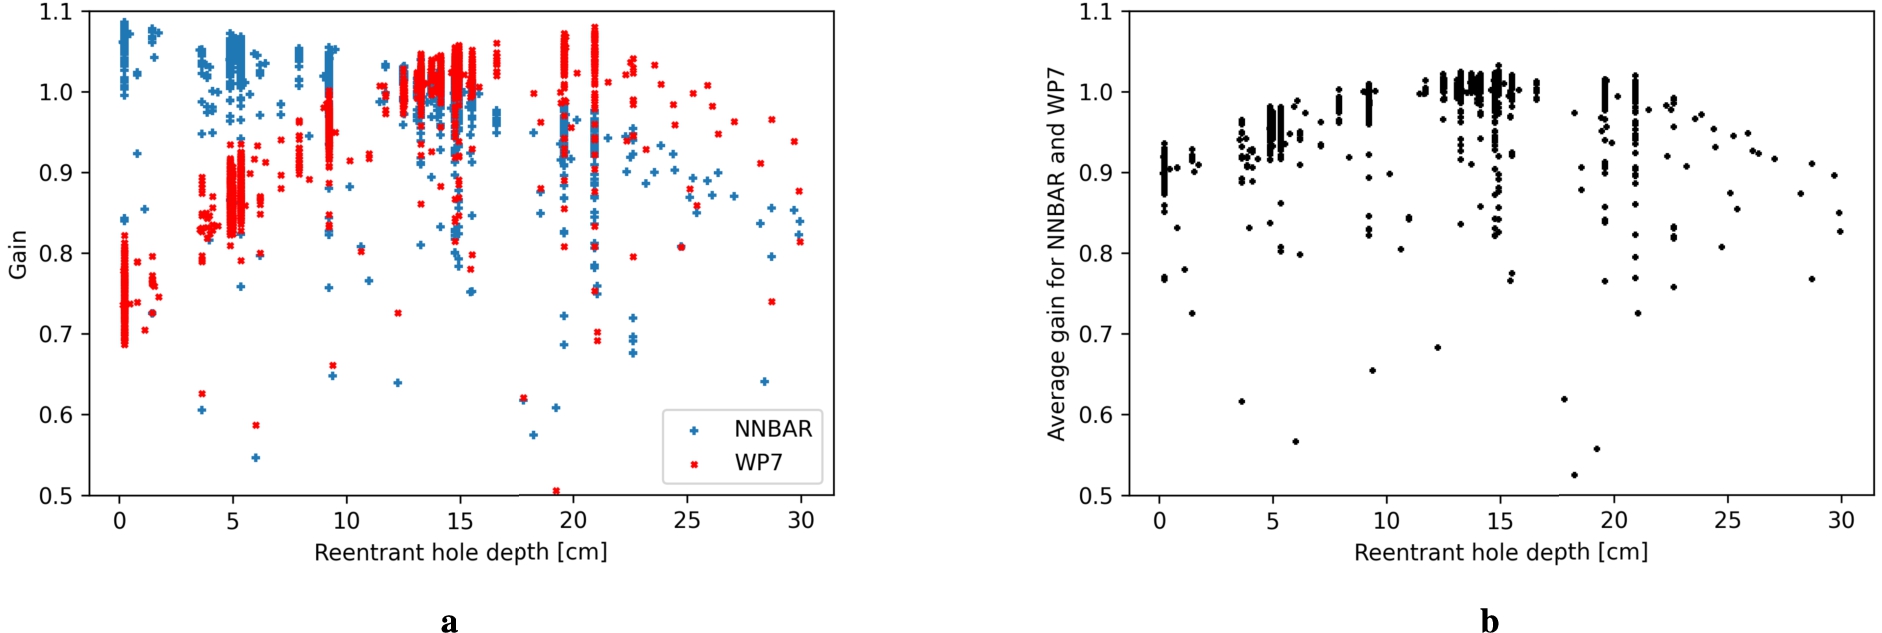
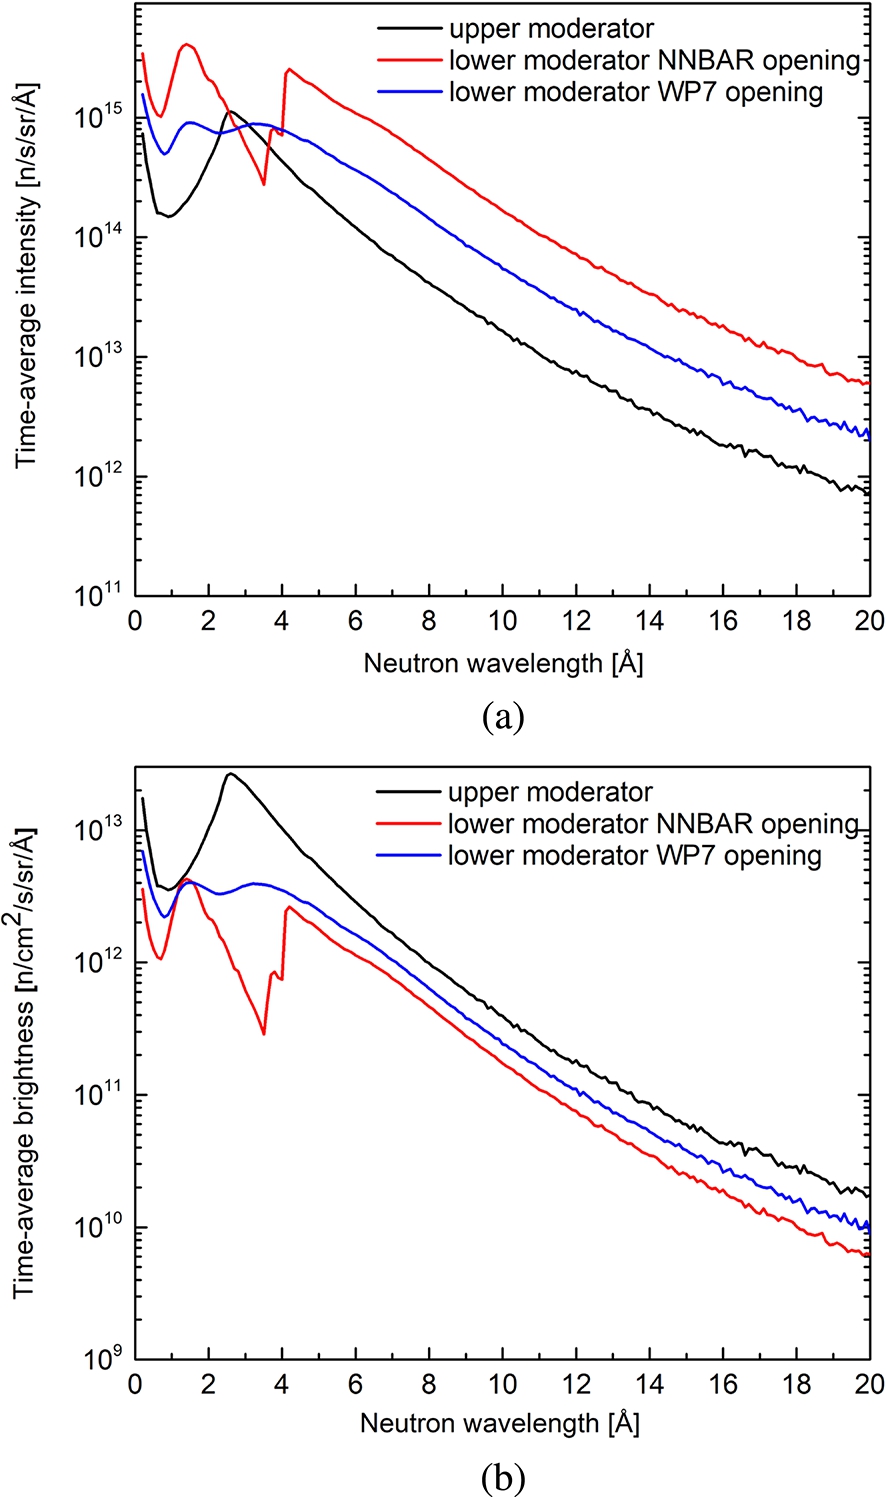
Fig. 27.
Comparison of neutron spectra for the lower and upper moderators for the third iteration of optimisation. (A) time-averaged intensity. (B) time-averaged brightness.
A smaller subset of solutions was filtered out based on these limits (represented as red circles in Fig. 22). The goal was to select a solution that is close to the Utopia point, and which also minimizes the moderator volume in order to reduce heatload. In the end, this combination of parameters was selected for the LD2 moderator:
- Moderator length = 48 cm;
- Moderator width = 41 cm;
- Be filter thickness = 13 cm;
- Reentrant hole depth = 10 cm.
The volume of LD2 in the moderator is 32.2 l. For reference, we can also compare the intensity of the lower cold moderator from this neutronic optimization with the model of the upper moderator. The upper moderator has a higher brightness; however, because of the smaller size, its intensity is lower. This can be seen in Fig. 27(a) and (b) which show the time-averaged brightness and intensity respectively for the thermal and cold neutrons measured at the NNBAR and WP7 openings including the time-averaged brightness and intensity calculated for the upper moderator. For the upper moderator, the size of the emission window depends on the angle of extraction: at the NNBAR location, an emission window with a surface of about 42 cm2 would be available,22 and this give an intensity of the upper moderator above 4 Å of 7 × 10¹⁴ n/s/sr (i.e. 10 times lower than for the NNBAR opening of the lower moderator).
After completion of the third iteration of optimisation, the model of the cold moderator was delivered to the engineering team, WP5, where a thorough engineering study was conducted.
A summary of the expected performances, integrated in different wavelength ranges, is shown in Table 6. There is a decrease in NNBAR and WP7 FOMs in comparison to the model from the second iteration of neutronic optimisation (see Table 5) due to the increase in temperature of LD2 from 20 K to 22 K and the presence of 2.5 vol% Al in LD2.
Table 6
Neutronic performance and characteristics of the model from third iteration of cold moderator. Brightness and intensity integrated over different wavelength ranges (NNBAR and WP7 openings) and compared with the upper moderator. The values for the upper moderator are from [222]. To calculate the intensity we considered the following size of emission windows: NNBAR – 960 cm2; WP7 – 225 cm2; upper moderator – 42 cm2. The moderator volume is the sum of volume of the LD2 box and Be filter
| Brightness [n/cm2/s/sr] | |||
| >2 Å | >4 Å | >10 Å | |
| NNBAR | |||
| WP7 | |||
| Upper moderator | |||
| Intensity [n/s/sr] | |||
| >2 Å | >4 Å | >10 Å | |
| NNBAR | |||
| WP7 | |||
| Upper moderator | |||
| NNBAR FOM | |||
| WP7 FOM | |||
| Heatload on LD2 moderator | 28.5 [kW] | ||
| Heatload on Be filter | 19.5 [kW] | ||
| Heatload on Al vessel | 7.3 [kW] | ||
| Total heatload | 55.3 [kW] | ||
| Moderator volume | 45.0 [liters] | ||
2.3.7.Effect of Be filter and reentrant hole
A quantification of the effect of the Be filter and reentrant hole on the neutronic performance was done in the third iteration of optimisation. Figure 25a clearly shows that the NNBAR side benefits from the presence of the Be filter. The gain in the NNBAR FOM observed when comparing the case with no Be filter (Be filter thickness = 0 cm) and the cases with Be filters having thicknesses between about 10 and 15 cm is about 30%. Similarly, the WP7 side benefits from the presence of a reentrant hole (see Fig. 26a). In this case, the WP7 FOM increases by about 20% for reentrant holes with depths between about 10 and 15 cm.
2.3.8.Shape of the reentrant hole
The development of the cold moderator continued with a study of the impact of different shapes of reentrant holes. More specifically, the initially rectangular shaped reentrant hole was replaced by, for example, a wedge-shaped reentrant hole with variable depth (see Fig. 28). Subsequently, the neutronic performance on the WP7 side was estimated with this shape of reentrant hole for the beamport S11 (“S” stands for South Sector, and “11” refers to the number of the beamport; it is the beamport perpendicular to both the incoming proton beam and the emission surface of the moderator at the WP7 side) and the beamport S9 with an offset of 12° with respect to S11 (see Fig. 29 for a depiction of the beamport positions). The calculated values of the WP7 FOM at various reentrant hole depths are shown in Fig. 30. The maximal gain with respect to the rectangular reentrant hole at the S9 beamport was of about 5%, but with a penalty to the WP7 FOM for the S11 beamport of about 3%. Other shapes of reentrant holes were investigated, but with a consistent result that the gain for the off-axis beamport S9 was only marginal with a small loss for the on-axis S11 beamport at the same time. Therefore, the shape of the reentrant hole was kept rectangular in this round of optimization.
Fig. 28.
Model of the wedge-shaped reentrant hole. (A) horizontal view. (B) vertical view.
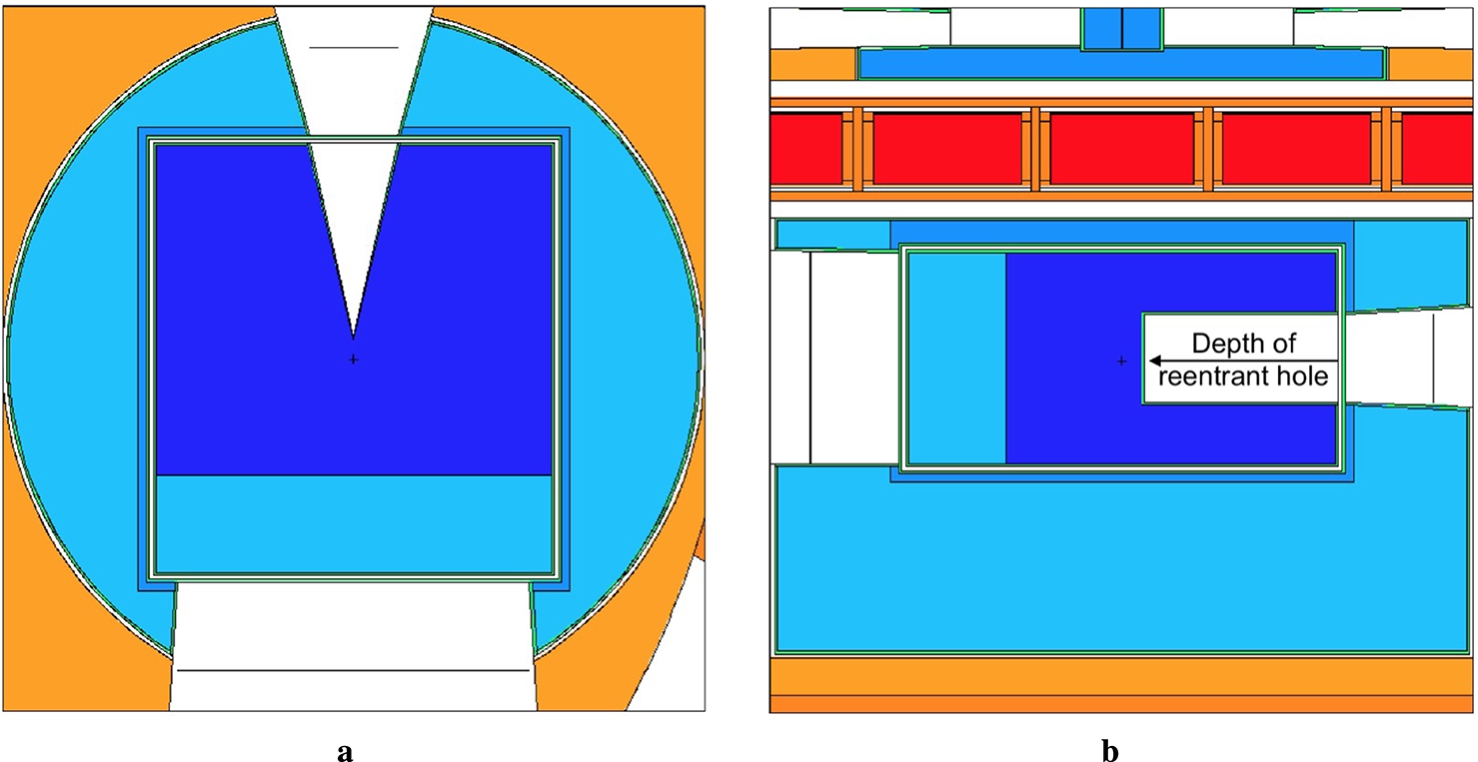
Fig. 29.
Horizontal view of the wedge-shaped reentrant hole, the on-axis S11 beamport, and the off-axis S9 beamport.
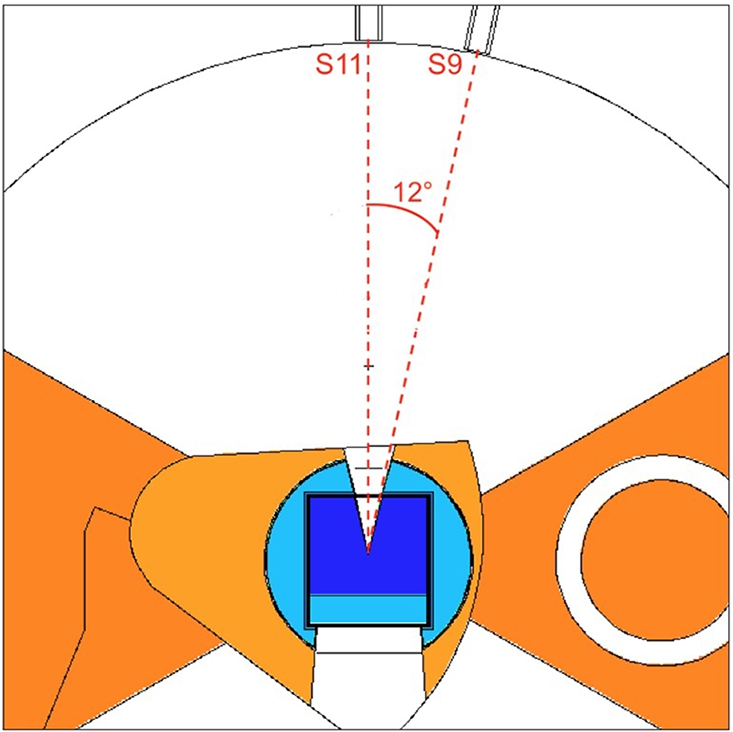
Fig. 30.
Performance of a wedge-shaped reentrant hole at different depths.
2.3.9.Moderator characterization
The model of the cold moderator from the second neutronic iteration was used to perform a comprehensive moderator characterization. Given the similarity of the designs from the different iterations, the results presented in this section also apply to the design from the third iteration.
Intensity spectra from the two moderator openings are shown in Fig. 31. Spectra are shown for two proton energies of 2 GeV and 800 MeV, which for an average current of 2.5 mA correspond to operation at average power of 5 MW and 2 MW, respectively. For both openings, intensity spectra per unit power are almost equivalent, indicating that the results presented in most of this work, which are for 5 MW average power, can be directly scaled to the 2 MW average power (the initial operating power of ESS) dividing by a factor of 2.5.
Fig. 31.
Spectra comparison between the NNBAR and the neutron scattering instrument (WP7) sides of the LD2 using MOGA optimization for protons impinging on the target at 2 GeV and 800 MeV, per unit power.
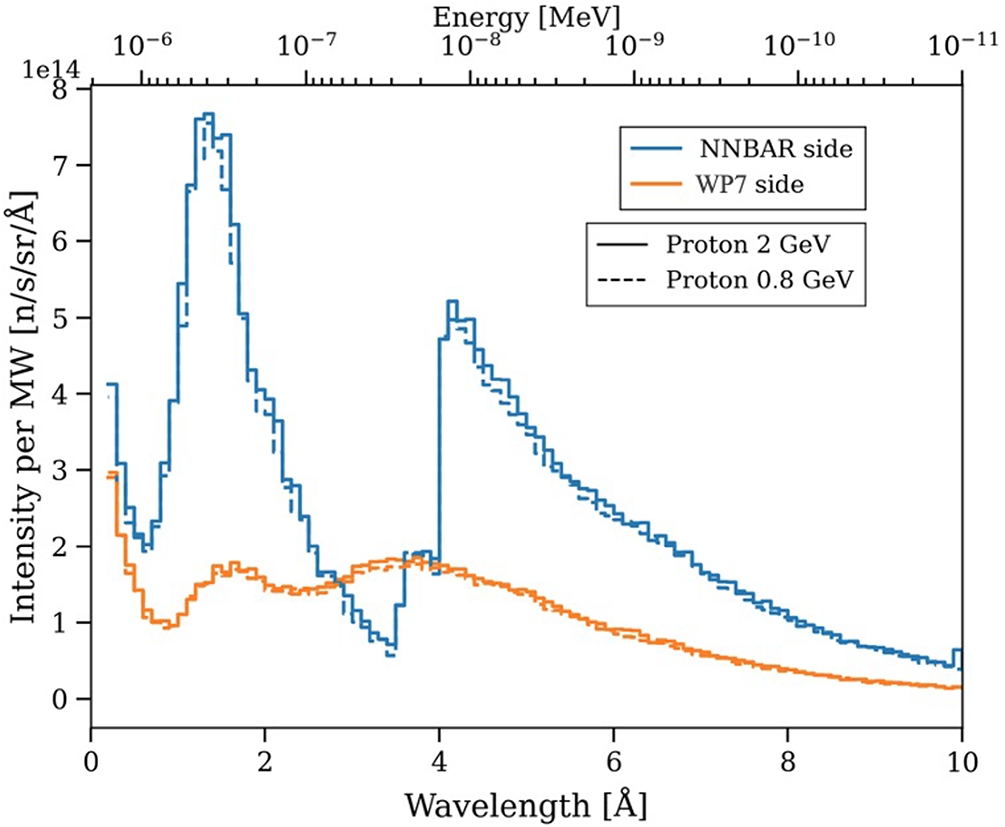
The main feature of the spectral brightness distribution on the NNBAR side is the very sharp cut-off at 4 Å due to the Be filter. The enhanced peak between 1 Å and 2 Å is a feature introduced by the filter. A smoother spectral distribution is observed on the neutron scattering instruments (WP7) opening with the thermal and cold peaks clearly visible.
The spatial distribution of neutrons coming out of the surface of the moderator was studied with a pinhole-camera tally integrated in MCNP. The pinholes are placed 2 m away from the center of the moderator along the central axis for both openings, while the detector arrays are 2 m away from the pinholes on the same axis and have dimensions of 50 cm × 50 cm and 30 cm × 30 cm for the NNBAR and WP7 sides, respectively. The results are shown in Fig. 32 (NNBAR on the left and WP7 on the right) for three wavelength ranges:
Fig. 32.
Pinhole images of the 24 cm × 40 cm NNBAR opening (left) and the 15 cm × 15 cm WP7 opening (right) with filters for neutrons at different energies. The pinholes are placed 2 m away from the center of the moderator along the central axis, while the detector arrays are 2 m away from the pinholes on the same axis and with the dimensions 50 cm × 50 cm and 30 cm × 30 cm for NNBAR and WP7, respectively. The pictures have the same scale and appear inverted along the vertical direction due to the camera obscura effect.
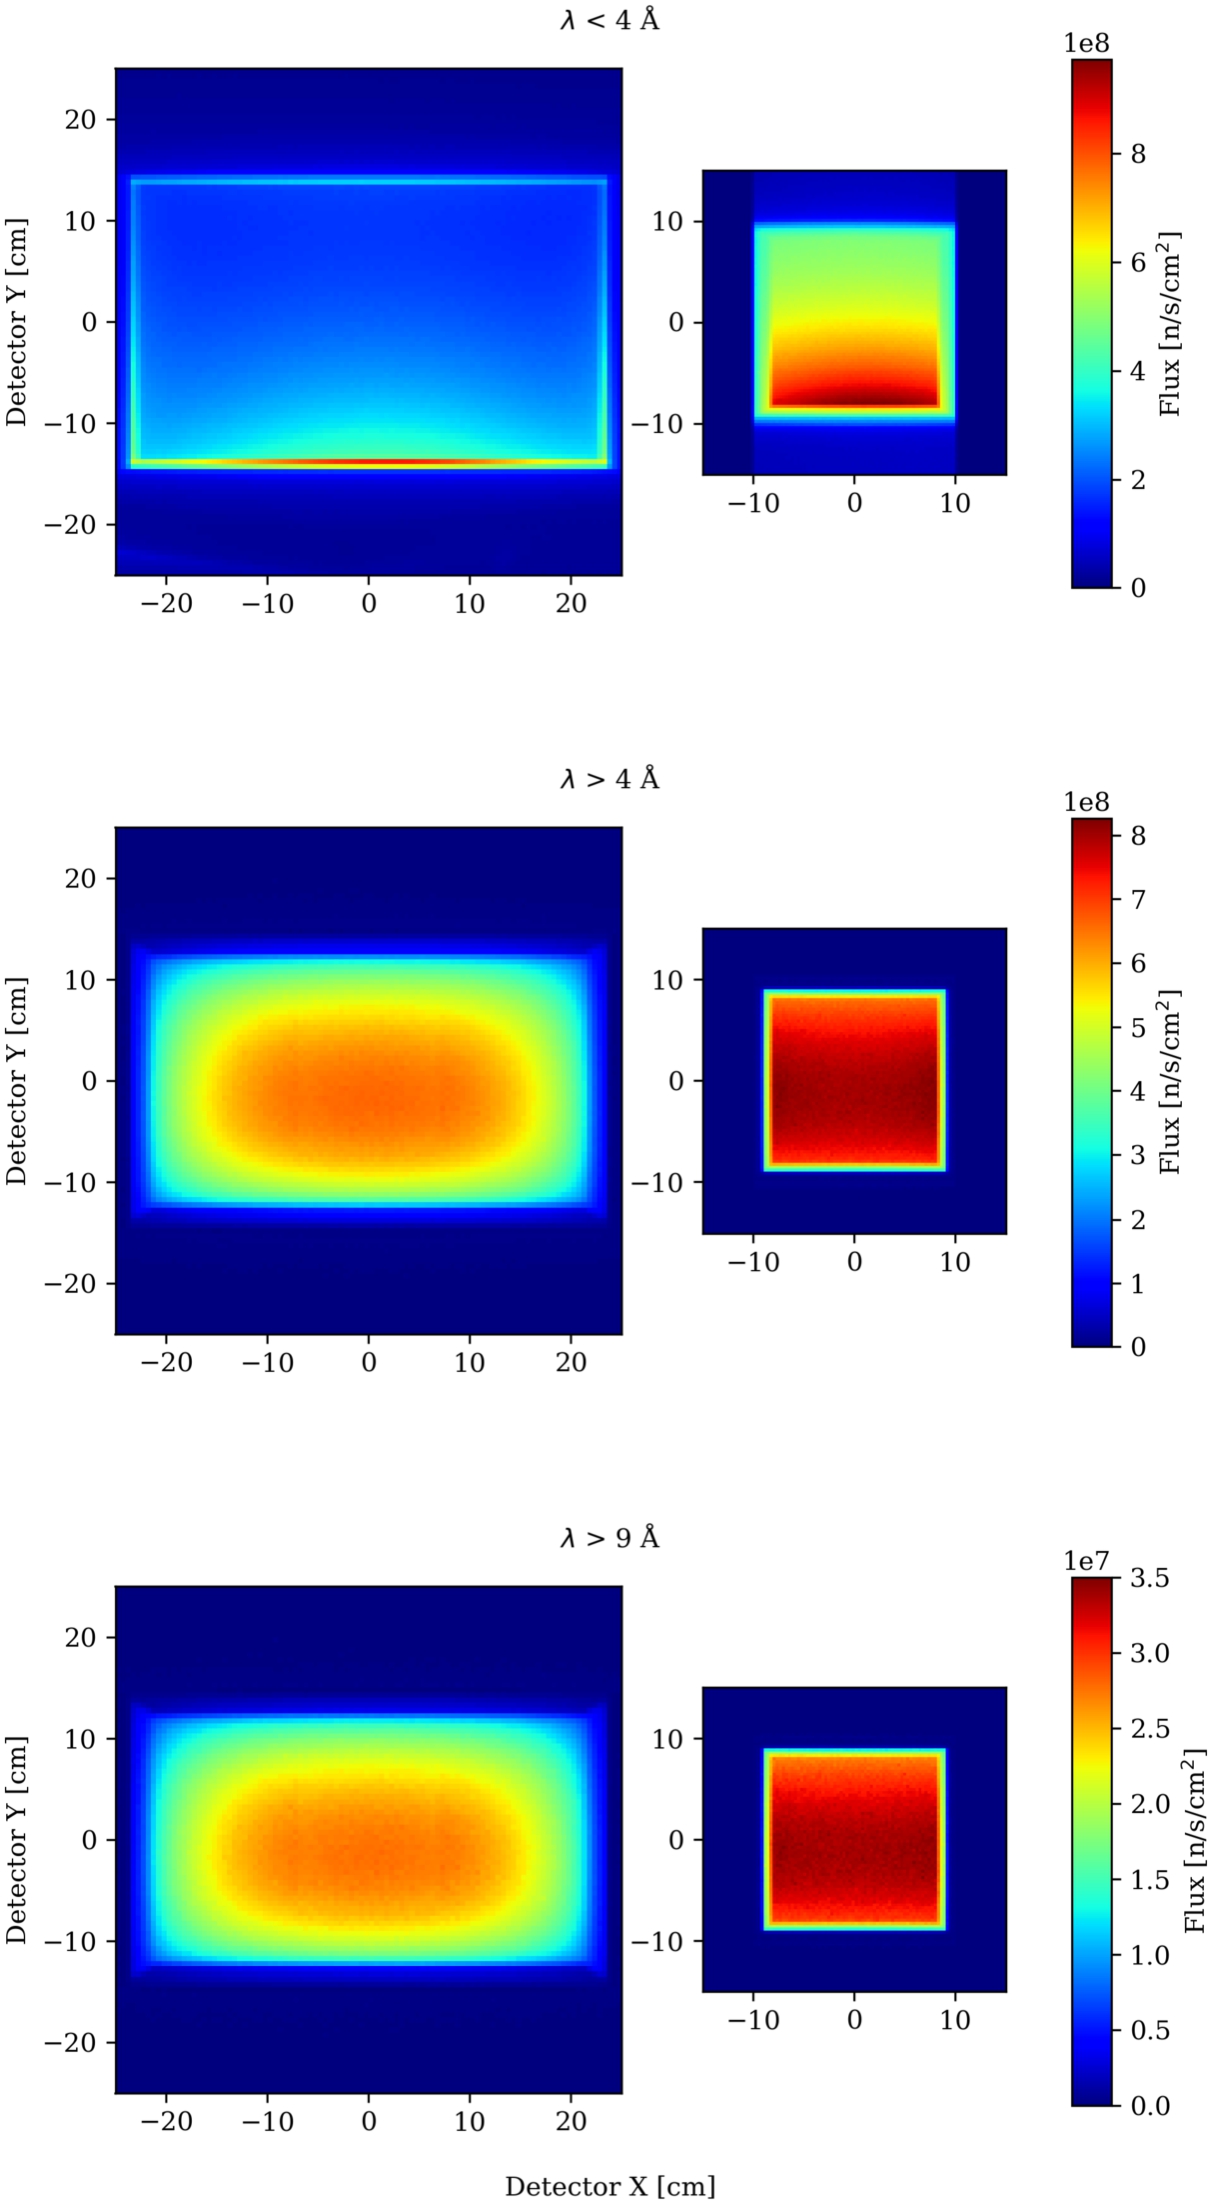
The distribution of the neutrons is quite different between the two openings. The bigger NNBAR opening has a non-uniform profile along both axes, with a central hot-spot slightly off-centered toward the top of the moderator (the pinhole images appear inverted in the vertical direction). The smaller opening for the neutron scattering instruments is a more uniform source. Although the integrated intensity is higher on the NNBAR side, the effective contribution of the neutrons from the corners is quite limited due to current optics design [206]. In any case, the advantage of having such a large opening in the moderator has been established, but further improvement can be made to increase the intensity farther from the center.
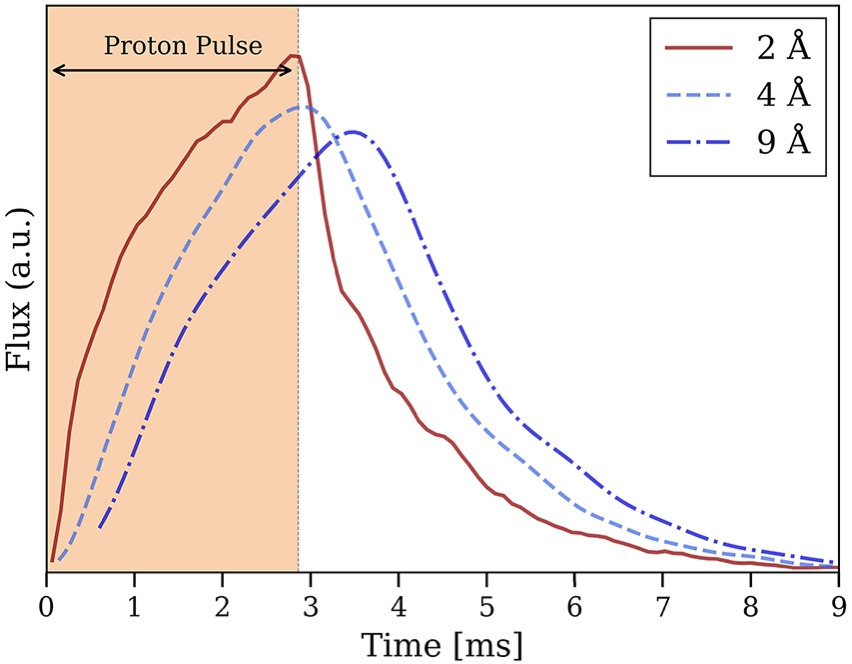
Finally, in Fig. 33 the pulse shape of the neutrons coming out of the moderator at 2 Å, 4 Å, and 9 Å is presented. The curves were obtained by recording the neutrons leaving the moderator by crossing the surface on the NNBAR side through a SSW card [78]. The neutrons were then filtered in energy using the Monte Carlo Particle Lists (MCPL) interface [104] and binned in elapsed time in ms. The histograms were normalized in order to be comparable and smoothed with Gaussian kernel density estimation. The pulse width is significantly broader than the proton pulse (2.86 ms). This is due to the slow LD2 thermalization time and will likely impact neutron scattering experiments. In particular, the use of choppers in conventional neutron scattering experiments will certainly lead to a reduction in peak fluxes. On the other hand, for NNBAR there is no foreseen impact since the quantity of interest is the time-averaged flux.
Fig. 33.
Pulse spectra of neutrons from the moderator at 2, 4, and 9 Å wavelength. The proton beam impinging on the target lasts 2.86 ms, indicated by the shaded region on the left. Histograms are normalized to probability density functions (a.u.) for comparison. The smoothed curves are obtained with Gaussian kernel density estimation.
2.3.10.Effects of engineering design on neutronic performance
An engineering design was made based on the optimized neutronic model (see Section 3). In this section, the impact of various engineering solutions on the neutronic performance is analyzed. Two features of the engineering design were found to particularly affect the neutronic performance: first, the large thickness (0.8 cm) of the Al vessel required for the engineering design of a vessel with flat walls; second, the relatively complex design of the Al flow channels, due to the presence of a reentrant hole on the neutron scattering side.
Additionally, on recommendation from the engineering team, the beryllium was placed outside the LD2 vessel. This was done to solve two issues: 1) there is a significant reduction of the heat load which has to be handled by the LD2 flow inside the moderator when the beryllium is not inside; 2) there was an issue with film boiling between beryllium blocks in the thermomechanical simulations when the blocks are inside the LD2.
To simplify the flow structure and to reduce the amount of Al inside the vessel, a change in the shape of the reentrant hole was implemented: the original square-shaped REH was replaced by a U-shaped one of the same width (15 cm) but with the height of the moderator vessel (24 cm).
To quantify the effects of these design changes, a set of tests was performed with the following modifications of the third iteration model, starting from the original optimized model (Fig. 34):
LD2 with Al flow guides modeled explicitly and wall thickness increased from 0.3 cm to 0.8 cm (Fig. 35).
Be filter separated from LD2 moderator (Fig. 36).
U-shaped reentrant hole with a few parameters slightly changed to streamline the model (Fig. 37).
LD2 with Al flow guides modeled explicitly and wall thickness increased from 0.3 cm to 0.4 cm (Fig. 38).
Tapered rectangular REH (Fig. 39).
The conclusions from this analysis are that a thickness of 0.8 cm of Al gives too much neutronic penalty and should be reduced. On the other hand, moving the Be filter outside the Al vessel (and envisaging a separate cooling) and using a simplified U-shaped reentrant hole do not give a large penalty.
Fig. 34.
Original optimized design for the LD2 source.
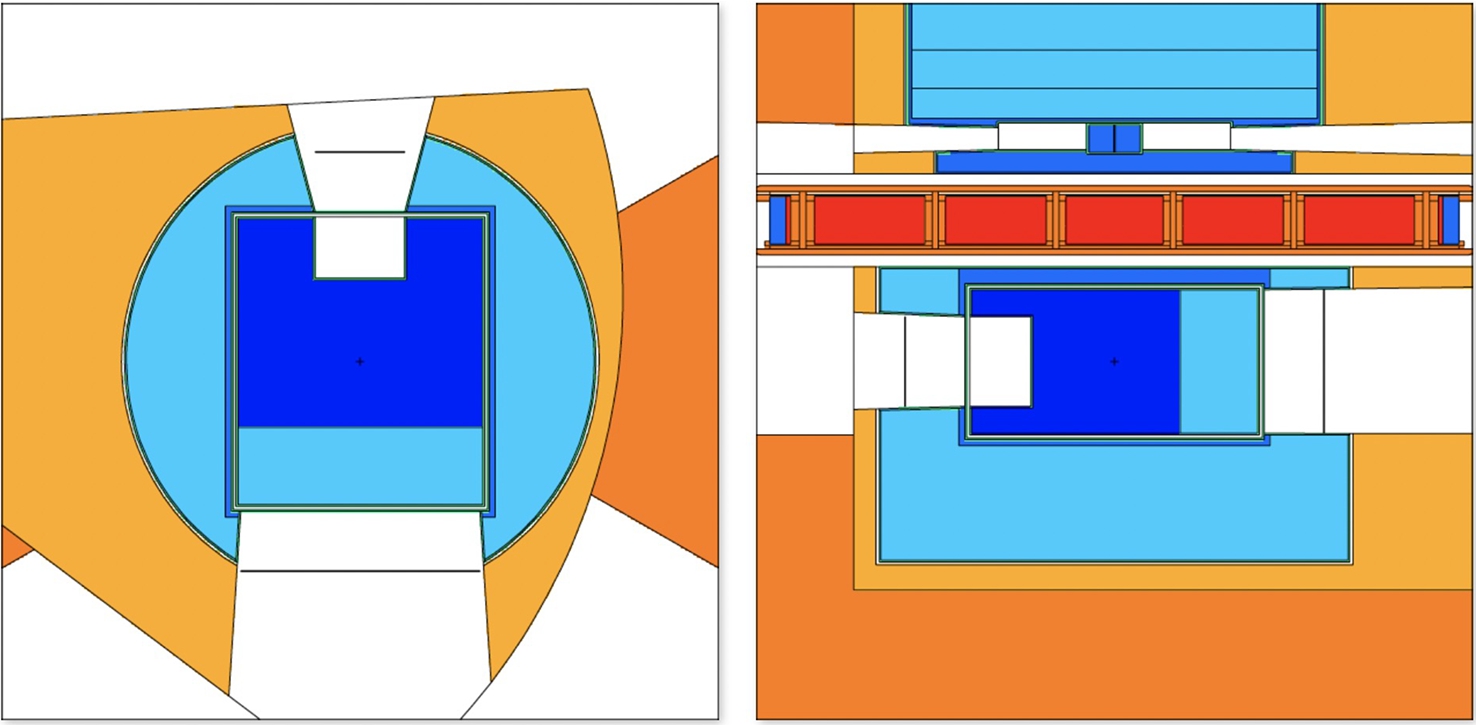
Fig. 35.
As in Fig. 34, but Al flow guides modeled explicitly, while the wall thickness increased from 0.3 cm to 0.8 cm.

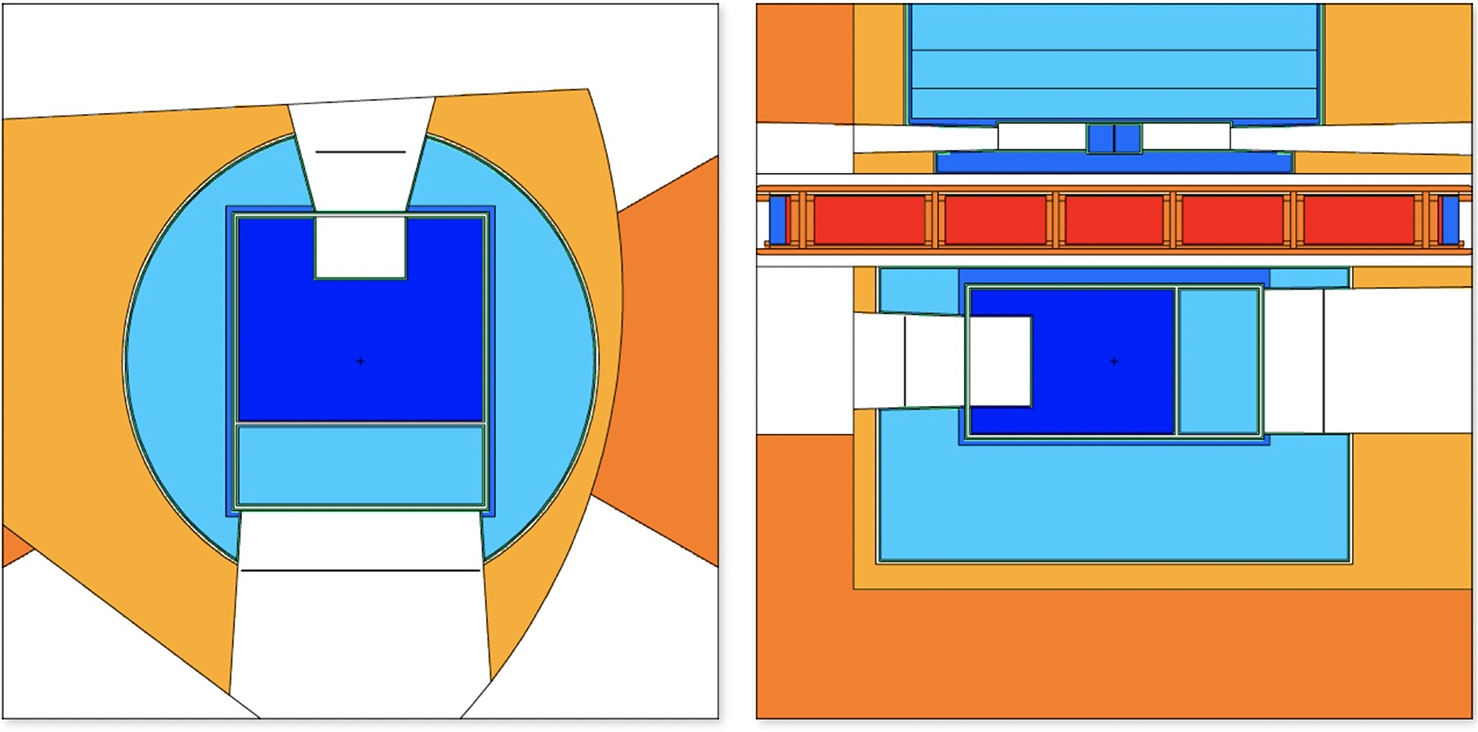
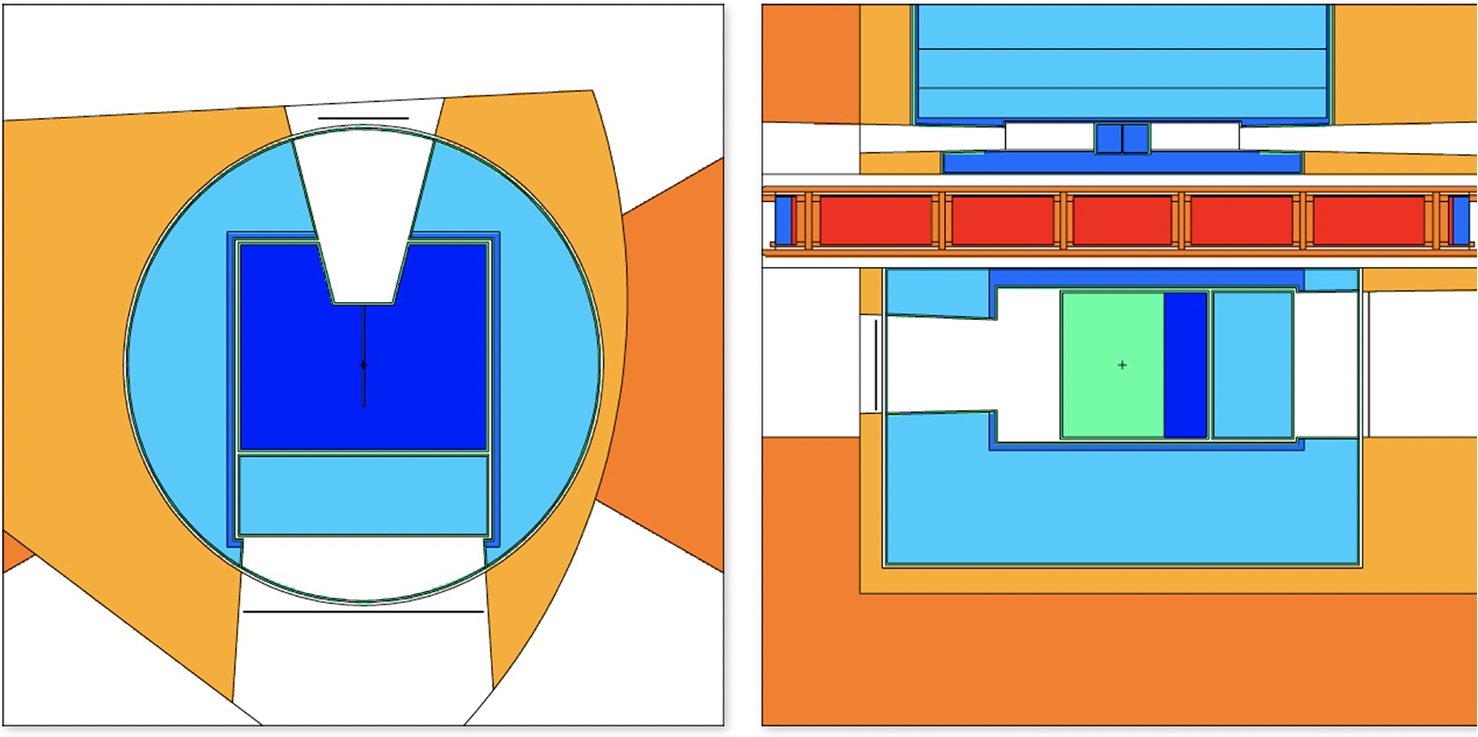
Fig. 37.
As in Fig. 36, but with an alternative reentrant hole shape and a few parameters slightly changed to streamline the model.
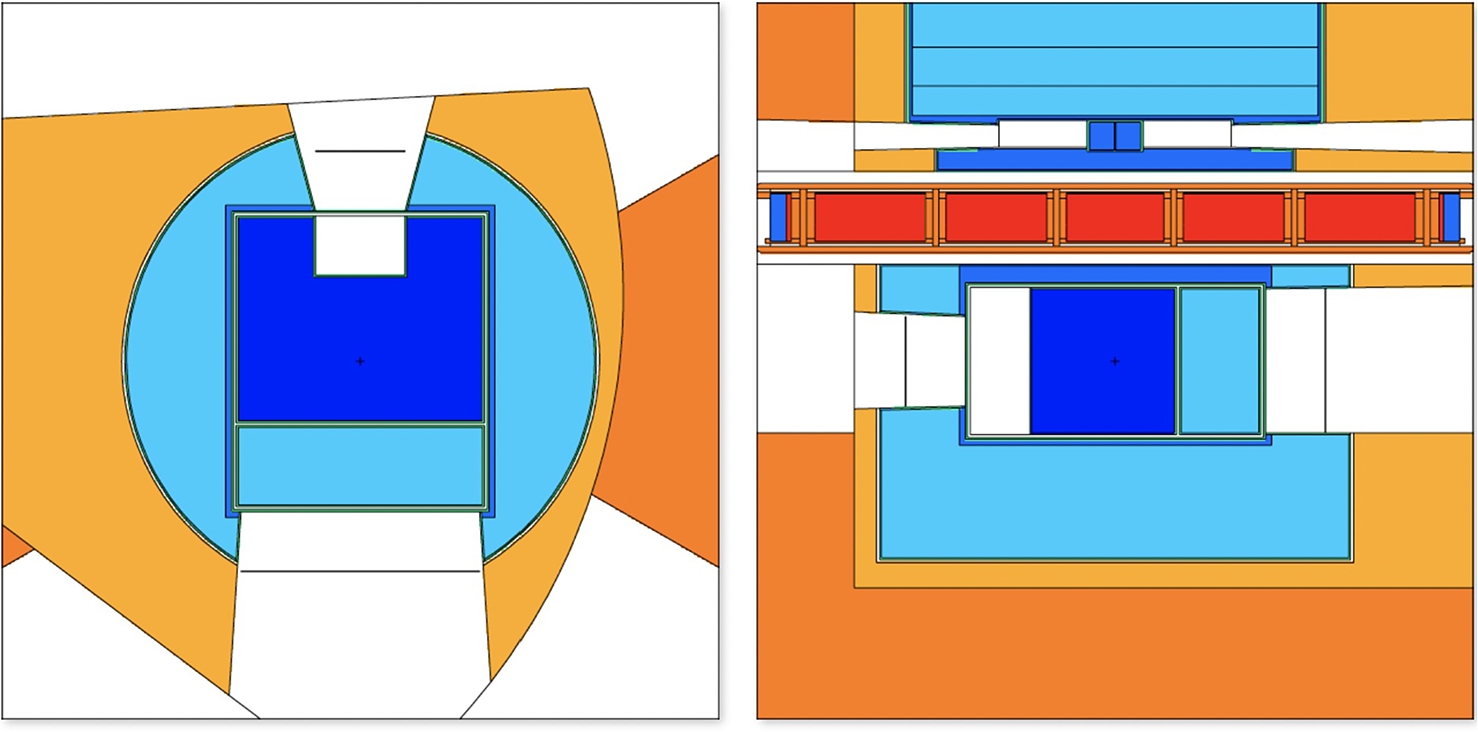
Fig. 38.
As in Fig. 37, but Al flow guides modeled explicitly, while the wall thickness increased from 0.3 cm to 0.4 cm.
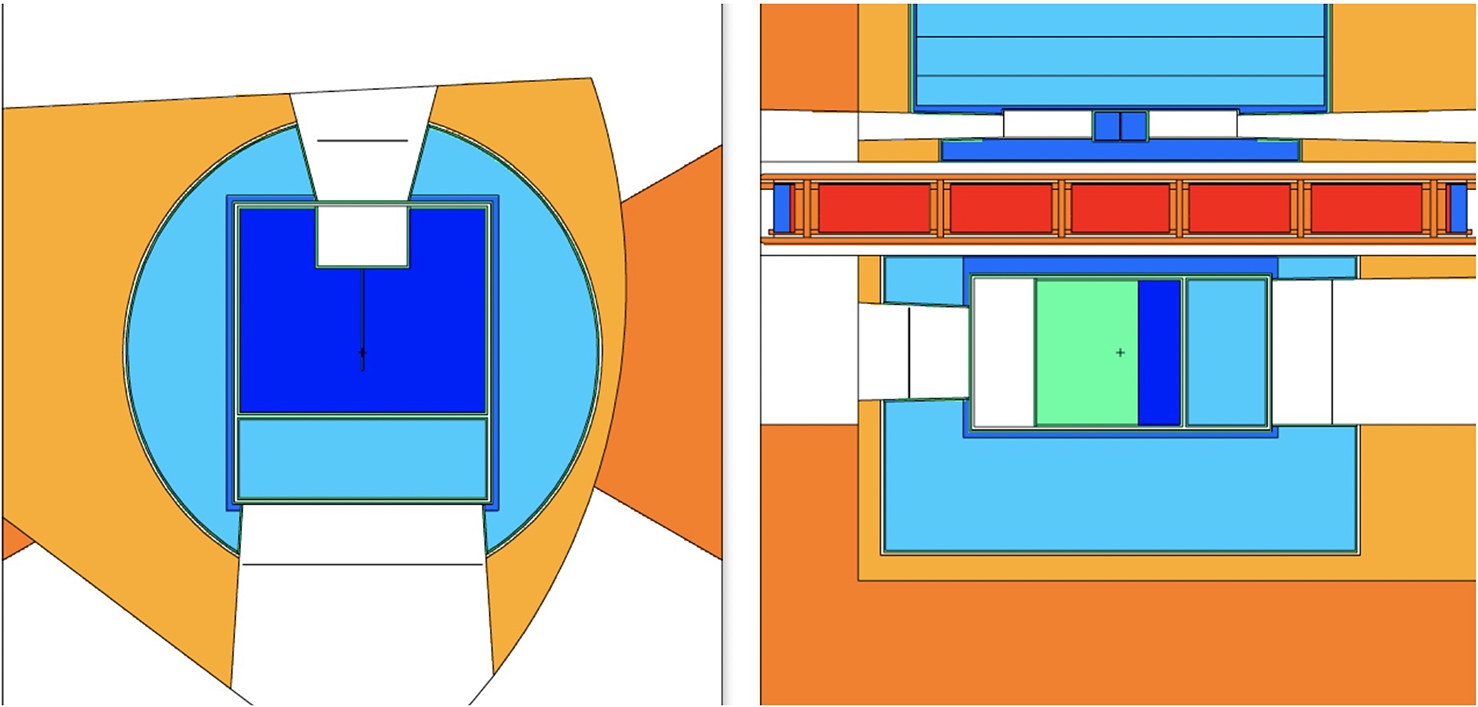
Fig. 39.
As in Fig. 38, but rectangular REH is tapered and the geometry is slightly changed to increase the overall performance.
2.3.11.Rounded shape model
Table 7
Impact of engineering refinements on neutronic performance, normalized to the optimized LD2 baseline
| NNBAR | WP7 | |
| Fig. 34 | 100 | 100 |
| Fig. 35 | 75 | 77 |
| Fig. 36 | 92 | 98 |
| Fig. 37 | 91 | 93 |
| Fig. 38 | 94 | 93 |
| Fig. 39 | 94 | 94 |
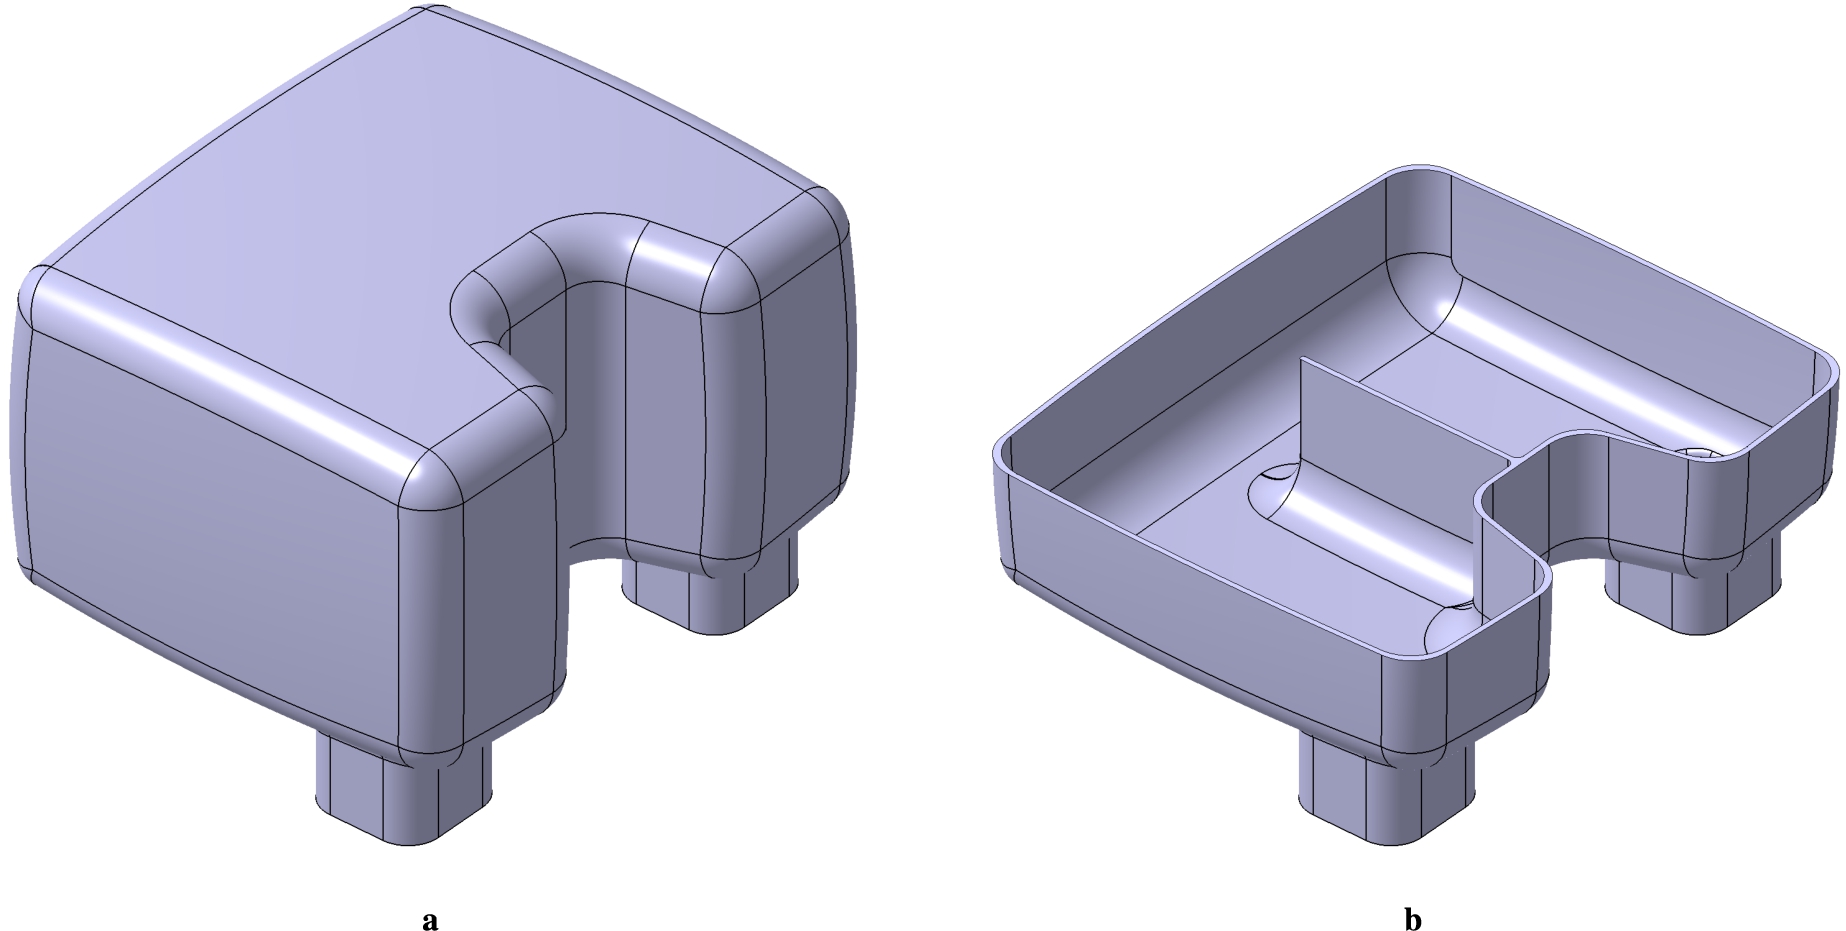
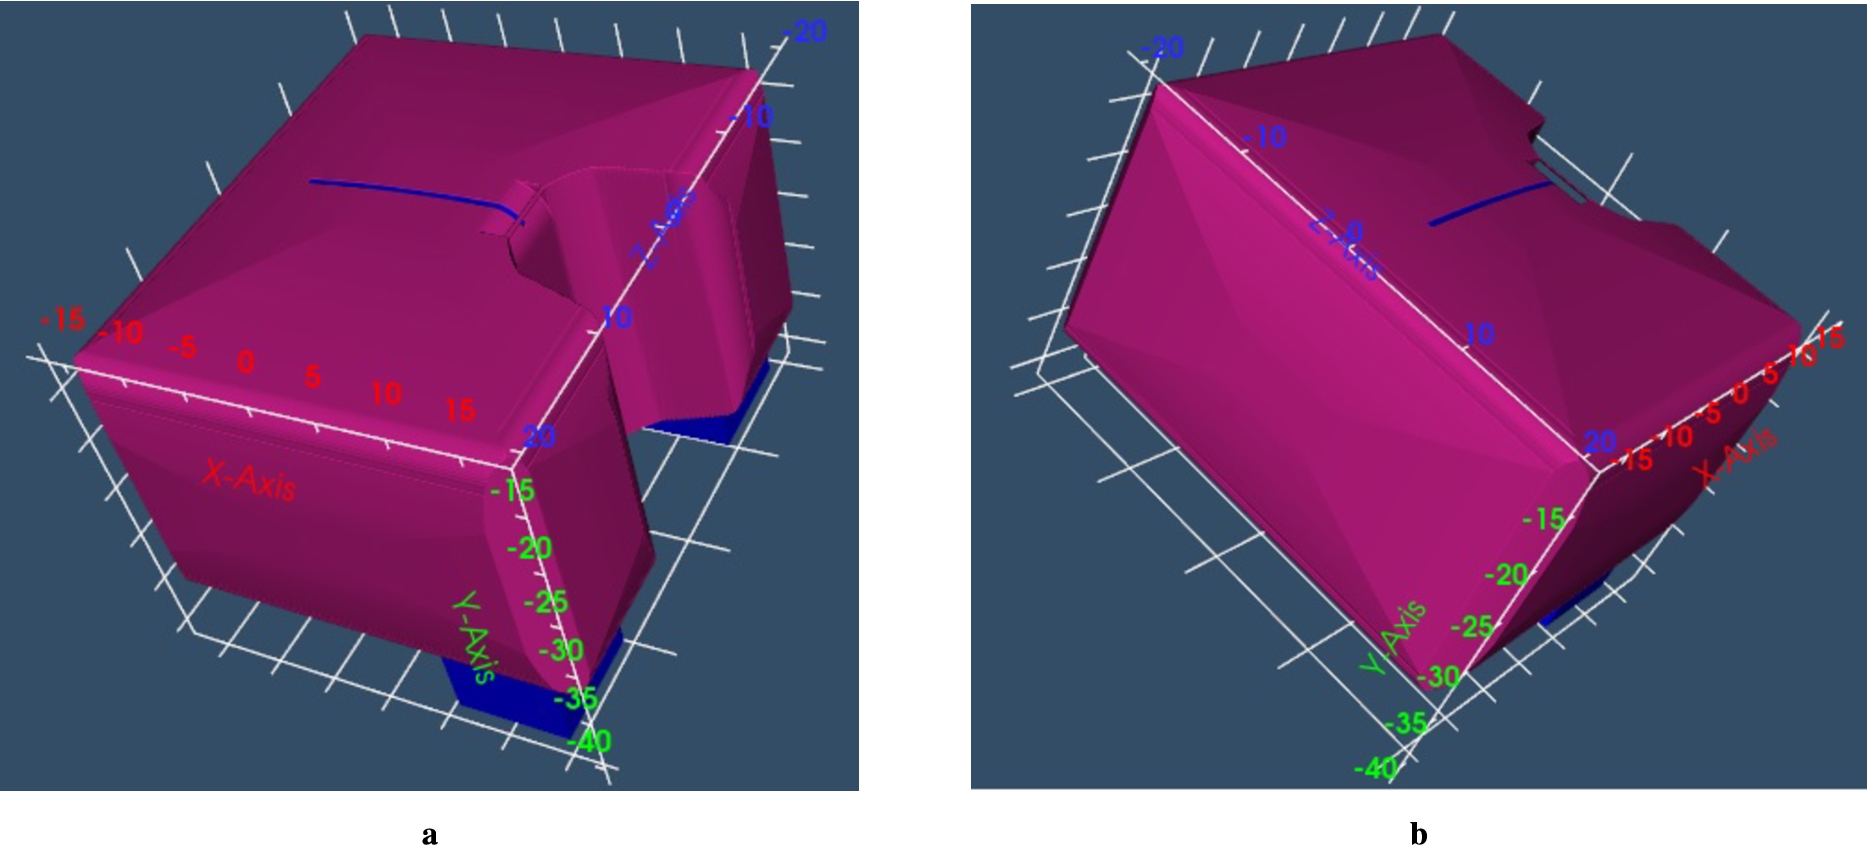
As a final step of the design of the liquid deuterium moderator, we investigated a model with separated LD2 box and Be filter, U-shaped reentrant hole and rounded walls of the LD2 box based on new preliminary engineering studies. As shown in the previous section, a 0.8-cm thick Al vessel and additional Al flow guides would be required for a vessel with flat walls (see model on Fig. 35) leading to a significant drop in NNBAR FOM of about 25 % (see Table 7). To reduce the negative impact on the neutronic performance of the cold moderator, rounded walls were proposed for the moderator. Moreover, as stated in the previous section, the Be filter and LD2 box were separated and the shape of reentrant hole was simplified to an U-shape. This allowed reducing the thickness of the Al vessel to 0.4 cm.
The WP5 team provided a detailed CAD model of the LD2 moderator vessel (Figs 40a and 40b). An MCNP model designed according to this CAD model is shown in Figs 41 and 42.
Fig. 40.
Design of LD2 moderator with rounded shape, developed by the engineering team. (A) full model. (B) horizontal cut.
We note that there was no time available in the project to perform a full engineering study of this option. Nevertheless, we report these results in this document since it should be further investigated in the future. The summary of the expected performances, integrated in different wavelength ranges, is shown in Table 8.
Fig. 41.
Graphical representation of the final design for the LD2 moderator with an U-shaped reentrant hole, separated Be filter and LD2 and rounded walls. The color codes are the following: orange: steel (twister frame, inner shielding, etc); dark blue: liquid ortho-deuterium; blue: light water; light blue: beryllium; green: aluminum. Note that cold Be filters and ambient Be reflector are shown using the same color; the same note applies to Al.
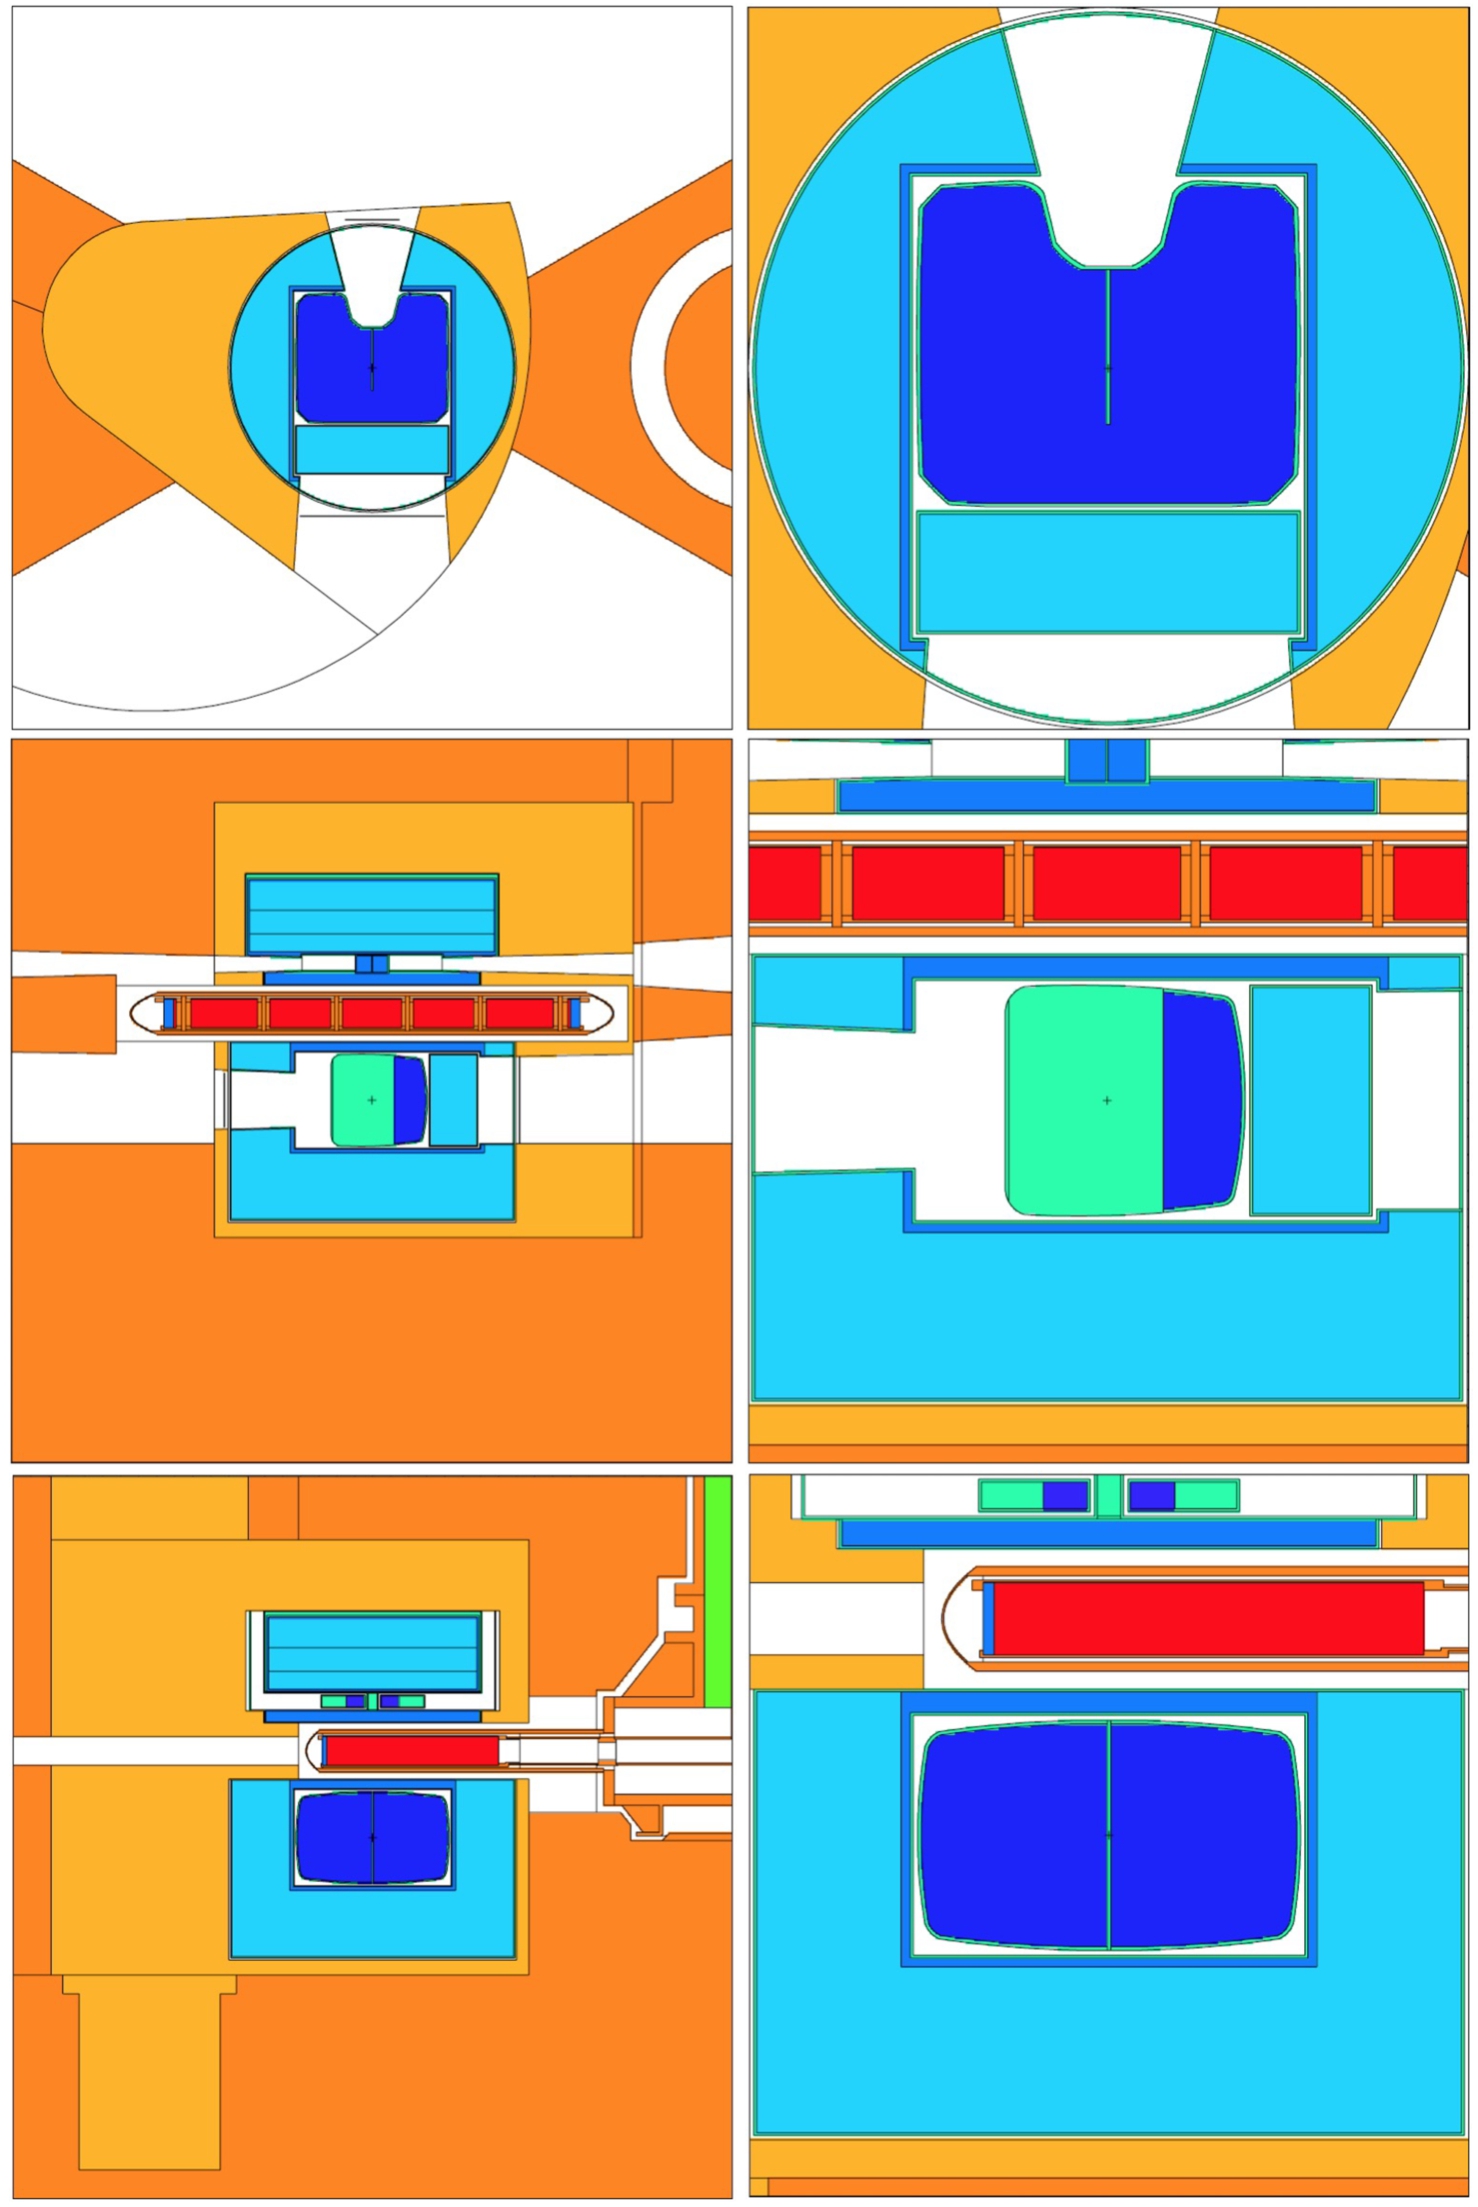
Fig. 42.
MCNP model of the cold moderator with rounded shapes according to the technical drawing from the engineering team. This view shows the outer surface of cold moderator covered by the Al vessel.
2.4.Summary of the cold moderator design
We have successfully designed a cold neutron source with a neutron intensity above 4 Å exceeding the one from the upper moderator by a factor of 10. This accomplishment aligns with one of the primary objectives of HighNESS, which aimed to create a complementary source capable of supporting various experiments where neutron intensity holds greater significance than brightness. This has been achieved using the proven technology of liquid deuterium moderators which are the workhorses at high power research reactors and continuous sources like SINQ.33
Table 8
Neutronic performance and characteristics of the most recent model of the cold moderator based on the preliminary engineering study. Brightness and intensity integrated over different wavelength ranges (NNBAR and WP7 openings) and compared with the upper moderator. The values for the upper moderator are from ref [222]. To calculate the intensity we considered the following size of emission windows: NNBAR – 960 cm2; WP7 – 225 cm2; upper moderator – 42 cm2
| Brightness [n/cm2/s/sr] | |||
| >2 Å | >4 Å | >10 Å | |
| NNBAR | |||
| WP7 | |||
| Upper moderator | |||
| Intensity [n/s/sr] | |||
| >2 Å | >4 Å | >10 Å | |
| NNBAR | |||
| WP7 | |||
| Upper moderator | |||
| NNBAR FOM | |||
| WP7 FOM | |||
| Heatload on LD2 moderator | 25.8 [kW] | ||
| Heatload on Be filter | 16.3 [kW] | ||
| Heatload on Al vessel | 10.5 [kW] | ||
| Total heatload | 52.6 [kW] | ||
The design of the cold moderator has been refined throughout the whole duration of the project, with several iterations with the engineering team. Details on the engineering design are provided in the next section. Although an engineering design of the rounded-shape model has not been performed due to time constraints, there are strong indications that this design could be the best one for the cold source and should be further investigated.
3.Engineering design of the liquid deuterium moderator
The first moderator and reflector system (so called twister I) will have two liquid parahydrogen moderators above the target wheel only. However, there is available space below the target wheel (lower moderator plug), which has been reserved for future moderator upgrades that could be used for a LD2 volume moderator. In the HighNESS project, Work Package 5 (WP5) was in charge of the engineering implementation of new cold moderator concepts. This includes the definition of fluid parameters; cooling process concept design; structural materials choice; detailed CAD design of the advanced moderator concepts for the lower moderator plug including manufacturability verification; weldability analysis; structural-mechanics and fluid-dynamics simulations; and integrability into the ESS facility [171].
From an engineering point of view, the cooling and integration into the existing facility of such a large cryogenic pressure vessel in the high-power spallation source ESS is critical and must be analyzed in combination with the mechanical design [61].
3.1.Introduction
The first generation ESS moderator system consists of two liquid parahydrogen low-dimensional moderators, located above the tungsten target wheel. As mentioned previously, the moderator support structure, the twister, also allows for the use of the space below the target wheel for future moderator upgrades. Figure 43 shows the isometric view of the ESS Target Monolith. The colored components are subjects of the planned upgrades of the ESS Target station [172].
Fig. 43.
ESS target monolith, isometric cutaway view.
The major engineering challenge here is to handle the enormous heat load into the LD2 moderator of around 60 kW resulting from the spallation process of a 5 MW accelerator-driven neutron source. Following the several iterations discussed in the previous section, the following preliminary engineering design of the LD2 moderator was developed. The moderator vessel consists of high-strength Aluminum alloy EN AW-6061 T6, which allows local stresses up to 87 MPa and will be filled with approximately 30 L of liquid deuterium. The cold moderator is surrounded by a vacuum jacket followed by a light water premoderator and a warm beryllium reflector. In addition, one cold beryllium filter (⩽80 K) is installed inside the cold moderator vessel on the NNBAR side serving the large beam port (see Fig. 44 blue block) [171].
Fig. 44.
Pre-design of the LD2 moderator. Engineering design based on the third neutronic iteration (Fig. 21).
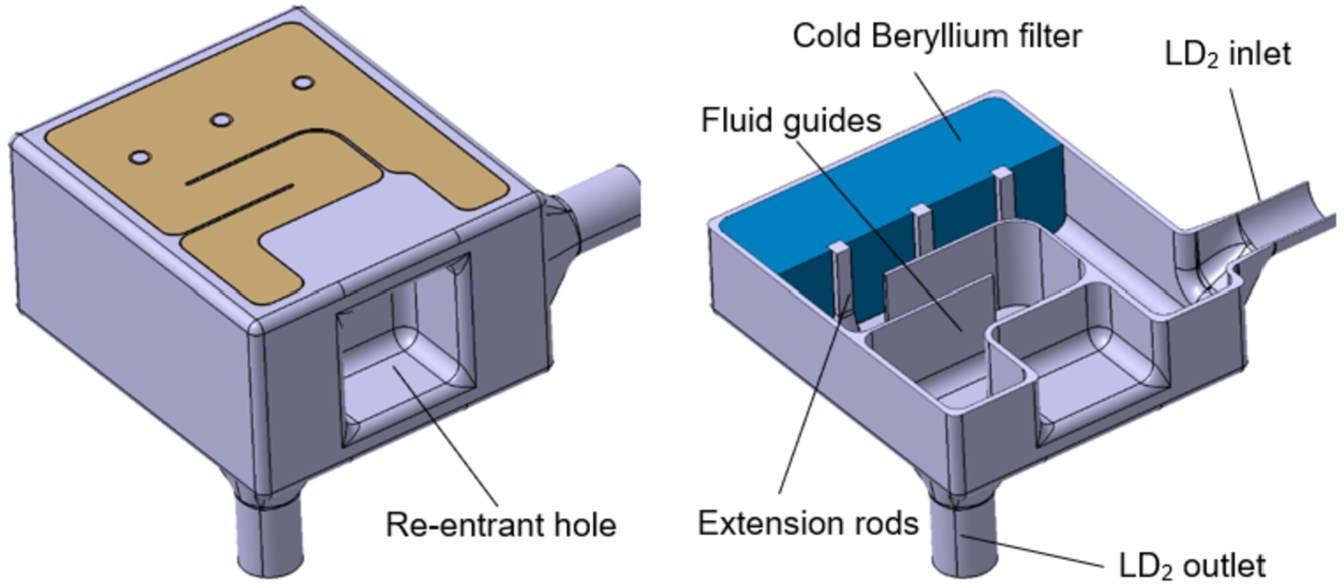
The fluid guides ensure that flow separation, dead areas, and swirls do not occur. The extension rods ensure additional mechanical stability since the vessel walls are flat and need to be as thin as possible to minimize neutron losses. The moderator will be milled and partially Electrical Discharge Machining (EDM) machined from a solid block of aluminum EN AW-6061 T6, and the cover will be finally welded to the main body with “low-distortion” electron beam welding. In addition to the usual structural and fluid mechanics issues, the integrability must also be checked, since the components must be installed into an existing source. Originally, the twister was designed for low-dimensional hydrogen moderators only. The integrability is critical, since the LD2 volume moderator has a substantially larger volume and thus dissipates significantly more heat. Therefore, larger supply and dissipation cross-sections are required. All supply lines must be routed through the twister shaft. However, the diameter of the shaft cannot be increased because it is surrounded by non-replaceable shielding elements. Figure 45 shows the twister with the upper moderator on the left-hand side and on the right-hand side the integrated volume LD2 moderator in the lower moderator plug. [171]
Fig. 45.
Integration of LD2 moderator: 1. Upper moderator plug; 2. Upper moderator plug in the moderator support structure; 3. Moderator plug with LD2 moderator; 4. And 5. Moderator plug in the moderator support structure near the outer reflector [171].
![Integration of LD2 moderator: 1. Upper moderator plug; 2. Upper moderator plug in the moderator support structure; 3. Moderator plug with LD2 moderator; 4. And 5. Moderator plug in the moderator support structure near the outer reflector [171].](https://content.iospress.com:443/media/jnr/2023/25-3-4/jnr-25-3-4-jnr230950/jnr-25-jnr230950-g045.jpg)
Fig. 46.
Definition of fluid parameters for the moderator LD2 volume.
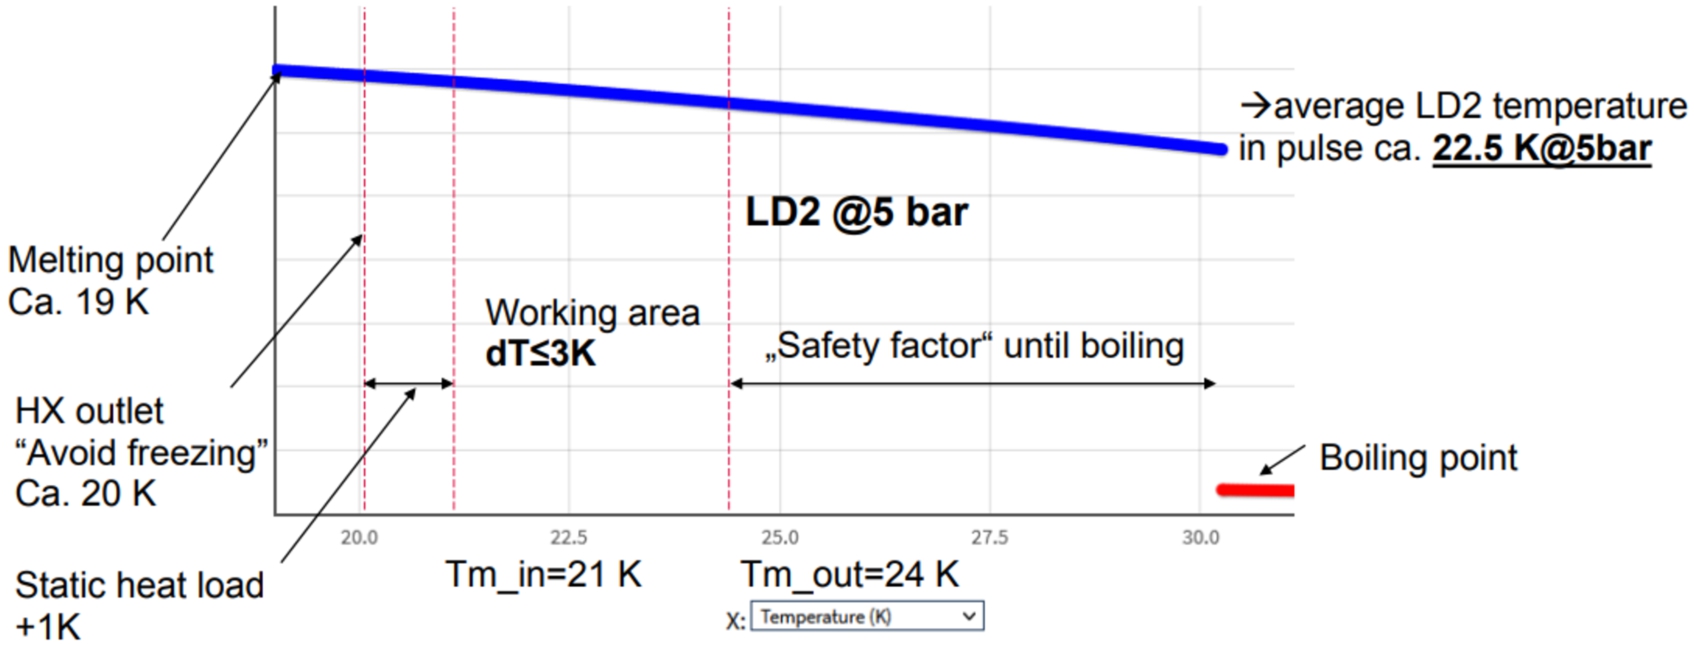
Table 9
Critical design parameters
| Liquid ortho-deuterium volume | |
| Heat load into oLD2-moderator | |
| Total heat load | |
| Average pressure (moderator) | p = 5 bar |
| Average density | ρ = 173.8 kg m−3 |
| Flow velocity | w ⩽ 5 m s−1 |
| Average mass flow | ṁ ⩾ 3400 g s−1 |
| Average temperature increase (mo.) | dT ⩽ 3 K |
| Average temperature | |
| Average inlet temperature | |
| Average outlet temperature |
3.2.Definition of fluid parameters and cooling process concept design
The fluid parameters of liquid deuterium are defined in the following section, since these are required for the following designs and calculations of the new cold moderator system. Figure 46 shows a simplified representation of LD2 (blue line) at the chosen operation pressure of 5 bar. It can be seen that the deuterium solidifies at a temperature of ≈19 K and vaporizes at ≈30 K, which defines the temperature range in the liquid phase for the moderator system. In order to avoid freezing during operation, the minimum temperature at the outlet of the heat exchanger is set to 20 K. In addition, it is assumed that additional heat load from the circulation pumps and insulation losses will increase the deuterium temperature by 1 K before it arrives at the moderator inlet. The average temperature increases in the moderator due to particle heating of 59.8 kW will be up to 3 K, which means that the average outlet temperature will be around 24 K. As a result, there is still a contingency factor for local temperature peaks of approximately 6 K before the deuterium evaporates.
Fig. 47.
Piping and instrumentation diagram for the LD2 moderator system.
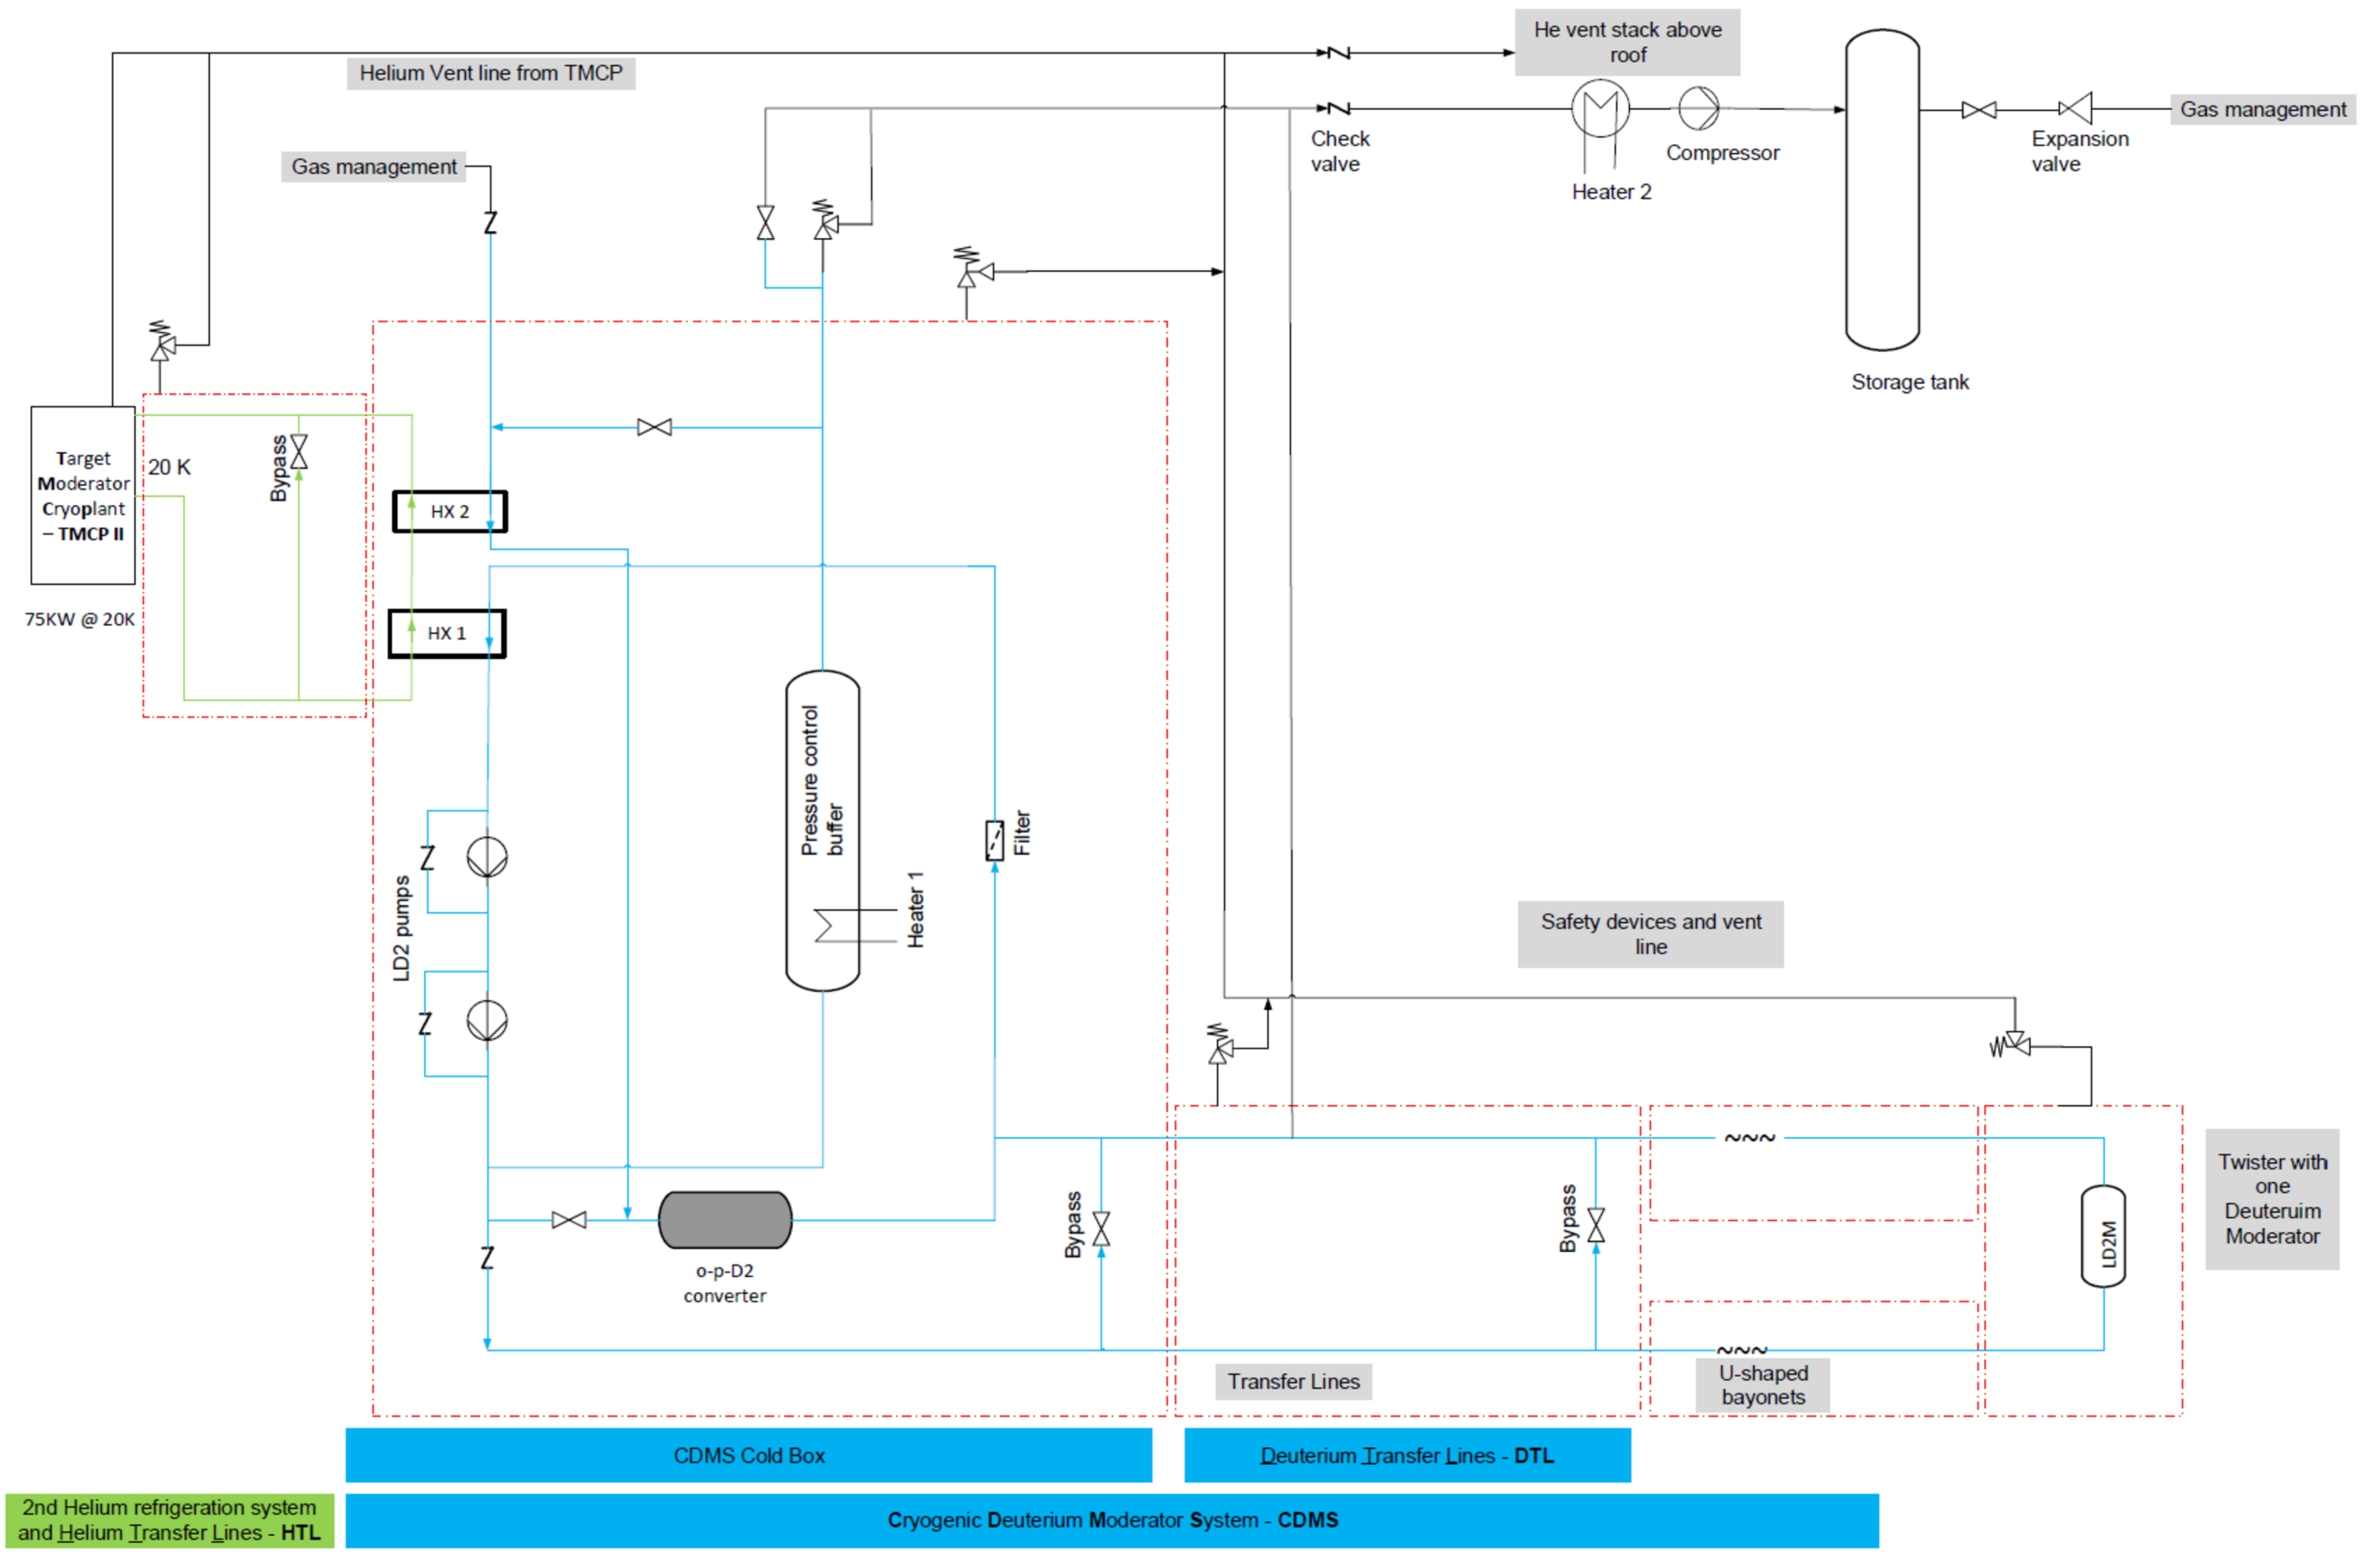
The mass flow can now be estimated by using the chosen operating pressure, the inlet- and outlet- temperature, and the heat load. A mass flow of at least 3400 g s−1 liquid deuterium is needed to remove the enormous particle heat and to keep the average temperature increase below ⩽3 K. Assuming a flow velocity of up to ⩽5 m s−1, an inlet/outlet pipe diameter of 70 mm would be required, which has to fit into the existing twister structure. A summary of the critical design parameters can be found in Table 9.
With the defined fluid parameters, a first piping and instrumentation diagram (P& ID, see Fig. 47) was created, and a working CAD design of the lower moderator plug was completed for use in structural mechanical simulations and fluid dynamic simulations. The P& ID in Fig. 47 is a simplified system flow diagram of the cryogenic deuterium moderator system (CDMS), consisting of the helium refrigeration system (TMCP II) with 75 kW cryo-power at 20 K, the helium transfer lines (HTL), the deuterium liquefaction cryostat (CDMS Cold Box), the deuterium transfer lines (DTL), and finally the twister with the lower moderator plug.
The helium refrigeration system is responsible for providing the required cryo-power to the deuterium cryostat to liquify the gaseous deuterium and to remove the heat load of the moderator system during operation. For this, gaseous helium is pumped in a closed loop at a minimum temperature of 20 K via the helium transfer lines to the deuterium cryostat heat exchanger and back to the helium refrigeration system. The main components of the deuterium cryostat itself are the heat exchanger, the circulation pumps, the ortho–para converter and the pressure control buffer. The circulation pumps are installed in the deuterium cryostat to supply the moderator with the liquefied deuterium in a closed circuit. In addition, the para-deuterium content is converted into almost 100% ortho deuterium by using a catalyst in the cryostat, since this has better moderator properties. An active heated pressure-control buffer is also installed in the cryostat to compensate pressure changes caused by the pulsed proton beam and beam trips.
The cryostat provides the needed liquid deuterium to the moderator via the deuterium transfer lines, where the deuterium is heated up by particle interactions and returned to the heat exchanger of the cryostat to cool the deuterium down again. In addition, a storage tank for the deuterium will be necessary since deuterium produces tritium under irradiation. Therefore, the deuterium cannot be vented like hydrogen, for example, when maintenance work or similar actions have to take place. For this reason, in case of maintenance work, the deuterium will be heated and then fed into the storage tank using a heater and compressor. Then, completing maintenance, the deuterium would be reused.
This is also advantageous, because of the high cost of deuterium. The size of the storage tank is determined by the total inventory of the circuit, cryostat and moderator, which must be kept as small as possible for safety and costs reasons. Therefore, it is very important to place the cryostat as close as possible to the moderator to reduce the total amount of deuterium. Since selecting a final location of the components was not within the framework of the HighNESS project, this will be necessary in the final design phase.
3.3.Costs estimation of LD2 infrastructure
The rough cost estimation shown in Table 10 is based on the cost of the existing ESS hydrogen system and is scaled up according to the heat load of the deuterium moderator system (ca. 75 kW) compared to the hydrogen moderator system (ca. 30 kW). In addition, a storage tank system is considered because of the issue mentioned above that deuterium can not be vented in maintenance cases due to tritium production. In addition, significantly higher costs for deuterium itself are considered as well. Since the location of the needed new building for the helium refrigeration system and the location of the deuterium cryostate inside the Target Station building are unknown, the distance to each other is estimated in order to be able to estimate the costs for the respective transfer lines.
Table 10
Cost estimation of the LD2 moderator system
| Item | Cost [M€] | Comments |
| Helium refrigeration system | 35 | Ca. 75 kW @ 20 K |
| Helium transfer lines | 1.93 | Assumed: 2 × 100 m |
| D2 cryostat | 14 | |
| LD2 transfer lines | 2.75 | Assumed: 2 × 40 m |
| LD2 moderator plug | 5.5 | Complete new twister |
| D2 storage system | 2.5 | |
| New building for He-refrigaration system | ||
| Room preparation for LD2 cryostat, ATEX, … | 5 | No room selected so far |
| Total: | 66.68 |
The real costs can deviate significantly upwards or downwards from the estimated ones if the locations (distance) of components change and if the heat load is lower or higher, for example.
3.4.Selection of materials and overall design
For the newly designed moderator, the moderating medium of LD2 is kept at 20 K. The structural material for the moderator vessel is required to be tolerant to radiation damage, as transparent for neutrons as possible, and suitable for cryogenic temperatures. The chosen structural material shall also be sufficiently ductile for the fast load changes caused by the pulsed proton beam and sufficient in terms of strength to withstand the internal pressure of the LD2.
Aluminum is nearly transparent for cold and thermal neutrons and is therefore typically selected as a moderator vessel material. However, the strength of pure aluminum is much too low to keep the stress from inner pressure within the allowable range, especially for large volumes as in the case of the LD2 moderator. Therefore, heat treatable aluminum alloys (6000 series) or non-heat treatable (5000 series) are the preferred choice [61].
There is no ideal aluminum alloy, with each choice having advantages and drawbacks. Many facilities use EN AW-6061 T6, for example at SNS, J-PARC, and for the liquid hydrogen moderator of ESS. In addition, sufficient data of irradiated samples are available to evaluate the radiation-related lifetime of the moderator vessel [61]. Because of its well-known radiation properties, the high strength values and wide application fields in the frame of spallation sources, it was ultimately decided to use EN AW-6061 T6 for the lower moderator.
3.5.Design overview of the lower moderator plug
The new moderator is located in the frames of the twister just below the target wheel, as can be seen is Fig. 45. All details about the integration of the LD2 moderator assembly into the already existing ESS twister can be found in Section 3.11. The lower moderator plug consists of the inner LD2 moderator and a cold beryllium filter, that are surrounded by an insulation vacuum, a warm beryllium reflector, and a water premoderator on the top side, facing the target wheel. On each side of the outer vacuum vessel there are actively helium-cooled neutron windows (part of the vacuum vessel) where the cold neutrons exit the moderator (see Fig. 48).
Fig. 48.
3D cross section illustration of the lower moderator plug.
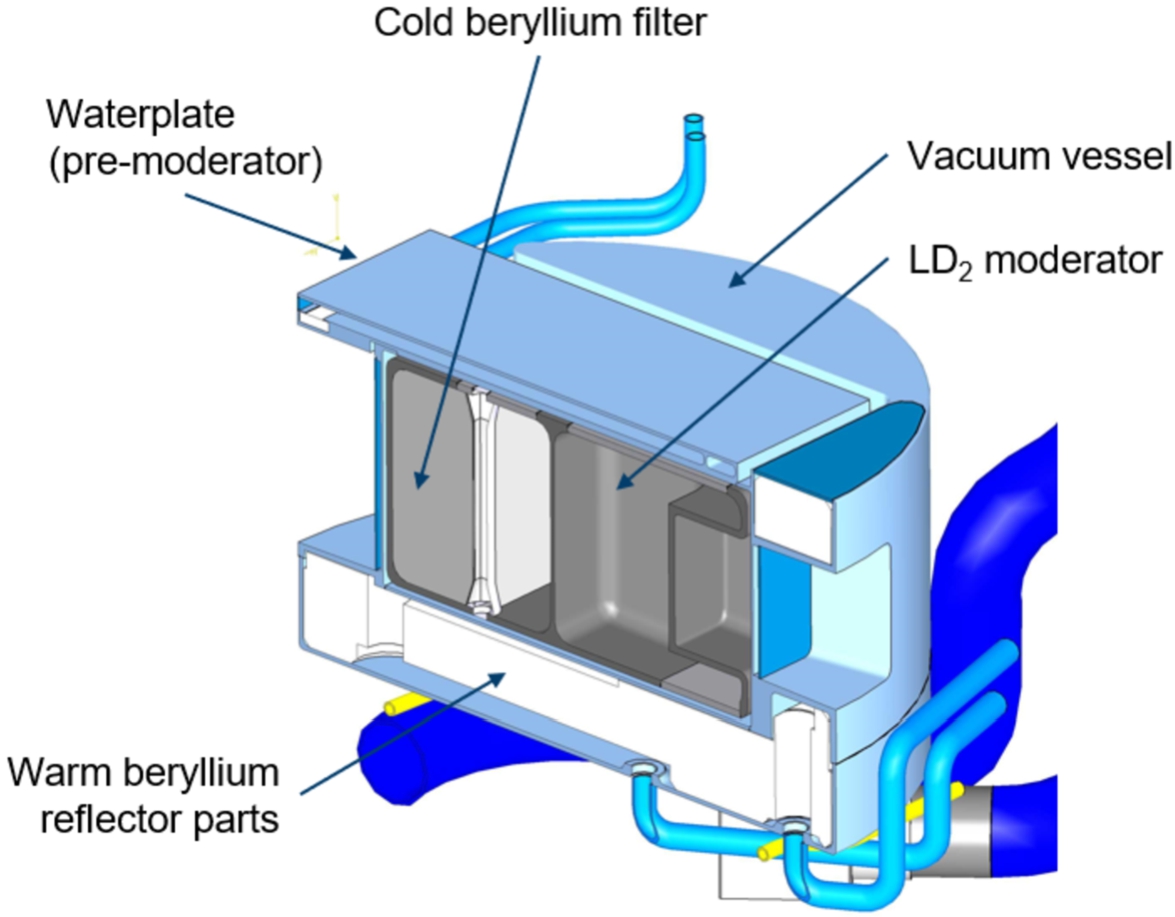
Figure 49 shows the overall box dimensions of the lower moderator plug without the media supply pipes and a horizontal cross-section of the assembly with the parts inside the plug. In principle, the LD2 moderator sits within the surrounding vacuum vessel with a 5 mm insulation vacuum gap to the adjacent aluminum walls. A layer of water and the warm beryllium reflector segments surround the moderator, with the reflector segments also placed inside a closed aluminum vessel.
Fig. 49.
Dimensions and layout of the lower moderator plug.
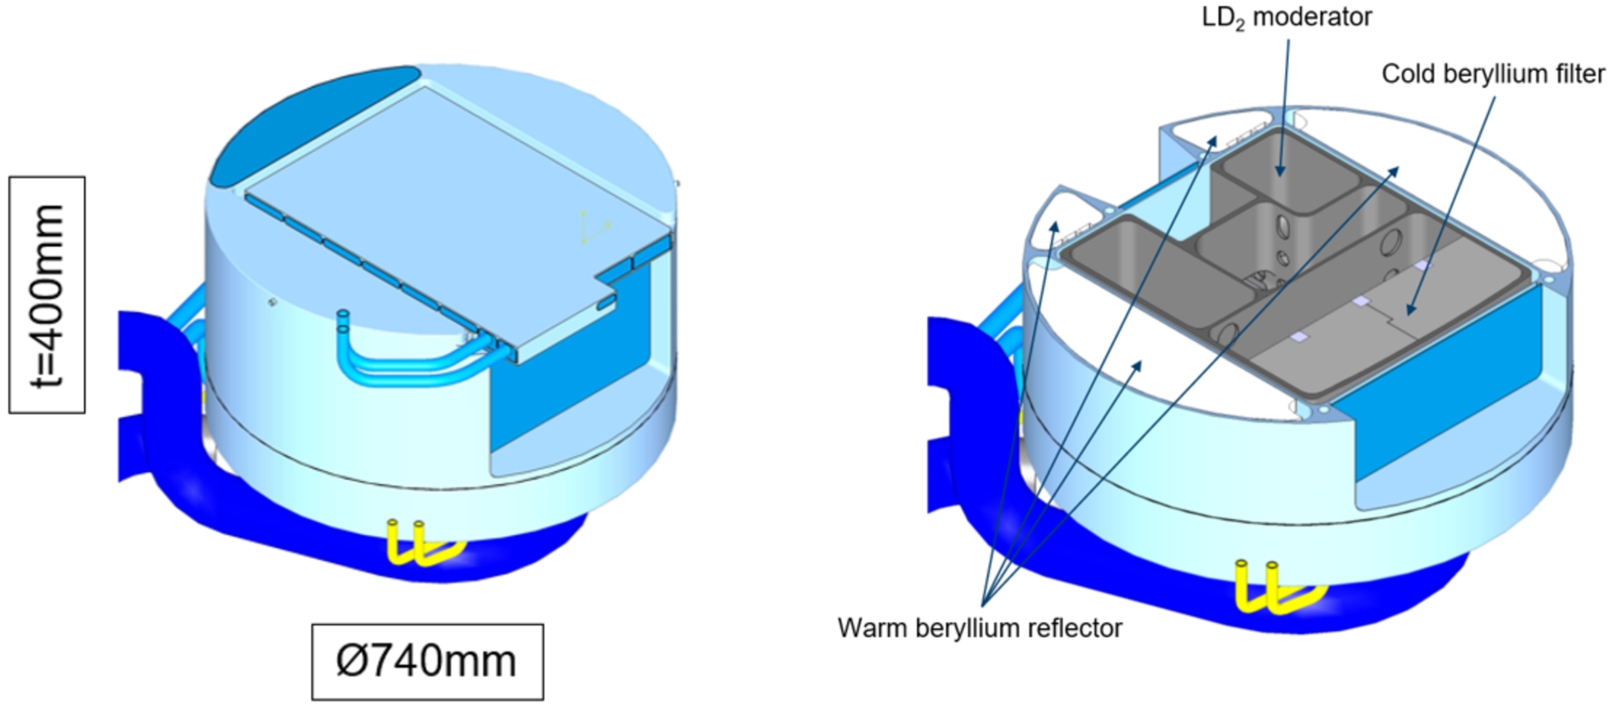
The lower moderator plug has two openings on the front and the back side, one smaller neutron window A (WP7 side) and a larger neutron window B (NNBAR side). Both neutron windows are actively cooled by a transversal helium flow and are therefore designed with a thin double-wall design, as shown in Fig. 50.
Fig. 50.
3D cross-section of the neutron windows.
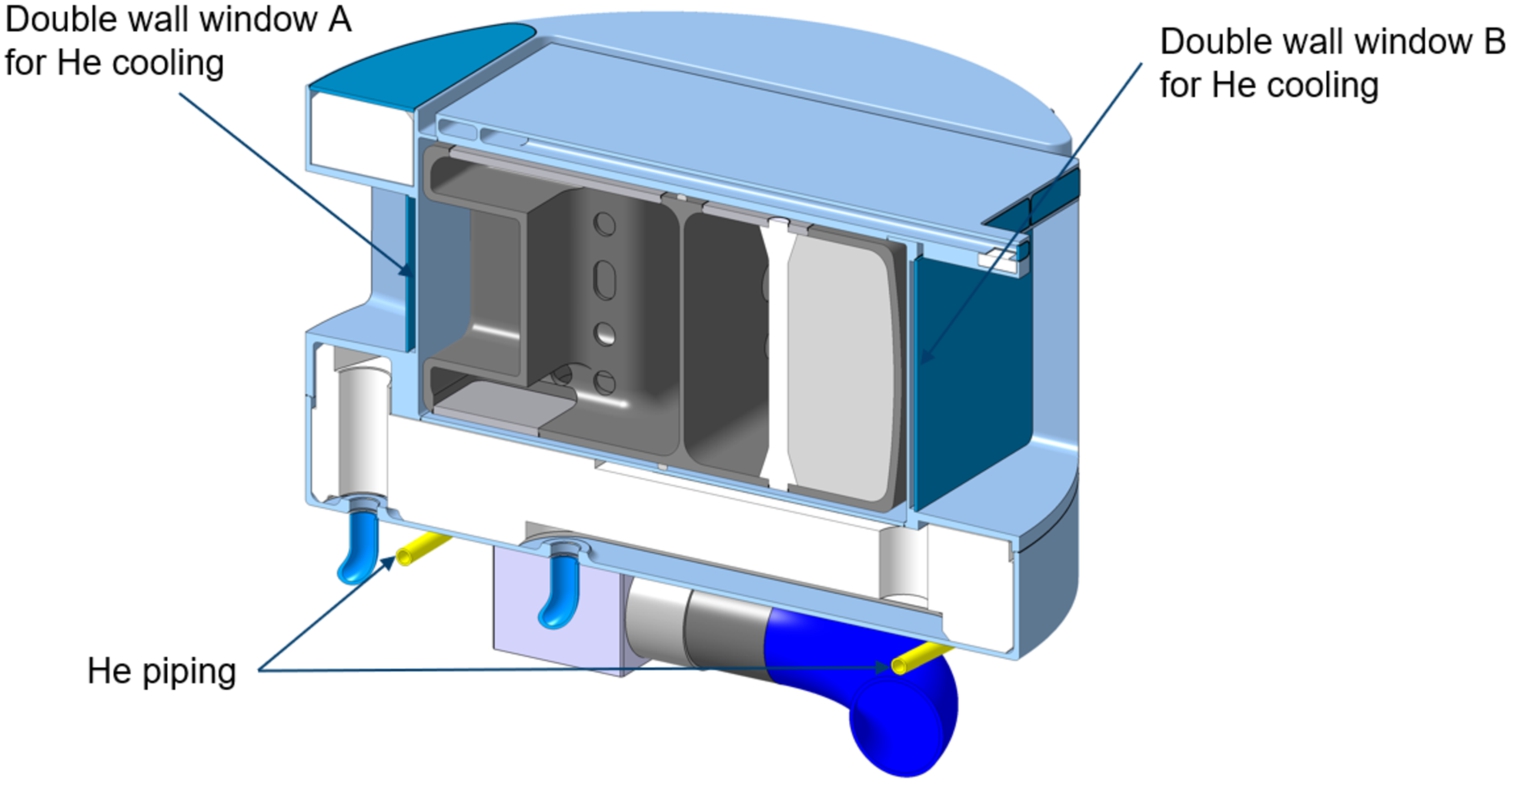
3.6.Assembly and welding of the moderator
A cold beryllium filter is embdedded within the LD2 moderator on the NNBAR side, adjacent window B. This filter element is divided into two pieces for installation purposes. Three stiffening rods are also needed to support the structural integrity of the vessel. The flow guides and restrictors ensure a defined flow of the liquid deuterium from the inlet to the outlet. The whole moderator is milled and eroded from a single piece of EN AW-6061 T6 aluminum. The openings on the top and the bottom side are necessary for inserting the cold beryllium filter parts and for manufacturing reasons. The box dimensions of the moderator vessel with a wall thickness of 8 mm are shown in Fig. 51.
Fig. 51.
Detailed view of the LD2 moderator structure within the moderator plug.
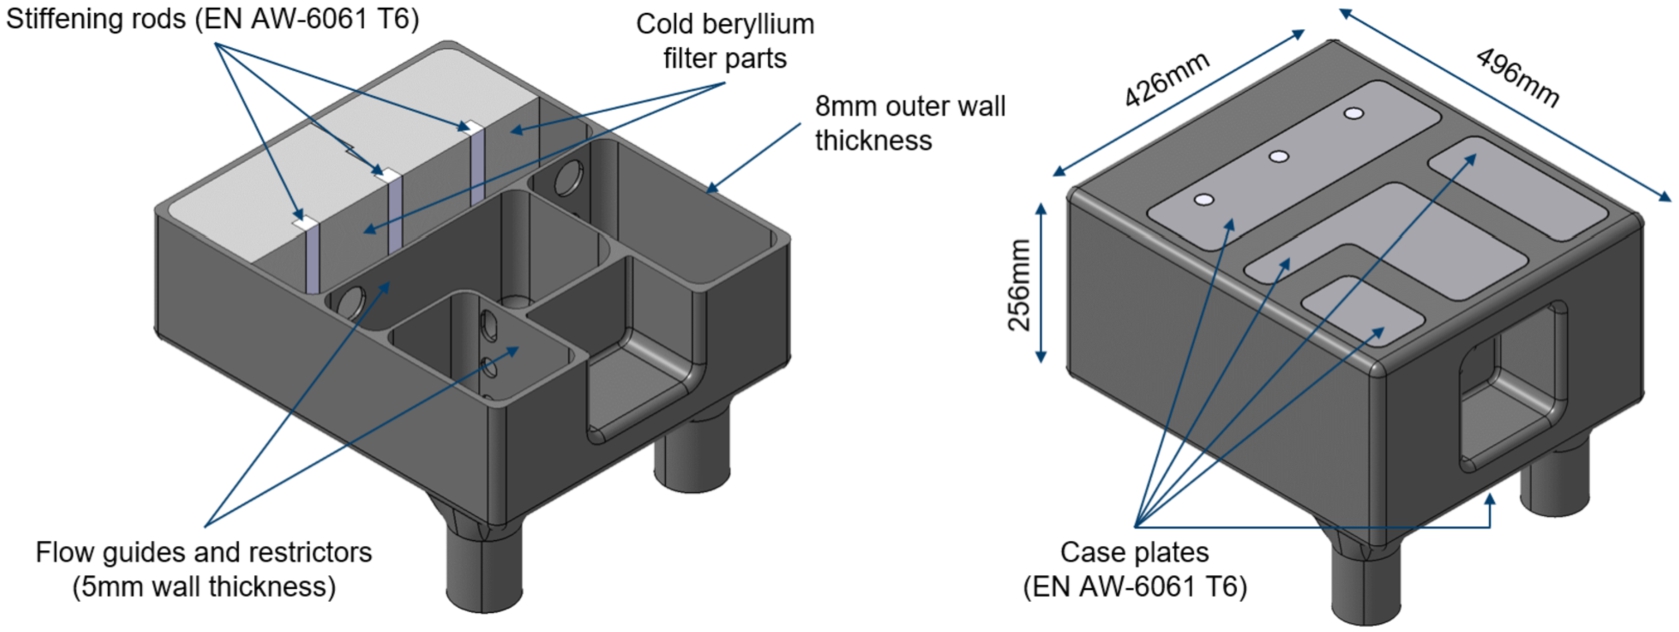
The assembly sequence of the LD2 moderator is shown in Fig. 52 and Fig. 53. First, the parts of the cold beryllium filter are inserted through the top cut-out into the base body of the moderator. Then the 3 stiffening rods are put into the base body and into their grooves in the cold beryllium filter parts, ensuring the correct positioning. Afterwards, the moderator vessel is closed with the case plates.
Fig. 52.
Assembly of the LD2 moderator vessel – parts overview.
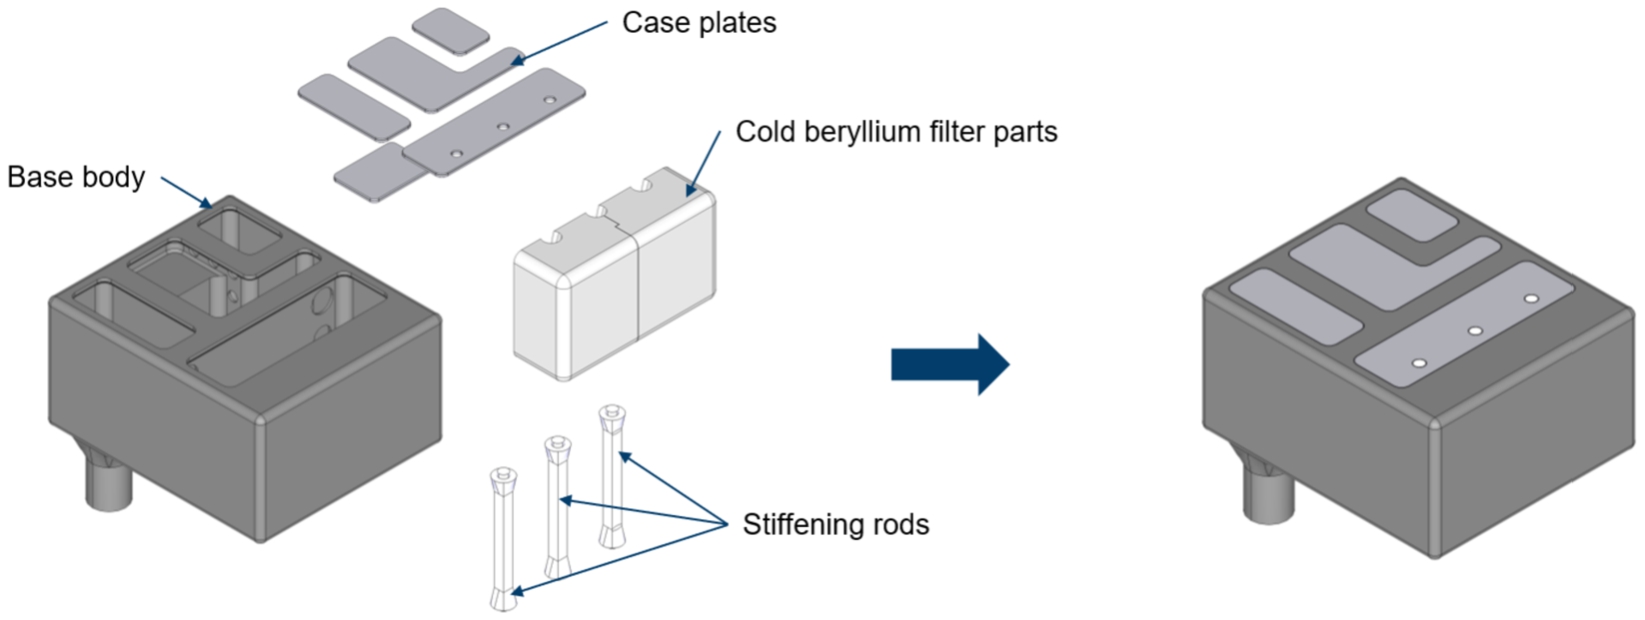
Fig. 53.
Assembly of the LD2 moderator vessel – assembly sequence.
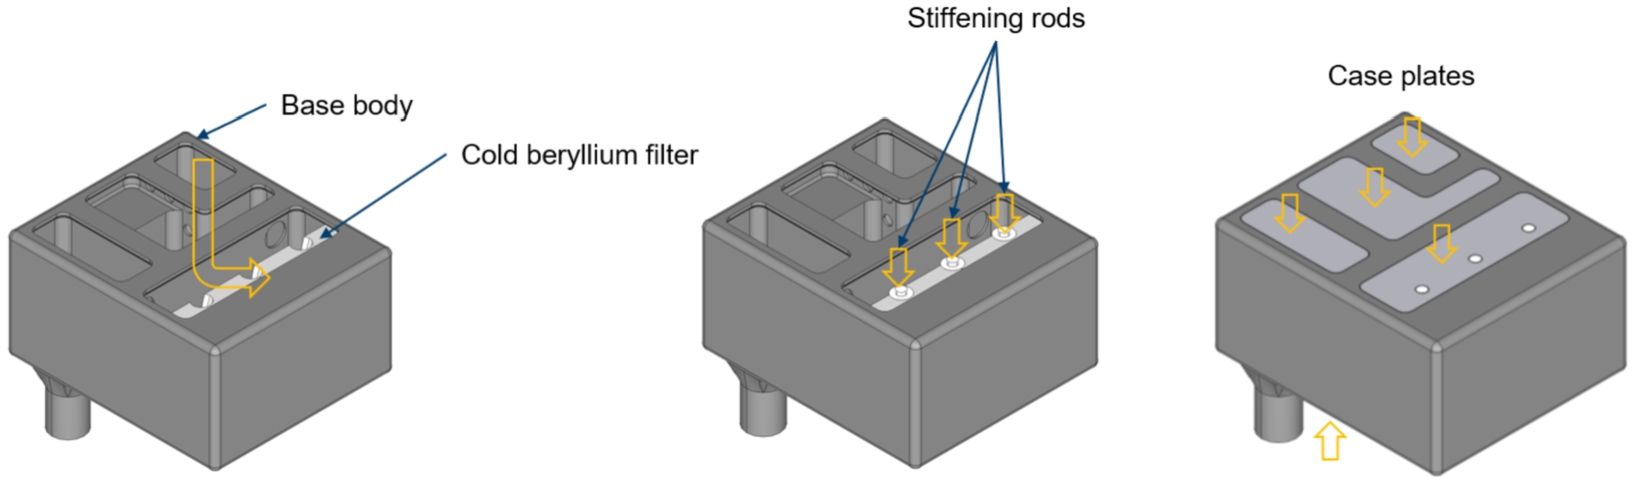
One challenge when manufacturing the inner LD2 moderator vessel is the welding process of the case plates, because of the high structural loads that result from the interior operating pressure of the liquid deuterium of 5 bar and the unusual box shape for a pressurized vessel. Figure 54 shows a close-up of the welding area of one of the case plates. To determine the ideal weld-in depth of the filler material, that is needed to avoid heat cracks during the welding process of the EN AW-6061 T6 aluminum alloy, detailed pre-tests of the welding geometry will be necessary in the future before building of such a vessel can be realized.
Fig. 54.
EB-welding of the LD2 moderator vessel.
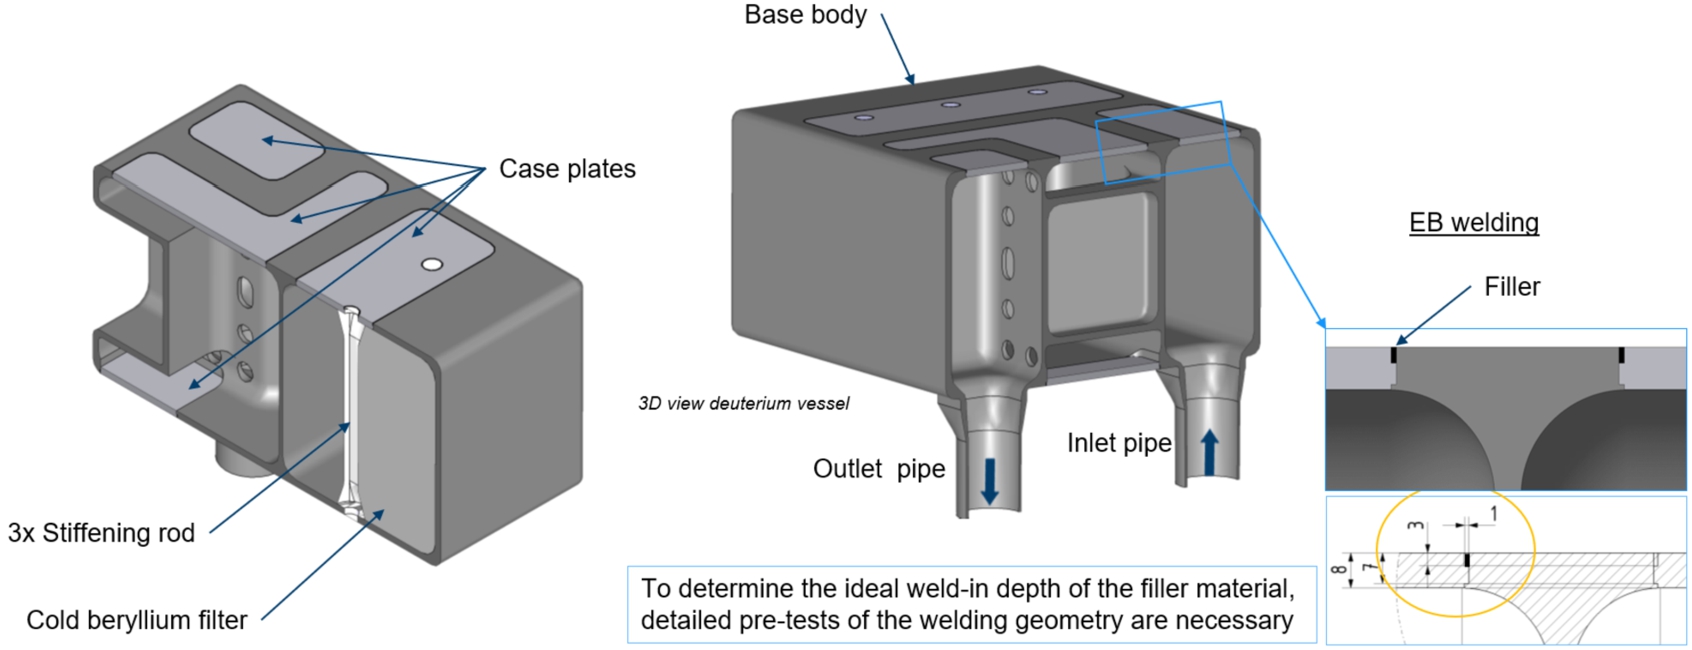
3.7.Structural mechanical calculations
Structural strength simulations with a design pressure of 7 bar (operation pressure 5 bar) following the design rules of RCC-MRx 2012 code were performed to analyze the static behavior of the LD2 moderator, which basically behaves as a pressure vessel. Figure 55 illustrate that the large flat wall on the front-facing side – where the cold beryllium filter is placed (not included in the simulation) – the stress is particularly high due to the unusual box shape. In this area, the stress exceeds the limit of
Fig. 55.
Equivalent primary stress at design pressure.
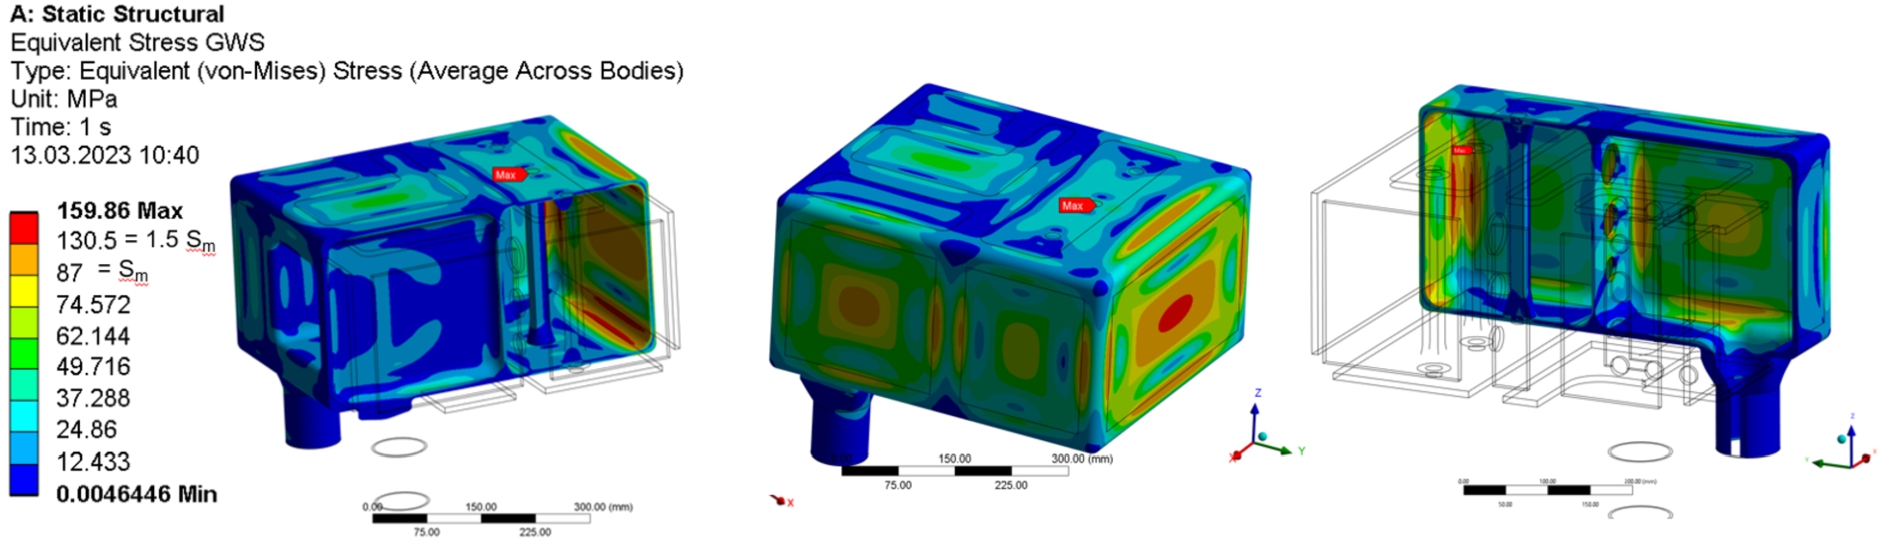
To further optimize the design and meeting the strength criteria regarding the allowable stress, optimizations on this large wall were performed. At first, the wall was shaped cylindrically, which reduced the bending stresses compared to a flat wall. Nevertheless, the sum of the local membrane and bending stress
Finally, the large and originally flat surface was transformed into a perfectly plastic membrane, which is deformed by pressure to create a shape capable of bearing the load with reduced bending stress. This derived shape is used as a contour for the geometry of the rear wall. This free-formed, or “membrane-shaped” wall under pressure is shown in Fig. 56, shown with a 10× magnification of the deformation for visualization. To limit the extent of the free-forming effect, the membrane shape was selected with a maximum deformation of 10 mm.
Fig. 56.
Shape of membrane under pressure, magnified 10× for visualization purpose.
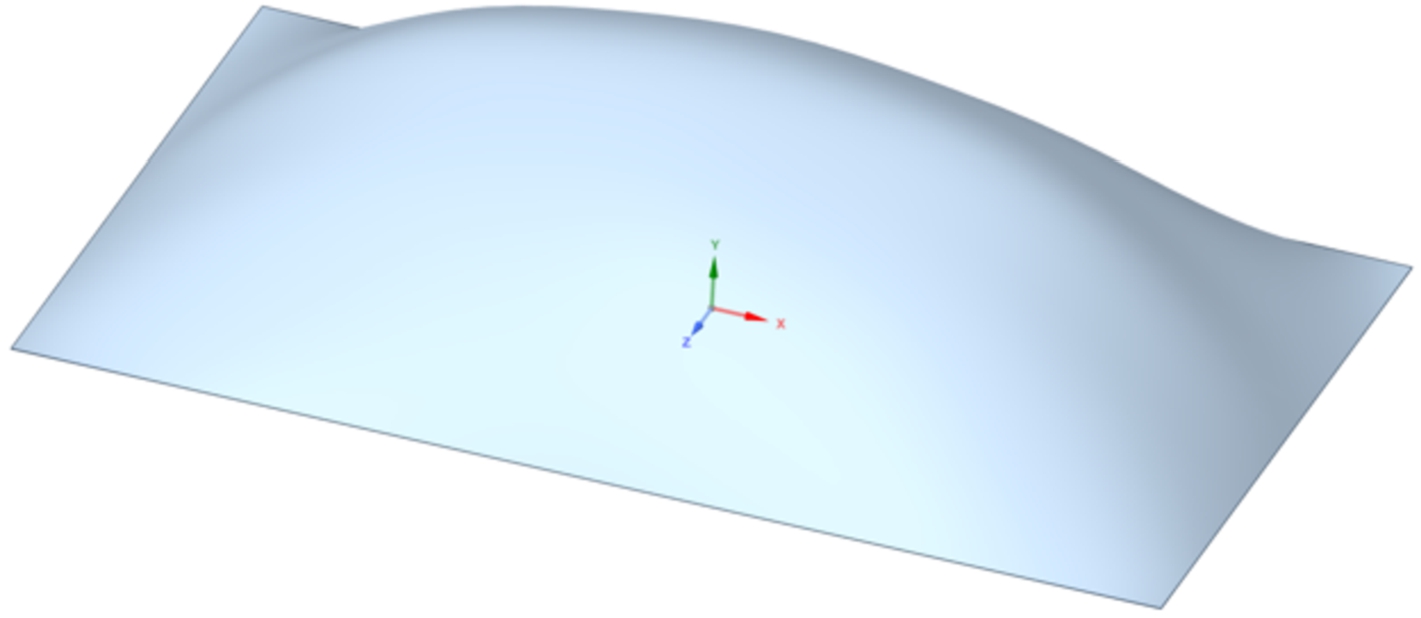
Fig. 57.
Updated equivalent primary stress at design pressure.
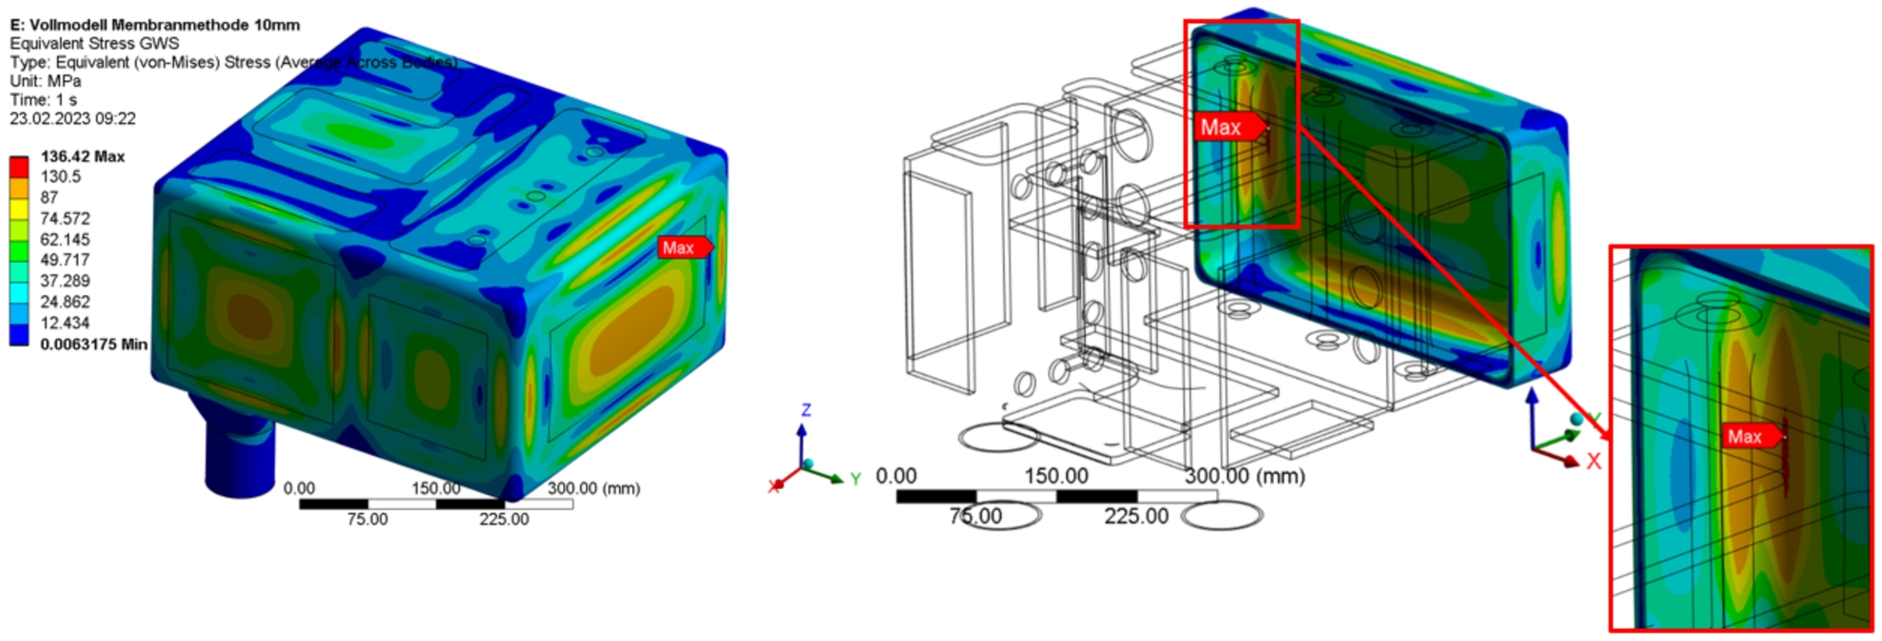
Fig. 58.
Results for membrane stress on the NNBAR-side outer wall.
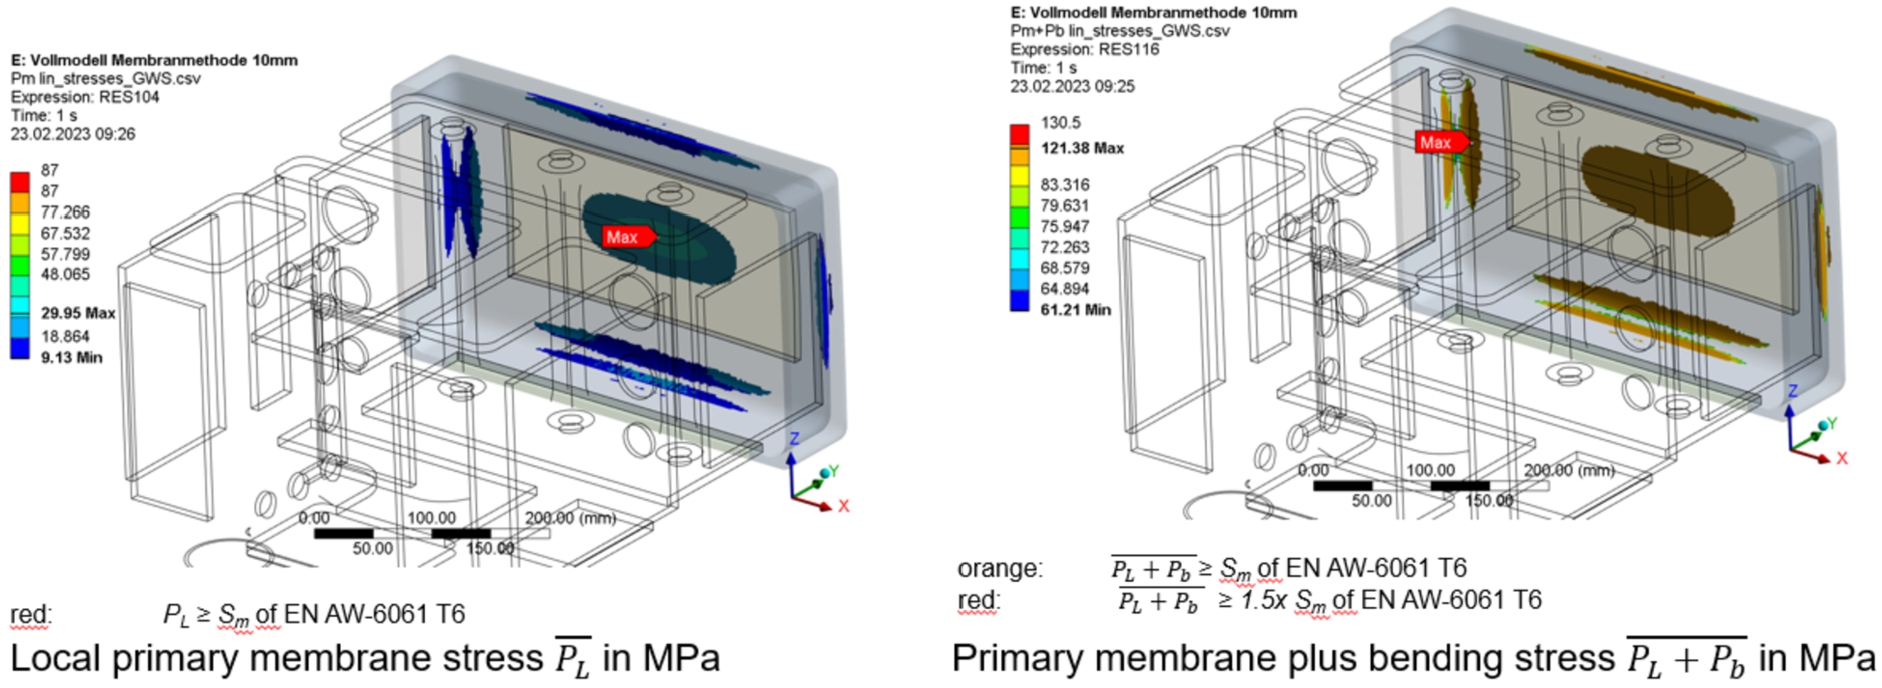
Figure 57 shows the updated equivalent primary stresses at a design pressure of 7 bar. Here, it is indicated that the stress only exceeds the maximum of 130.5 MPa by 0.92 MPa at a single spot in a rounded corner. However, the linearized stresses at surfaces with
In summary, a free-shaped rear wall significantly reduces the sum of local membrane and bending stress compared to a flat rear wall or a cylindrical rear wall with identical offset of 10 mm. The sum of local membrane and bending stress
3.8.Analysis of weld seams
In principle, all moderator vessels are welded. Depending on the number of welds, the distance to each other and the welding process itself (TIG, Laser, Electron-Beam, etc.) the entire vessel can lose the additional strength gained by the selected tempered material. The TIG welding process requires a pre-heating of the vessel, which will often damage the previous heat treatments that have been made to achieve the high material strength, such as T6. This can be avoided to a large degree by using electron beam welding (with no pre-heating necessary) and a carefully planned welding design.
Nevertheless, reduced strength must be expected in the area around a weld. Thus, by putting the welds in a low stress area where possible, it is still possible to benefit from the T6 conditions. On the other hand, electron beam (EB) welding requires a very high manufacturing tolerance.
Another issue with using EN AW-6061 T6 is the need of a welding filler to avoid heat crack formation. These heat cracks occur during the rapid solidification of the melt (thanks to the high thermal conductivity of aluminum) and can be mitigated by the alloy composition of the EN AW-6061 T6, particularly owing to the silicon and magnesium content. Therefore, a good choice of filler would have, for example, a relatively high silicon content, which is offered by EN AW-4047A with 12% silicon. Increasing the content of magnesium is not helpful in this case since it evaporates when the aluminum melt is produced.
The filler material needs to be set precisely into the welding area. Also, the weld-in depth is a very sensitive value. For EB welding, it is ideal that there are no gaps between the welded parts and the filler material, because even small gaps > 0.1 mm will result in irregularities in the weld seam and a faulty welding process. This is very challenging for the manufacturing process of the welded parts in terms of accuracy and the manufacturing strategy. The loss of the T6 condition of the aluminum alloy and its influence on the strength of the weld seams and the heat affected zone (HAZ) around them was investigated by simulation. For this purpose, all material within 15 mm of weld seams is assumed to be heat affected and therefore loses the T6 condition, with a significant corresponding loss in strength values which must be considered. This was approximated by conservatively upscaling the observations from previously tested components with lower wall thicknesses. An overview of the heat affected zones of the LD2 moderator is given in Fig. 59.
Fig. 59.
Heat affected zones of the LD2 moderator.
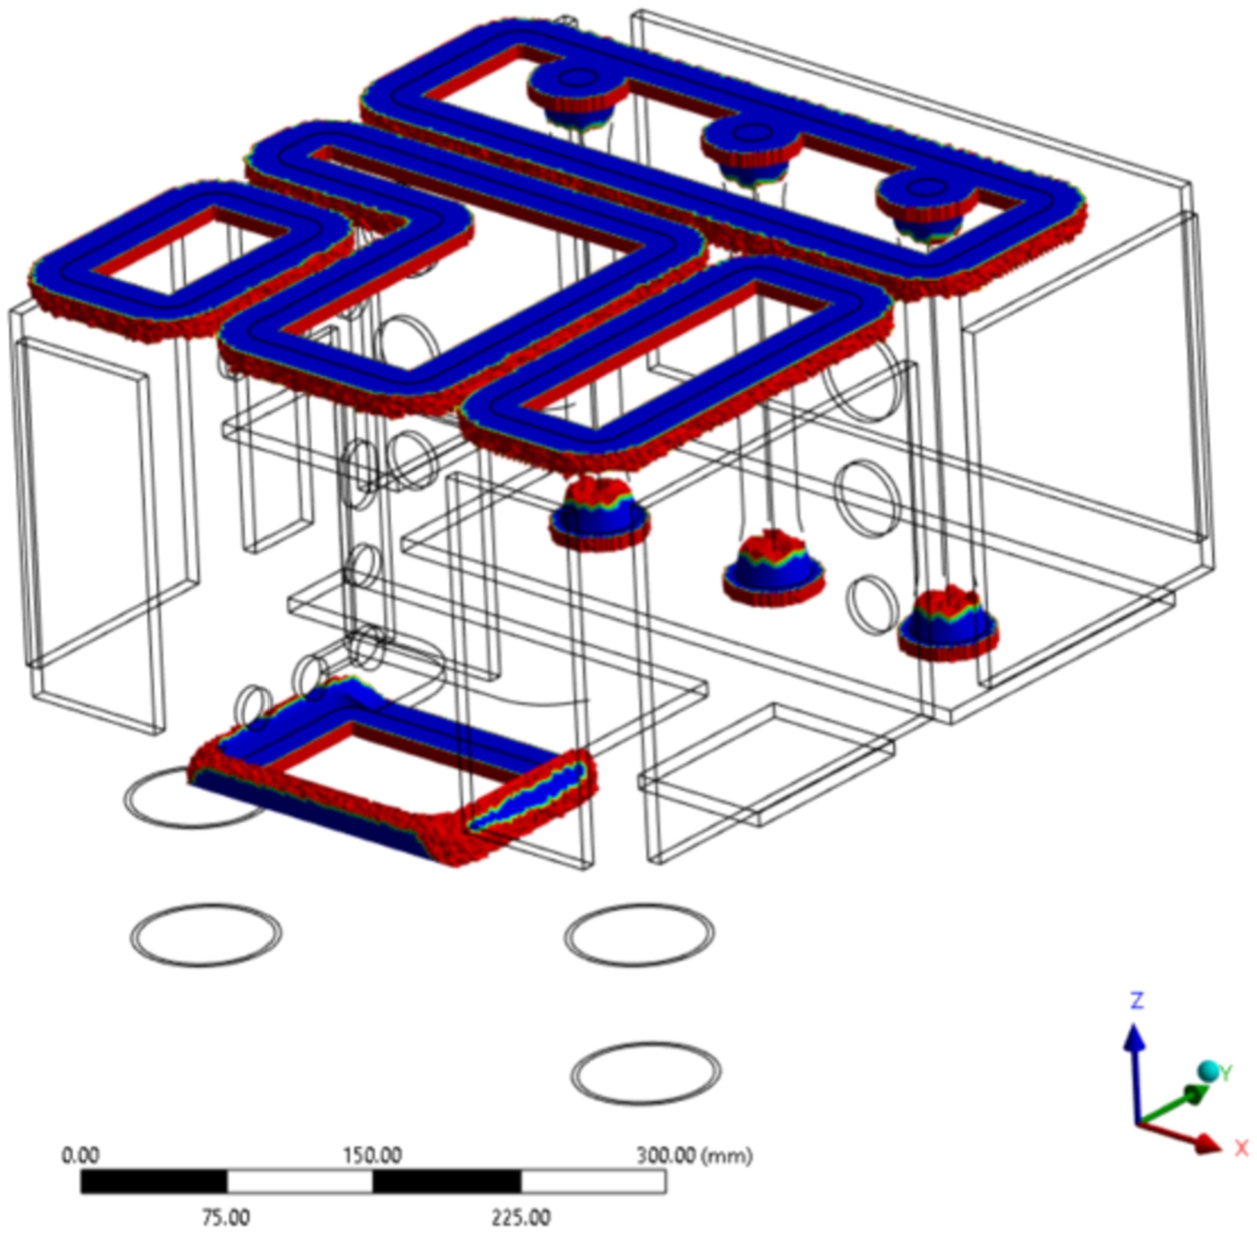
Fig. 60.
Linearized stresses at the weld seams of cover plates.
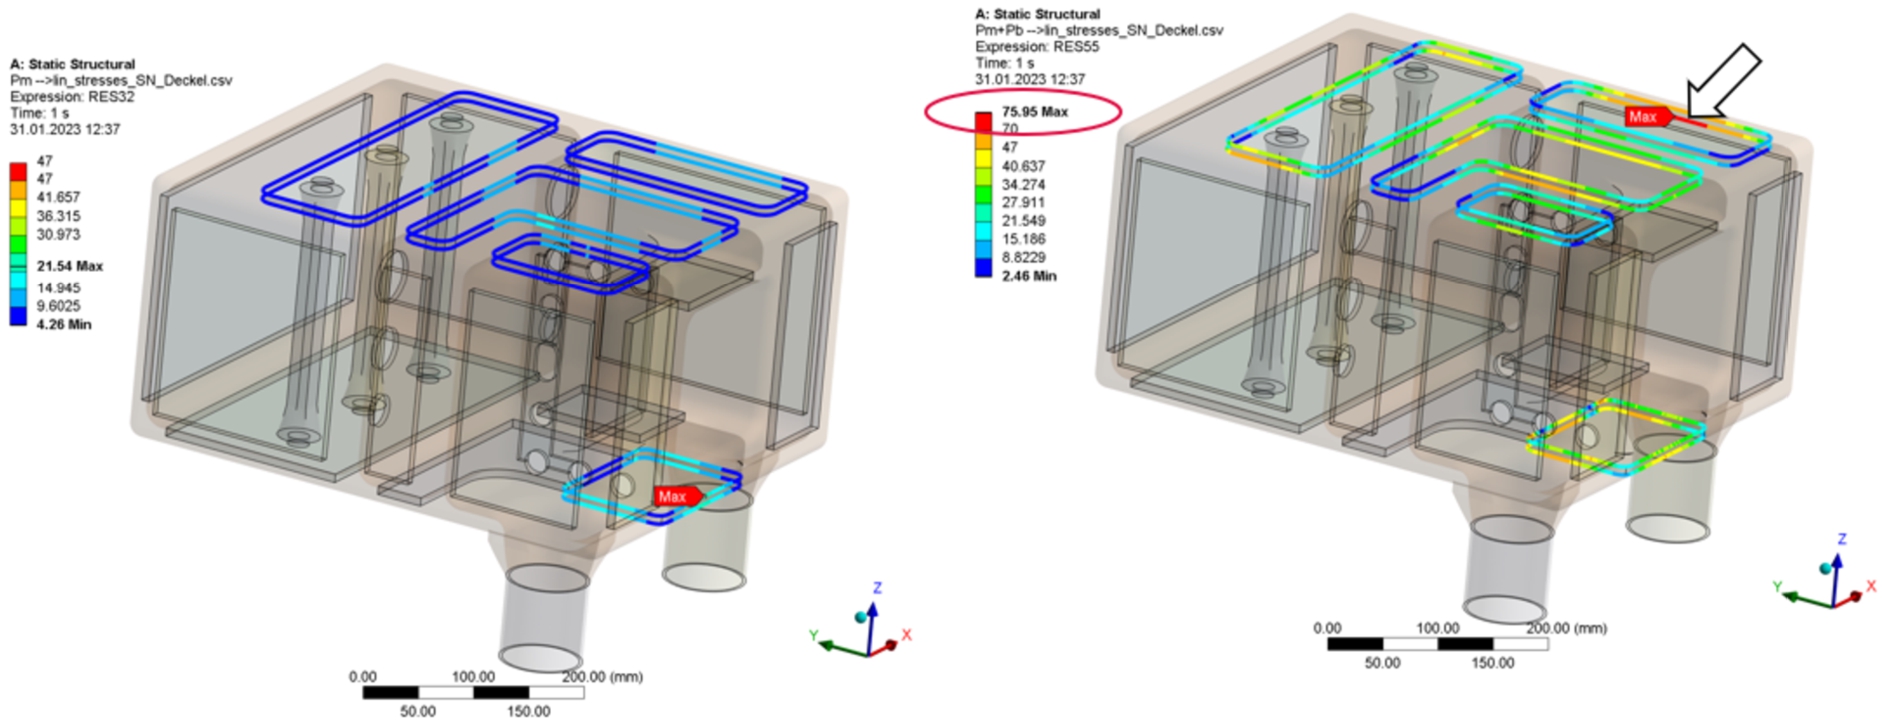
The structural strength simulations with a static design pressure of 7 bar following the design rules of RCC-MRx 2012 code showed that the linearized stresses at the weld seams of the cover plates did satisfy the strength criteria of
A further simulation was performed with the same boundary conditions, but an updated design model. In this case the position of the weld seam of the former, unsatisfactory cover plate was moved 6 mm toward a less stressed region of the vessel. Figure 61 shows that the criteria of
Fig. 61.
Updated linearized stresses at weld seams of cover plates.
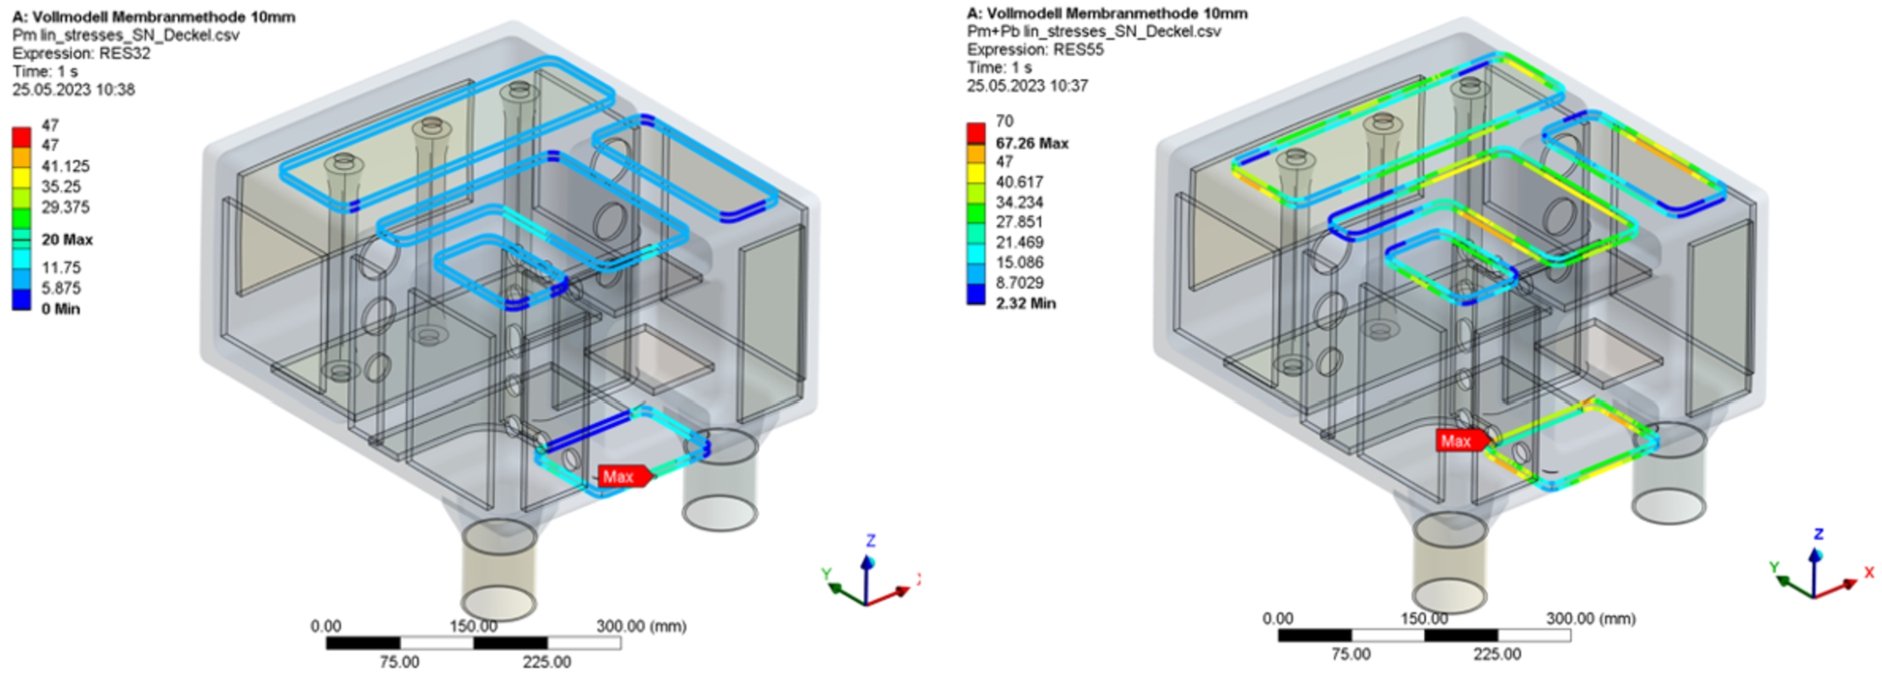
The weld seams at the three stiffening rods were also subject of the structural strength simulation. The results overview in Fig. 62 shows that the nominal stresses at the weld seams of the stiffening rods all satisfy the strength criteria of
Fig. 62.
Nominal stresses on the weld seams of the stiffening rods.
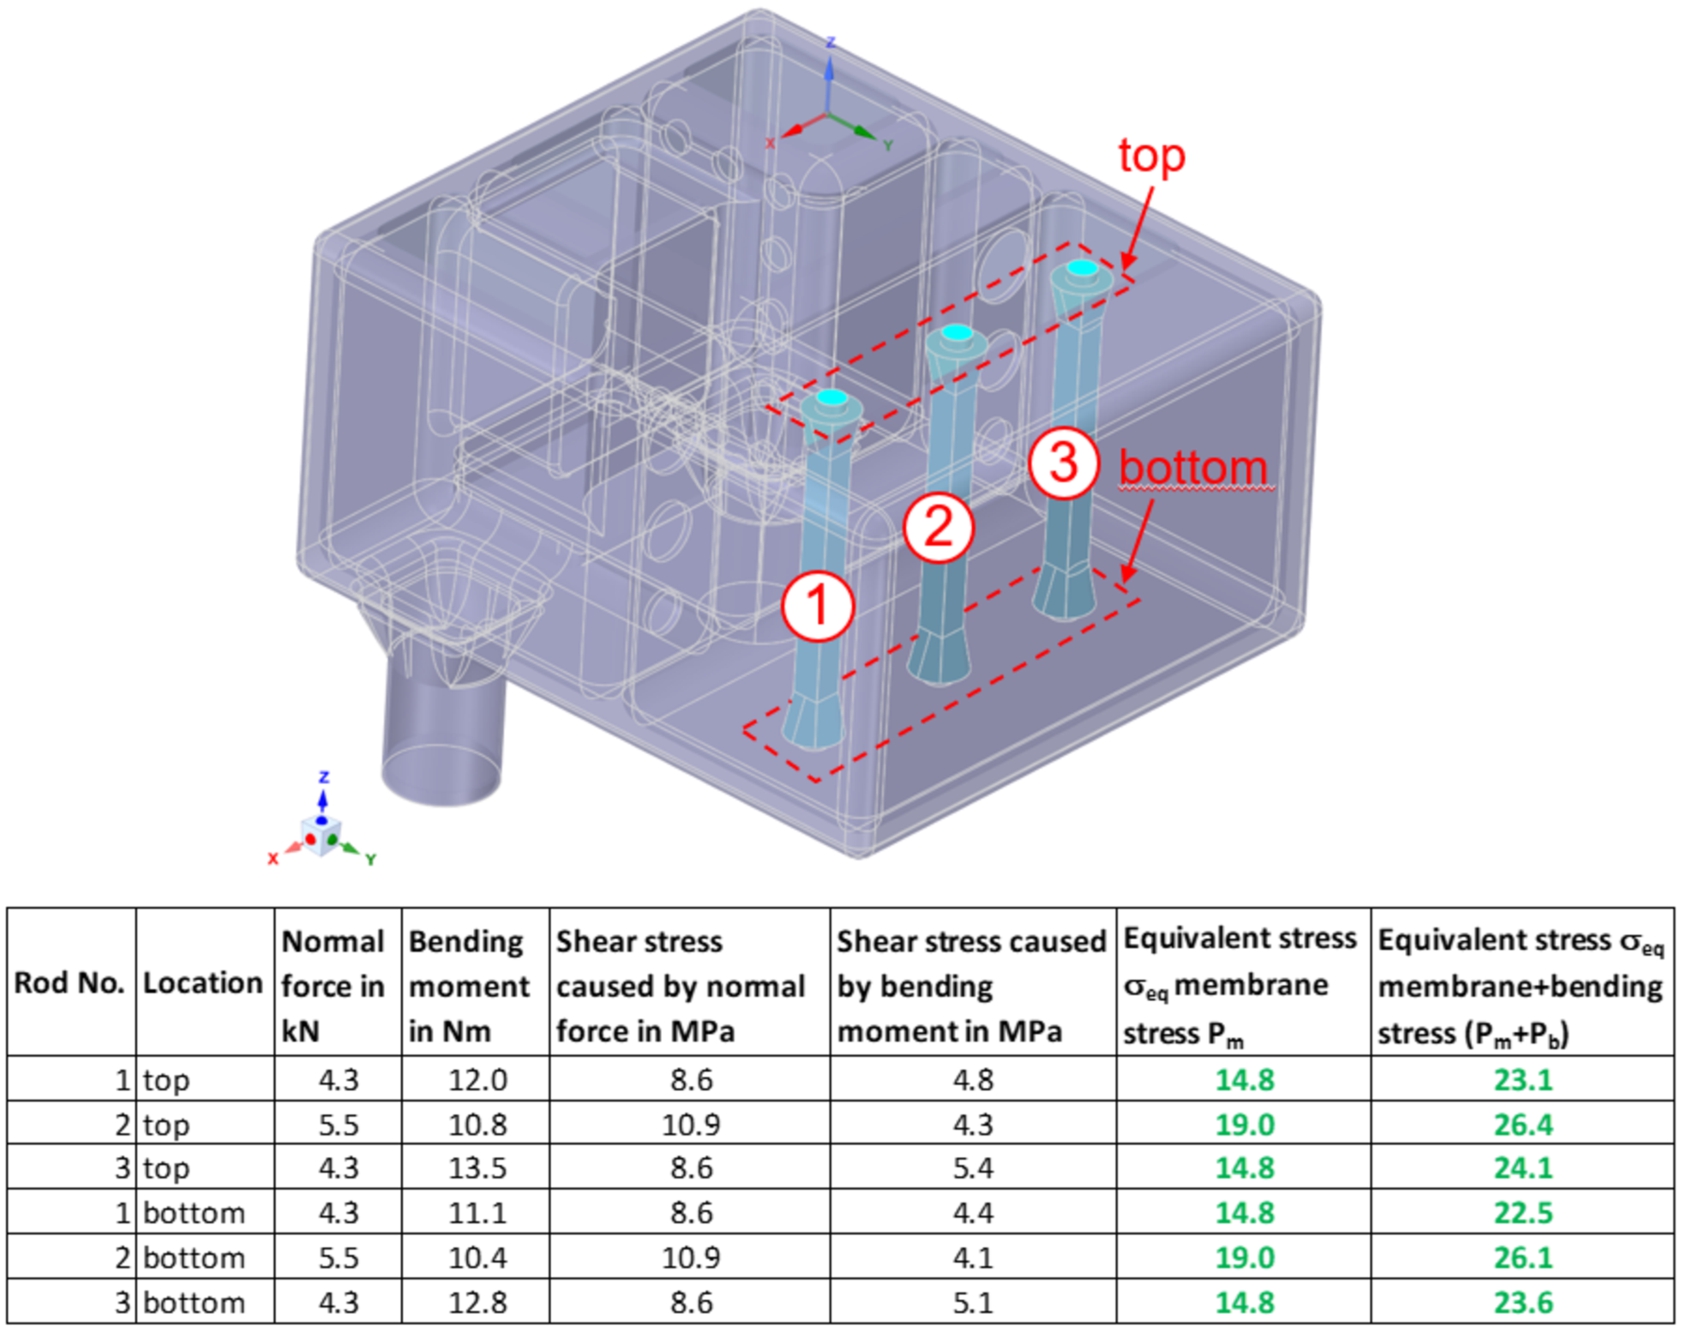
In conclusion, it can be stated that all requirements from a structural mechanical point of view are met, considering the RCC-MRx code.
3.9.Thermohydraulic simulations
The fluid parameters and cooling concepts have been verified by full-scale fluid dynamic simulations. Here, the fluid modeled is the subcooled moderating media LD2 with an average inlet temperature of approximately 21 K. The heat input by neutrons is pulsed, with a 14 Hz pulse frequency and 2.86 ms pulse length based on the ESS proton beam parameters. The allowed temperature increase of deuterium by neutron heat is limited in order to avoid boiling and particularly film boiling. Therefore, the goal for the fluid dynamical simulation is that the fluid temperature does not exceed the boiling temperature at any time.
This goal could not be achieved for the 5 MW load case with the given design and requirements. Further details on this issue and remedial measures are discussed in Section 3.12. The simulations were thus carried out using the design shown at reduced beam power of 2 MW, since ESS will run at this power in the initial operations phase. A corresponding total heat deposition of 28.4 kW was therefore considered in the simulations, using distribution functions derived for the design of the liquid hydrogen moderator of ESS.
The reentrant hole on the WP7 side (window A) of the moderator, opposite to the cold beryllium filter requires special consideration, since it is fully surrounded by LD2 on the interior faces of the moderator. To achieve this, a complex flow pattern of the liquid deuterium through the moderator vessel is needed. The deuterium is guided from the inlet to the outlet via flow distributors and restrictors to ensure a homogeneous flow inside the vessel. In the area of the reentrant hole the flow is split, so that the deuterium can flow above and below it (see Fig. 63).
Fig. 63.
Flow pattern of LD2 through the moderator vessel, below and above the reentrant hole on window A.
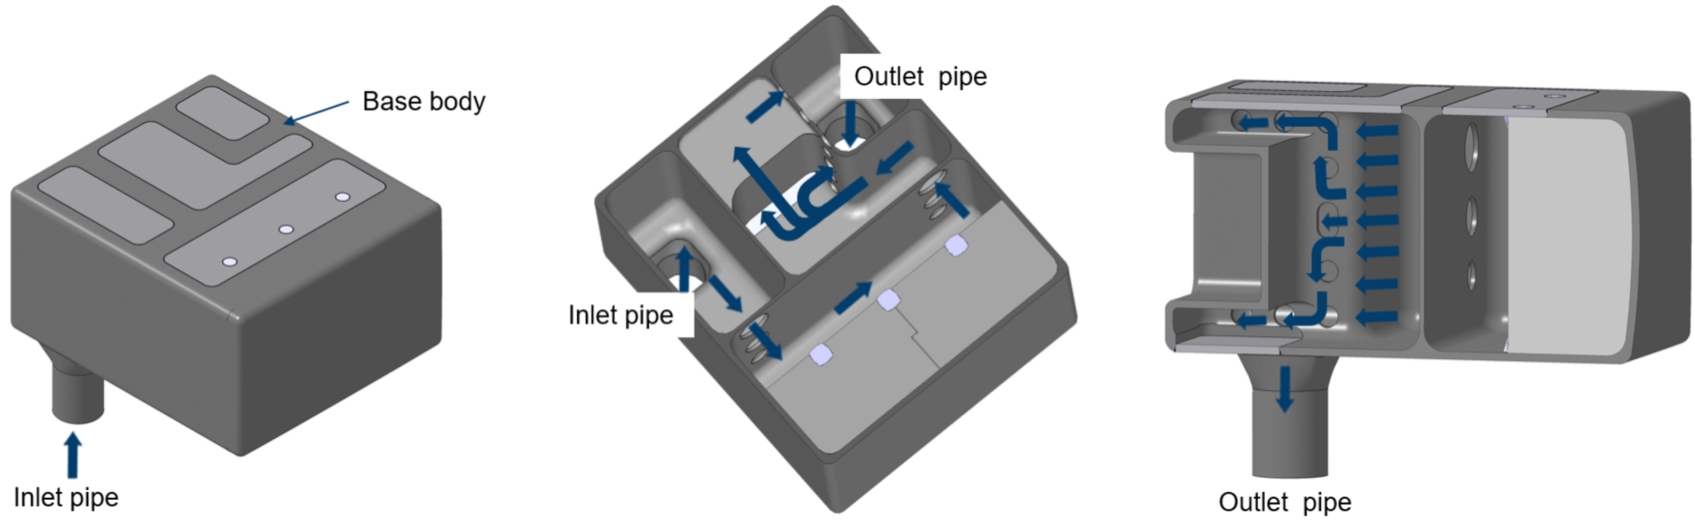
Figure 64 shows the velocity streamlines of the liquid deuterium inside the moderator vessel that result from the CFX analysis [94]. Time-averaged results confirm a pressure drop of 0.15 bar in the moderator and a maximum fluid velocity of 7.26 m s−1 at an inlet velocity of 5.16 m s−1.
Fig. 64.
Velocity streamlines of LD2 inside the moderator vessel.
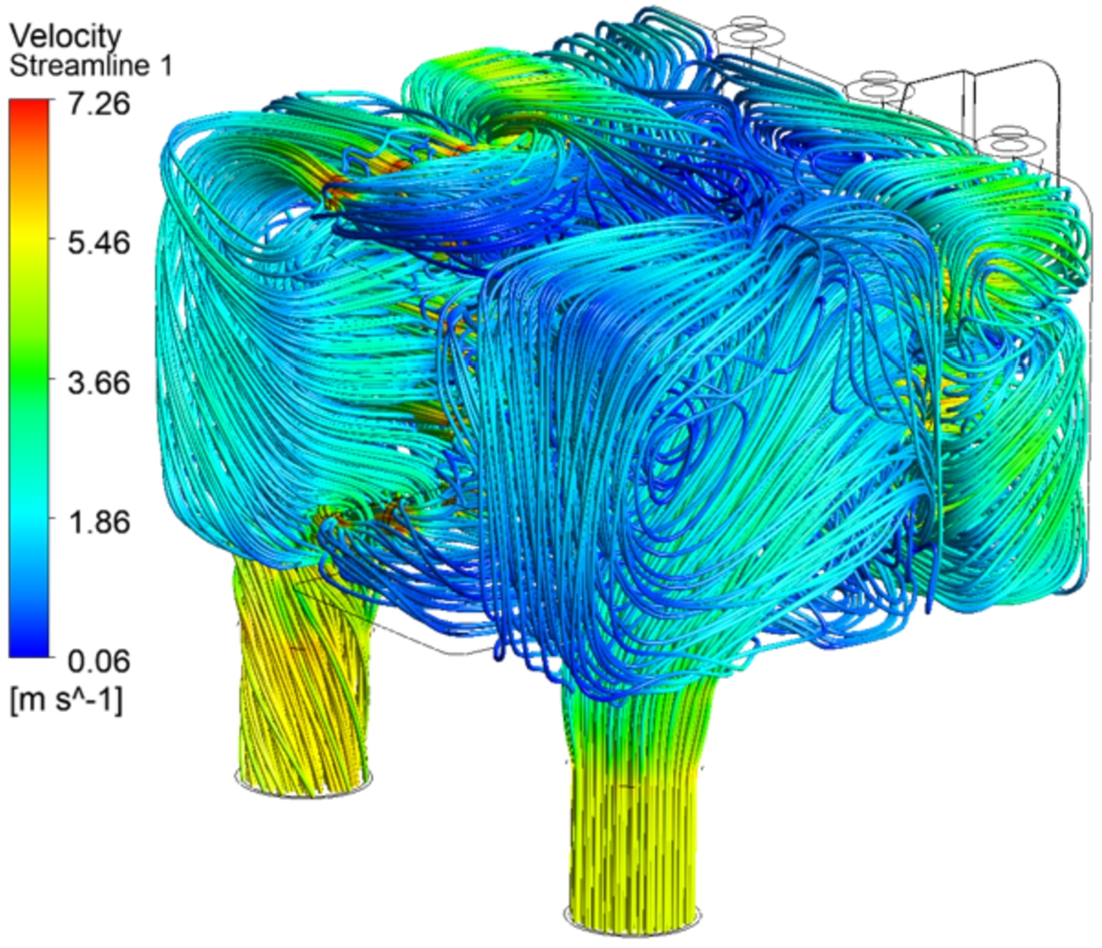
The temperature difference from the inlet to the outlet is 1.4 K with an outlet temperature of 22.4 K (time averaged). The boiling temperature of deuterium at a pressure of 5 bar is 30.6 K. This temperature is reached locally at the inner interface layer between the deuterium and the cold beryllium filter and in the small gap between the cold beryllium filter parts, as shown in Fig. 65, but the main flow is still sufficiently subcooled. Therefore, there is no risk of film boiling.
Fig. 65.
Time-averaged fluid temperatures for the LD2 moderator.
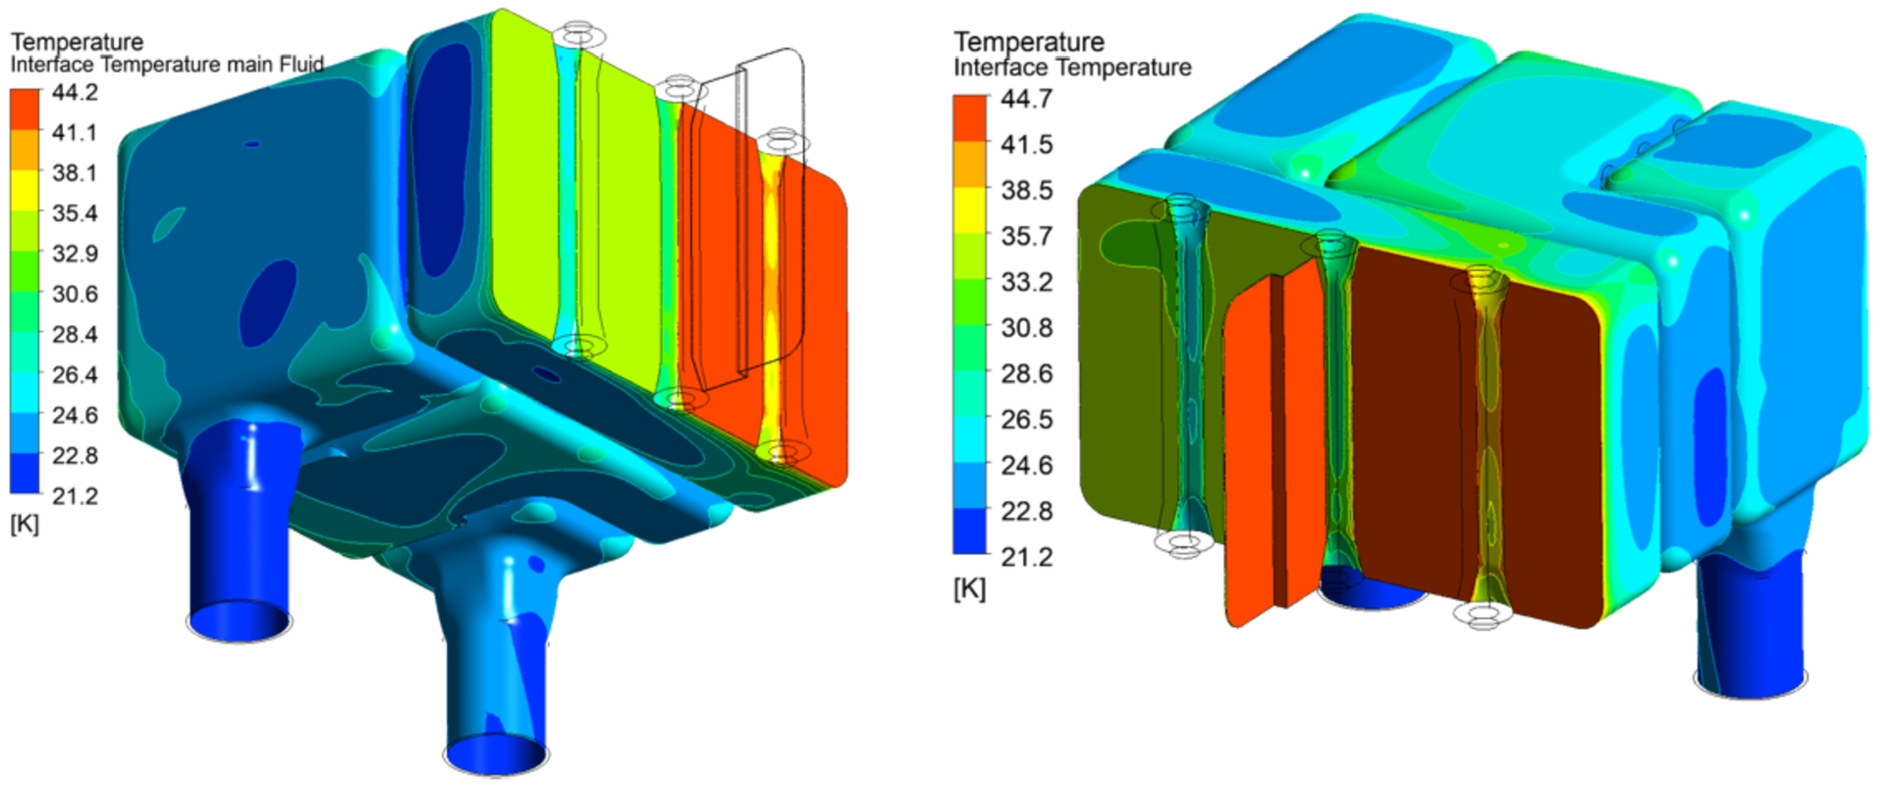
In summary, it can be said that the fluid mechanical requirements for the 2 MW load case are met, if local boiling at the beryllium filter – fluid inner interface is allowed. So, there are no concerns from an operational safety point of view.
3.10.Design solution of the vacuum vessel
Fig. 66.
Assembly of outer vessel for the lower moderator.
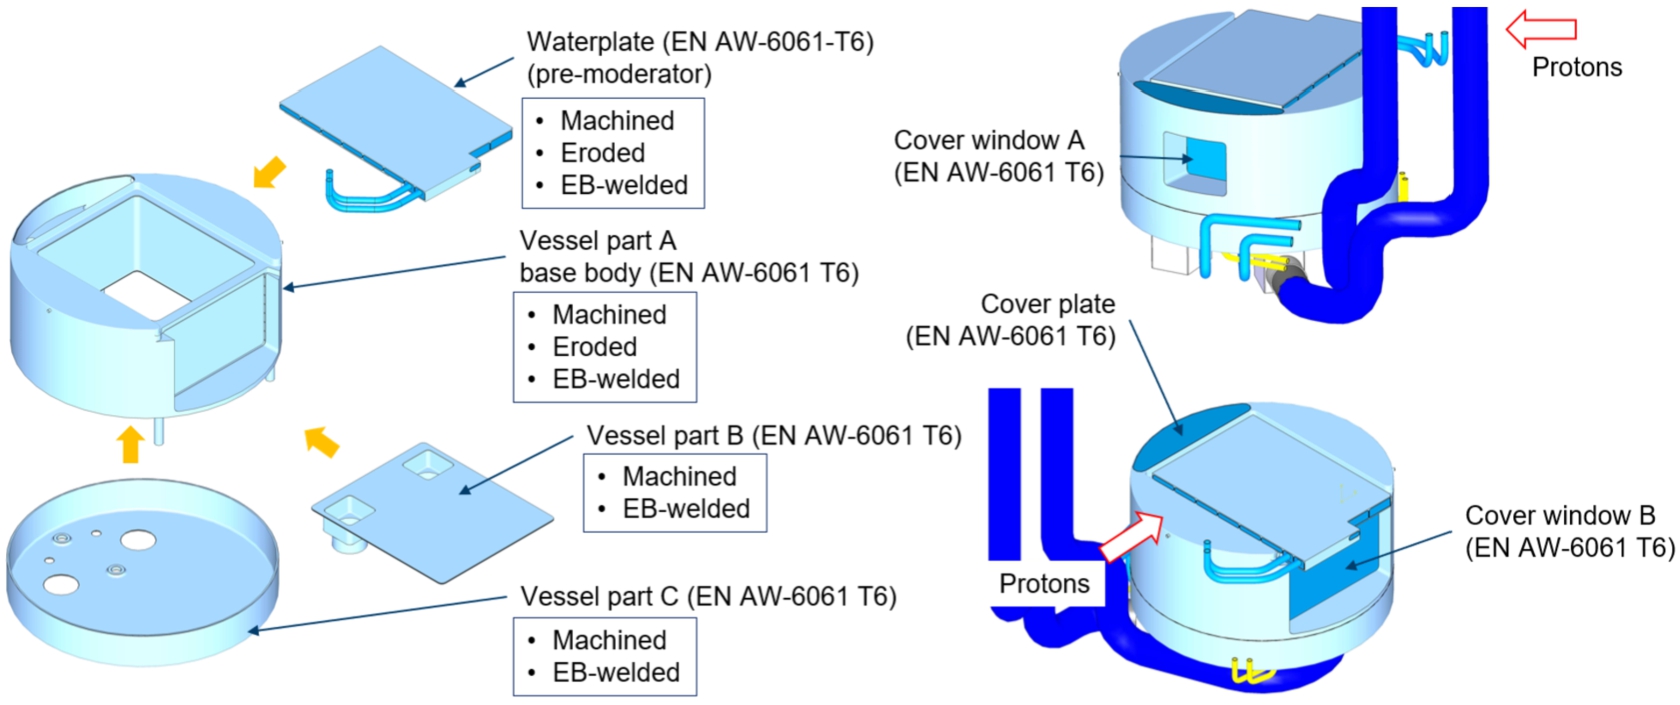
The outer vessel shown in Fig. 66 consists of multiple parts that are combined inside a vessel made of EN AW-6061 T6 aluminum alloy. This vessel and the involved reflector parts also enable the water cooling of the beryllium (Be) reflector. Between the Be-reflector and the inner LD2 moderator there is an insulation vacuum gap of 5 mm to minimize the heat transfer between the cold and warm parts.
Figure 67 shows the different parts of the assembly, that consists of the center LD2 moderator, the warm beryllium reflector parts, and the outer aluminum vessel.
Fig. 67.
Assembly of the lower moderator plug – parts overview.
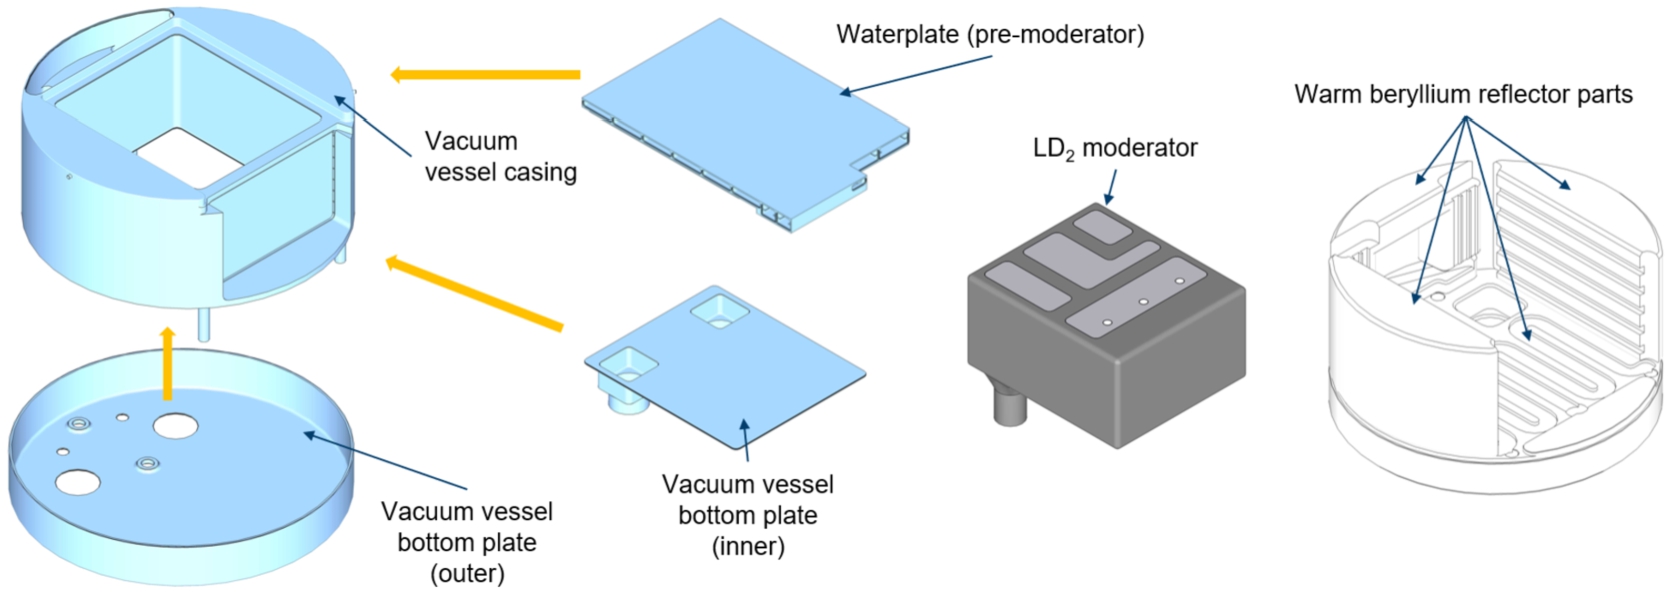
Fig. 68.
Flow pattern of water through the premoderator.
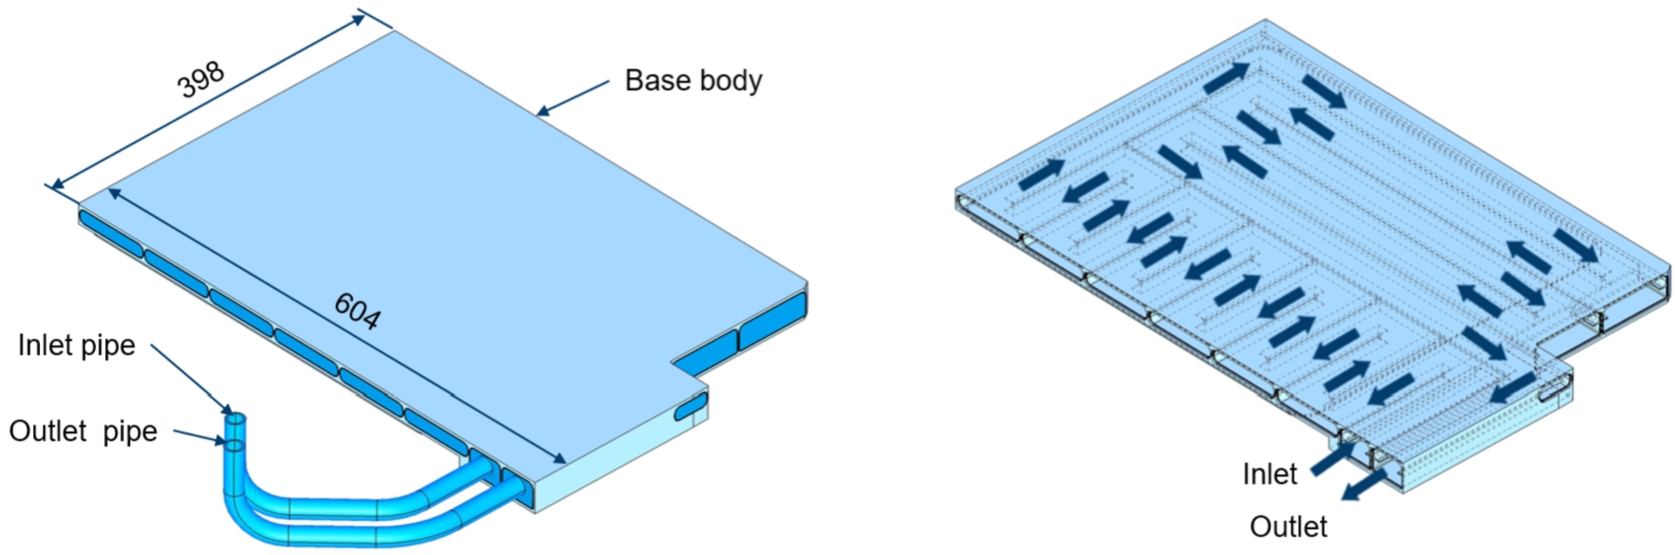
The water disc on top of the moderator plug assembly works as a premoderator for the fast neutrons released by the tungsten target. Figure 68 shows the flow pattern of water through the premoderator, that is located on top of the lower moderator plug.
It is assembled as shown in Fig. 69. Above the bigger neutron window B, also warm beryllium reflector parts are inserted and the milled and eroded water channels inside the water disc are closed via electron-beam welding.
Fig. 69.
Assembly and EB-welding detail of the premoderator.
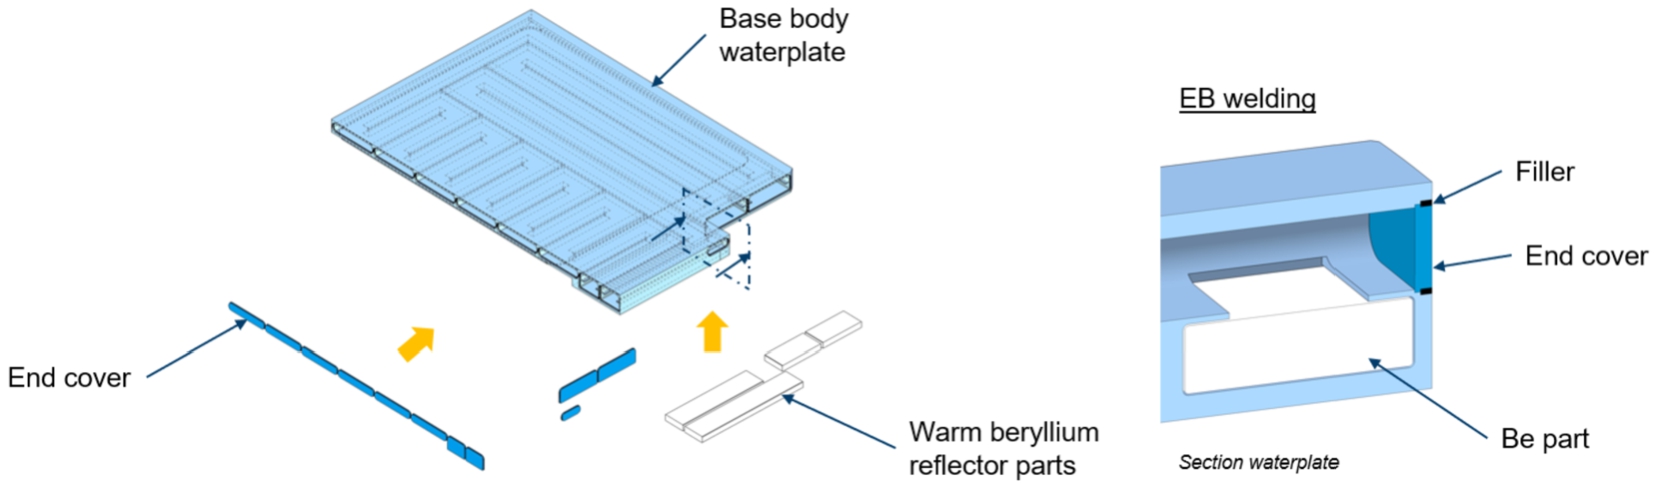
Figure 70 to Fig. 76 show the flow pattern of water through the warm beryllium reflector parts inside the outer vessel, shown in progressive vertical cross-sections. At first the water enters through the inlet on the bottom side of the outer vessel and is afterwards distributed to the bottom part of the warm beryllium reflector.
Fig. 70.
Flow pattern of water through the warm beryllium reflector parts, section A.
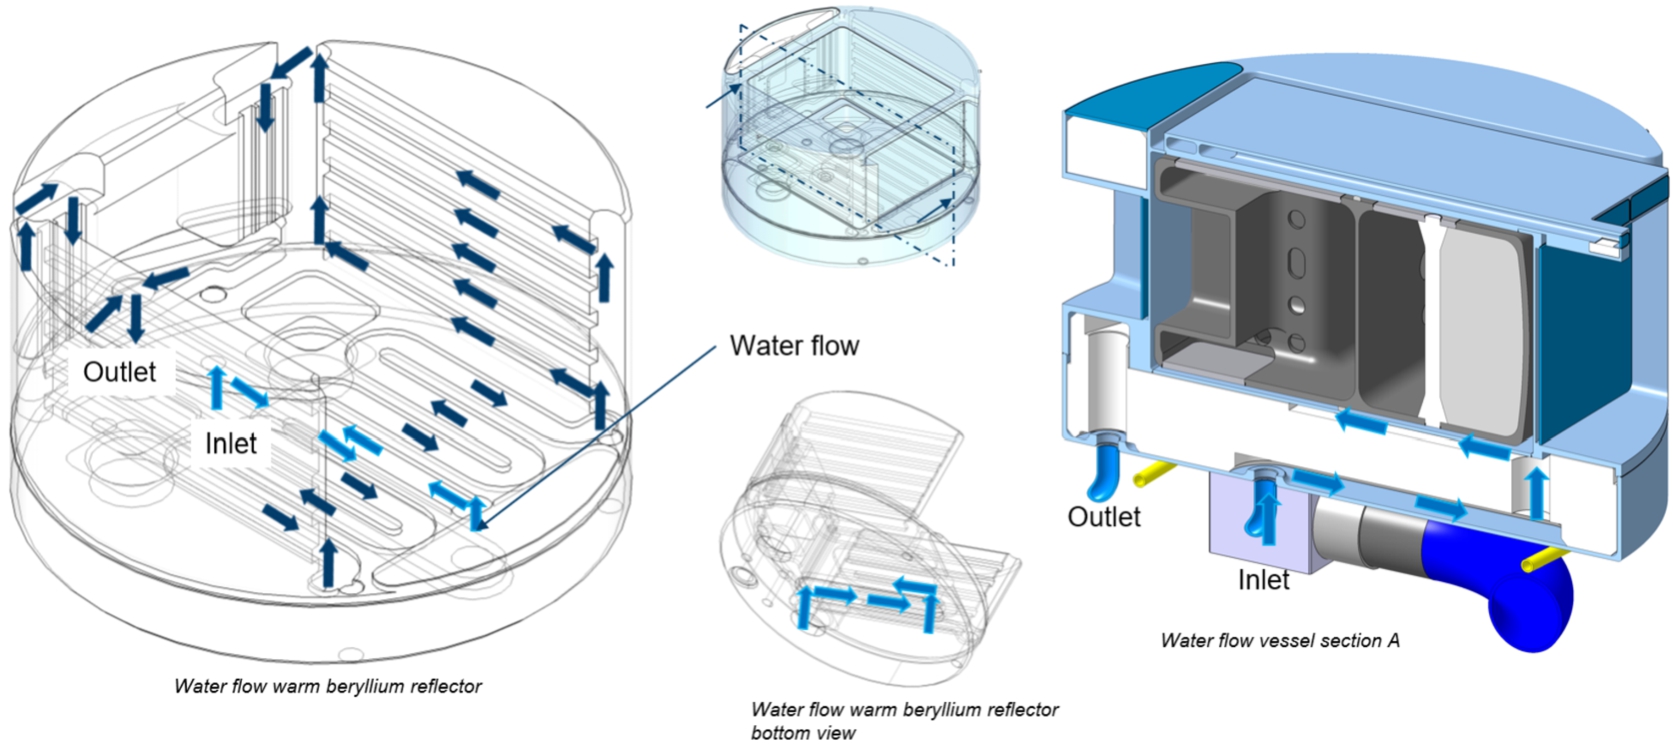
Fig. 71.
Flow pattern of water through the warm beryllium reflector parts, section B.
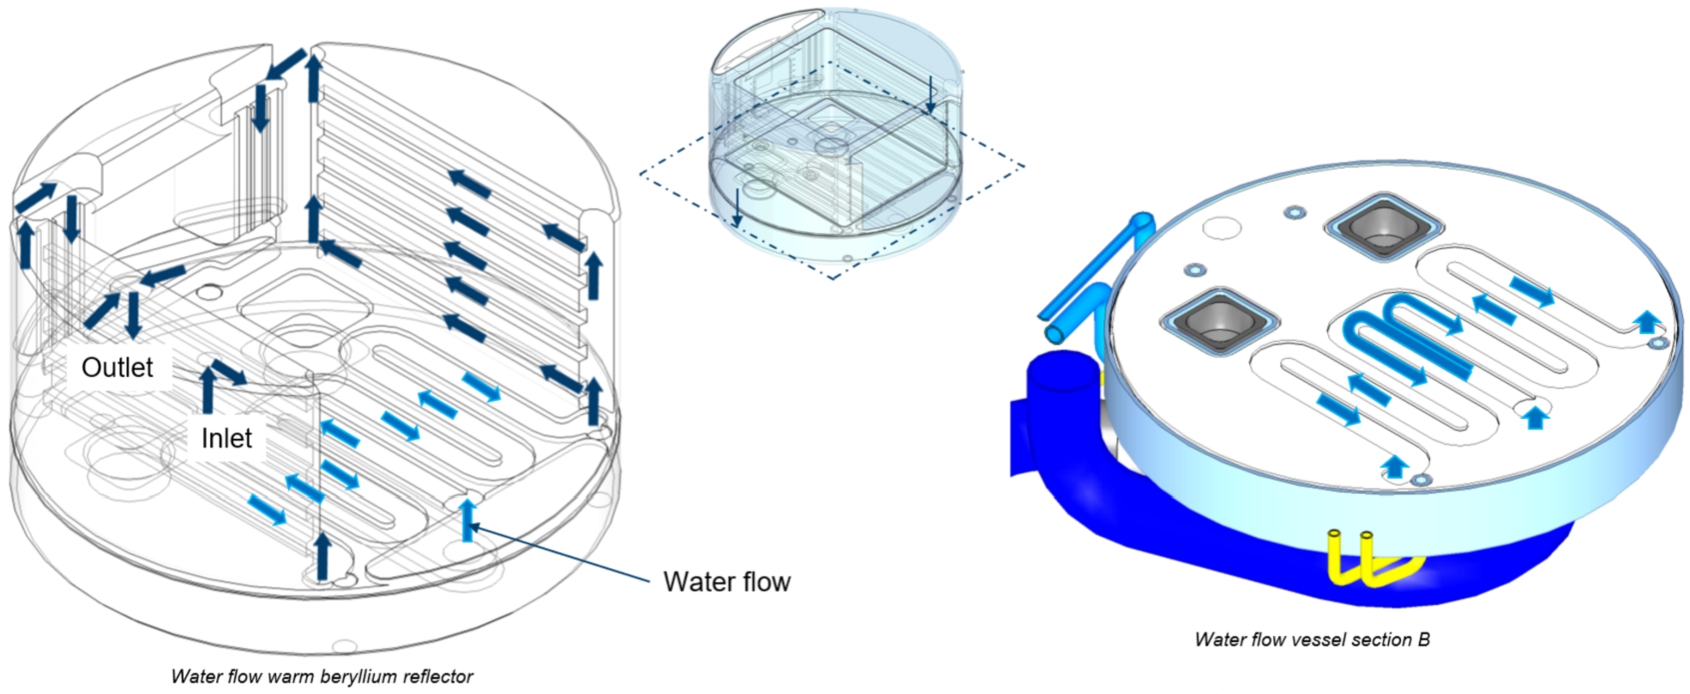
In this bottom part, the flow is separated into two parallel flows that go upwards along each side of the NNBAR opening (Fig. 71).
Fig. 72.
Flow pattern of water through the warm beryllium reflector parts, section C.
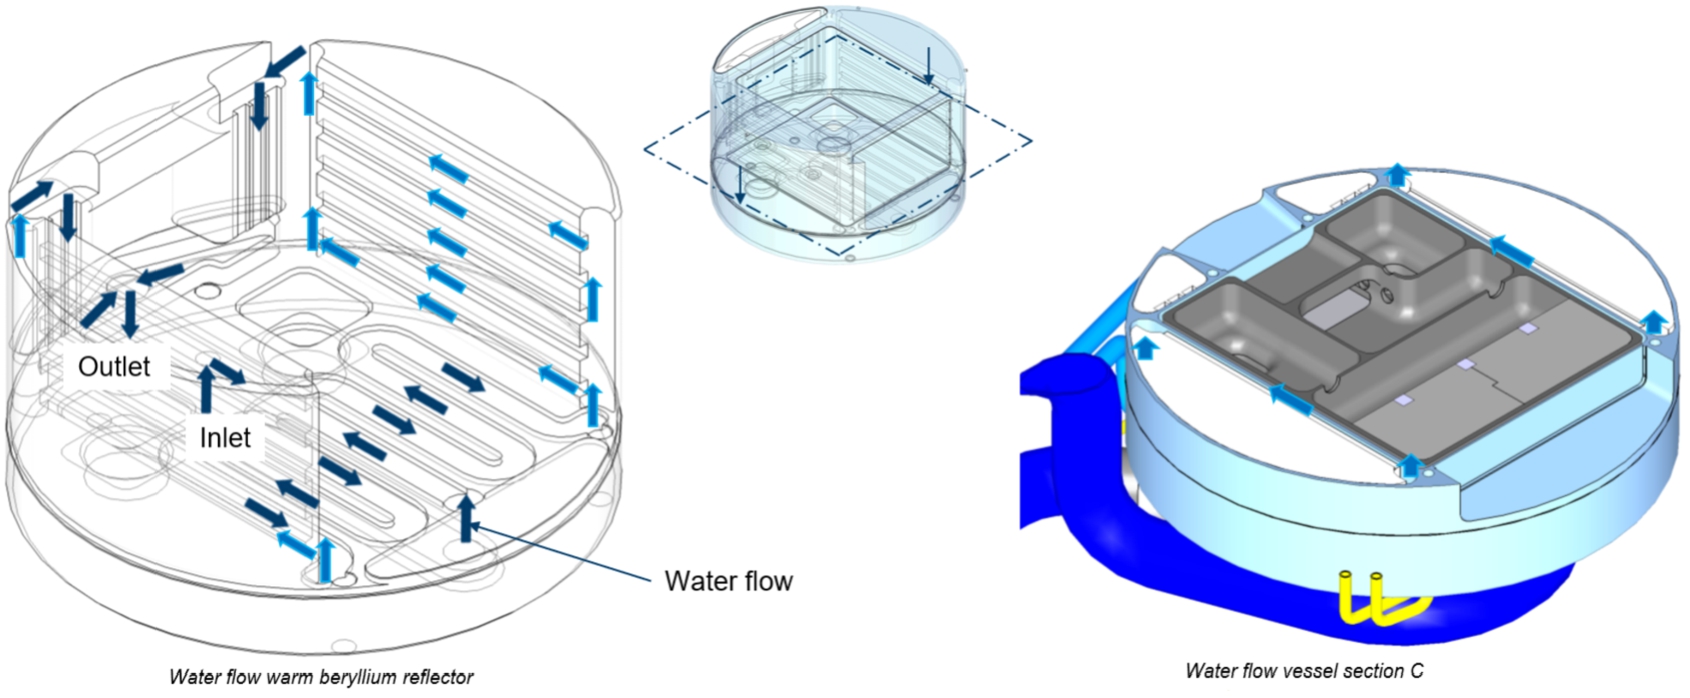
Fig. 73.
Flow pattern of water through the warm beryllium reflector parts, section D.
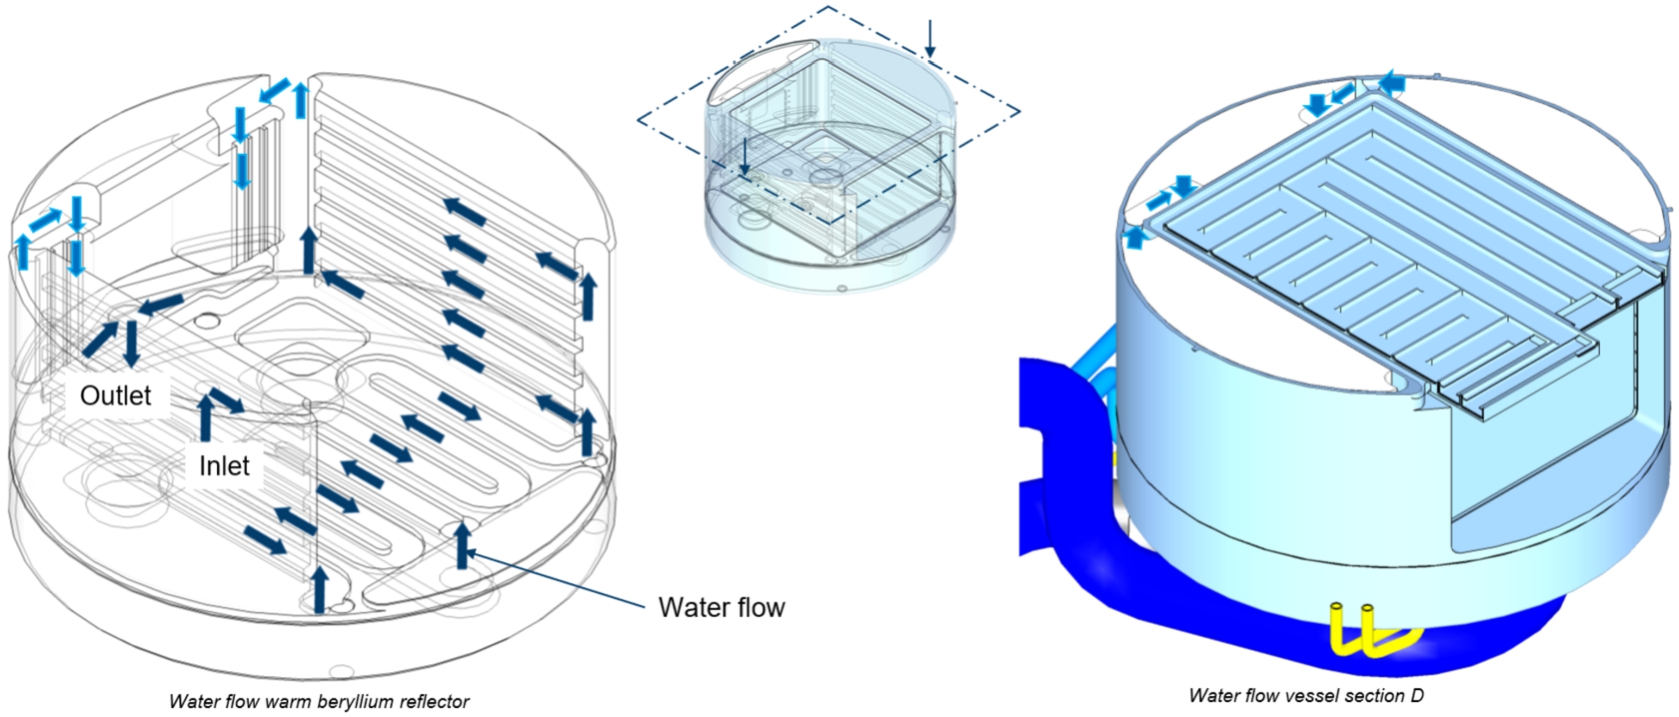
Fig. 74.
Flow pattern of water through the warm beryllium reflector parts, section E.
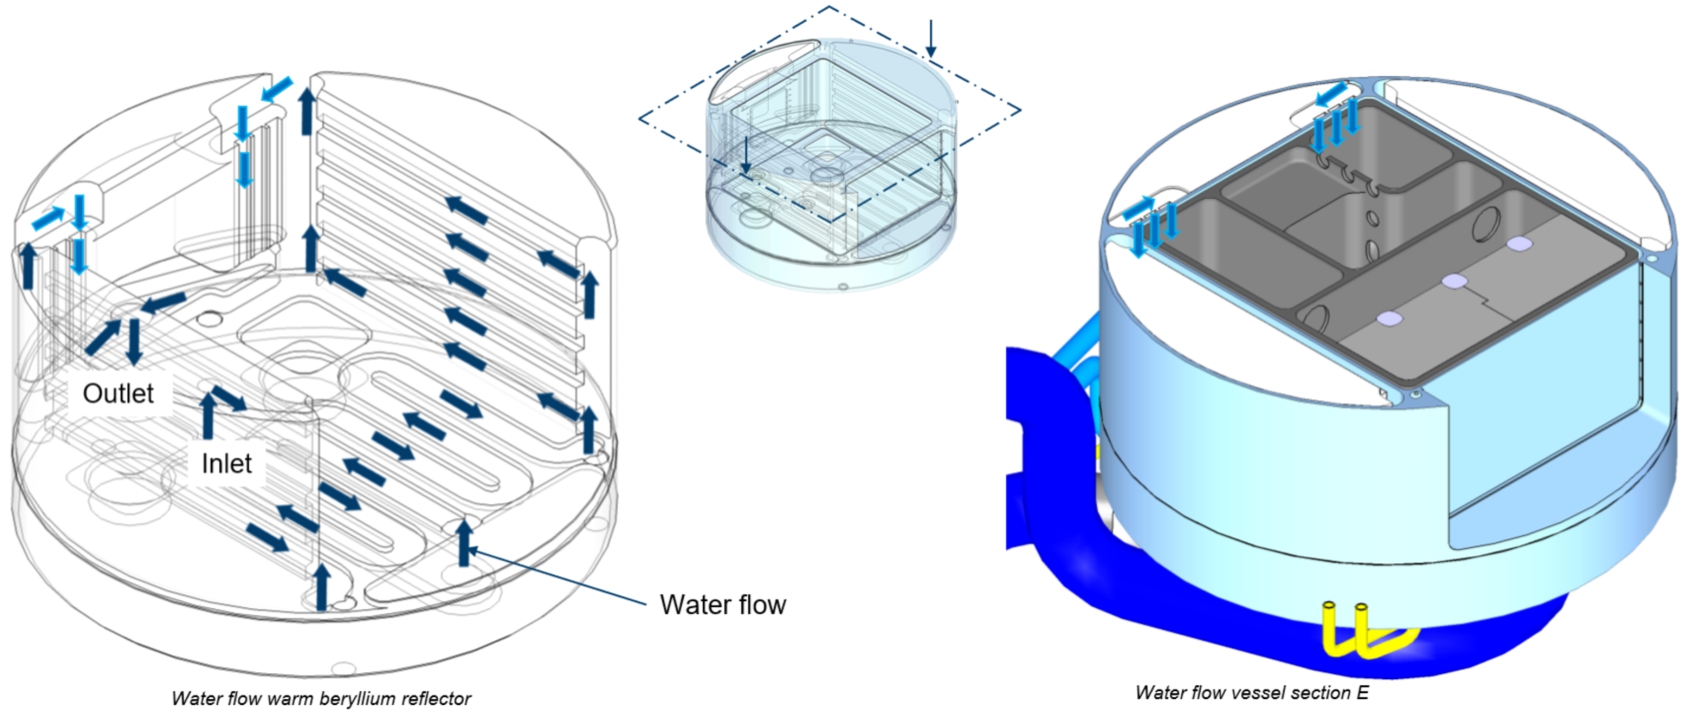
Fig. 75.
Flow pattern of water through the warm beryllium reflector parts.
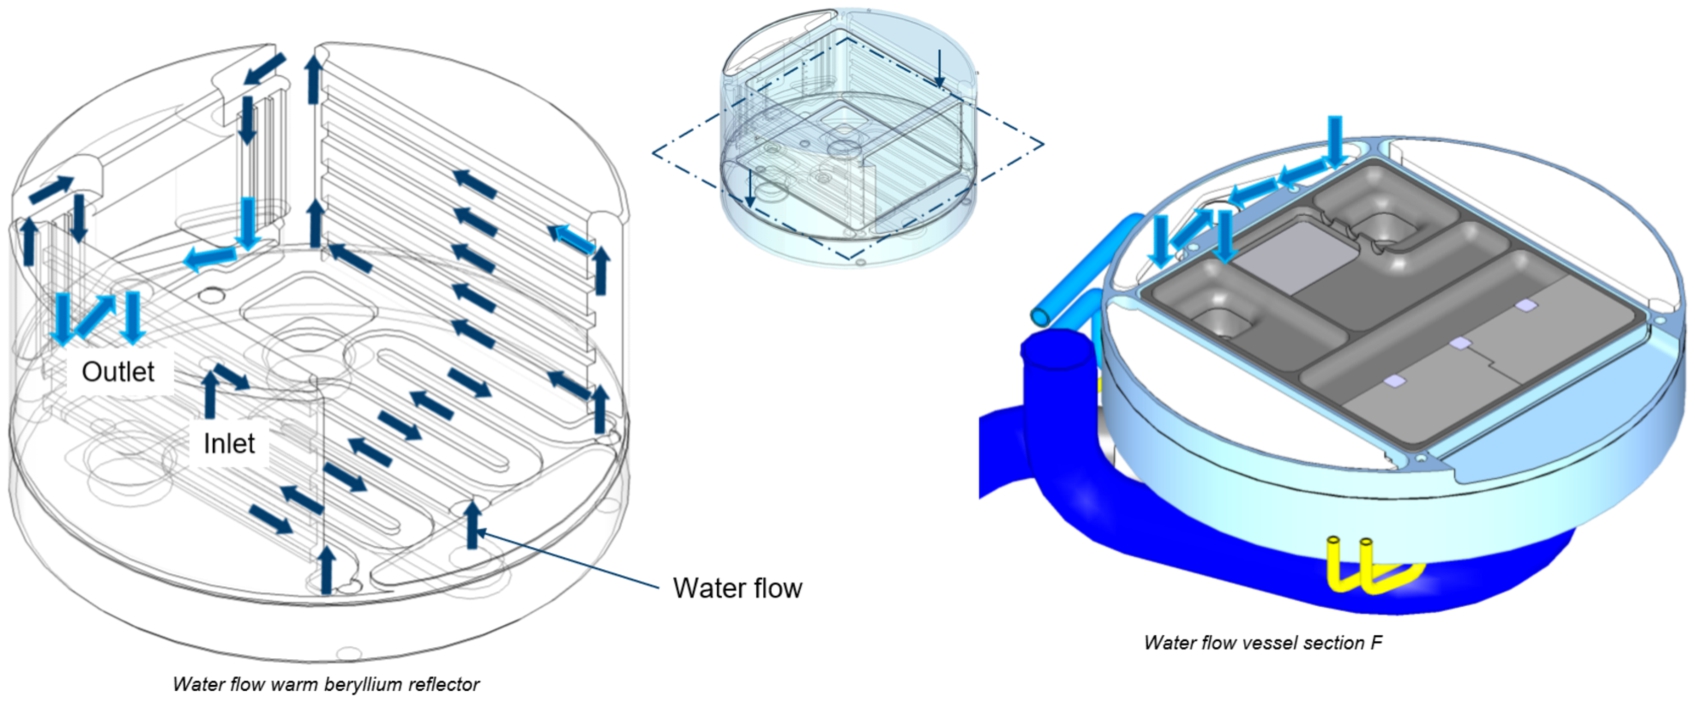
Fig. 76.
Flow pattern of water through the warm beryllium reflector parts.
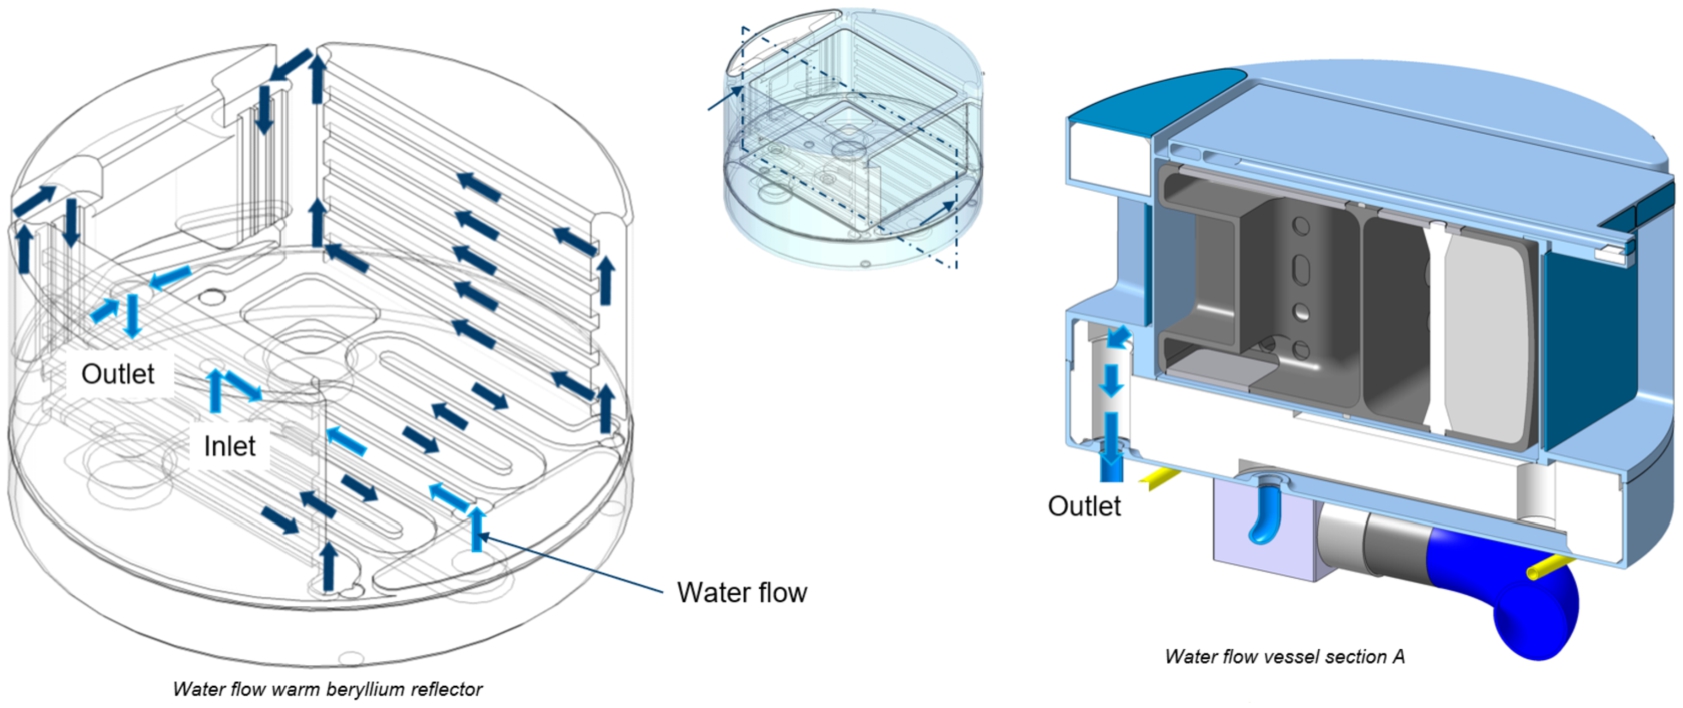
While flowing toward the top, the water is also distributed alongside the side pieces of the warm beryllium reflector, as shown in Fig. 72.
When the smaller neutron window A opening is reached in Fig. 73 and Fig. 74, the water flows downwards again.
Next, the water flow is guided below the smaller neutron window A opening, through the warm beryllium filter parts underneath it (Fig. 75).
Finally, the flow is guided to the outlet pipe at the bottom side of the lower moderator plug, as shown in Fig. 76.
The assembly sequence of the outer vessel is then shown in Fig. 77 to Fig. 83. At first, the water disc premoderator is welded to the top of the outer vessel via electron-beam welding (Fig. 77).
Fig. 77.
Assembly and EB-welding of the vacuum vessel (premoderator).
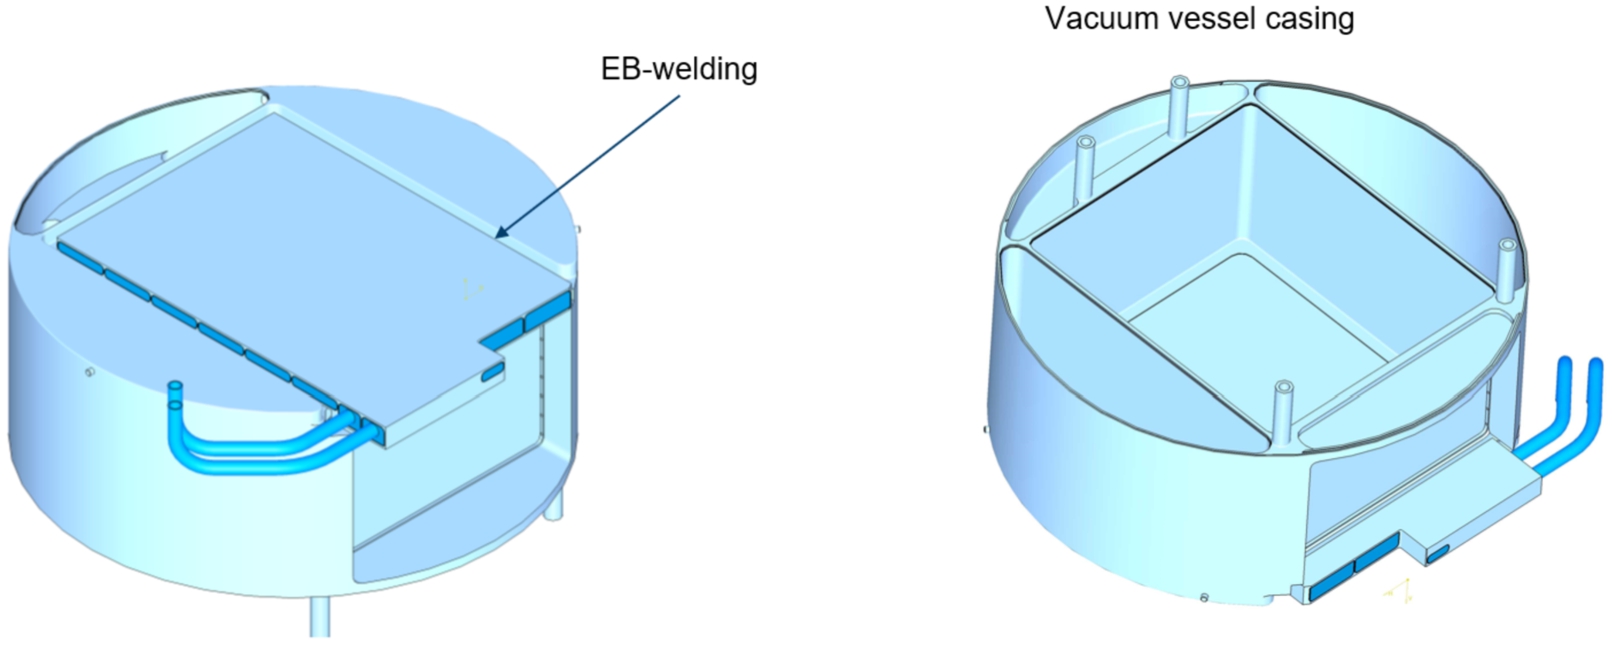
The vessel is then flipped upside down and the LD2 moderator in inserted. After this is complete, the inner bottom plate of the vacuum vessel is welded on via electron-beam welding (Fig. 78).
Fig. 78.
Assembly and EB-welding of the vacuum vessel (inner bottom plate).
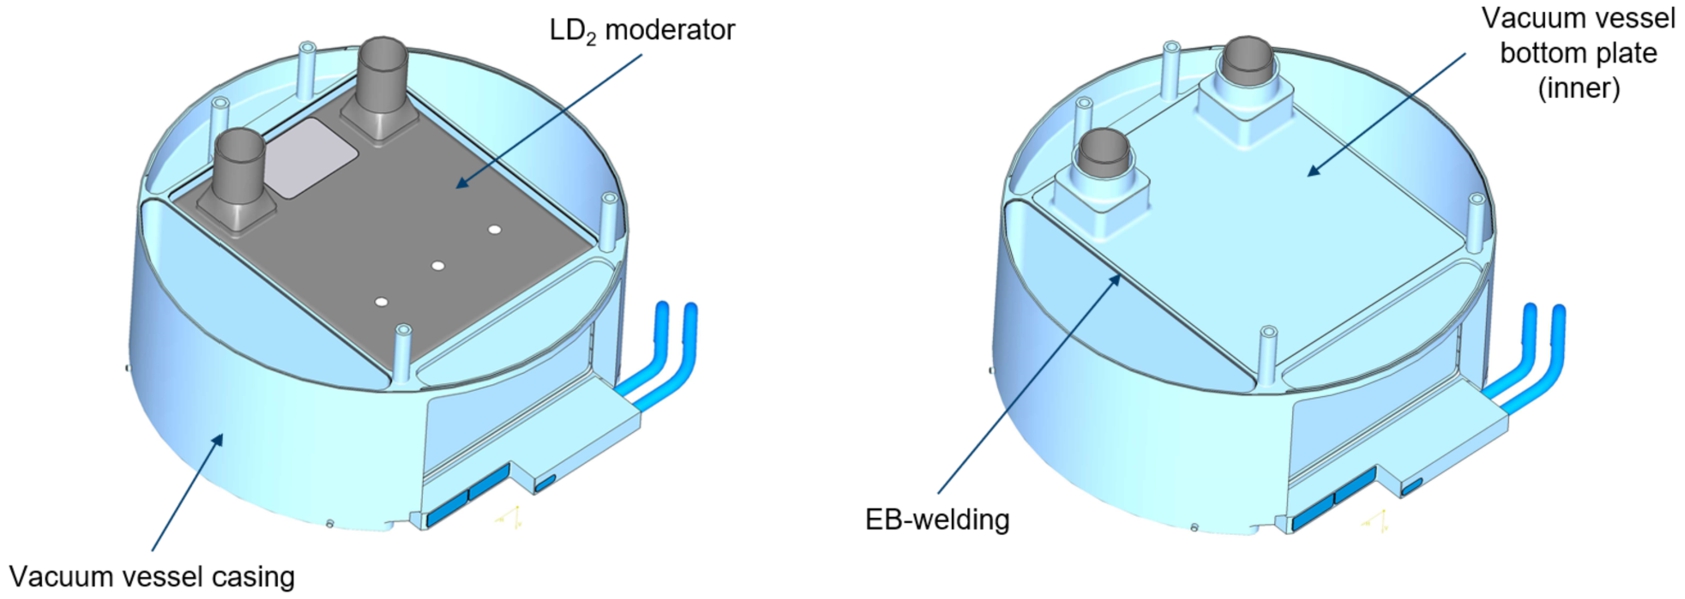
Figure 79 shows how the moderator is positioned inside the insulation vacuum. It will rest on titanium pins on the top and the bottom of the moderator vessel. Titanium as a material is chosen for the positioning pins, because of its relatively low thermal conductivity – to minimize the heat transfer between the moderator and the vacuum vessel – and for its radiation resistance.
Fig. 79.
Positioning of the LD2 moderator inside the vacuum vessel.
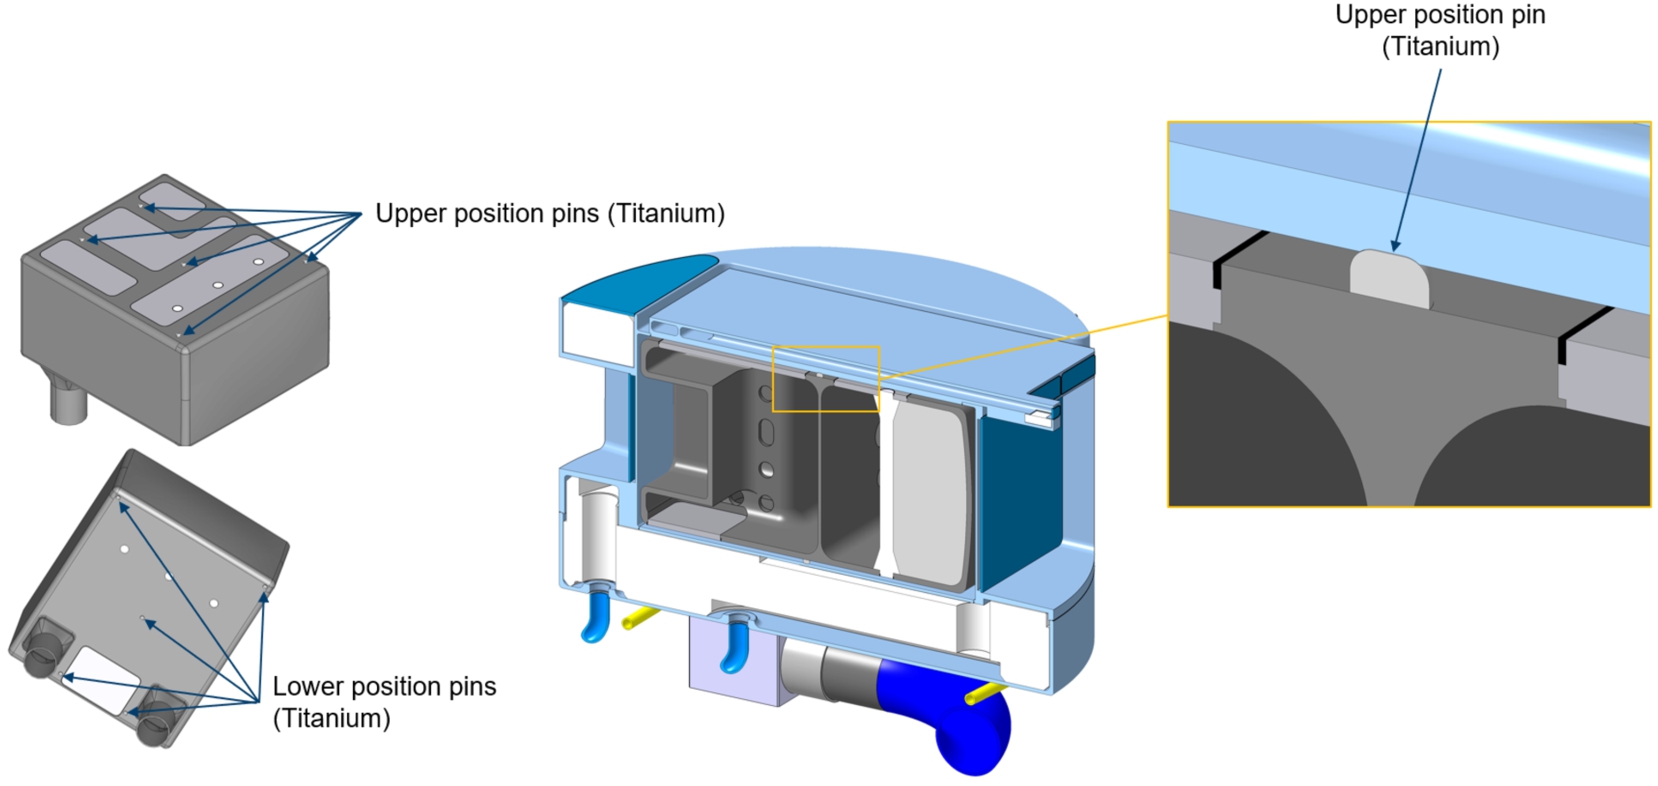
When the insulation vacuum around the moderator is successfully closed, the side segments of the warm beryllium reflector are inserted and the outer vessel is closed with the vacuum vessel closing discs via electron-beam welding (Fig. 80).
Fig. 80.
Assembly and EB-welding of the vacuum vessel (Be reflector side segments).
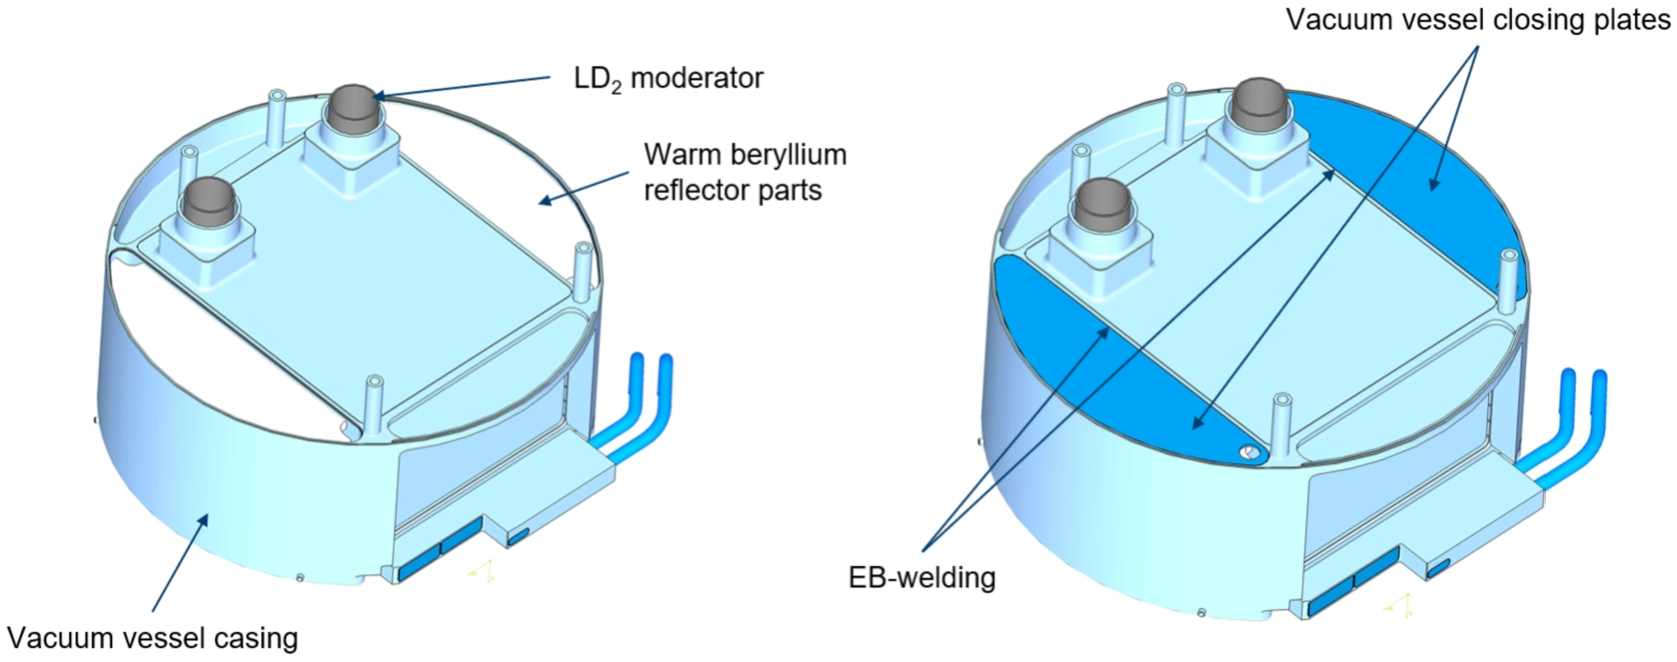
Then the warm beryllium reflector parts above the WP7 window A (Fig. 81) and the large bottom reflector part below the moderator (Fig. 82) can be mounted and afterwards covered and sealed via electron-beam welding.
Fig. 81.
Assembly and EB-welding of the vacuum vessel (Be reflector segment above WP7 window A).
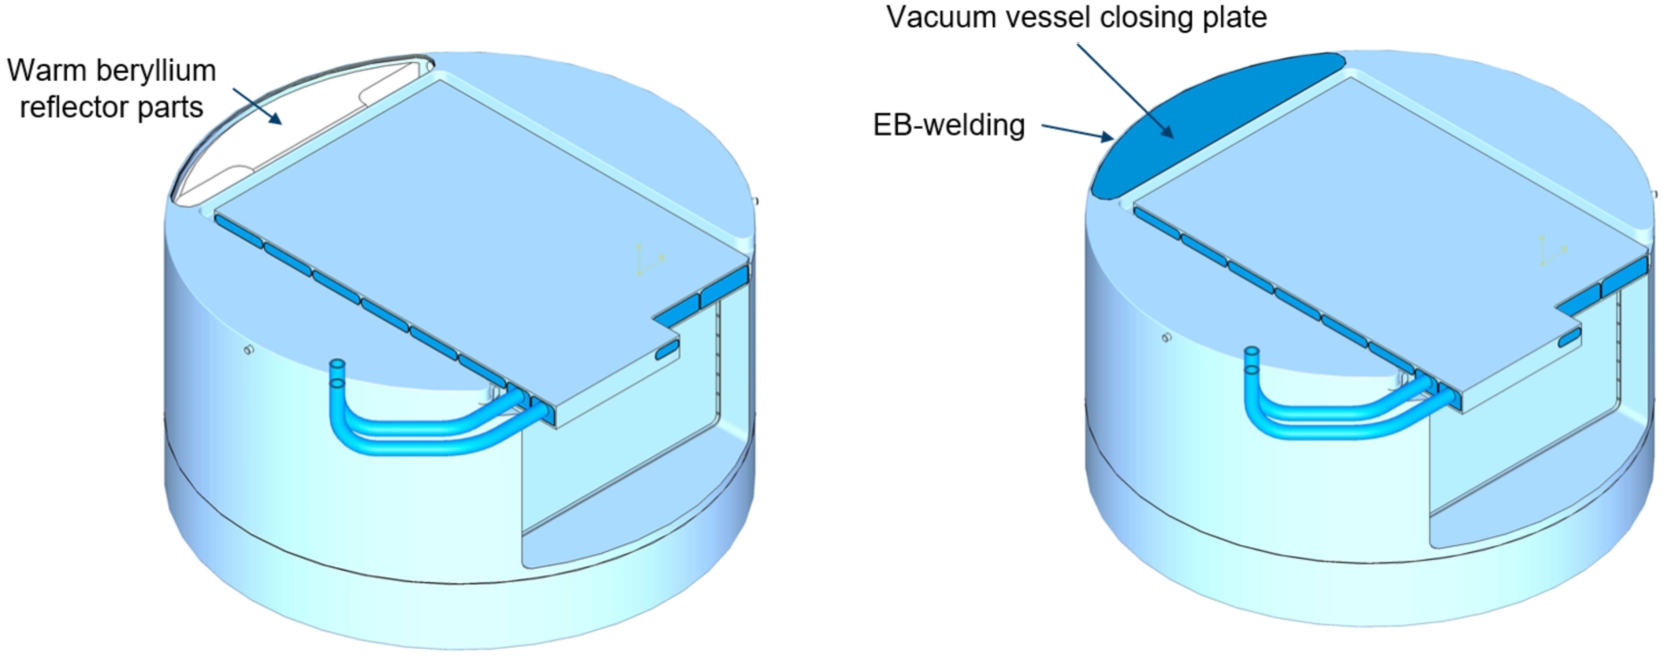
Fig. 82.
Assembly and EB-welding of the vacuum vessel (large Be reflector below the moderator).
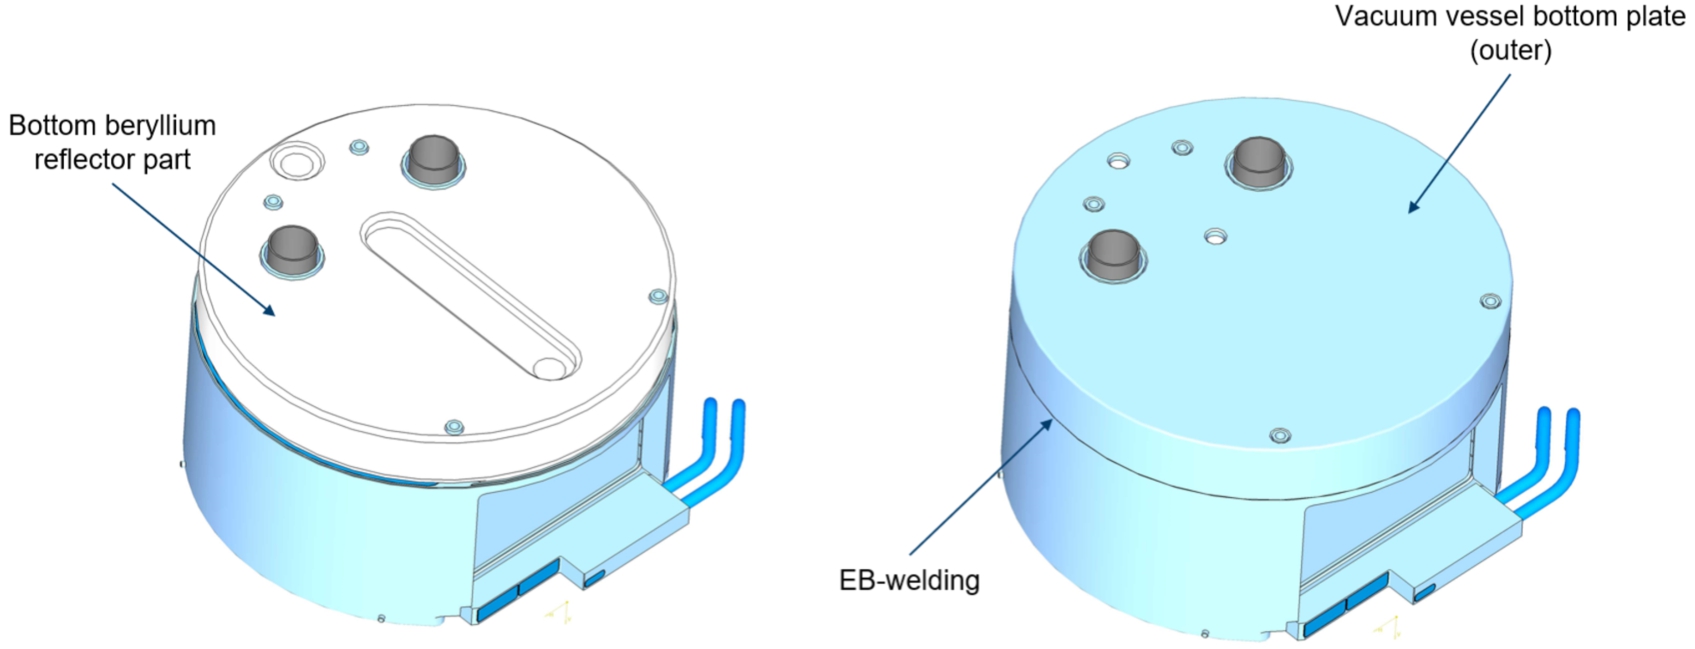
In a final step, the cover plates for the actively cooled neutron windows A & B can be welded on via electron-beam welding, as shown in Fig. 83.
Fig. 83.
Assembly and EB-welding of the vacuum vessel (cover plates for beam windows).
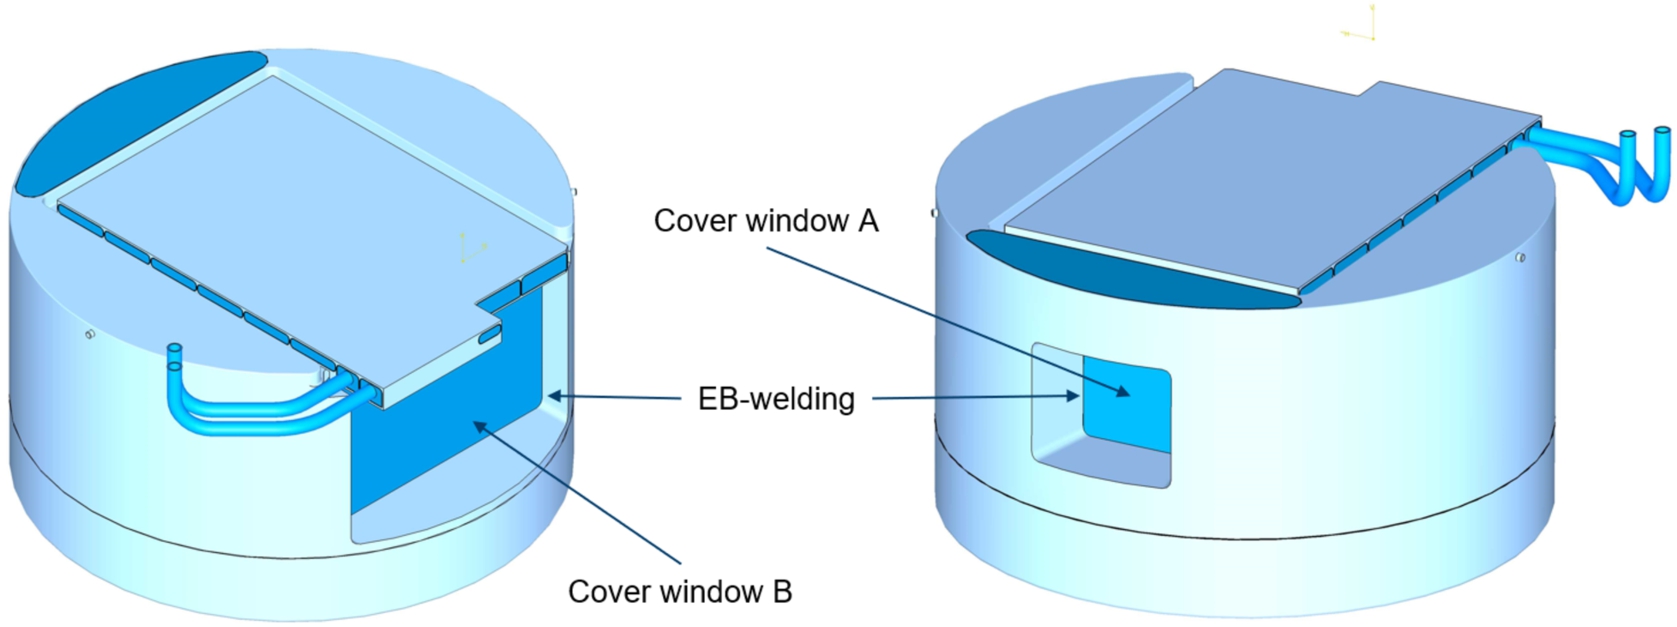
At this point, the pre-assembly is ready for integration into the twister, which will be described in the following section.
3.11.Integrability into the ESS twister
The newly designed moderator and reflector plug must fit into the existing twister frame below the target wheel. Also, all media supply for the moderators and the reflectors needs to be guided through the existing design of the twister shaft, since the surrounding shielding elements are not exchangeable and therefore a larger twister shaft diameter is not possible. In addition to the supply media for the first generation LH2 moderator and its beryllium reflector above the target wheel, the lower moderator plug needs an additional supply lines for liquid deuterium, water for the premoderator, helium for the cooling of the neutron windows, water for the warm beryllium reflector, and vacuum for insulation. The designated location of the different media and the supply-pipe routing through the existing twister shaft are shown in Figs 84 and 85.
Fig. 84.
Media interfaces on the lower moderator plug.
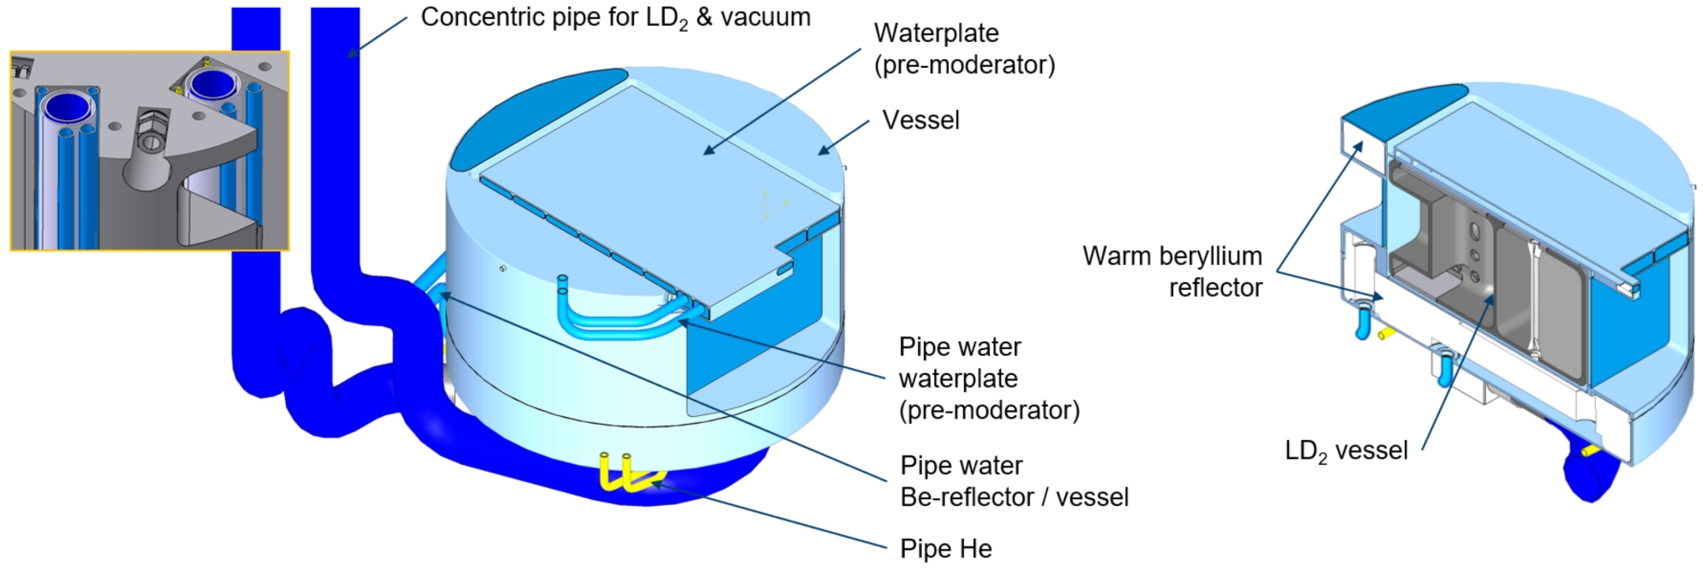
Fig. 85.
Twister integration and interface description.
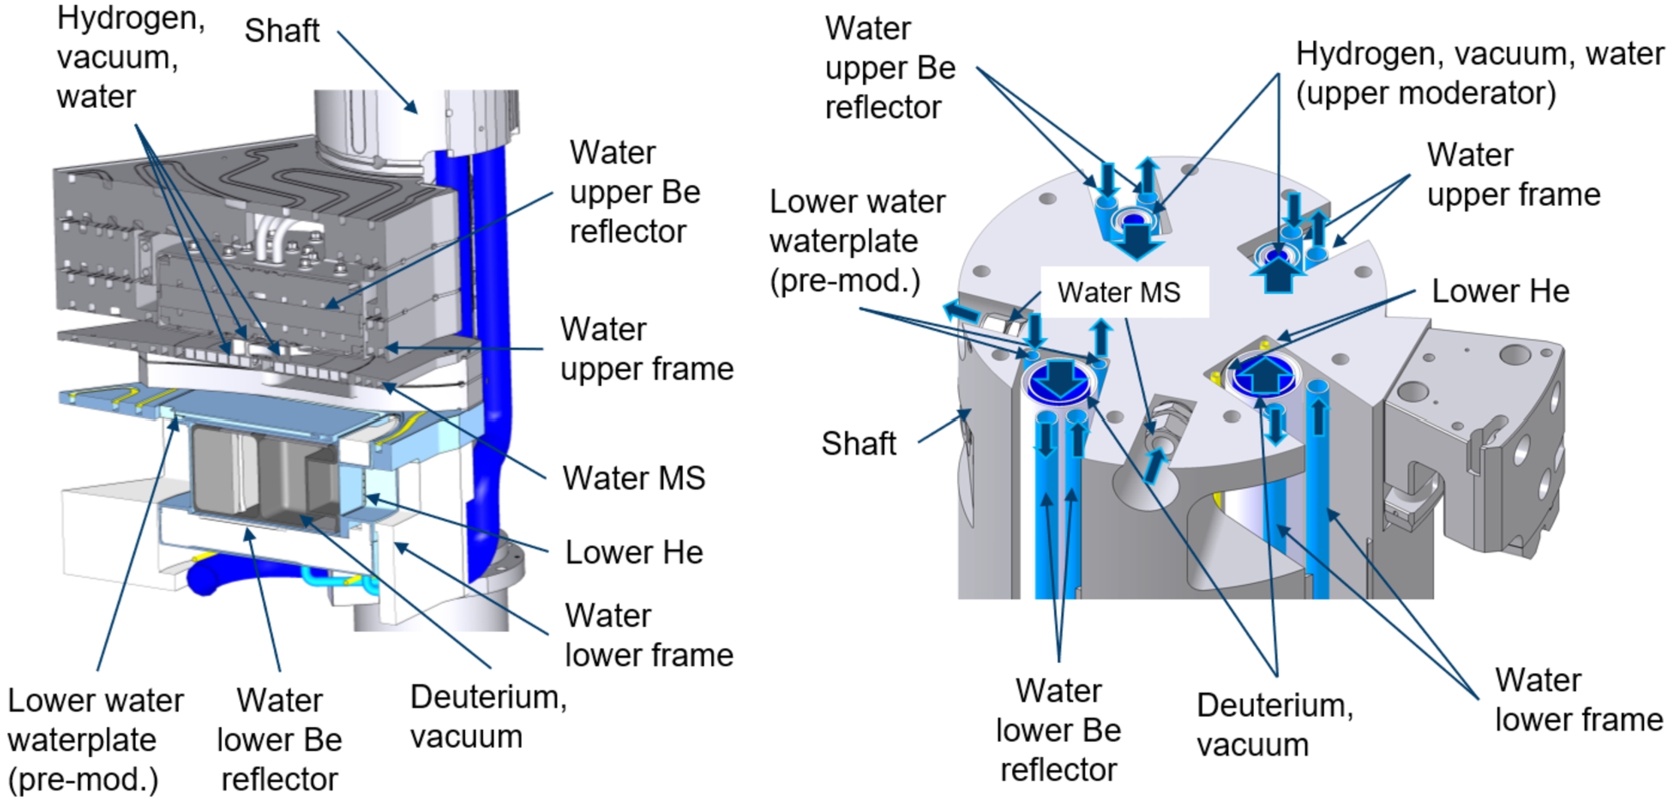
The attachment and integration of the lower moderator plug into the twister, underneath the target wheel, is illustrated in Figs 86 and 87. The outer vessel has three assembly pins radially installed on the outer cylindrical surface. The corresponding part in the twister is the lower mounting socket, where three slots with a bayonet-catch shape are implemented.
Fig. 86.
Assembly of the lower moderator plug to the twister (mounting details).
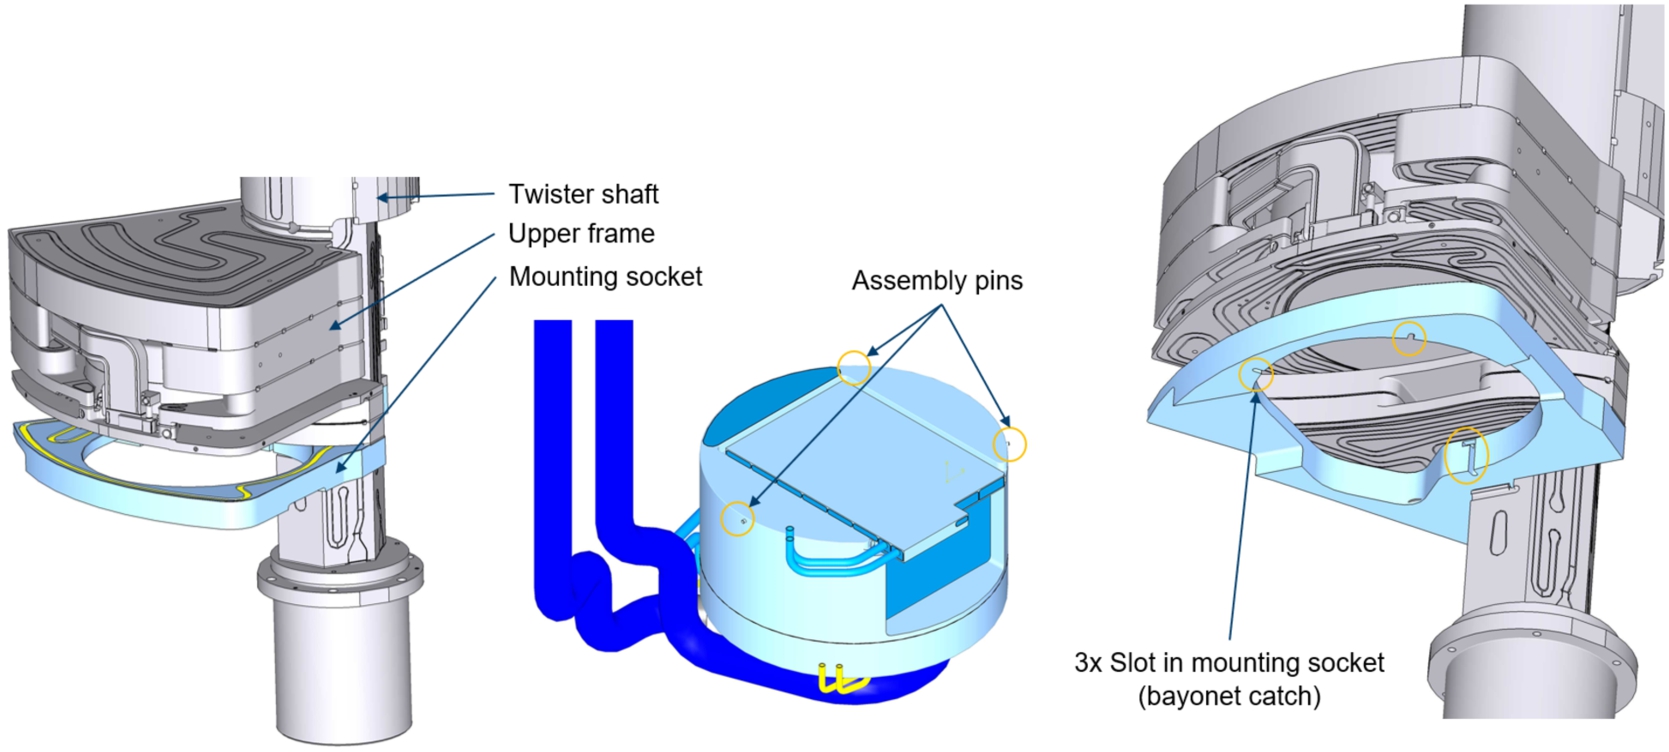
With this mechanism, the moderator plug can be inserted into the mounting socket from below and then is aligned to its final position by turning. After the plug is fixed in the mounting socket, the lower frame can be assembled to the twister shaft and welded to the mounting socket, to complete the stainless-steel shielding in this area.
Fig. 87.
Assembly of the lower moderator plug to the twister (insertion and turning).
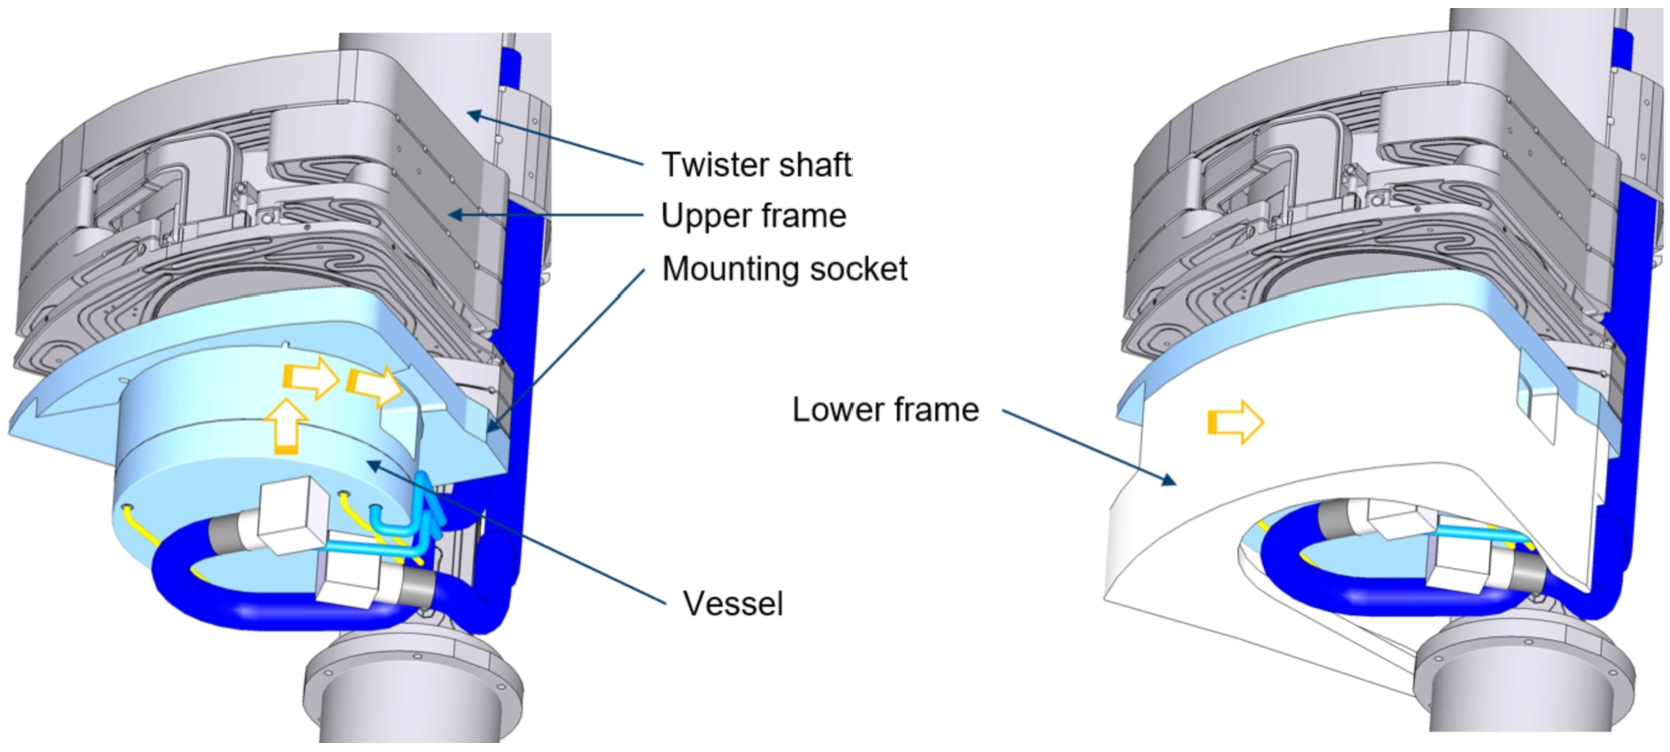
In summary, it can be stated that the integration of the new LD2 moderator system into the existing twister is a very complex process, but feasible.
3.12.Summary and outlook: Engineering implementation of deuterium moderator
In general, it can be concluded that a LD2 moderator system for ESS appears to be feasible from an engineering point of view. It was demonstrated that a volume moderator, including all necessary process lines, can be integrated into the existing twister structure under the given restrictions. Furthermore, the detailed design shows that the moderator system can withstand all mechanical loads and that the manufacturing and welding, although very complex, is feasible.
The conceptual design for the cooling process describes all the additional infrastructure needed to realize such a moderator upgrade. A key point is to reduce the deuterium inventory as much as possible. On one hand, this can be accomplished by choosing a location for the cryostat as close as possible to the moderator and, on the other hand, by reducing the heat load.
The reduction of the heat load is also decisive from a thermo-mechanical point of view in order to be able to use the moderator at full beam power of 5 MW. Without further optimization, the proton beam power is currently limited to 2 MW. However, the first optimizations have already shown that the separation of the cold beryllium filter already leads to significant improvements. In contrast to the demonstrated box-shaped moderator (worst case), slightly shaped vessel walls would allow for a reduction in the wall thickness, which means in turn that less heat is generated and the neutronic performance of the moderator is improved as well. However, the following recommendations should be examined more closely in a follow-up project, before a final decision for the moderator upgrade will be made:
Recommended further engineering investigations
- Building a full-scale prototype is recommended, because of the stringent requirements on the manufacturing process and specifically because of the welding process. Electron-beam welding of the aluminum alloy EN AW-6061 T6 can be critical, because of the weld-in depth of the needed filler material. Therefore, thorough welding tests should be performed to determine the final design.
- Thermo-hydraulic analysis needs further investigations, especially for 5 MW beam power.
- Separation of the beryllium filter from the LD2 moderator, to reduce the heat load.
- Reducing aluminum content by changing the shape of the moderator to reduce the heat load and to improve the neutronic performance.
- Better understanding of local nuclear boiling on the wall with subcooled main flow.
- Thermo-hydraulic analysis, considering boiling on the wall (by experiment).
- Possibly relaxing ESS requirements regarding local boiling and measurement of critical heat flux.
- Analysis of the risk of cavitation due to wall boiling in-pulse (by experiment).
4.Design of a very cold neutron source
4.1.VCN: A long-wished-for source
An intense VCN source has been a desire of the neutron community for at least 20 years. A dedicated workshop [33] was held in 2005 to discuss ideas for sources and applications. While several ideas on possible materials for VCN were raised (cf. Section 4.6), it was clear at that time that the lack of knowledge of the properties of the candidate materials, and, in particular, the thermal scattering libraries, constituted a major problem for realistic design studies. It is worth recalling that at this workshop a program to study VCN sources was outlined, including topics such as: 1) experiments on selected moderator types; 2) development of scattering kernels for candidate materials; 3) benchmark measurements of VCN production; 4) investigations of thermal and superthermal production of VCN. The HighNESS project has taken on most of these tasks, thus offering for the first time the concrete possibility of designing realistic VCN sources.
4.2.VCN neutrons: A brief introduction
Very cold neutrons cover a wide spectral range within the long-wavelength tail of cold neutron sources,44 with energies ranging from below 1 meV (9 Å) to few hundreds of neV (>several 100 Å), the domain of UCN. A VCN source offers new possibilities in neutron scattering applications [63] and fundamental physics research. Extended neutron wavelengths (λ) inherently enhance the capabilities of diverse instrument categories. This impact can be observed in the λ dependencies of the gains in instrumental resolution at fixed geometry and in intensity at fixed resolution. For example, gains in resolutions proportional to
Particle physics experiments can benefit from enhanced VCN fluxes, including the search for neutron-antineutron oscillations (described in HighNESS Conceptual Design Report Volume II), beam experiments looking for a non-zero neutron electric dipole moment and search for novel fundamental forces (discussed in Section 4.3).
In this section, we first provide an overview of the scientific case for VCNs and later describe the different design concepts that have been developed in the course of the HighNESS project.
4.3.Fundamental physics with VCN
The primary advantage of VCNs in fundamental physics experiments is their extremely low energy, which results in long interaction times with the experimental apparatus. Unlike UCNs, VCNs can still be considered as beams, allowing for the application of beam optics and related methods. Consequently, VCNs enhance the sensitivity of most fundamental physics experiments that utilize beams of slow neutrons or exploit the wave-optical properties of these beams.
4.3.1.Beam experiments
Recently suggested particle physics experiments using beams of slow neutrons include:55
- In-beam searches for a permanent neutron electric dipole moment (nEDM) [1,155,156], and searches for new fundamental forces [157]. These kinds of experiments profit linearly from the interaction time t of the neutron in the apparatus. Therefore, their figure of merit can be considered proportional to λ.
- Measuring the neutron lifetime
where A is the cross-sectional area of the trap and- Experiments searching for neutron anti-neutron oscillations [3,16]. Here it is not the interaction time, but quasi-free flight time of VCN that allow to significantly increase the sensitivity of the experiment. Under these conditions the probability for a transition can be expressed by:
with the free oscillation time
4.3.2.Wave-optical experiments
Another class of experiments that could benefit from intense VCN beams exploits the wave-optical properties of the neutron, in particular diffraction and interferometry. The potential of long wavelength neutrons for wave optics experiments was already pointed out in [58]. A list of fundamental physics experiments utilizing neutron interferometry techniques is given in [162]. Some of these experiments can benefit from lower energy neutrons.
A VCN source could be used for the following studies:
- Further investigation of gravitationally induced quantum interference as measured in the COW66 experiment [44]. This effect was already measured with VCN [201], but the experiment could be significantly improved with higher fluxes and modern VCN optics.77 With regard to the latter, especially the field of holographic gratings, as described in [107], made significant progress.
- Improvement of the current limit on the neutron charge [21] with a Talbot–Lau interferometer [156].
- Measurement of the gravitational constant G using an active gravitational mass other than the Earth itself, in a Cavendish experiment, as described in [105].
4.4.VCNs in condensed matter research
In condensed matter research with neutrons, the momentum and energy transfer of scattering events is measured to probe the structure and dynamics of a sample material. Very cold neutrons hold significant potential for advancing this field of study. While low-energy neutrons provide the highest sensitivity to low momentum and energy transfers (and are therefore well suited for maximizing resolution) their usage is hindered by the low available flux in the VCN regime. The flux of VCNs in the tail of a Maxwellian spectrum typically available from conventional cold neutron moderators exhibits a wavelength dependence of
High-resolution techniques that are expected to gain using longer wavelength neutrons are small-angle neutron scattering (SANS), time-of-flight spectroscopy, and neutron spin-echo (NSE) [64]. Moreover, a real-space technique like neutron imaging might benefit in some cases from improved fluxes in the VCN range.
In small angle scattering, the resolution of small angles enables studying large-scale structures on the nanometer scale, i.e. from a few to a few thousand nanometers. Because of flux limitations it is usually not possible to probe larger structures up to the micrometer scale using a conventional pinhole SANS instrumentation. Other instrumentation exploring even smaller momentum transfers, and thus giving access to the low-micrometer scale, are typically limited to one dimension and require separate measurements. It is therefore desirable to increase the resolution of conventional SANS instruments.
A simple analysis [33] shows that a
It is however important to point out some downsides that can be expected with VCNs, in particular the increased probability of absorption, and the effect of gravity. Increased absorption increases the requirements on all materials used in the neutron beam, in particular neutron beam windows of sources, guides, and sample cells and environments. The increased absorption probability along with an increased scattering probability will favor the use of thin samples to avoid absorption losses and multiple scattering. Effects from gravity can in principle be countered by instrument design but might increase the complexity and lead to additional absorption issues.
Considering experimental methods that probe energy transfers and thus dynamics, the same break-even principle is found for time-of-flight spectroscopy probing inelastic scattering. Simple estimates take into account that the energy change
In NSE, the use of longer wavelengths allows improving the energy resolution based on the relation
For neutron imaging, different considerations need to be taken into account. Currently, thanks to progress in detector technology, neutron imaging can reach resolutions of a few micrometers. However, in the range of single micrometers, the technique meets two limitations. The first one is related to contrast, since only a few materials would provide sufficient image contrast on a thickness scale of micrometers. A colder spectrum would be beneficial, since absorption increases with longer wavelengths, enabling the resolution of smaller structures. The second limitation is neutron flux. Current resolutions and the utilization of the entire white beam spectrum already indicate a limitation in flux, suggesting that a decay in flux close to
Novel lens systems for neutrons promise gains of the order of
Finally, in [150] the possible advantages of using VCNs in reflectometry techniques are discussed for several configurations. Gains are expected for a shift of the neutron spectrum towards colder energies, provided that the brightness is preserved. The use of VCNs for reflectometry is also considered promising for compact sources; new compact sources could be designed aiming at optimizing the VCN flux, having more freedom in the advanced VCN moderator and reflector materials used in the design, with respect to existing facilities.
4.5.VCN design options
In the original proposal of the HighNESS project, two approaches were considered for the design of a VCN source. One is based on a dedicated VCN source using a suitable material that would provide a high flux of VCNs, while another one, similarly to the PF2 beamline 88 at the ILL, extracts VCNs directly from the cold source. At the dedicated workshop in 2022 [173], an additional concept was suggested, that can be considered a merger of the two approaches [141].
4.5.1.Dedicated VCN moderator
In previous studies, a set of candidate materials for which thermal scattering libraries were available was analyzed as a potential VCN source. Results indicated that solid orthodeuterium and solid methane should have a higher VCN production performance than LD2 [70]. As discussed below, solid methane is likely not suitable in a high-power spallation facility, while solid deuterium is well-established as an in-pile converter medium for UCN sources and is therefore a suitable candidate material for an in-depth investigation in HighNESS. Another class of candidate materials are fully deuterated clathrate hydrates; in these inclusion compounds, guest molecules occupy cages formed by a rigid network of water molecules. Various local modes can be excited in incoherent inelastic scattering events, which provide a path for cascaded neutron cooling that is not kinematically restricted by a dispersion relation [230]. A strong candidate material investigated within HighNESS is the fully deuterated tetrahydrofuran (THF-d) clathrate hydrate, which has a broad band of low-energy modes, as experimentally demonstrated for its undeuterated version [45].
For any selected moderator material the highest VCN fluxes are to be expected at source locations near the spallation target. Their use is justified only if they outperform the main source in the wavelength range of VCNs. This is very difficult to achieve, as shown in Ref. [70]; the highest possible incident flux is required, meaning that the best location for a VCN source would be below the spallation target, where the cold source is located and would need to be replaced. Additionally, this solution would have to cope with the challenge of cooling the material to the needed temperature in a region with a high radiation field and high heat loads. While for SD2 a temperature of 5 K seems optimal [65], the THF-d clathrate hydrate would best be operated below 2 K. At such low temperatures, the local modes are predominantly populated in the ground state, which suppresses up-scattering. From a practical point of view, He-II can be used for effective cooling of the weakly thermal-conducting clathrate hydrate.
Designs with dedicated VCN moderators are reported in Section 4.7 for SD2 and in Section 5 for deuterated clathrate hydrates.
4.5.2.Use of advanced reflectors
In the original proposal of the HighNESS project the use of advanced reflectors for a VCN source was intended in combination with the liquid deuterium moderator; this option is discussed in Section 4.9. However, in the course of the project we have developed designs where advanced reflectors, specifically nanodiamonds, have also been applied in combination with SD2, either in the full SD2 design, as detailed in Section 4.7, or in the hybrid LD2/SD2 design.
The hybrid design, proposed by Nesvizhevsky, supplements the baseline LD2 moderator with an adjacent or embedded block of SD2. The original rationale for such an option was to improve the performance for NNBAR. However, potential gains for general VCN performance may also be feasible. As such, this option has been investigated in several configurations, for both the NNBAR and WP7 beam openings, and is discussed in-depth in Section 4.8.
4.6.Solid ortho-D2
In the first workshop dedicated to applications of a Very Cold Neutron Source [33], the designs proposed for a VCN moderator already made use of solid materials like Be, graphite, D2 and D2O in the configuration of a bed of small pellets between 5 and 10 K with liquid helium at 2 K flowing through the gaps as a coolant. During the workshop, it was acknowledged that deuterium-based materials are expected to be generally better than graphite and beryllium, whose total cross sections have no incoherent contribution and a steep fall for energies below the lowest Bragg edge (5 meV in Be and 2 meV in graphite). However, the higher heat capacities of beryllium and graphite left open the possibility that they might be favored when optimizing the source for the neutron flux weighted on the heating during the accelerator pulse. At the end of the workshop, there was a consensus that the lack of neutron scattering kernels and measurements was hindering the design of a VCN source based on calculations.
As mentioned above, a more recent study by Gallmeier et al. [70] looked for a VCN source option for the second target station at SNS. The set of materials investigated was chosen based on the thermal scattering libraries available. In particular, para-H2, water ice, beryllium [23,24], ortho-D2 [80], CH4 [185], and neon, all solid at cryogenic temperatures of 4–6 K, were compared. The figure of merit in that study was the time-integrated pulse brightness over a liquid para-H2 moderator at 20 K. The authors indicated that solid ortho-deuterium (SD2) and solid methane are the most promising material for delivering a higher VCN production than liquid hydrogen, with the former able to outperform a conventional cold source by a factor 2, at the expense of a pulse five time longer. While solid CH4 is generally considered a good candidate material for a VCN source due its high hydrogen content, it is likely not suitable in a high-power spallation facility like ESS. Irradiation of methane leads to the formation of radiolysis-induced radicals -(CH2)n-, followed by polymerization into carbon-based deposits and release of H2, both of which have been observed to accumulate in the moderator vessel [18,90]. On the other hand, solid ortho-deuterium, well-established as an in-pile converter medium for UCN sources [12,29,111,115,134,182], has no physical impediment to the VCN production in high radiation fields, despite the many challenges related to keeping such a source at low temperature.
In this work, a new scattering kernel was used to model the interactions of slow neutrons with SD2. The library, developed by the Spallation Physics Group at ESS, follows the physics of the thermal scattering model from Granada [80,81], and uses the new mixed-elastic scattering format to correctly include both the coherent and incoherent components of elastic scattering [161]. The cross section and the benchmark against experimental data [12,115] can be seen in Fig. 88. The related files are available in the ESS Gitlab repository [59].
Fig. 88.
Total scattering cross section per atom for SD2 as a function of incident energy. Here, NJOY + NCrystal is the new library, CAB is the evaluation generated by Centro Atomico Bariloche [80,81], and IKE is the evaluation from Institut für Kernenergetik und Energiesysteme [23]. Also the more recent model developed in [121] is shown for comparison. Models are also validated with measurements from SINQ/PSI [12] and LANL/LANSCE [115]. Only every fourth data point is shown for clarity.
![Total scattering cross section per atom for SD2 as a function of incident energy. Here, NJOY + NCrystal is the new library, CAB is the evaluation generated by Centro Atomico Bariloche [80,81], and IKE is the evaluation from Institut für Kernenergetik und Energiesysteme [23]. Also the more recent model developed in [121] is shown for comparison. Models are also validated with measurements from SINQ/PSI [12] and LANL/LANSCE [115]. Only every fourth data point is shown for clarity.](https://content.iospress.com:443/media/jnr/2023/25-3-4/jnr-25-3-4-jnr230950/jnr-25-jnr230950-g088.jpg)
Fig. 89.
MCNP model of the full SD2 moderator (a) vertical cut, perpendicular to the proton beam direction. (B) cut parallel to the target plane with the proton beam impinging from the left.
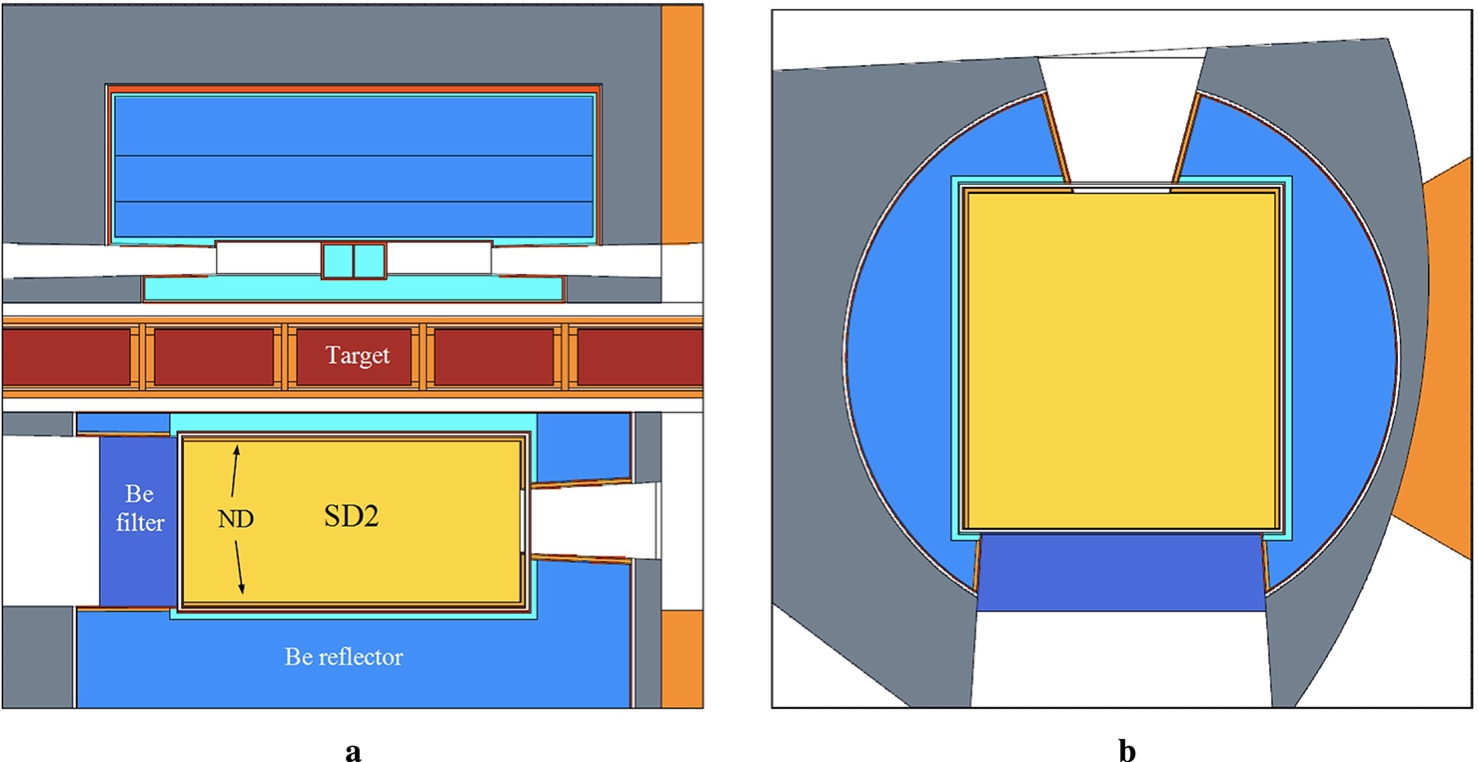
4.7.Dedicated SD2 source
Neutronic simulations for this analysis used MCNP 6.2 [209]. Our first tests involved a moderator which had a similar total volume to the baseline LD2 source, where the total LD2 moderator volume was partially displaced by SD2. Different configurations were tested, varying the relative amounts of SD2 and LD2. The highest intensity in the VCN region was obtained for SD2 completely replacing the LD2. Therefore, the focus in this section is on the properties and performance of a full SD2 moderator. Additionally, we have investigated the effect of surrounding the SD2 with a layer of nanodiamonds (NDs), see Section 9.2.2. The ND layer, separated from the SD2 by a 0.5 mm Al sheet, has a thickness of 5 mm and a density of 0.6 g/cm3. Figure 89 presents the MCNP modelling of the geometry of the SD2 moderator.
In comparison to the LD2 baseline, the SD2 moderator vessel has thinner Al walls (2 mm), which is possible because of the lower pressure exerted by the solid block, and due to the simpler geometry, as no reentrant hole is considered in that design. The design benefits from further improvement by the addition of a 20 K beryllium filter on the left-hand side, facing the NNBAR experiment. Unlike the design of the LD2 moderator, the Be filter would be added outside the vessel, thus avoiding the need to remove moderator material. The addition of that filter leads to an increase of the performance on the NNBAR side in the range from 4 Å to 10 Å of about 40% in comparison to the case in which no filter is considered, while sacrificing 70% of the intensity in the range from 2.5 Å to 4 Å and 20% above 40 Å. The addition of such a filter on the opposite side would also be beneficial for the scattering instruments’ opening as this would lead to a flux increase of 5% in the CN and VCN ranges.
Table 11 summarizes the gain factors for the best performing SD2 model (Fig. 89) over the baseline LD2 design for the different wavelength ranges of interest.
Table 11
Gain factors of the SD2 moderator over the LD2 baseline design for the NNBAR opening and the general-purpose neutron scattering instruments opening (WP7). No internal cooling structures are considered (pure ortho-D2 is used for both cases)
| λ | 2.5 Å to 4 Å | 4 Å to 10 Å | 10 Å to 40 Å | >40 Å |
| WP7 | 0.7 | 1.1 | 2.3 | 27 |
| NNBAR | 0.6 | 1.3 | 2.1 | 14 |
Fig. 90.
Brightness spectra comparison for VCNs emitted by lower-moderator designs using LD2, SD2, and SD2 + ND reflection layer. Tallies are taken for neutrons traveling ±2° from the normal of the emission surface; the recording surface is placed at the twister exit in the direction of the beam port for neutron scattering instruments.
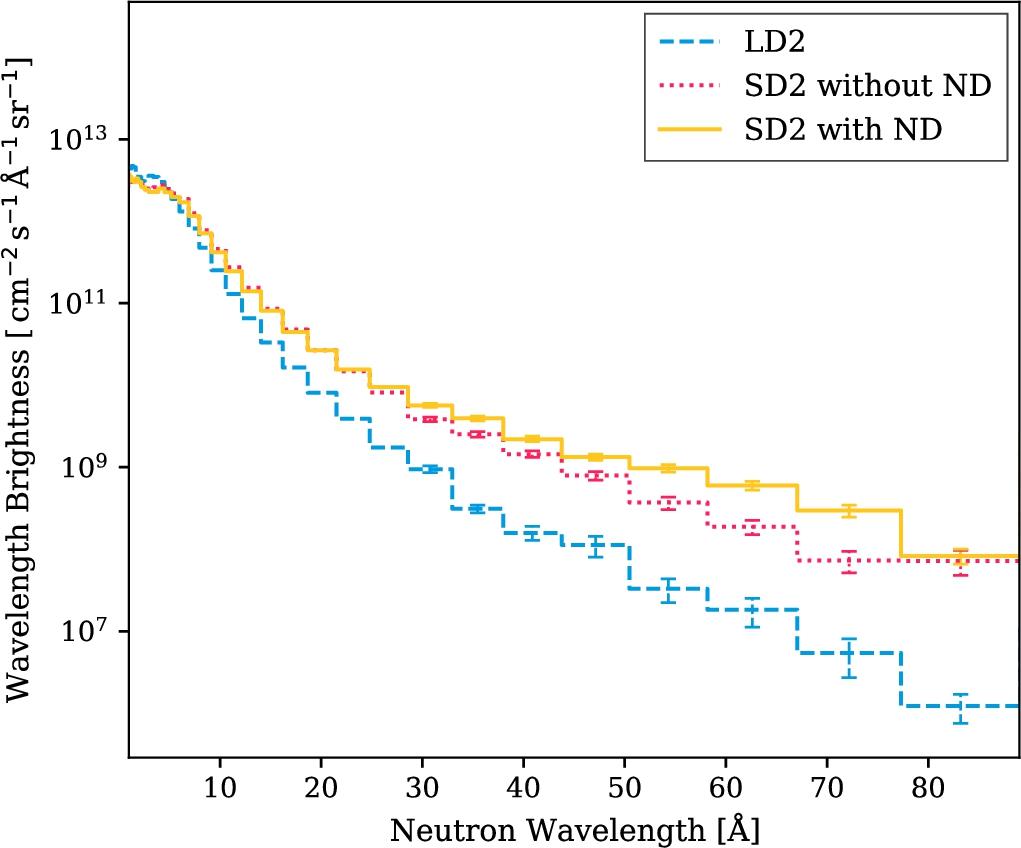
Figure 90 presents the comparison of the spectral brightness, calculated for the cases with and without ND, with the LD2 design. To obtain the absolute brightness this procedure was followed:
(1) the raw counts of neutrons, per incident proton on the spallation target, are recorded at the exit of the twister (
(2) the counts within a cone with 2° half opening angle to the surface normal are divided by the emission surface, by the solid angle defined by such cone and by the bin width in wavelength;
(3) finally, the result is scaled by 1.56 × 10¹⁶ proton/s, corresponding to the average proton current on the ESS target at 5 MW.
Fig. 91.
Thermal scattering cross section per atom for ortho-SD2 used in this study. The elastic, both coherent and incoherent, and inelastic contributions are shown. The fall of the upscattering cross section at low energy makes SD2 an excellent moderator for the VCN range.
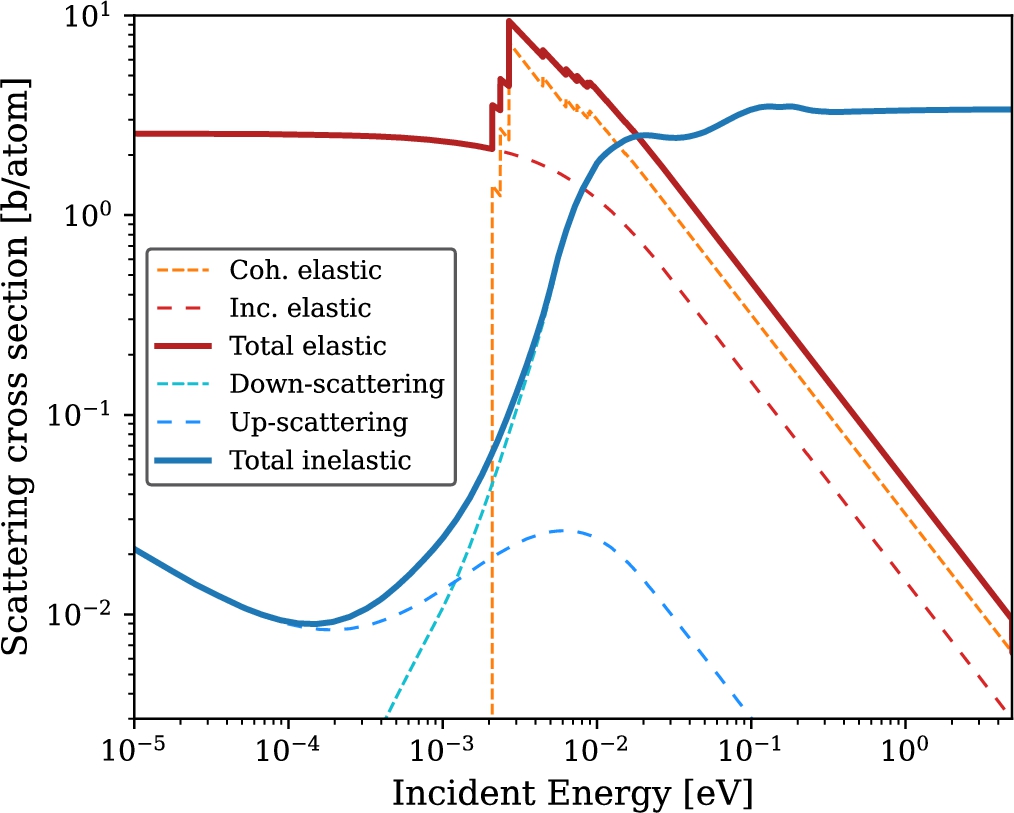
Two factors contribute to the improved performance of the SD2 moderator with respect to LD2. The first factor is the high VCN yield of the ortho-D2 crystal arising from the very small value of the upscattering cross-section for energies lower than 20 meV (
Fig. 92.
Temporal response of the moderator for CNs in the range
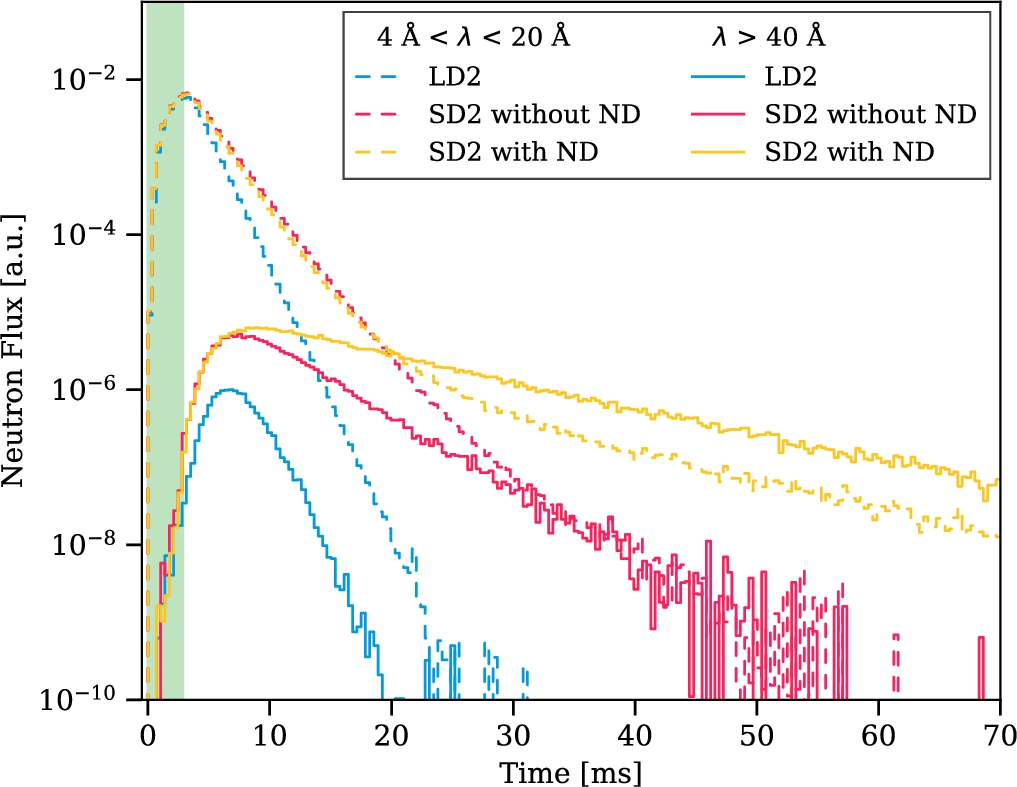
As another interesting result, it was found that the addition of a thin ND layer to the LD2 baseline did not produce the same relative gains described for SD2. On the NNBAR side, a significant 40% increase was calculated for
For neutrons in the
It should be noted that these basic simulations are not taking into account the following parameters that could have a negative effect on the gains:
- Internal structure for cooling;
- Para-D2 and H impurities in ortho-D2;
- Cracks and imperfections in the D2 crystal.
Before giving more details about the effects of those three parameters in the next sections, it should be mentioned that a full optimization of the moderator’s dimensional parameters (size, shape, position, etc.) has not yet been performed. This is expected to have a positive impact the final VCN yield. For example, substantial gains are observed when adding NDs as reflector in the extraction. Similarly, reducing the thickness of the 0.5 mm Al sheet located between the D2 crystal and the ND layer and/or using a different low-absorbing material like beryllium or magnesium can also contribute to better performance [42]. A full optimization which accounts for such engineering considerations requires a wider effort and is outside the scope of this preliminary study. Nevertheless, possible detrimental factors can be assessed and, when possible, their impact is estimated at the best of the author’s knowledge.
4.7.1.Internal cooling structure
The most critical aspect to cover to assess the feasibility of a large-volume solid deuterium moderator is the cooling of the system made by the crystal and its aluminum vessel, which is on the scale of tens of kilowatts. When the SD2 temperature is exceeding 5 K, the VCN flux is predictably decreasing with respect to its optimum; however, it was estimated that SD2 still outperforms the LD2 baseline by roughly a factor of 5 at wavelengths greater than 10 Å at 15 K, near its melting point. Nevertheless, considering greater thermal stresses, there is a greater likelihood for defect formation, and the thermal conductivity of the SD2 itself drops between 5 and 12 K [9] from approximately 30 to 1 W m−1 K−1, indicating the imperative need of keeping as much of the SD2 bulk as possible at a temperature below roughly 10 K.
Preliminary steady-state thermal simulations done by the HighNESS engineering team in FZJ showed that, for pure solid ortho-D2 at 2 MW beam power, it could be feasible to keep the moderator at the foreseen operating temperature even within the ESS environment, by implementing an embedded cooling structure. The simulations assumed a cooling structure made of two main components. First, a metallic (aluminum or beryllium) or graphite foam inlay to increase the thermal conductivity of the solid block; and second, an additional system of inner cooling pipe (or pipes) with flowing liquid helium that would extract heat from both the outer surfaces and the very deep core of the solid.
Considering both neutronic and thermal conductivity aspects, three possible material options for the inlay can be considered: aluminum, beryllium, or graphite [69,93,101,108,227]. Those foams are known to have very high effective thermal conductivities [43,109,132,217], performing comparably with their bulk counterparts at cryogenic temperatures [20,200,208,211,212]. More complex materials presenting exceptional thermal conductivity, such as diamond/copper composites [40] or aluminum/beryllium alloys, may also be worth studying but are not considered further in the context of this work.
The steady-state thermal simulation tool of Ansys® Workbench 19.2 was used for a preliminary assessment. Material data for deuterium with variable ortho-para concentrations, helium, aluminum (99.994% and 6061-T6) and beryllium, taken from the MPDB Material Property Database v7.91, were considered in the simulation as a function of the temperature [98] except for the deuterium data [167]. The combined thermal conductivity
Table 12
Heat conductivity
| Φ | 0.85 | 0.93 | 0.95 |
| 85.97 | 41.02 | 29.78 | |
| 200.24 | 101.90 | 77.35 | |
| 213.12 | 99.59 | 71.2 |
A uniformly distributed volumetric heat source induced by the spallation reaction was considered over the moderator volume. Only steady-state simulations have been performed (no pulsed heat). Two cases where studied, one corresponding to full-load operation (5 MW proton beam power Q = 60 kW) and one to partial-load operation (2 MW proton beam power Q = 24 kW). The heat is removed by a surface cooling only. Helium is the cooling medium, having an average temperature of 3.75 K. The heat transfer coefficient of the He-wall is considered to be infinite. The thermal contact of the foam to the aluminum vessel wall is also assumed as optimal. All of the approximations listed need to be checked performing detailed simulations.
Table 13
Intensity gain factors in the SD2 lower moderator at different volume percentages of aluminum (Al), beryllium (Be), and graphite (C) approximating embedded foam densities. Counts are measured at the Beam Port Tally and gains are reported as ratios over the baseline with 4% aluminum added. In the non-uniform cases (second rows), the boundary is a higher-density 10-cm-radius sphere encompassing the SD2 core; only such non-uniform trials are reported for graphite
| λ range | Al % | 2.5 Å to 4 Å | 4 Å to 10 Å | 10 Å to 40 Å | >40 Å |
| WP7 | 15% | 0.57 | 0.68 | 0.95 | 2.5 |
| 15/7 % | 0.68 | 0.94 | 1.52 | 5.73 | |
| NNBAR | 15% | 0.48 | 0.71 | 0.95 | 1.9 |
| 15/7 % | 0.56 | 0.96 | 1.50 | 4.15 |
| λ range | Be % | 2.5 Å to 4 Å | 4 Å to 10 Å | 10 Å to 40 Å | >40 Å |
| WP7 | 15% | 0.64 | 1.10 | 2.12 | 10.0 |
| 15/7 % | 0.77 | 1.27 | 2.47 | 18.3 | |
| NNBAR | 15% | 0.56 | 1.10 | 1.93 | 10.1 |
| 15/7 % | 0.63 | 1.26 | 2.33 | 13.8 |
| λ range | C % | 2.5 Å to 4 Å | 4 Å to 10 Å | 10 Å to 40 Å | >40 Å |
| WP7 | 15/7 % | 0.79 | 1.28 | 2.57 | 22.0 |
| NNBAR | 15/7 % | 0.64 | 1.25 | 2.42 | 16.1 |
Fig. 93.
Lower-moderator cell heat deposition for metallic (Al and Be) and graphite (C) foam configurations, divided by the proton current in mA impinging on the target (for a 5 MW beam). The green triangles show results accounting for additional heating due to 27Al activation.
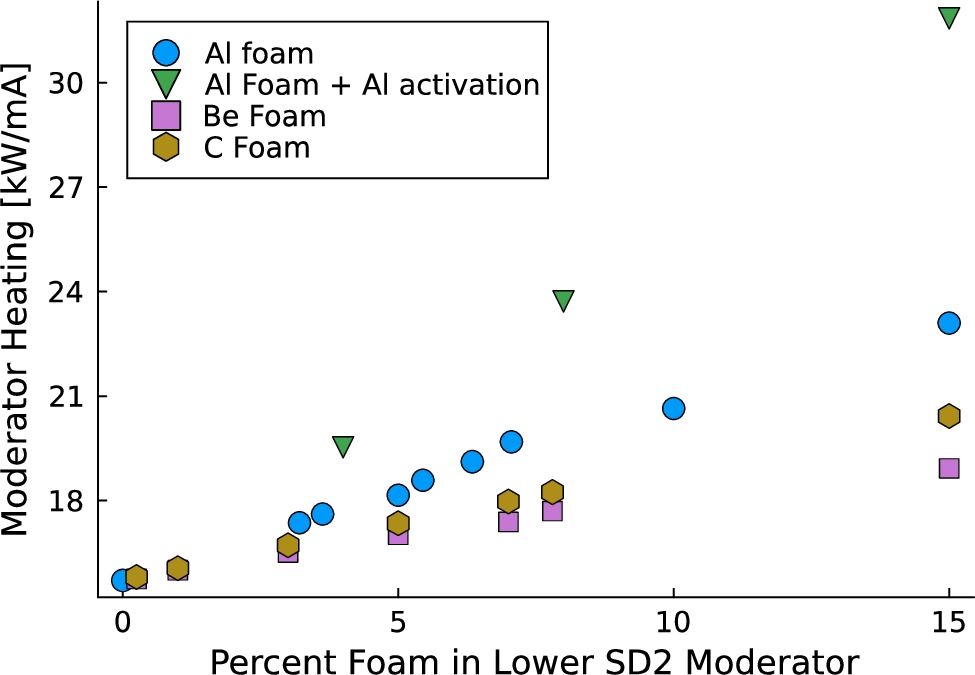
Neutronics simulations aimed at investigating the effect of metallic foam on the VCN production are summarized in Table 13. The system of crystal and foam was first approximated in MCNP by a uniform mixture of 85% volume fraction of SD2 and 15% foam inlay. The gains are reported as count ratios at 2 m (Beam Port Tally) over the baseline LD2 moderator with 4% aluminum added, which approximates the LD2 cooling-flow channels, allowing for fairer comparison. The possibility of reducing the amount of foam material by having an inlay with different densities between the core region and the outer corners, where it is less important, was also explored. In these calculations, the boundary between these two regions is a sphere of 10 cm radius, and the volume percentage of the outer foam is reduced from 15% to 7%. This last configuration has a significant advantage over the uniform case in terms of neutron yield, while keeping the required cooling power almost unchanged. We also studied the increase of heat deposition in the moderator cell as a function of the foam volume percentage (Fig. 93).
According to the results presented, graphite and beryllium outperform aluminum regarding neutronic, self-heating, and thermal conductivity. In terms of performance, beryllium is a promising candidate but manufacturing a beryllium foam would be challenging due to the higher melting point and non-standard safety measures in handling this material. Graphite then appears as an appealing candidate material in general terms.
However, at roughly 3200 W m−1 K−1 [126] near the melting point of SD2, the thermal conductivity of high-quality bulk beryllium at the relevant temperature range of 5–20 K is particularly high with an effective thermal conductivity value of roughly 200 W m−1 K−1 for a porosity of approximately 85%; the thermal conductivity of graphite foam is likely to be lower by at least a factor of two [109,228]. Depending on the purity of the material, it should also be mentioned that the thermal conductivity for aluminum and beryllium can vary by orders of magnitude [198,211], for example, the thermal conductivity of ultra-high-purity aluminum is 35,000 Wm−1 K−1 at 10 K [194].
A foam with open pores (I) or a 3D printed grid structure (II) would be two interesting options worth investigating regarding the manufacturability of the inlay [92,151]. In the case of option (I), a melting of the optimized alloy can be frothed through the addition of a foaming agent. The density and porosity can be tuned homogeneously for the inlay in this process. The second option (II) would consist of a grid structure manufactured using the selective-laser-sintering (SLS) 3D printing technique; a thin layer of metal powder is locally sintered by a laser beam. A defined three-dimensional geometry can be created by repeating the operation layer-by-layer. The advantage of this method in comparison with option (I) is the capability to adapt the geometry to the need of an optimal thermal conduction while minimizing the reduction of SD2 volume. This is overcoming the limitations due to the homogeneous properties of option (I).It should be noted that this heatsink inlay is not intended to act as a structural support, its only goal is to improve the thermal conductivity. When incorporating such an inlay into the moderator design, a critical aspect is its thermal coupling with the surrounding moderator vessel walls and the liquid helium channel. This coupling could be realized by a defined press fit or a soldering process with a matched plumb alloy. Inlay-type (II) would allow for the printing of a thin-wall structure in the geometry to enlarge the connecting interface surface. This would increase the thermal coupling compared with the press fit and soldering option. Further experimental investigations will be necessary to investigate more in details this point.
4.7.2.Hydrogen and Para-D2 impurities
Thanks to its small nuclear mass and absorption cross section, deuterium is one of the best neutron moderator materials. The importance of having high-purity ortho-D2 crystals for UCN production through the use of SD2 have been highlighted in the literature [120,134]. Hydrogen and para-deuterium are the elements usually considered as impurities due to their respectively higher absorption and upscattering cross sections [120]. However, in view of the similarities between the two spin isomers in the VCN energy range and the achievable ortho-D2 purity, the impact of these impurities on the VCN yield are expected to be small, as discussed in the following.
The effect of hydrogen impurities was simulated by adding increasing percentages of solid para-H2 at 5 K in the SD2. Hydrogen impurities have typically been found in the form of HD and not para-H2. However, since this was the only library available and impurity concentrations in D2 are usually around 0.2% [134], those data were considered to give a reasonable approximation of the absorption problem. The impact of the impurities was assessed at the exit of the twister where statistical uncertainties were lower. The results are plotted in Fig. 94. For concentrations ranging up to 1%, an average drop in neutron counts of roughly 0.35% was highlighted for
Fig. 94.
Effects of introducing small vol% of solid para-H2 in the ortho-D2 crystal for neutrons with
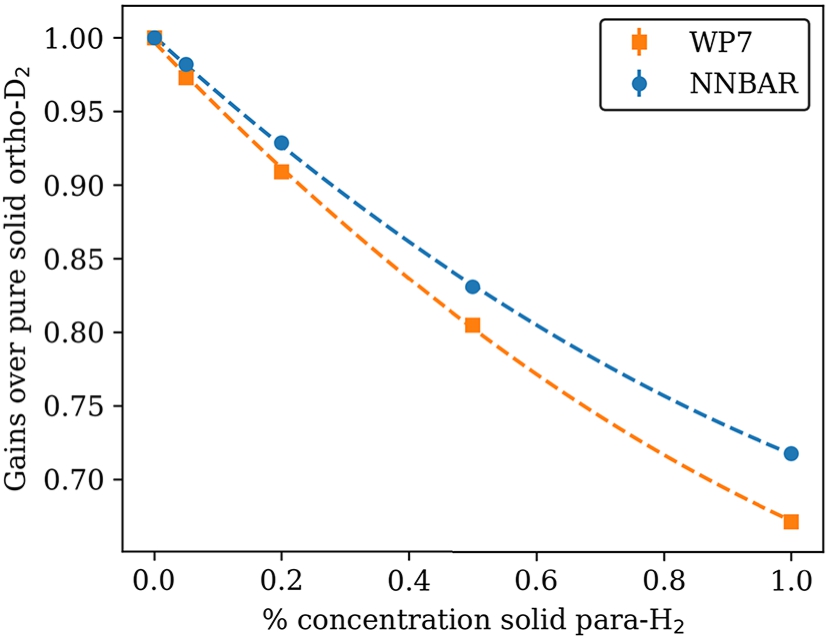
Similarly, the addition of 1% para-D2 to the material mix did not lead to significant effects exceeding the statistical uncertainty at the exit of the twister. However, due to recombination following the radiolysis induced by fast neutrons and gammas, it could be expected that the para-D2 concentration will increase as a function of the operation time. After the radiolysis of an ortho-D2 molecule, according to the natural proportion of the two spin isomeric forms, the recombination will produce a para-D2 molecule 33% of the time [96]. Preliminary calculations performed using a solid para-D2 thermal scattering library at 5 K showed small losses (less than 5%) for neutrons with
4.7.3.Crystal imperfections
Growing a perfectly transparent SD2 crystal is clearly known as a challenge [9,13,29,111,134,165]. The goal of perfect optical transparency is hindered by the crystal defects due to thermal stress. If high-purity ortho-D2 is achievable, cracks and frost buildup on the surface seem inevitable. The former are produced during the cooling phase and also during temperature cycling, while the latter is a snow-like layer on the SD2 surface created by a small amount of D2 undergoing sublimation during a proton pulse.
As they are strongly affecting the UCN yield, those defects have been extensively studied but there is limited evidence of the interaction with higher energy neutrons in the VCN range. In this section, we address this point based on the available knowledge, keeping in mind that a more detailed study would be necessary for further applications.
The impact of cracks on the SD2 transparency has been studied in [29,134]. The presence of cracks induces a sharp change in potential
One possibility is that assuming a smaller mean-free path could ultimately lead to the calculation of sub-optimal dimensions for the moderator. Using the method adopted for ND in [166], SANS could be added to the SD2 thermal scattering library in order to model cracks. The experimental Porod exponents taken from [29,165] could be used as starting point and would allow modelling a real crystal under different cooling conditions. In any case, less damage to the crystal was reported when the cooling from the liquid phase was slow and the temperature cycling was kept varying between 5 K and 10 K.
Surface degradation has been extensively studied from both theoretical and experimental perspectives in [9]. The creation of a frost layer at the SD2-vacuum interface is due to D2 sublimation. This frost layer is then poorly cooled and poorly attached to the SD2 surface. As the number of layers increases with the number of proton pulses, the optical opacity of the surface increases. A procedure called conditioning allows sublimating and resublimating the frost as better-quality SD2, while recovering the UCN yield. The physics behind the neutron loss is resulting from an alteration of the optical potential shape (from a stepped to a smooth profile), specular and non-specular scattering (due to roughness [14]), and diffusion from randomly oriented crystal facets. Each of these mechanisms prevents the extraction of UCN, but are energy-dependent processes described by the optical laws of reflection [9]. In particular, the probabilities for reflection
4.7.4.SD2 source summary
Simulations for a full-SD2 source predict order-of-magnitude gains for
Although it is clear that both cracks and surface degradation will need a dedicated study which takes into account the specific conditions and constraints at ESS, it is likely that imperfections in SD2 – which are generally considered detrimental for UCN production – should not significantly affect higher energies in the VCN range.
Novel heat-extraction solutions are required to make the proposed design feasible, with preliminary studies indicating that embedding a foam structure of beryllium or graphite into the moderator volume would be viable with the ESS initial operating proton beam power of 2 MW. Engineering such a cooling system for the design power of 5 MW may present greater difficulties, and further study would be required.
Implementation of a such VCN moderator can be expected to open new avenues of research in neutron scattering and fundamental physics studies with neutrons.
4.8.Combined option
![Original concept of the SD2 converter as presented in [141].](https://content.iospress.com:443/media/jnr/2023/25-3-4/jnr-25-3-4-jnr230950/jnr-25-jnr230950-g095.jpg)
The idea of a VCN source combining an SD2-based VCN converter with an existing CN source was proposed at the first HighNESS workshop on UCN and VCN Sources at ESS [141]. The rationale behind the concept is to maximize the VCN flux to the NNBAR experiment. A dedicated VCN source could overcome the well-known low phase-space density (the neutron flux decreases as the square of longitudinal neutron velocity in a cold source), while retaining the sensitivity increase as the square of the free flight time (
- An SD2 VCN converter at a temperature of ≈4 K is placed in front of the 24 cm × 40 cm NNBAR opening.
- A long channel filled with fluorinated detonated nanodiamonds (F-DNDs) is placed at the exit as extraction system, increasing the total flux of VCN at 2 m due to multiple reflections from the walls and enhanced directional extraction to the experiment.
- A thin F-DND layer is placed between the LD2 source and the SD2 converter to increase the chance of moderation inside the converter volume. At the same time, such a thin layer is nearly transparent for CNs, hence the incident CNs are virtually unaffected.
Contrary to UCN extraction with SD2, VCNs penetrate through the inhomogeneities in the SD2 bulk, and are thus more easily extracted with minimal losses.
The source flexibility and the ease of implementation within the current LD2 cold source make this an interesting design for a general-purpose VCN beamline. Therefore, the performance of a possible converter on the WP7 has also been studied.
4.8.1.NNBAR side
As a starting point, the simplest study one can imagine is to measure the effect of a thin converter on the VCN flux at the beam port, which is located 2 m from the center of the moderator. For this test, we put 5 cm of SD2 in a 170-cm-long ND-filled channel with 2-cm reflector thickness on the sides and 1 cm in the direction of the cold neutron beam. The reason for having a thick ND layer is to increase the diffusive transport of VCNs. The very cold energy range is far from the quasi-specular regime; thus, the intense albedo from the powder is exploited instead. The first tests did not have any structure around the converter and for the inner walls. This is clearly an oversimplification, since in reality both the D2 (gas) and the NDs (powder) must be stored in a container, but it allows for a verification of the predicted enhancing effect, neglecting the engineering complications. The model used is shown in detail in Fig. 96.
Fig. 96.
Table 14. (Left) MCNP model of the preliminary test run to check the separate and combined effect of ND and the SD2 block. (Right) parameter table for this model.
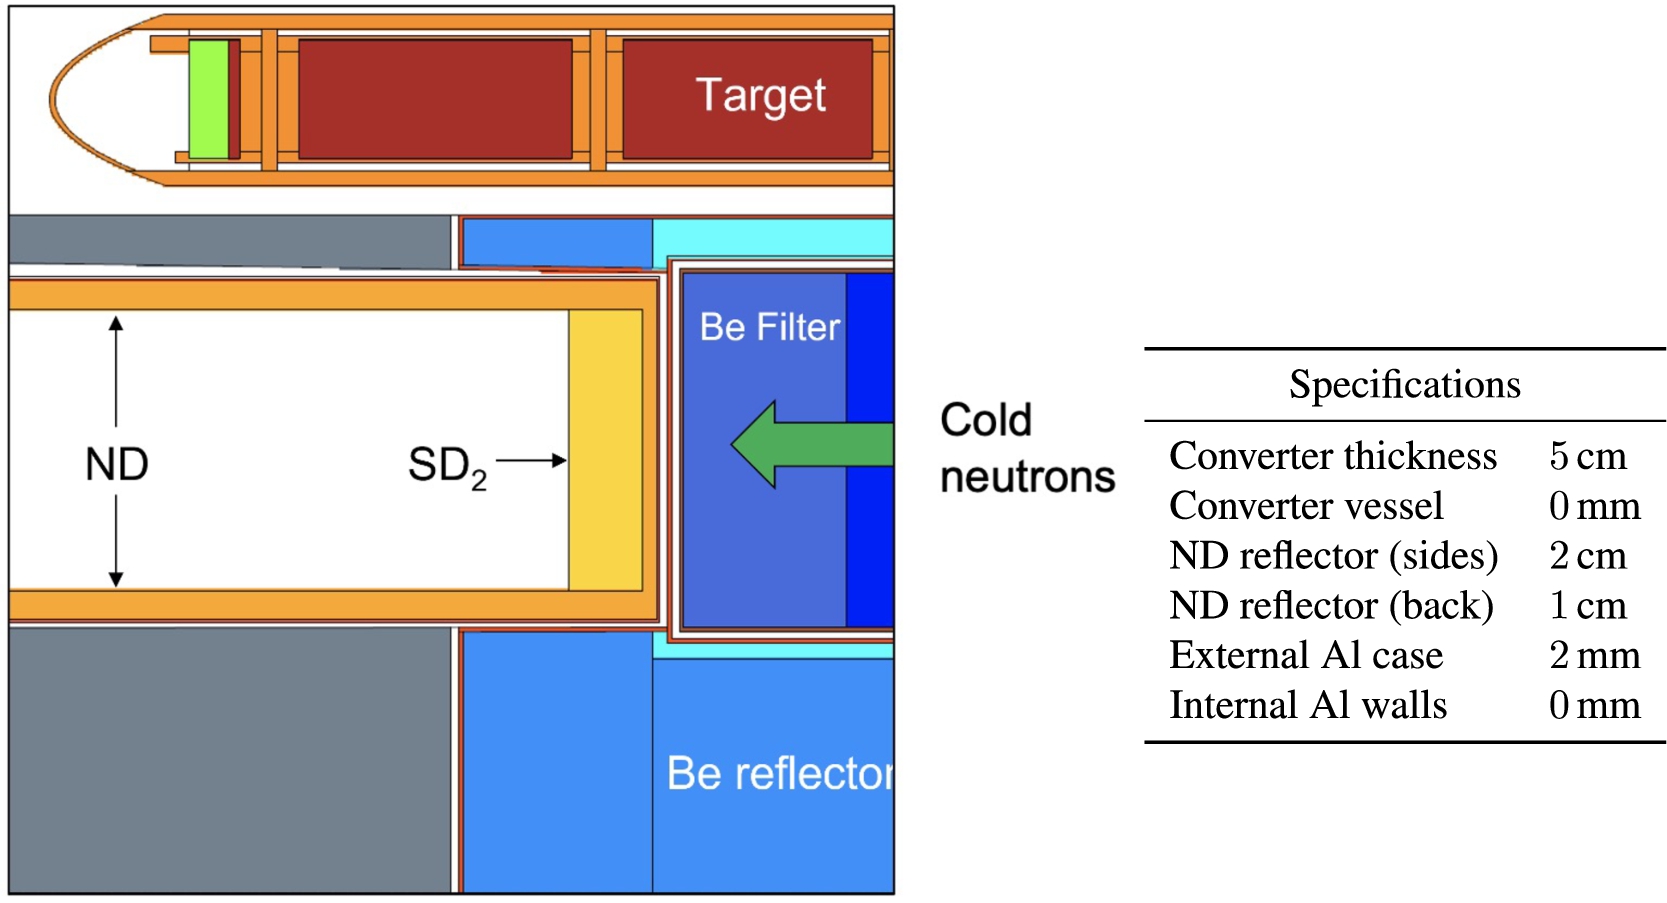
The performance of the converter is measured with a current tally (F1) through a fixed surface placed at the beam port with several energy-grouped resolutions and coarse angle bins. The effect on the neutron counts was studied separately for each component of the system. The Table 15 summarizes these preliminary results at all angles.
Table 15
Preliminary results at all angles of the SD2 converter design on the NNBAR side. The tally is measuring the counts at all angles through a fixed surface placed at the beam port. Gains are measured over the third optimized baseline (see Section 2.3.6)
| Gains | Al casing | SD2 only | NDs only | SD2 + NDs |
| 0.98 | 0.54 | 1.71 | 0.87 | |
| 0.95 | 0.71 | 0.84 | 1.76 | |
| 0.86 | 0.93 | 0.44 | 16.9 |
First, the Al case was added in the opening, which produced overall small losses in the energy ranges studied. Then, only the SD2 crystal was inserted, without the surrounding NDs. As a result, cold neutron (4 Å to 10 Å) and VCNs from 20 Å to 40 Å are less, while an increase in the coldest neutron counts (
Similarly, results for ND reflector but no SD2 are shown. In this third case, it is possible to observe an increase in the cold counts for the ND guide only, which is due to the quasi-specular reflection. On the other hand, huge losses are observed in the VCN energy region. The difference with the previous model, and cause of the losses, is in the additional layer at the emission surface, which is back-scattering and diffusing the VCNs coming from the LD2 moderator.
Finally, the two pieces are coupled, SD2 and NDs in the Al case, and the VCN counts at the beam port almost double from 20 Å to 40 Å and increase by a factor 17 above 40 Å. In the next section, this tentative simple case is improved by an optimization of the parameters.
4.8.2.Optimization of the ideal case
For a robust and methodical approach to the optimization task, Dakota [2] and the EGO algorithm were used. The optimization parameters were the thickness of the SD2 block and the thickness of the ND layer both on the sides of the guide-like system and behind the SD2 (in front of the emission source) designated as side and back thicknesses, respectively. The FOM chosen to drive the algorithm is the VCN counts at the beam port between 20 and 40 Å and at all angles. In fact, it is more convenient to use this tally since it converges faster while following approximately the same behavior as the VCNs above 40 Å. The results of this multi-dimensional optimization are shown in Fig. 97.
Fig. 97.
Results of the multi-dimensional optimization. Each run of the optimization is represented by three vertically aligned points, one for each energy-group of interest and each one with its own scale for the gains over the LD2 baseline. Trend lines are shown with the sole purpose of guiding the reader’s eye.
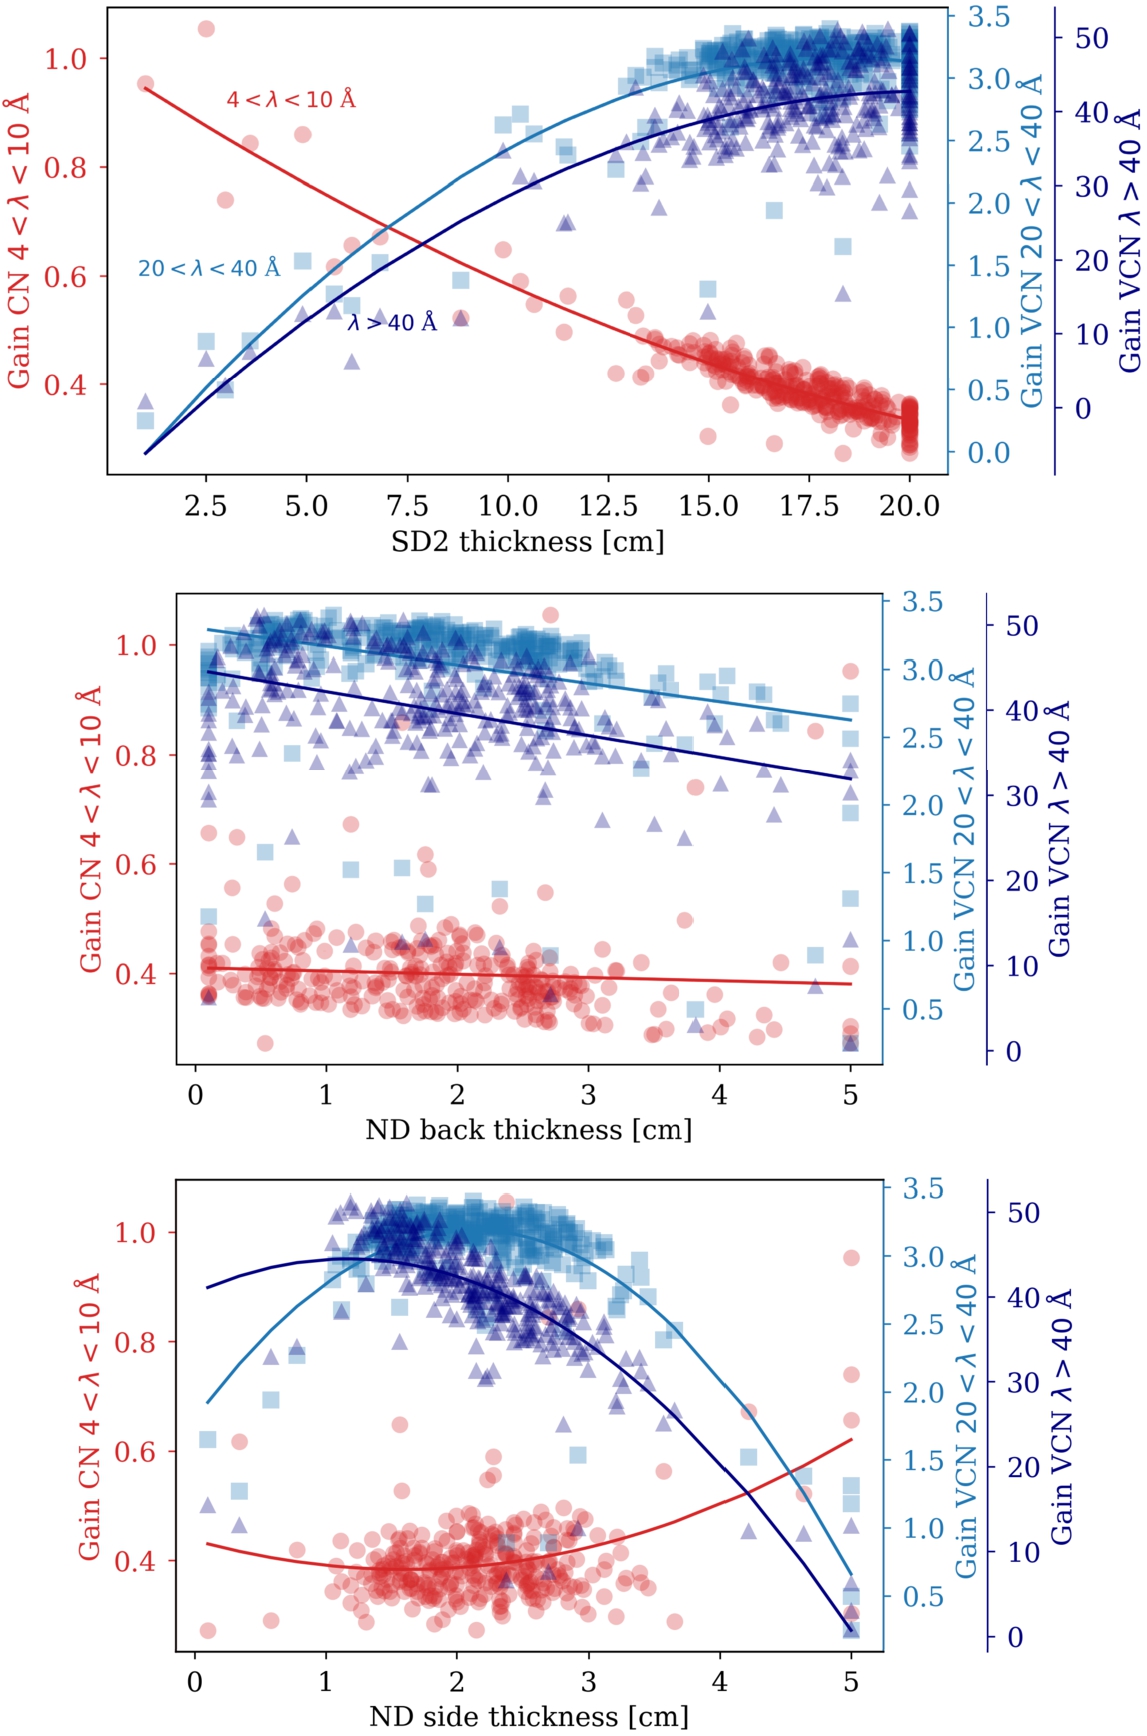
Before discussing the results, the content of the plots in Fig. 97 should be clarified:
- Each run of the optimization is represented by three vertically aligned points, one for each energy-group of interest and each one with its own scale for the gains over the LD2 baseline.
- Since we are showing one parameter at a time, the presence of different counts values for the same parameter value is to be interpreted as a run where one (or both) of the other parameters was changed.
- The lines shown are mere trend lines with the sole purpose of guiding the reader’s eye and not fitted models.
- The EGO algorithm does not sample uniformly the parameter space, hence the larger clusters of points visible in the plots are formed to better sample the region around the maximum of the FOM. This is also why this approach can be much faster than a simpler evaluation of a parameter grid.
The first important result of the optimization is that large blocks of SD2 produce the highest VCN yields. Here 20 cm was the upper boundary given to Dakota for the thickness, but it is reasonable to assume that there would be higher gains for larger crystals. However, with approximately 14 L of SD2, this moderator has already unprecedented dimensions for a crystal at 5 K, with non-negligible issues pertaining to cooling and engineering (the estimated heat deposition from prompt neutron and gammas is 2.5 kW). The cost for the high gains in the VCN energy range are considerable losses in the cold range around 4 Å. A possible explanation for these losses is in the large SD2 elastic cross section (see Fig. 91) that decreases the mean free path, effectively making the cold source appear further away from the beam port and increasing the chances of absorption or leakage.
Additionally, the thickness of the crystal seems to be the most important parameter by looking at the range of the results, while the thickness of the back ND layer is the least crucial for an optimal design. The latter is due to the relatively high transmission fraction of cold neutron through thick ND layers. Meanwhile, once the neutrons are moderated to VCN energy, that layer, even when few millimeters thin, suddenly becomes opaque, reducing the chances of leakage.
Conversely, the thickness of the ND layer on the sides seems to have a more important role. In particular, both too-thick and too-thin values are penalizing for VCNs. In the first case because there is not enough reflecting material, while in the second case, too much moderating material is lost to accommodate NDs. Also, the emission surface is considerably shaded by the reflector layer, inevitably reducing the neutron counts at the beam port. The optimized model is shown in Fig. 98. Compared to the LD2 baseline, this model is able to deliver 47 times more neutrons above 40 Å and 3 times more neutrons in the range from 20 Å to 40 Å, while retaining only 40% of the cold neutrons between 4 and 10 Å.
Fig. 98.
Table 16. (Left) MCNP model of the optimized converter. (Right) parameter table for this model. The optimized parameter are in bold.
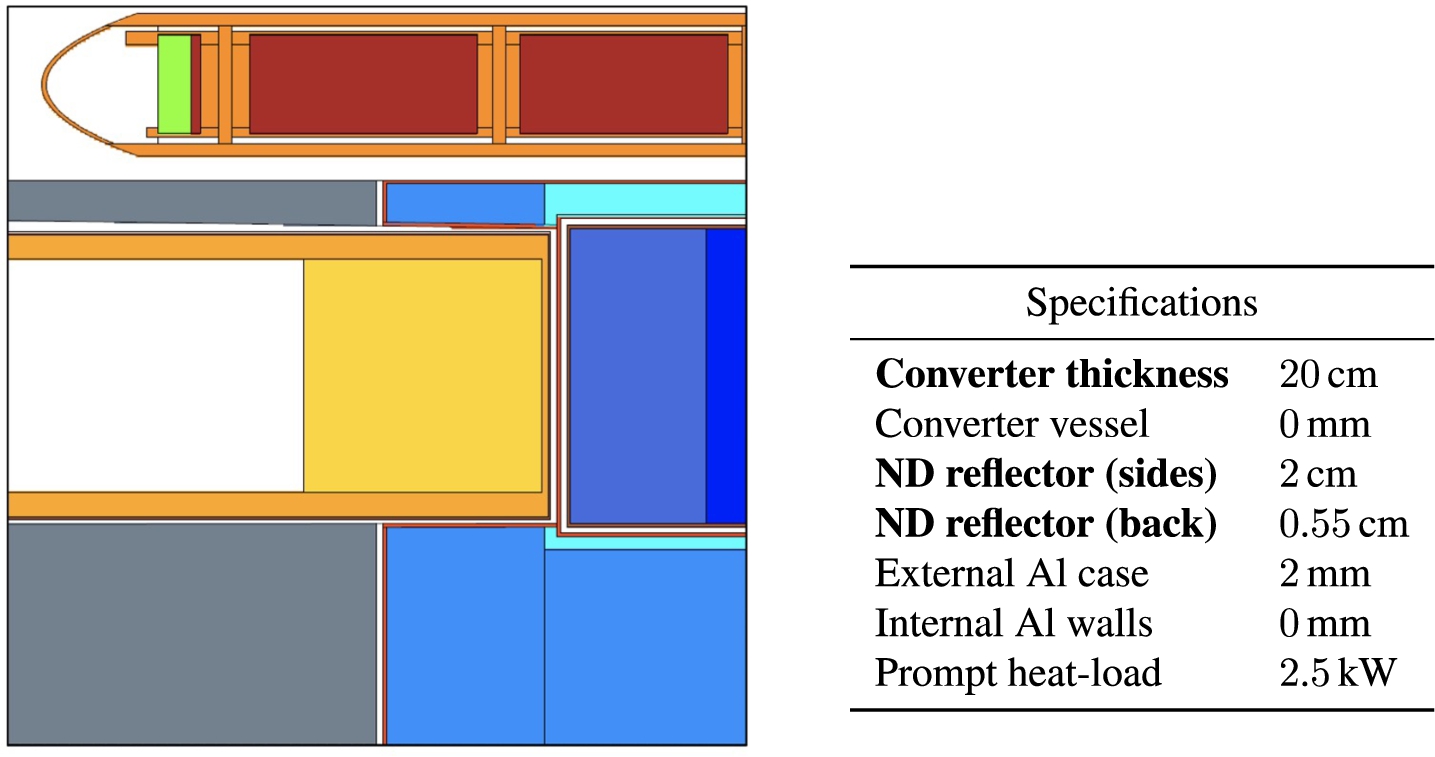
4.8.3.Engineering details
In order to make the model more realistic, we added an aluminum vessel 2 mm thick at 5 K around the SD2 crystal. An additional 5 mm vacuum gap separates the converter vessel from the ND reflector surrounding it. Finally, we add 1 mm of aluminum as internal cladding for the reflector. We have already mentioned that the model without inner Al structure was a simplified test to study the validity of the idea. For a ND guide, this is quite a critical feature, especially in the VCN range. This model is shown in Fig. 99.
Fig. 99.
Table 17. (Left) MCNP model of the optimized converter with engineering details. (Right) parameter table for this model.
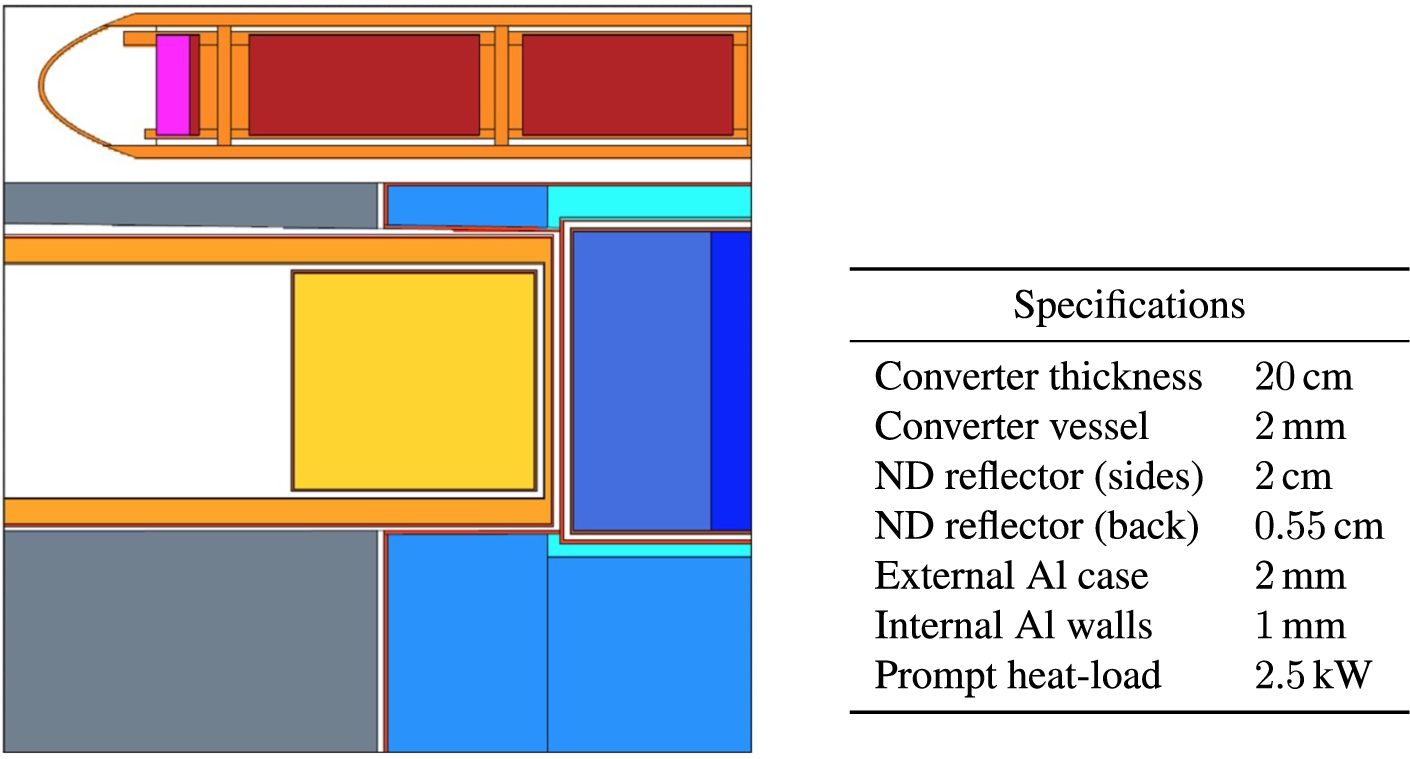
Compared to the ideal case, this model performs much worse. We estimated that, in terms of gain over the baseline, it yields only 2.6 times more neutrons above 40 Å and 10% more neutrons in the range from 20 Å to 40 Å. While 1 mm is already a reasonable thickness, one way to improve the model is to use thinner Al cladding for the extraction. Another way to improve performance would be using other metal foils, like magnesium [42]. Preliminary calculations with 1 mm of pure Mg showed gains over the baseline as high as a factor of 12 for neutrons above 40 Å and a factor of 2 in the range from 20 Å to 40 Å. Here, it is probably most noteworthy that the flexibility of the design could be used to improve the performances, keeping in mind that reducing the thickness of the inner walls or changing the material tends to be beneficial.
4.8.4.Improvements to the design
The first change we can make to the model that will predictably improve the performance is removing the cold beryllium filter from the LD2 vessel. The reason for this is that the beryllium at 20 K reflects any neutrons with wavelengths below 4 Å back to the moderator; whereas for longer wavelength neutrons, the crystal is almost transparent. Although this is beneficial for NNBAR, whose FOM is proportional to
Fig. 100.
Table 18. (Left) MCNP model of the optimized converter with engineering details and without Be filter in the cold source. (Right) parameter table for this model.
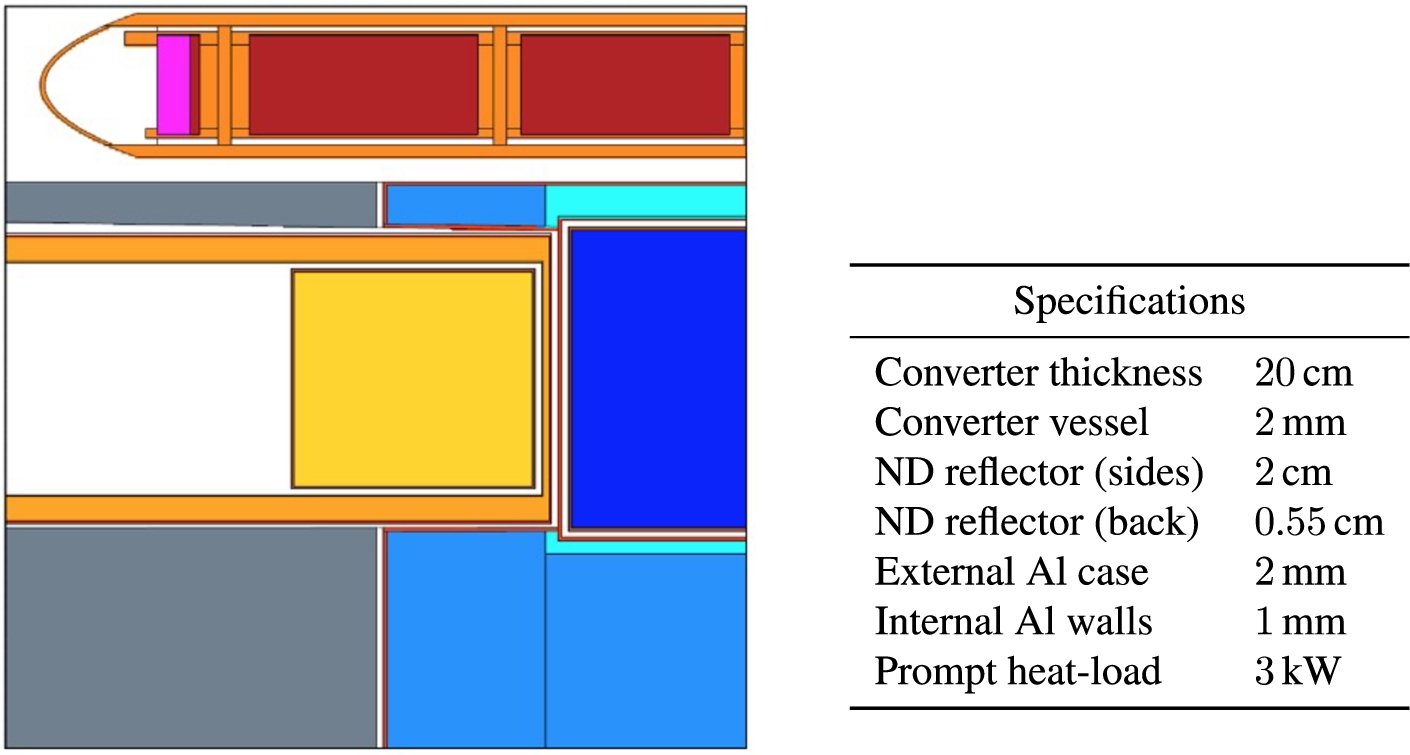
Since the thermal and cold neutron flux have an important role in VCN production when with SD2, a further improvement to the design should be obtained by moving the converter closer to the source. In other words, it is worth studying the effect of embedding the converter inside the LD2 vessel, regardless of its feasibility. To this end, we inserted the converter 11 cm deep inside the cold source. Due to the major shift in the design, we chose to optimize this model separately. The parameters are, within the statistical uncertainty, identical to the previous optimization, except for the thickness of the back ND layer which is 1.2 cm (still a low-sensitivity parameter).
The model implementing this idea is shown in Fig. 101. In terms of performances, this solution provides an average factor of two improvement for all energies over the case with the Be filter (Fig. 99). If we compare the neutron counts over the baseline without a VCN converter, this model is able to deliver 5.7 times more neutrons above 40 Å and 2.5 times more neutrons in the range from 20 Å to 40 Å, while retaining 60% of the cold neutrons between 4 and 10 Å. However, once again, the price to pay for the increased flux is a significant increase in heat-load. We estimate that just moving the converter 11 cm inside the moderator nearly doubles the heat deposition to a value of 5.8 kW.
Fig. 101.
Table 19. (Left) MCNP model of the optimized converter embedded in the LD2 cold source. (Right) parameter table for this model. The optimized parameters are in bold.
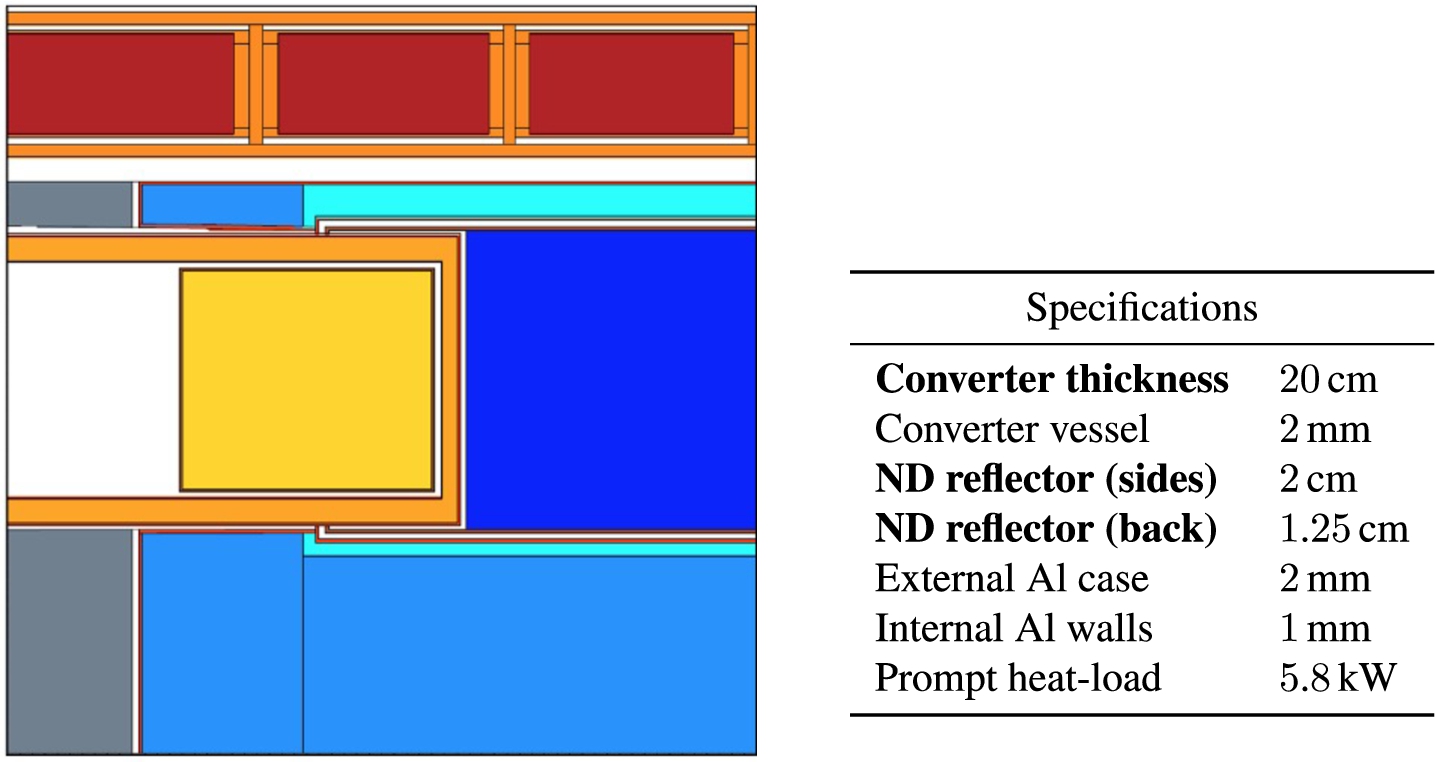
4.8.5.Converter for neutron scattering instruments
Similarly to the tests on the NNBAR side, the effects on VCN flux were studied for a thin converter on the WP7 side. The F1 tally measures the current at a fixed surface placed at the beam port, 2 m from the center of the moderator, with the same energy-angle resolution. For this test, the opening is 10 cm × 10 cm and the SD2 crystal is 5 cm thick. The ND guide is 190 cm long with 2-cm-thick walls on the sides and 1 cm in the direction of the cold neutron beam. No structure is present around the converter and for the inner walls. The model used is shown in detail in Fig. 102.
Fig. 102.
Table 20. (Left) MCNP model of the converter embedded on the WP7 side for the preliminary test run to check the separate and combined effect of NDs and the SD2 block. (Right) parameter table for this model.
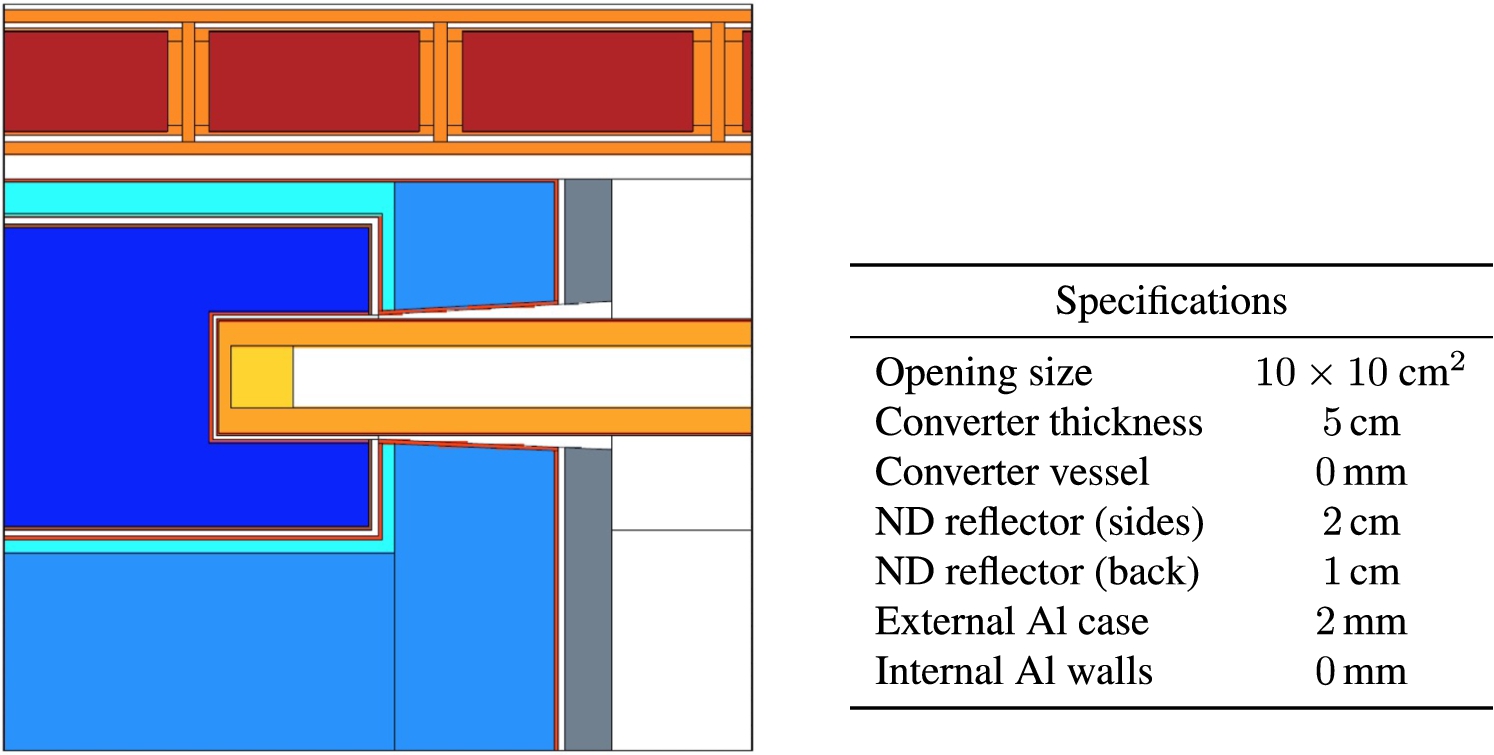
The preliminary test with this tentative setup did not show, compared to the baseline, any gain in using the converter independently from the energy-group considered. To be sure that the bad performances observed are not strictly bound to a particular configuration, the most important parameters of the geometry were optimized with Dakota. Namely, the EGO algorithm found the best values for the SD2 thickness, the ND layer thickness on both the sides and the back. Similarly to the NNBAR case, the figure of merit of the optimization was the VCN counts between 20 Å and 40 Å and the minimum value set as boundary for the ND layers is 0.1 cm. Despite the precision being lower than the NNBAR case, especially at very long wavelength, the results suggest with a good degree of convergence that the most favorable configuration has only 1 mm of NDs on the sides (Fig. 103).
The fact that gains are observed over the baseline in the VCN range suggests that inserting a block of SD2 has the intended effect of further moderating the cold spectrum coming from the LD2. Also, as expected, the system is not very sensitive, within few centimeters, to the thickness of the NDs in the back due to the high neutron transmission in the cold range.
Fig. 103.
Results of the multi-dimensional Dakota optimization of the 10 cm × 10 cm opening for WP7. Each run of the optimization is represented by a point. Only gains for the VCN energy-group from 20 Å to 40 Å are shown. The gains are calculated over the baseline with the same opening. (A) SD2 thickness vs ND layer side thickness (b) SD2 thickness vs ND layer back thickness.
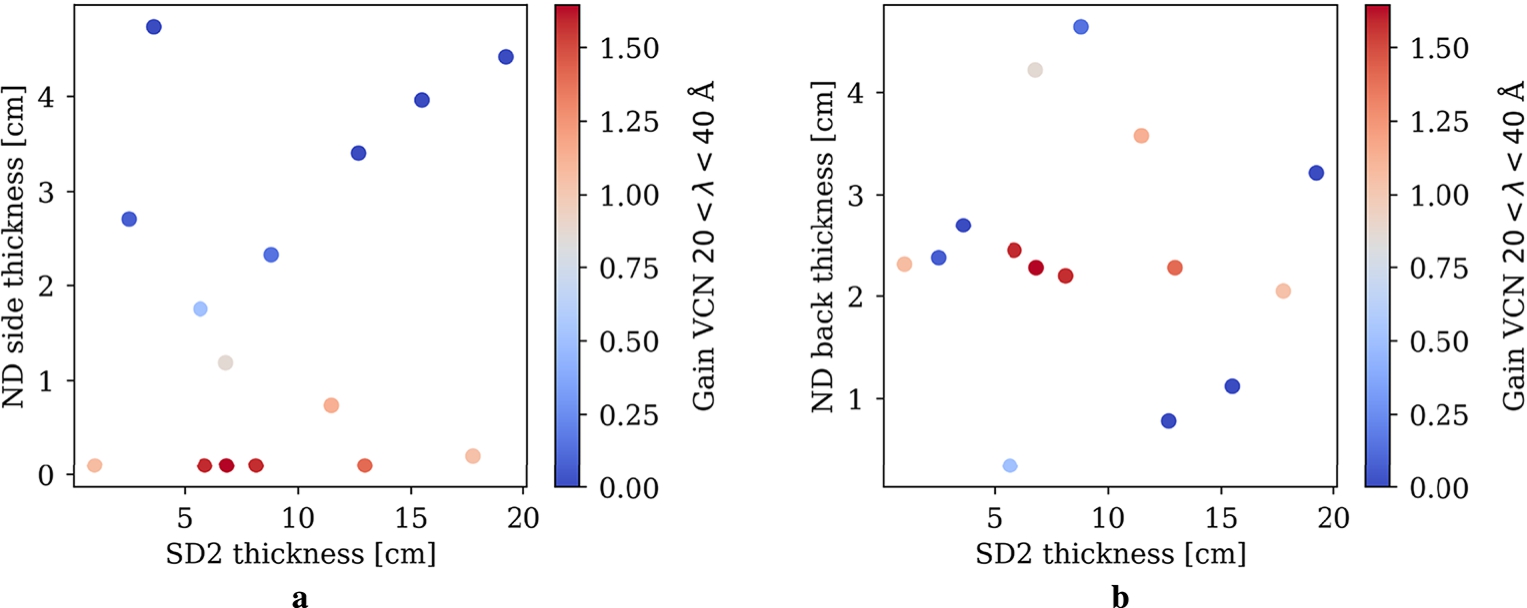
However, the configuration that maximizes the gains between 20 Å and 40 Å is found at the minimum of the ND thickness on the sides. The different behavior observed between WP7 and NNBAR in the optimization of the ND side layer thickness is explained by a poor parameterization of the model. As already mentioned, the increase of the reflector thickness on the side has the effect of reducing the amount of SD2 and occluding the emission surface. Despite being present also on the NNBAR side, this effect seems to be crippling only on the WP7 side.
One way to fix this is to move the SD2 block out of the reentrant hole and by changing the thickness of the ND layer outward at the cost of the reflector, not the emission surface. In this setup, the SD2 block has the same lateral dimensions as the opening and it is decoupled from the NDs. This allows for an unrestricted increase to the ND layers on the sides to reduce the leakage, without occluding the opening. Finally, the thickness of the reflector layer outside the twister (i.e. the guide-like part) is also decoupled and optimized separately. The cost in terms of performance for this setup is a lower cold flux due to the longer distance from the center of the cold source. The optimized model for a 15 cm × 15 cm opening is shown in Fig. 104, while in Fig. 105 an overview of the results of the optimization is presented.
Fig. 104.
Table 21. (Left) MCNP model of the converter for the WP7 side with improved parameterization. (Right) parameter table for this model. The optimized parameters are in bold.
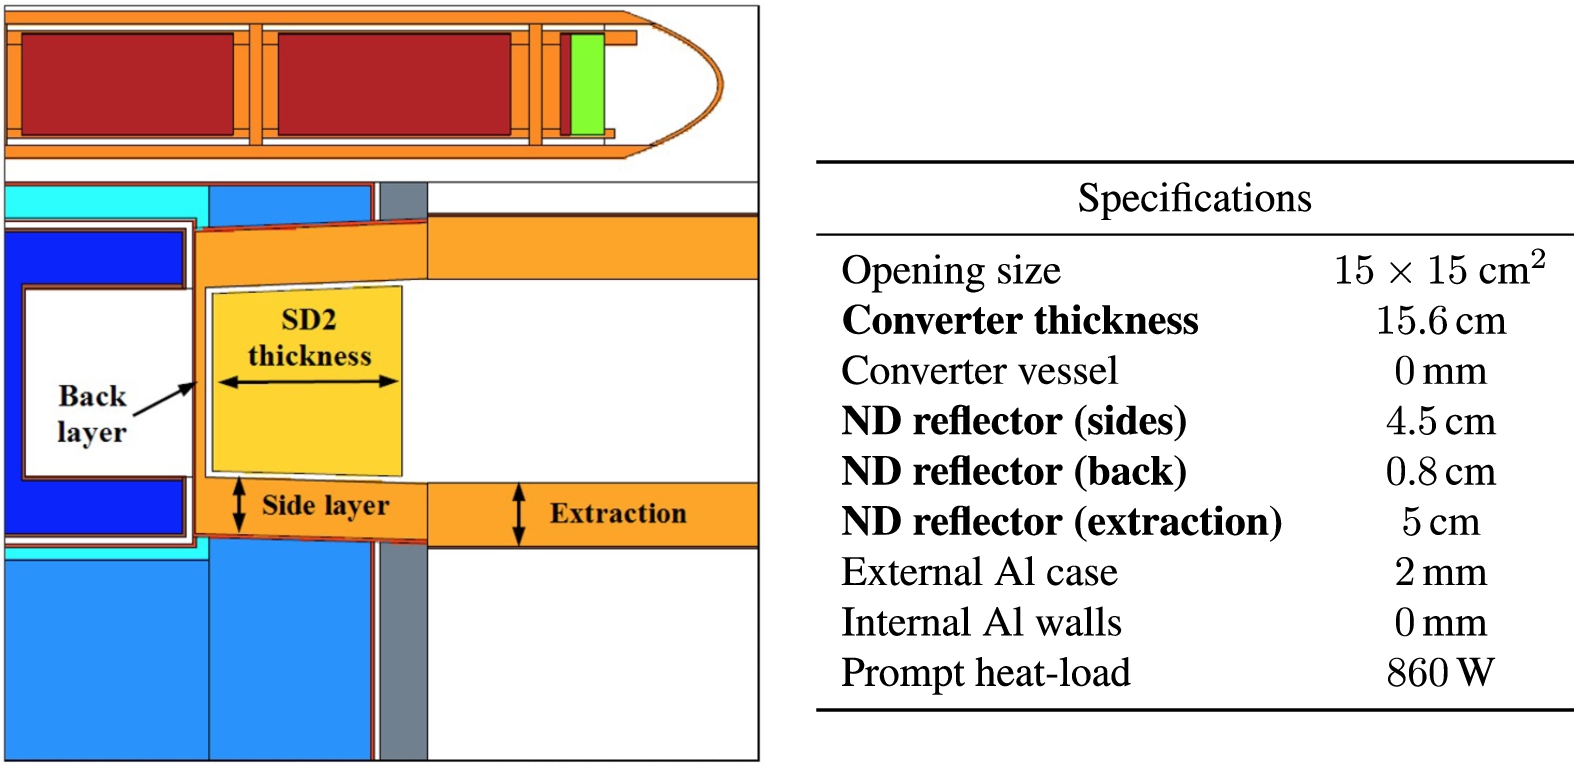
Fig. 105.
Results of the multi-dimensional Dakota optimization of the 15 cm × 15 cm opening for WP7. The gains are calculated at all angles over the baseline with the same opening. (A) each run of the optimization is represented by three vertically aligned points, one for each energy-group of interest and each one with its own scale for the gains. Trend lines are shown with the sole purpose of guiding the readers’ eye. (B) each run of the optimization is represented by a point. Only gains for the VCN energy-group from 20 Å to 40 Å are shown. The two parameters plotted are: SD2 thickness vs ND layer side thickness. (C) SD2 thickness vs. ND layer thickness in the extraction.
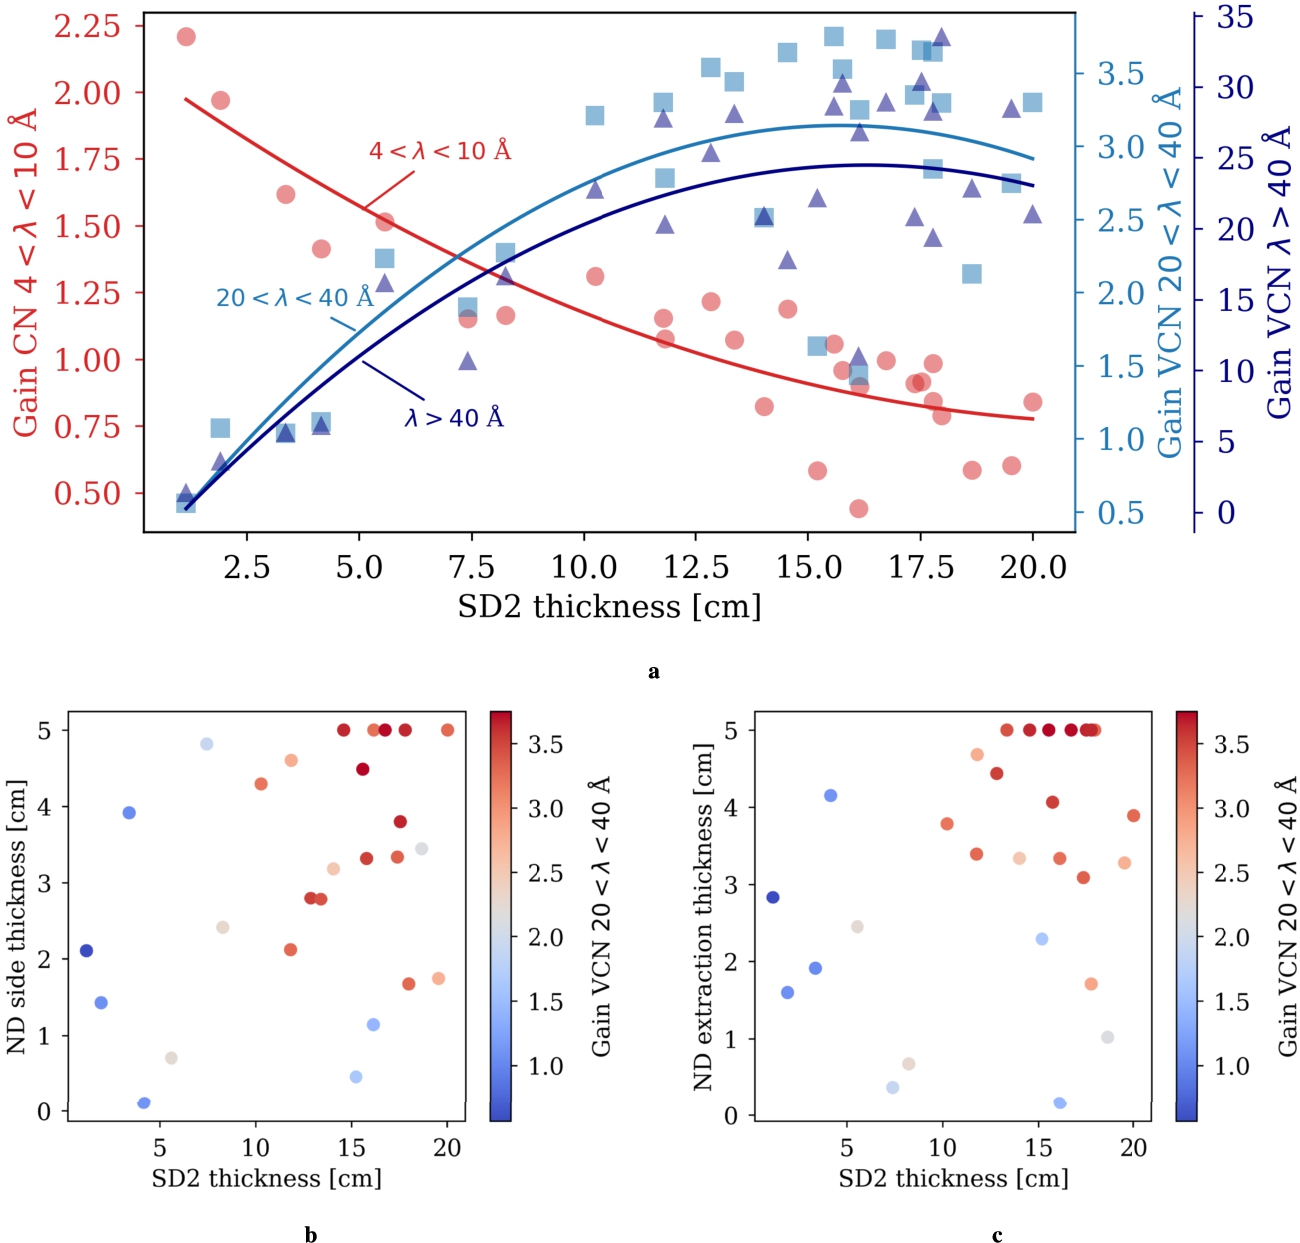
From the analysis of the parameter space, the behavior of the improved model is more similar to what was expected by such system. In Fig. 105a, the different trends of the gains for different energy groups as a function of the SD2 thickness are highlighted. It is clear that, for small amounts of SD2 in the opening, the overall effect of the setup is to increase the CN transport by exploiting the quasi-specular reflection on the ND layers on the sides. Notably, the factor 2 increase in the flux is compatible with the results in Section 4.9 at all angles. As the thickness of the converter increases, the shift at longer wavelengths becomes more and more pronounced. Around 15–20 cm, the converter yields an average gain factor of more than 3 for VCNs between 20 Å and 40 Å and 30 for VCNs at longer wavelengths and at all angles. In Fig. 105b and Fig. 105c the gains from 20 Å to 40 Å are plotted as function of the SD2 thickness and ND layer on the sides and in the extraction, respectively. In both cases, a thicker reflector is correlated with higher gains. In the case of the NDs on the sides, the removal of standard reflector does not seem to produce a significant loss.
It should be noted at this point that each step of the optimization is computationally more expensive and tally precision is lower than for the NNBAR opening. This limits the exploration of the parameter space and the extraction of key insights about the system. Despite the lower cold flux on the converter caused by the longer distance from the center of the moderator, the system is able to deliver order-of-magnitudes gains in the lower VCN range, with potentially smaller impact on the cold flux at the beam port and a smaller heat load to remove (cfr. Figure 104). Finally, in Section 4.8.3 the losses caused by adding the engineering details were discussed for the setup in the NNBAR opening. Similar observations are reasonably valid for the WP7 opening.
4.8.6.Gains at small angles
The results discussed so far are for neutrons reaching the beam port at any angle. The presence of a ND channel allows neutrons with a large divergence to reach the recording surface. However, for most conventional neutron scattering instruments, neutrons with large divergence are collimated along the way and do not contribute to the flux at the sample. The gains for the neutrons with vertical divergence between 0° and 2° are shown in Fig. 106a for the NNBAR opening, and Fig. 106b for the WP7 opening.
Fig. 106.
Results of the multi-dimensional Dakota optimization of the (a) NNBAR opening and (b) the 15 cm × 15 cm opening for WP7. The gains are calculated at small angle over the baseline with the same opening. Each run of the optimization is represented by three vertically aligned points, one for each energy-group of interest and each one with its own scale for the gains. Only the SD2 thickness is reported. Trend lines are shown with the sole purpose of guiding the readers’ eye.
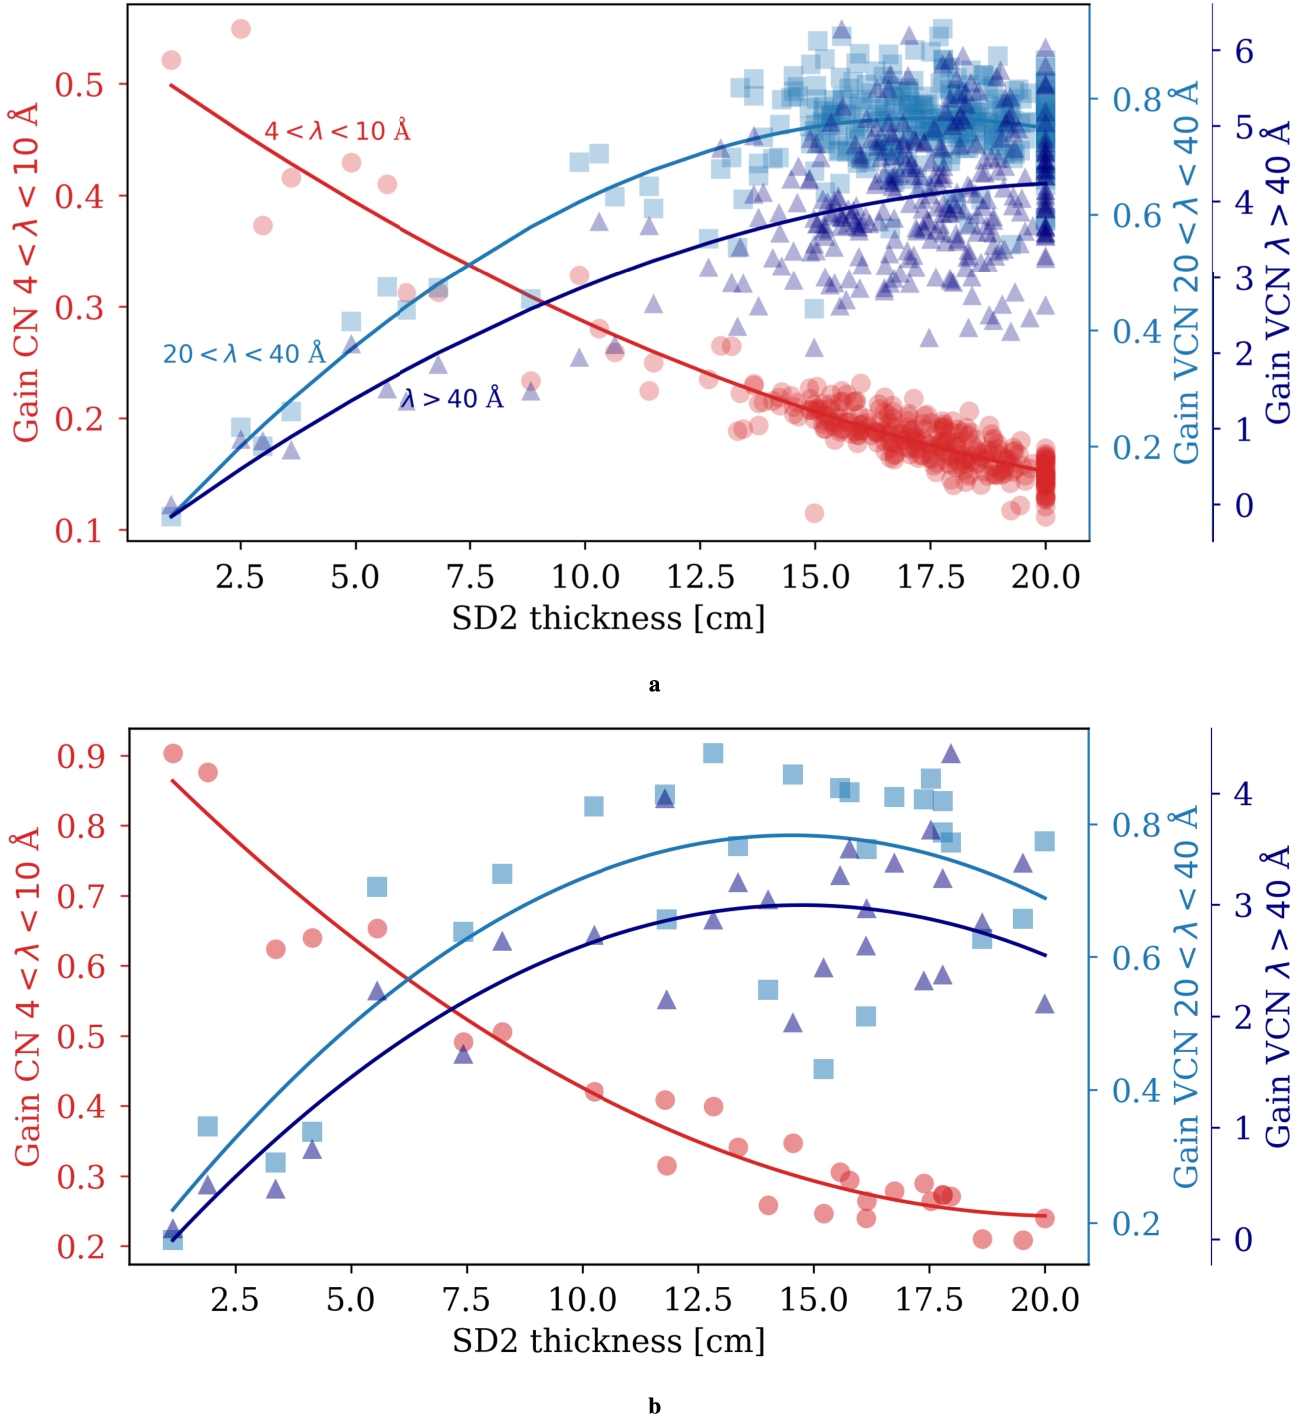
The gains are reported solely as a function of the SD2 thickness, as the strongest predictor. While the trends are similar to the all-angles cases, the scale of the VCN gains is smaller. Up to 20 Å, there is no advantage in using the converter. The initial VCNs produced inside the LD2 cannot reach the beam port due to the thin ND layer between the main source and the converter. Since ND channels have proven to be effective in improving the neutron flux at small divergence, the reason for the lower gains can be attributed only to a lesser production in the SD2. The neutron flux out of the SD2 at small divergence does not compensate for the initial VCN flux, yielding an overall loss between 20–30%. Above 40 Å, the neutron production by the SD2 crystal over the LD2 baseline is enough to achieve a net gain. Due to the wide applications of low-divergence neutrons, this effect should be studied in detail, in order to tailor the source to the specific needs of the instruments placed at the end of the extraction system.
4.9.Beam extraction with nanodiamonds
An additional option for improving VCN yield regardless of the source configuration is to use a dedicated guide-like system to more efficiently extract the VCN tail from the LD2 spectrum. In a dedicated study, since the quasi-specular reflection on thin ND powder samples has been experimentally observed [5,47,143,144], a straight ND guide with walls thickness of 5 mm was considered adequate to observe the improvement of extracting CNs and VCNs. Preliminary simulations were conducted on both sides of the LD2. The ND powder had an effective density of 0.6 g/cm3, so it was compressed inside the hollow space created by two Al walls. The inner wall was a 0.1 mm thick Al foil, and the outer Al wall had a thickness of 2 mm. The geometry is shown in Fig. 107.
Fig. 107.
MCNP model of the LD2 baseline with ND extraction system (a) vertical cross section, perpendicular to the proton beam direction. (B) cross section parallel to the target plane with the proton beam impinging from the left.
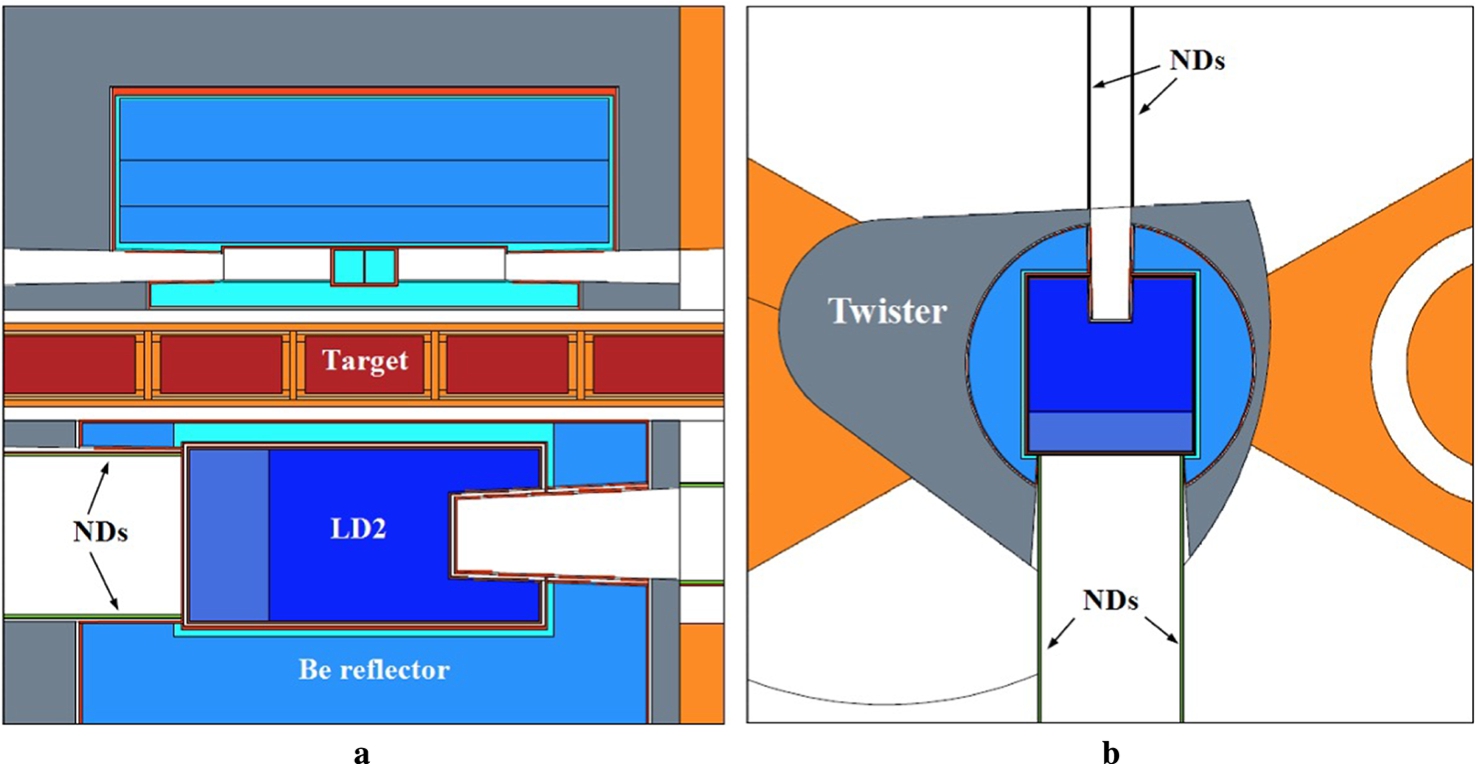
Fig. 108.
Gains with ND guide 2 m away from the center of the moderator (beam port position) as a function of neutron wavelength groups for NNBAR (left) and WP7 (right) openings.
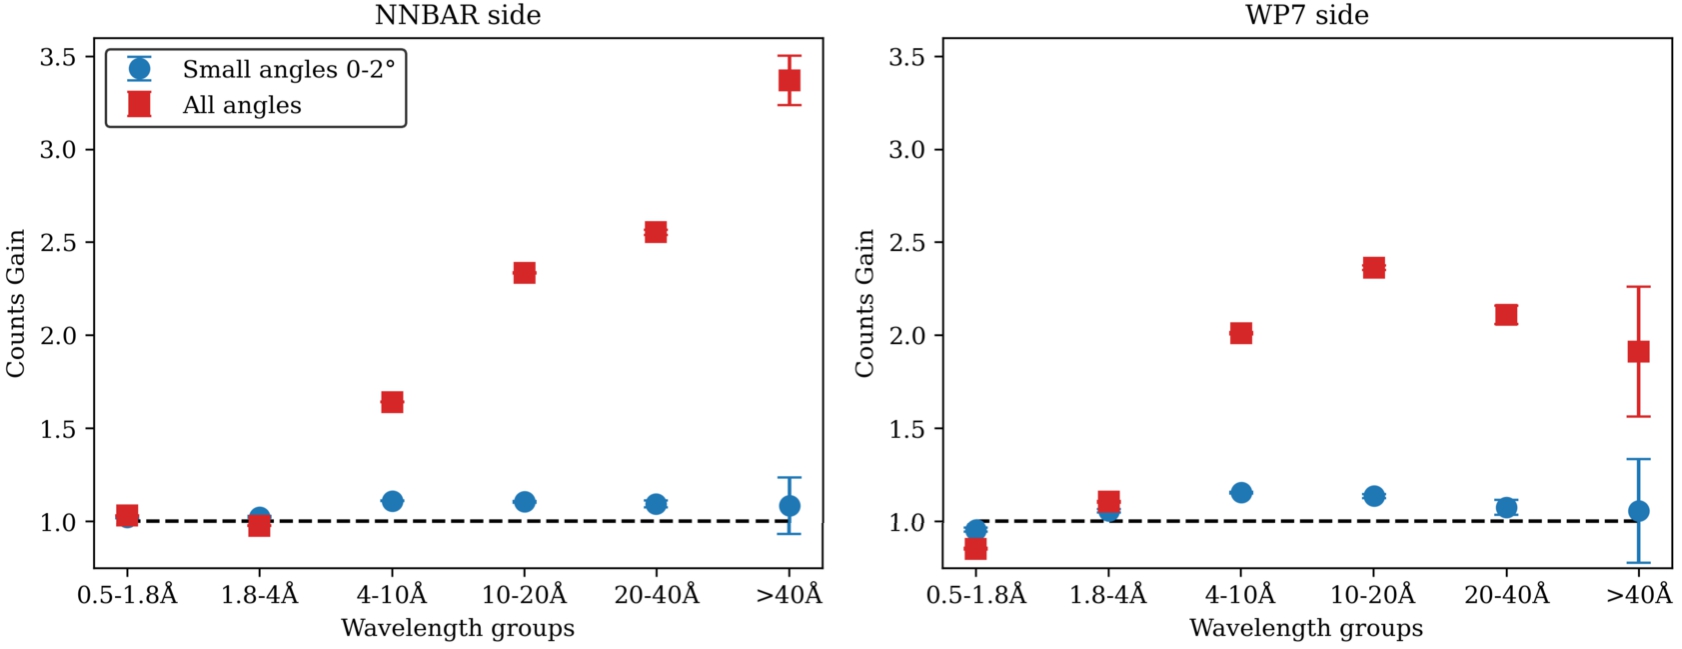
Fig. 109.
Divergence of cold neutrons at the beam port (
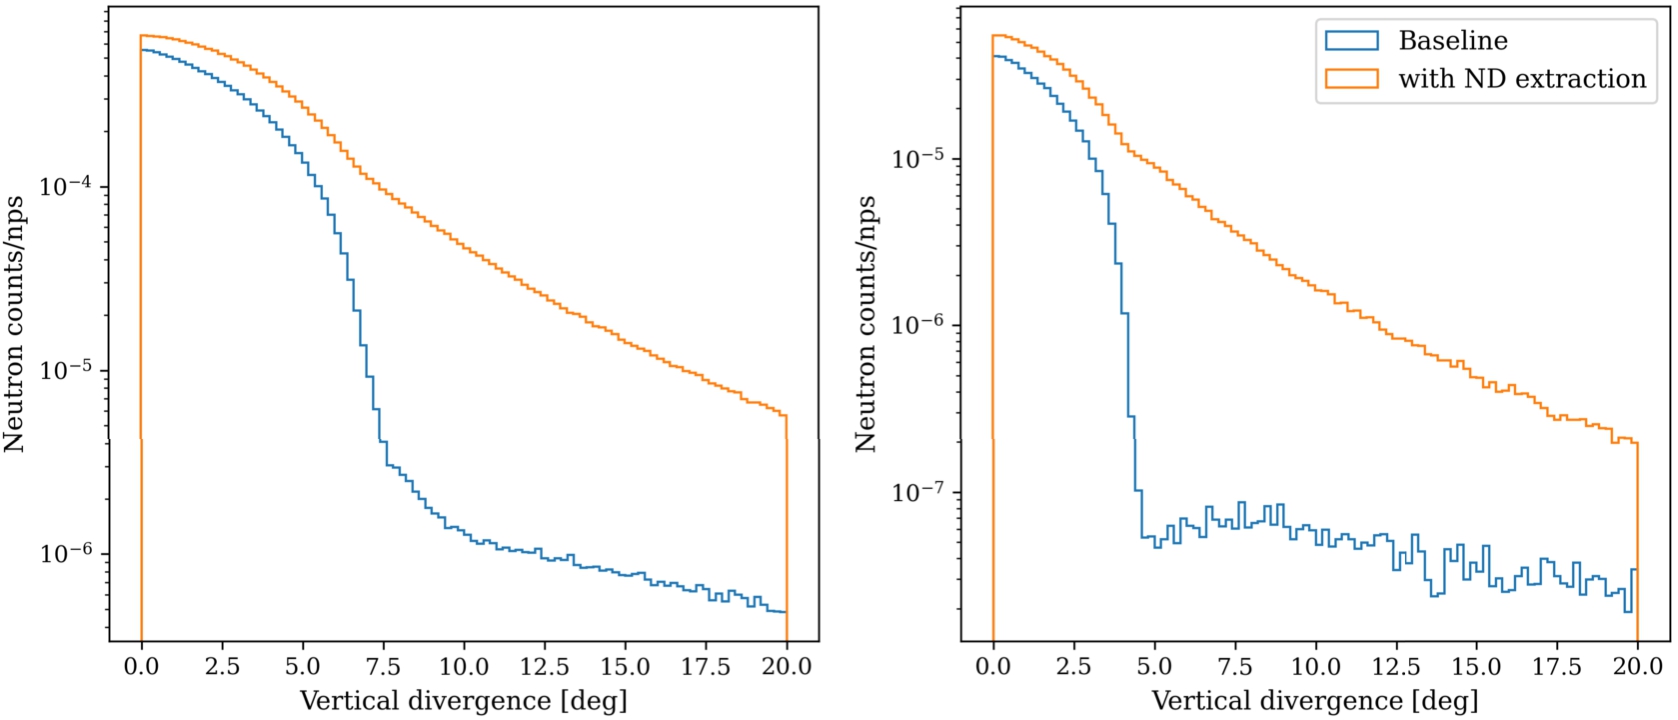
The result of the study are summarized in Figs 108 and 109. As expected, the ND guide can transport cold neutrons and can provide on average a factor of 2 gain at 2 m over the baseline. However, most of these gains are obtained for neutrons reaching the beam port with vertical divergence greater than 2°, that is, the more pronounced effect is observed in the region of the phase space where fewer neutrons (or none at all) would be allowed to reach the beam port without the guide. The gain provided by the ND guide reached the maximum at around 10 Å on the WP7 side, and then decrease in the VCN energy range. Here, due to the multiple large-angle interactions, the reflections on the ND layer very quickly produce an isotropic distribution. The large NNBAR beam port is more likely to accept those large divergence neutrons, while in the smaller guide on the neutron scattering side, they are easily lost (absorbed, back-scattered, and so on) after multiple interactions with the ND and the Al walls. The idea of a ND guide between the emission surface and the beam port as a VCN-enhancing system is further investigated in the following section.
4.10.Comparison of the different options
Fig. 110.
MCNP models of the VCN sources compared in this work: (a) standard LD2 with advanced ND extraction system (b) dedicated SD2 with advanced ND extraction system (c) combined LD2 and SD2 source with ND extraction (ideal case) (d) combined LD2 and SD2 source with ND extraction (Al vessel and void gap).
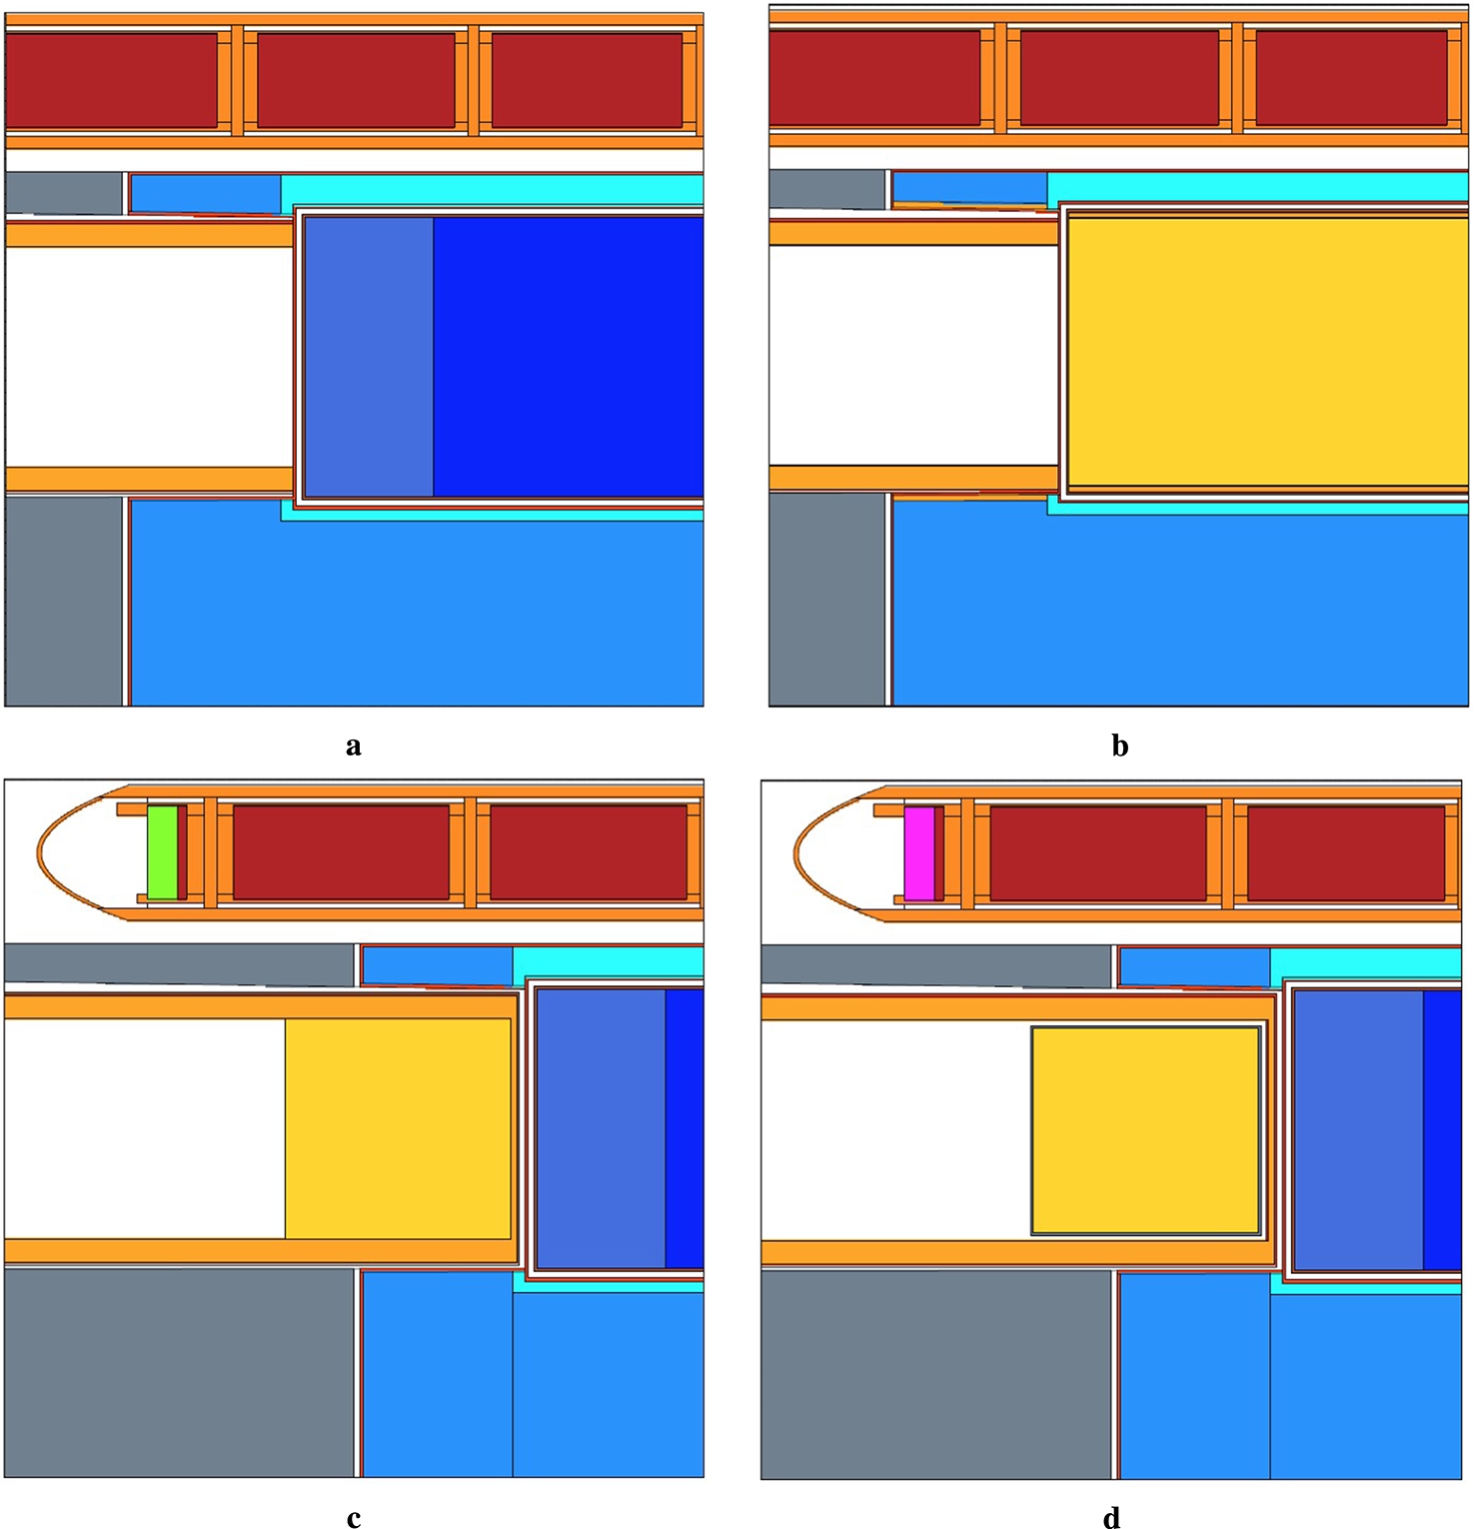
In this section, we compare the performance of the VCN options presented thus far, except for the clathrates option because it is still at a conceptual level. The models compared here are shown in Fig. 110. In order for the comparison to be meaningful, it is important to account for the differences that are not at the core of the design (e.g. the size of the recording surface, or the thickness of the Al walls). Here, we focus only on the NNBAR opening since its size is very similar between the cases, and it is more reliable in terms of statistical convergence. Below is a description of each model that is part of the comparison:
- The baseline used is an LD2 24 cm × 45 cm × 48.5 cm box at 22 K with a reentrant hole on the neutron scattering side of approximately 10 cm × 10 cm and 12.5 cm and straight walls in the direction perpendicular to the target. The NNBAR side is 24 cm × 40 cm and a 11-cm cold Be filter at the exit. This baseline was initially conceived to accommodate several equally-illuminated instruments on a plane parallel to the target. The only adjustment to be made to the model in view of the comparison is the dimension of the recording surface at 2 m from the center of the moderator. This is set for all the cases at 19 cm × 35 cm.
- The ND extraction discussed in Section 4.9 has a thin ND layer on the sides. Here it is increased to 2 cm, which should increase the effect of the enhanced VCN transport at the expense of the cold neutrons. The inner Al wall that contains the ND is 1 mm thick. The model is presented in Fig. 110a.
- For the dedicated full SD2 source, a ND extraction system identical to the previous case was added (Fig. 110b). The model for this comparison assumes ideal SD2 at 5 K with no cooling structure inside the moderating volume. As seen in Section 4.7, this is far from being a realistic description of the moderator, but it is based on the same sets of assumptions that define the baseline (i.e. ideal LD2 at 22 K with no flow channels inside).
- In the combined option for the NNBAR side, the SD2 block is 20 cm thick and the ND layer between the source and the SD2 block is 0.55 cm. The ND extraction system is the same as the previous cases, as well as the recording surface. The difference between the ideal case in Fig. 110c and the one in Fig. 110d is only the 2 mm Al vessel and the 5 mm vacuum gap surrounding the SD2. The only change made for the comparison is adjusting the position and the dimensions of the ND guide to match the previous cases.
Table 22
Neutron current and brightness in wavelength groups for the five VCN sources used in the comparison (Fig. 110), calculated for the NNBAR opening. The statistical relative error is also reported
| Value | % Rel. err. | Value | % Rel. err. | Value | % Rel. err. | Value | % Rel. err. | Value | % Rel. err. | |
| Current at all angles [n/s] | ||||||||||
| Baseline | 0.1 | 0.1 | 0.1 | 0.5 | 3.7 | |||||
| Baseline (ND extraction) | 0.2 | 0.1 | 0.1 | 0.3 | 2.0 | |||||
| Full SD2 (ND extraction) | 0.2 | 0.1 | 0.1 | 0.2 | 0.6 | |||||
| Combined option (ideal) | 0.3 | 0.1 | 0.1 | 0.4 | 0.7 | |||||
| Combined option (Al vessel) | 0.3 | 0.1 | 0.1 | 0.4 | 1.3 | |||||
| Brightness [n/s/cm2/sr/Å] | ||||||||||
| Baseline | 0.4 | 0.3 | 0.3 | 1.3 | 10 | |||||
| Baseline (ND extraction) | 0.4 | 0.3 | 0.3 | 1.3 | 9.1 | |||||
| Full SD2 (ND extraction) | 0.5 | 0.2 | 0.2 | 1.0 | 3.5 | |||||
| Combined option (ideal) | 0.8 | 0.3 | 0.3 | 1.7 | 5.1 | |||||
| Combined option (Al vessel) | 0.8 | 0.3 | 0.3 | 1.8 | 9.6 | |||||
Table 23
Neutron current and brightness gains over baseline in wavelength groups calculated from Table 22. Propagated statistical error is also reported
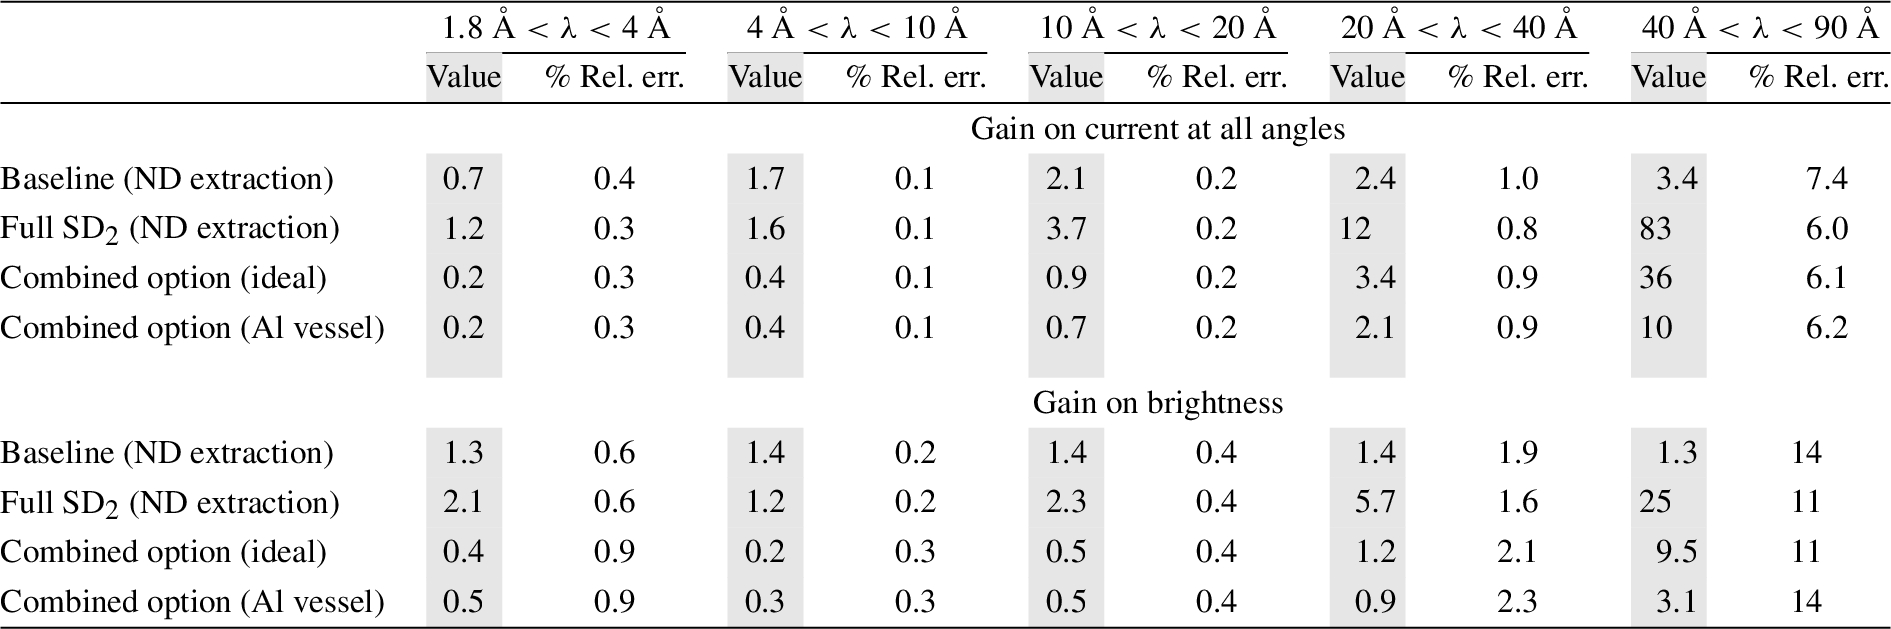
For each of these cases, we calculated the current in n/s and the brightness in n/s/cm2/sr/Å. The calculation of the absolute brightness for this comparison is similar to what has been done in Section 4.7. First, we recorded the raw counts per spallation proton through the surface at 2 m from the center of the moderator. Then, we divided the counts at ±2° from the surface normal, by the emission surface, by the solid angle in the 2° cone, and by the wavelength range of the group, then we multiplied the result by the expected proton current on the ESS target at 5 MW, as in Equation (3). All the results in the appropriate units are presented in Table 22. To facilitate the comparison, in Table 23 we calculated the gains over the baseline for each option, while in Fig. 111 the current spectra at all angles highlights the effect of ND, SD2, and the combination of the two in two wavelength regions.
Fig. 111.
Current at all angles [n/s/Å] at 2 m from the moderator center for all the VCN options studied in this section. (A) Bragg peaks from Be filter, ND and D2 crystal are visible in the range between 2 and 10 Å. (b) VCN tails are highlighted in the range between 10 and 50 Å.
![Current at all angles [n/s/Å] at 2 m from the moderator center for all the VCN options studied in this section. (A) Bragg peaks from Be filter, ND and D2 crystal are visible in the range between 2 and 10 Å. (b) VCN tails are highlighted in the range between 10 and 50 Å.](https://content.iospress.com:443/media/jnr/2023/25-3-4/jnr-25-3-4-jnr230950/jnr-25-jnr230950-g112.jpg)
The best option for both the figure of merits studied is undoubtedly the dedicated full SD2 moderator at 5 K. From the neutronic point of view, order-of-magnitude VCN gains are complemented by a high CN yield. This makes such a moderator an ideal candidate to replace the LD2 cold source. However, as already highlighted in Section 4.7, this solution comes with great challenges from the engineering point of view.
On the other hand, the easiest solution is using the LD2 moderator as it is would be to place a guide-like system made of a thick layer of ND and enhance the VCN tail of the cold spectrum. The simulations show that the longer the wavelength, the higher the gain factor for the current; but when it comes to brightness (low angles) the gains are more limited. The interactions with dedicated VCN instruments need to be investigated for a complete overview of the impact of such device. There is, nevertheless, room for further improvement in the design both in terms of materials (e.g. metal walls, packing of the powder etc.) and configuration (e.g. position of the guide) that should be further investigated in a new project.
The option of combining SD2 and LD2 is a midpoint between the previous two cases. Even though the possibility of cooling a 5-K D2 block so close to the spallation target is yet to be determined, this case promises to be much easier to handle if compared to the full SD2. At the same time, other challenges would arise in terms of the engineering development (e.g. finding room for the cooling infrastructure in the limited space of the opening, replacing components etc.) that do not need to be faced in the case of a simpler ND guide. In terms of neutronic performance, this option can potentially provide order-of-magnitude gains in the VCN current, without structural changes to the CN baseline. As with the other cases, the optimization of the materials used for the extraction and the containment of the D2 is crucial to preserve the ideal gains. Lastly, this option takes a significant toll on the CNs, which are drastically reduced at 2 m with the insertion of the SD2 block. A possible explanation for this effect is the decrease of the neutron mean free path due to the elastic scattering inside the D2 crystal, which increases the effective distance between the moderator surface and the recording surface.
5.Deuterated clathrates hydrates
Another set of materials investigated within the HighNESS project are deuterated clathrate hydrates [187] (DCH), which are water-based solids with large crystallographic unit cells. The moderation potential of clathrate hydrates lies in their low energy modes, which are a consequence of the ability of these so-called inclusion compounds to host guest molecules in cages that are formed by networks of hydrogen-bonded water molecules.
While moderation from collective excitations, such as phonons, in a moderator material are kinematically restricted; localized, dispersion-free excitations, such as displacement of confined molecules – often referred to as Einstein modes –, molecular rotations, librations or paramagnetic excitations do not suffer from this limitation and allow for an efficient neutron slowdown even at lowest neutron temperatures [48] [230]. Clathrate hydrates present numerous localized modes, making them a promising choice for VCN moderators. However, their actual moderation capability for the VCN range still needs to be demonstrated experimentally.
Three hydrate systems were investigated within the HighNESS project. The first one hosting deuterated tetrahydrofuran (THF-d) as a guest molecule (molecular formula: 17D2O · C4D8O),99 the second one hosting molecular oxygen (O2) as a guest molecule (molecular formula: 17D2O∼ 3O2)1010 and the third one hosting both THF-d and O2 (molecular formula: 17D2O · C4D8O ∼ 3O2). Therein, O2 occupies the small cages, which are twice as abundant as the bigger cages occupied by the THF-d.
The biggest advantage of the first system is that it can be manufactured with high yields by freezing a stoichiometric mixture of THF-d and heavy-water (D2O). Introducing O2 to the hydrate allows for an additional channel of neutron slow-down. The magnetic triplet ground state of molecular oxygen with its zero-field splitting of 0.4 meV allows for moderation via a cooling cascade mechanism, as described in [230]. The notably low excitation energy, in contrast to modes in the lattice and THF with energies in the range of several meV, is expected to considerably improve the moderation efficiency towards VCN, with the inelastic magnetic scattering providing a final cooling decrement. In this section we present results of the experimental characterization of THF-hydrates (Section 5.1), as well as first results from neutronic simulations using moderators of O2-clathrate (Section 5.3).
5.1.Experimental characterization of clathrate hydrates
A necessary characteristic to assess the suitability of a material for moderation purposes is the dynamic structure factor
5.1.1.Manufacturing of THF-hydrates
A starting point of this experimental campaign is establishing a reliable and scalable technique, that allows production of relatively large quantities of hydrates with minimal amounts of residual ice. This technique is described in detail in [48] for THF-hydrates having different protonated and deuterated components. The obtained structures were studied by neutron diffraction at the high-intensity two-axis diffractometer D20.
THF (molecular formula C4H8O) is an organic compound which has a ring structure. A great advantage of THF-hydrates, compared to most other clathrate hydrate compounds, is that they form at ambient pressure from a stoichiometric mixture of its two liquid components, water (
Table 24
Characteristics of the CS-II hydrate crystal cell structure. In the case of THF-hydrates the unit cell formula reduces to 8THF: 136H2O, with the small cages remaining empty. Table adapted from [187, p. 60]
| Crystal system | Cubic |
| Space group | Fd3m (N°227) |
| Lattice description | Face centered |
| F Lattice parameters | a = 17.1 Å–17.33 Å |
| Number of cages | 8 large ( |
| Ideal unit cell formula |
Fig. 112.
Diffraction pattern of fully deuterated THF-hydrates (
![Diffraction pattern of fully deuterated THF-hydrates (THF-d·D2O) formed in situ taken on D20 with λ= 1.546 Å at a temperature of 230 K (red) and the corresponding multi-phase rietveld-refinement (black). The blue line depicts the difference between the data and the fit. The calculated peak positions (green ticks) correspond to phases considered for the refinement, which are, besides the THF-d-hydrate, the aluminum sample environment and residual hexagonal ice. The upper right corner shows 1 of the 8 large cages (51264) within the unit cell hosting a THF-d molecule, as well as 1 of the 16 empty small cages (512). The experimental conditions are described in detail in [48]. The data is available under [233].](https://content.iospress.com:443/media/jnr/2023/25-3-4/jnr-25-3-4-jnr230950/jnr-25-jnr230950-g113.jpg)
Table 25
Refinement details of the diffraction pattern depicted in Fig. 112. The Bragg R-factor (
| Phase | Ice | |
| Crystal system | Cubic | Hexagonal |
| Space group | Fd-3 m | P 63/m m c |
| Cell parameters | a = 17.22(7) | a = b = 4.50(7) |
| c = 7.35(4) | ||
| 10.49 | 27.92 | |
| 4.89 | 4.89 |
5.2.Low-energy excitations of THF-hydrates
After verifying the formation of the CS-II structure in the samples subjected to both solidification through quenching and slower cooldown, we undertook an investigation of their low-energy excitations. For this purpose, experiments were carried out using the ILL time-of-flight (TOF) spectrometers, specifically IN5 [147] and Panther [62]. These experiments aimed to measure the dynamic structure function
Table 26
Differently deuterated and protonated samples prepared for spectroscopy experiments. The deuteration of either the guest molecule or the host lattice allows the highlighting of different parts of the sample in the scattering signal. Note that the full or partial deuteration is capable of slightly changing the dynamics of the sample, while the structure remains the one described in Table 24
| Abbrev. | Host | Guest | |
| Fully protonated | |||
| Deuterated guest | |||
| Deuterated cage | |||
| Fully deuterated |
Figures 113a and 113b show two spectra for different THF hydrate samples measured at Panther and IN5, respectively. These spectra are obtained by integration over a given q-range, providing an average of the coherent signal in this range.
Fig. 113.
(A) constant q-slice at
![(A) constant q-slice at q=(4±1)Å−1 through S(q,ω) for different deuterations and protonations of the THF-hydrate measured at Panther with an incident energy Ei=19meV at a temperature of T=1.5K. The characteristic peaks at 7 meV and 10.5 meV of CS-II can be well discerned. Preliminary results, data is available under [234]. (B) constant q-slice at q=(3.5±0.75)Å−1 through S(q,ω) at IN5 with an incident energy Ei=9meV at a temperature of T=1.5K. The observed peaks are due to localized excitations of the THF molecules (see text). The shoulder of the elastic peak is not a feature of the sample but back scattering of the sample environment. The experimental conditions are described in detail in [48]. The data is available under [233].](https://content.iospress.com:443/media/jnr/2023/25-3-4/jnr-25-3-4-jnr230950/jnr-25-jnr230950-g114.jpg)
In the investigated energy range, the dynamics of the host structure are primarily determined by the translational modes of the
5.3.Simulation of a clathrate hydrate moderator
To study the use of clathrate hydrate as a VCN moderator, neutron flux in a simple spherical model was initially calculated in OpenMC [168]. In this model, a sphere with radius of 22 cm was filled with the clathrate hydrate at 2 K (see Fig. 114a) with a thermal (1 eV) isotropic point source of neutrons located in the center of sphere. The radius of the sphere was chosen so that it has a similar volume as the baseline LD2 cold moderator. The sphere was subsequently filled with LD2 and SD2 for comparison with clathrate.
The neutron energy spectrum for each case can be seen in Fig. 115a, and the neutron wavelength spectrum for each case can be seen in Fig. 116a and Fig. 116b. Here, the SD2 outperforms the clathrate for both the CN (
Fig. 114.
An initial model of the clathrate VCN source. (A) initial model with sphere of radius 22 cm filled with clathrate hydrate. (B) second model with additional 5 cm thick layer of MgH2 cold neutron reflector.
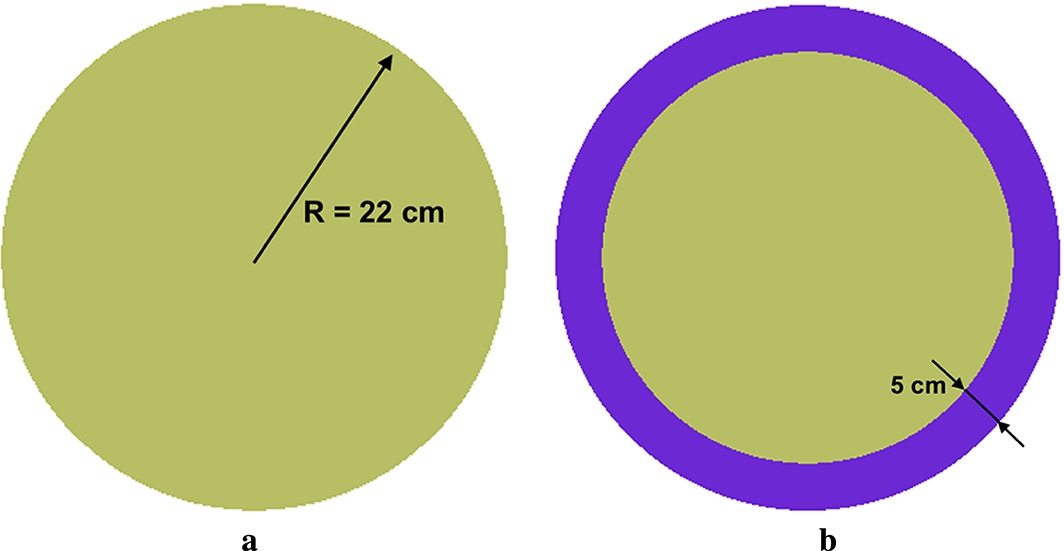
Fig. 115.
Calculated neutron flux inside a sphere filled by O2-clathrate, LD2 or SD2. (A) model without the cold neutron reflector. (B) comparison of the model with and without the cold neutron reflector, which was is MgH2 at 20 K.
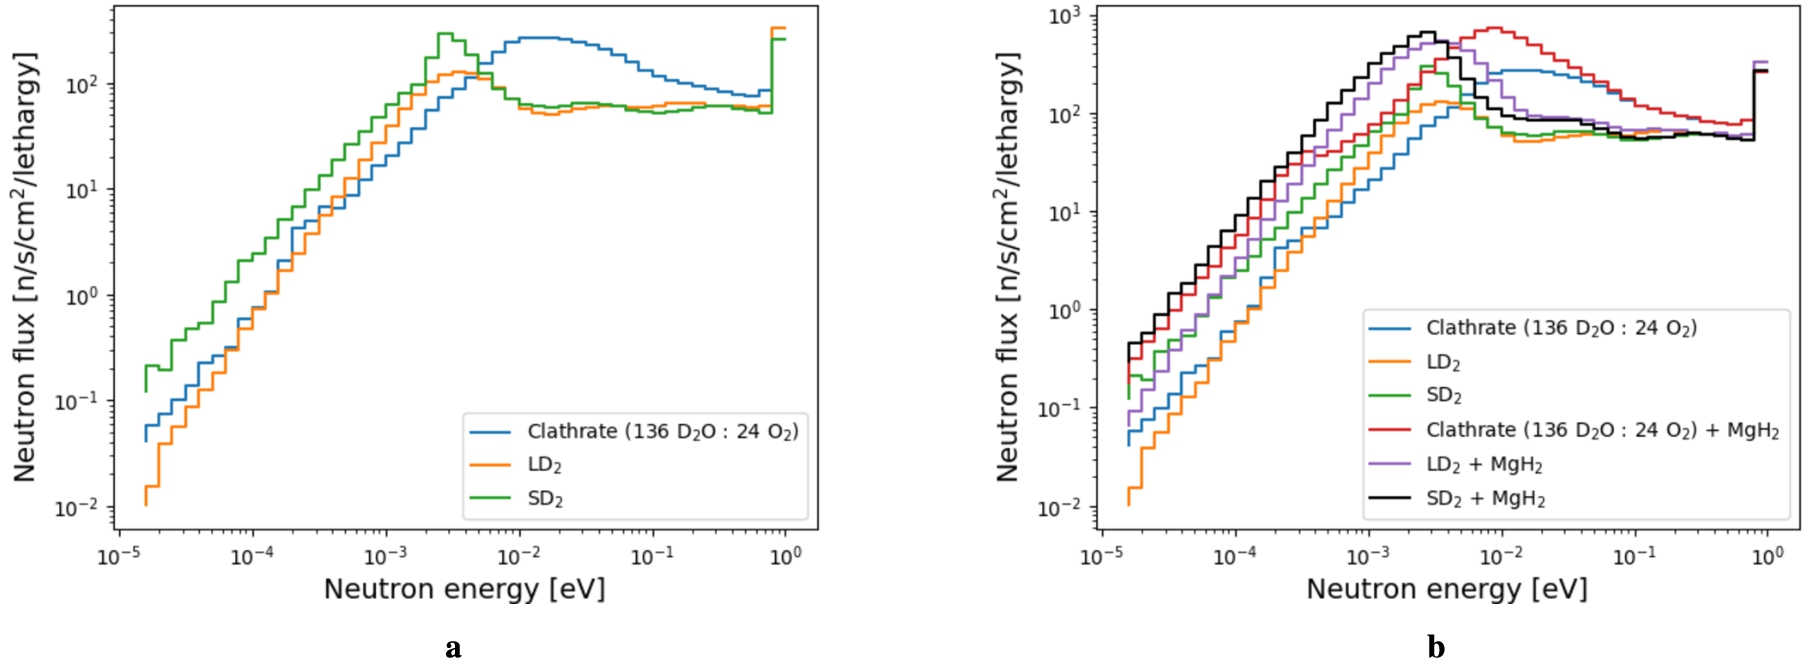
Fig. 116.
Neutron spectrum computed in the sphere filled by O2-clathrate, LD2 or SD2. (A) spectrum between 1 and 15 Å. (B) spectrum between 10 and 20 Å.
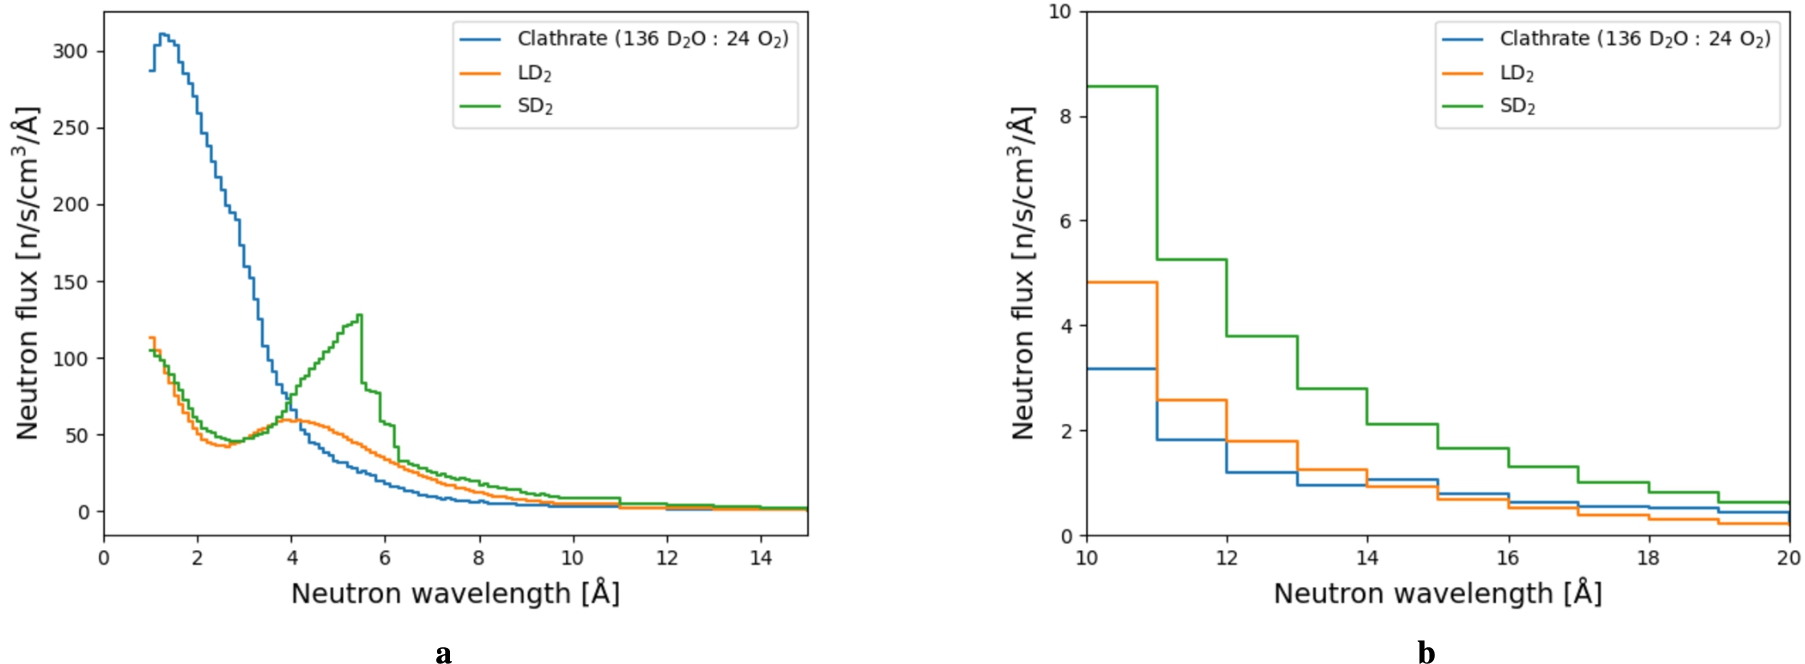
Fig. 117.
Cross-section for the magnetic scattering in O2-clathrate hydrate with 136 D2O and 24 O2 in each unit cell. Generated using the tool ncplugin-MagScat presented in ref. [214].
![Cross-section for the magnetic scattering in O2-clathrate hydrate with 136 D2O and 24 O2 in each unit cell. Generated using the tool ncplugin-MagScat presented in ref. [214].](https://content.iospress.com:443/media/jnr/2023/25-3-4/jnr-25-3-4-jnr230950/jnr-25-jnr230950-g118.jpg)
A limiting factor of the selected clathrate at 2 K is the large mean free path of cold neutrons, about 30 cm, for magnetic down scattering that can be deduced from Fig. 117. The cross sections are computed using the tool ncplugin-MagScat in which the physics of inelastic neutron magnetic scattering [230] is implemented [214]. To mitigate this deficiency, a 5 cm thick shell of material to reflect cold neutrons was designed around the sphere to allow for more interactions between cold neutrons and the clathrate (see Fig. 114b). This shell was filled with MgH2 because of its promising properties as a cold neutron reflector, as reported by Granada et al. [83] and based on a study of several neutron reflector materials. This study was conducted using the model in Fig. 114b where the 5 cm thick outer shell was filled with several possible cold neutron reflectors (results shown in Figs 119a and 119b). In this case, the presence of MgH2 at 20 K maximized the neutron flux for the cold and very cold regions.
The resulting neutron energy and wavelength spectra for the spherical moderator surrounded by the cold neutron reflector is shown in Figs 115b, 120a and 120b. It is clear that the presence of the MgH2 reflector improves the efficiency of the clathrate as a VCN moderator much more than for the case of SD2 and LD2. The performance of clathrate with an MgH2 reflector nearly reached that of SD2 with a MgH2 reflector in this scenario. The peak for the SD2 spectrum at about 5 Å appears in the case with the MgH2 reflector as well. This result from OpenMC is again consistent with the results from MCNP (see Fig. 118b).
Fig. 118.
Comparison of the neutron wavelength spectra for the spherical moderator filled with SD2 calculated in MCNP and OpenMC. (A) spectra without the MgH2 reflector at 20 K. (B) spectra with the MgH2 reflector at 20 K.
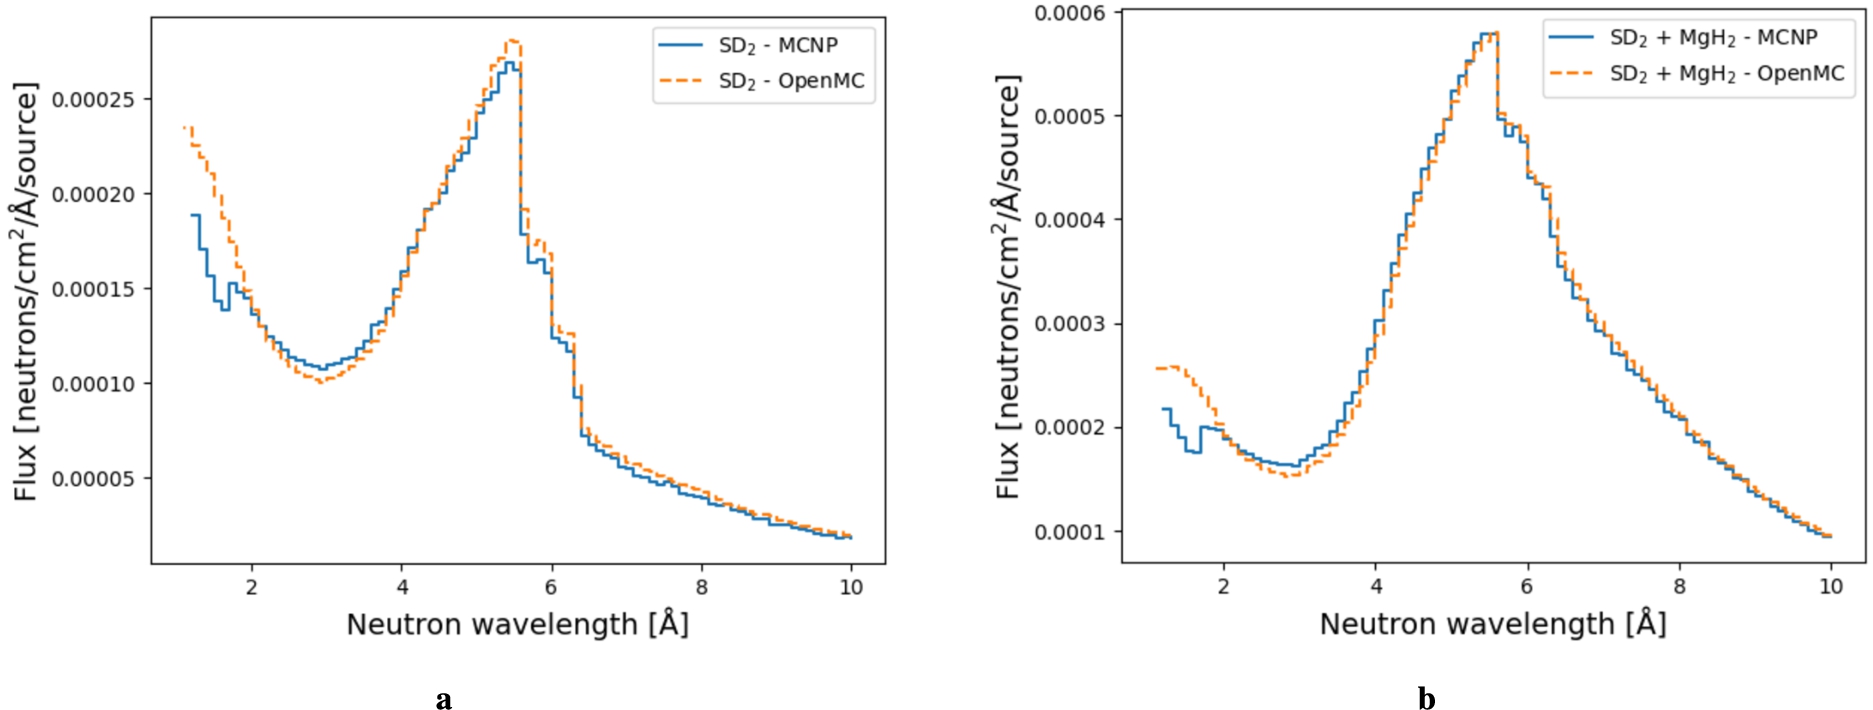
Fig. 119.
Neutron spectra computed in the sphere filled by O2-clathrate and different neutron reflector materials around the moderator. (A) spectrum in energy. (B) spectrum in wavelength.
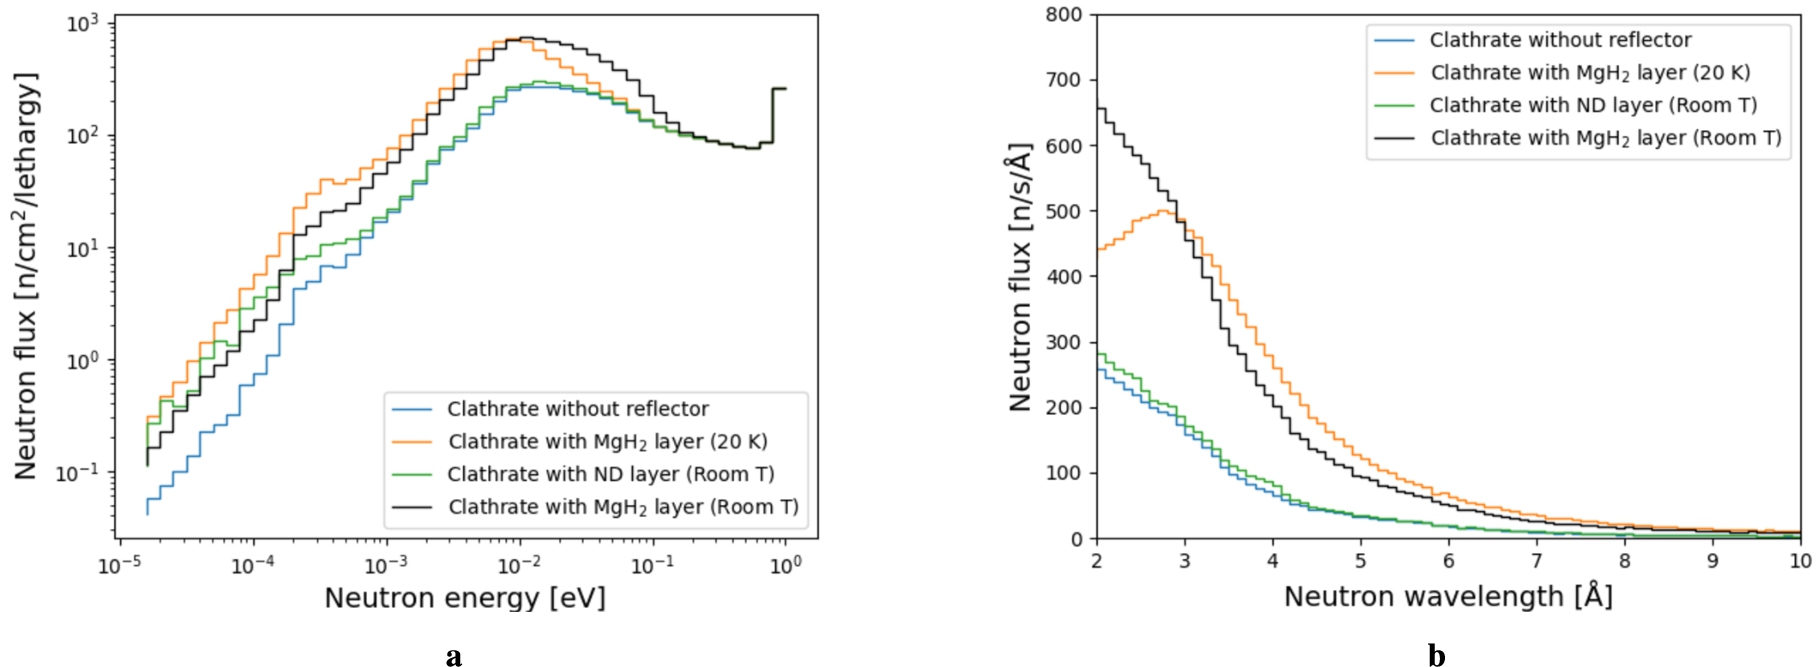
Fig. 120.
Neutron spectrum computed in a sphere filled by O2-clathrate, LD2, or SD2; with or without the MgH2 reflector at 20 K. (A) spectrum between 1 and 15 Å. (B) spectrum between 10 and 22 Å.
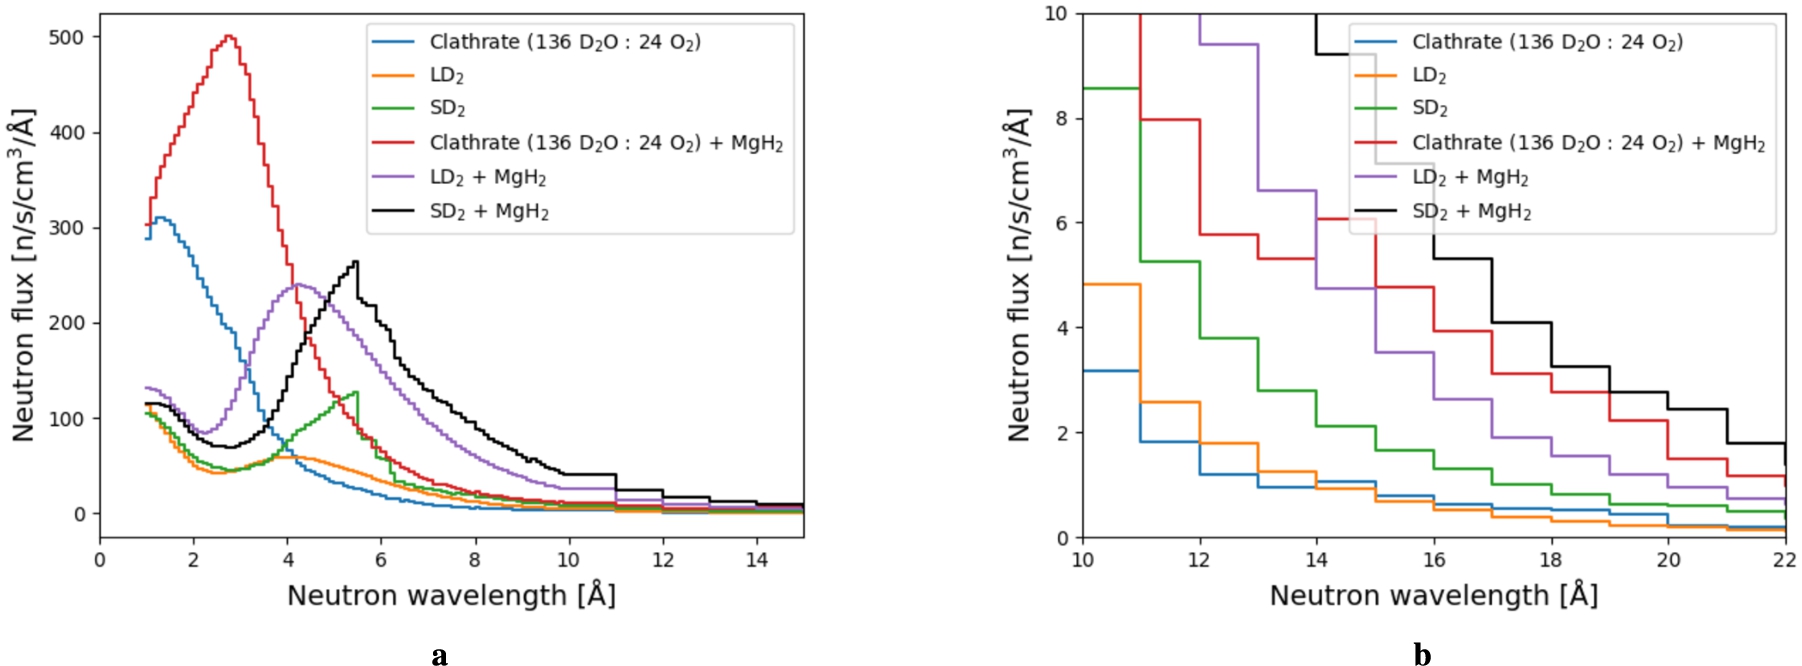
Fig. 121.
Drawing of the OpenMC toy model of a clathrate moderator, with size of moderator box of 40 × 40 × 40 cm3.
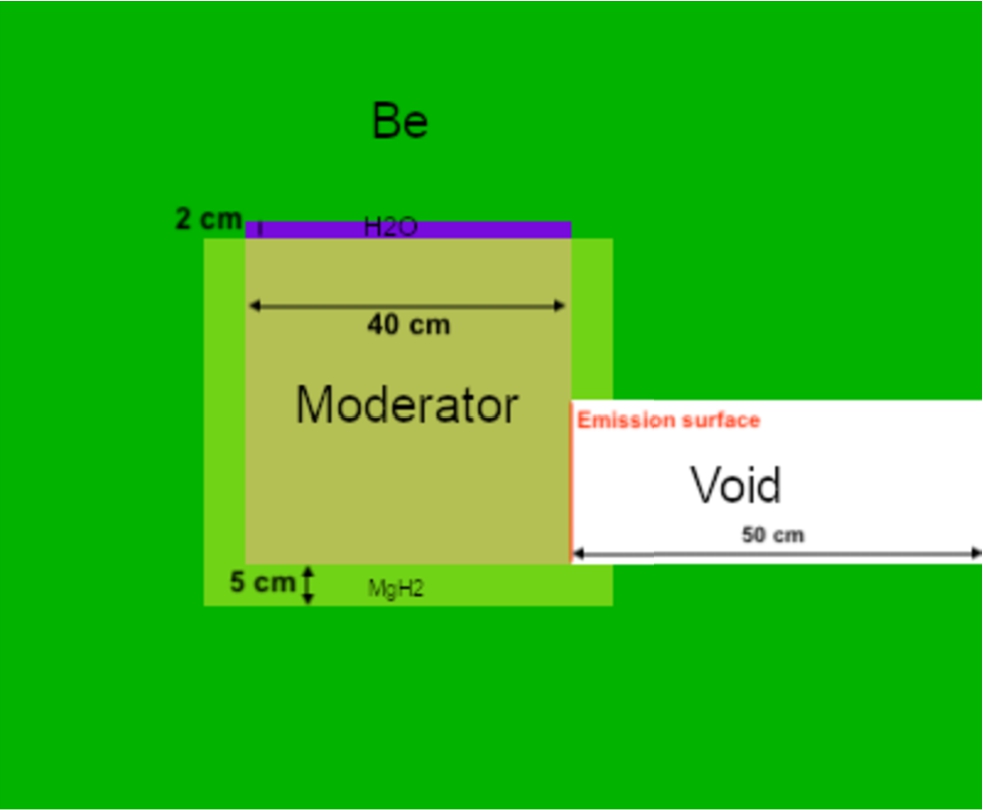
Fig. 122.
Neutron energy spectrum computed 50 cm away from the emission surface with size of moderator box of 40 × 40 × 40 cm3.
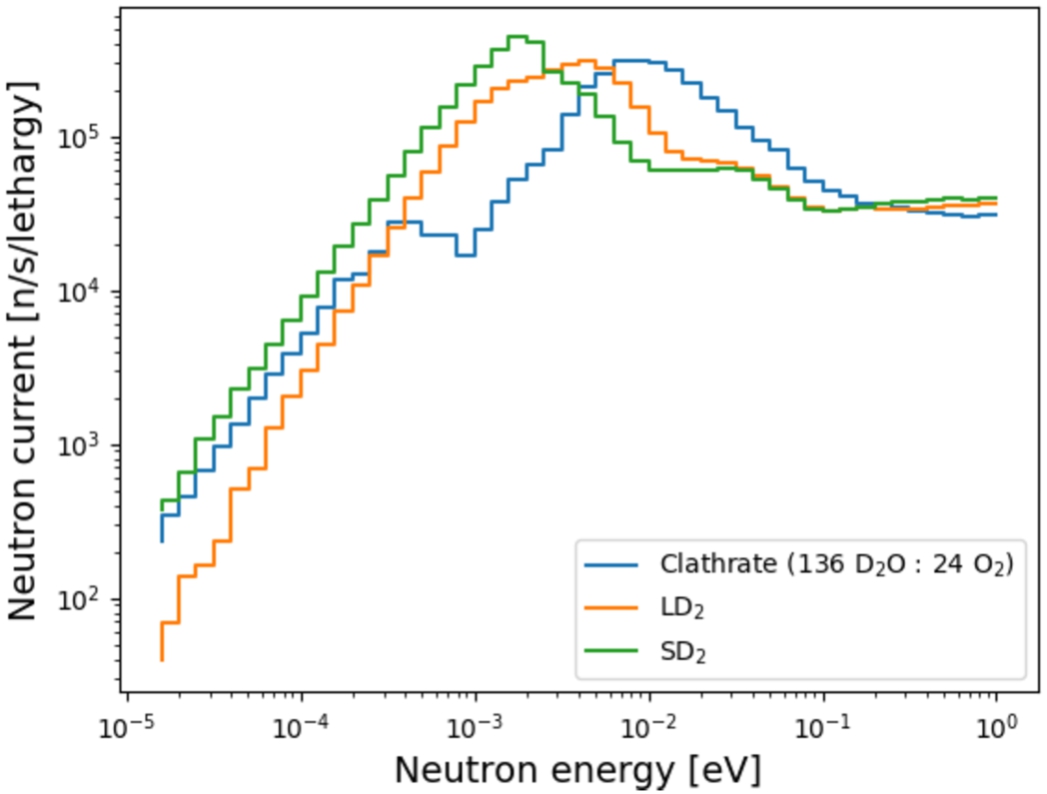
Fig. 123.
Neutron wavelength spectra computed 50 cm away from the emission surface for the model with moderator volume of 40 × 40 × 40 cm3. (A) spectra from 1 to 15 Å. (B) spectra from 10 to 20 Å.
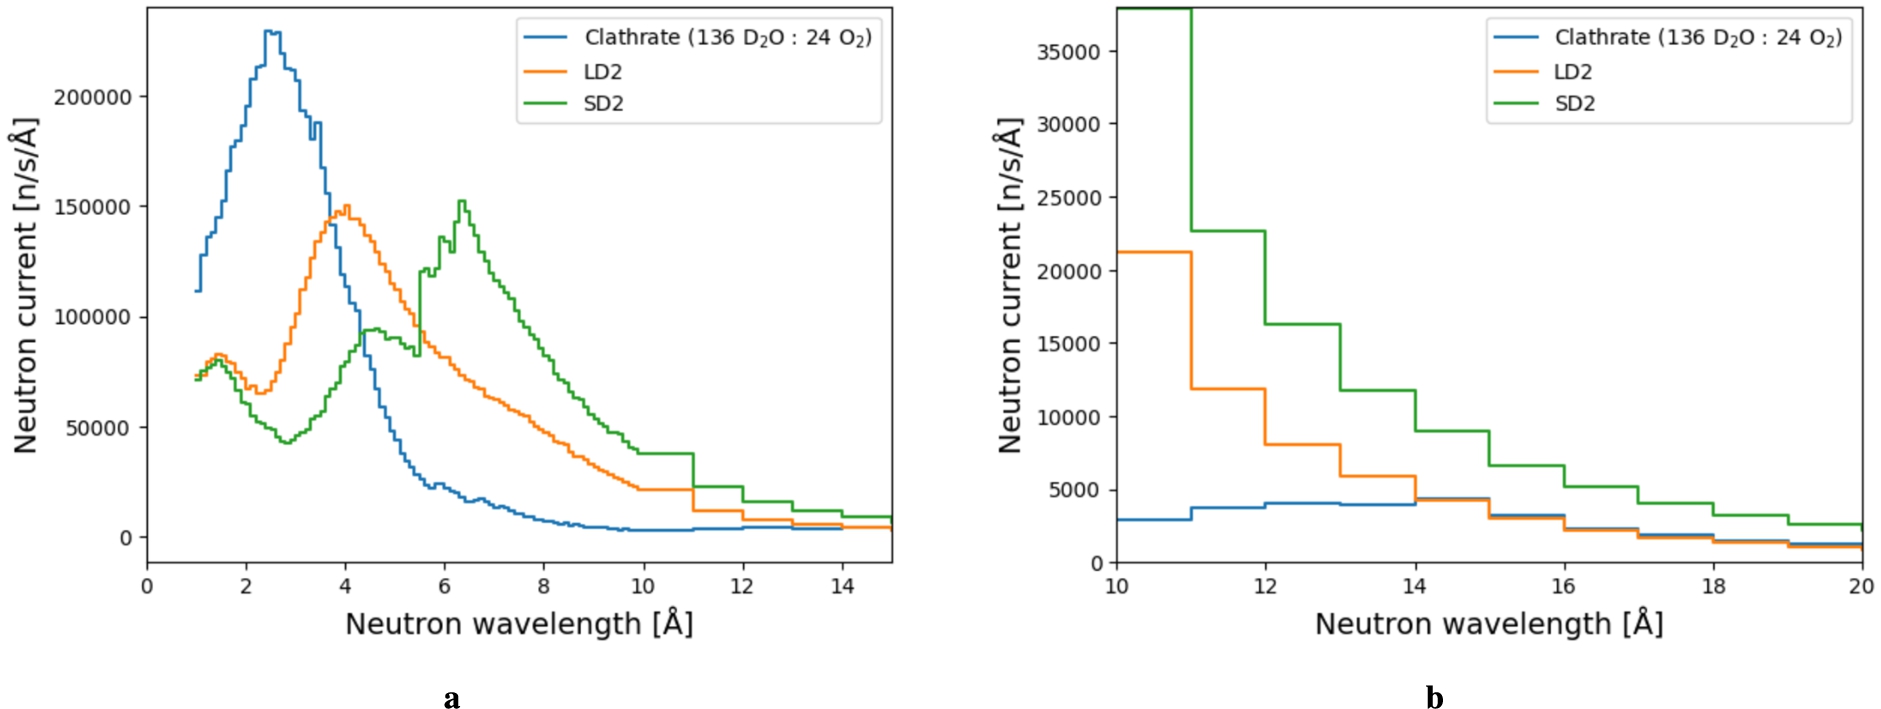
A toy model was designed after finishing the initial study to simulate more realistic conditions for a source made of clathrate hydrate inserted below the spallation target at the ESS. This model contains a cell with a beryllium thermal reflector, a 2-cm thick thermal premoderator filled with H2O, and a cubic-shaped moderator filled either with the clathrate hydrate, LD2, or SD2 surrounded by a 5-cm thick MgH2 cold reflector filled. The emission surface has an area of 20 × 20 cm2, designed together with a 50-cm vacuum pipe for neutron extraction. A surface source with area of 40 × 40 cm2 was located at the top of the H2O premoderator. The volume of the moderator cell was fixed at 40 × 40 × 40 cm3 (see Fig. 121).
The neutron energy spectrum was calculated (see Fig. 122) 50 cm away from the emission surface in the extraction pipe. The neutron wavelength spectra in Figs 123a and 123b show that the clathrate hydrate becomes a competitive moderator material with LD2 above about
6.Design of the ESS ultracold neutron source
6.1.UCN scientific case and general overview of the field
The extremely low energies of ultracold neutrons, in the order of several hundred neV and below, enable them to exhibit unique properties. Neutrons are massive, neutral, nuclear particles and are affected by the gravitational, magnetic, week and strong interaction. Usually, the UCN’s energy is defined as being smaller than the effective strong interaction potential
It was F.L. Shapiro, who pointed out the possibility of precession measurements with UCN [183], followed by the first reported observations of UCNs [122,189]. This led to rapid developments in the field during the 1970s, resulting in substantial enhancements in precision in measuring the neutron lifetime [153]. They also played a crucial role in setting constraints on the electric dipole moment (EDM) of the neutron [76], and later in the discovery of gravitational eigenstates of UCN above a flat mirror [142].
Increasing the quantity of ultracold neutrons introduced into experiments remains a valuable approach for improving experimental precision. In cases where the free neutron lifetime is not the main limiting factor for losses, as observed in neutron EDM measurements, significant enhancements can also be achieved by extending the storage duration.1111 However, it is important to highlight that regardless of the scenario, existing experiments with ultracold neutrons are primarily restricted by counting statistics. For a comprehensive overview of the scientific capabilities of UCNs and the specific needs of respective experiments the reader can refer to [1].
Currently, there are only a handful of operational UCN sources worldwide, including those at ILL, PSI, TRIGA-Mainz, and LANL. PNPI in Russia has operated several UCN sources in the past, and a new one is currently under construction. Additionally, various UCN sources are either in the construction phase or have been proposed at prominent facilities like FRM-II in Germany, TRIUMF in Canada, LANL and SNS in the USA. For a comprehensive overview of the global UCN landscape, refer to [180].
The first UCN source developed for user applications is PF2 at the ILL. It is based on the vertical extraction of VCNs from the tail of the Maxwellian distribution of a cold source, followed by final slowdown to UCNs using the Steyerl-turbine [190]. All the other sources, operating, under design or under construction, are based on neutron conversion, using either SD2 at about 5 K, or superfluid 4He (He-II) at about 1 K or less. While other materials have been considered and are still studied (see [235] and references therein), these two materials have been identified as particularly suitable for UCN production. The transition from a cold neutron to an ultracold neutron occurs in both of these materials through a single scattering event. Consequently, the UCN do not reach thermal equilibrium with the medium, leading to the classification of such sources as “superthermal”. It is imperative to maintain the medium at extremely low temperatures to minimize the loss of UCN due to up-scattering.
One of the primary objectives of HighNESS is to design a UCN source at ESS. Extensive studies have been conducted, drawing from the two materials mentioned above. This exploration includes various concepts for UCN sources, ranging from those positioned in close proximity to the neutron-production target (referred to as “in-pile” options) to sources located further away and supplied with a cold neutron beam (referred to as “in-beam” options). You can find a comprehensive list of concepts and potential locations for possible UCN sources at ESS in [221]. The findings presented herein are based on the assumption of ESS operating with a proton beam power of 5 MW, equivalent to a beam energy of 2 GeV and an average current of 2.5 mA. As discussed in Section 1.2.3, ESS will start its operation with the reduced power of 2 MW corresponding to an 800 MeV beam energy and maintaining an average current of 2.5 mA. Given the linear increase of the neutron spallation yield, the calculated UCN performance and heat loads can be directly scaled to the 2 MW operational scenario.
6.1.1.VCN to feed UCN production
The parallel development of a VCN source in HighNESS has a positive side effect of improving the flux in the wavelength ranges relevant to UCN production (which are discussed in detail in Section 6.4). Thus, the VCN design options proposed in Section 4 may be highly beneficial in terms of UCN production.
For example, as highlighted in [77], superfluid He-II can be utilized as a converter in the production of UCN through a superthermal cooling process of CN or VCN (see Section 6.4.2). This is made possible by the crossing dispersion relations between superfluid He-II and the free neutron, allowing neutrons with wavelengths of approximately 8.9 Å (equivalent to a kinetic energy of 1.0 meV) to be scattered down to the ultracold regime emitting a single phonon. An enhancement of the flux of neutrons with wavelengths around 8.9 Å would be a valuable asset for in-beam UCN-sources exploiting this mechanism. This includes variants with in-situ UCN production and detection approaches, as proposed in [53].
6.2.In-pile and in-beam UCN sources
We have divided the possible implementations of UCN sources at ESS into two groups: in-beam and in-pile UCN sources.
An in-pile source is placed near the primary source of neutrons, i.e., a reactor core, or the target in a spallation source. Thus, an in-pile source has the advantage of receiving a high neutron flux, with the possibility of delivering high UCN yields. This comes however with the challenges related to positioning such a source near the target, and in particular to keep the source at the desired low temperature (about 5 K for an SD2 source, and below 2 K for a He-II source). Conversely, an in-beam source is placed at some distance (typically several tens of meters) from the primary cold source. Such an in-beam source, fed by a cold neutron beam, will have lower UCN production rate than for an in-pile source, but there are several advantages, such as: easier engineering (for example, more freedom about the placement of the source, more available space); much easier cooling of the source to sub-K temperature; easier access for maintenance.
Fig. 124.
A horizontal cut through the target region, at the height of the LD2 moderator (shown in green) situated below the spallation target (not visible). The cylindrical region of radius 5.5 m around the center represents the shielding monolith (shown in red). The right figure is a zoom of the central part of the left figure. About half of its 42 standard beamports are visible in the cut plane. The possible locations of UCN sources, as studied within the HighNESS project are: (1) inside the “twister”; (2) inside the moderator cooling block; (3) in a standard beamport; (4) in the large beamport (shown as a white segment in the monolith); (5) outside the “bunker”, a heavy concrete shielding structure (shown in orange) placed around the monolith; the minimum distance of this location from the moderator is 15 m. See [221] for details and explanation of options for the various source positions. Reprinted from [221].
![A horizontal cut through the target region, at the height of the LD2 moderator (shown in green) situated below the spallation target (not visible). The cylindrical region of radius 5.5 m around the center represents the shielding monolith (shown in red). The right figure is a zoom of the central part of the left figure. About half of its 42 standard beamports are visible in the cut plane. The possible locations of UCN sources, as studied within the HighNESS project are: (1) inside the “twister”; (2) inside the moderator cooling block; (3) in a standard beamport; (4) in the large beamport (shown as a white segment in the monolith); (5) outside the “bunker”, a heavy concrete shielding structure (shown in orange) placed around the monolith; the minimum distance of this location from the moderator is 15 m. See [221] for details and explanation of options for the various source positions. Reprinted from [221].](https://content.iospress.com:443/media/jnr/2023/25-3-4/jnr-25-3-4-jnr230950/jnr-25-jnr230950-g125.jpg)
The list of the identified in-pile and in-beam options is given in [221] and shown in Fig. 124. We have adopted the convention to label a source located inside the ESS monolith, i.e., within 5.5 m from the center of the monolith (corresponding to the center of the main moderator) as in-pile. A source located at larger distance is considered in-beam (cf. Fig. 4 in [221]). In HighNESS, we have intestigated only one in-beam concept, which has been published in [235]. This in-beam concept exploits the larger field of view offered by the large beamport, and adopts novel nested mirror optics [231]. Alternatively, a regular beamline, i.e. from one of the available beamports of ESS, could be used for an in-beam source similar to the ILL SuperSUN [37]. Performance estimates are given in [52].
An alternative approach for UCN studies is to perform the intended experiment in-situ [52]. Such experiments have previously been realized and are proposed for ESS and other facilities. In this approach, the measurements are performed inside the source, which is based on He-II. The proposed experiments are EDM searches, thus requiring polarized neutrons. The detector is also placed inside the source and can be based on 3He. The major advantage of in-situ measurements is the fact that transport losses are avoided altogether. There are some challenges, in particular related to the guiding of cold neutrons in the source, in-situ detection of UCN, and balancing UCN accumulation time with measurement time. In-situ measurement might be possible for the in-beam option [235] that we propose which uses a He-II source placed at a distance from the ESS cold source, and nested mirror optics to transport the neutrons from the LBP to the UCN source. Additionally, an in-situ configuration could also be possible for a He-II source placed directly in the LBP at about 2 m from the cold source.
Concerning the possible converter materials for in-beam and in-pile UCN sources, we have adopted the following: in the case of in-pile sources, both SD2 and He-II are possible candidates; therefore both materials have been studied. For an in-beam source, we considered only the option of He-II. The reason for this choice is that we expect higher total UCN production in a large He-II converter placed in a cold neutron beam than in a SD2 converter. The latter, even when placed in beam, would have to be of relatively small volume, to overcome the issue of poor UCN extraction from the bulk of the SD2 converter. Because of that, SD2 is considered a valid candidate for a UCN source only in the in-pile option. In fact, all the UCN sources in operation (LANL, PSI) or under construction (FRM-II), based on SD2, are in-pile designs.
In summary, the list of possible UCN sources which have been analyzed within the HighNESS project is the following:
- He-II in twister;
- SD2 in twister;
- He-II in MCB;
- SD2 in MCB;
- He-II in LBP;
- He-II in beam.
Regarding the last case, He-II in-beam, we have only studied the source’s performance using the LBP where thanks to the large available solid angle, special optics can be employed. Performance of a generic in-beam He-II source at the ESS using a regular beamport, can be estimated rescaling the results obtained from this case.
6.3.UCN production
There are several quantities that can be used to characterize the performance of a UCN source:
- UCN production rate density
- UCN production rate
- UCN density in the source
In this expression,
- Total UCN number (or saturated UCN number) in the source
- UCN density in the storage vessel
- Total (saturated) number of UCNs in the storage vessel
Given the multitude of quantities involved, it becomes evident that there is no single, unambiguous figure of merit for optimizing a UCN source. In our studies, our primary focus was on achieving high
For the same reason, the performance of SD2-based and He-II based sources are not directly comparable: the UCN lifetimes in the two materials are very different, of the order of 40 μs for SD2, and of the order of hundreds of seconds for He-II below 1 K. The scopes of these two source types are thus different as well. SD2 close to a primary cold source can produce a large UCN flux which is suitable for experiments in flow-through mode or if large vessels need to be filled, whereas He-II enables UCN accumulation to high saturated UCN densities, which can be advantageous for small storage vessel with a long storage time constant. Finally a prerequisite for in-pile source variants, where the UCN converter medium is installed close to a primary cold source, is the capability to transport UCNs with low losses over large distances of several tens of meters.
6.4.Methods for calculating the UCN production rate density P UCN
6.4.1.Calculating P UCN
Fig. 125.
The comparison of UCN production cross sections in SD2. Adapted from Liu et al. [121]. The red squares depict the cross section measured at PSI [11], whereas the blue circles depict the cross section calculated at TUM in Munich [66]. The calculation of cross section at TUM was based on experimental data from neutron time-of-flight experiment at IN4 (ILL).
![The comparison of UCN production cross sections in SD2. Adapted from Liu et al. [121]. The red squares depict the cross section measured at PSI [11], whereas the blue circles depict the cross section calculated at TUM in Munich [66]. The calculation of cross section at TUM was based on experimental data from neutron time-of-flight experiment at IN4 (ILL).](https://content.iospress.com:443/media/jnr/2023/25-3-4/jnr-25-3-4-jnr230950/jnr-25-jnr230950-g126.jpg)
Fig. 126.
The scattering function,
![The scattering function, s(λ), for UCN production in He-II. The curve from Schmidt-Wellenburg et al. [177] has been determined experimentally. The ESS model 1 curve was used for this work and is based on an early version of the scattering library [85], while ESS model 2 is an improved version, which can be used for future work [84]. The single-phonon peak for ESS model 2 has been multiplied by a factor of 0.065 for visualization purposes.](https://content.iospress.com:443/media/jnr/2023/25-3-4/jnr-25-3-4-jnr230950/jnr-25-jnr230950-g127.jpg)
6.4.2.Calculating P UCN
The scattering function for He-II,
The scattering function can then be derived from this model and has also been determined experimentally [177]. Both functions are shown in Fig. 126. ESS Model 1 refers to the version used for this work, while ESS Model 2 is based on a revised methodology [84], which can be used in future work. It can be seen in the figure that the main contribution to the UCN production is given by a narrow wavelength band around 8.9 Å, but also higher energetic neutrons between 2 Å and 6 Å contribute to UCN production (via multi-phonon processes).
Following [177],
6.4.3.UCN production rates as a function of the distance from the LD2 moderator
The calculated production rate density in He-II and SD2, as a function of the distance from the cold moderator, ranging from the moderator surface to 150 cm away, is shown in Fig. 127. These estimates are obtained following the procedure explained in the sections above. Neutron fluxes are calculated at a given distance from the moderator surface; the SD2 or He-II converters are not modelled. These curves are therefore representative of the production in He-II or thin films of SD2, i.e., for configurations where the perturbation of the incoming cold flux, from the converter itself, is negligible.
![Calculated production rate densities for He-II [177] and SD2 [121] as a function of the distance from the LD2 moderator. The distances are from the center of the UCN source to the edge of the beryllium filter on the NNBAR side of the lower moderator. The UCN converters are not modelled.](https://content.iospress.com:443/media/jnr/2023/25-3-4/jnr-25-3-4-jnr230950/jnr-25-jnr230950-g128.jpg)
6.5.SD2 source in twister
The first option that we consider is to place the UCN source as close as possible to the cold source inside the lower moderator plug in the ESS twister (see Section 2.1). This option corresponds to option 1 in Fig. 124. The rationale behind this concept is to maximize the cold flux delivered to the UCN converter and therefore the UCN production, in agreement with the results shown in Fig. 127. This solution requires either to design a dedicated second-generation cold moderator or to find a design that complements the first-generation cold source, without impacting the needs of the NNBAR experiment and of the neutron scattering instruments. As indicated in [221], a possible design which, thanks to the reduced amount of SD2 inside the twister, might be possible to cool and operate, consists of a thin slab of SD2 placed close to the main cold source. We explore several ideas using a thin SD2 converter in the twister in Sections 6.5.1, 6.5.3 and 6.5.4. A larger volume of SD2, if coolable at the high power levels of ESS, could be a very promising source of VCNs, as well as UCNs. This is discussed in Section 6.5.5.
6.5.1.Thin-slab external converter
The most straightforward implementation of a UCN source in the twister consists of adding a UCN converter to the current optimized design of the cold source. We added a 2-cm-thick slab of SD2 at 5 K covering the NNBAR opening completely. The SD2 volume is embedded in an Al case 2 mm thick, but there is no Al on the extraction side. In a real case, there would be a very thin window. A view of the MCNP model is shown in Fig. 128.
The choice of the SD2 thickness comes from evidence reported in literature [29,56] on the effective production depth of extracted UCN. In particular, it was estimated that roughly 50% of the UCN produced in the last 2 cm of a 16-cm thick converter are extracted. This percentage drops to 30% between 2 and 4 cm in depth, while making it increasingly more inefficient to keep the SD2 at 5 K. In our concept, the volume of the converter is 1.8 liters. The UCN production rate density from the thin slab, calculated with the method highlighted in Section 6.4.1, was estimated to be 3.07 × 10⁵ n/s/cm3. The corresponding
Fig. 128.
MCNP model of a 2-cm-thick SD2 UCN source complementing the LD2 baseline for UCN production. (A) vertical cut, perpendicular to the proton beam direction. (B) cut parallel to the target plane with the proton beam impinging from the left.
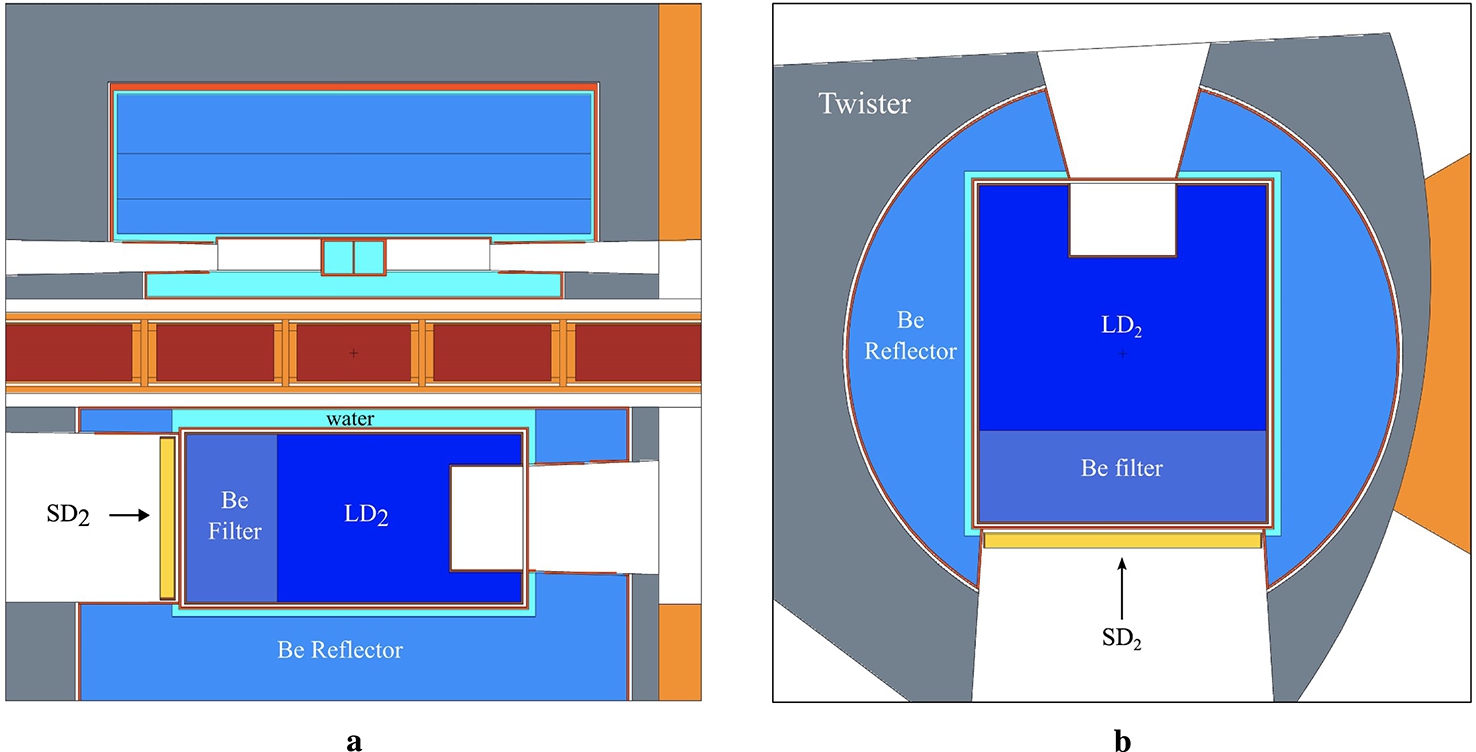
A first improvement to the design may come from the removal of the cold Be filter. As a matter of fact, the gains for
It is also of interest to study the performance of the thin-slab converter in the ideal case where the lower moderator would be optimized for UCN production, as opposed to the previous case, where a thin SD2 layer was added to an existing design. Such a source would still emit CNs and VCNs, but would be optimized for UCNs. This case represents the non plus ultra for an in-pile UCN source based on SD2 (at least when a thin-slab is used), and therefore is a term of comparison for the other cases. We assume the cold moderator to be completely filled with ortho-LD2 at 22 K (with 2.5 wt% Al) and with only one fixed-dimensions opening 24 cm × 40 cm. The vertical dimension was also kept fixed to 24 cm, while the other two (parallel and transverse to the proton beam axis) were varied. The center of the moderator-converter system along the transverse-to-proton-beam axis was also a variable in the Dakota optimization (more information on Dakota and the optimization algorithm in [2]). The optimization algorithm found the best
Fig. 129.
Fixed 2-cm SD2 UCN source with optimized cold LD2 moderator. (A) vertical cut, perpendicular to the proton beam direction. (B) cut parallel to the target plane with the proton beam impinging from the left. The figure of merit for the optimization was the mean UCN production rate density inside the SD2 converter.
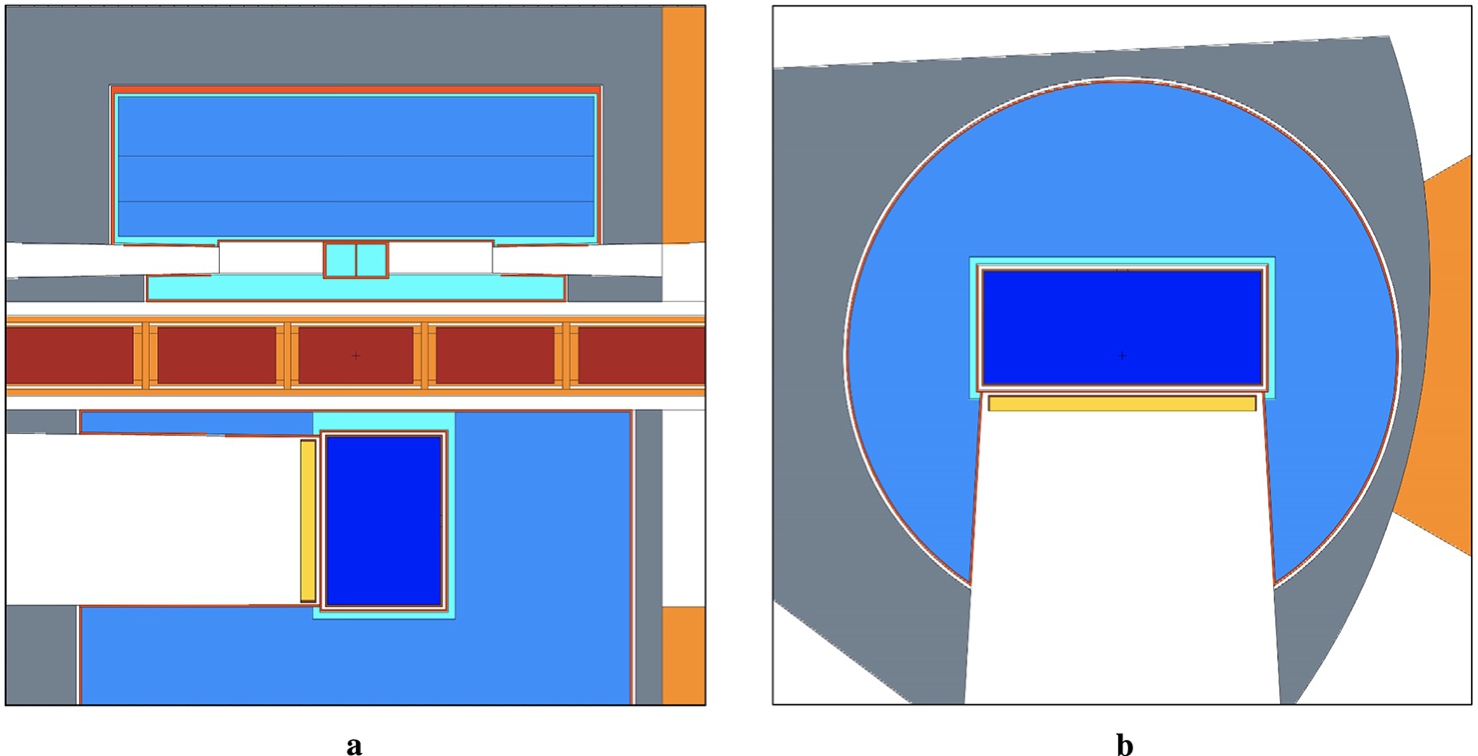
6.5.2.Delayed heat deposition from activation
A correct estimation of the heat deposition on the UCN converter is essential for the in-pile solution, where the high radiation flux could make it challenging to keep the converter at 5 K. Additional heat-load, which is not taken into account by the F6 tally in MCNP (which only calculated prompt energy deposition), comes from the decay of activation products. Considering the use of Al in the moderator vessels, we expect the most important contributor to be 28Al:
Table 27
Delayed heat deposition from 28Al decay. The columns correspond to the source cells. For each cell, the scored heat-load in both the SD2 and the Al vessel is reported. Two different tables are presented for electrons and photons
| To\from | Flow channels | LD2 vessel | REH vessel | Vacuum jacket | SD2 vessel | Total |
| Delayed electron heat-load [W] | ||||||
| SD2 | 1.63 | 1.14 | 10.9 | 12.1 | ||
| SD2 vessel | 7.33 | 22.7 | 47.6 | 70.5 | ||
| Total | 8.96 | 23.8 | 58.5 | 82.6 | ||
| Delayed γ heat-load [W] | ||||||
| SD2 | 3.38 | 3.89 | 1.14 | 9.01 | ||
| SD2 vessel | 1.00 | 6.62 | 8.17 | 3.36 | 19.3 | |
| Total | 1.54 | 9.99 | 12.0 | 4.50 | 28.3 | |
6.5.3.Reentrant hole design
Fig. 130.
Fixed 2-cm SD2 UCN source in a reentrant hole inside the LD2 moderator, hence closer to the hot-spot of cold neutrons production. (A) vertical cut, perpendicular to the proton beam direction. (B) cut parallel to the target plane with the proton beam impinging from the left. The figure of merit for the optimization was the UCN production rate density inside the SD2 converter.
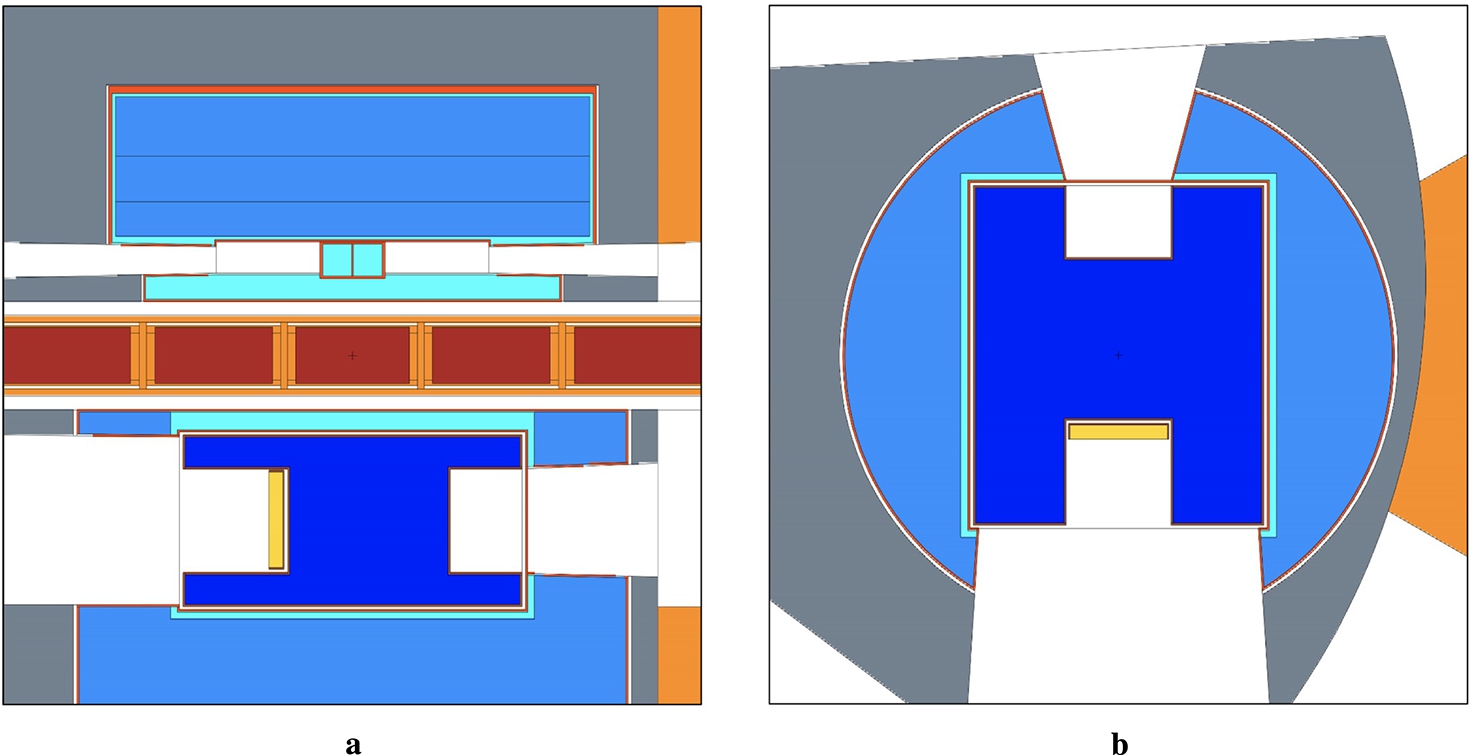
In light of the results of the ideal case, we explored also a design that would possibly reconcile the needs of both a neutron scattering instruments opening delivering CN on one side and a UCN source on the other; such design could be adopted after the NNBAR experiment is completed. The two openings compete for the high CN intensity produced at the center of the large LD2 moderator. For the first tentative design, we added a 2-cm-thick SD2 converter at the bottom of a 15 cm × 15 cm × 15 cm reentrant hole on the NNBAR side. Hence, this converter has a smaller volume of 384 cm3. It is important for the UCN extraction that no Al layer is interposed between the converter and the channel. Hence the Al window (3 mm) separating in the previous models the vacuum jacket and extraction channel (also vacuum) is removed. The geometry is shown in Fig. 130. The estimated
6.5.4.Cylindrical 3-opening design
Fig. 131.
Cylindrical cold moderator (45 cm diameter) with three openings for NNBAR, UCN and neutron scattering experiments. The SD2 converter has a fixed thickness of 2 cm. The cut is parallel to the target plane with the proton beam impinging from the left.
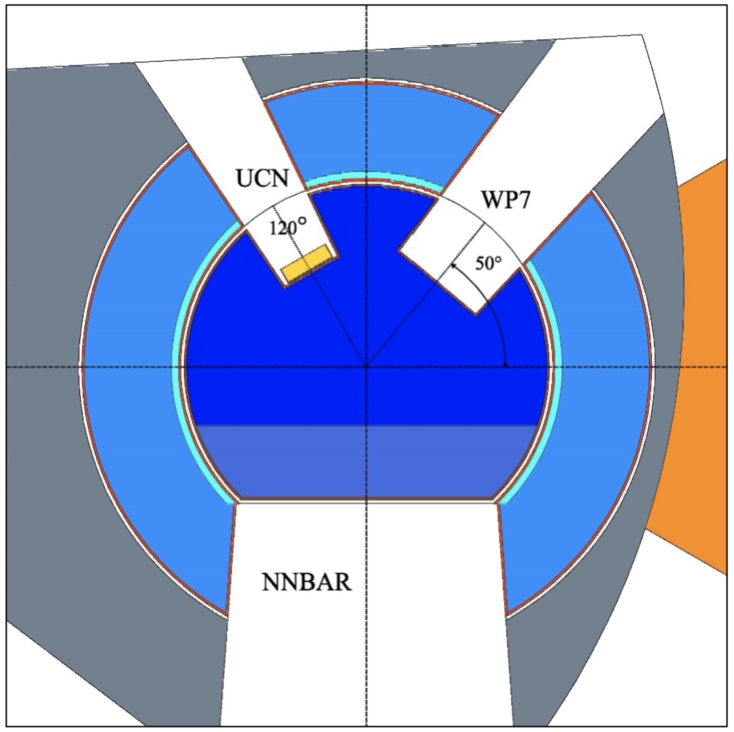
We studied the possibility to have a UCN in-pile source together with an opening for NNBAR and one for standard scattering experiment. We deemed not possible to accommodate a third opening in the box geometry presented so far, so we switched the shape of the cold moderator to a cylinder with a 45 cm diameter and 24 cm height. The model is shown in Fig. 131. The NNBAR opening is of the same size and in the same position as before, since it is constrained by the position of the large beamport at 2 m. As in the developing of the lower moderator it was found that the cylindrical emission surface in the NNBAR opening was detrimental to the performance, the cylinder was cut to obtain a flat rectangular emission surface. A 10 cm thick cold Be filter was also included. The WP7 opening is a 15 cm × 15 cm square surface 10 cm deep in the moderator, placed at 50° with respect to the proton beam direction (as a comparison, the NNBAR opening is placed at 270° in this coordinate system). Finally, the UCN converter is placed in a 10 cm × 10 cm opening at 120°, also 10 cm deep in the moderator. It has again a fixed thickness of 2 cm for a total SD2 volume of 128 cm3. At this exploratory stage, these dimensions are tentative, but it should be noted that we can apply the same principle of competition for the hot-spot described for the opposing openings. Hence, we opted for a symmetric configuration. The estimated
It is clear that this is a limited study and a wider optimization effort, which takes into account all the parameters including the NNBAR and WP7 FOMs, could find one or more better compromises to accommodate the three applications.
6.5.5.SD2 as primary moderator
The last in-twister design is based on the observation that the high-intensity SD2-based VCN source not only gave the highest VCN yield, but also produced UCN, even though only the ones produced in the last few cm of the crystal can be extracted. The geometry is shown in Fig. 132.
Fig. 132.
MCNP model of a 41 cm × 48 cm × 24 cm SD2 moderator for VCN and UCN production. (A) vertical cut, perpendicular to the proton beam direction. The inset zooms on the 5-mm ND reflector layer and its aluminum case. (B) cut parallel to the target plane with the proton beam impinging from the left.
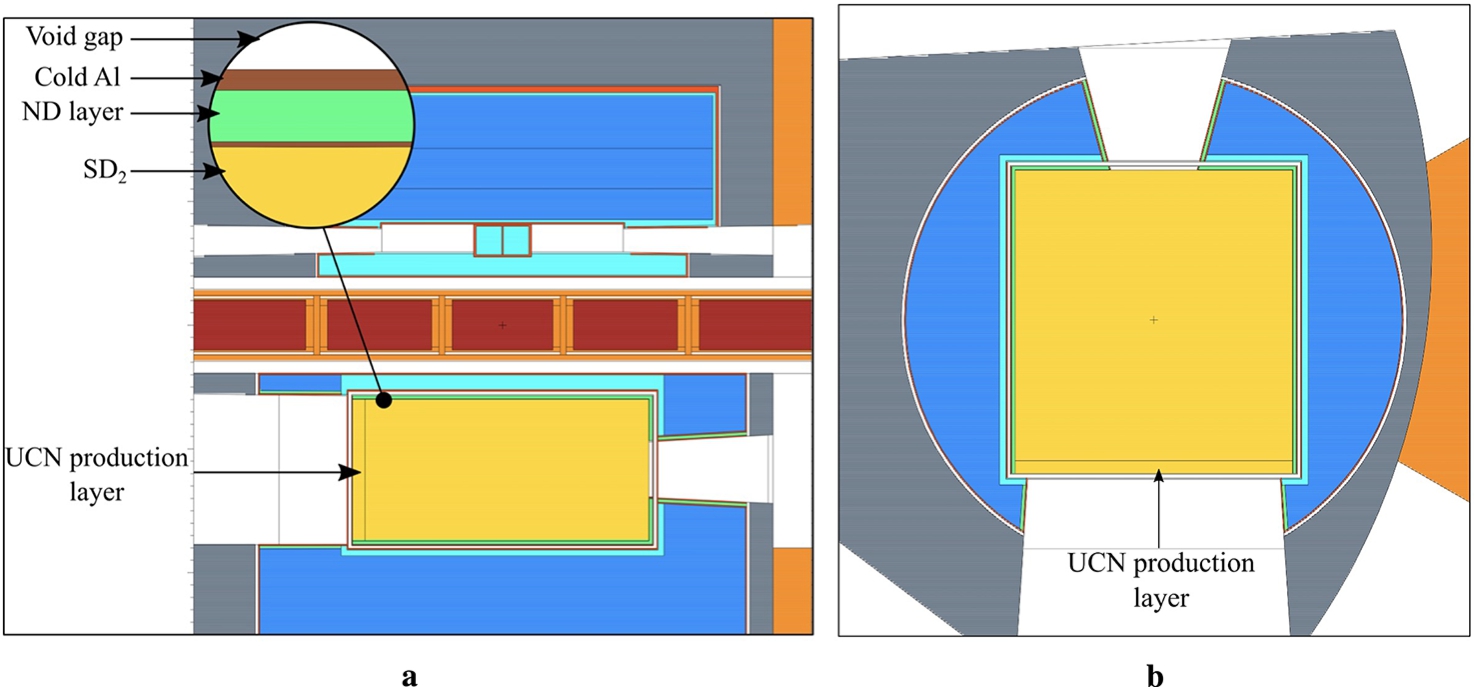
An extensive description of the model, the method and the results of the VCN performance of this multi-purpose source, which would be the first of its kind, is provided in Section 4.7. Here, we only report the relevant values concerning the UCN production. The total volume of SD2 is 48.2 L, but only the last 2 L (corresponding to the last 2 cm on the NNBAR side) are considered for the UCN production. The
Estimated values for each design in this section are listed in Table 28 for comparison.
Table 28
Summary table of the calculations for the in-twister options. The optimization was driven by maximising
| SD2 volume [L] | Heat-load [W] | WP7 FOM [n/s/sr] | NNBAR FOM [nÅ2/s/sr] | |||
| Baseline + UCN | 1.81 | 760 | - | |||
| No Be filter + UCN | 1.81 | 1000 | - | |||
| Optimized UCN-only | 1.75 | 2910 | - | - | ||
| Reentrant hole | 0.38 | 560 | - | |||
| 3-openings cylinder | 0.13 | 520 | ||||
| Full SD2 moderator | 48.2 | 39886 | - | - |
Fig. 133.
In-pile UCN source with He-II (light green) nearly fully diplacing the LD2 (dark blue) moderator volume.
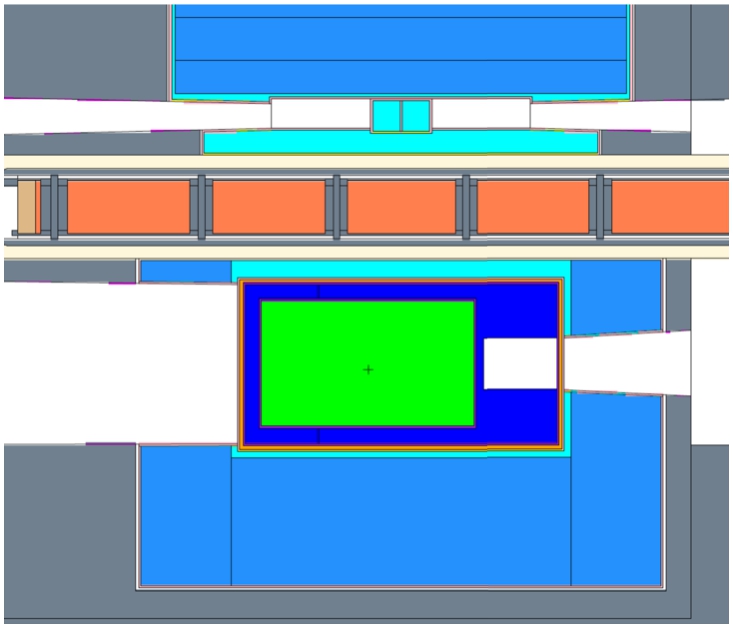
6.6.In-twister He-II UCN source
Similar to the models discussed in Section 6.5, placing a UCN source within the twister has been investigated for cases having He-II as the UCN production material. This solution imposes the most difficulty in terms of heating, while also presenting considerable engineering constraints.
Table 29
Calculations for liquid helium UCN sources placed in-pile. The reported heat-load is only the prompt radiation heat-load
| He-II/SD2 volume [L] | Heat-load [W] | |||
| Full He-II moderator + MgH2 (Fig. 133) | 21.9 | 9933 | ||
| Full He-II moderator + No MgH2 | 21.9 | 9915 | ||
| Small He-II w/extraction (Fig. 134) | 1.25 | 113 | ||
| Small He-II + SD2 slab w/extraction (Fig. 135) | ||||
| SD2 slab only | 0.06 | 10 | ||
| He-II extraction line only | 1.19 | 99 | ||
| Total | 1.25 | – | 109 |
A preliminary model is shown in Fig. 133, where the majority of the LD2 volume is displaced by He-II at a temperature of 1.2 K. Although engineering such an insert to the baseline LD2 model could be relatively straightforward, the heatload reported in this model in Table 29 is nearly 10 kW. While a kW-scale heatload may be feasible for SD2 when considering its optimal temperature range of roughly 4–10 K, He-II is ideally kept below 1 K [74,75] and heatloads exceeding 100 W are likely unfeasible. Despite this model being impractical, it should be observed that the total neutron production rate exceeds that of
A more realistic model is shown in Fig. 134, where the moderator is extended downward with a small 64 cm3 primary UCN production volume of He-II and an extraction line extending to a beamport adjacent the NNBAR opening. In this case, the single-crystalline bismuth shielding reduces photon heating while being relatively transparent to neutrons in the critical UCN production range for He-II near 9 Å (see Fig. 126) [4]. Polycrystalline bismuth was also tested and is an effective gamma-shield, but shows a penalty in UCN production of roughly 4%. The best available thermal scattering kernel for single-crystalline bismuth was at a temperature of 77 K. For further studies a library at a temperature of 22 K would be necessary to match that of the LD2 moderator; it is expected that this would increase the He-II UCN production by further reducing the bismuth cross-section near 9 Å. (See also: Section 6.9.1.)
From Table 29, one can see that the heatload drops by roughly two orders of magnitude, while the UCN production rate per cm3 is only reduced by approximately 75%. This reduction can be attributed to the increased distance from the He-II volume to the target, with a small penalty due to the bismuth gamma shield.
Fig. 134.
In-pile liquid helium UCN source (light green) with extraction channel; vertically extended LD2 moderator (dark blue); and single-crystalline bismuth gamma shield (red). (A) cross-section of the extraction channel. (B) top-down view of the moderator and extraction channel within the twister.
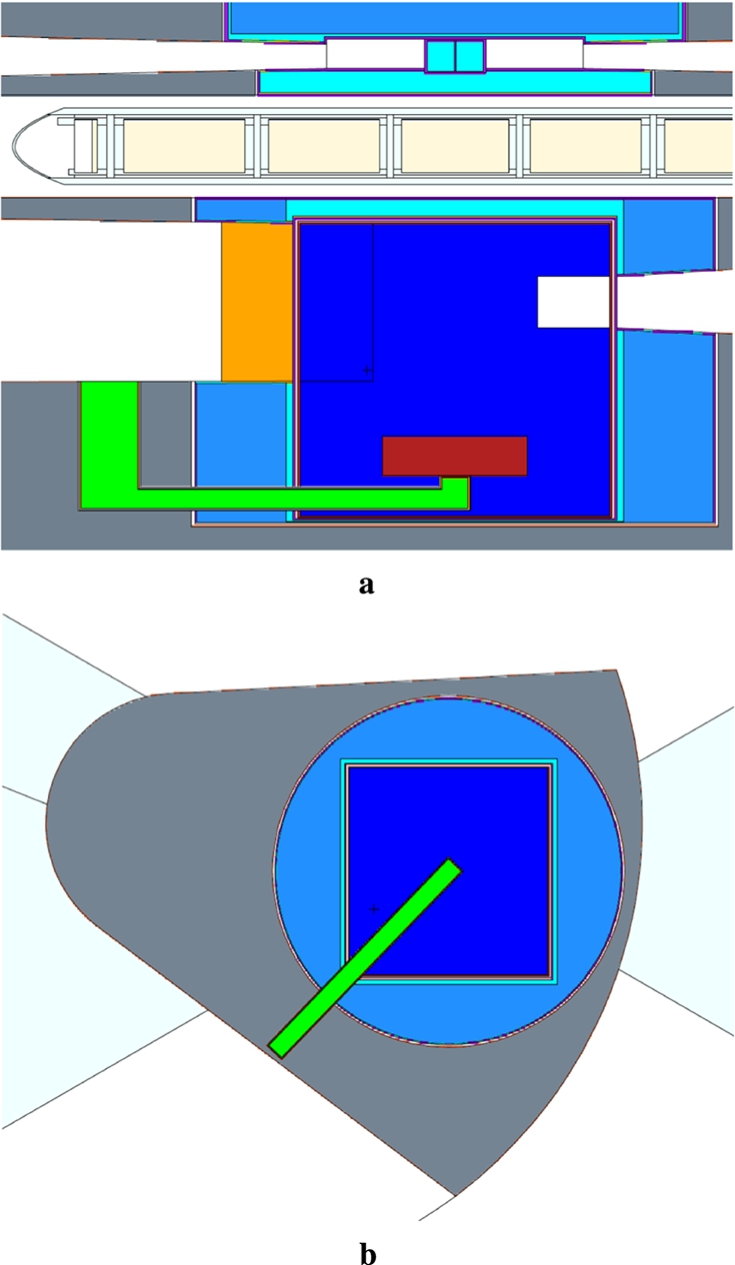
Fig. 135.
In-pile liquid helium UCN source and extraction channel (light green) with added thin-slab SD2 UCN source (yellow); a vertically extended LD2 moderator (dark blue); and single-crystalline bismuth gamma shield (red). (A) cross-section of the hybrid source and extraction channel. (B) top-down view of the primary UCN production volume.
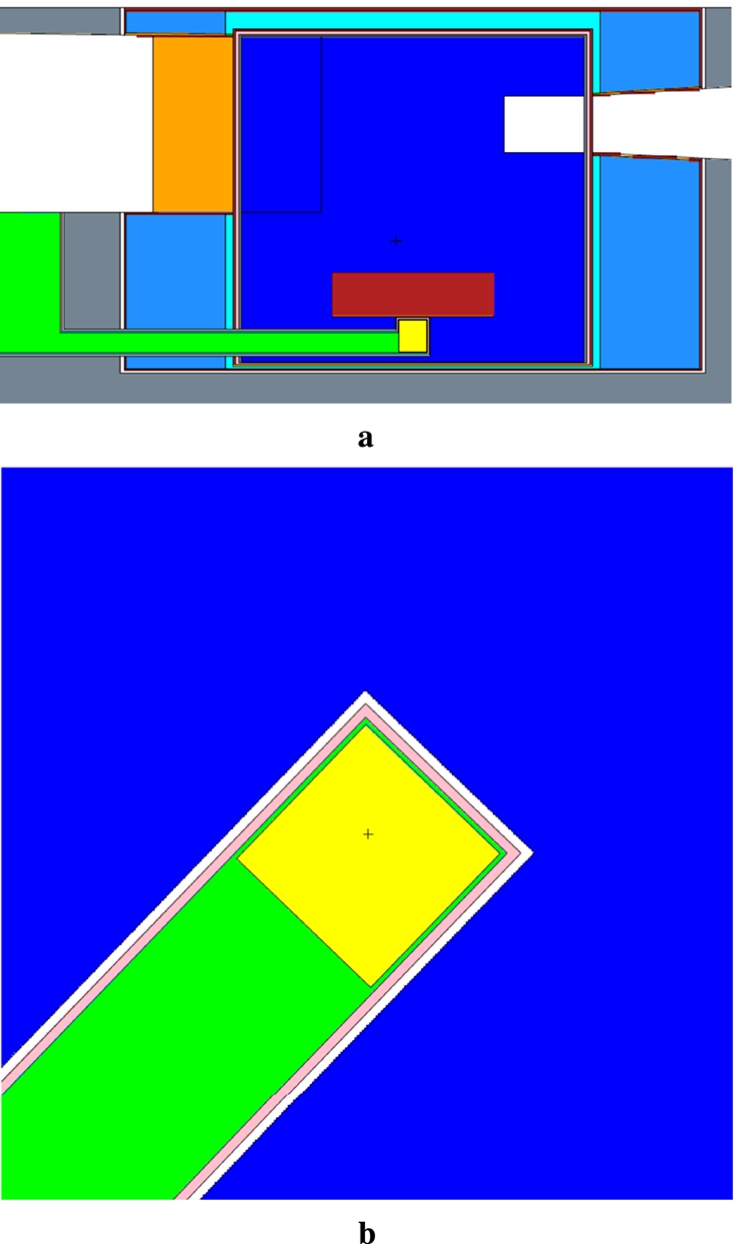
A hybrid model is then shown in Fig. 135, where a thin slab of SD2 is added in the critical UCN production volume centered directly below the impact point of protons on target (the proton beam direction is pointing out of the page). For this case, the He-II and SD2 volumes contribute roughly equal amounts to the total UCN yield in neutrons per second, with the SD2 being better suited for absorbing the higher heatload and producing orders of magnitude more neutrons per cm3, and the longer lifetime of UCNs in He-II allowing for a larger volume.
6.7.SD2 in MCB
The possibility of placing the UCN SD2 converter in the moderator cooling block was studied. The MCB is a piece made of steel located in the target vessel with the sole purpose of shielding (see Section 3.2 in [221]). A part of the MCB that surrounds the twister and the LD2 moderator (see Fig. 136a) can be potentially modified to fit the UCN converter inside [221]. In this section, we describe the analysis of a SD2 converter, while a He-II converter in the MCB is described in Section 6.8. The basic concept is to place the SD2 UCN converter into MCB near the cold source (see position 2 of Fig. 4 in [221]), which would make use of cold neutrons streaming from the LD2 moderator to produce UCNs. However, as it is clear from Fig. 136b, in the current baseline model few cold neutrons can reach the MCB location, leading to small
Fig. 136.
(A) the baseline geometry for LD2 cold neutron moderator and MCB. (B) map of
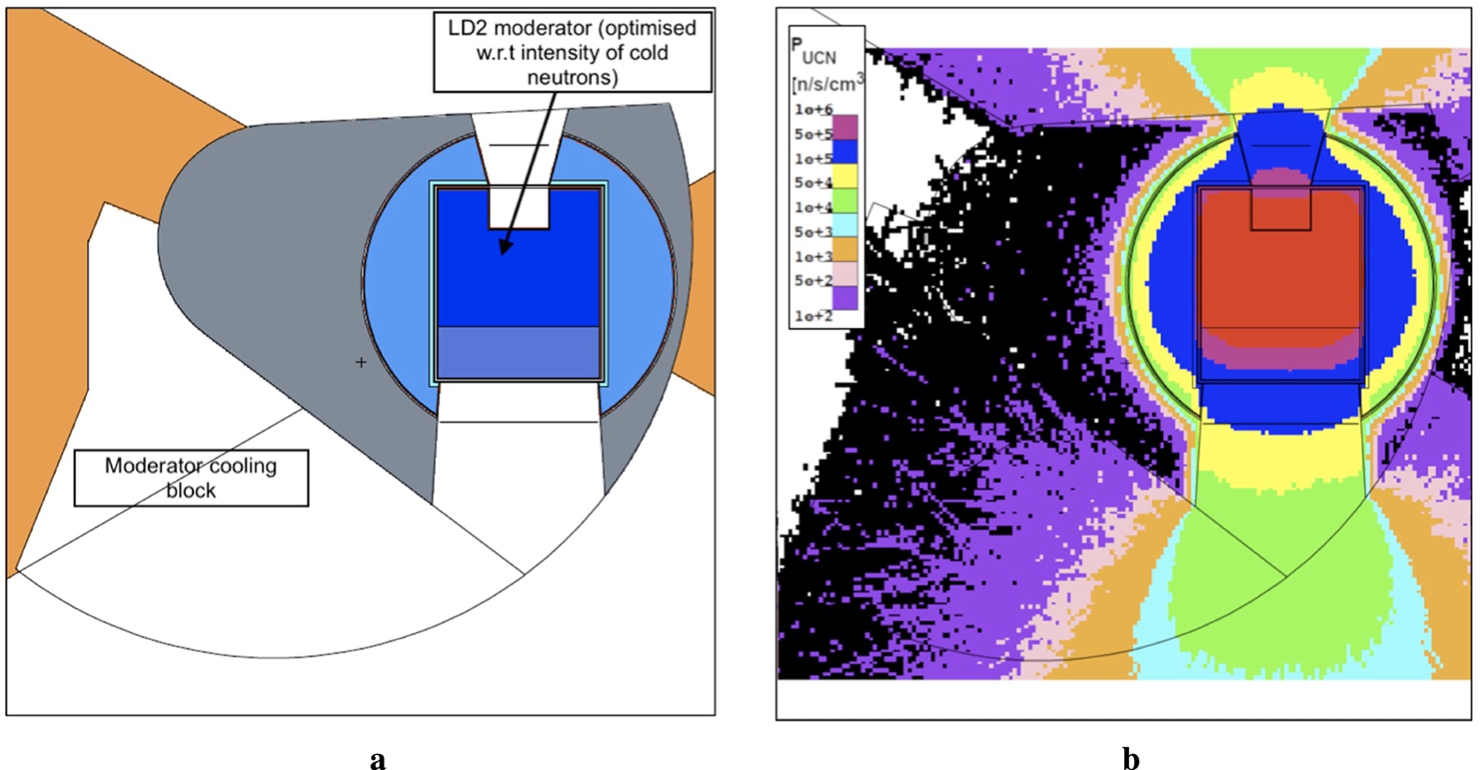
Fig. 137.
Parameterised model of the channel and UCN converter.
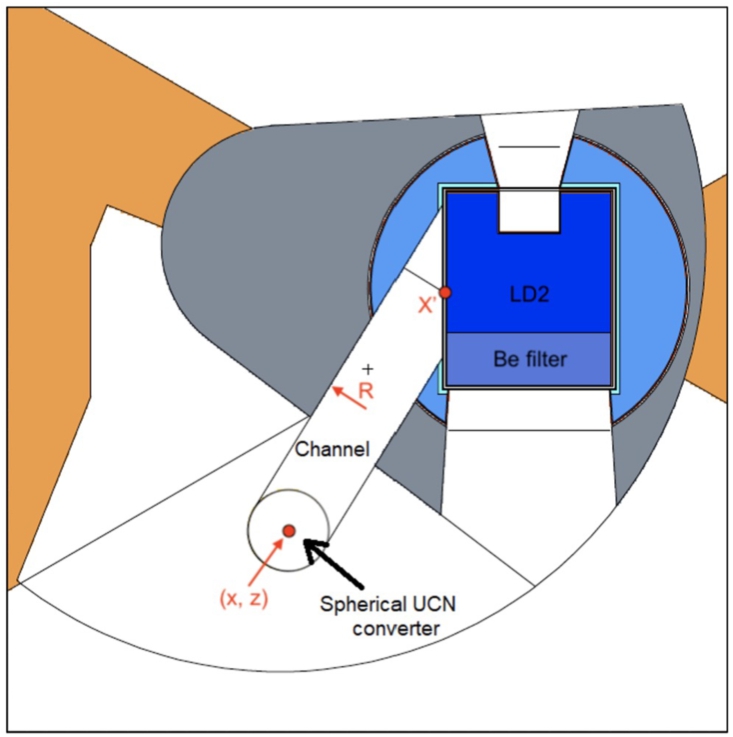
The initial model that was studied comprised of a cylindrical channel to transport cold neutrons from the surface of the LD2 moderator to the MCB and spherical UCN converter in which
Subsequently, the model was parametrized such that the horizontal position of the channel’s opening at the LD2 moderator surface
Moreover,
This finding was also independently confirmed by the Efficient Global Optimization algorithm that searched for maximal
Simultaneously, the decrease in the NNBAR FOM was minimal. This was unexpected, since cold neutrons with a wavelength between 2 and 4 Å partially contribute to
The maximal acceptable decrease in NNBAR FOM was chosen to be 5 % for any model of a UCN converter in the MCB. The NNBAR FOM of the baseline model without the UCN converter and transport channel was 2.53 × 10¹⁷, the lowest acceptable FOM therefore 2.40 × 10¹⁷. Of the models fulfilling this requirement, the highest observed
Subsequently, an SD2 converter in the MCB with direct view of the NNBAR emission surface was studied. This design was modelled by placing the converter further down in MCB with respect to the x axis, and defining a plane in the twister below which all material was removed. Consequently, cold neutrons emitted from the NNBAR emission surface could reach the SD2 converter in the MCB without obstacles, as shown in Fig. 138a. Based on Fig. 138b, the SD2 converter in the MCB could reach
Fig. 138.
A model with material removed in twister below a horizontal plane to allow for a direct view between the SD2 converter in MCB and NNBAR emission surface (a) drawing of the model. (B) map of
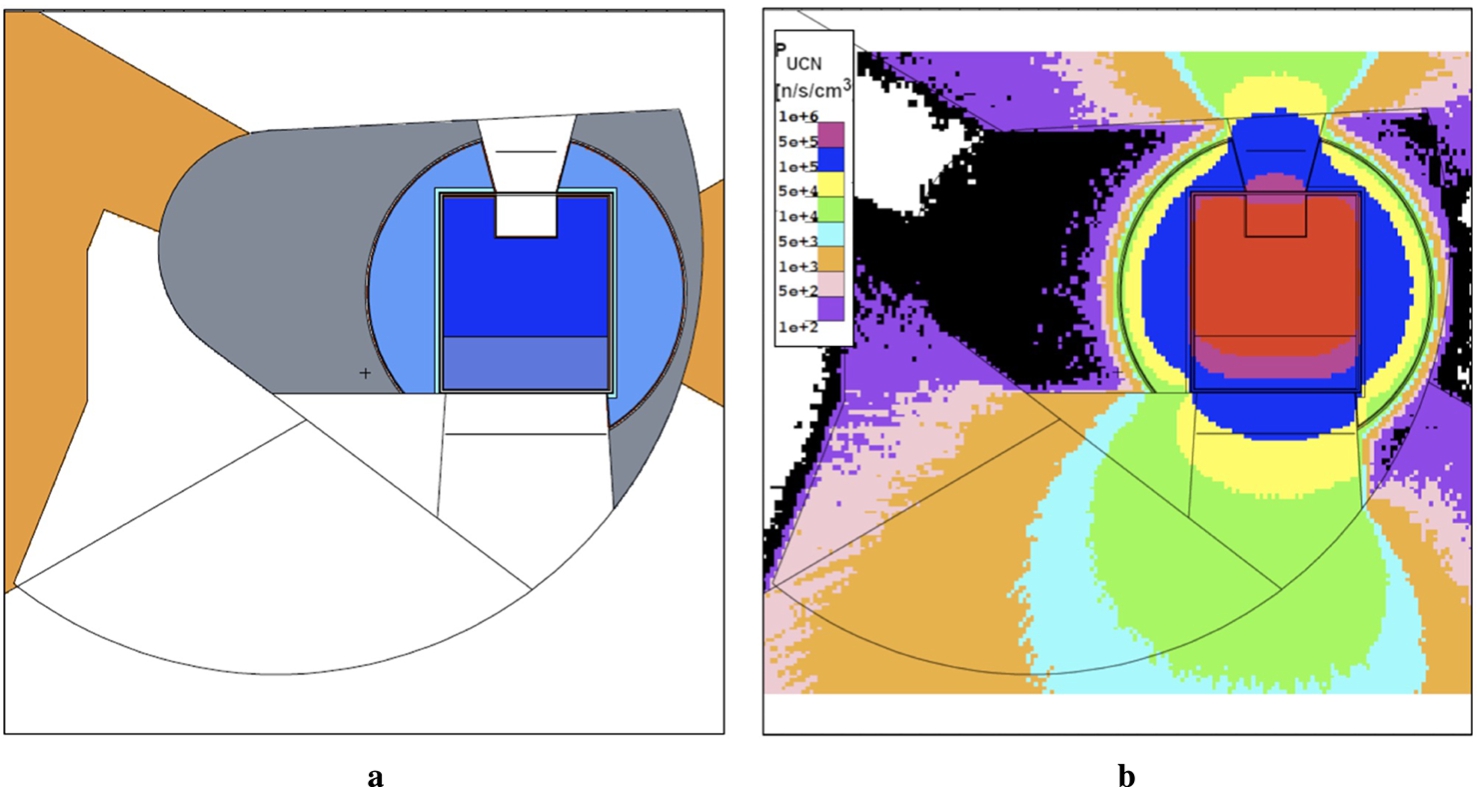
Estimating the heat-load on the SD2 converter and surrounding Al vessel was also an integral part of the study. The prompt heat-load for the thick box-shaped SD2 UCN converter was 440 W, where the heat deposited by neutrons was 220 W, and the heat deposited by photons was 200 W. However, this estimation did not take into account a contribution due to the neutron activation of isotope 27Al with subsequent β-decay of 28Al where both an electron and a γ-ray were emitted. The decay heat for the thick UCN SD2 converter was 18 W. Similarly, the prompt heat-load for a thin box-shaped SD2 UCN converter was 150 W, where the heat deposited by neutrons was 60 W, and the heat deposited by photons was 80 W. The decay heat of 28Al was 9 W.
Fig. 139.
(A) the thick SD2 UCN converter in the MCB for which
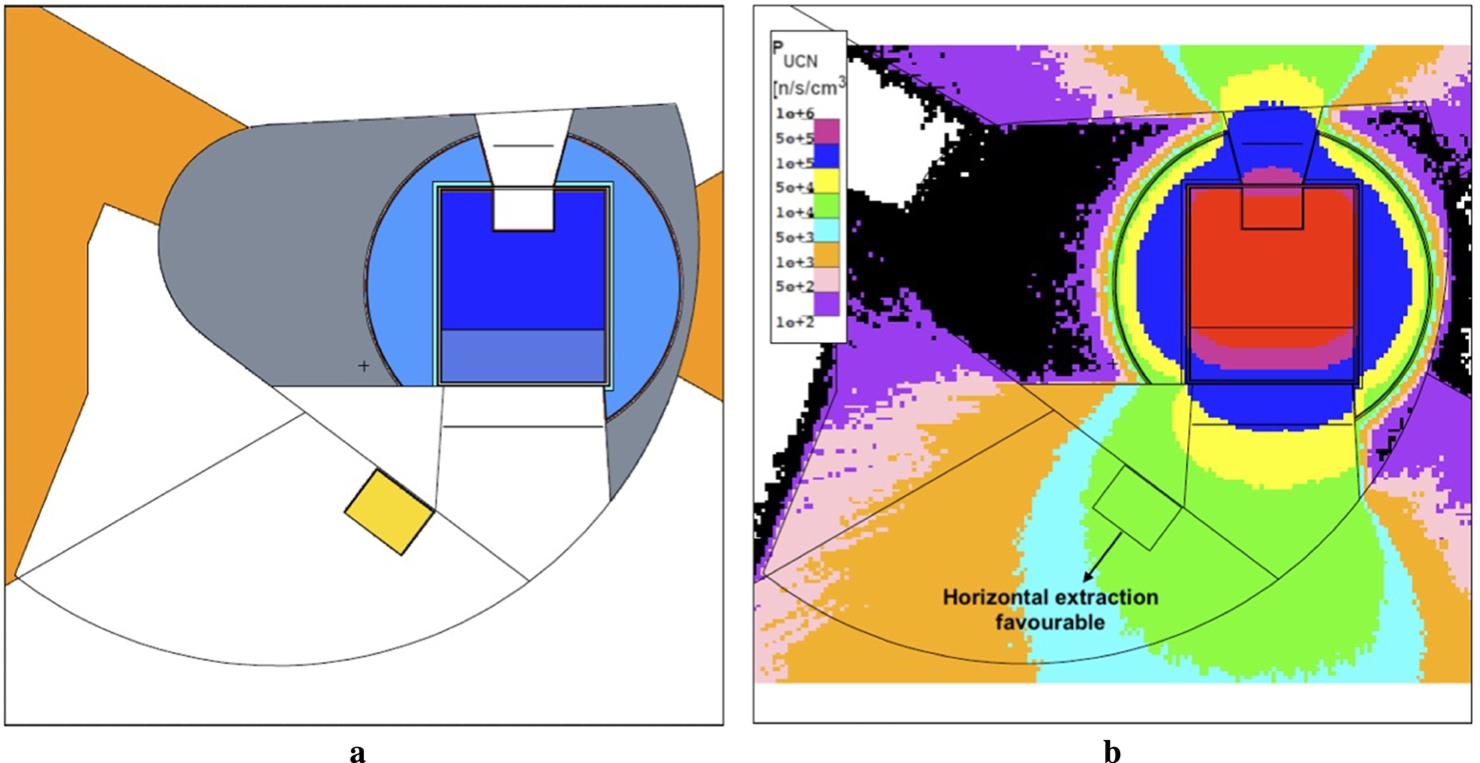
Fig. 140.
(A) thin box-shaped SD2 UCN converter placed in the MCB. (B)
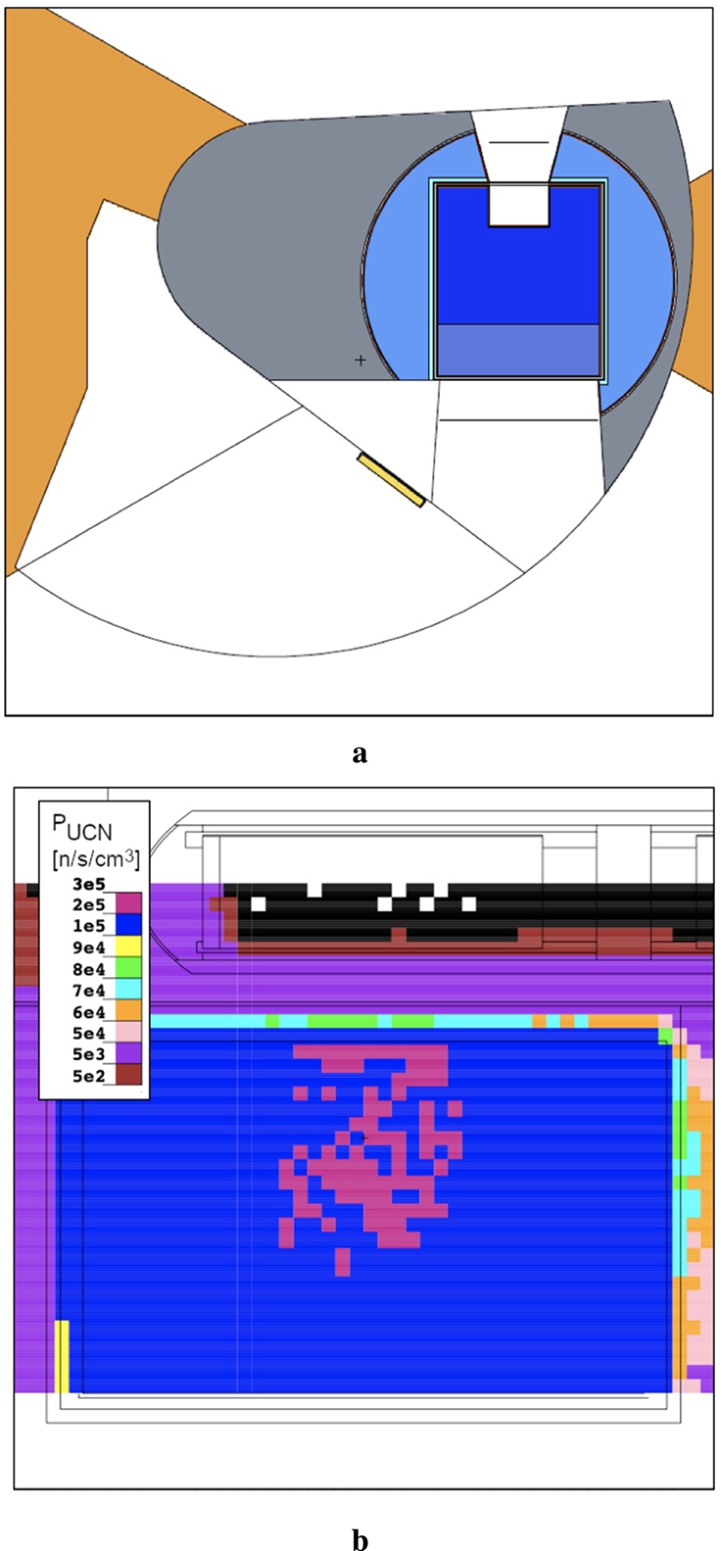
All the calculated variations of
Fig. 141.
(A) inserting the bismuth shielding into the twister in order to suppress photons before they reach MCB. (B) bismuth shielding in the twister reduced the flux of photons in MCB significantly.
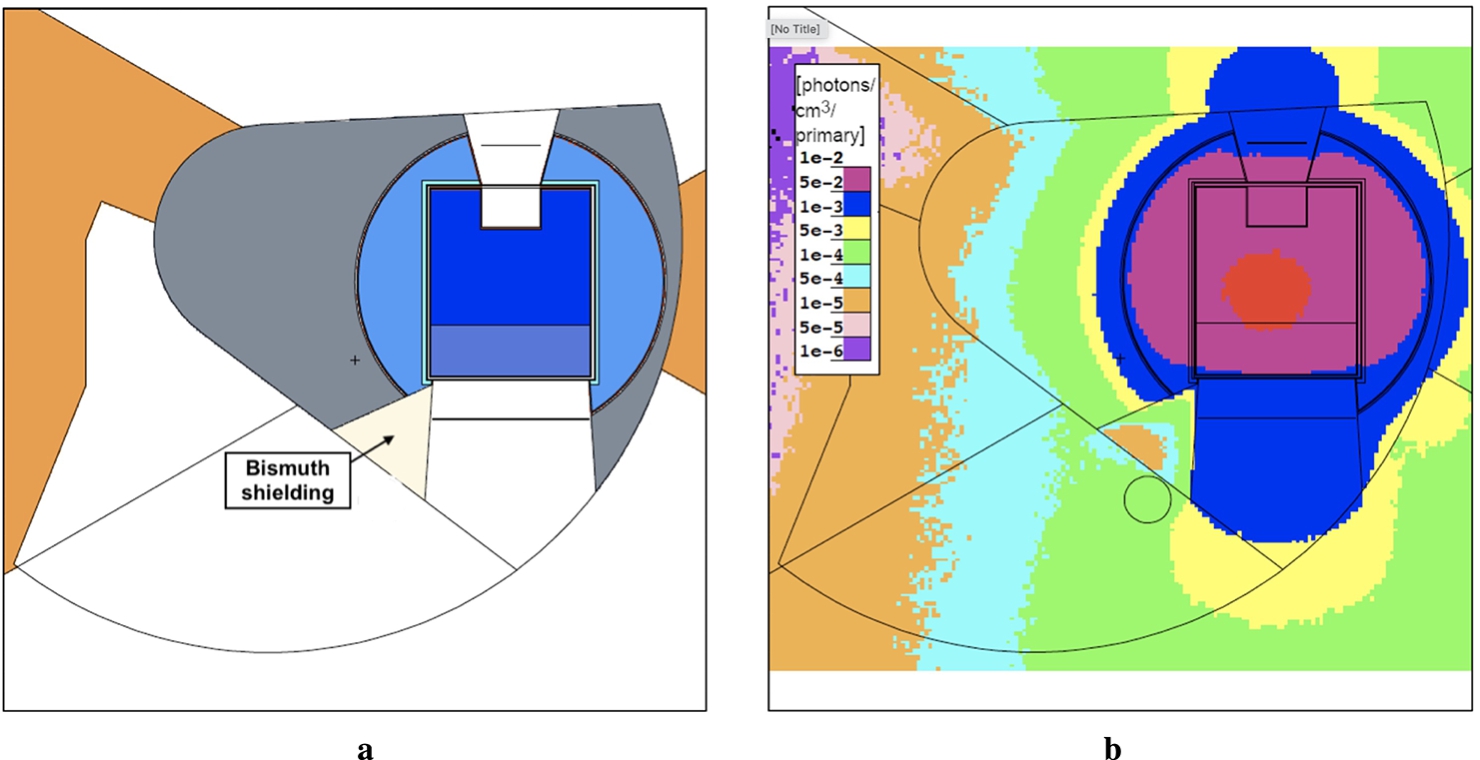
Fig. 142.
(A) the neutron spectrum in the MCB. The red line depicts the spectrum without bismuth shielding in the twister, and the blue line depicts the spectrum with bismuth shielding in the twister. (B) the flux of cold and thermal neutrons with wavelengths > 1 Å was clearly suppressed in the MCB by the bismuth shielding.
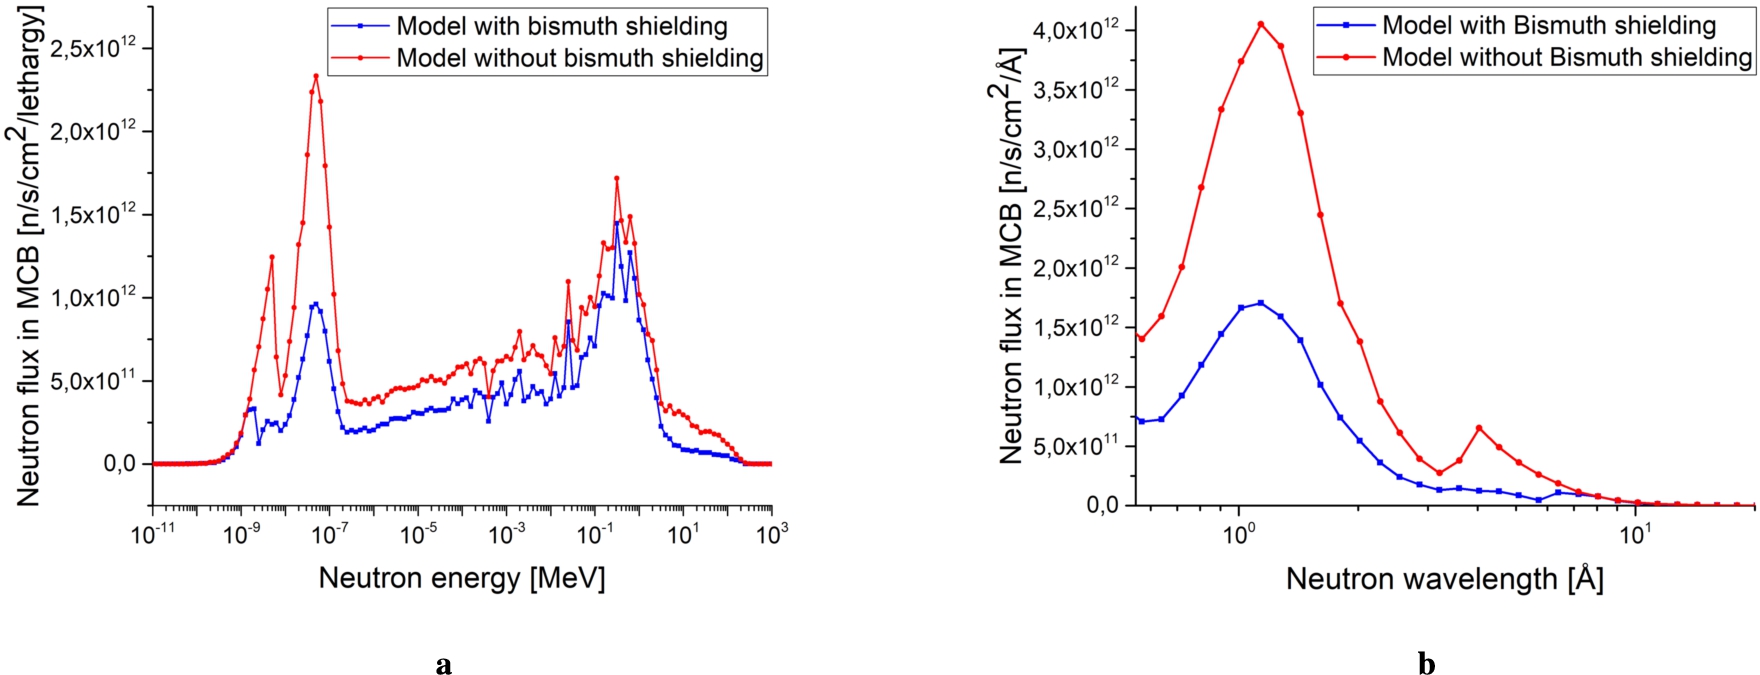
6.8.He-II in MCB
The option of a UCN moderator placed in the moderator cooling block based on helium in phase-state II (He-II) is investigated in this section. This option is very promising if CN, VCN and UCN sources are intended to be installed and operated in parallel. Therefore, preliminary engineering studies have been performed for this option. The following engineering study is unconstrained by the final decision for an implementation concept in this location.
A three stage coaxial shell moderator concept and a channel option to lead cold neutrons from the LD2 moderator to the UCN source has been studied in an attempt to increase the UCN production rate [36]. In the channel case (Fig. 137) the result was a loss in the UCN production rate for every channel diameter, reflector material and wall size. Removing parts of the twister as depicted in Fig. 143 leads to a gain in the UCN production rate and is therefore the preferred option.
Fig. 143.
MCNP simulation of coaxial-moderator shell design. Horizontal cut through the MCNP simulated geometry. Left: baseline geometry with He-II filled vessel. Right: coaxial-moderator shell geometry. The moderator shell thickness a & b has been varied in a parameter study.
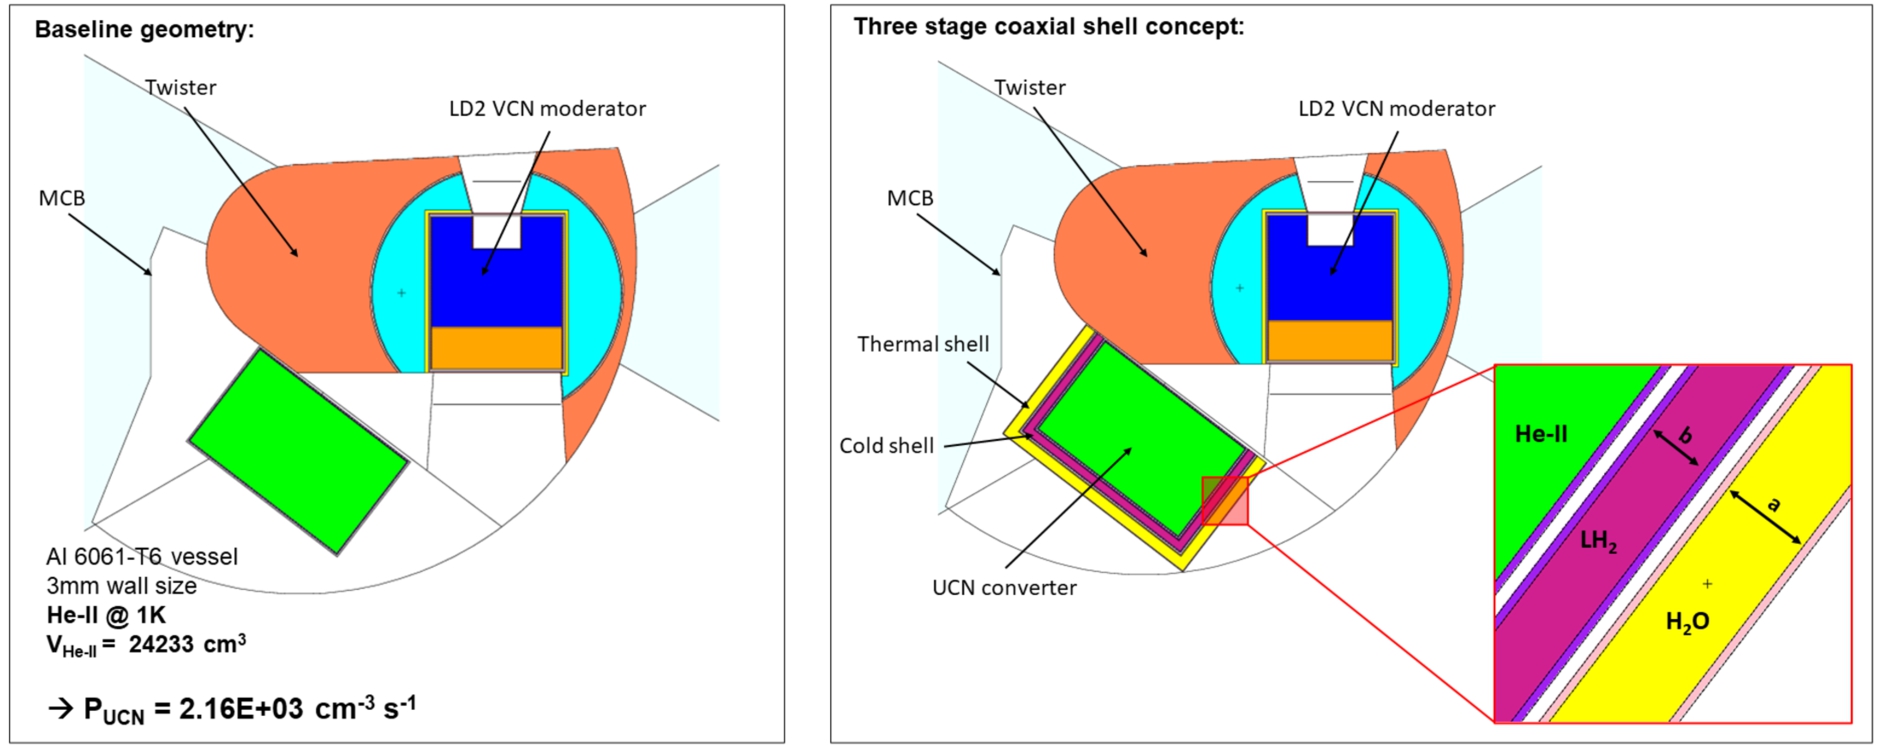
A coaxial-moderator shell design has been evaluated in a parametric study. The baseline model is shown in Fig. 143 and consists of an aluminum T6061-T6 vessel with a constant wall size of 3 mm filled with He-II at 1 K. The volume of the He-II content is about 24 L. The shell model consists of two different premoderators encapsulating the He-II vessel. The first premoderator, with thickness a, is a H2O layer at room temperature and is supposed to thermalize fast neutrons. Inside of it is an additional layer with thickness b of parahydrogen at 20 K, to moderate thermal neutrons into a cold neutron regime (8.9Å) in which the probability of direct conversion in He-II to the desired UCNs is highly increased (see Fig. 126).
The moderator media are encased by 3 mm Al T6061-T6 spaced with a 5 mm vacuum gap between the vessels as depicted in Fig. 143. The variation in the media thicknesses varies between a: 15 mm to 35 mm for the thermal and b: 5 mm to 25 mm for the cold moderator.
It can be observed that the maximum gain of ≈2% is reached for a case of thick thermal and thin cold moderator layers. The result is that the shell concept is not highly performing compared to the baseline model, but can be followed up in further simulations with different geometries and moderator media even if an outstanding gain in performance is unlikely. Therefore, the baseline model is the option that will be considered in the further engineering process.
Table 30 shows the expected heat loads on the aluminum structure and on the He-II filling, separated for neutron and gamma radiation. It can be observed that the highest heat load is caused by gamma radiation absorbed in the aluminum structure.
Table 30
Heat load on the He-II vessel separated by material and type of radiation
| Al | He-II | Σ | |
| γ | 173 W | 84 W | 256 W |
| n | 11 W | 61 W | 71 W |
| 328 W |
The neutron absorption cross section in most materials generally increases towards lower neutron energies. Therefore, the gain in UCN conversion by He-II is overcome by the loss due to absorption of the premoderated neutrons in aluminum structures needed to add moderation stages; simultaneously the heat load in the system is increased. Figure 126 shows that for lower neutron wavelength then the narrow 8.9 Å band of high interaction probability with He-II, the interaction probability is significantly lower but still present. In this regime the energy transfer from the neutron to the He-II is mediated in several steps by phonon interactions. Due to He-II’s extremely low absorption cross section, higher-energy neutrons are either converted to UCNs as desired or pass through He-II without interaction. The conclusion for the further engineering process is that the He-II vessel of the UCN source should be designed under the premise to minimize the aluminum content to the needed for fulfilling the demands on structural integrity of the nuclear code for pressure vessels while maximizing the encased He-II volume, without additional moderation devices. If in the following engineering process the heat load is above a critical level that can not be handled by available He cryostates, additional gamma filter shells can be considered, which will most likely imply some loss of the UCN performance of the source.
It can also be considered to manufacture the vessel from beryllium or from a beryllium/aluminum alloy which would considerably reduce the heat load on the vessel. These materials are currently not qualified by the RCC-MRx nuclear code for pressure vessels although the material parameters are promising. Therefore an accreditation for the use of these materials can be taken into account.
The mounting position in the moderator cooling block offers the possibility to integrate the UCN source in the existing ESS infrastructure by replacing and rebuilding a minimum of existing components. The moderator cooling block consists of staked and actively cooled stainless steel shielding blocks which can be partially replaced or overworked. Another benefit of the location is the already existing supply infrastructure with cooling water and cold gaseous as well as liquefied He.
In conclusion, the MCB location has, besides a high UCN production rate, different advantages. The UCN source can be implemented by changing and overworking a small number of existing components while most of the existing ESS structure can be left untouched. Furthermore, the location offers existing supply infrastructure with cooling water and helium on different temperature levels.
6.8.1.Recommended further engineering investigations
Engineering on UCN source concept:
∗ Guiding of UCN and interfacing to experiments
∗ Inner wall coating (58Ni)
∗ Purification of He-II
Experimental investigations on He-II regarding:
∗ Phase stability
∗ Heat conductivity
∗ Experimental simulation of ESS conditions based on MCNP simulation results (expected heat load, pulse structure)
Limits for cross section area for heat transport through He-II
6.9.He-II in LBP
Another option for creating a UCNs source at ESS is based on He-II placed at the LBP, which is described extensively in Section 3.4 of [221]. A He-II based UCN source can benefit from the extended lifetime of the UCNs within the neutron absorption-free medium, allowing for storage and therefore, high density of UCNs. Additionally, this location can result in lower heat loads compared to the other options discussed so far. While the LBP is initially intended for use by the NNBAR experiment, it could potentially be repurposed for UCN production at a later stage.
Two different concepts of UCN source that could use the LBP location were identified. In the first option, which is studied in this section, the LBP can host a He-II converter for UCN production (represented as number 4 in Fig. 124), placed inside the monolith, with the tip of the source at a distance above approximately 2 m from the center of the lower moderator. As it is described in Section 6.2, we still consider this option as “in-pile”, even though it is a larger distance from the primary source compared to the options in the twister or in the MCB, discussed in the previous sections. This classification is justified by the fact that at that location, a He-II converter will receive a neutron spectrum with a large component of fast neutrons, unlike a pure in-beam converter which will receive mainly cold neutrons and a smaller fraction of background neutrons. In the second option (location 5 in Fig. 124, considered as “in-beam”, we still use the LBP, but the source is placed further away, outside the neutron bunker. This option is described in Section 6.10.
For the in-pile option under study in this section, we followed the proposal by Serebrov and Lyamkin [180], consisting of a 58-liter vessel (60 cm × 30 cm × 32 cm) filled with He-II, surrounded by a reflector made of LD2 and bismuth shielding. The geometry is depicted in Fig. 144, and it will be referred to as the baseline geometry henceforth.
Fig. 144.
Left: MCNP geometry showing the He-II source backed by a LD2 reflector in the large beamport, concept of Serebrov and Lyamkin [180]. Right: the geometry and the materials used in the UCN source located at LBP plotted by PHITS 3.27 [175].
![Left: MCNP geometry showing the He-II source backed by a LD2 reflector in the large beamport, concept of Serebrov and Lyamkin [180]. Right: the geometry and the materials used in the UCN source located at LBP plotted by PHITS 3.27 [175].](https://content.iospress.com:443/media/jnr/2023/25-3-4/jnr-25-3-4-jnr230950/jnr-25-jnr230950-g145.jpg)
Table 31 presents a summary of the UCN production for the baseline geometry [221]. For this study, the He-II thermal scattering library mentioned at Section 6.4.2 is used in MCNP. By implementing the scattering function from ESS model 1, Fig. 126 into Equation (8), the UCN production rate density is calculated as 368.5 n/s/cm3. The total prompt heat-load only on the He-II converter at the specified source location is 8.2 W. To further enhance this design, it is essential to understand how each component of the UCN source impacts UCN production and heat load.
The main objectives are twofold: first, to maximize the neutron flux within the energy range of 1–10 meV within the He-II converter. Second, to effectively manage the total heat load on the He-II converter. This heat load encompasses contributions from both neutrons and photons on the He-II converter as well as the aluminum shell surrounding the He-II. Additionally, there is a decay heat load resulting from aluminum beta activation, which accounts for about 24 % of the total heat load originating from neutrons and photons [181]. Throughout the optimization process, we maintained the He-II volume constant at the preliminary design value of 57.6 L for comparability. Subsequently, we investigated the impact of each component on the performance of the UCN source.
6.9.1.Bismuth filter for gamma shielding
Table 31
Performance of baseline geometry of He-II UCN source in the LBP
| He-II volume [L] | Heat-load [W] | |||
| He-II in LBP (baseline) | 57.6 | 368.5 | 8.2 |
Fig. 145.
Studying the baseline geometry to assess the impact of individual components: (a) investigation of bismuth shielding by the front section and walls; (b) examination of the effect of LD2 by the back section and walls.
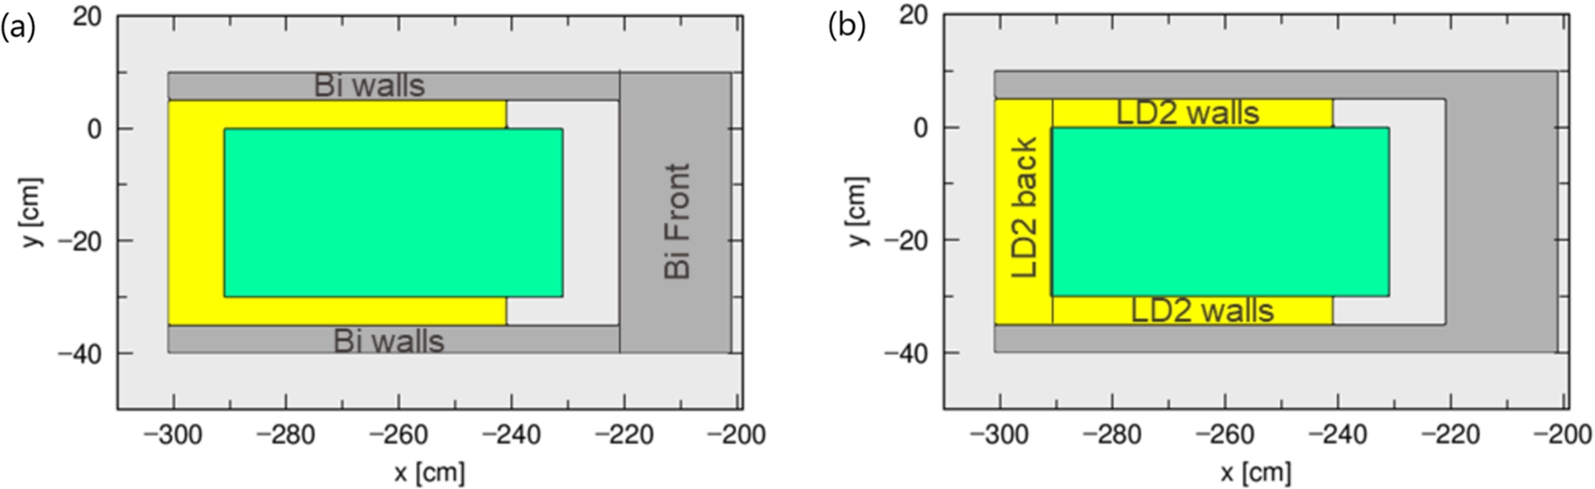
To investigate the impact of bismuth on the resulting UCN density and heat load, we segregated this part of the geometry into the front section and the section encompassing the walls, as depicted in Fig. 145 (a). The outcomes, outlined in Table 32, indicate that the presence of Bi in the walls does not markedly influence the heat load or the UCN production rate density when compared to the front part. Removing Bi from the front portion results in a doubling of UCN gain, albeit at the cost of increasing the heat load by approximately a factor 6.
Table 32
Effect of Bi in the front and in the walls on the relative gain in UCN production rate density and relative heat load compared to the baseline geometry
| Relative gain | Relative heat load He-II, n + γ | |
| Baseline | 1 | 1 |
| Baseline-absence of Bi-walls | 0.85 | 1.3 |
| Baseline-absence of Bi-front | 2.37 | 5.7 |
| baseline-absence of total bismuth | 1.95 | 6.7 |
Fig. 146.
The cold source spectrum when there is no bismuth filter and at the presence of bismuth filter at 77 K as a function of energy.
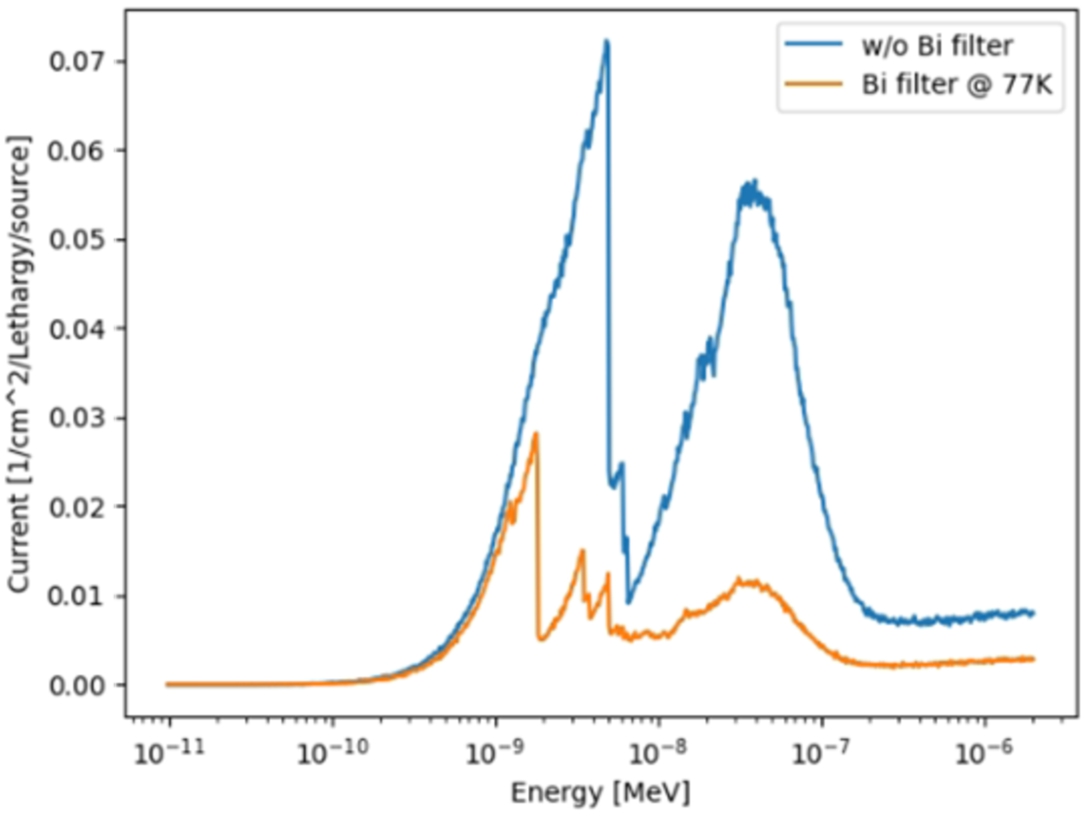
Fig. 147.
Left: total neutron interaction cross section of neutron for polycrystalline and oriented single crystalline bismuth; right: total cross section of neutrons for polycrystalline bismuth and beryllium.
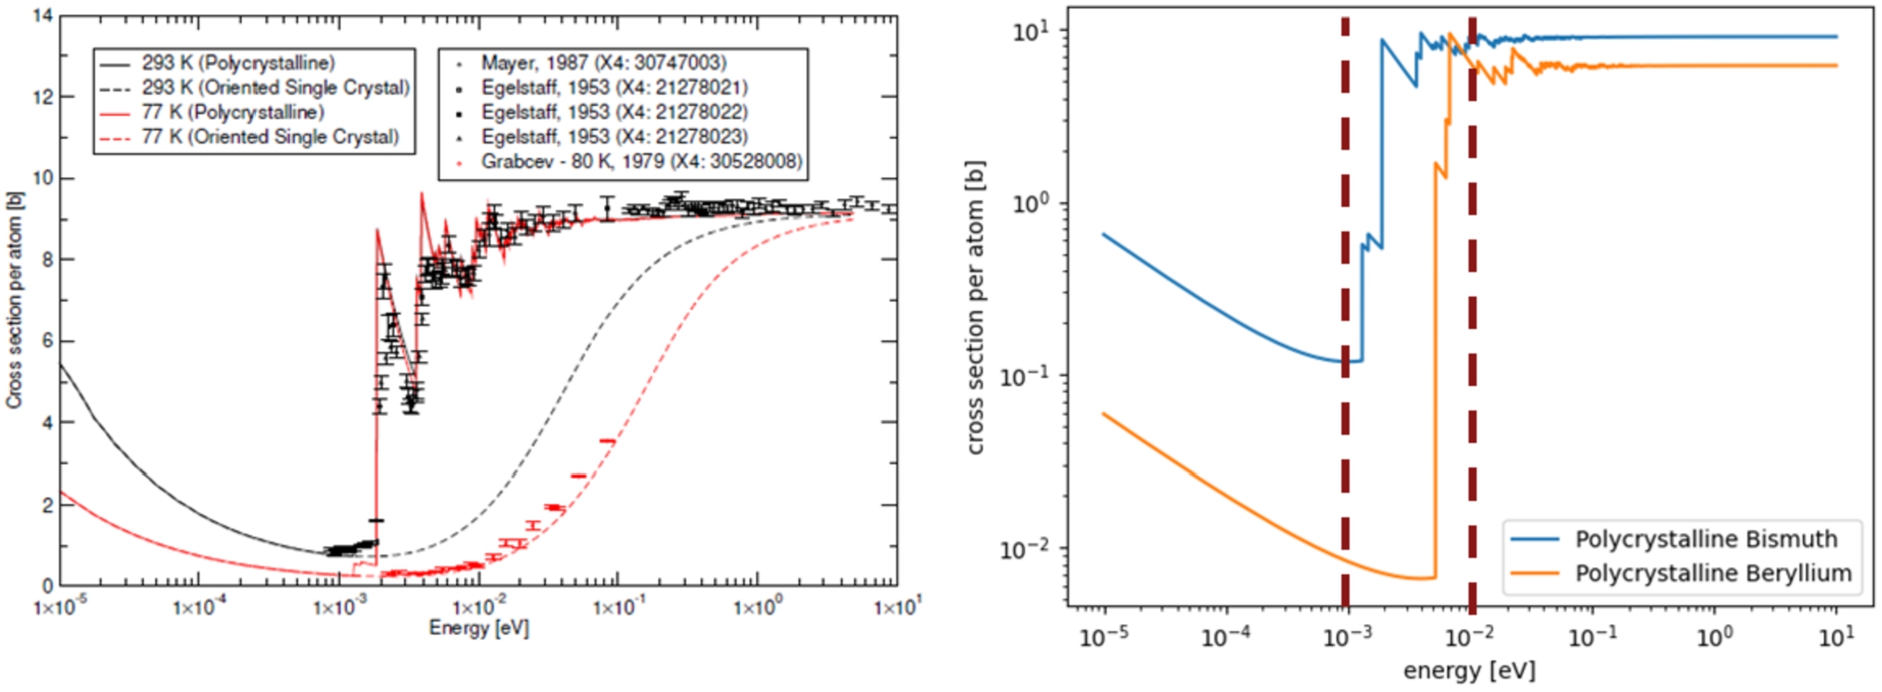
The significant impact of removing Bi on UCN gain can be understood by examining the transmission spectrum with and without Bi in the front section, as illustrated in Fig. 146. This comparison reveals a substantial drop within the 1–10 meV range, which is crucial for UCN production.
This effect arises from the presence of Bragg peaks in the cross-section of polycrystalline bismuth, as shown in Fig. 147 (left). To compensate for this drop, we need to identify a material that scatters neutrons less effectively within the 1–10 meV range. Looking again at Fig. 147, oriented single crystal bismuth at 77 K exhibits a minimal scattering cross section within this range. Additionally, beryllium, shown on the right side of the figure, also has a lower scattering cross section.
The results of replacing polycrystalline bismuth in the front section with single crystalline bismuth and beryllium are detailed in Table 33. Single crystalline bismuth leads to a 1.75-fold increase in gain compared to the baseline, with only a 30 % increase in heat load. On the other hand, beryllium shows lower performance in both UCN gain (1.6-fold increase) and heat load reduction (1.9-fold increase).
Figure 148(a) displays the transmittance spectrum of various filters, demonstrating the superior transmission of neutrons within the 1–10 meV range for single crystalline bismuth and beryllium. Additionally, Fig. 148(b) illustrates the neutron spectrum inside the He-II, revealing a greater flux for single crystalline bismuth and beryllium when compared to polycrystalline bismuth. This observation aligns with the findings presented in the table.
Table 33
Effect of different front filter materials on the UCN production rate density and the heat load on He-II converter. PC: polycrystalline ; SC: single crystalline
| Front filter | Relative | He-II heat load (n |
| Void | 2.3 | 5.2 |
| Bi PC @ 77 K | 1 | 1 |
| Bi SC @ 77 K | 1.75 | 1.3 |
| Be PC @ 77 K | 1.6 | 1.9 |
Fig. 148.
(A) transmittance spectrum of incoming cold neutrons for different materials; (b) flux of neutrons inside the He-II converter.
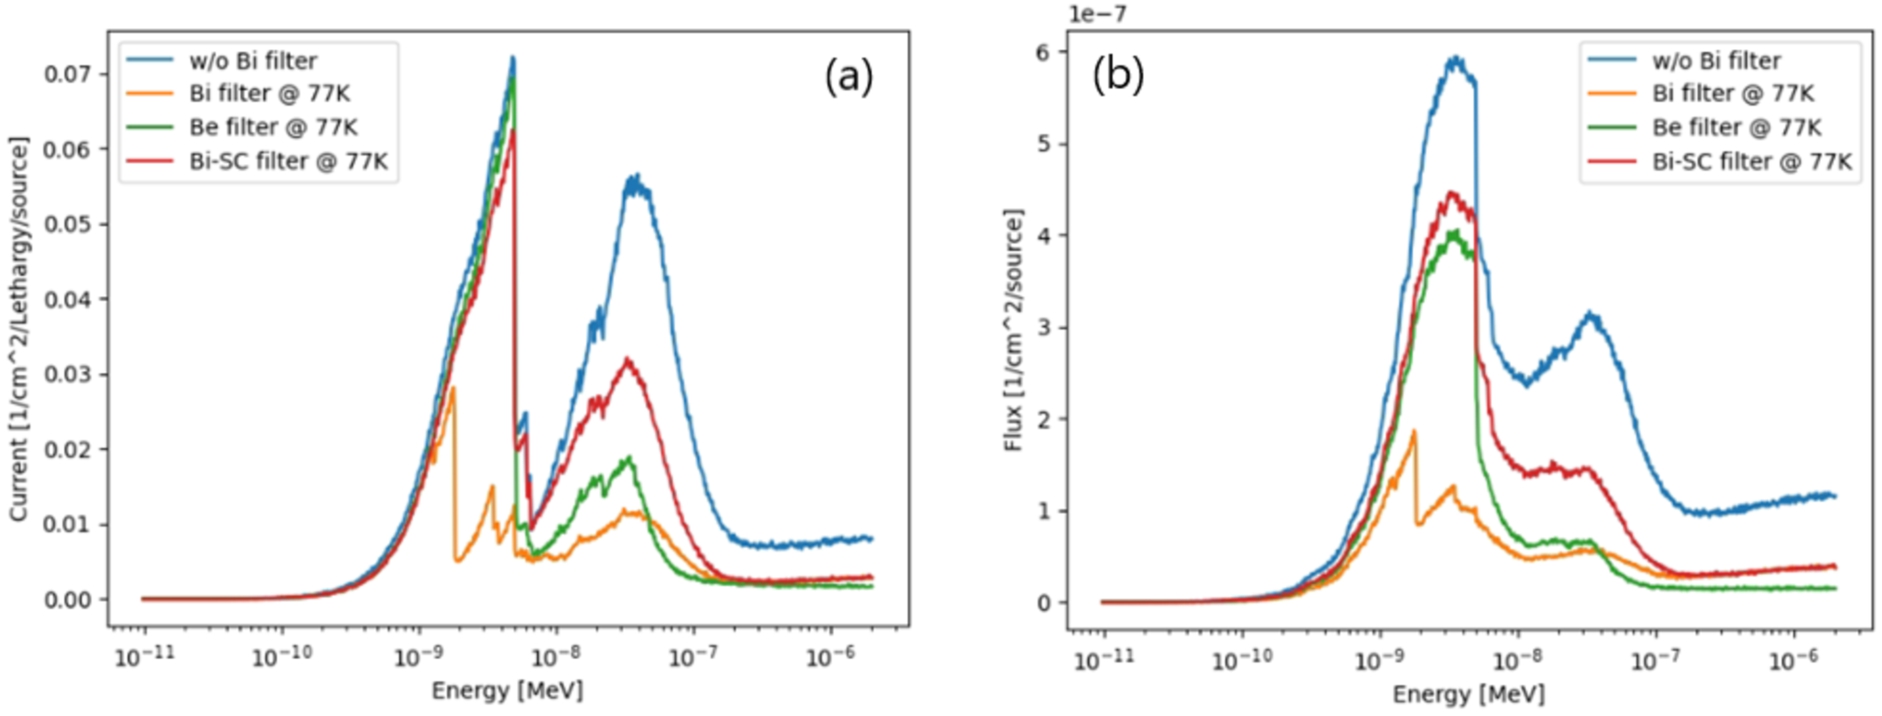
6.9.2.LD2 as a CN reflector
Following the same methodology employed for the bismuth studies, we divided the LD2 into two parts: the back section and the walls, as depicted in Fig. 145(b). The impact of each part of the LD2 reflector is outlined in Table 34. In total, the presence of LD2 leads to a 42 % gain in UCN production rate density and has a favorable effect on reducing heat load. This is primarily attributed to the implementation of the inverted pre-moderator scheme, allowing cold neutrons a second opportunity for conversion to UCNs upon reflection back into the He-II. The reduction in heat load arises from the fact that a portion of the heat is absorbed by LD2, thereby reducing the amount absorbed by the He-II converter.
Table 34
Effect of different parts of LD2 reflector on the UCN production rate density
| Relative gain | He-II heat load (n | |
| Baseline | 1 | 1 |
| Absence of LD2-walls | 0.65 | 1.2 |
| Absence of LD2-back | 0.87 | 1.01 |
| Absence of LD2-total | 0.58 | 1.21 |
Apart from using LD2 as a cold reflector, there are other materials that hold potential as effective reflectors for the cold regime, such as nanodiamonds and MgH2. Figure 149 displays the reflectivity of these materials, distinctly highlighting that MgH2 exhibits better reflection compared to the other two, specifically for neutrons within the 1–10 meV range. Additionally, maintaining MgH2 at 20 K results in reduced scattering, as illustrated on the right-hand side of the same figure.
Fig. 149.
Left: reflectivity of nanodiamonds, graphite and MgH2 as a function of neutron energy [83]; right: total neutron interaction cross section of MgH2 at 20 K and 293 K [82].
![Left: reflectivity of nanodiamonds, graphite and MgH2 as a function of neutron energy [83]; right: total neutron interaction cross section of MgH2 at 20 K and 293 K [82].](https://content.iospress.com:443/media/jnr/2023/25-3-4/jnr-25-3-4-jnr230950/jnr-25-jnr230950-g150.jpg)
Table 35 provides a comparison of the relative UCN production rate density in scenarios without bismuth walls and with the substitution of LD2, resulting in a 39 % increase in gain. This gain factor could see another 41 percent improvement with the addition of a 1-cm layer of MgH2 surrounding the He-II converter. However, increasing the temperature of MgH2 leads to a loss in performance, almost equivalent to the baseline geometry. This is likely attributed to up-scattering events, which diminish the flux of cold neutrons within the He-II medium, and underscores the significance of keeping the source at low temperatures.
Table 35
Effect of MgH2 layer on the UCN production rate density
| Geometry | Relative gain |
| Baseline | 1 |
| Absence of Bi walls | 0.85 |
| Bi walls replaced by LD2@20K | 1.24 |
| 1 cm MgH2@20K + 9 cm LD2@20K | 1.65 |
| 1 cm MgH2@293K + 9 cm LD2@20K | 1.04 |
6.9.3.Adding engineering details
Until now, our discussion has been based on an idealized design concept. In reality, maintaining He-II at 1K, MgH2 at 20K, and Bi at 77 K requires proper isolation of each component through the use of vacuum insulation. Furthermore, both He-II and LD2 are fluids and necessitate the presence of a vessel, along with considerations for the vessel’s material, and the inclusion of vacuum gaps within the design. As per the technical designs, a 3 mm aluminum vessel encompassing all components and a 10 mm vacuum gap can adequately fulfill these requirements, as illustrated in Fig. 150. In Table 36, the effects of adding engineering details on UCN production rate density are summarized.
Fig. 150.
Adding engineering details, including aluminum vessel and vacuum gaps to the source design. A close-up view is provided for better clarity.
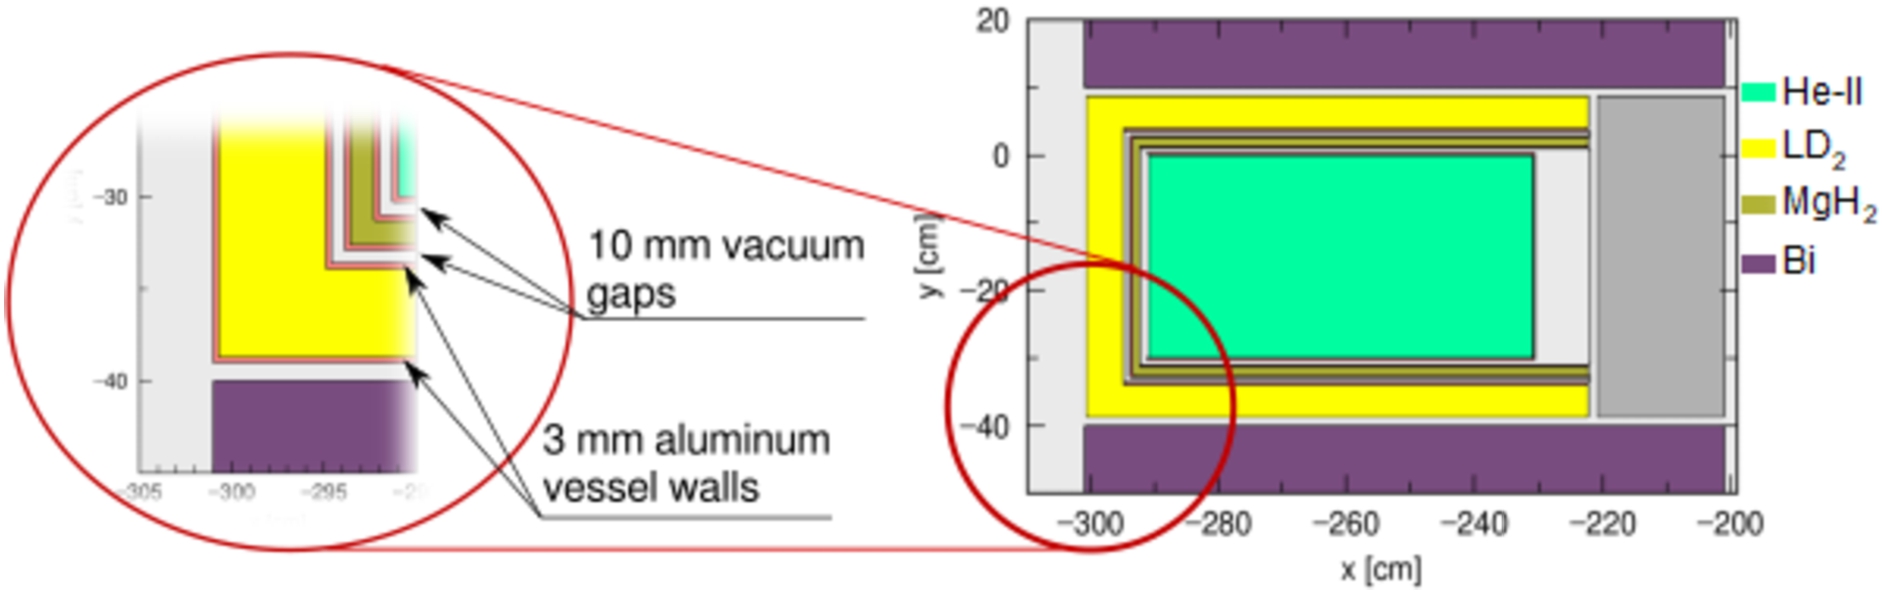
Table 36
Effect of adding engineering details on the UCN production rate density
| Geometry | Relative gain | Heat load [W] He-II (n | Heat load [W] Al (n | Heat load [W] Al (β) | Total heat load [W] |
| Baseline (ideal) | 1 | 8.0 | - | - | 8.0 |
| Baseline | 0.76 | 9.3 | 3.05 | 2.26 | 14.6 |
| Optimized (MgH2 + LD2 + Bi PC) | 1.02 | 10.6 | 7.0 | 5.2 | 22.8 |
| Optimized (MgH2 + LD2 + Bi SC) | 1.6 | 13.5 | 10.7 | 8.0 | 32.2 |
| Optimized (MgH2 + LD2 + Be) | 1.52 | 19.5 | 17.8 | 13.2 | 50.5 |
6.9.4.Outlook
According to the calculations, employing single crystalline bismuth at 77 K and MgH2 at 20 K presents an opportunity to enhance UCN gain while still maintaining the heat load below 100 W. While this design did not account for the UCN extraction scheme, it is worth noting that being situated within a large beam port provides enough space for implementing extraction channels. Additionally, considering the specific instrument and UCN experiment, there may be room for optimization in the volume of He-II. Table 37 shows the final values for the optimized geometry of the UCN source at LBP considering the engineering details.
Table 37
Performance of optimized geometry of He-II UCN source in the LBP
| He-II volume [liters] | Heat-load [W] | |||
| He-II in LBP (final design) | 57.6 | 590 | 32.2 |
6.10.In-beam UCN source
In this section the design and possible performance of an in-beam UCN source for the ESS are described. More details can be found in a recent publication [235]).
The central component of in-beam UCN source is a neutron delivery system consisting of nested-mirror optics (NMO). The bright neutron emission surface of the large liquid-deuterium moderator has to be imaged onto the UCN source, a remotely located superfluid-helium converter. This approach allows the converter to be placed far away from the high-radiation area in the ESS shielding bunker. The focused beam illuminates the converter under a solid angle that may significantly exceed the solid angle transportable by a straight guide equipped with the most advanced supermirror coating. In this way a large gain in flux density and hence UCN production rate density is achieved.
6.10.1.Basic principles of an in-beam UCN source
The three main components to an in-beam UCN source are: a cold neutron moderator, a neutron optical delivery system (NODS), and a converter vessel, filled with superfluid Helium (He-II). The problem of optimizing the UCN production according to a particular set of desired characteristics requires a careful consideration of not only the many parameters describing these three components, but also the interplay between them.
A possible architecture for the transport system for neutrons diverging from a source to a target region is an elliptical guide, with its focal points coinciding with the center of the source and the detector, respectively [231,232]. The layers of several guides can then be nested to build up a spatial tight component (see Fig. 151) to form a NMO system. These devices accept neutrons within a wide, geometrically defined angular range. Two main implementations of NMO can be considered, either with a toroidal or with a planar symmetry (see inlays in Fig. 151). In the former case, the device is rotationally symmetric about the optical axis; each mirror surface is a section of an ellipsoid of revolution, and a single reflection transports a neutron from source to target. In the planar case, the mirrors have a local translational symmetry in a direction transverse to the optical axis. Refocusing the beam in both transverse dimensions then requires a combination of two planar NMO rotated by 90° about the optical axis. Such a system images the beam by two reflections, one for each transverse dimension.
Fig. 151.
Schematic of an elliptic nested mirror optical (NMO) system. The foci M and
![Schematic of an elliptic nested mirror optical (NMO) system. The foci M and M′ are separated by the distance 2f and are common for a set of ellipses. One of them is indicated by the dashed line. The surfaces of the mirrors are formed by truncating the ellipses to a common length l. The two types of symmetry about the optical axis of the NMO are indicated in the upper corners; the views show the NMO surfaces projected onto a surface normal to the optical axis z. Image from [235].](https://content.iospress.com:443/media/jnr/2023/25-3-4/jnr-25-3-4-jnr230950/jnr-25-jnr230950-g152.jpg)
The in-beam UCN source for this report is proposed to be of the “superthermal” type. The mechanism was proposed 1975 by Golub and Pendlebury [77] and in contrast to UCN production by neutron moderation, cold neutrons are “converted” to UCN by imparting nearly their entire kinetic energy to elementary excitations – most commonly phonons – of the source medium in single scattering events. In Fig. 152 the process for superfluid 4He (He-II) is depicted. The dispersion relations of the free neutron and the phonon-roton of the superfluid helium cross at an energy
This makes clear that for such an in-beam UCN device the goal becomes to maximize the average of
Fig. 152.
A) dispersion curves of free neutrons and phonons in superfluid helium 4He. B) elastic scattering process. A cold neutron excites a phonon and becomes ultracold.
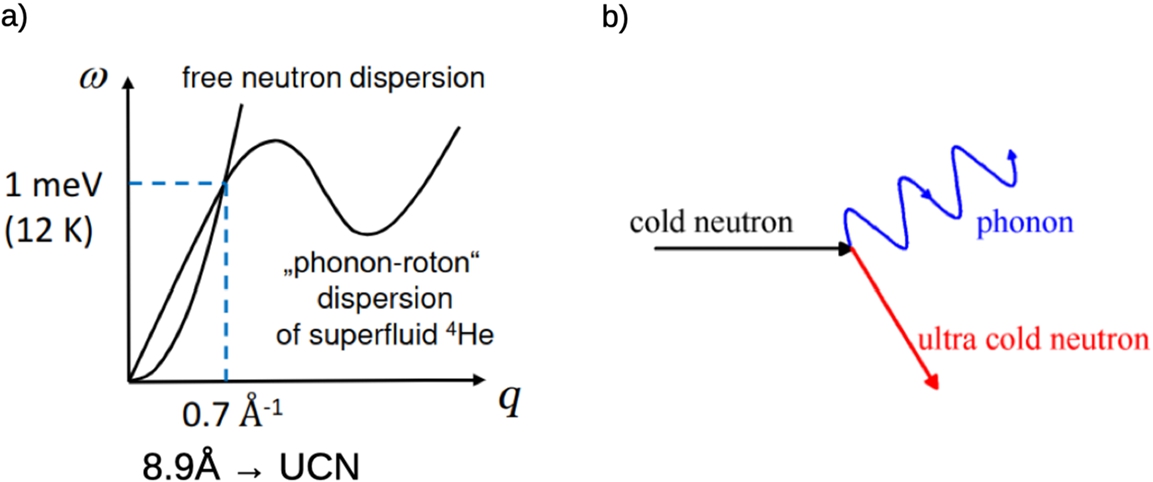
6.10.2.In-beam UCN source implementation at the ESS
The concepts pointed out in the previous section shall now be applied to an implementation at the ESS in order to estimate the UCN densities that may be possible using NMO to transport cold neutrons to a He-II converter vessel. The ideal location for such a UCN source would make use of the LBP, through which moderators in the vicinity of the spallation target wheel can be viewed with large solid angle. The emission parameters of the LD2 moderator are
Fig. 153.
Depiction of a (simulated) intensity map on the ESS LD2 moderator surface for neutrons with wavelengths around
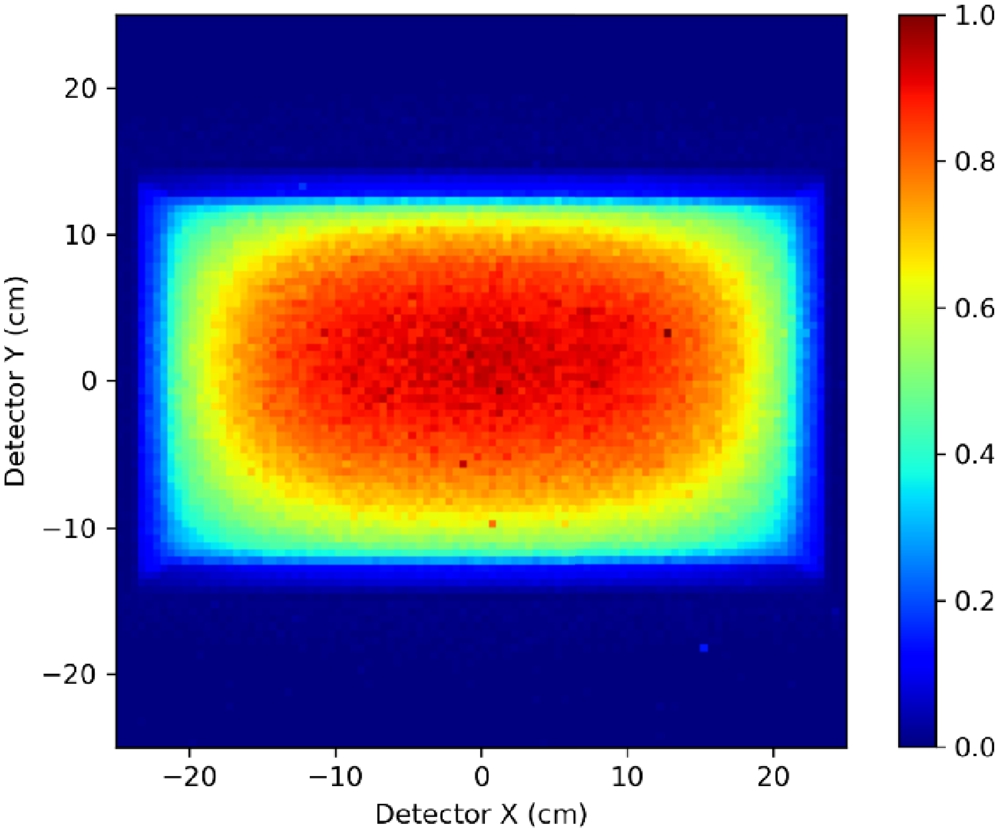
Fig. 154.
Schematic of the proposed neutron optical delivery system for the large beam port at the ESS. The parameters quoted below have been used for the McStas simulations. The distance between the moderator, at left, and the converter entrance, at right, is 35 m. Neutrons are emitted at the LD2 moderator surface from an area
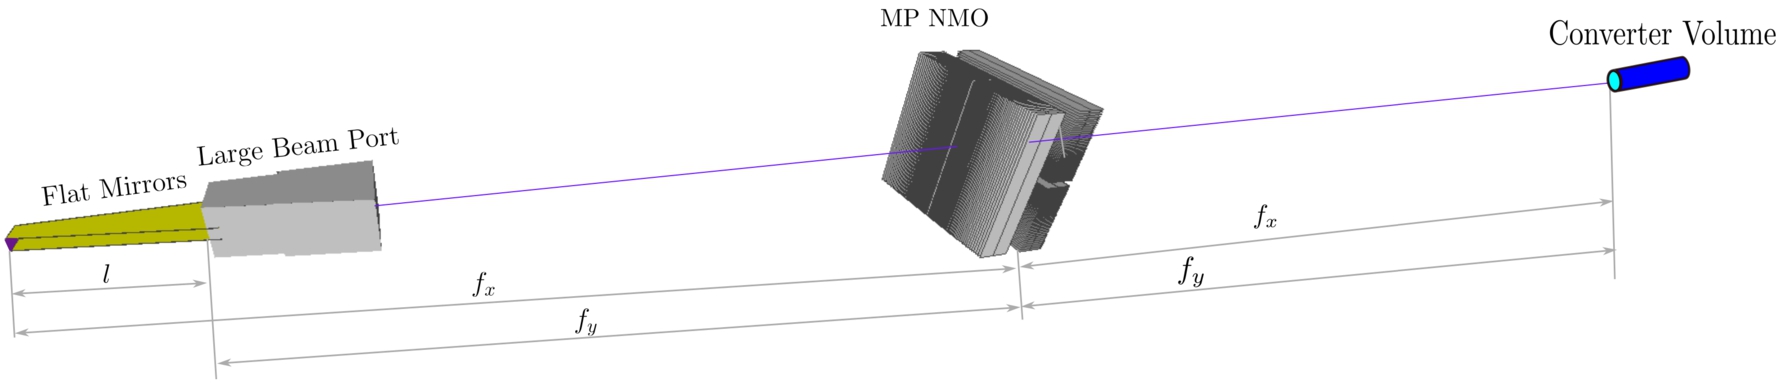
Fig. 155.
Relative (left) and total (right) production rates at the UCN converter volume as a function of the radius of the converter.
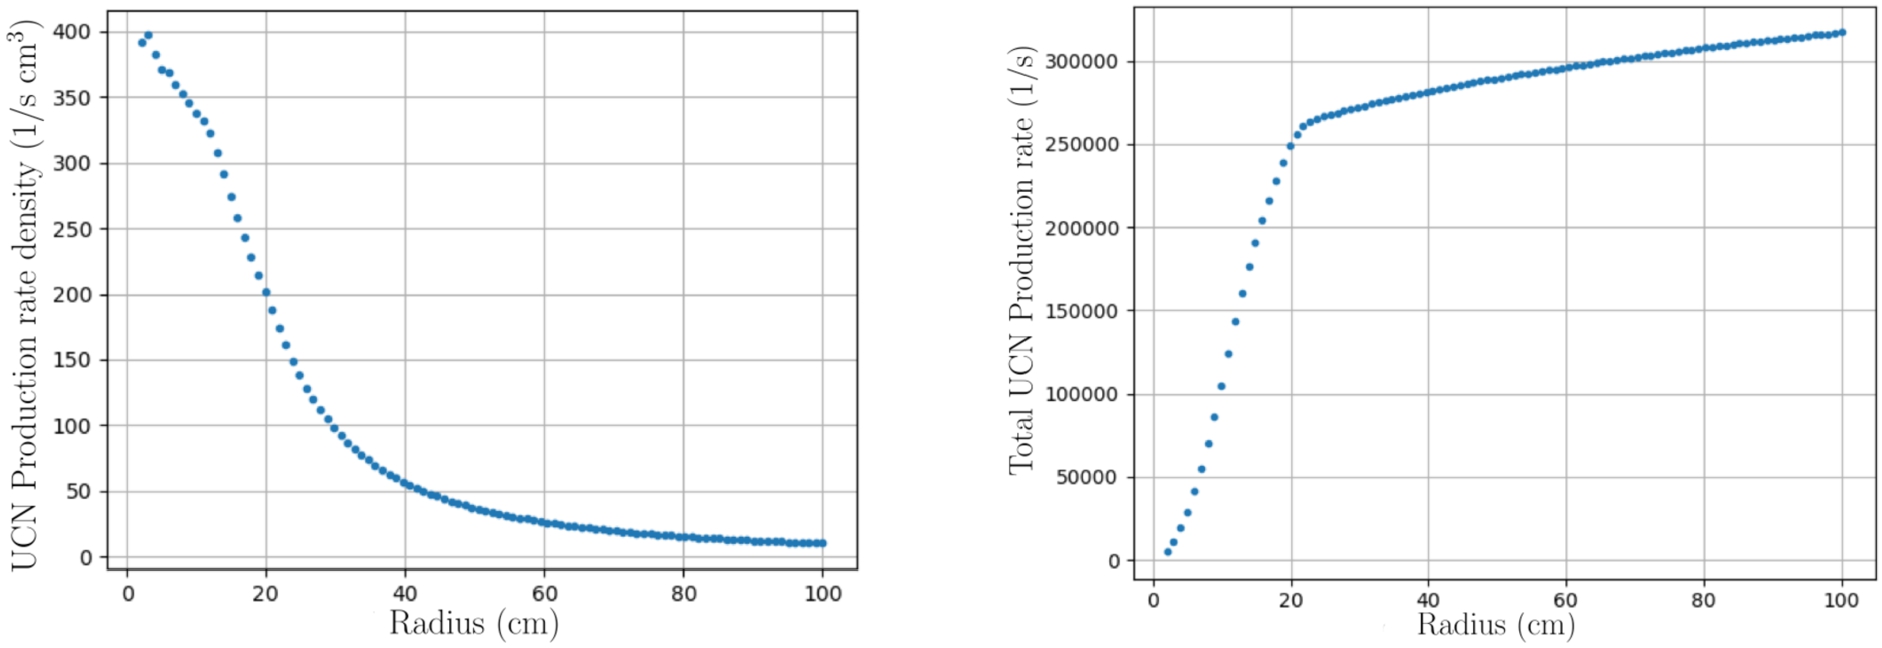
To determine its performance, the proposed system has been simulated in McStas. The NMO have been realized using the library developed for the NNBAR reflector (see Section 7 of the HighNESS Conceptual Design Report Volume II). The recorded flux at the converter area is converted to a production rate using Equation (10). In Fig. 155 the plots of the relative and total productions rates at the converter and the total UCN production rate for converter volumes of different radii are shown. For a converter with diameter
It can be concluded that the parameters of the UCN in-beam type source described in this section propose a very attractive option since it offers a saturated UCN density at the top of the range of other current projects, which rely on UCN production in vicinity of a strong primary cold neutron source. This kind of UCN source is complementary to in-pile type proposals, which generally possess a much higher UCN production rate, but have to overcome cooling and extraction difficulties. It’s also important to consider the practical advantages of having the converter located remotely from the primary source. By being far removed from strong radiation fields, the required cooling power is significantly reduced, and the UCN source is easily accessible for troubleshooting. Moreover, UCN transportation is limited to short distances, and nuclear licensing procedures are less likely to pose direct obstacles to the project.
6.11.Comparison of the UCN sources
In Table 38 the performances of the different concepts are compared. Overall, we have analyzed several solutions with SD2 in the twister and in the MCB, and different solutions using He-II in the twister, MCB, LBP and in-beam with a NMO system. Some general conclusions are:
-
- High
- Heat-loads are much lower for the He-II placed further away from the spallation target, compared to the other options. This is a clear advantage for a solution based on a He-II source placed at least 2 m away from the spallation target, or in-beam outside the ESS neutron bunker.
- In-source
Table 38
Summary table with the performance of different UCN source concepts. For details, see discussions in the corresponding sections. The source locations are the ones from Fig. 124. The beam values from [236] have been corrected with a 10 % reduction to account for differences in the MCNP models used
| Option | Volume [L] | Heat [Watt] | ||
| SD2 thin slab in twister – location 1 | ||||
| Fig. 128 | 1.81 | 3.1 × 10⁵ | 5.6 × 10⁸ | 760 |
| Fig. 129 | 1.75 | 7.7 × 10⁵ | 1.4 × 10⁹ | 2910 |
| Fig. 130 | 0.38 | 1.3 × 10⁶ | 5.0 × 10⁸ | 560 |
| Fig. 131 | 0.13 | 1.7 × 10⁶ | 2.2 × 10⁸ | 520 |
| Full He-II in twister – location 1 | ||||
| Fig. 133 | 21.9 | 9933 | ||
| Thin He-II in twister w/extraction – location 1 | ||||
| Fig. 134 | 1.25 | 113 | ||
| Thin SD2 + He-II in twister w/extraction – location 1 | ||||
| Fig. 135 | 1.25 | – | 109 | |
| (SD2 Only) | 0.06 | 10 | ||
| (He-II Only) | 1.19 | 99 | ||
| Full SD2 in twister – location 1 | ||||
| Fig. 132 | 48.2 | 39886 | ||
| SD2 thin slab in MCB – location 2 | ||||
| Fig. 140a | 0.91 | 159 | ||
| He-II in MCB – location 2 | ||||
| Fig. 143 | 24.3 | 2160 | 328 | |
| He-II in MCB + 77 K Bi Shield – location 2 | ||||
| Fig. 143 | 24.3 | 1435 | 153 | |
| He-II in MCB + 293.6 K Bi Shield – location 2 | ||||
| Fig. 143 | 24.3 | 1150 | 145 | |
| He-II in LBP – location 4 | ||||
| Fig. 144 | 58 | 590 | 32 | |
| He-II in beam – location 5 | ||||
| Fig. 154 | 114 | 234 | ||
7.Integration of the CN, VCN and UCN sources
7.1.Summary of the main results for CN, VCN and UCN sources
As presented in the previous sections, the HighNESS project explored various potential solutions for CN, VCN, and UCN sources. It’s important to recall that HighNESS had two primary objectives: designing intense neutron sources and shifting the neutron spectrum towards colder energies. These goals can be achieved through several approaches.
In the following discussion, we will first summarize and discuss the results for each type of source individually. Then, we will explore how these different sources can be integrated most efficiently.
The second ESS source is centered around the CN moderator designed in HighNESS. The reference design, utilizing LD2 and a Be filter/reflector, achieves an order-of-magnitude increase in intensity compared to the upper moderator. This source is expected to serve both the NNBAR experiment and various neutron scattering studies. It’s worth noting that this CN source is the only one that has been fully designed. This is not surprising, as it utilizes LD2, a well-established high-intensity cold source with decades of proven experience.
There is, however, an alternative to this design, namely a SD2 moderator, that was discussed in the context of VCN and UCN sources. While preliminary engineering design considerations seem promising for operating such a moderator at least up to 2 MW, further in-depth R&D would be necessary to realize and operate this source in a high-temperature, strong-radiation environment. As a result, implementing this source would only be possible after years of research, therefore the most likely scenario is that this source will be installed at a later stage, likely after the completion of the NNBAR experiment. It can then be concluded that the ESS second source should be based on the LD2 moderator for the first several years of operation.
Unlike the CN source, the VCN moderator presented several promising options for investigation. Our study followed two distinct but interconnected paths: one involved the use of dedicated VCN materials, while the other explored the use of advanced reflectors to enhance VCN source performance. In the dedicated materials category, we considered SD2 and deuterated clathrate hydrates. Additionally, we explored advanced reflectors such as nanodiamonds and MgH2, which could be employed not only with dedicated VCN materials but also with LD2.
Furthermore, a variety of hybrid configurations using both LD2 and SD2 were analyzed, thanks also to the availability of accurate thermal scattering libraries (several of which were calculated in the framework of the HighNESS project). Among the various options, it seems that the most promising ones in the foreseeable future are based on the use of SD2 in conjunction with nanodiamond reflectors, where LD2 is fully displaced as the moderating medium. Deuterated clathrate hydrates have been explored for the first time for the development of a practical VCN source. The first results in HighNESS indicate that larger volumes of such moderating materials would be necessary, compared to SD2. This would probably make them impractical for ESS as primary VCN-source options; nevertheless the potential for the use of this material is established, and investigations should be extended to their use as reflectors, or in conjunction with a primary source.
A full SD2 source is expected to deliver an order-of-magnitude increase in VCN brightness above 40 Å. This result was not anticipated at the outset of the HighNESS project: there were no prior works with VCN sources placed so near a spallation target, and reliable thermal scattering libraries needed development or improvement. This result is therefore very important and could be groundbreaking in the field of neutron scattering, if such a source was realized.
Regarding UCN sources, HighNESS explored a wider range of concepts compared to VCN sources. The project identified various in-pile options both in the initial proposal and during its course. Furthermore, the availability of two proven materials, SD2 and He-II, expanded the array of potential options. To provide a comprehensive overview, the in-pile performances are summarized in Table 38. Additionally, the project conducted an in-depth study of an in-beam option.
7.2.Integration options based on an LD2 primary source
This option was considered the most promising in the HighNESS proposal. The rationale behind this concept involves having a primary high-intensity cold source that can also serve as a source to feed secondary VCN and UCN sources. Consequently, the project dedicated significant effort to explore this possibility, which culminated in a detailed design of the LD2 moderator. This design underwent several phases of neutronic and engineering optimization.
For this option we explored two possibilities for the placement of the secondary source: the MCB as can be seen on Fig. 156, and the LBP.
Fig. 156.
An example of integration of primary cold neutron source made of LD2 and secondary UCN source made of SD2. LD2 is depicted by dark blue color and SD2 is depicted by yellow color. The Be filter on NNBAR opening is depicted by the light blue color.
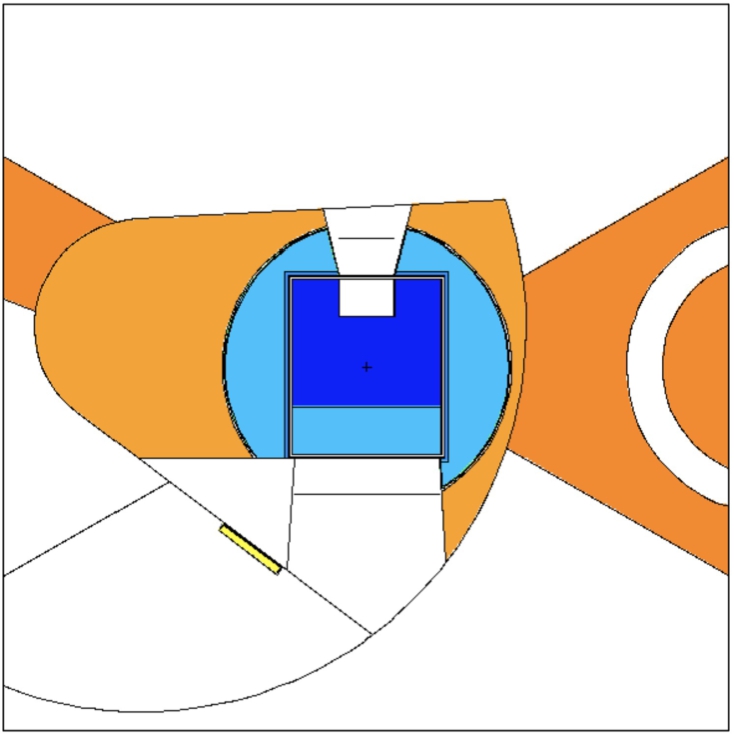
7.2.1.LD2 in twister, UCN in the MCB
For this option, from day one ESS has an intense CN source and a UCN source in the MCB, which has no interference with the operation of NNBAR. Neutronic design of this option has been investigated for UCN sources both based on SD2 and He-II, showing great potential for a high-performance source.
7.2.2.LD2 in twister, followed by UCN in LBP after NNBAR
In this scenario, ESS initially uses the LD2 moderator alone, and the NNBAR experiment is conducted for several years. Once the NNBAR experiment is completed, the LBP can be repurposed for other applications. We have conducted detailed studies of two options for this case: the in-pile option (see Fig. 157) and the in-beam option using nested mirror optics.
Fig. 157.
Integration of the primary cold source made of LD2 depicted by the dark blue color located below the target and secondary UCN source made of He-II depicted by the green color located in the NNBAR beamport. The model is based on the proposal from Serebrov. The red color depicts the ESS target made of tungsten. The dark red color around He-II converter depicts the shielding made of bismuth.
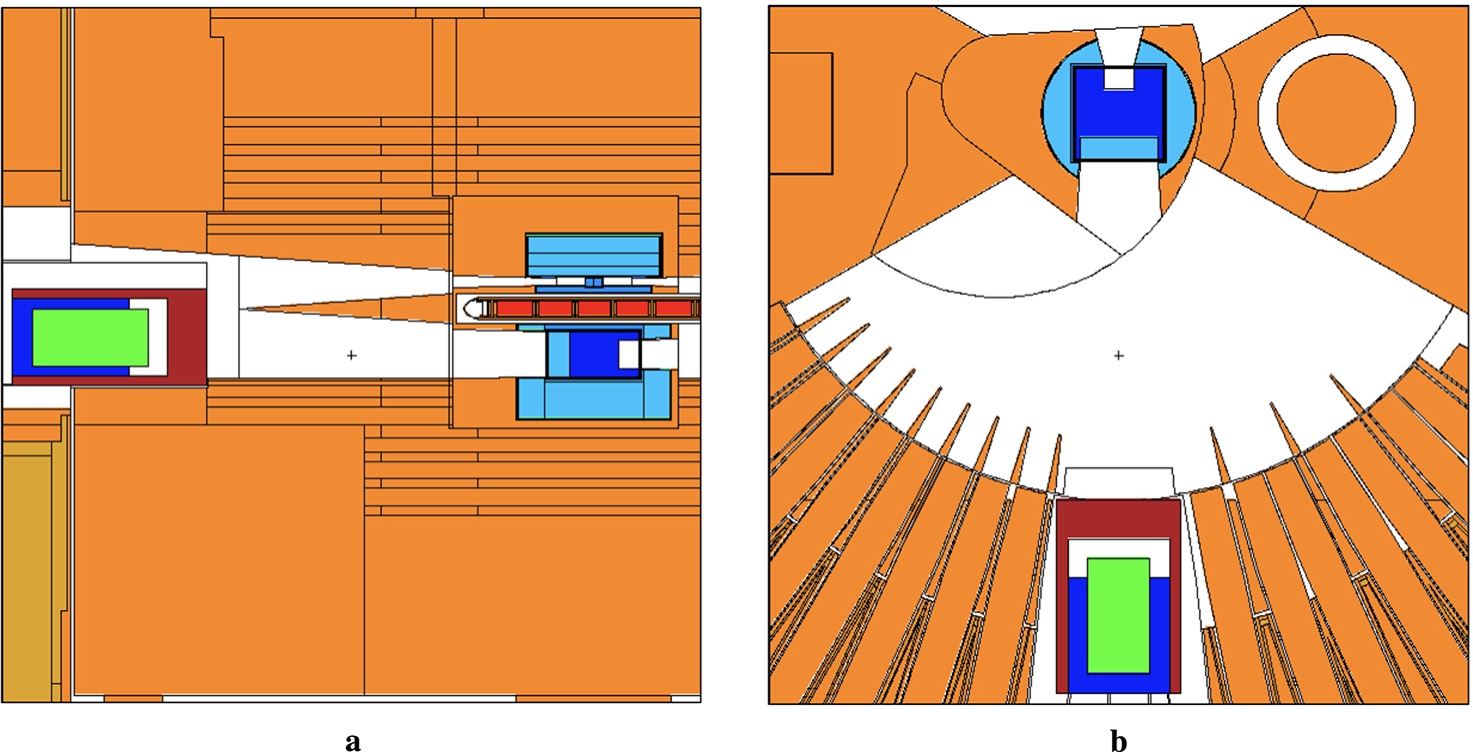
7.2.3.LD2 in twister, UCN in regular beamport
This configuration represents a third option for a secondary UCN source fed by the LD2 moderator, wherein a regular beamport is utilized in order to avoid interfering with the NNBAR experiment. Additionally, in this case the UCN source can be in-pile, inside the monolith, or in-beam. We did not perform a neutronic study of this in-beam option, however its performance can be estimated by either scaling the results for the LBP in-pile solution see Section 7.2.2, or from estimates made at the HighNESS workshop [38].
7.3.Integration option based on an LD2 primary source, upgraded to deliver also VCN and UCN
The options based on using the LD2 moderator as primary source described above do not have a dedicated VCN source. This is due to the fact that, for a VCN source to surpass the performance of an LD2 moderator, in the wavelength range of the VCNs, such a source must necessarily be placed inside the twister, close to the hot spot of neutron production. The only other possibility for a VCN source without using a dedicated material that has been explored in HighNESS is the use of advanced reflectors (NDs) to more efficiently transport the coldest part of the spectrum to an instrument or guide entrance. However, it was found to only have a significant effect at large divergence angles, which is not immediately relevant for the intended applications of the second source. An upgraded LD2 cold source, with the addition of a SD2 slab on one of its extraction sides – or in one of the more complex hybrid options detailed in Section 6.5 – could be a valid alternative for a combined CN/VCN source.
7.4.A full-SD2 source for CN, VCN and UCN?
A VCN source based on a full-SD2 moderator at 5 K was also designed as part of HighNESS. With respect to the LD2 source, an SD2 moderator delivers more neutrons for wavelengths above about 6 Å, while the performance below this range is lower. However, it would provide a slight increase in the FOM of NNBAR, which would make it very interesting as it would be a source of CN, VCN and UCN.
In this scenario, ESS would start with a LD2 moderator located below the target; later the LD2 moderator would be replaced with a SD2 moderator with the same dimensions. This scenario would be possible only if the big cooling challenges to operate a solid deuterium source at high power would be solved; by the time ESS will reach the 5 MW average power, a compromise design solution should probably be adopted, where the moderator is part LD2 and part SD2.
7.5.Comparison of the different scenarios
Based on the above considerations, it is evident that there are several competitive possibilities for providing a second source that complements the upper high-brightness bi-spectral moderator. To select the most promising option among these, several factors need to be taken into account, particularly focusing on performance, operability, and technical feasibility.
Table 39
The different integration scenarios
| Option | CN source | VCN source | UCN source |
| 1 | LD2 | None | None |
| 2 | LD2 | None | SD2 or He-II in MCB |
| 3a | LD2 | None | He-II in beam in regular beamport |
| 4b | LD2 | None | He-II in LBP |
| 5c | LD2 | None | He-II in beam in LBP (NMO) |
| 6d | Hybrid LD2/SD2 | SD2 + ND | SD2 |
| 7 | Hybrid LD2/SD2 | SD2 + ND | He-II in beam |
| 8e | SD2 | SD2 | SD2 |
a: not studied in HighNESS, performance can be estimated from SuperSUN at ILL.
b: installed after NNBAR is completed.
c: UCN in beam, use of NMO; installed after NNBAR is completed.
d: UCN extracted from SD2.
e: full SD2 option.
The list of possible options for an integrated source is in Table 39.
The eight rows in Table 39 could be loosely considered as a possible sequence of possible configurations for the lower moderator plug. Starting from having only the LD2 moderator in the twister, it would be possible to add in parallel a UCN source in the MCB, or a UCN source in beam using a regular beamport other than the LBP.
Different options for UCN sources could be implemented after NNBAR is completed and the LBP is available (options 3 and 4).
To establish a high-intensity VCN source, we have determined that the use of a dedicated material in the twister is essential. However, the development of technology to operate a 5 K moderator in close proximity to the spallation target is required. Additionally, the need to commence operation of the lower moderator with a high-intensity cold moderator suggests that the implementation of a strong VCN source would likely occur at a later stage, potentially after the NNBAR experiment is completed. In terms of performance, a full SD2 moderator is comparable to an LD2 moderator, but it delivers an order of magnitude or more VCNs and is also a proven material for UCN. Therefore, option 8 could potentially represent the final stage of the HighNESS source, where a single SD2 moderator can offer competitive CN fluxes, unprecedented VCN fluxes, and a world-leading UCN source.
8.Neutron scattering instruments for the ESS second source
During the late stages of the design of the European Spallation Source it was realized that reducing the height of the cold hydrogen moderator could significantly increase its brightness, presenting a new opportunity for both moderator and instrument design [8]. The increase in brightness did not fully compensate for the decrease in height, meaning the height would directly control the trade-off between intensity and brightness. The optics for all instruments, which will be served by the newly designed “butterfly” moderator [223], were reoptimized for a range of moderator heights [8], and a choice was made to reduce the height from 10 cm to 3 cm, as this benefited almost all instruments, and in some cases increased the simulated flux on sample with over 150 %.
There were however a few science cases that proved to be more difficult on the smaller moderator, for example imaging, which benefits from a larger moderator due to better homogeneity and field of view (FoV). Some types of instruments can tolerate a large divergence, for example backscattering instruments or time-of-flight spectrometers, and their performance is more closely related to the intensity of the moderator than its brightness. For these reasons it was natural for the HighNESS project to investigate larger moderators to complement the “butterfly” moderator with its small height. The “butterfly” moderator has a bispectral design with both a thermal water part and cold hydrogen part [223]. On the other hand, the HighNESS, larger moderator, focuses on the cold side, and provides a colder spectrum which can potentially benefit small-angle neutron scattering (SANS), imaging and spin-echo instruments.
In order to optimize the moderator proposed by HighNESS, a number of instrument concepts that would utilize this new moderator were considered along with suitable figure-of-merit (FOM) expressions. This allowed an iterative approach for moderator design. Each new design could be evaluated using these instrument concepts to assess the performance of the moderator, considering not only the flux at its surface but also its impact on the performance of the instruments reliant on the moderator.
In this section we share the final design of the instruments along with their performance for each of the 4 proposed moderator sizes, providing the necessary data to choose the best of the 4 options. The considered instruments were two SANS instruments, one using conventional optics and the other using focusing optics, as well as an imaging instrument. The work on a spin-echo instrument using focusing optics was not finished within the time constraints of the project but shows promising results and should be further developed in future studies. Each conceptual instrument is compared with the relevant ESS instruments under construction to ensure they add new capabilities and avoid replicating existing capabilities in the instrument suite, to as high a degree as possible.
As described previously, the HighNESS project has also investigated a solid deuterium moderator which would have significantly better performance in the VCN wavelength range. When considering instrumentation for such a source, it is important to have optical tools for counteracting the effects of gravity. The last part of this section investigates the use of prisms in combination with focusing optics to create achromatic optics, which will be an essential tool for future VCN-neutron scattering instruments.
8.1.Moderator alternatives
The moderator optimization process arrived at a large liquid deuterium vessel with different sizes of exits towards the condensed matter instruments investigated here. The final four candidates were the following sizes,
In Fig. 158 the intensity and brightness of these four moderators are plotted along with the corresponding values for the cold part of the upper “butterfly” moderator. While the smaller openings do have a higher brightness, this effect is much smaller for the deuterium moderator than the hydrogen-based “butterfly”, meaning that differences in brightness are less pronounced. At wavelengths larger than 5 Å the brightness of the larger moderators is very similar to that of the “butterfly”, while the two smaller moderators have slightly higher brightness than the upper moderator. With the similar brightness, the larger moderators (>5 × 5 cm2) have a significantly larger neutron intensity when compared to the “butterfly” moderator.
Fig. 158.
Spectra of the proposed lower liquid deuterium moderators, in terms of (a) neutron intensity and (b) neutron brightness, measured at 2 m distance, over the beam-port. The corresponding cold spectrum of the upper “butterfly” moderator is plotted over for comparison.
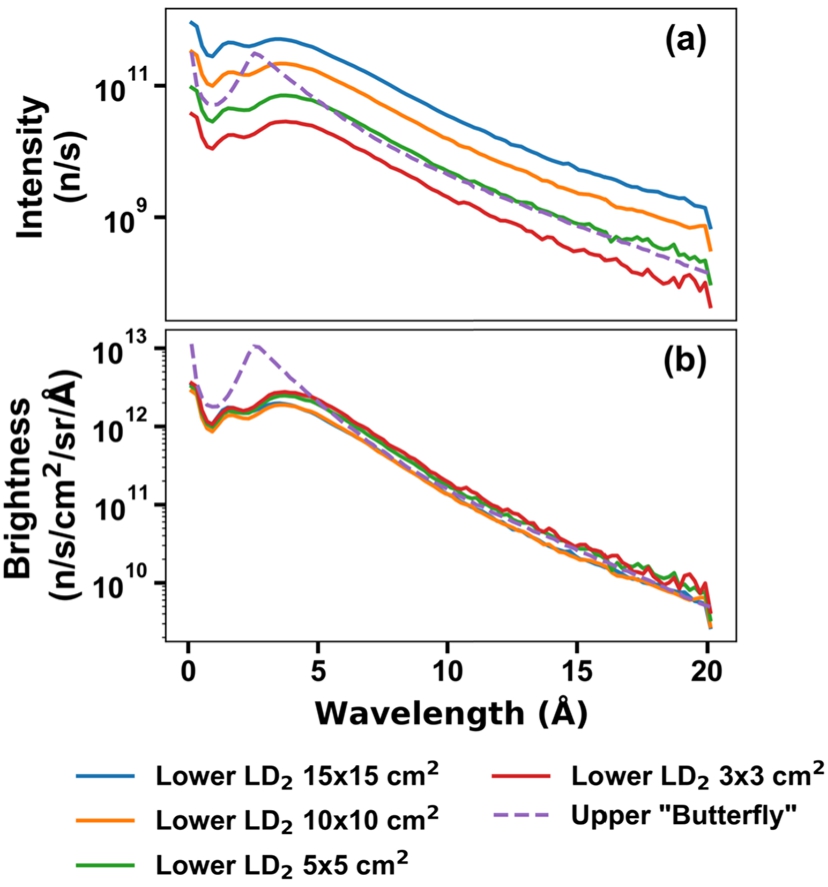
8.2.Optimization of small-angle neutron scattering instruments
The SANS science case for a larger moderator would naturally focus on larger samples, though the large source can also be utilized by focusing optics. As such, two different designs were investigated, a conventional SANS named ConvSANS and a Wolter optics-based SANS instrument named WOF-SANS. There are two SANS instruments under construction at the ESS, the short-length LoKI and the medium-length SKADI. For ConvSANS to be complementary to these instruments, it is chosen to increase its length to achieve better resolution and smaller minimum Q. The WOF-SANS instrument uses focusing optics to benefit from the large moderator area and due to the focusing properties can avoid a long collimation section, resulting in a shorter instrument with greater bandwidth, while maintaining high resolution for even smaller Q values.
Fig. 159.
Overview of ConvSANS instrument geometry.
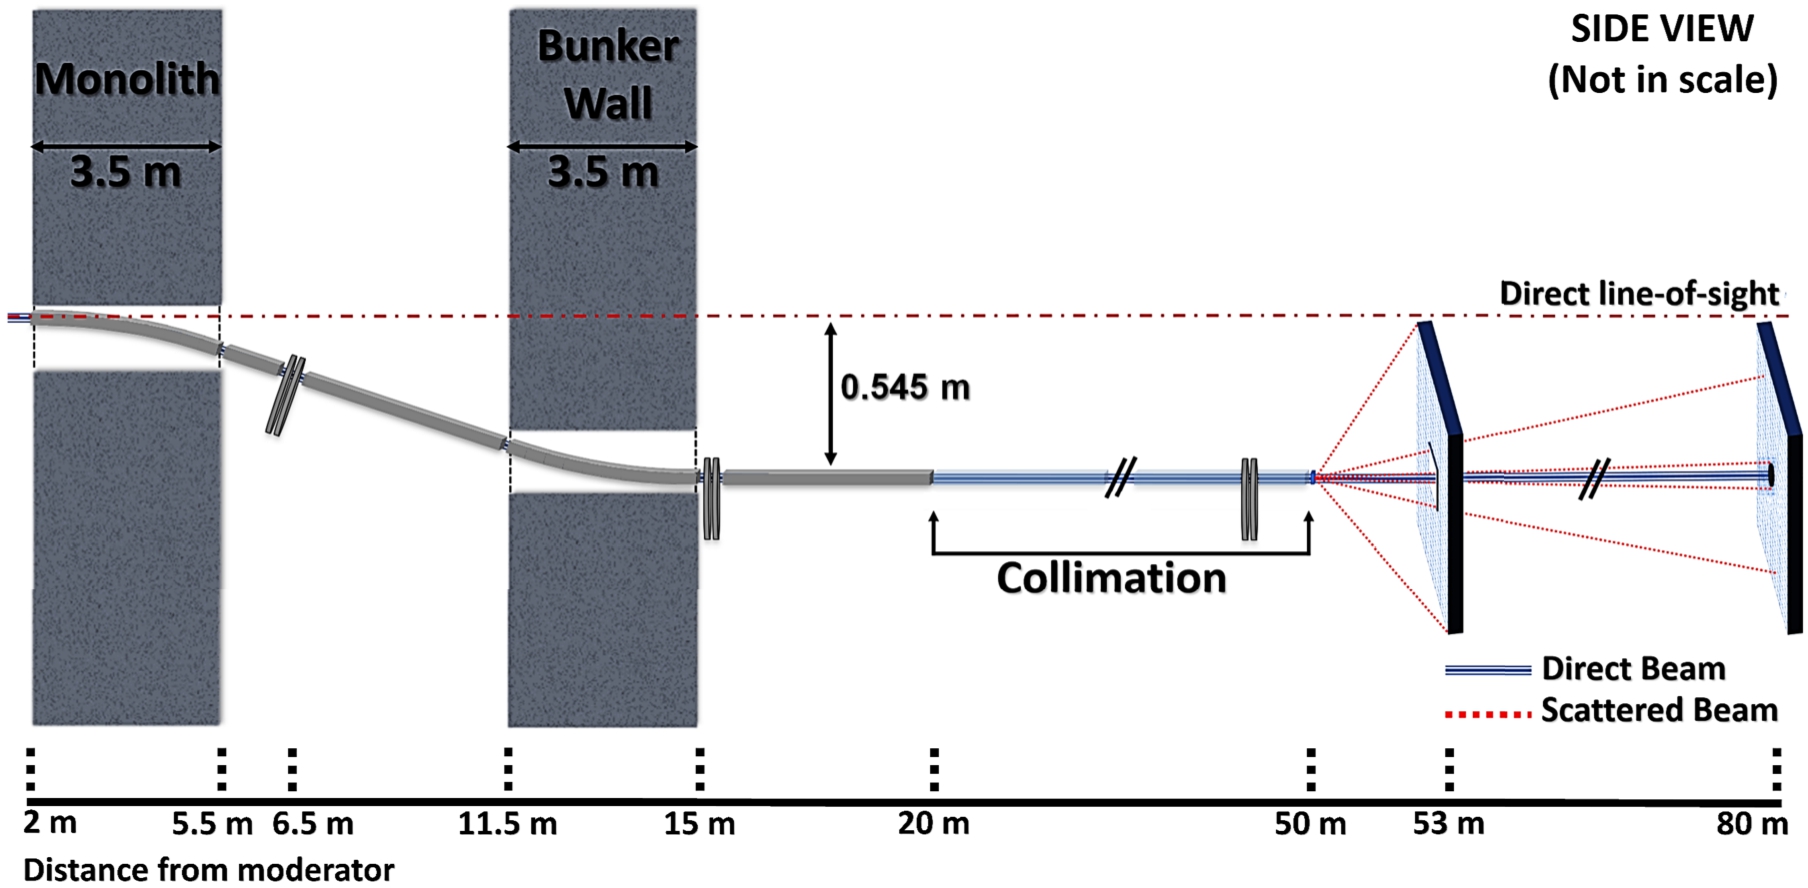
8.2.1.Conventional SANS
The Conventional SANS (ConvSANS) conceptual design presented here is based on a typical pinhole collimation geometry. A schematic of the instrument is given in Fig. 159. The current design consists of a single block 30 m long collimation, thus having, for initial assessment, a constant collimation distance. In a practical realization the collimation will consist of sections to enable to relax resolution and adapt to different sample sizes. Currently, two fixed-position detectors are placed at 3 m (wide angles) and 30 m (small angles) from the sample, respectively. The combination of the long collimation with the two detector positions, will allow for a large Q-range coverage, allowing at the same time to maintain high Q resolution for large sample sizes. The relatively long total instrument length, set at 80 m, leads to good wavelength resolution, while the long collimation provides high angular resolution, which can be traded for large samples and thus high intensity. The total length of the instrument limits the wavelength bandwidth to about 3.5 Å when operating in the standard 14 Hz mode, however, this can be extended to about 7.0 Å in the pulse skipping 7 Hz mode of operation.
The present instrument design assumes a constant guide size of 6 × 6 cm2 throughout the instrument. The start of the neutron guide is at 2 m from the moderator surface, at the beginning of the monolith wall. The instrument makes use of a pair of benders located in the monolith and the bunker wall, respectively, that are used to avoid direct line-of-sight to the moderator and act as a short wavelength cut-off filter. The benders are designed with a radius of curvature of 61.25 m and a length of 3.5 m. The use of the bender pair provides for twice out of line-of-sight curvature to minimize the intrinsic background, and offsets the beamline down vertically by about 0.55 m. In the in-between space of the monolith wall and the bunker wall, two tilted straight neutron guides, 1 m and 5 m in length, respectively, connect the two benders, with a small gap between them reserved for chopper installation. After the second bender, a straight guide of 5 m in length brings the beam back into horizontal position and connects the bender with the collimation system. After initial Monte Carlo investigations, all neutron guides and benders are coated with m = 4 supermirrors, however, this should be subjected to further optimization. The 30 m collimator starts at 20 m from the moderator, where a first aperture, hereafter referred to as source aperture (D1), is located, and ends at 50 m from the moderator, where the sample aperture (D2) is located.
Wavelength selection and frame overlap prevention is performed using two double-disc choppers. A bandwidth double-disk chopper is placed in the in-bunker section of the instrument, between the two tilted neutron guides, at 6.5 m from the moderator. An additional pair of choppers is placed right after the bunker wall, at 15 m, downstream of the second bender, to suppress frame overlap. A third pair of choppers can also be added further downstream, at 40 m within the collimation section, to further suppress frame overlap.
The detector configuration employed for the current set-up is based on a “window-frame” design (see Fig. 159). The front detector is at a fixed position, 53 m from the moderator and 3 m from the sample position. It has a 3 × 3 m2 surface area with a 0.327 × 0.327 m2 window opening at the center. The rear detector, also at fixed position, is located at 80 m from the moderator and 30 m from the sample position, with a 3 × 3 m2 surface area. In the current design, there is no specific detector technology considered (e.g., 3He gas detector or 10B-based detector).
While the instrument has flexible collimation configurations for different samples, it was chosen to investigate the neutron intensity on sample for the configuration that accommodates the largest possible sample, here a source aperture of 6 cm and a sample aperture of 6 cm. The spectrum on the sample with the choppers open (full spectrum) can be seen in Fig. 160. In this configuration the performance is similar for all moderators, with only the smallest delivering a distinctly lower intensity. Thus, for configurations intended for larger samples and moderate resolution, the benefit from the larger moderators increases, though it is important to note that even for higher resolution setups, the largest moderator still achieves the highest intensity.
Fig. 160.
Intensity on sample for ConvSANS instrument for each proposed moderator size measured over the full wavelength range.
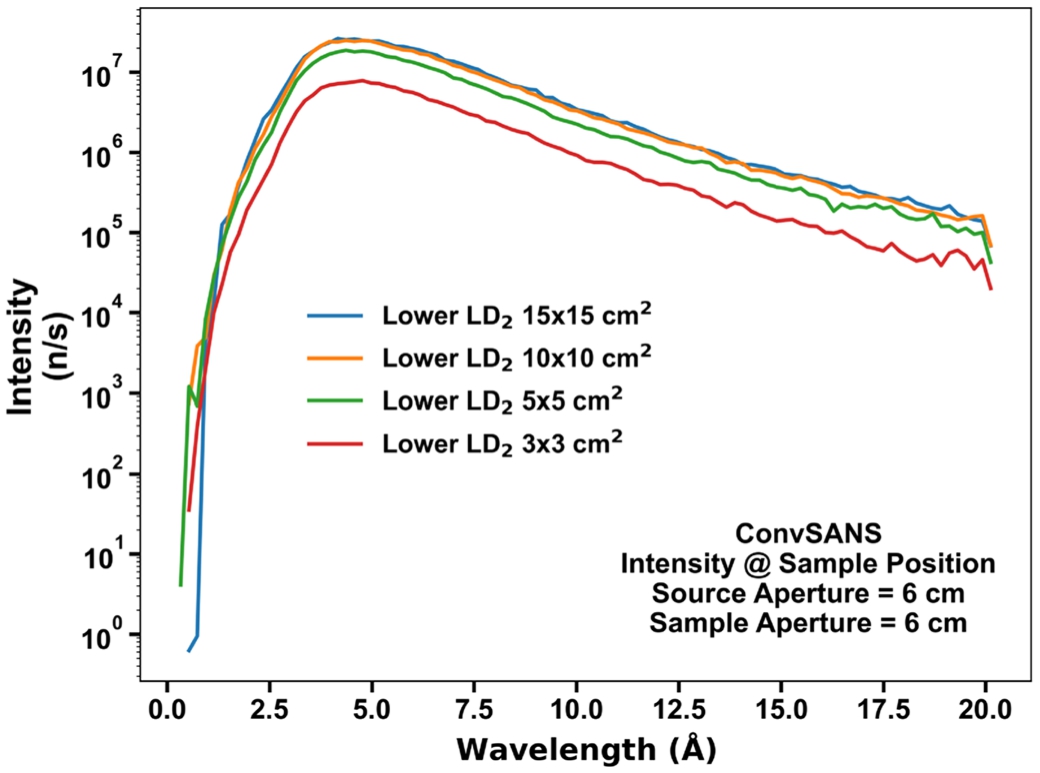
8.2.2.SANS with Wolter focusing optics
The WOF-SANS design makes use of a pair of reflective Type I Wolter optics [210] to take advantage of the large moderator surface and thus increase the neutron intensity at the sample position. The concept of such a focusing SANS instrument is described in [129]. A schematic of the current instrument design can be seen in Fig. 161. The total length of the instrument is 29.5 m defining a wavelength bandwidth of 9.5 Å when operating with the 14 Hz source frequency and can be extended to about 19 Å at pulse skipping mode.
Fig. 161.
Overview of WOF-SANS instrument geometry. L1 is the distance from the pinhole to the sample, L2 the one from the sample to the detector.
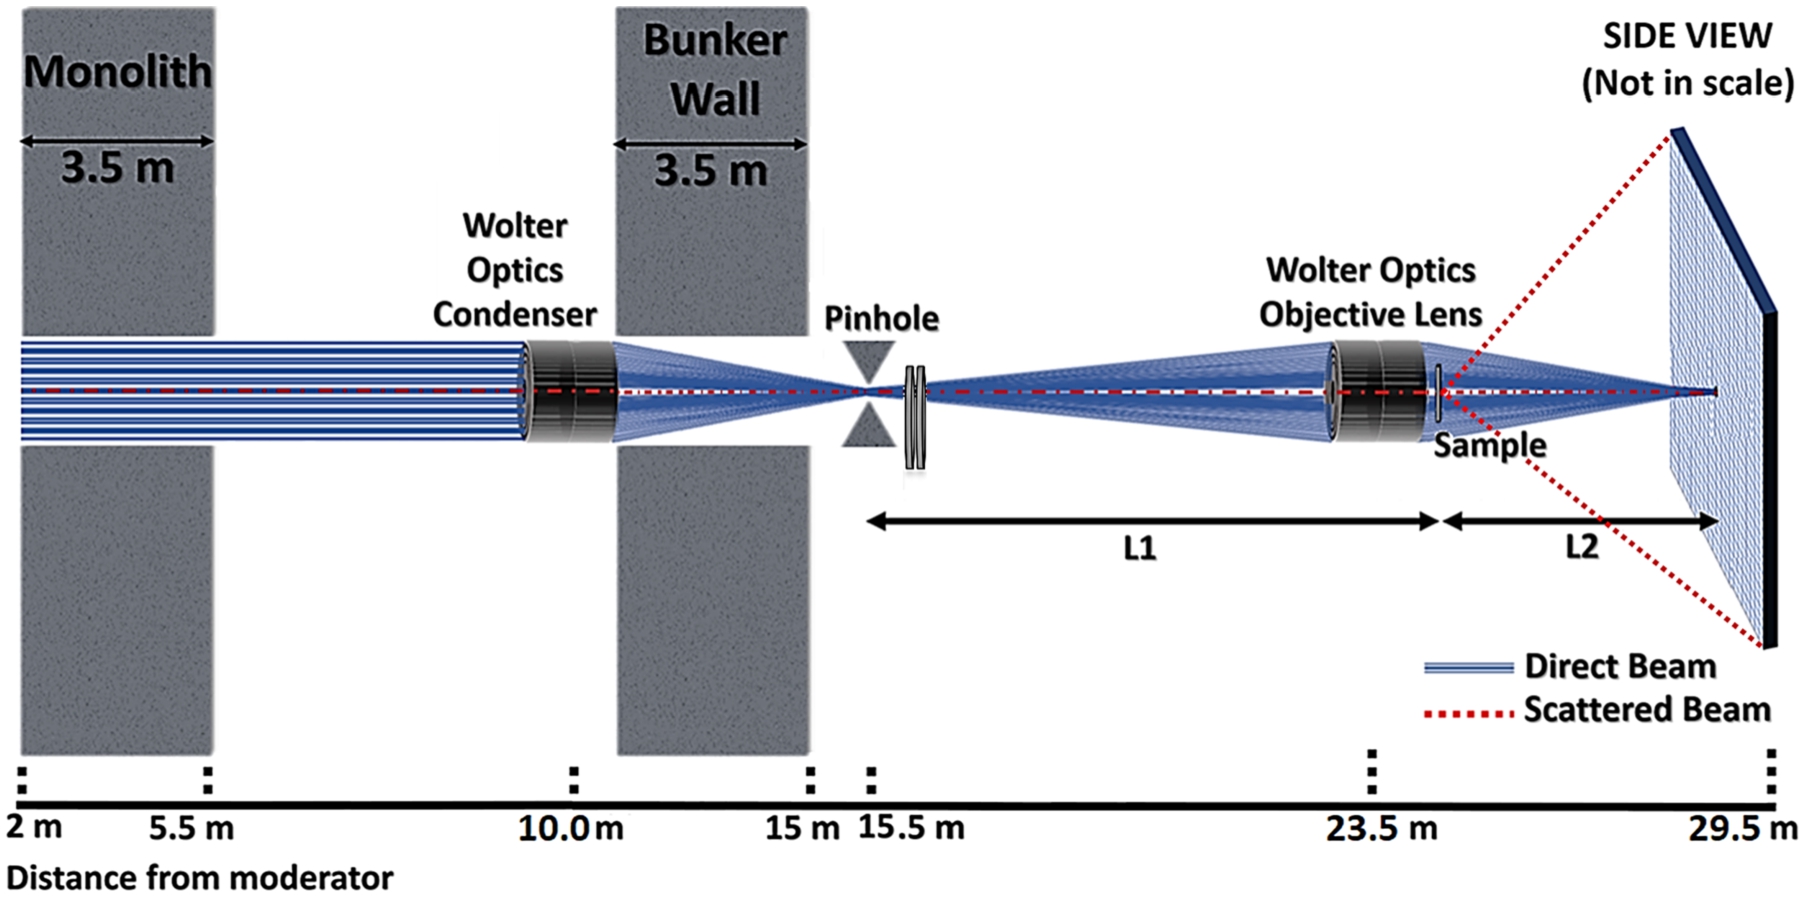
The first Wolter optics system is used as a condenser lens, and it is located in the in-bunker section of the instrument, 10 m from the moderator (considering its middle point). It is designed accordingly to have the highest possible throughput. For an initial assessment, it consists of 28 nested paired parabolic and hyperbolic (P-H) sections, currently 1.3 m and 1.0 m in length, respectively (2.3 m total length), with a total radius of 7.5 cm. The innermost radius of 1.0 cm is not covered and might be filled with an absorber. The focal length of the condenser is 5.5 m thus its focal point is 15.5 m from the moderator. The use of parabolic mirrors as the first point of contact for the incoming beam, implies that predominantly the lowest divergence component of the phase space will be focused. The mirrors are coated, for initial assessment, with supermirror coating of m = 3.0. Lower coating quality is anticipated to suffice, as highly divergent portions of the beam, similar to the conventional SANS approach, will not be taken into account. Instead, a larger area of the moderator will be considered. An aperture of 4 mm in diameter is placed downstream of the bunker wall, at the focal point of the condenser, to suppress any out-of-focus rays and any neutrons that pass through the condenser without reflecting. This position will be heavily shielded and the aperture will be designed to deal with such a situation and to shield the large diameter beam of background radiation.
The second Wolter optics system is used as an objective lens and it is located 23.5 m from the moderator (considering its middle point). Its focal lengths, aperture-to-objective and objective-to-detector, are 8 m and 6 m, respectively, resulting in a (de)magnification M = 0.75. As such, the beam spot size on the detector center is expected to be 3 mm in diameter. The objective lens consists of 25 nested paired elliptical and hyperbolic (E-H) sections, 0.9 m and 0.82 m in length, respectively (1.72 m total length). Its maximum radius is 10 cm, allowing it to collect the full divergence coming from the aperture (i.e., from the condenser). The E-H mirrors are also coated supermirror of m = 3.0, however, this is subject to optimization. The sample is placed between the objective lens and the detector. Different positions are possible with corresponding impact on illuminated sample size (beam size), Q-range, and resolution. A bandwidth double-disk chopper is placed right after the bunker wall and the slit of the focusing position, at 16 m. An additional pair of choppers can be placed before the objective lens to suppress frame overlap. The position sensitive detector is considered to have a surface area of 3 × 3 m2 and is placed at a fixed position matching the focal point of the E-H optics, at 29.5 m from the moderator. As in the case of ConvSANS there is no assumption of specific detector technology.
Fig. 162.
Intensity on sample for WOF-SANS instrument for each proposed moderator size, measured over the full cross section of the objective lens and over the full wavelength range.
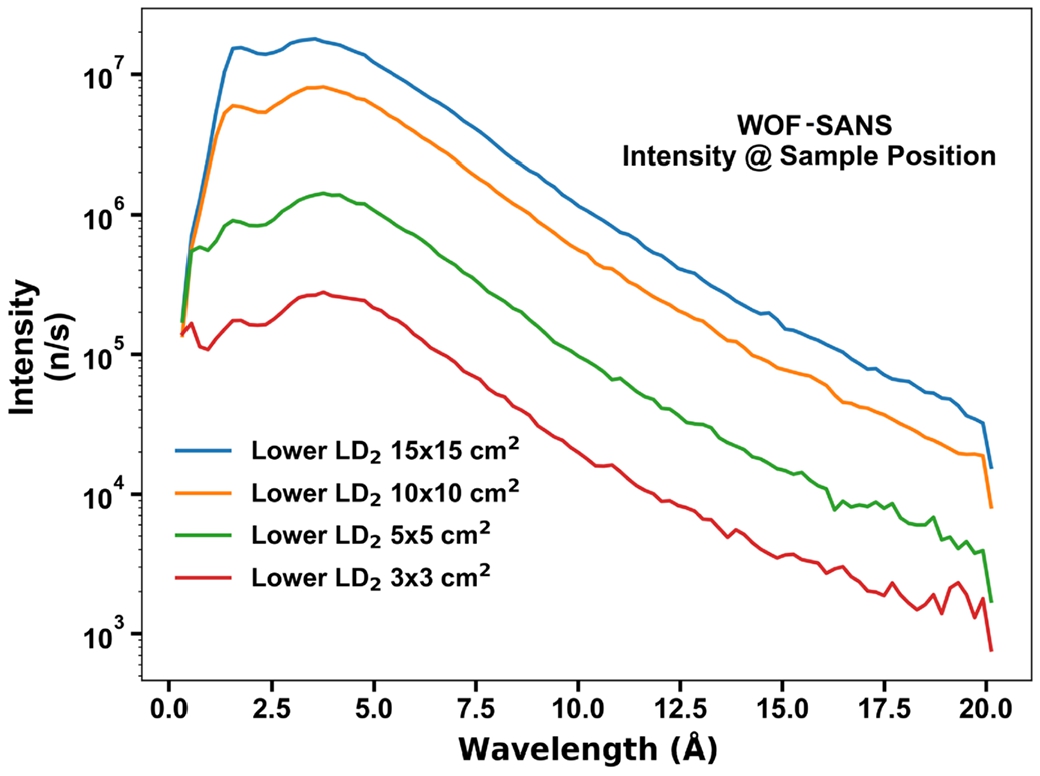
The spectrum on the detector position with all choppers open can be seen in Fig. 162. Due to the focusing of the instrument, this is equivalent to the intensity at the sample regardless of position (when neglecting losses from air scattering). The WOF-SANS instrument shows higher sensitivity to the size of the moderator, attributed to the use of a parabolic section that performs better with larger sources.
8.2.3.FOM definition
In general, determining the FOM of a SANS instrument can be complex since there are many parameters coming into play and different sets of samples and/or configurations need to be taken into account. For our SANS instruments, at this early stage of conceptual design, the useful parameters that can be considered are the intensities at the sample position (
With the above definition we see that the FOM is proportional to the intensity, as well as the ratio of
8.2.4.Performance of conceptual SANS instruments
With this definition of the FOM, both the SANS instruments and moderator candidates can now be directly compared. To illustrate the performance of the instruments as a function of moderator size, the FOM at the same maximum usable sample size of 6 cm is plotted for each moderator in Fig. 163, which clearly shows that both SANS instrument concepts perform best at the largest source.
Fig. 163.
FOM at fixed sample size (maximum considered) as function of moderator size.
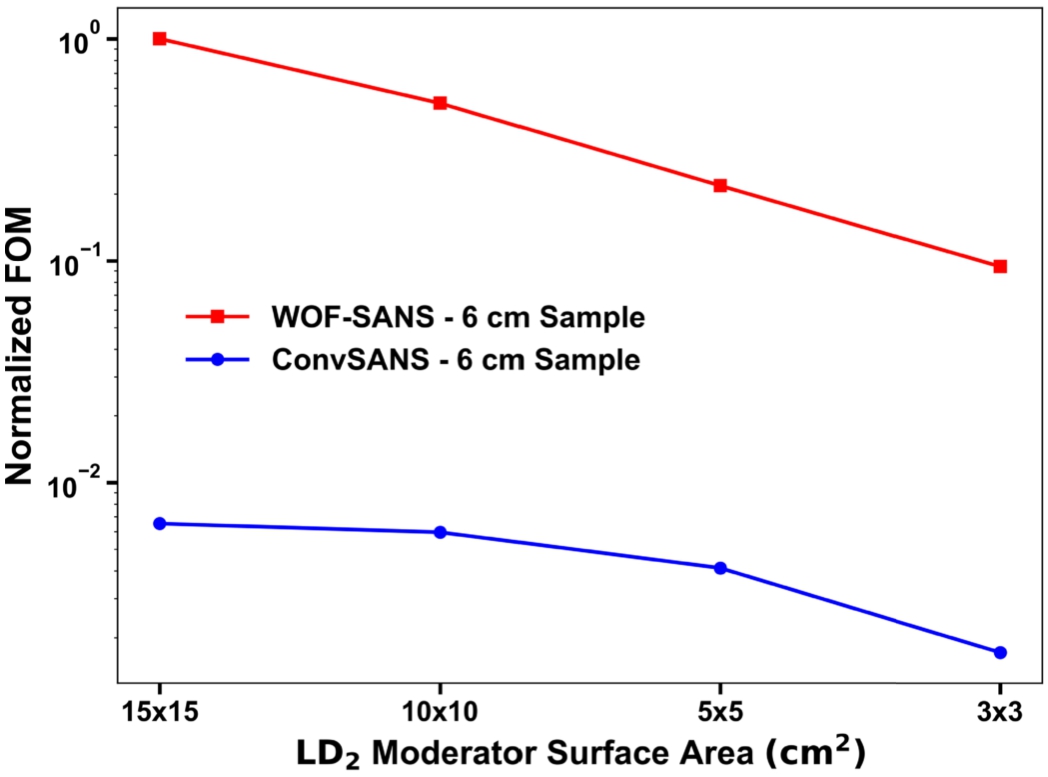
8.2.5.Performance comparison to ESS instruments
In addition to comparing the two conceptual SANS instruments with each other for each proposed moderator, it is important to view their performance in the context of the SANS instruments already under construction at the ESS. In this section, the 15 × 15 cm2 moderator has been selected, while LoKI and SKADI were simulated using the upper “butterfly” moderator and their latest McStas instrument files. Figure 164a depicts
Fig. 164.
(A) calculated
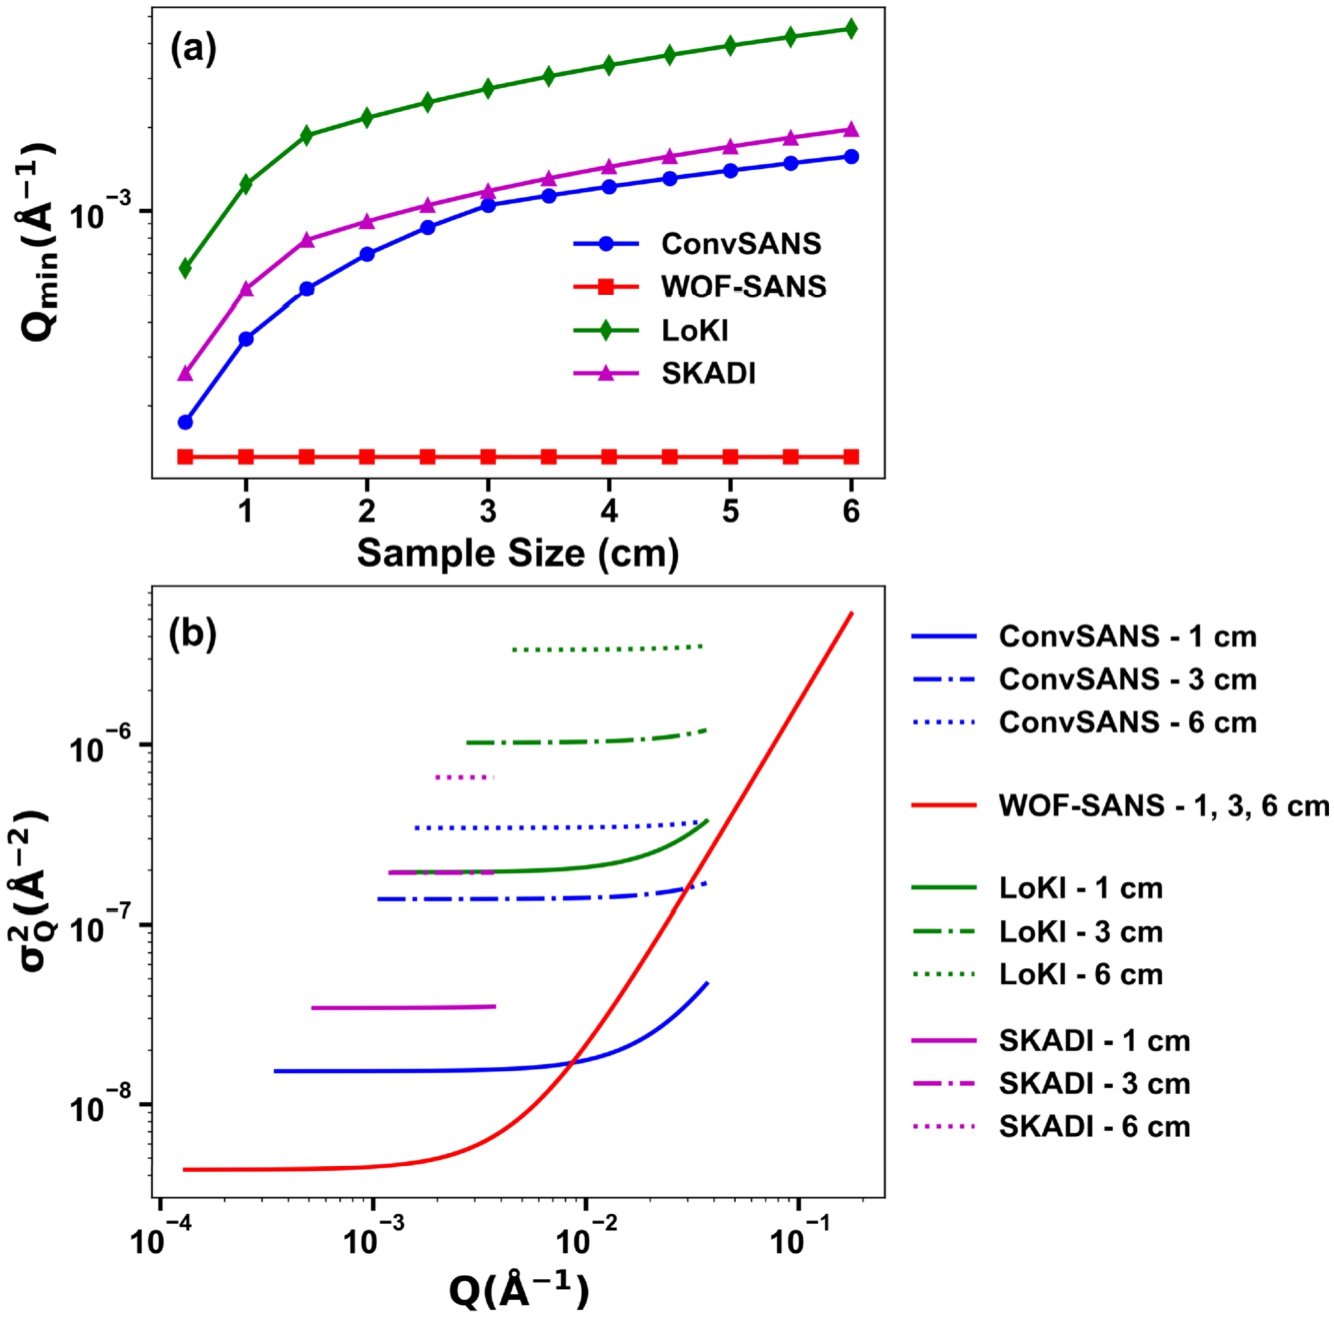
From our calculations, the WOF-SANS instrument exhibits the lowest
The instruments are also compared in terms of neutron intensity on sample and FOM when considering their rearmost detector configuration, with the results given in Fig. 165. Compared to the ESS instruments LOKI and SKADI, the ConvSANS instrument sacrifices some flux especially at the smallest sample sizes to achieve the better resolution characteristics already discussed. The WOF-SANS instrument, overall offers relatively high intensity when considering the full optics cross-section. However, to maintain such intensity, the samples need to move along the beam with smaller samples positioned closer to the detector deteriorating both
Fig. 165.
(A) total neutron intensity at the sample position as a function of sample size for ConvSANS, WOF-SANS, LoKI, and SKADI. (B) calculated normalized FOM of WOF-SANS, ConvSANS, LoKI, and SKADI as a function of sample size.
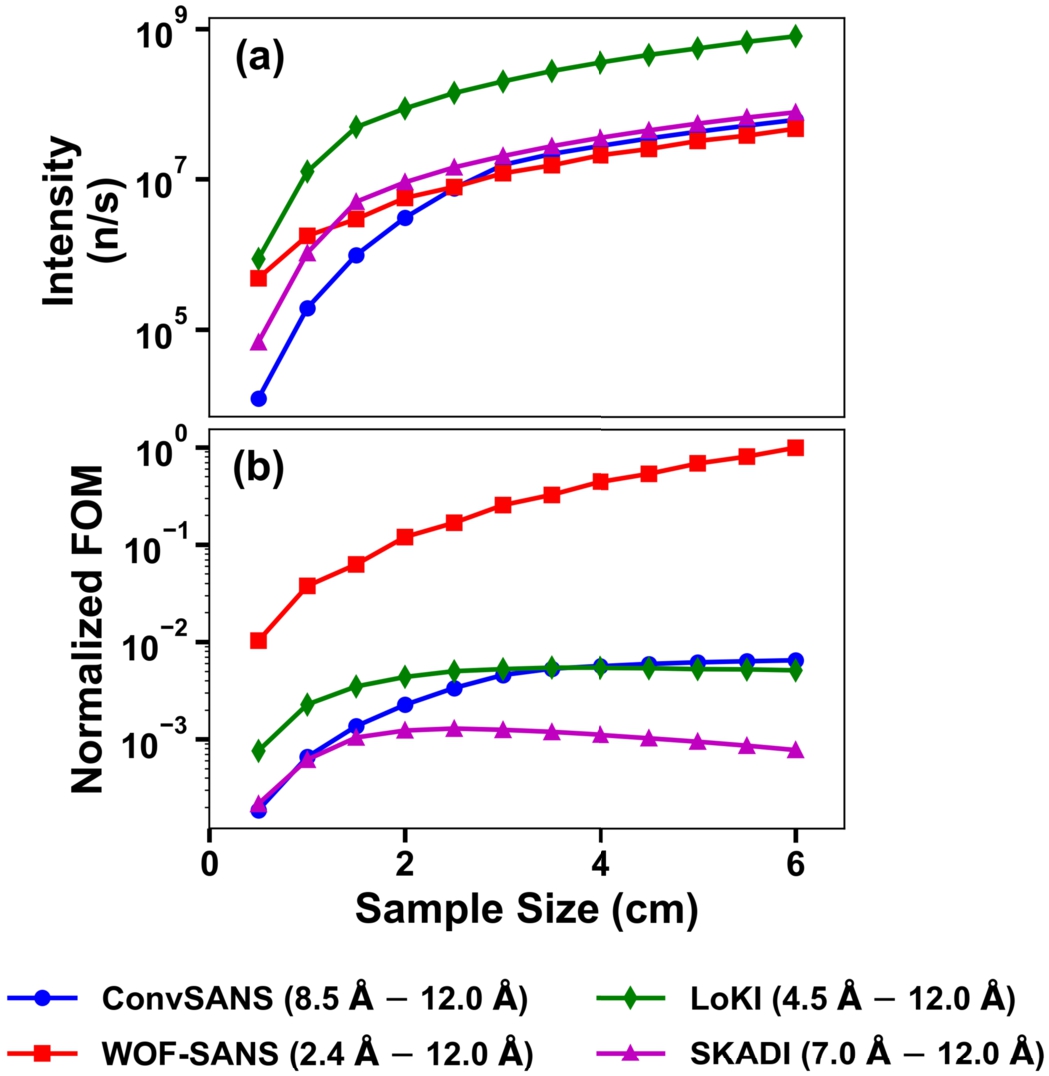
8.2.6.SANS conclusion
It was shown that both conceptual SANS instruments, ConvSANS and WOF-SANS, perform best on the largest 15 × 15 cm2 moderator. Using this moderator, the ConvSANS instrument was able to fit into the suite of ESS SANS instruments by extending the minimum Q and providing a slightly better resolution at the cost of some flux. The WOF-SANS with its different mode of operation, when also considering Q ranges and corresponding resolution, was shown to perform significantly better than ESS instruments under construction.
8.3.Optimization of imaging instrument
The ESS instrument suite already has an imaging instrument under construction, namely ODIN [7], which uses a complex chopper system and a neutron guide to achieve enhanced wavelength resolutions necessary for Bragg edge analyses and other wavelength resolved imaging methods. Not all experiments will require these capabilities, and thus ODIN would be well complimented by a simple pinhole based imaging instrument that would exploit the larger and more homogeneous FoV from a larger moderator, and e.g., very moderate wavelength resolution. Given the known positions of the monolith and bunker, as well as the requirement for a wide FoV, it was determined that the pinhole should be located 8 meters from the moderator, with the detector situated up to 24 meters away. The geometry can be seen in Fig. 166. With the maximum distance between the detector and the pinhole being twice that between the pinhole and the moderator, the anticipated maximum FoV will be twice the width and height of the moderator.
Fig. 166.
Overview of the imaging instrument geometry.
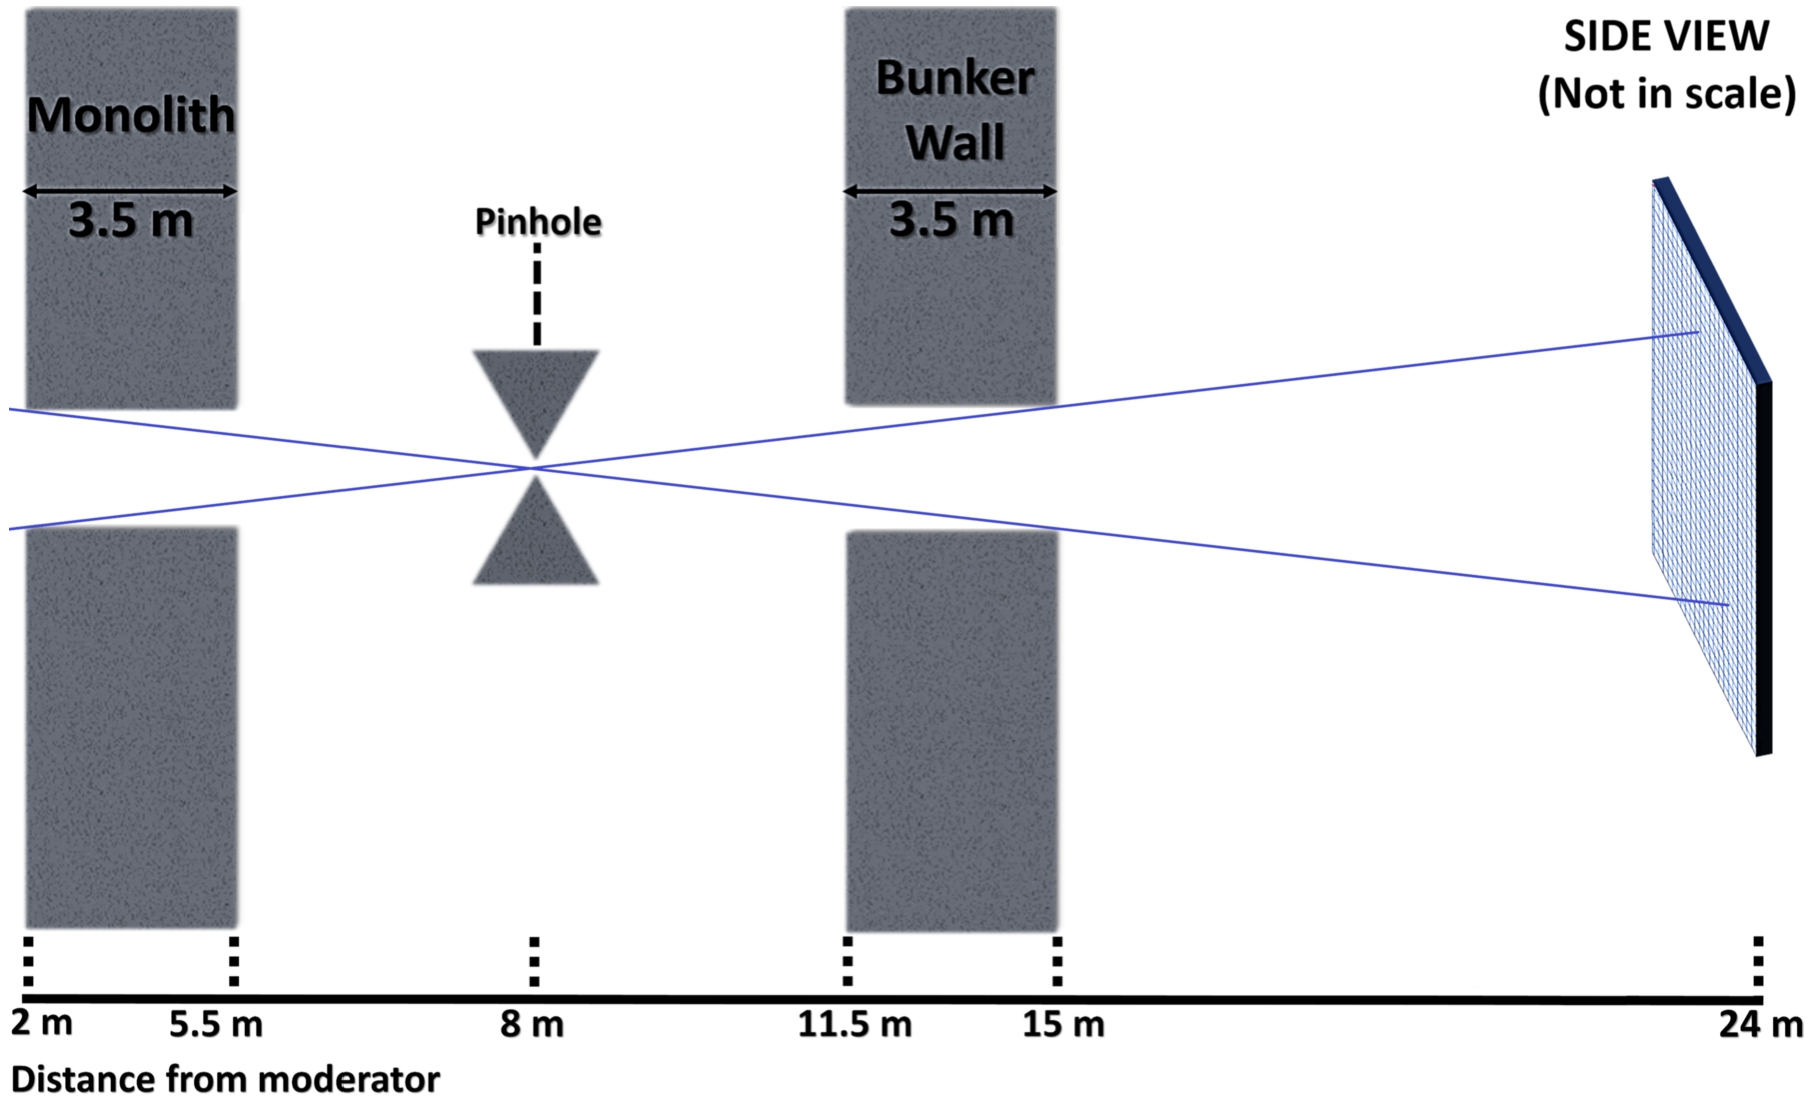
The spectrum reaching the detector with a pinhole of 2 × 2 cm2 can be seen in Fig. 167 and scales with the moderator intensity as expected. In this work square pinholes are used over the usual circular counterpart in order to allow comparisons when using the moderator itself as a pinhole.
Fig. 167.
Intensity on detector for the imaging instrument when using a 2 × 2 cm2 pinhole with each of the different proposed moderators.
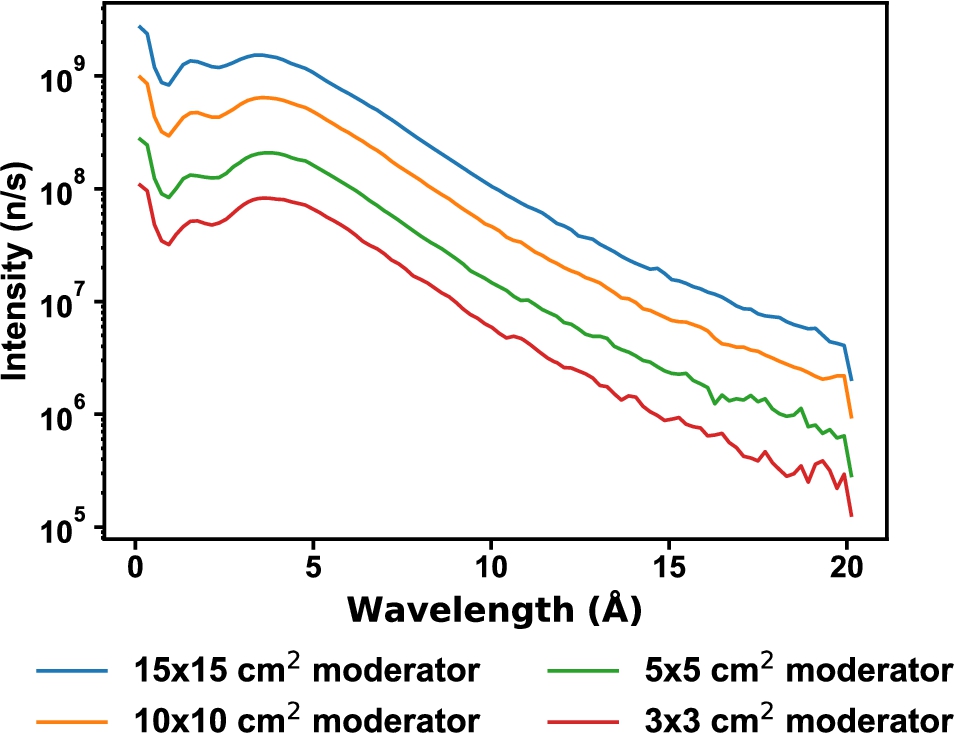
8.3.1.FOM definition
For an imaging instrument there are several factors that should contribute to its FOM. In the following, intensity refers to the intensity on the detector, L to the distance from pinhole to detector and D to the size of the pinhole.
Intensity: The FOM should increase when the required exposure time is decreased, which is here determined by the intensity in the pixel on the detector with the lowest intensity within the defined FoV.
FoV: the FOM would be higher for an instrument that can provide a larger FoV, so the FOM is multiplied by the FoV area. Unless otherwise specified, the FoV is found as the largest square area centered on the detector where no pixel is less than 75% of the maximum intensity.
Collimation: the FOM should be normalized to the collimation provided by the instrument, changing the
Evenness: The FOM should decrease as the image becomes less flat. Here, we assess flatness using the standard deviation of intensity in the detector pixels within the defined FoV. This assessment is represented as the square root of the inverse of the standard deviation.
8.3.2.Imaging instrument performance
The imaging instrument can adjust its collimation through changes to the pinhole and the position of the sample/detector along the beam outside the bunker (on an optical bench). For the purpose of this report we have investigated four different configurations, all of which at the outmost measurement position at 24 m, as shown in Table 40.
Table 40
Investigated distance and pinhole configurations for imaging instrument
| L (cm) pinhole detector distance | D (cm) pinhole size | |
| 1600 cm | 1 cm | 1600 |
| 1600 cm | 2 cm | 800 |
| 1600 cm | 3 cm | 533 |
| 1600 cm | 5 cm | 320 |
If we assume that the optimal FoV for each configuration is twice the dimensions of the viewed moderator, we can evaluate the FOM for each moderator at each configuration. The result is shown in Fig. 168. Generally, the larger moderators perform better, and this trend is stronger at high collimation ratios than at low.
Fig. 168.
FOM for the imaging instrument with different pinhole sizes resulting in different
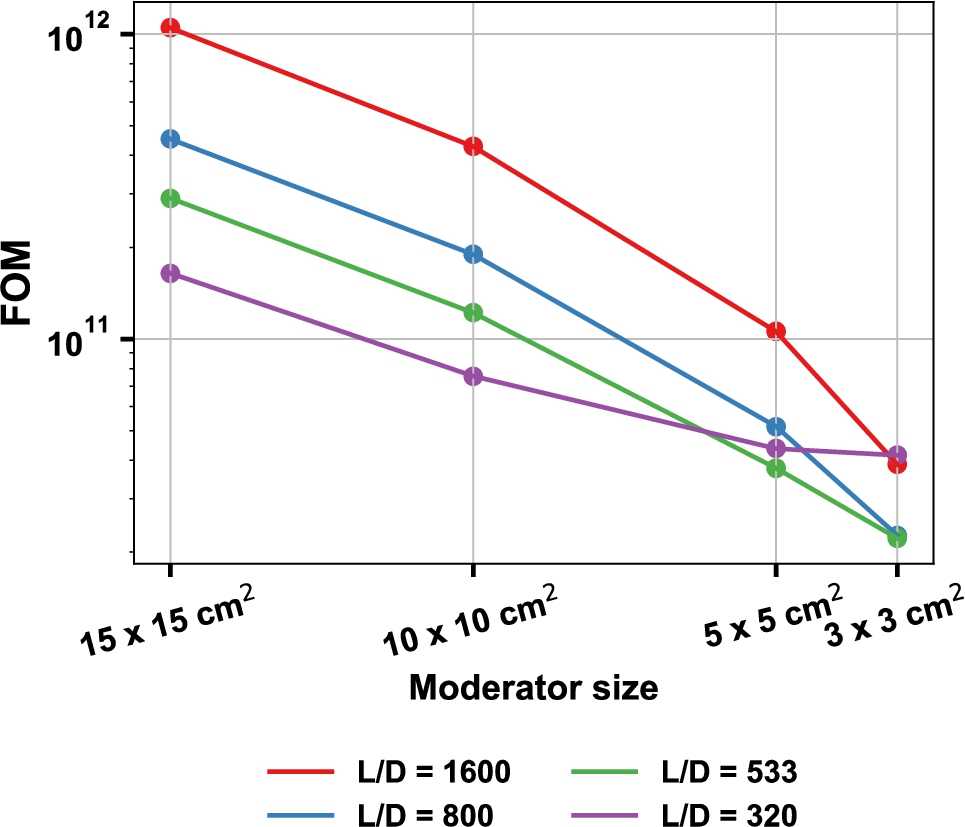
Since the two smallest moderators correspond directly to the pinholes used for the two lowest
Table 41
Configurations of imaging instrument that use the moderator itself as pinhole definition when possible
| Moderator | ||||
| Size (cm2) | D = 5 × 5 cm2 | D = 3 × 3 cm2 | D = 2 × 2 cm2 | D = 1 × 1 cm2 |
| 15 × 15 | Pinhole 8 m from moderator Detector 24 m from moderator L = 16 m | |||
| 10 × 10 | ||||
| 5 × 5 | No pinhole Detector 16 m from moderator L = 16 m | |||
| 3 × 3 | No pinhole, D = 3 × 3 cm2 Detector 9.6 m from moderator L = 9.6 m | No pinhole Detector 16 m from moderator L = 16 m | ||
The configurations using a 16 m distance from the moderator would be limited by restrictions in allowed size of gaps in the bunker wall, which ends 15 m from the moderator. Here we assume that these gaps can be increased by additional shielding around the instrument cave. The lowest
Fig. 169.
FOM for the imaging instrument with different pinhole sizes resulting in different
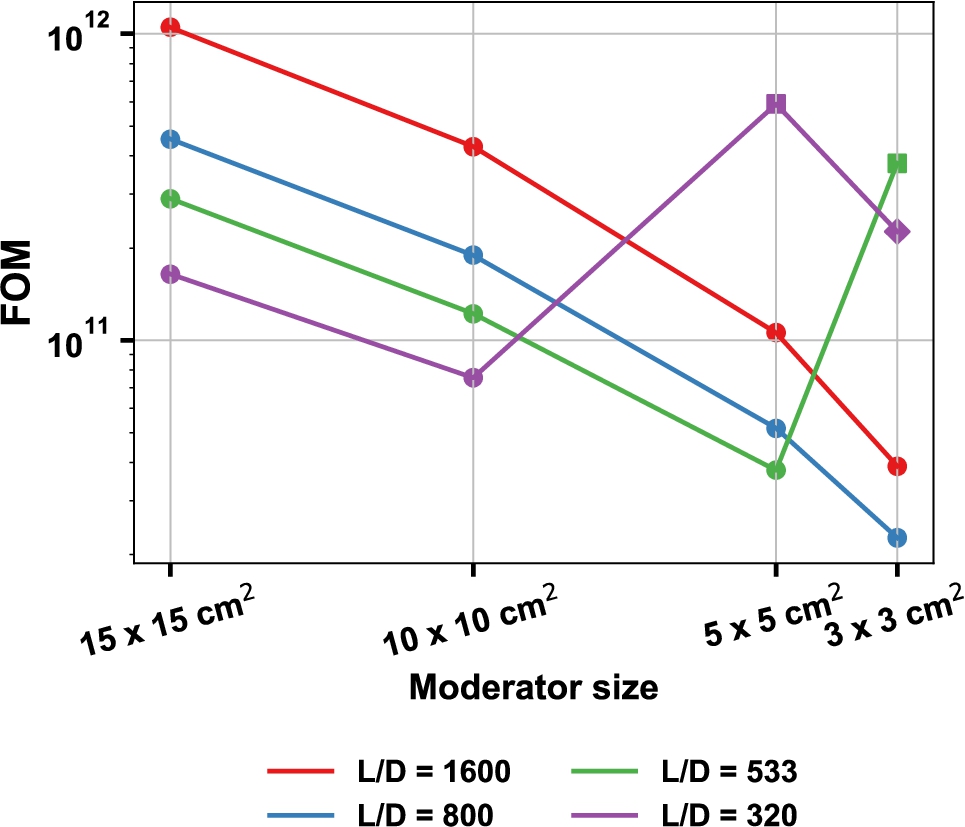
Fig. 170.
Example of FOM calculation for all moderators with 2 × 2 cm2 pinhole corresponding to a
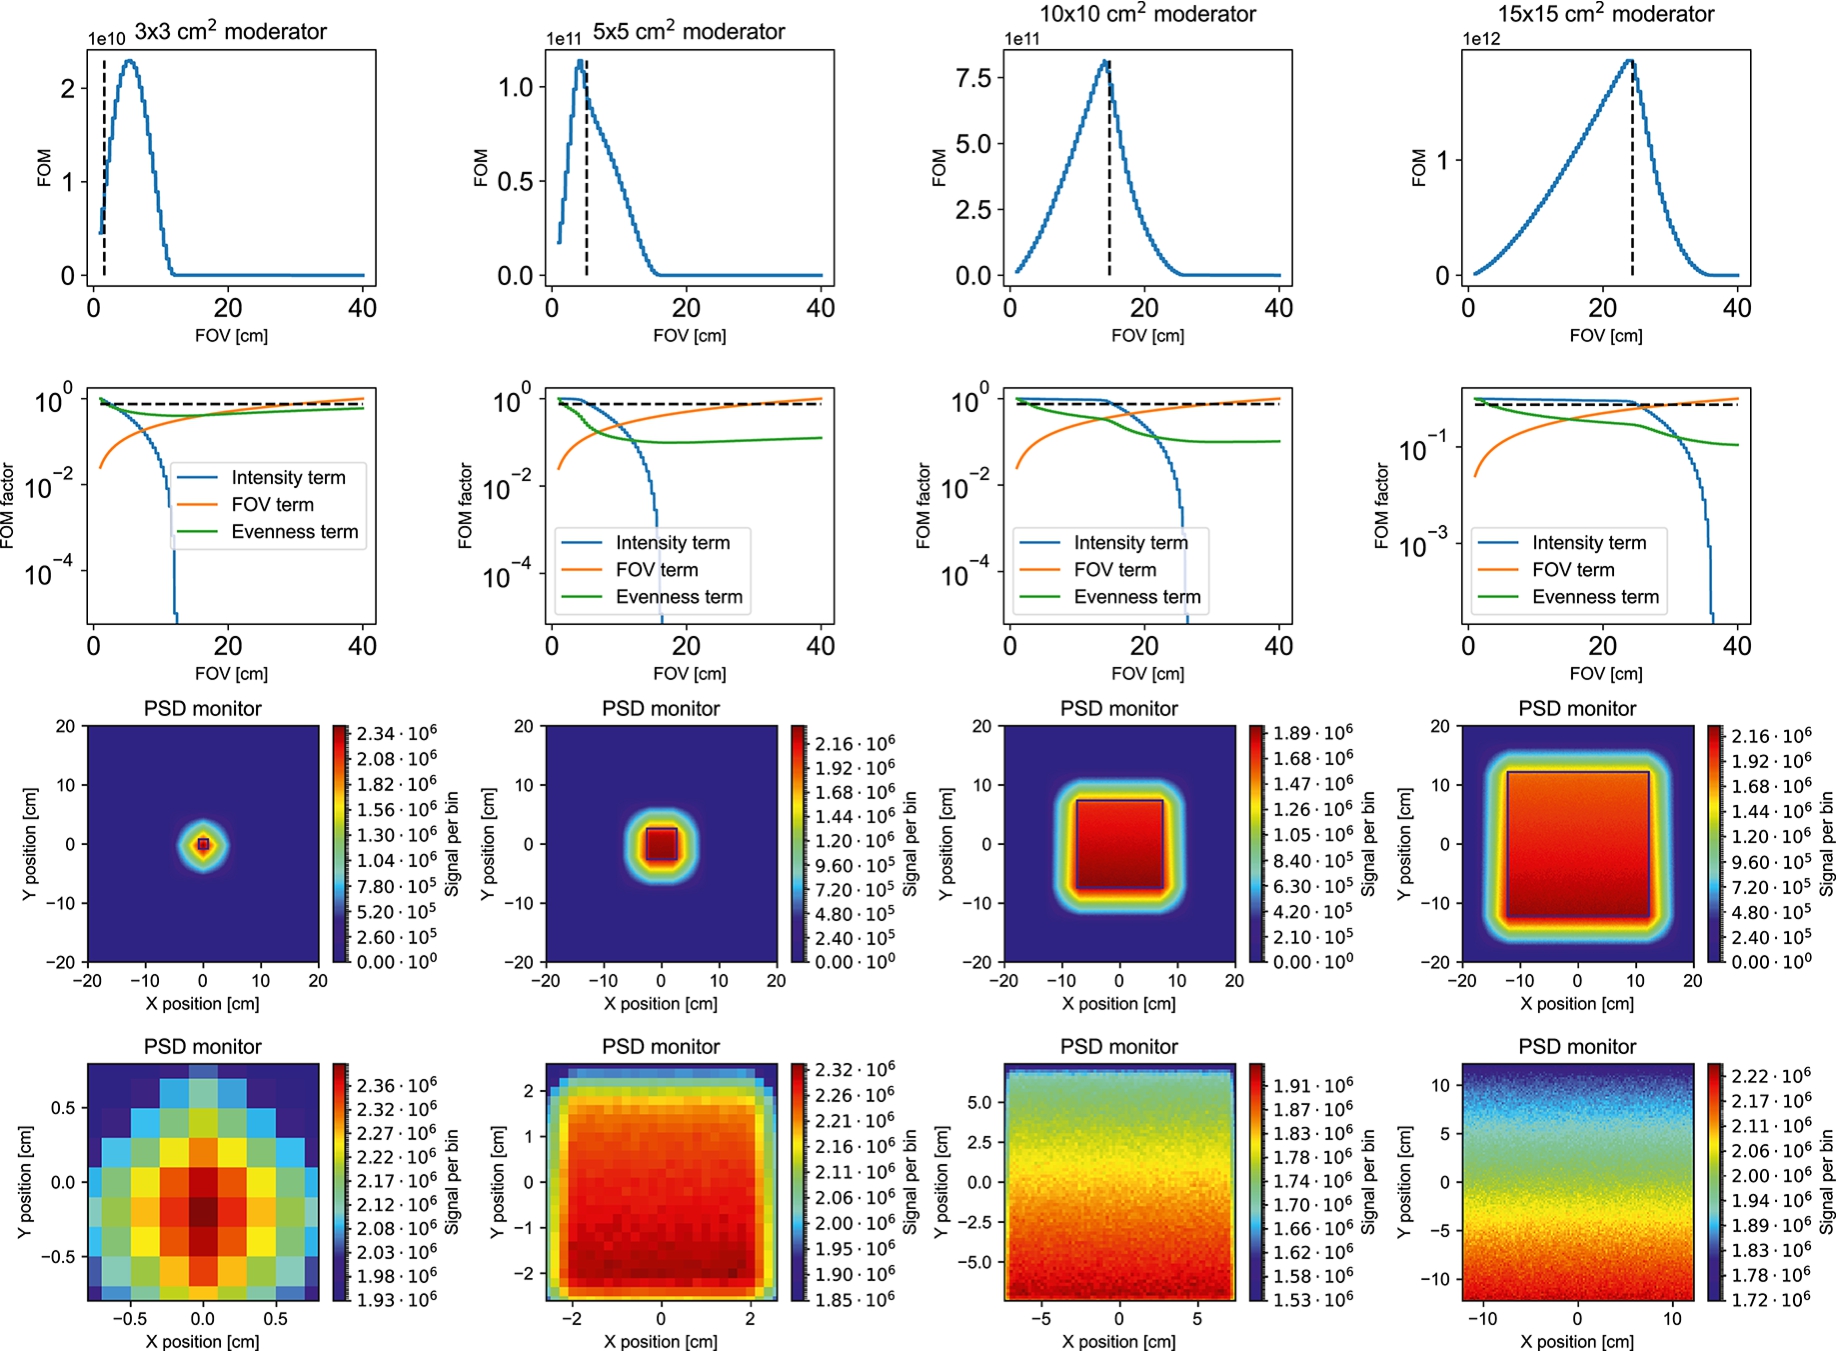
Fig. 171.
Left: FoV where the minimum intensity is 75 % of the maximum for all configurations of moderators and pinholes. The dashed line is twice the moderator size for comparison. Right: the corresponding FOM for all configurations of moderators and pinholes.
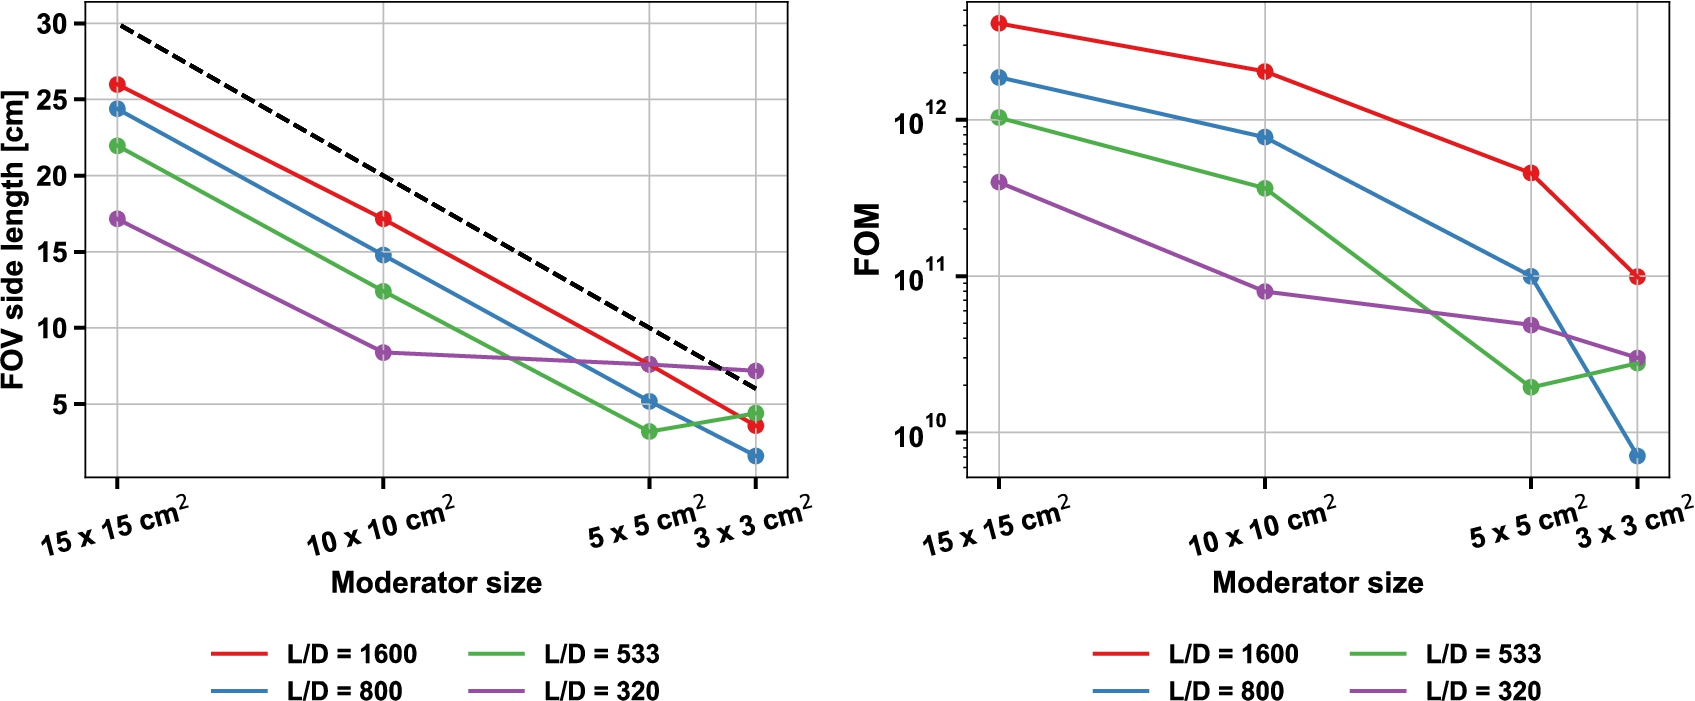
The feasibility of using the moderator as pinhole is doubtful as neutrons could scatter close to it and still reach the sample, blurring the image. The required opening in the shielding would be much larger than the other configurations, resulting in severely increased background. The configurations using the moderator as pinhole were studied for completeness, yet it was decided not to continue the investigation despite their impressive low collimation performance.
So far the FoV has been assumed to be twice that of the moderator. The beam for each configuration is now examined to find the FoV corresponding to the intensity at the edge falling to no less than 75% of the maximum intensity. An example of such an investigation is seen in Fig. 170. The smallest moderator is almost the same size as the pinhole, and thus suffers in terms of evenness, yet the larger moderators each have a successively larger homogenous area. They also have increased brightness in the area nearest the target at top of the moderator, which after inversion from the pinhole camera correspond to a larger intensity near the bottom of the detector, detracting from the flatness of the distribution. The same procedure is followed for all configurations.
If we plot the achieved FoV and corresponding FOM for each configuration of pinhole and moderator size (Fig. 171), it can be seen, that the found FoV is less than twice the moderator size, except for a single configuration of the smallest moderator. The overall trend in the FOM is similar to the fixed fields of view with pinholes in all configurations, and thus we conclude that the fixed field version is sufficient for further analysis.
8.3.3.Performance comparison to ESS instrument
In order to investigate whether the conceptual imaging instrument is relevant for ESS it is compared to the ODIN imaging instrument already under construction. Here it is assumed, that the 15 × 15 cm2 moderator is chosen for the conceptual instrument, while the performance of ODIN is calculated using the bispectral extraction of the “butterfly” moderator with same proton power on target. For this comparison it is important to note that ODIN uses a guide to extend the instrument length and thus significantly improves energy resolution, along with a comprehensive chopper setup that allows it to customize this resolution on demand. Such options are much more limited for the conceptual instrument without a guide. A comparison of flux as a function of sample size/FoV for a nominal
The FOMs used in this section for the two instruments are also compared as a function of sample size, and the results are shown in Fig. 172b. The conceptual imaging instrument achieves a higher FOM over the FoV/sample size range, which is primarily caused by the lack of energy resolution in the FOM. This is however justified by the requirement of optimizing an instrument that should compliment ODIN. While the conceptual “simple” imaging instrument can handle the presumably large subset of experiments that do not require energy resolution with significantly shorter measurement times, ODIN could focus on experiments, where customizable energy resolution is necessary.
Fig. 172.
(A) total neutron flux at the sample position of NI and ODIN as a function of sample size. (B) FOM of NI and ODIN as a function of sample size. All simulations and calculations were done for
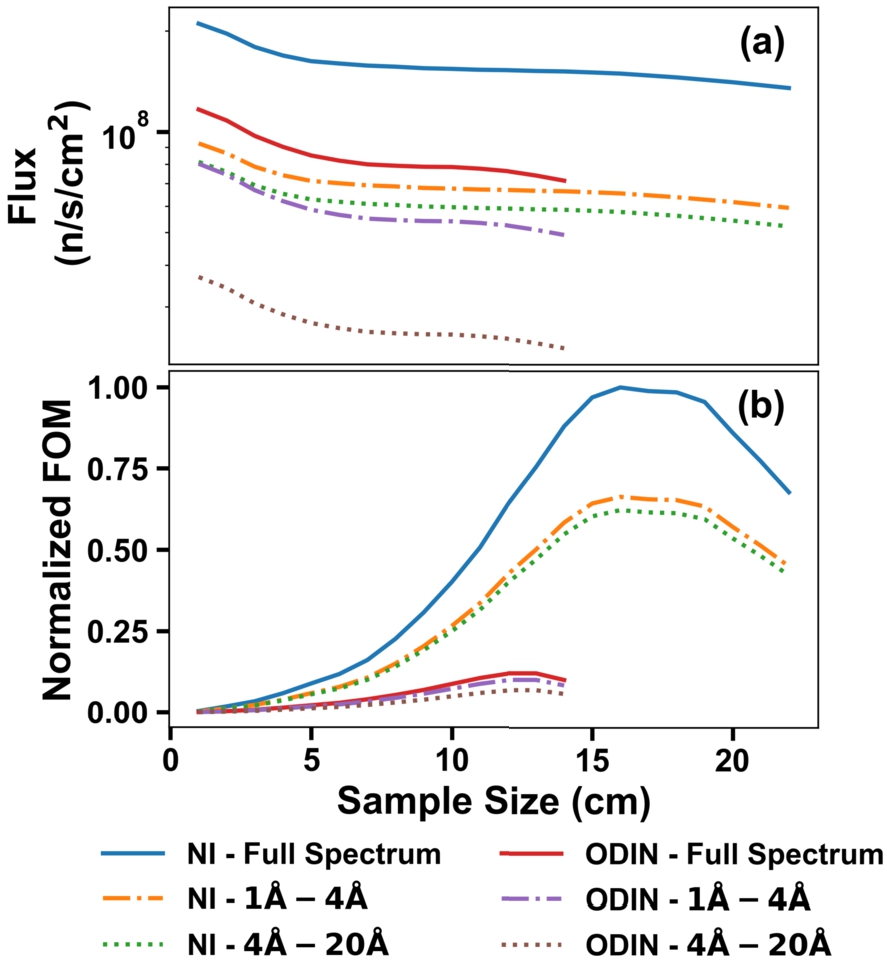
8.4.Achromatic optics for long wavelengths
Typically, condensed matter instrumentation for neutron scattering can ignore the effect of gravity. When going to the VCN region, though, this becomes a serious issue. While they can be transported with traditional guides, any long collimation section or focusing can be problematic. A part of the HighNESS project was studying how prisms could be used to counteract gravity when used in conjunction with focusing optics.
A well-collimated white beam incident on a prism will be split according to wavelength such that all the trajectories meet at a later point. The distance to this point corresponds to the properties of the prism, both its geometry and material, and is here called the critical distance for a prism. At this point the beam will be divergent, but can be recombined with a second prism, as seen in Fig. 173. For some applications it is unwanted to have a prism close to the destination of a beam. Here an alternative geometry can be used with a stack of prism halfway between the origin and target, though the distance covered in this configuration is only half the characteristic length, see Fig. 174.
Fig. 173.
Diagram of two prisms canceling gravity between them. The distance has to correspond to the characteristic length of the prisms, which depend both on the material and shape. (Not to scale and not illustrating the actual path within the prisms.)
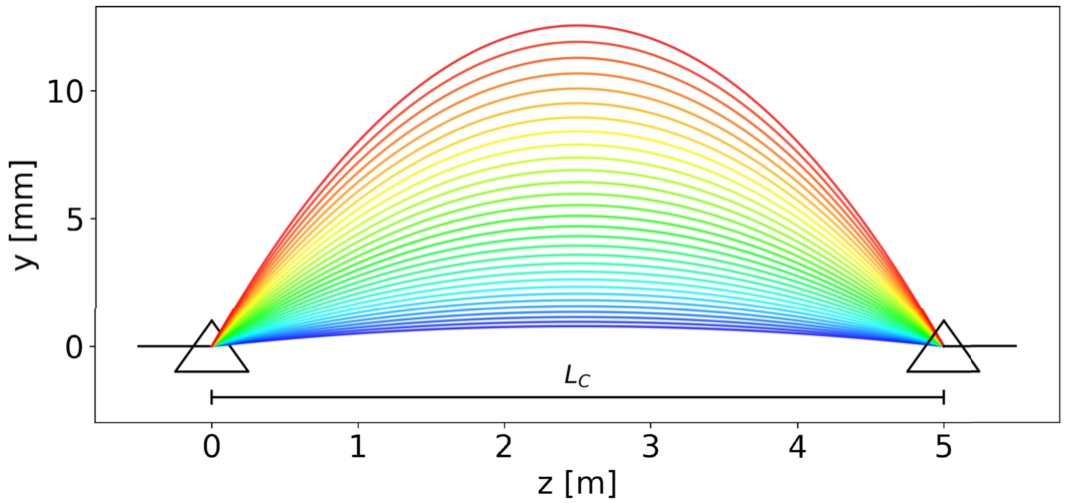
Fig. 174.
Diagram of prism stack placed centrally cancelling the effect of gravity over half a characteristic length of the prisms used (not to scale and not illustrating the actual path within the prism.)
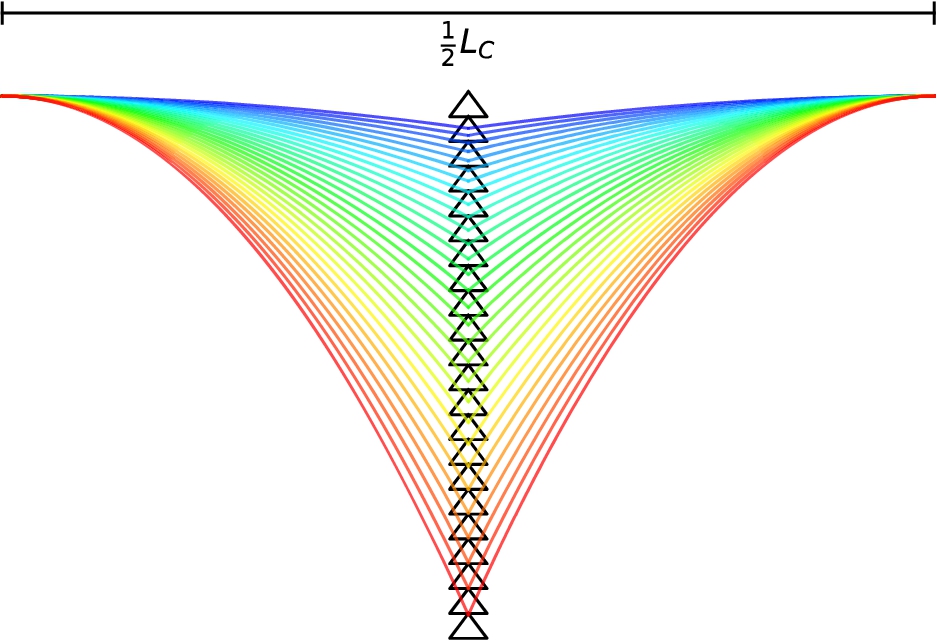
These configurations have been tested with the Monte Carlo ray-tracing simulation tool McStas and work as expected, even for beams with some divergence, which act as if there was no gravity in the corrected region.
To demonstrate this further we combine these techniques with focusing Wolter optics. As they have limited depth, the majority of the flight path would be in free space where the prism systems can counteract the vertical displacement due to gravity. This system is shown in Fig. 175. The instrument starts with a point source and is followed by a stack of Be prisms after 4.88 m which correspond to their characteristic length. The focusing optics are placed right after the prisms. Gravity correction of the focused beam is performed with a stack at the halfway point, again using Be prisms. The focal points of the focusing optics are thus on the source and 2.44 m after the end of the focusing optic.
Fig. 175.
Illustration of Wolter optics with correcting prisms. Blue paths are low wavelength with little gravity impact and the red color has the highest wavelength and large impact from gravity.
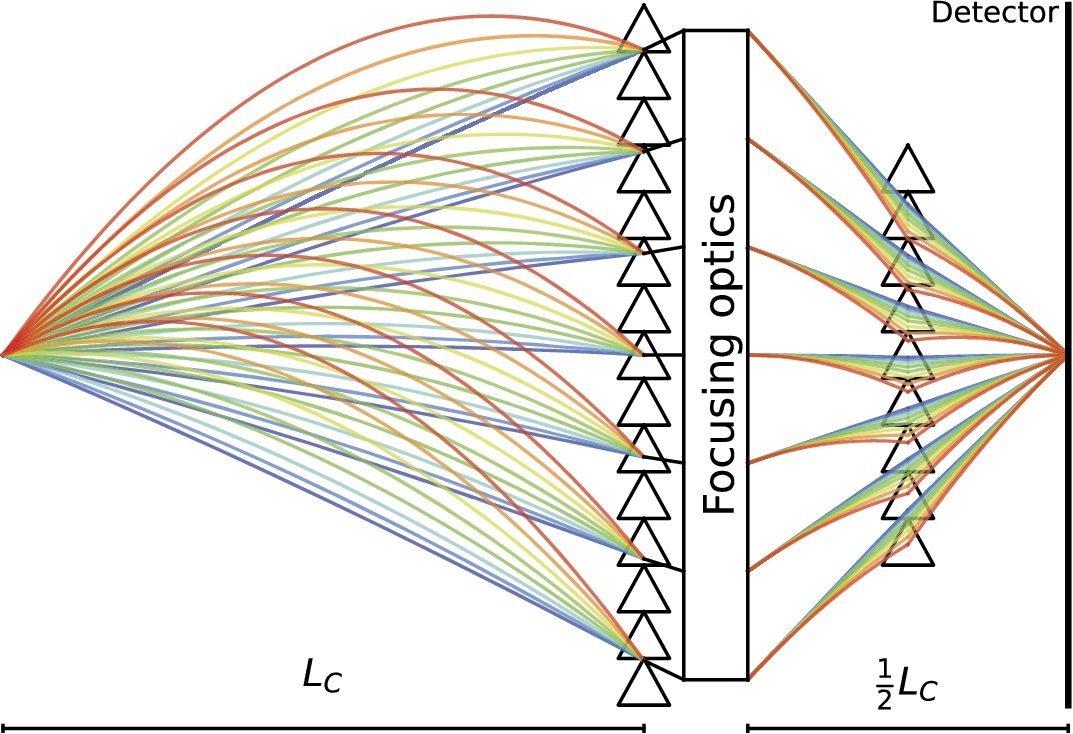
In Fig. 176a and Fig. 176b the beam quality of this system is compared to a version without the correcting prims. The difference in beam quality is stark, with the uncorrected version having a drop and complex correlations between position and divergence. The corrected instrument does have artifacts, these are however at intensities 3 orders of magnitude lower than the intended beam. The beam drop as a function of wavelength is investigated in the same manner in Fig. 177a and Fig. 177b. Again, it becomes evident that even over such small distances, correcting measures are necessary for the VCN wavelength range.
Fig. 176.
Acceptance diagram of vertical divergence and position at the detector with a white beam 10–70 Å.
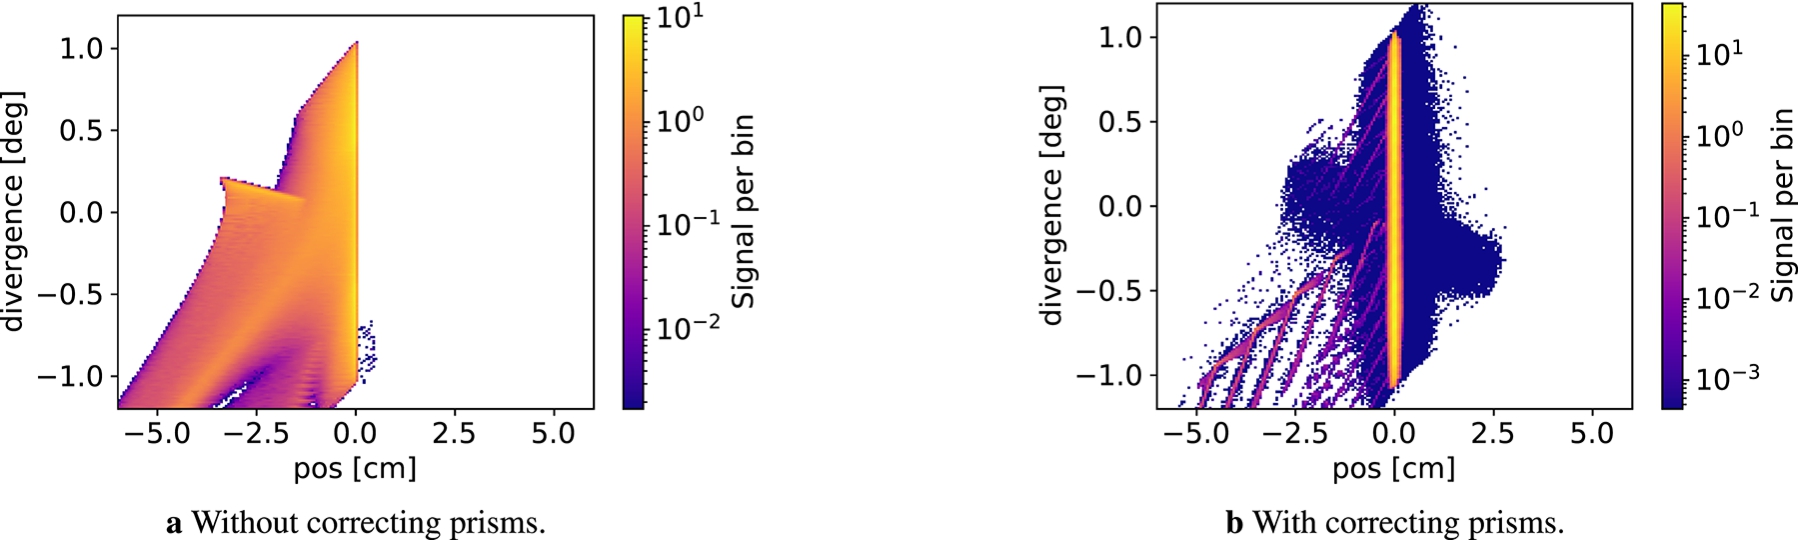
Fig. 177.
Height distribution of the focused beam as a function of wavelength.
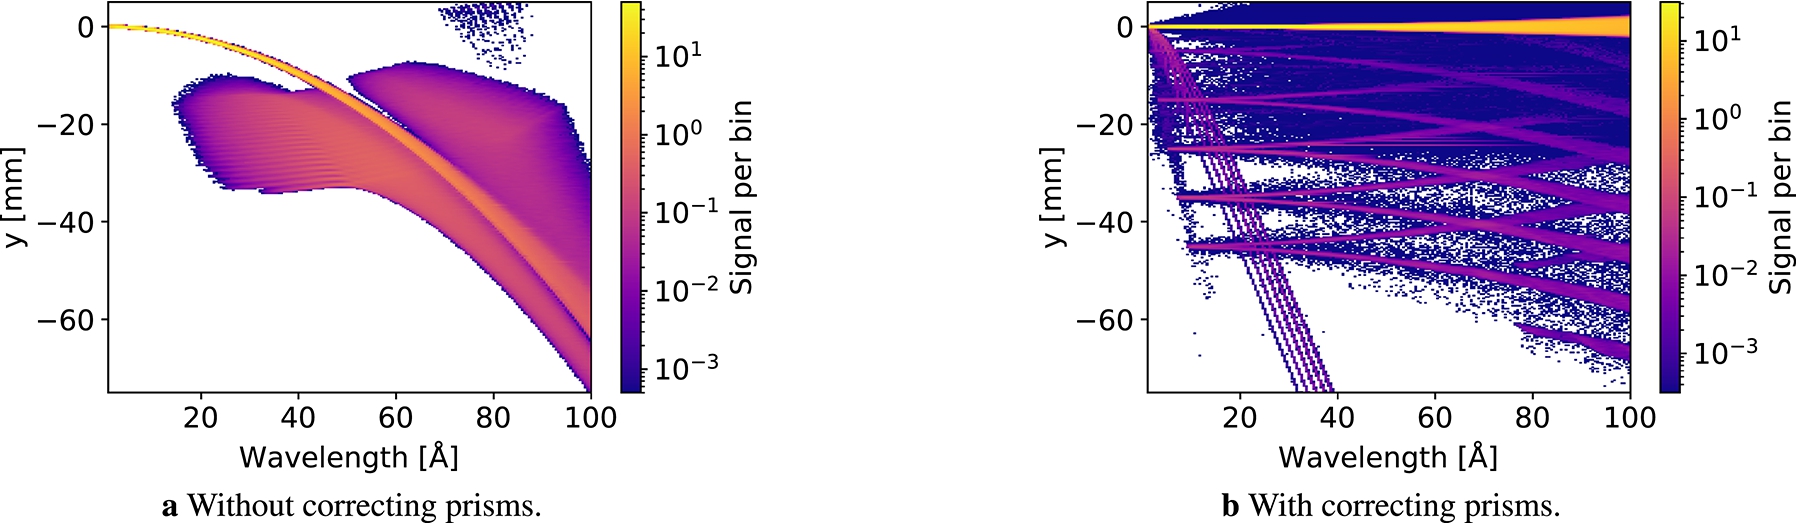
Fig. 178.
Normalized FOM as function of moderator size for the three instruments, all normalized to the 15 × 15 cm2 moderator. The SANS instruments are for
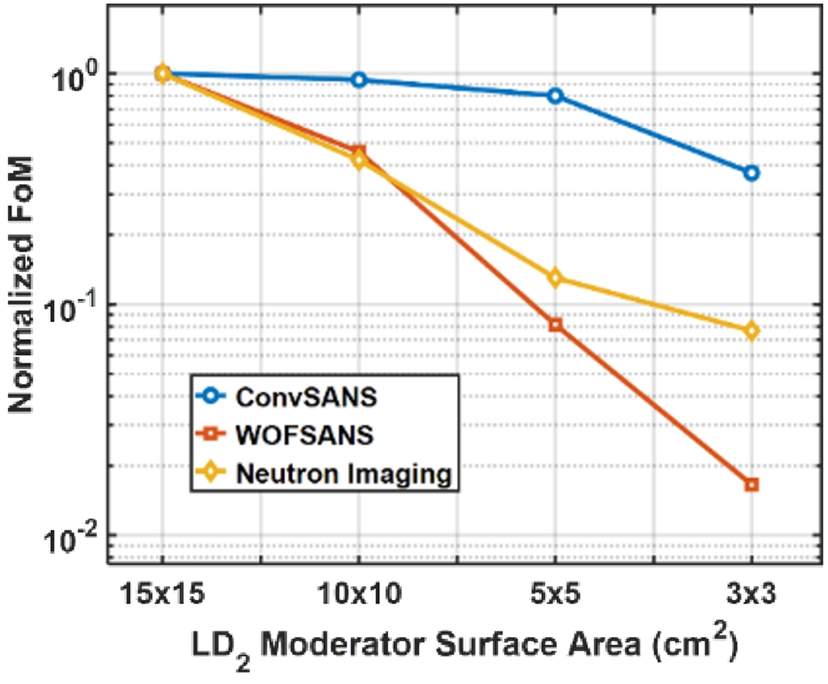
Such an optical system can be a part of the solution for creating efficient and accurate instrumentation that functions over a very broad wavelength range. The system could for example be used to create a SANS instrument, where additional length could be achieved with multiple columns of prisms. These preliminary studies are promising and warrant further investigation in future research.
8.5.Neutron scattering instrumentation summary and cost estimation
This section investigated the performance of three conceptual instruments, a conventional SANS instrument, a Wolter optics-based SANS instrument and an imaging instrument for four moderator candidates of varying size. The smaller moderators had a higher brightness, but in contrast to the similar survey for the “butterfly” moderator, all investigated instruments preferred the largest moderator as seen Fig. 178. The trade-off between brightness and size for the investigated liquid deuterium moderator was simply smaller than for the hydrogen-based “butterfly” moderator, resulting in the opposite outcome. The large liquid deuterium moderator thus complements the “butterfly” moderator well as it provides a large surface with a similar brightness at wavelengths over 5 Å, and is especially suited to instruments with performance scaling driven by moderator size or neutron intensity.
It was shown that when using the proposed 15 × 15 cm2 moderator, the conceptual instruments are all highly competitive with the ESS instruments under construction and are complementary as they avoid covering exactly the same usecases while offering new capabilities. A rough estimate of the cost for each instrument can be found in Table 42
Furthermore, it was investigated how to counteract gravity when transporting neutron beams with a large wavelength range; here, prisms were shown to work well in conjunction with Wolter focusing optics.
9.Thermal scattering libraries
9.1.Introduction
Here we present the development of simulation software for describing neutron interactions in novel moderator and reflector materials considered of interest for the HighNESS project. The main interest is the development of software in order to describe neutron interactions in NDs, magnesium hydride, graphitic compounds with extended Bragg-edges compared to normal graphite, and the clathrate hydrates. To support this work, several methods were developed to include new physics processes, such as small-angle neutron scattering and magnetic scattering, into the Monte-Carlo simulation process.
Traditionally, thermal neutron scattering data for Monte-Carlo simulations are usually distributed as part of the thermal scattering sublibrary (TSL) of major evaluated nuclear data libraries (ENDF/B [28], JEFF [158] and JENDL [97]). In the past decade, these libraries have seen an increase in activity related to the development of the TSL, in part due to the work of the Subgroup 48 of the Working Party for Evaluation Cooperation [95]. Nevertheless, the coverage of materials, and particularly of materials of interest in the development of cold neutron sources, is limited.
Table 42
Cost estimates of conceptual instruments
| Instrument | Cost estimate [M€] |
| ConvSANS | 20–30 |
| WOFSANS | 20–30 |
| Imaging instrument | 15–20 |
In addition, these libraries are also restricted by the ENDF format [88]. In its current version, elastic scattering can be either represented using a coherent or incoherent model. In December 2020, a format change was proposed [226] to include both components in what is called mixed elastic scattering. To make use of this format, the tool that is currently freely available for the generation of thermal scattering libraries, the LEAPR module of NJOY [123], must be modified and recompiled to support the calculation of coherent scattering in new materials. In addition, there is no simple way to include additional physics processes such as small-angle neutron scattering and magnetic scattering through this approach.
To overcome these limitations, we investigated a number of approaches for including improved thermal neutron scattering data in Monte-Carlo simulations. These include approaches based on extended thermal neutron scattering libraries in a modified ENDF format in addition to calling the code NCrystal [31,32,103] on-the-fly during a Monte-Carlo simulation.
Each of the above mentioned developments used input based on state-of-the art molecular modelling systems. This included the usage of both density-functional-theory (DFT) techniques in addition to classical molecular dynamics.
An important part of the process of development of new models and tools is benchmarking against experimental data. Data for this purpose is in particular very limited for materials of interest to very cold and ultracold neutron applications. For this reason, we also carried out an experimental campaign at the BOA instrument at the Paul Scherrer Institute to explore its possible use as a neutron beamline for this purpose and also to investigate in particular extend Bragg-edge graphitic compounds.
In the following, we first present the molecular modelling simulations, followed by advancements in nuclear libraries and extension of NCrystal to include new physics, and finally work on benchmarking and investigations with the BOA instrument.
9.2.Molecular modelling
To support the development of new neutron scattering models, extensive molecular modelling calculations were carried out using a variety of techniques. The main outcomes of such calculations are the structure, in the form of the atomic positions, and the phonon frequency distribution. These two quantities can be used as input to the neutron scattering models.
9.2.1.Molecular modelling for MgH2 / MgD2
The phonon spectra inputs for the MgH2, and its deuterated variant MgD2, libraries were generated using Density Functional Perturbation Theory (DFPT) [19] with the Perdew–Burke–Ernzerhof (PBE) [154] approximation for the exchange and correlation energy functional. The calculations also employed ultrasoft pseudopotentials [49,202] and plane wave expansions of Kohn–Sham orbitals as given in the Quantum-ESPRESSO (QE) package [72]. The phonon density of states (PDOS) of MgH2 and MgD2 are shown in Fig. 179 [160].
The results for MgH2 are very similar to previous ab-initio works [146,176]. In particular, in [146] the overall validity of the isotropic approximation of the mean square displacement is assessed at different temperatures. The high-frequency phonons, due to the motion of hydrogen, are almost exactly scaled by a factor
![Comparison of the theoretical phonon DOS for MgH2 and MgD2 (from ref. [160]).](https://content.iospress.com:443/media/jnr/2023/25-3-4/jnr-25-3-4-jnr230950/jnr-25-jnr230950-g180.jpg)
9.2.2.Nanodiamonds
NDs of interest as reflector materials for cold neutrons are synthesized by detonation techniques [195]. The resulting samples consist of nanoparticles with a distribution in diameter centered at about 5 nm [195]. Transmission electron microscopy (TEM) measurements of NDs synthesized under different conditions revealed a mostly diamond-like structure of the nanoparticles with, however, a partial surface graphitization whose extent depends on the preparation conditions, thermal history, and purification process [131]. Full transformation of NDs into carbon onions was in fact observed by heating at about 1670 K [159]. Impurities such as H, N and O are also present, resulting from the purification methods or from oxidation in air. A fraction of about 5 atomic % of H was measured, for instance, in commercial samples of detonation NDs used by Vasiliev et al. in ref. [204] to measure the heat capacity as a function of temperature. This latter work shows that the heat capacity of 5 nm NDs is notably larger than that of bulk diamond up to 300 K.
This result suggests a sizable difference in the PDOS of the NDs with respect to the bulk which is confirmed by the inelastic neutron scattering data reported by Shiryaev et al. in Ref. [186].
Since the PDOS is expected to affect both the elastic (via the Debye–Waller factor) and the inelastic contributions to the neutron scattering cross section, it is important to have reliable structural models of the NDs to provide both atomic positions and the phonon DOS for the calculation of the total neutron scattering cross section.
To this aim, we generated models of NDs by molecular dynamics (MD) simulations with the classical interatomic potential AIREBO [191]. This potential is suitable for generating reliable structural models of NDs as shown by several previous works, including the formation of a graphitic shell upon annealing [127]. However, the classical potential is less reliable in reproducing the PDOS, which is the key property needed to compute the neutron scattering cross section. Our strategy thus consists of using the classical potential to investigate the dependence of the structural properties on the annealing process and then to use the NDs models generated with the AIREBO potential to compute the PDOS with a more reliable, but much more computationally demanding scheme. To this aim we chose the Gaussian Approximation Potential (GAP) from Ref. [169].
We have investigated NDs with diameters of 1.4, 2.5 and 5 nm, containing about 200, 750, and 5900 atoms, respectively. The initial configuration of the ND was built in two different ways, either as a spherical shape or by using the Wulff construction that minimizes the overall surface energy. To this aim we used the theoretical surface energies of the surfaces of diamonds from Ref. [199], obtained from Density Functional Theory (DFT).
We then annealed the models at several different temperatures in the range 500–3000 K for 1 ns. Snapshots of the evolution of the 2.5 nm ND as a function of time at 2000 K are shown in Fig. 180. A partial graphitization of the outermost layers is clearly visible.
Preliminary calculations of PDOS with the AIREBO potential show that the PDOS is more similar to that of the bulk diamond for annealing at the lower temperatures while sizable changes occur at and above 2000 K due to partial graphitization with a reduction of the optical peak and an increase of the PDOS due to acoustic phonons at low frequency. This effect is reduced by increasing the size of the NDs as also shown by the results of Ref. [127] on 1442-atom NDs.
Fig. 180.
Snapshots of the evolution of the 2.5 nm ND annealed at 2000 K with the AIREBO potential extracted at (left) 10 ps, (central) 500 ps and (right) 1 ns. The initial configuration was built by the Wulff construction.
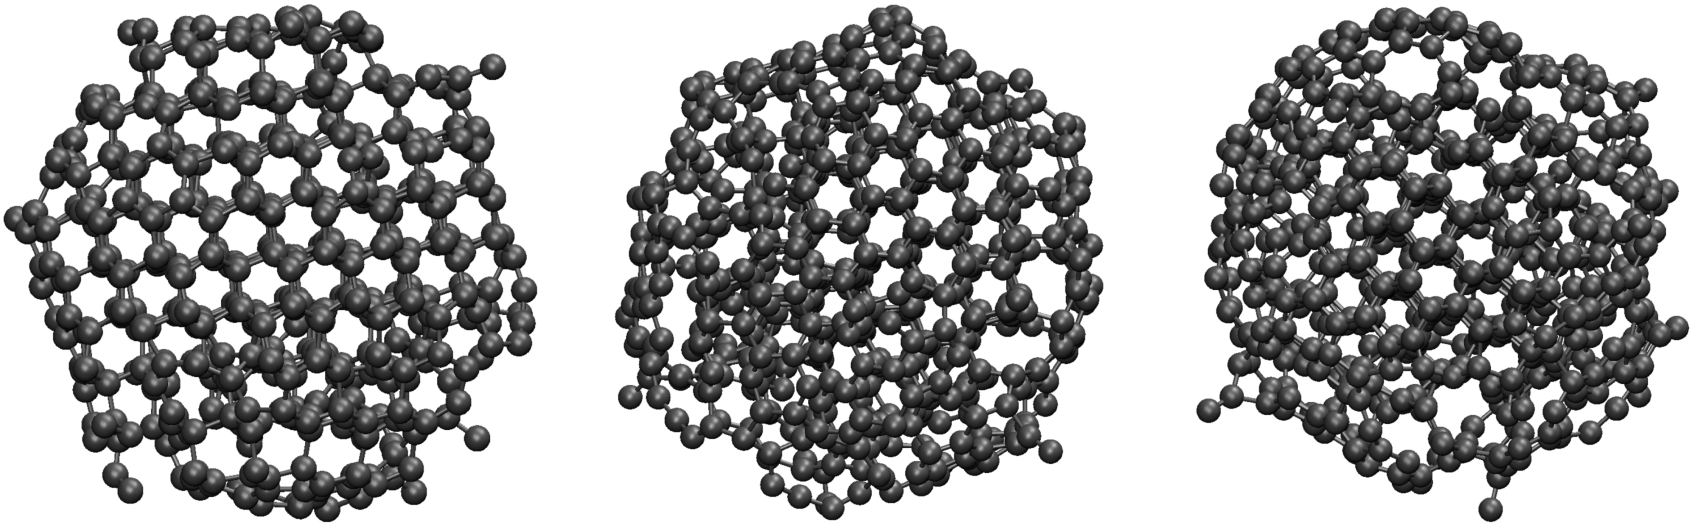
To compare with experimental data we resort, however, to the more accurate GAP potential. In Fig. 181 we compare the theoretical PDOS of the largest 5 nm ND annealed at 500 K with INS data from Ref. [186]. The PDOS was obtained by Fourier transforming the velocity-velocity correlation function extracted from simulations 20 ps long. The agreement with experimental data is overall good and it improves for the models annealed at higher temperatures which corresponds to a higher degree of graphitization. These theoretical PDOS have been used to compute the neutron scattering cross section presented in the sections below.
![Phonon density of states computed with the GAP potential for the 5.0 nm ND annealed at 500 K (from ref. [55]), compared with experimental data from inelastic neutron scattering from ref. [186].](https://content.iospress.com:443/media/jnr/2023/25-3-4/jnr-25-3-4-jnr230950/jnr-25-jnr230950-g182.jpg)
9.2.3.Graphitic compounds
We have explored several graphitic compounds through DFT calculations. This includes graphite oxide and intercalated graphite oxide, also in deuterated forms, and fullerite. We present below a selection of these calculations, further details can be found in [214] for fullerite.
Graphite oxide (GO) is made of graphitic layers with a fraction of carbon atoms bound to oxygen atoms either in an epoxy group (C-O-C) or within a hydroxyl (C-OH). This leads to a wrinkled hexagonal structure with a typical 6–7 Å distance between the layers [118,128,192], which is also ruled by the presence of hydrogen bonds among hydroxyls in adjacent layers. Intercalated water molecules bound to the hydrophilic hydroxyl groups have a marginal effect on the structure of the individual layers, but they lead to a further expansion of the interlayer distance [192]. The C/O and C/H ratio of graphite oxide depends on the preparation conditions with reported compositions ranging from C8O(OH)2 to C12O(OH) (see Ref. [26] for a review).
To provide structural and phononic data for the calculation of the neutron scattering cross sections, we optimized the geometry of different models of GO by means of DFT calculations. We first considered the model with composition C8O(OH)2 proposed in Ref. [26]. The supercell contains two graphitic planes each made of 2 × 2 unit cells of a single graphite layer (8 carbon atom per layer) with one epoxy group and two hydroxyl groups per layer pointing in opposite directions with respect to the graphitic plane. The two graphitic planes in the unit cell have oxygen atoms and hydroxyls in the same positions but the planes can slide one with respect to the other during the geometry optimization. We then considered a second larger model with a supercell containing two graphitic planes each made of 3 × 3 unit cells of a single graphite layer (18 carbon atom per layer) with one epoxy group and two hydroxyl groups per layer, still pointing in opposite directions with respect to the graphitic plane, which corresponds to a composition C18O(OH)2.
Finally, we considered a hydrated form of the small model by adding a water molecule in the van der Waals gap between adjacent graphitic layers which corresponds to a composition C8O(OH)2-H2O. The geometry of these models have been optimized by DFT calculations with the QE suite of programs [72], the PBE [154] approximation for the exchange and correlation energy functional, ultrasoft pseudopotentials [202] and a plane wave expansion of Kohn–Sham orbitals. We also included semiempirical van der Waals interactions á la Grimme (D2) [86].
The side views of the final configuration of the small and large model of GO are shown in Fig. 182. The sliding of the two graphitic planes leads to the formation of H-bonds among the hydroxyls and between one hydroxyl and the epoxy group. There are two different interplanar distances corresponding to 5.244 and 4.525 Å in the small model and to 4.616 and 4.699 Å in the large one. In the hydrated model, with composition C8O(OH)2-H2O, the water molecules induce a swelling of the structure with larger interlayer distances of 6.131 and 6.141 Å.
Fig. 182.
Side views of (right) the small model of GO (composition C8O(OH)2) and (left) the large model of GO (composition C18O(OH)2). Several replicas of the supercell are shown. Hydrogen bonds are depicted by green lines. Carbon, oxygen and hydrogen atoms are depicted by gray, yellow and black spheres.
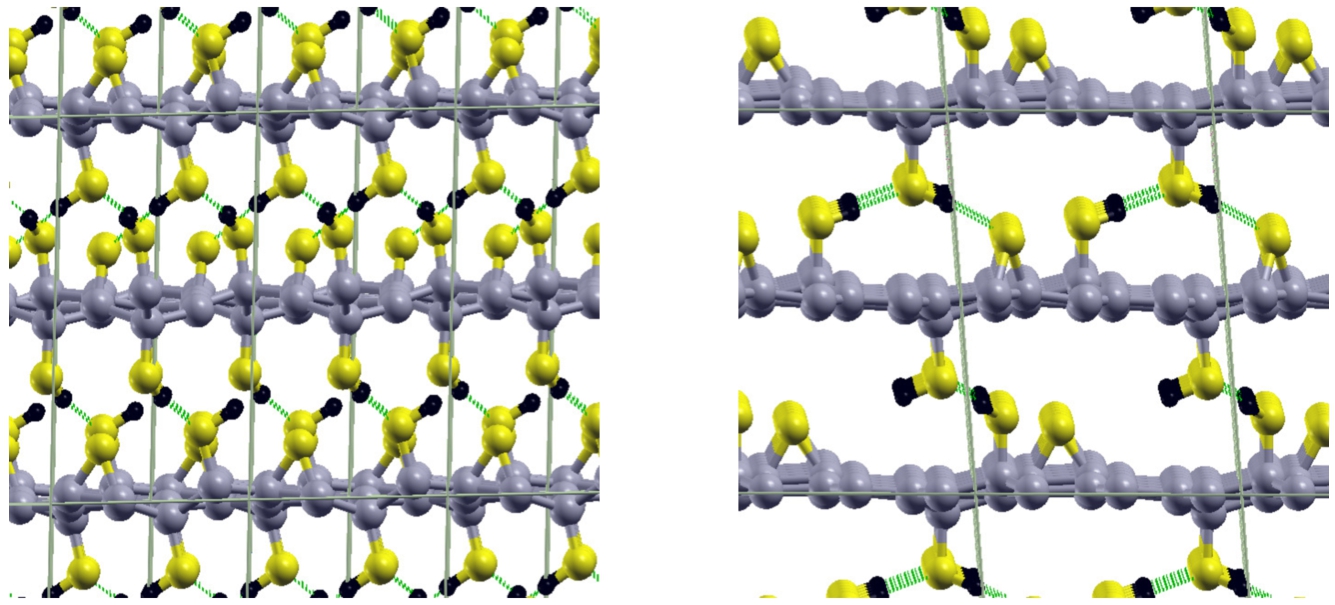
We then computed the PDOS for all models within DFPT [19] as implemented in the QE code. We also computed the PDOS for deuterated models. Examples of the PDOS projected on different atomic species, each normalized to one, are shown in Fig. 183 for the small and large models with no intercalated water. Atomic positions and PDOS of the models discussed above have been used as input to the neutron scattering models.
Fig. 183.
Phonon density of states (PDOS) projected on different atomic species, each normalized to one for (top panel) the small model with composition C8O(OH)2 and (bottom panel) in the large model with composition C18O(OH)2.
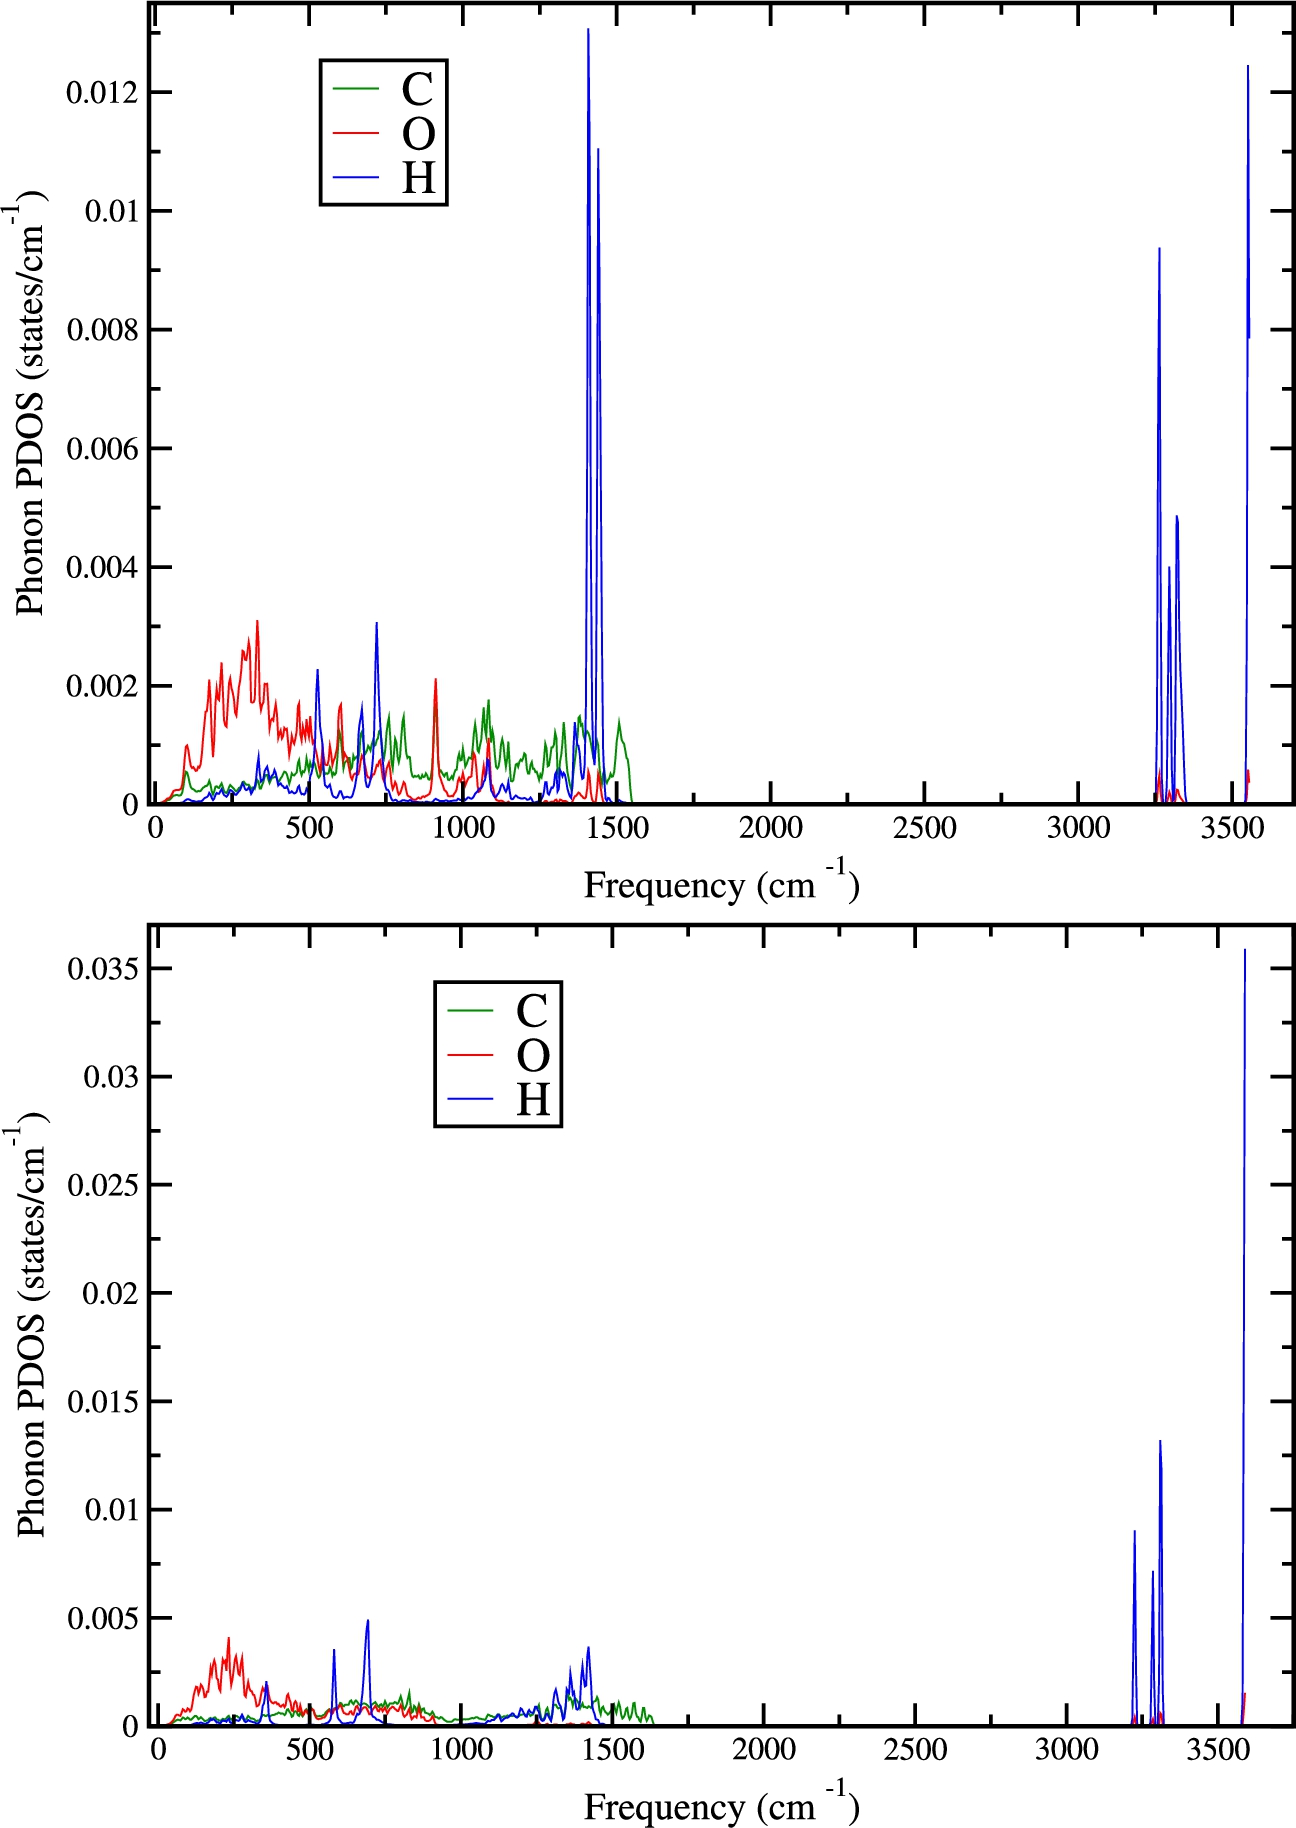
9.2.4.Clathrate hydrates
Fig. 184.
Normalised PDOS of TDF-containing hydrogenated clathrate hydrate projected on different atomic species from DFT calculations. The global PDOS can be obtained by summing the projected PDOS multiplied by the number of corresponding atoms in the unit cell.
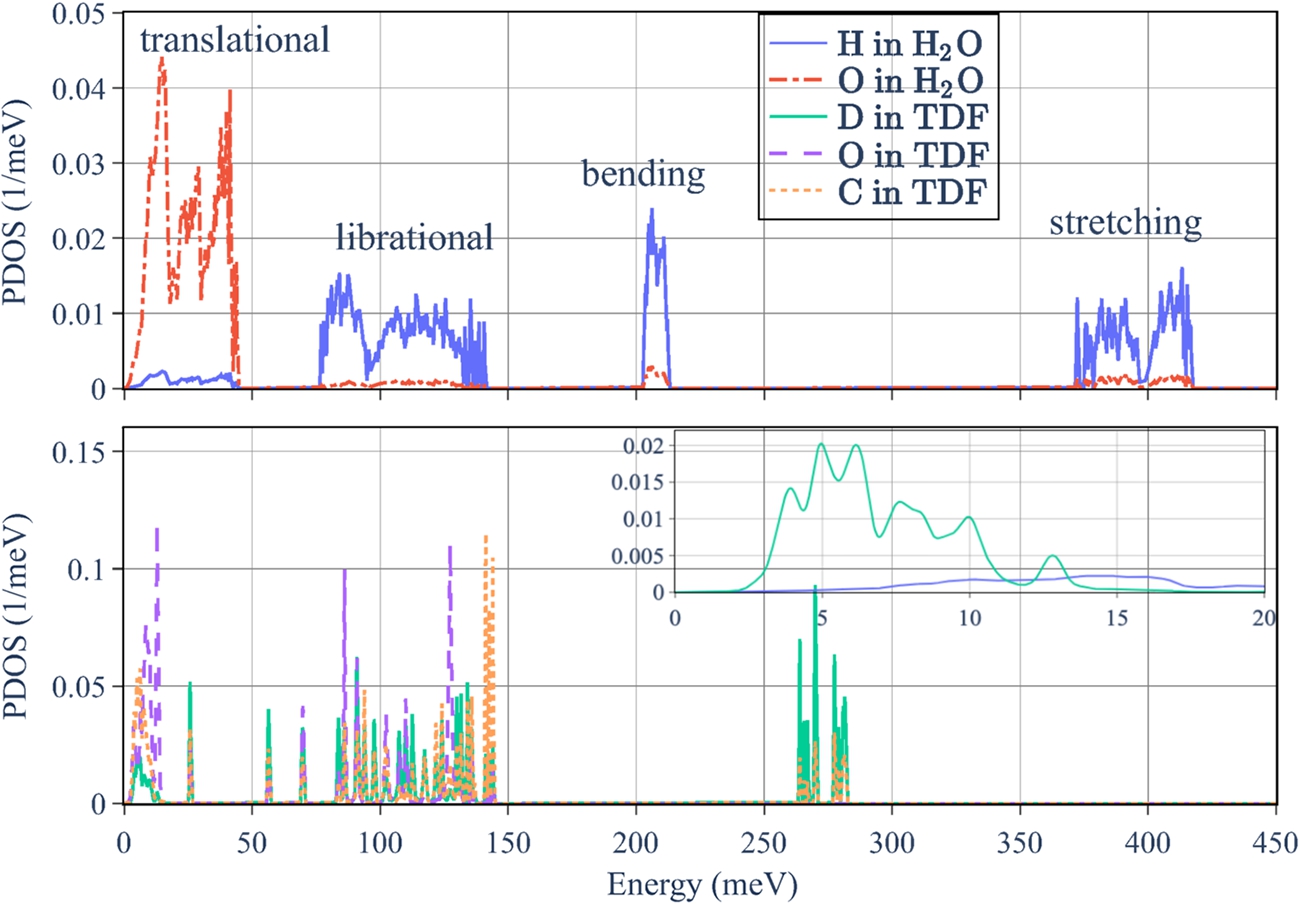
The initial configuration of the THF-containing hydrogenated clathrate hydrates in structure II was taken from Ref. [117]. The unit cell of the face centered cubic lattice contains 34 H2O molecules and two THF molecules inserted in the large cages. The unit cell was replicated to build the conventional cubic cell with 136 H2O and 8 THF molecules. The initial position of the THF molecules was selected by performing classical MD simulations with GROMACS [89] using the SPC/E potential for water [22] and the general Amber force field for THF and THF-water interactions [207]. The initial structure was optimised by means of DFT calculations with CP2k [203]. We employed the PBE approximation for the exchange and correlation functional [154] and norm conserving pseudopotentials [73]. The Kohn–Sham orbitals were expanded in a triple-zeta-valence plus polarisation basis set while the electronic density was expanded in plane waves as implemented in CP2k. Semiempirical van der Waals interactions were included according to Grimme (D3) [87]. The phonons were computed using CP2k combined with phonopy [197] at the experimental lattice parameter. The force constant matrix was computed from forces at finite atomic displacements in the conventional cubic cell (136 water molecules). The Coulombic long range contribution was computed analytically from effective charges and the dielectric constant obtained in turn from ionic forces and polarisation at finite electric field within the Berry phase approach [188] implemented in CP2k.
The PDOS was computed for all possible four combinations of TDF/THF and hydrated/deuterated clathrate. As an example, we show in Fig. 184 the PDOS projected on different atomic species for the TDF-H2O clathrate. At low energy, the translational modes of the H2O molecules dominate. In this spectral region, the experimental neutron weighted PDOS of type II clathrate hydrates has two characteristic peaks at about 7 and 10.5 meV [35,179]. This double peak feature is less evident in the theoretical PDOS projected on the water molecules. The position of the two peaks is also blue-shifted to about 10 and 14.5 meV. This double peak feature is instead better reproduced by classical simulations with rigid water molecules as reported for instance in Refs. [30,35]. A possible improvement of the theoretical PDOS would then result from the use of the DFT-PDOS for the intramolecular modes and the classical result for the PDOS in the translational low frequency region as we will discuss later on. The band from 70 meV to 150 meV is due to molecular librations. At higher energy, intramolecular modes are dominant with O-H bending and O-H stretching at around 200 meV and 400 meV, respectively. The PDOS of atoms bound in the TDF molecules are illustrated in the lower panel of Fig. 184. The PDOS of the THF-H2O and TDF-D2O can be found in Ref. [215]. The PDOS of the cage can be transferred to other clathrates, based on weak guest–host coupling assumption as discussed in Ref. [179].
We considered two other type II clathrates, which include the clathrate with O2 molecules in the large and small cages [39] and a mixed clathrate with THF in the large cages and O2 molecules in the small cages. For these structures, we performed classical MD simulations at 10 K with the same force-field with rigid water molecules and partially rigid THF used for the generation of the initial structure of the THF-clathrate mentioned previously. We considered a supercell made of 2 × 2 × 2 conventional cubic cells each containing 136 water molecules. The PDOS were computed by Fourier transforming the velocity-velocity autocorrelation function extracted from MD trajectories.
To include in the PDOS the contribution from intramolecular modes of the water molecule, we used the DFT results obtained for the type II clathrate containing THF discussed above. In the approximation of weak coupling between water and the guest molecules in the cage, we expect that the intramolecular modes of H2O would be little affected by the replacement of THF by O2 at least for the purpose of the calculation of the neutron scattering cross section.
To describe both the intermolecular and intramolecular modes we then built a PDOS by merging the classical PDOS in the low frequency region of translational and librational modes with the DFT PDOS in the high frequency region for the intramolecular modes of water. The resulting PDOS projected on the different atomic species are shown in shown in Fig. 185 for the O2-clathrate hydrate. The simulated PDOS serve to compare with the measurements presented in Section 4.
Fig. 185.
The phonon density of states of O2-H2O clathrate projected on the different atomic species obtained from atomistic simulations (see text). Each projected PDOS is normalized to one. The total PDOS can be obtained by summing the projected PDOS multiplied by the number of corresponding atoms in the unit cell. For the sake of clarity, the projected PDOSs are multiplied by five above 50 meV for O in water.
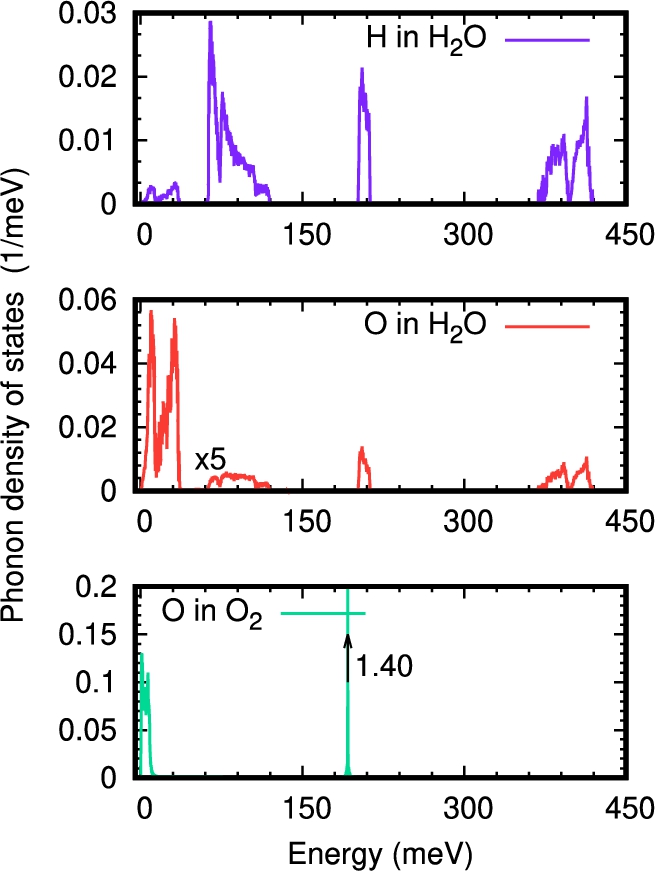
9.3.Advancements in nuclear data libraries
The design of reactors, neutron sources, and nuclear systems requires calculations of neutron distributions using radiation transport codes. A major source for nuclear data used in radiation transport codes, such as MCNP, OpenMC, and PHITS, are the ENDF files. These files include sub-libraries for different kinds of particles, in particular thermal neutron scattering data in form of TSL and written in ENDF-6 format [88]. In ENDF format, File 7 stores the thermal neutron scattering data in two sections: one for elastic and one for inelastic scattering. In general, the scattering cross section of neutrons can be decomposed into four parts: coherent elastic, incoherent elastic, coherent inelastic, and incoherent inelastic scattering. Elastic scattering represents the scattering of a neutron without the exchange of energy with the target material in the laboratory frame of reference, while inelastic scattering represents the scattering of a neutron where it either gains or loses energy. Coherent scattering contains the interference terms of the scattering and therefore is sensitive to the structure of the material, whereas incoherent elastic scattering depends on the self correlation for each atom at different times.
At the moment, in the ENDF-6 format, the elastic section stores either the coherent elastic or incoherent elastic cross section only. In the inelastic section, either the incoherent inelastic cross section is stored in the incoherent approximation or the inelastic is stored as a sum of incoherent and coherent inelastic parts calculated in the incoherent approximation. To overcome the limitation in the elastic section, a change was recently proposed [226] for the thermal scattering format, which will in this paper be referred to as the “mixed-elastic format”. Implementation of the new format makes it possible to store both the coherent and incoherent elastic cross sections in the elastic section, one after another one, in the same format in which they were stored before individually. This is important for materials like MgD2 which have a significant coherent and incoherent elastic component. Without the new format, thermalization of neutrons couldn’t be properly calculated for such a material using the current format.
Thermal scattering files can be produced with the LEAPR module of NJOY, which is available under a free software license but its support for coherent elastic scattering is limited. On the other hand, the NCrystal library [31,32,103] has an extensive treatment of the calculation of thermal neutron scattering cross sections directly but cannot generate ENDF-6 formatted files. In order to remedy this, we have combined these two tools, using NCrystal to generate the microscopic data that is later used by NJOY to produce thermal scattering libraries. Additionally, we have modified NJOY to support the proposed mixed-elastic format and produce thermal scattering .ACE files with coherent and incoherent elastic scattering. The Monte-Carlo code OpenMC was modified as well to support this new format. This development is described in the NJOY + NCrystal paper [161] in great detail, however a summary is given below.
Since MgH2 and MgD2 have significant incoherent and coherent elastic components, the main motivation for developing NJOY + NCrystal was to enable accurate calculations of thermalization and moderation of neutrons in these materials, in both the current and proposed format. Additionally, NJOY + NCrystal was motivated by a need to implement the mixed-elastic format proposal in an open source code, such as NJOY. In essence, NJOY + NCrystal is a customized version of NJOY that relies on NCrystal to provide the necessary information for the calculations of the coherent and incoherent elastic components. Additionally, both NJOY and NCrystal utilize CMake and GitHub repositories for the installation, hence making the integration smoother.
The changes to NJOY can be split into two parts. The first part is to provide an interface between LEAPR and NCrystal so that LEAPR can calculate coherent and incoherent elastic cross section components for any crystalline material. The calculated elastic components are then stored in the tsl-ENDF file for both the current and proposed mixed-elastic format. The second part consists of implementing changes to the THERMR and ACER modules of NJOY so that the new mixed-elastic format can be read and handled properly in order to produce .ACE files used by Monte-Carlo particle transport codes to sample neutron scattering events. A summary of the generated libraries are given below.
9.3.1.MgH2 / MgD2
We computed the total scattering neutron cross sections of polycrystalline MgH2 and its deuterated variant MgD2 using the NJOY + NCrystal tool and input from the DFT simulations described above. MgH2 recently emerged as a good candidate material for cold neutron reflectors [82], while MgD2 is of interest because of an even lower absorption cross section. As mentioned before, calculating the total cross section of a material is one of the most important validation tests of the newly created libraries.
From the calculated phonon spectra, tsl-ENDF files were created for both MgH2 and MgD2, using the NJOY + NCrystal tool. In Fig. 186 it can be seen that the agreement between the measured total cross section data from Granada [82] and the calculated curves (which include an absorption cross section (
![Total scattering cross section comparison for MgH2. From [161].](https://content.iospress.com:443/media/jnr/2023/25-3-4/jnr-25-3-4-jnr230950/jnr-25-jnr230950-g187.jpg)
Figure 187 shows a comparison between the NCrystal and the NJOY + NCrystal calculated total cross sections for MgD2, as well as different scattering components as calculated in NJOY + NCrystal and NCrystal. It can be seen that the total cross section for MgD2 is an order of magnitude lower than for MgH2. This arises from the incoherent hydrogen, which has a cross section of 82.02 barns, and is replaced with coherent deuterium with a cross section of 7.64 barns. Although the CEF option is not recommended for deuterated materials due to the presence of both coherent and incoherent cross sections, the approximation for compounds works well in terms of total cross section because the coherent component is assigned to the Mg(MgD2) library and the incoherent component to the D(MgD2) library.
![Total scattering cross section comparison for MgD2. From [161].](https://content.iospress.com:443/media/jnr/2023/25-3-4/jnr-25-3-4-jnr230950/jnr-25-jnr230950-g188.jpg)
9.3.2.Other materials
In addition to including the MgH2 and MgD2 evaluations, the NJOY + NCrystal library contains 213 tsl-ENDF evaluations, created for 112 new or updated materials, in both the current ENDF-6 format and in the new proposed mixed-elastic format. A summary of the NJOY + NCrystal library is given in the NJOY + NCrystal paper [161].
Different methodologies were employed to create the final tsl-ENDF files. Some of the materials were created from existing .ncmat files in current and previous versions of NCrystal. For some of the materials, mostly monoatomic metals, the VDOS curves in existing .ncmat files were updated, mostly using different sources from the literature. For the rest of the materials, phonon curves were obtained by utilizing ab-initio calculations from a phonon database at Kyoto University [99,148,149,196]. In summary, the files from the database were used with Phonopy [197] to calculate phonon eigenvalues and eigenfrequencies, which were then utilized with oClimax [41] to extract partial phonon spectra. A detailed explanation of how the phonon spectrum and crystal structure was obtained for each material is provided in the comments section of the tsl-ENDF files.
The experimental data for the validation of the tsl-ENDF files is scarce. Wherever experimental data were available, tsl-ENDF files were validated against total cross-section measurements and diffraction data, while all materials were validated against specific heat capacity curves as a minimum standard for acceptance. The link to the exact files used for each material at the Kyoto University database can be found inside the tsl-ENDF files in the HighNESS Github repository. For validation, the correct crystal structure was a starting point (a reference for each crystal structure can be found inside tsl-ENDF files as well), followed by comparison with the experimental specific heat capacity and if available, total cross section measurements. For α and β SiC, diffraction data was used as well as a means of validation of the libraries.
9.3.3.Libraries for the THF- and TDF-clathrates
Fig. 188.
Neutron scattering cross sections of type II TDF-containing hydrogenated clathrate hydrate.
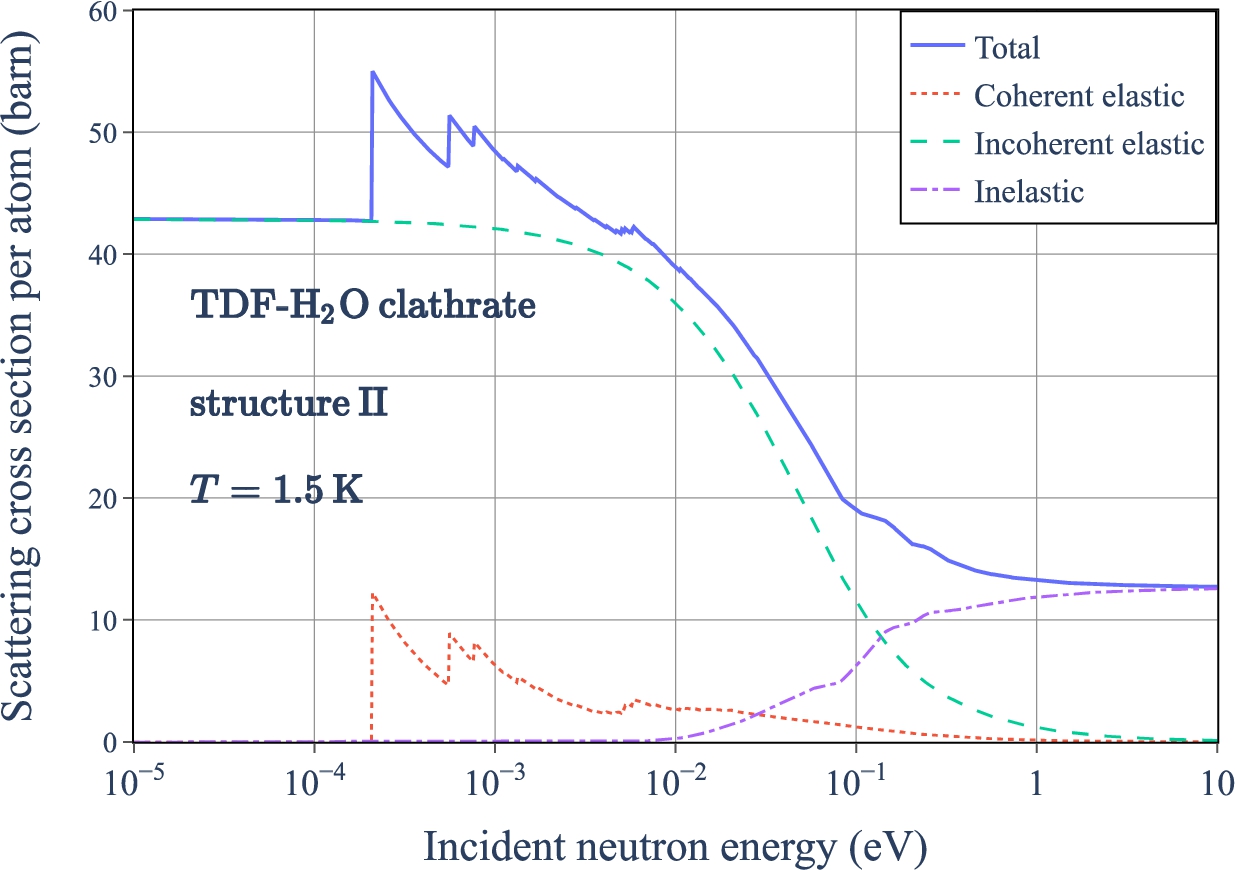
The lattice parameters, atomic positions of the crystalline structure, and the PDOS from the molecular modelling calculations were converted into input files for the NCrystal toolkit. Figure 188 shows the total scattering cross section of the THF-containing deuterated clathrate hydrate, which is the sum of coherent elastic, incoherent elastic and inelastic cross sections. Incoherent elastic scattering is dominant for neutron energy below a few meV because of the large incoherent cross section of hydrogen [51]. It should be pointed out that these scattering cross sections are calculated based on Fig. 184.
The large Bragg cutoff (around 0.2 meV or 20 Å) is an advantage for cold neutron moderation because neutrons can be reflected within the cage structure thus increasing the interactions with the guest molecules. The cross sections of the totally hydrogenated and deuterated THF-clathrates are presented in Ref. [215]. These theoretical neutron scattering cross sections serve to compare against the measurements performed at the ILL as shown in Section 4.
9.3.4.Libraries for graphitic compounds
Fig. 189.
Neutron scattering cross sections of the small and large models of hydrogenated GO, and hydrogenated GO intercalated with water molecule.
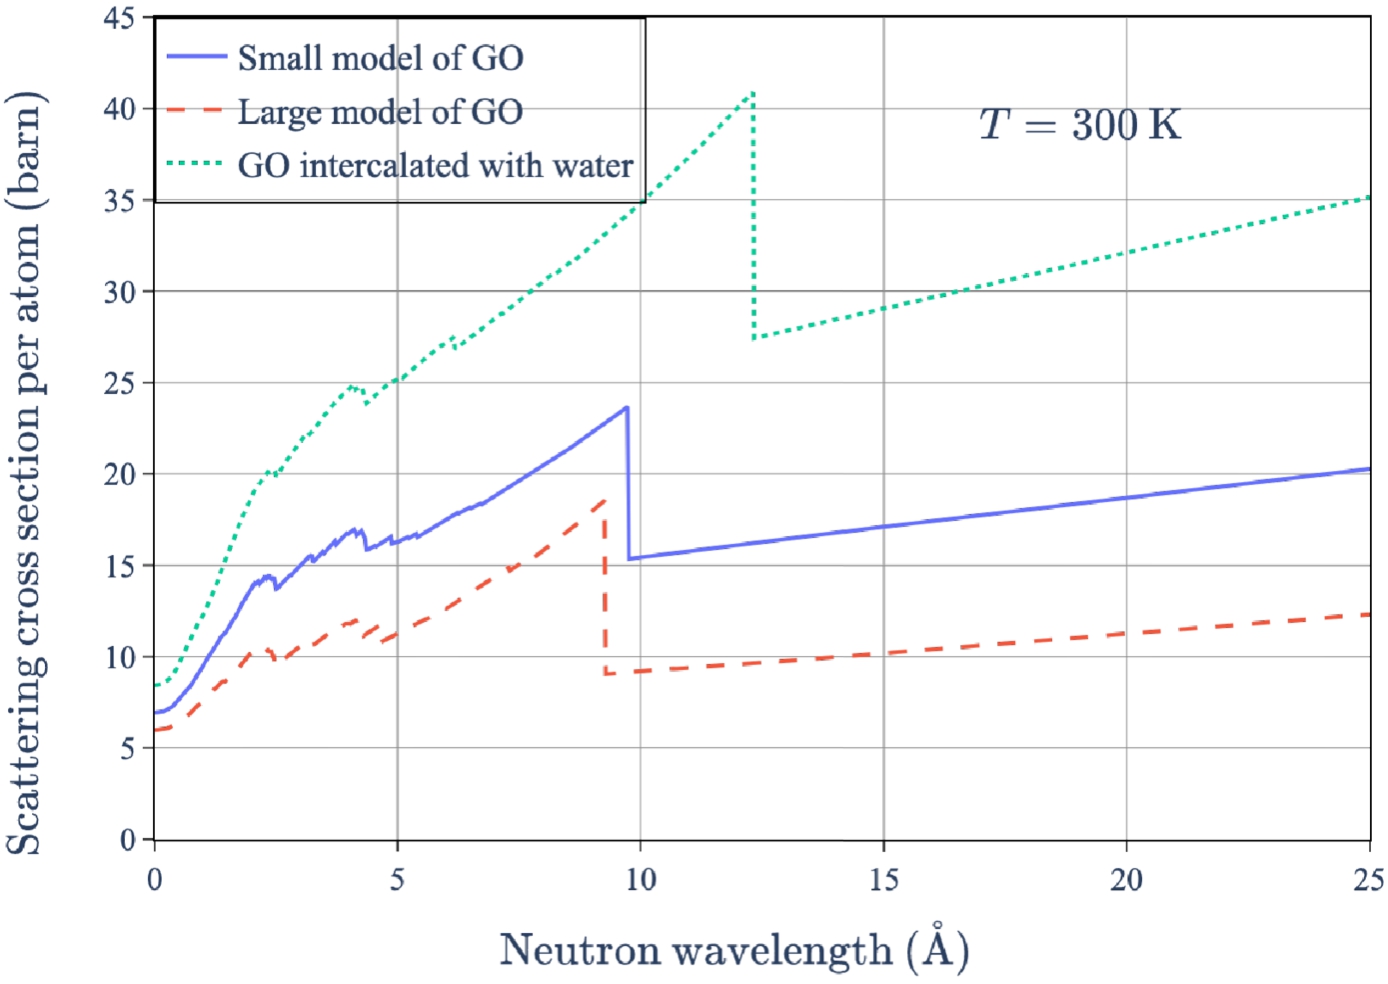
For the graphitic material presented in Section 9.2.3, the crystalline structure and the corresponding PDOS are merged into a .ncmat file by using the NCrystal internal tool. Examples of the theoretical neutron scattering cross sections are presented in Figs 189 and 190.
Fig. 190.
Neutron scattering cross section of fullerite, calculated based on the PDOS and crystalline structure presented in ref. [214].
![Neutron scattering cross section of fullerite, calculated based on the PDOS and crystalline structure presented in ref. [214].](https://content.iospress.com:443/media/jnr/2023/25-3-4/jnr-25-3-4-jnr230950/jnr-25-jnr230950-g191.jpg)
Figure 189 show the results for GO for the two different simulation models in addition to GO including water intercalation. It can be seen that the addition of the water extends the Bragg-cutoff to higher wavelengths. The scattering cross section per atom of the small model (C8O(OH)2) is larger than that of the large model (C18O(OH)2), because the atomic density of hydrogen is higher in the small model. The effect of deuteration is to the lower the cross-sections, due to the exchange of H to D, which results in a lower incoherent elastic scattering in the material.
Figure 190 shows the results for the fullerite model, which exhibits an extension of the Bragg-cutoff to even higher wavelengths, compared to the graphite oxide models. The neutron scattering cross section is obtained using the crystalline structure and the DFT-calculated PDOS which are detailed in Ref. [214].
In addition to the above, the .ncmat files for all graphite compounds investigated can be found in the HighNESS Github repository. This includes deuterated graphite oxide, deuterated intercalated graphite oxide, and a couple other intercalated graphites.
9.4.Extensions of NCrystal to include new physics
A unique feature for the code NCrystal is that it can be called on-the-fly during a Monte-Carlo simulation. This makes it possible to avoid limitations in the ENDF nuclear data format and include new physics that were not possible before through usage of plugins.
The support for plugins was introduced in NCrystal release versions 2.2.x–2.4.x and they are to be developed according to the descriptions given on the wiki pages [139,140]. The development process includes picking a name for the plugin, forking the plugin template library and developing the plugin to combine new physics models with the existing models in NCrystal. A template repository and example infrastructure to facilitate validation, debugging and bench-marking of the new plugin are provided to make it easier for new users to get started. After the plugin is developed, it can be compiled as a shared library or directly into a given NCrystal installation and all plugins developed should appear as forks of the ncplugin-template repository [138]. In addition, NCrystal release version 2.1.0 includes the ability to define custom data in the NCrystal material data files, which can be used by the new physics models developed in the plugin. These developments have made it possible to include small-angle neutron scattering, magnetic scattering, and texture effects directly into NCrystal and will be described below.
9.4.1.Small-angle neutron scattering plugin
The design and optimization of reflector systems for very-cold and ultracold neutron sources based on NDs critically relies on an efficient and validated implementation of SANS. For this reason, we investigated different approaches for integrating in Monte-Carlo codes a pre-existing empirical model for SANS in NDs powder. The first possibility consists of extending the NCrystal poly-crystalline kernel by adding the SANS process through a plugin which is interfaced through NCrystal with other radiation transport codes, e.g. McStas, Geant4 or OpenMC. The other possibility is to implement the ND calculation directly in the Monte-Carlo code and use a modified .ACE SANS file, as was done in [83]. This work has been presented in earlier papers [50,166].
The empirical model that serves as a starting point for both implementations is based on the work by Granada et. al. [82,83] and was implemented prior to the beginning of this project [50]. The idea is to fit a simple model to the SANS structure factor measured by Teshigawara et. al. [195]. This approach takes into consideration the nanoparticle size distribution, because it affects the experimental SANS structure factor.
Fig. 191.
Structure factor
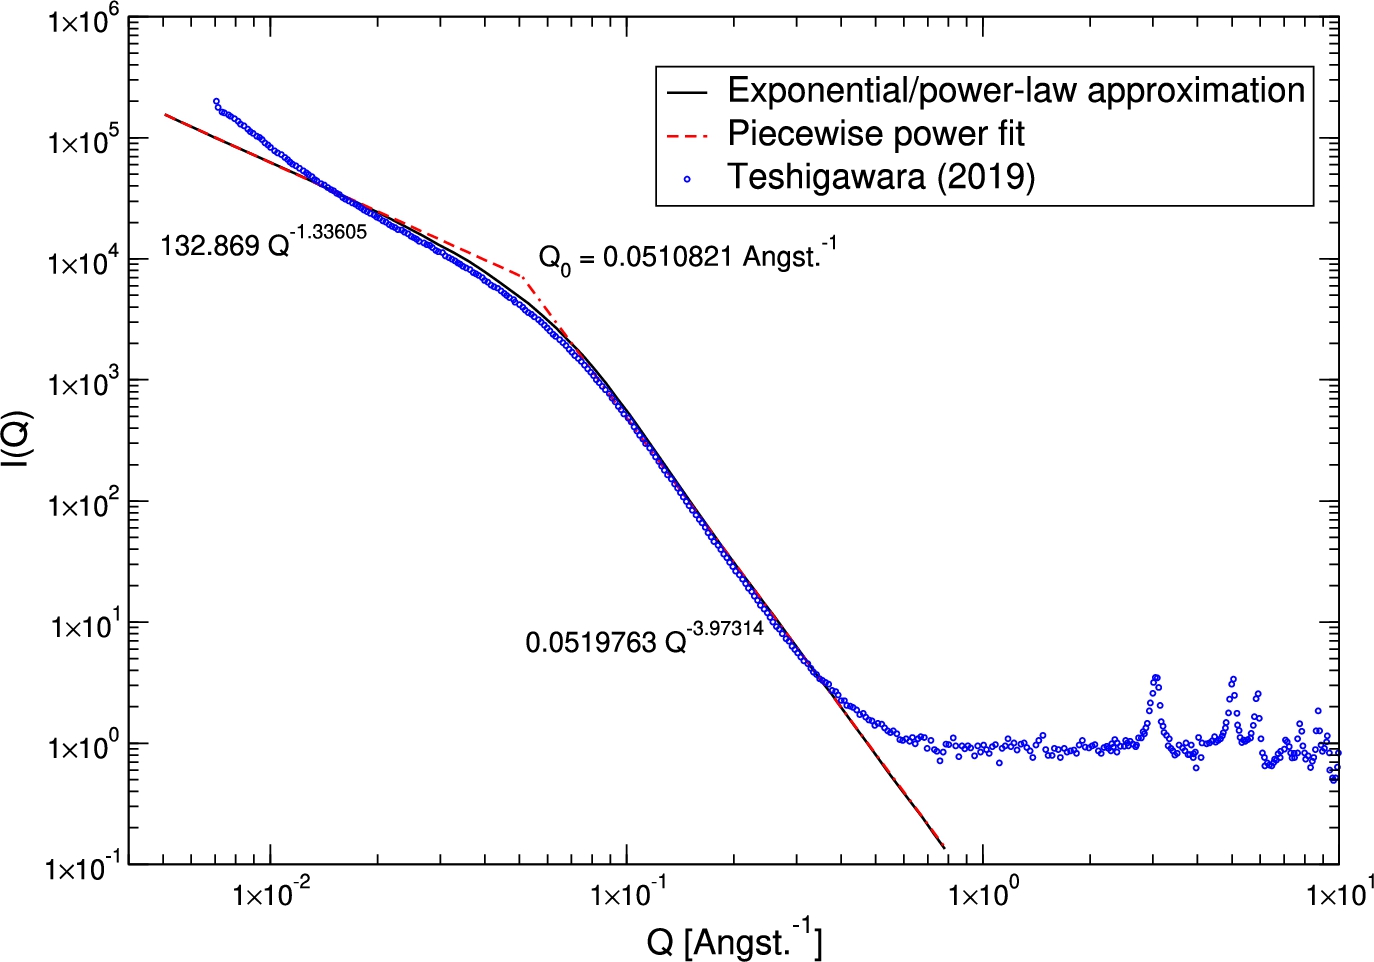
In the Teshigawara work, the experimental results were fit using the unified exponential/power-law approximation, as expressed in Eq. (3) in [15], while this implementation further simplifies the fit function in a piecewise power law:
This model has been implemented as a plugin in NCrystal and has been extensively benchmarked in [166].
In Fig. 192 we can see the calculated total scattering cross-sections using the phonon frequency distribution for perfect diamond and the one based on the finite size of the ND particles using the NCrystal plugin. It can be seen that the scattering cross-section is dominated by small-angle neutron scattering at low-energies, while the finite size of the NDs impacts the inelastic component of the cross-section.
Fig. 192.
Calculated scattering cross-sections and components for NDs using the phonon frequency distribution of perfect diamond and the phonon frequency spectrum based on a finite-size of the ND particles. From [55].
![Calculated scattering cross-sections and components for NDs using the phonon frequency distribution of perfect diamond and the phonon frequency spectrum based on a finite-size of the ND particles. From [55].](https://content.iospress.com:443/media/jnr/2023/25-3-4/jnr-25-3-4-jnr230950/jnr-25-jnr230950-g193.jpg)
9.4.2.Magnetic scattering plugin
Clathrate hydrates hosting oxygen are considered as promising candidates due to neutron inelastic magnetic scattering with oxygen [230]. A tiny energy around 0.4 meV, which corresponds to the zero-field splitting constant, can be removed from the neutrons due to the magnetic interactions with the electrons of oxygen molecules in paramagnetic states. Based on the theory derived by Zimmer [230], the equations of the magnetic scattering kernels are implemented as a plugin named ncplugin-MagScat in NCrystal.
At low temperatures, molecules in crystalline oxygen appear to be antiferromagnetically ordered [67,119]. Oxygen molecules are in paramagnetic states when they are kept sufficiently far away to avoid magnetic ordering, e.g., enclathrated in clathrate hydrates [230]. Paramagnetic molecular oxygen possesses a spin triplet ground state characterising the spin state projection along the symmetry axis of the molecule. The transition of the magnetic levels or spin orientation results in changing the neutron kinetic energy with 0.4 meV due to the molecular zero-field splitting. The physics of neutron scattering with paramagnetic oxygen is derived in Ref. [230]. Nevertheless, only the inelastic magnetic cross sections are given, the derivation of the theoretical outgoing neutron distribution or the scattering kernels required by Monte-Carlo simulations remains undone. Scattering kernels or
The aim is thus to include and validate the physics of neutron scattering with paramagnetic oxygen in the Monte-Carlo neutron transport simulations. To this end, we use the open source software package NCrystal to calculate the neutron nucleus scattering kernels and benefit from its flexibility and versatility to include the magnetic physics in a plugin named ncplugin-MagScat. NCrystal can be used as a backend for the Monte-Carlo particle transport code OpenMC, which provides a possibility to validate the implemented magnetic scattering model by comparing with the experimental measurements reported in the literature, performed by Chazallon et al. on O2 clathrate hydrate [39] and Renker et al. on O2-C60 [164], respectively.
Based on Ref. [230], the neutron magnetic scattering kernels or dynamic structure factors
Fig. 193.
Time-of-flight spectrometer IN6 at ILL.
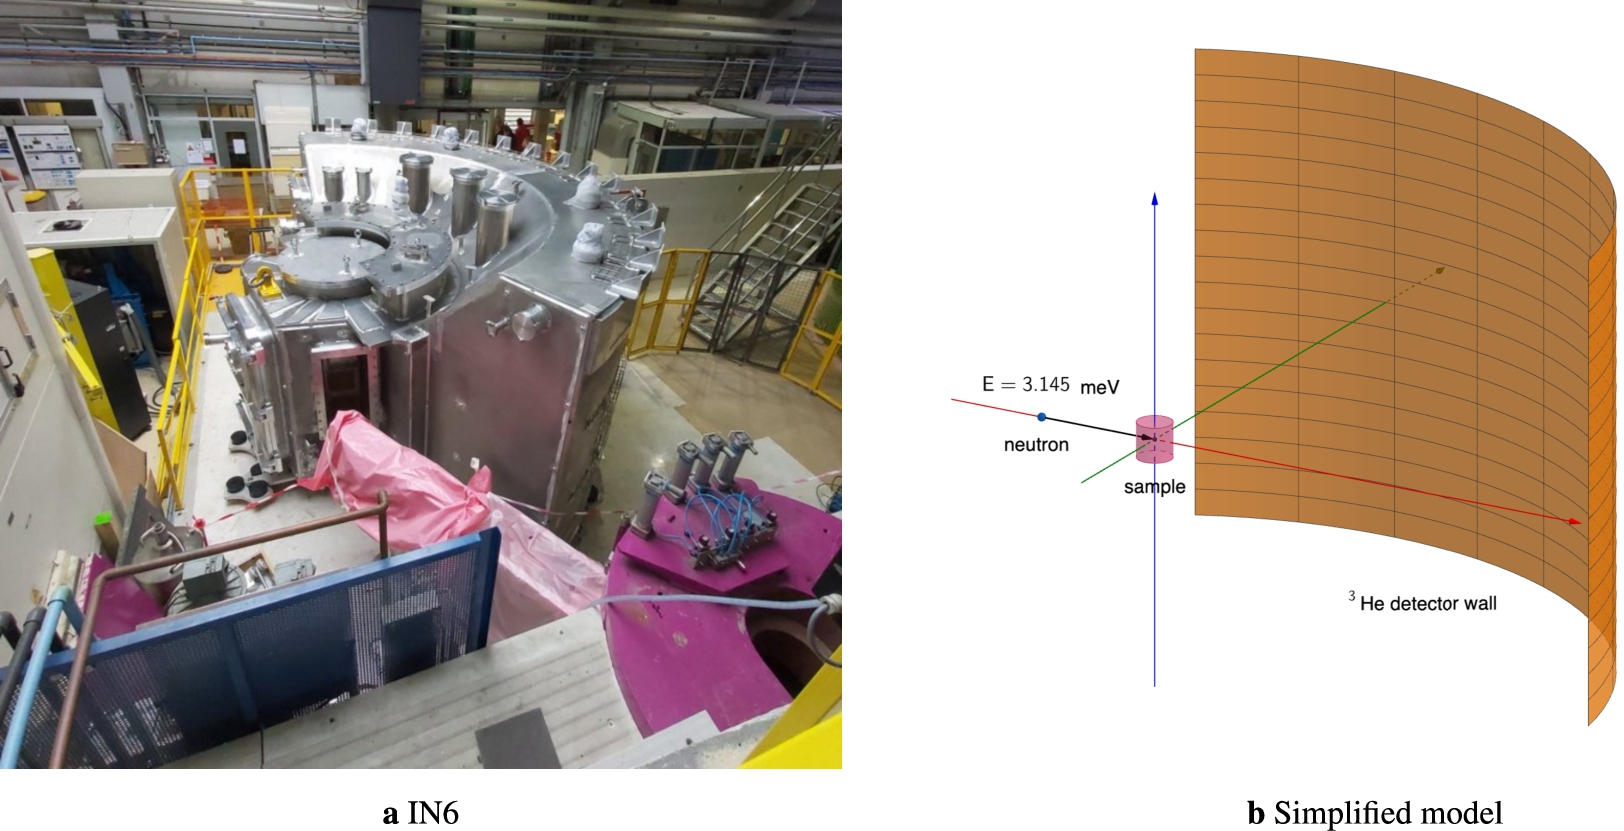
The above model has been integrated into a NCrystal plugin and more details are listed in Ref. [214]. It is pointed out in Ref. [230] that the inelastic neutron scattering due to magnetic effects was observed in the experiments performed by Chazallon et al. [39] on O2-clathrate and Renker et al. [164] on O2-C60. Both of the measurements were performed on the time-of-flight spectrometer IN6 (Fig. 193a) at ILL. The incident neutron wavelength was set to be 5.1 Å (3.145 meV) for these two measurements. The incident wavelength is larger than the Bragg cutoff of aluminum (Al) (
MD and DFT calculations are detailed in Ref. [214]. The simulations were performed by using the Monte-Carlo particle transport code OpenMC. From version 0.13.3, OpenMC enables users to define materials through the NCrystal .ncmat file and call the corresponding neutron scattering cross sections on-the-fly. The neutron magnetic scattering kernels calculated by the developed plugin ncplugin-MagScat and the neutron nucleus scattering kernels generated from PDOS can thus be taken into account in the Monte-Carlo simulations.
Based on detailed characteristics found on the website [184], a simplified model of IN6 spectrometer (Fig. 193b) was used in the OpenMC simulations. The distance between the sample position and the cylindrical 3He detector wall is
The experimental corrections were performed to take into account the resolution of the detectors and the motions of the guest oxygen molecules which are temperature-dependant. Good agreement is obtained between the simulated and experimental
Fig. 194.
Comparisons between simulated and experimental
![Comparisons between simulated and experimental S(Q,ω) on O2-clathrate [39] at 2 K and 40 K.](https://content.iospress.com:443/media/jnr/2023/25-3-4/jnr-25-3-4-jnr230950/jnr-25-jnr230950-g195.jpg)
9.4.3.Texture plugin
A polycrystalline material, whose grains are randomly oriented, is referred to as a powder. The calculation of the coherent elastic scattering cross section
Nevertheless, grains having a preferred orientation or texture are observed in polycrystalline materials. The presence of texture can have a significant impact on
The March–Dollase model assumes an axially symmetric orientation distribution around the beam direction [174]. Equation (22) is corrected by multiplying the following term
The March–Dollase model has been implemented in the NXS code [25]. The coherent elastic cross sections for aluminum calculated by NXS and our NCrystal plugin are compared in Fig. 195. We obtain an excellent agreement for powder aluminum. In Equation (22), when
Fig. 195.
Comparison of coherent elastic scattering cross section calculated by the NXS code and the NCrystal plugin for aluminum with and without texture.
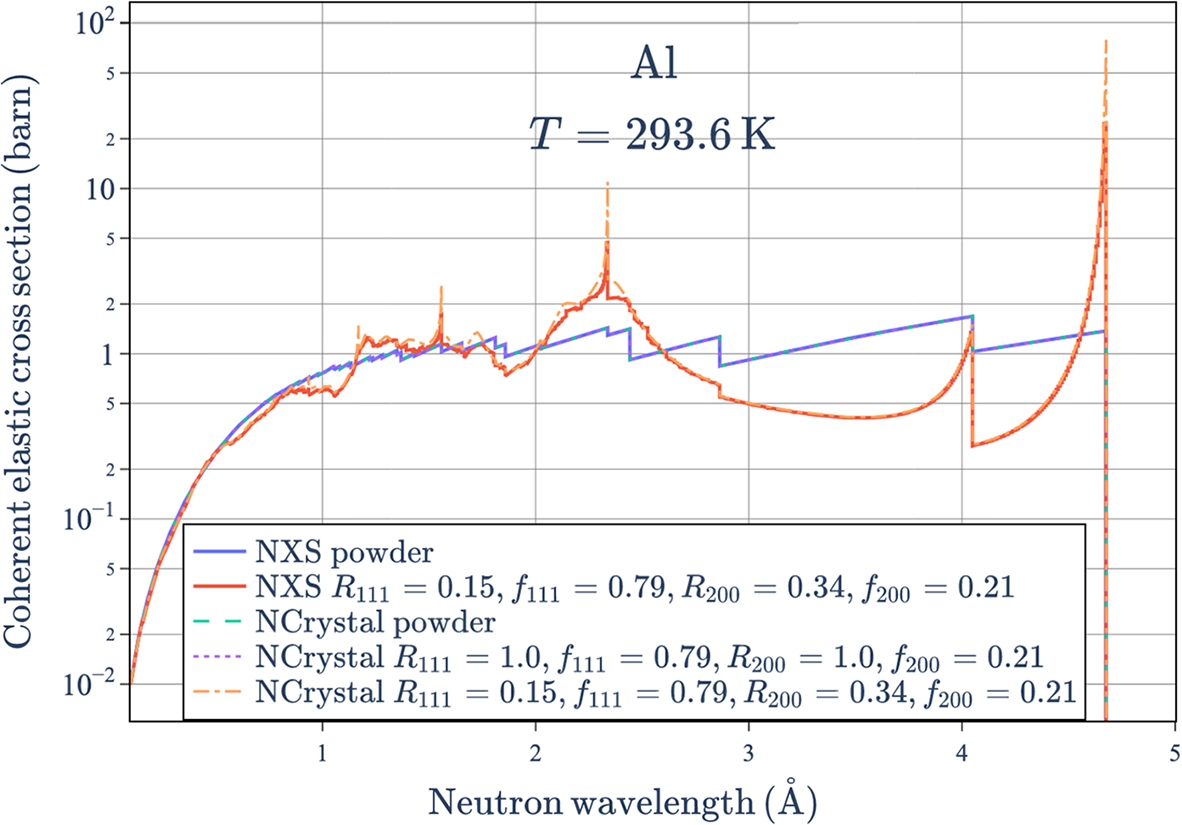
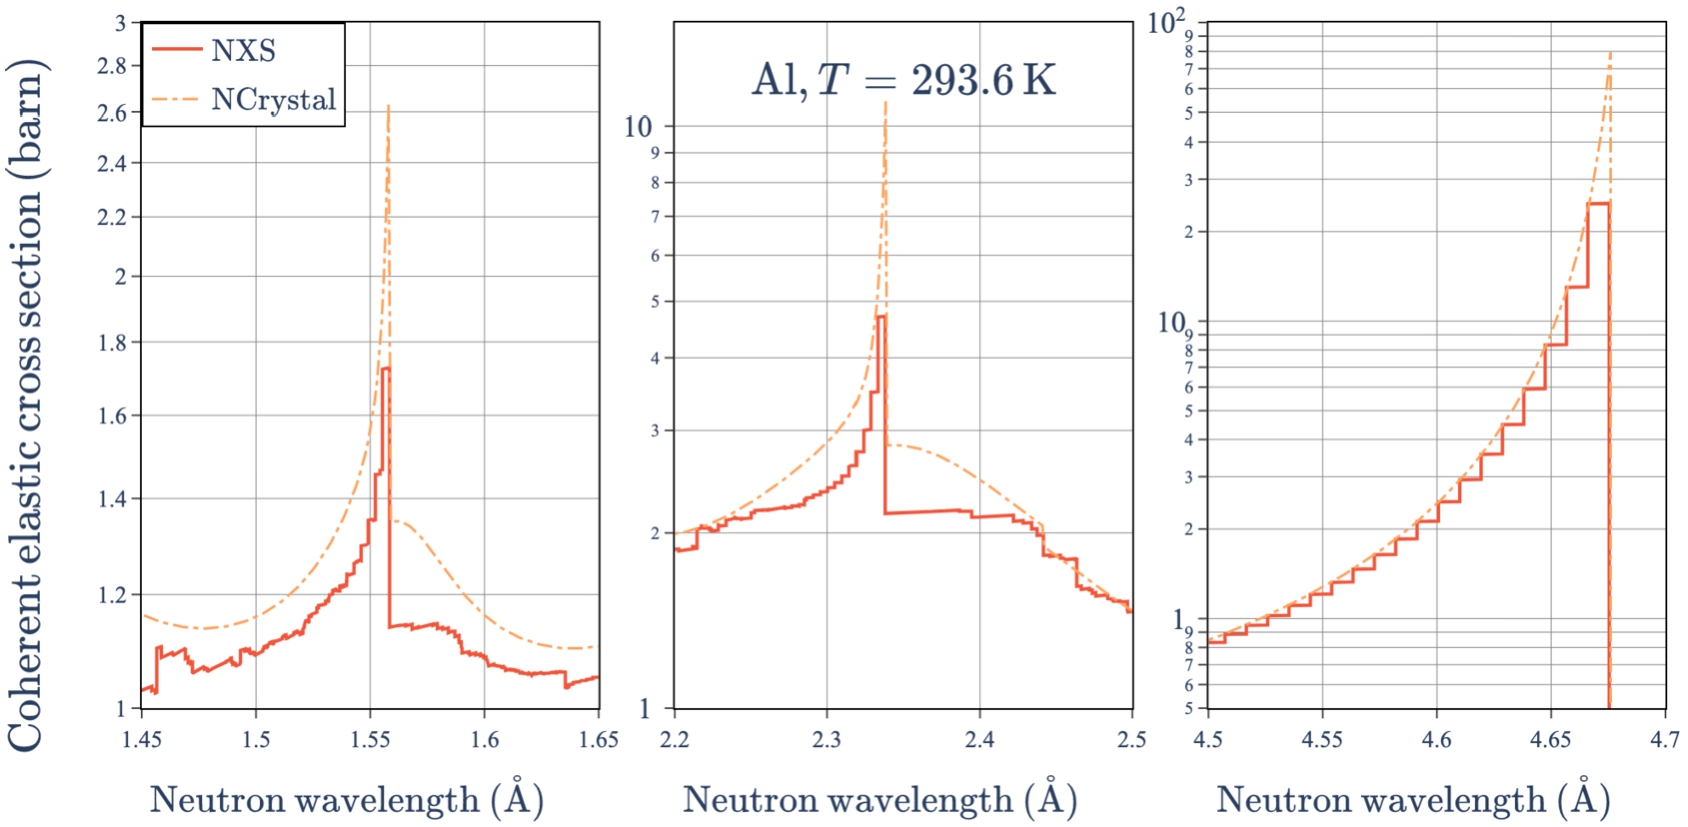
9.5.Experimental investigations of graphitic compounds
To support the work on the graphitec compounds, we carried out a series of measurements at the BOA [133] beamline at the Paul Scherrer Institute. These measurements were deemed necessary due to the lack of information of neutronic properties of expanded Bragg-edge graphitic compounds, and as a way to understand the structural and dynamical properties of the material better.
For the measurements, we prepared several different graphitic compound samples in flake form. These included normal graphite, graphite oxide, deuterated graphite oxide, graphite oxide intercalated with water and deuterated graphite oxide intercalated with heavy water.
Figure 197 shows examples of (wide-angle X-ray scattering) WAXS data collected at the CoSAXS beamline at MAX-IV for graphite, graphite oxide, and graphite oxide mixed with water. The plot clearly shows a decreasing value of q for the narrow peak, which indicates an increased interplanar spacing and thus a larger Bragg cutoff. The shift in the peak between graphite and graphite oxide is due to the oxidation of the graphite, while the shift in peak between graphite oxide and the graphite oxide mixed with water sample is due to the intercalation of water molecules between the planes of the graphite oxide.
Fig. 197.
Examples of diffraction data collected at CoSAXS.
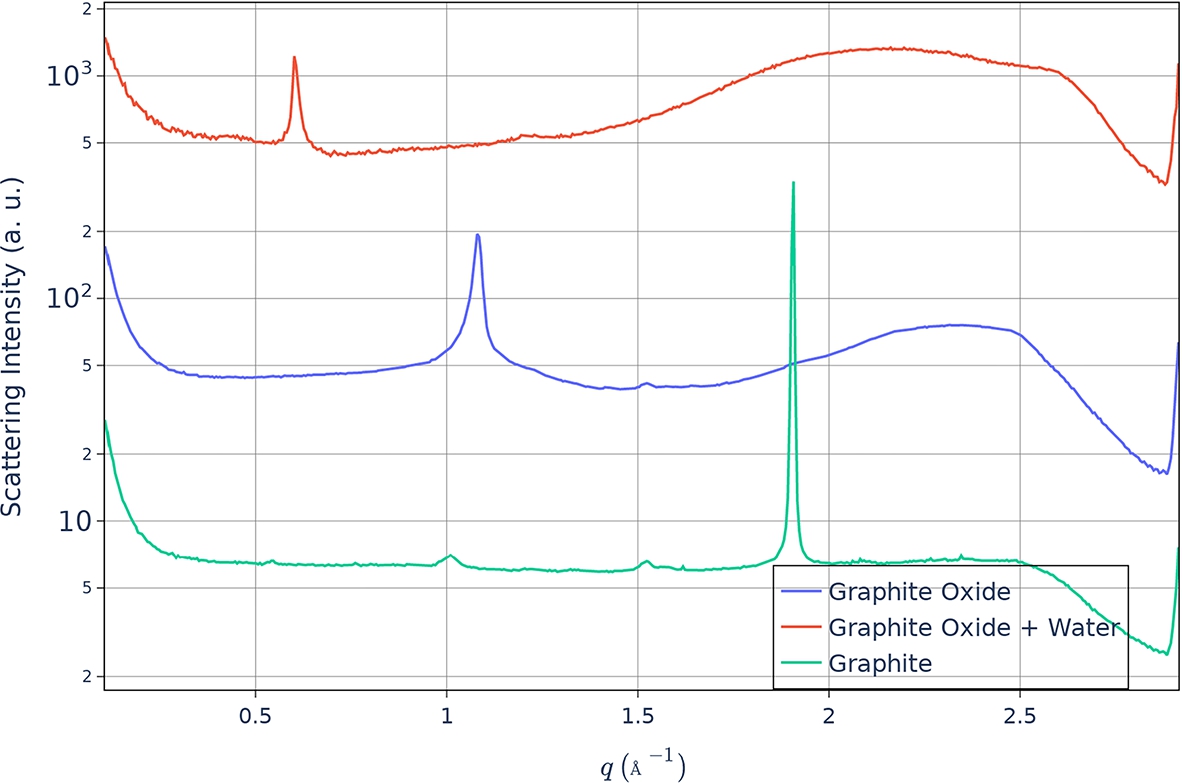
For the experimental campaign at BOA, we also developed a triaxial transmission sample holder (Fig. 198), which provides the same optical depth and the same center for the three directions. This was used to explore texture effects in the samples.
Fig. 198.
Sample holder for triaxial transmission experiments.
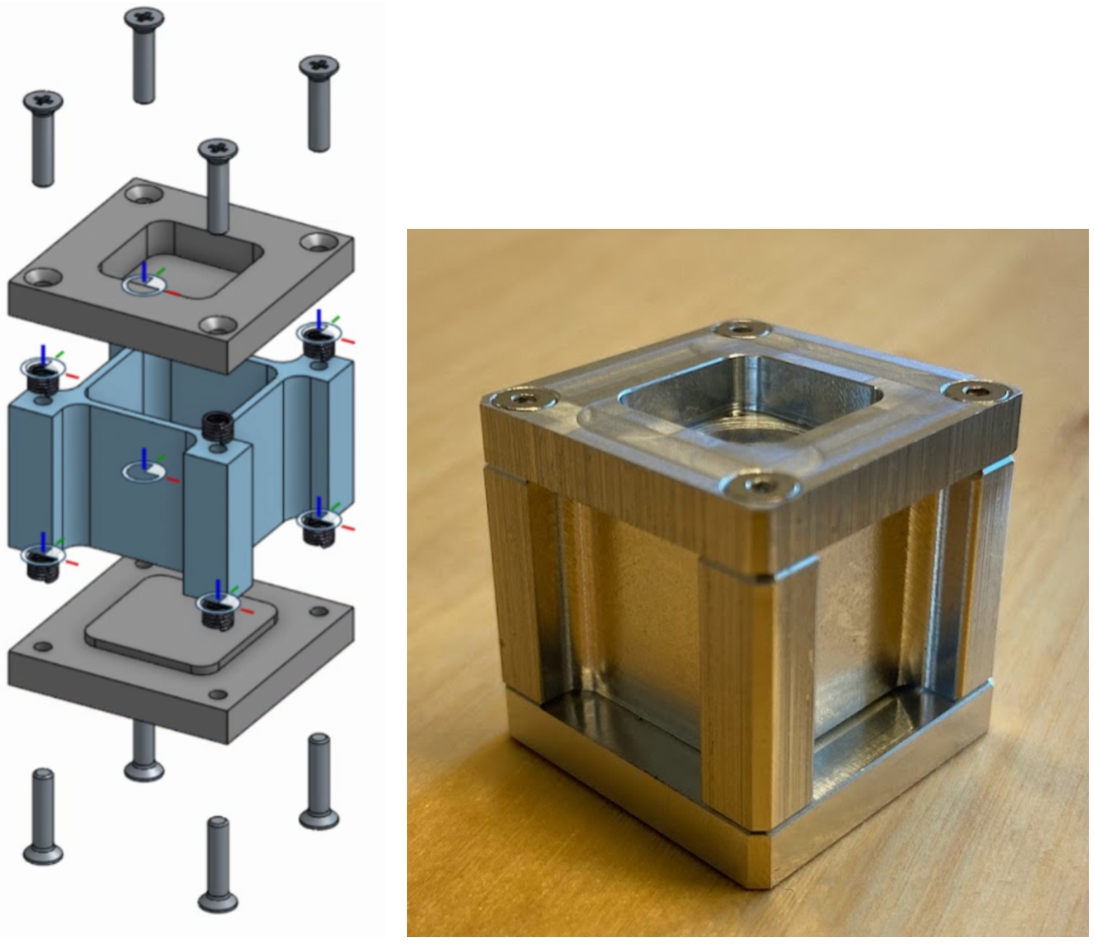
The measurements were carried out over three different beamtimes at BOA. In the first experiment we used the imaging setup of the instrument, however it was found that the background levels above 8 Å were too high in order to resolve Bragg-edges above this limit.
For the second measurement, we made major revisions to the setup in order to reduce the background above about 8 Å. This included the usage of a neutron collimation system from the PSI Neutron Optics and Computing Group, in combination with a flat, 8.5 mm thick multi-tube He-3 detector. We also used a flat
Fig. 199.
Measured spectra for the three experiments at BOA in PSI. From the first to the second experiment, background was significantly reduced, which resulted in an increase of the usable wavelength range. From the third experiment, the neutron mirror was removed, which made it possible to measure in the range 1–2 Å, at the expense of the long wavelength region.
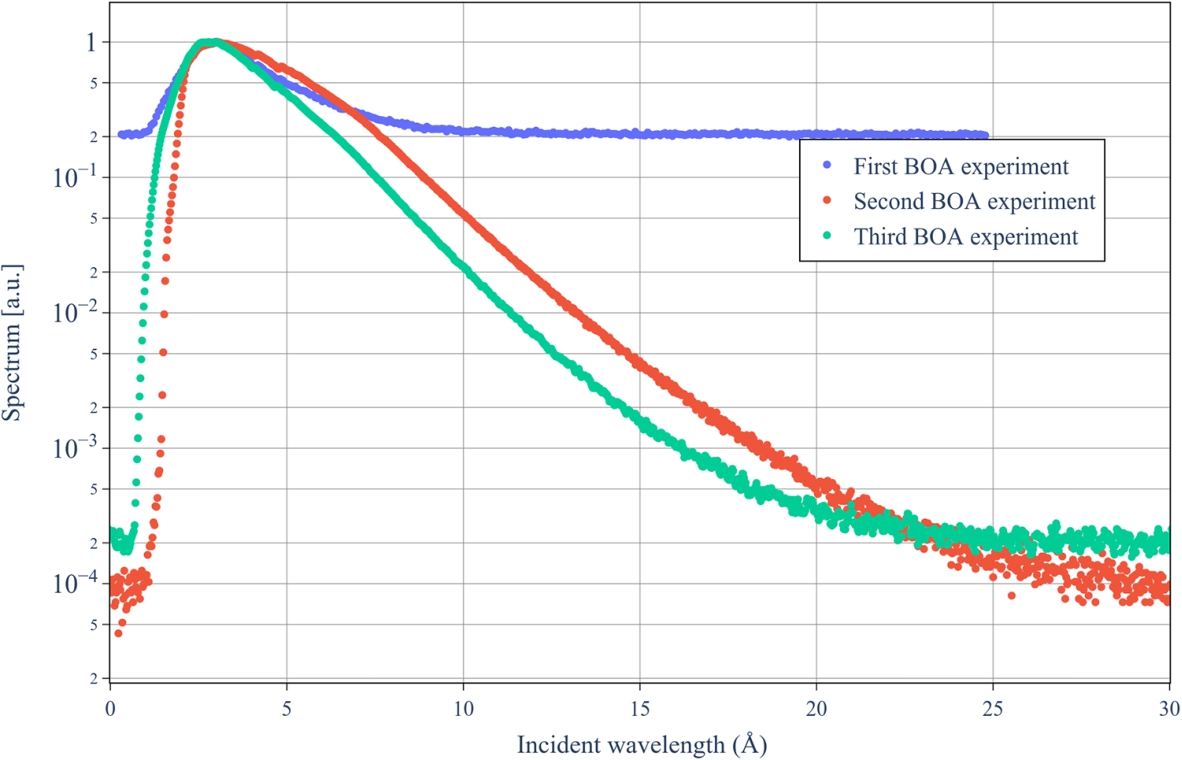
Fig. 200.
Measured total cross-sections for graphite and graphite oxide in the second PSI experiment.
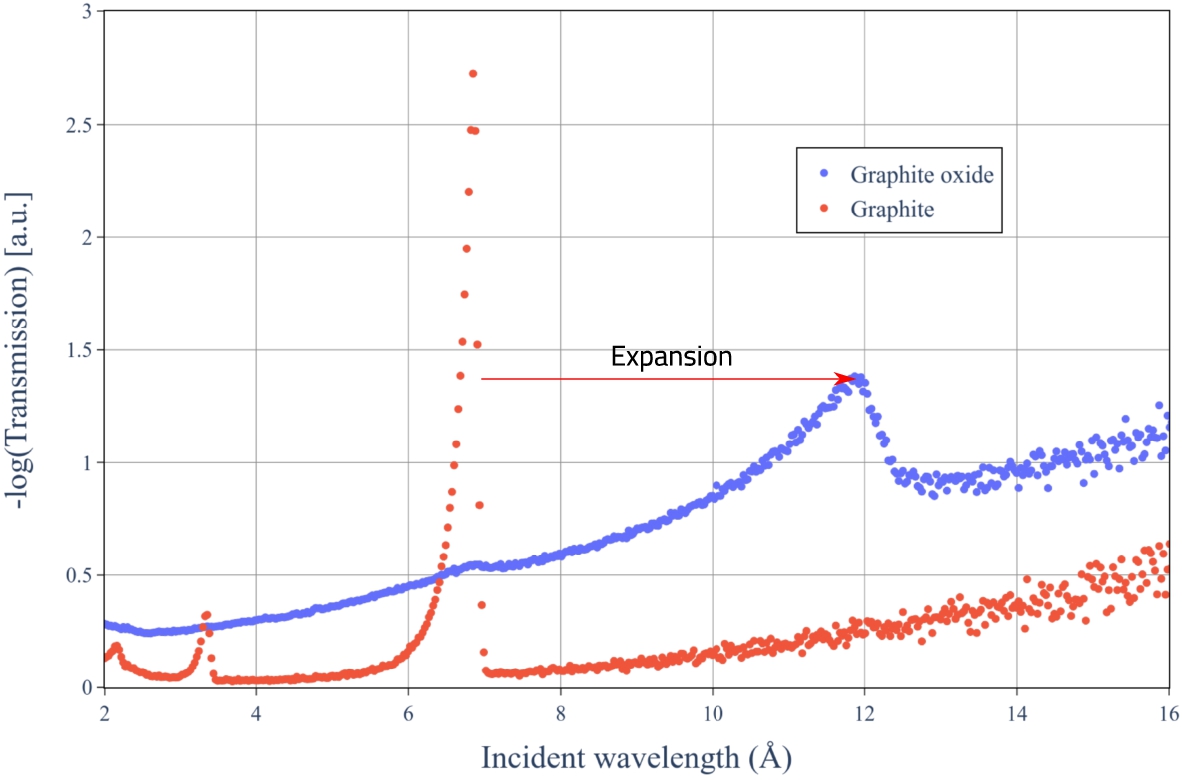
The main aim of the third measurement at BOA was to investigate texture effects in the graphite oxide samples. The spectrum obtained from this measurement is also shown in Fig. 199, where the differences at lower wavelength appear as the mirror was not used in the latter measurements.
A preliminary analysis of the results confirms the presence of texture in the samples, which can be appropriately represented using the March–Dollase texture implemented in NCrystal. Figure 201 shows the total cross section in the direction of compression for graphite flakes. It can be well represented by a combination of a texture model, to include the orientation of the flakes during the filling of the sample holder, and a SANS model to include the microscopic porosity of the graphites. This combination of models will also be used for further analysis of the measured spectra for other graphitic materials.
Fig. 201.
Total cross section for graphite flakes, measured and computed in the direction of compression.
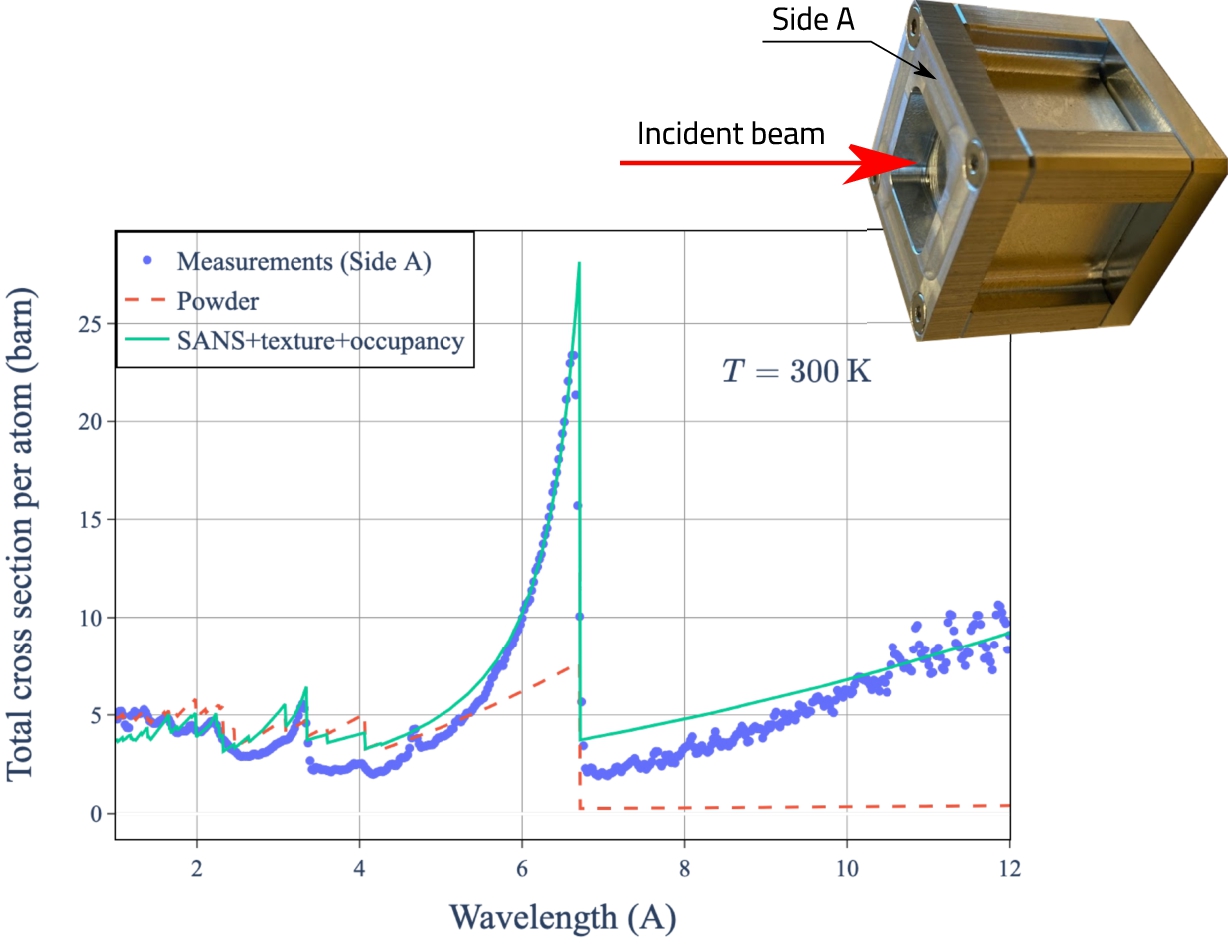
9.6.Advances on NCrystal
In addition to the above mentioned developments, NCrystal has undergone extensive upgrades over the course of the HighNESS project. This goes back to NCrystal release version 2.1.0. These releases include developments motivated not only by the HighNESS project, but also by outside projects and cover a wide range of areas such as improvements to the code and data format, extending and introducing new features and data, and bug fixes, just to name a few. A limited selection of specific examples are highlighted below. More information can also be found in the change logs [137], covering developments not only related to this work but also outside projects. Several of these developments are listed below.
NCrystal version 2.5.0 was a major technical upgrade to NCrystal which included changes to more than 200 files amounting to around 15,000 lines of code. The main motivation for these improvements was to bring NCrystal code up to modern C
Release version 2.6.x includes improvements to handling observed artifacts in calculated inelastic cross-sections due to low-granularity beta-grids and phonon density of states curves in addition to the possibility to estimate atomic mean-squared-displacements from the phonon density of states. The latter contribution improves the reliability of the Debye–Waller factors at low-temperatures in elastic scattering components.
Release version 2.7.0 [136] of NCrystal includes a massive addition of 64 new crystalline materials to the NCrystal library. Many of the new materials are of wide interest to the nuclear community, but serve as an important validation for NCrystal. Included in this library are also the data generated in this work for magnesium hydride and magnesium deuteride. The release also contains the useful scripts, ncrystal_verifyatompos and ncrystal_onlinedb2ncmat, for verification of input of the crystal structure of a material and also against multiple online databases (such as materialprojects.org or the Crystallography Open Database), respectively.
NCrystal was also updated to include improved sampling of scattering kernels for very cold and ultracold neutron producing materials. This was included in the release 3.1.0 of NCrystal. One practical challenge, facing in particular UCN moderator design studies, is that only a tiny fraction of scattered neutrons will normally be left with an energy at the desired UCN scale (hundreds of neV). Thus, in order to get sufficient statistics, while keeping computational requirements reasonable, it is necessary to employ some sort of biasing or variance reduction scheme. This is facilitated by making it possible to split a scattering process into two components: a down-scatter-to-UCN-regime process and a process with the rest of the physics, by respectively appending “;comp = inelas;ucnmode = only” and “;ucnmode = remove” to a given NCrystal material cfg-string. Furthermore, the dedicated UCN process is implemented with a special improved model which is believed to be completely free of any modelling artifacts. A new configuration parameter, ucnmode is used to control this UCN process split-up (cf. CfgRefDoc for details). Note that in order to divide neutrons into UCN and non-UCN regimes, the code also needs the definition of a UCN threshold energy. If not set explicitly, this will default to 300 neV (
In order to properly implement and validate the work described above, several internal utilities were added related to scattering kernels. This includes code for easily evaluating scattering kernels at any alpha and beta point, as well as utilities for what is essentially exact sampling or integration for cross sections. These utilities are useful as they allow us to validate scattering kernel models better, are used directly in the new UCN-production models, and will hopefully facilitate future improvements.
NCrystal was further improved in order to facilitate the HighNESS thermal neutron scattering school held in May 2023 at the ESS. In preparation for this school, new tools were added, including for example better material creation via a python API.
9.7.Contents of the HighNESS repository
. The software described here is freely available in the Github repository of HighNESS and is hosted in the Github platform, following the directives of the HighNESS Data Management Plan. The following is a list of the major software developments within the project.
OpenMC + Ncrystal:
NJOY + Ncrystal:
NJOY + Ncrystal Library (MgH2, MfD2 and additional materials):
OpenMC with modifications to support mixed-elastic scattering:
Texture Plugin:
NCMAT files for graphitic materials:
Magnetic Scattering Plugin:
NCMAT files for clathrates:
9.8.Conclusions
In this section we have presented developments of simulation software for describing neutron interactions in novel moderator and reflector materials considered of interest for the HighNESS project. The main focus has been the development of software to describe interactions in ND particles, magnesium hydride, graphitic compounds with extended Bragg-edges compared to normal graphite, and the clathrate hydrates.
For this purpose we have investigated two main approaches for including thermal neutron scattering data in Monte-Carlo simulations. In the first case we developed the tool NJOY + NCrystal to support a number of options for creating nuclear data in the format for Monte-Carlo simulations. The tool supports the creation of libraries for polycrystalline materials in a format that can be directly used with these codes, or in an improved mixed-elastic format which can be used with modified Monte-Carlo codes.
This approach is however still limited to polycrystalline materials with standard elastic and inelastic scattering components. Thus, to include effects like small-angle neutron scattering and magnetic scattering, we developed a plugin feature for NCrystal. Through this approach Monte-Carlo codes can access NCrystal on-the-fly, instead of accessing a nuclear data library, making it possible to extend the types of physics process included in the simulation.
Additionally, we have carried out extensive molecular modelling simulations in order to provide updated and new data for input to the neutron scattering models. For example, we investigated finite size effects on the phonon frequency spectrum of ND particles in addition to producing new data for magnesium hydride, graphitic compounds and the clathrate hydrates.
Finally, we carried out an experimental campaign at the BOA beamline of PSI in order to aid in the benchmarking of the graphitic compound models and to investigate the possibility of using this beamline for measurements of very cold neutron scattering cross-sections. We demonstrated through these experimental efforts that the background on the instrument could be reduced to a level where it was possible to resolve the Bragg-edges around 12 Å in our graphitic compound samples.
10.Experimental campaign with advanced reflectors
In this section, the experimental efforts to test the advanced reflector configurations highlighted during the HighNESS project are presented. In line with the plan described in the HighNESS proposal, the optimal beam extraction configuration for a mock-up experiment is identified in Section 10.1. The host institute chosen for this experiment is the Budapest Neutron Center (BNC), where a cold moderator test facility (CMTF) has been constructed [193]. The purpose of a CMTF is to provide users with a facility designed to test moderators, both for high-power and compact sources. In this setup, an out-of-pile moderator and reflector system is fed by the fast and thermal neutrons coming from the 10 MW BNC research reactor. The setup of the HighNESS experiment is designed to test the effect of advanced reflectors both around the cold source and in the beam extraction, taking into account the constraints imposed from the facility.
After having approximated the appropriate dimensions for the reflector layer and the diffusive extraction channel, this information was transferred to the engineering team, and served as starting point for the engineering design. Several iterations between neutronic and engineering design were done before the prototype was manufactured. First neutron and gamma dose measurements were performed at 1 MW reactor power at the channel outlet (near reflector) and outside the bunker on June 5th 2023. The low level of the background allowed for the beamline to also be opened at 10 MW. The outside bunker measurements were found to be within the local regulation limits; some parts of the bunker, however, needed to be reinforced.
In the context of a separate experiment planned by the Mirrotron company, the CMTF installation was completed in the reactor hall on June 23rd 2023, making it possible to obtain a 2D image from the moderator using a pin-hole system. Due to delays linked to reactor operation, however, the HighNESS measurement campaign was postponed until September 18th through the 29th.
After the preliminary experiment in Budapest Neutron Center, an opportunity arose to perform an additional experiment at the test station built in the Big Karl area of the Institute of Nuclear Physics (IKP) in Forschungszentrum Jülich (FZJ), a newly build accelerator-driven neutron source [219]. Here we investigated only the effect of putting advanced reflectors around the cold source (cryogenic methane). In this case, due to the short time between the invitation to participate and the allotted beamtime, no prior neutronic study was performed. However, the experience acquired by the engineers from the neutronic design for the experiment in Budapest was utilized in adapting this second experiment to the specific conditions related to the new facility.
In general, the characteristics of the facility that are required for the experiment and were considered in the planning phase are:
- The availability of a cold and stable moderator;
- Sufficient room to install the prototype;
- The availability of neutron detectors, with sufficient resolution to clearly quantify performance difference with a void prototype of same dimensions.
With these conditions in mind, in this section we describe both the experiment performed at the BNC reactor and the experiment performed at the JULIC accelerator in FZJ.
10.1.Mock-up experiment at the Budapest Neutron Center
The proof-of-concept experiment at the CMTF facility at BNC was designed to test the reflective properties of both ND and MgH2 in a representative beam-extraction configuration. In this section, the neutronic design of the experiment is discussed in some depth.
10.1.1.Introduction to CMTF and the HighNESS experiment
The BNC’s objective is to provide users with a prototype of a low-dimensional liquid para-hydrogen cold neutron source with a significantly higher brightness than previously developed neutron moderators, in order to replace the existing moderator. The beamline, sketched in Fig. 202, has been built at channel 4 of the 10 MW BNC reactor. The BNC reactor was commissioned in 1959 at 2.5 MW, refurbished and then upgraded to 10 MW in 1992. The maximum thermal flux is 2.5 × 10¹⁴ n/cm2s.
The CMTF design starts with a steel collimator coupled with one of the reactor channel outlets and with a high-purity box-shaped lead reflector. A 5 cm diameter beryllium disk is placed in the beam path to better diffuse the neutrons coming from the reactor. The moderator vessel consists of a 150-mm-long aluminum alloy tube with a diameter of 25 mm filled with liquid parahydrogen at 20 K placed at an angle of 45° with respect to the direct beam path. The beamline components of the moderator test facility include a collimator, a set of choppers, and a pin-hole imaging system to measure the brightness of the moderator cell based on the camera-obscura principle [68].
Fig. 202.
Sketch of the channel #4 beam line of the 10 MW Budapest Research Reactor of the Budapest Neutron Center (BNC). (1) channel #4 shutter drive, (2) primary carbon steel beam collimator, (3) lead reflector-moderator block, (4) extraction system, (5) cryo-cooler tank, (6) beam stop, (7) pin-hole assembly, (8) rail support system, (9) bunker’s shielding walls.
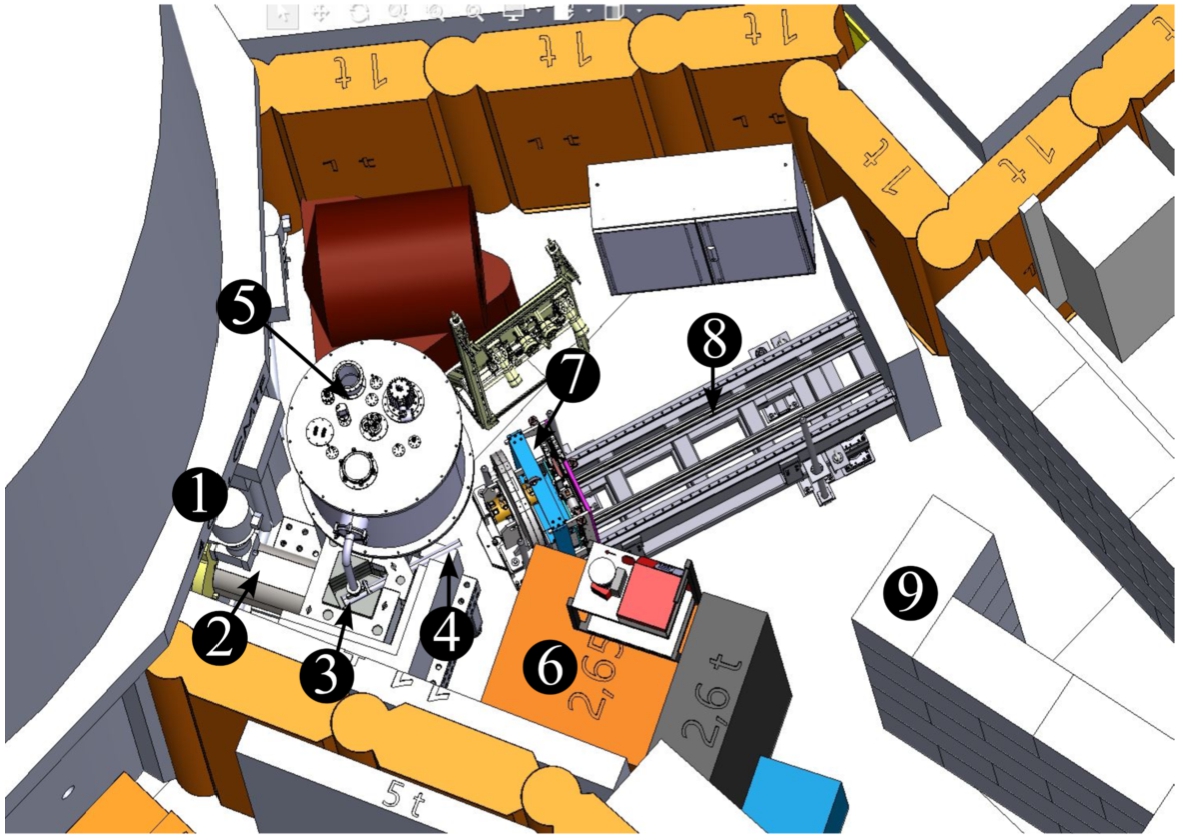
Sectional views in Fig. 203 from the engineering drawings show important features of the reflector-moderator block. The lead reflector is composed of different blocks, which can be removed to accommodate more components, like advanced reflector jackets and an extraction system. The section just above the moderator is left uncovered and is meant to house the pipes of the cryogenic system. Finally, it is important to mention that this design is the result of a long process in the context of a facility that was still under construction. Many features have changed since it was first designed in 2021 and several details were re-defined during the construction (e.g. shielding).
Fig. 203.
Section drawings of the lead reflector-moderator block at the CMTF. (A) vertical section (b) horizontal section at the height of the moderator vessel.
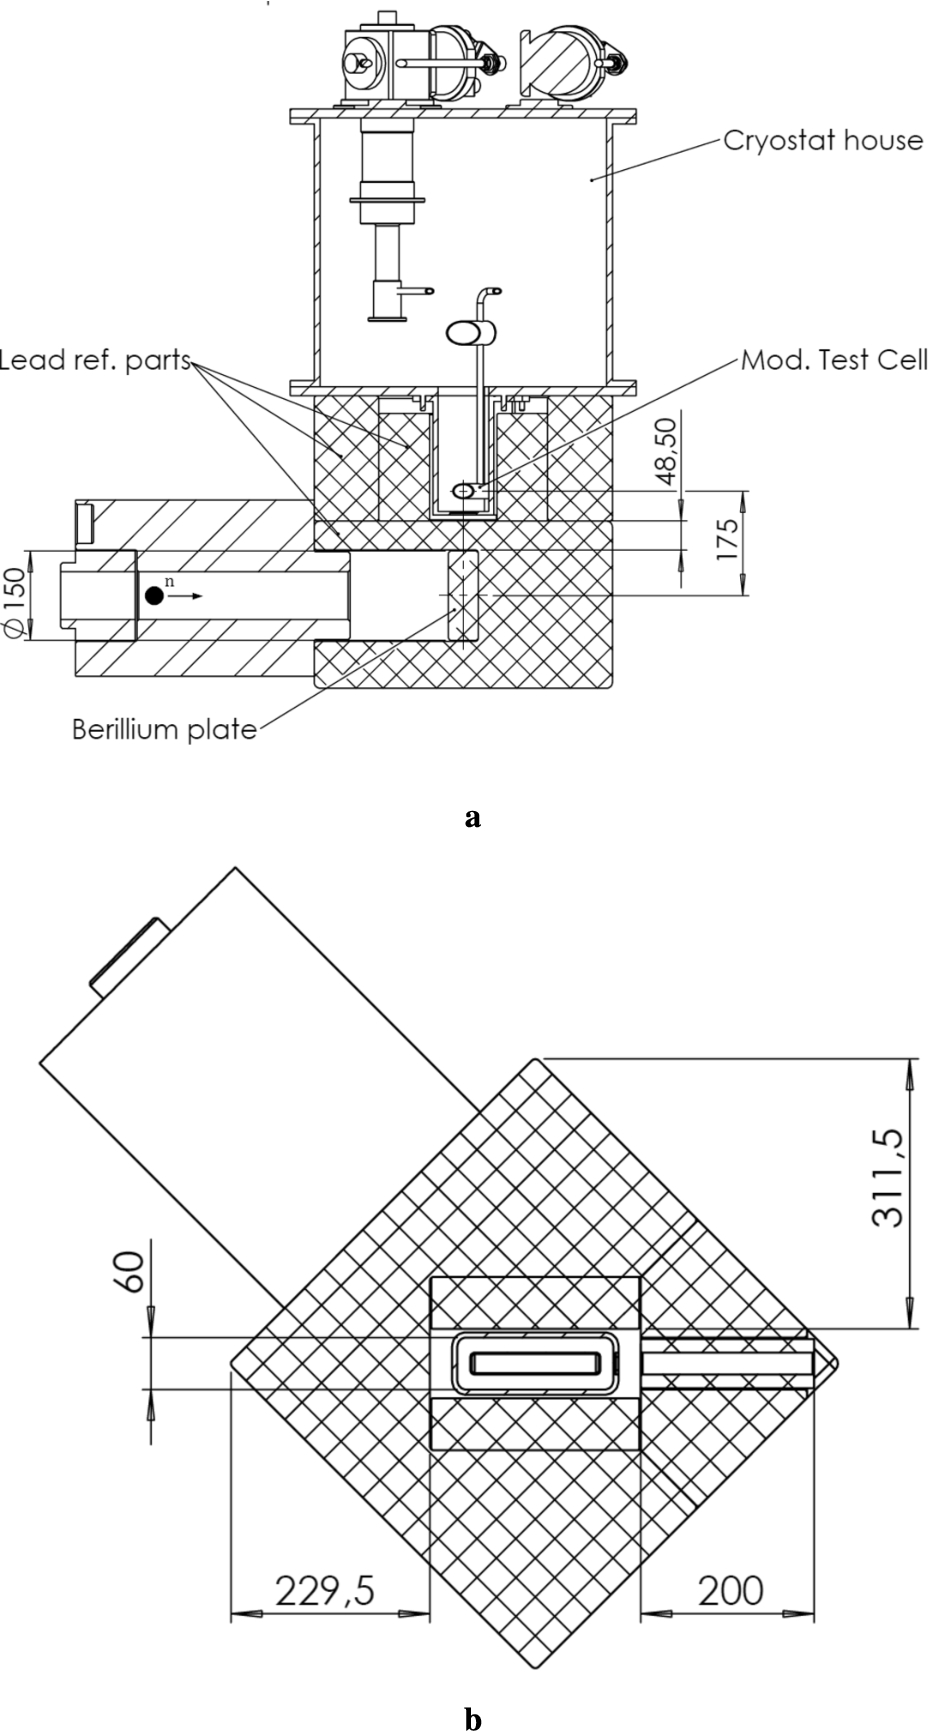
The CMTF concept was the starting point for the design of the HighNESS experiment. The possibility for reusing some of the CMTF components and to adapt them to the HighNESS purposes saved on manufacturing costs, but also imposed some constraints on the neutronic design of the experiment. In particular, we decided to retain the collimator, the lead reflector, and the detection system, which meant that the best option for the source was to keep the same low-dimensional design based on parahydrogen and focus the work solely on the extraction system.
In the extraction channel, a thin layer of ND powder is expected to give a significant increase in the cold neutron flux [100]. This is mainly due to the quasi-specular reflectivity exhibited by ND in the cold energy range. Meanwhile, MgH2 is expected to be much more effective than ND in reflecting the neutrons back into the source, where the environment is dominated by large-angle scattering, hence limiting the neutron leakage in the cold energy range [83]. For these reasons, the proposed set-up for the HighNESS experiment makes the following additions to the CMTF design:
- A reflector vessel that wraps the moderator tube on all sides, except the extraction side.
- An extraction guide with a thin inner layer of ND powder, coupled with the moderator vessel.
The neutron beam from the reactor source enters the test station through an assembly of lead blocks and hits a plate made of beryllium (Be). This Be-plate (in red in Fig. 204) is located directly below the test area for the moderator units and scatters the thermal neutrons, so that they are fed into the moderator and reflector assembly. After the neutrons are slowed down to cold neutron energies, they exit through the ND beam extraction system into the detector area. In the next section, we present the neutronic calculations that lead us to the final dimensions for the prototype of such a system.
Fig. 204.
MCNP model of the lead reflector-moderator block at CMTF produced according to the engineering drawings in Fig. 203. (A) vertical section (b) horizontal section at the height of the moderator vessel.
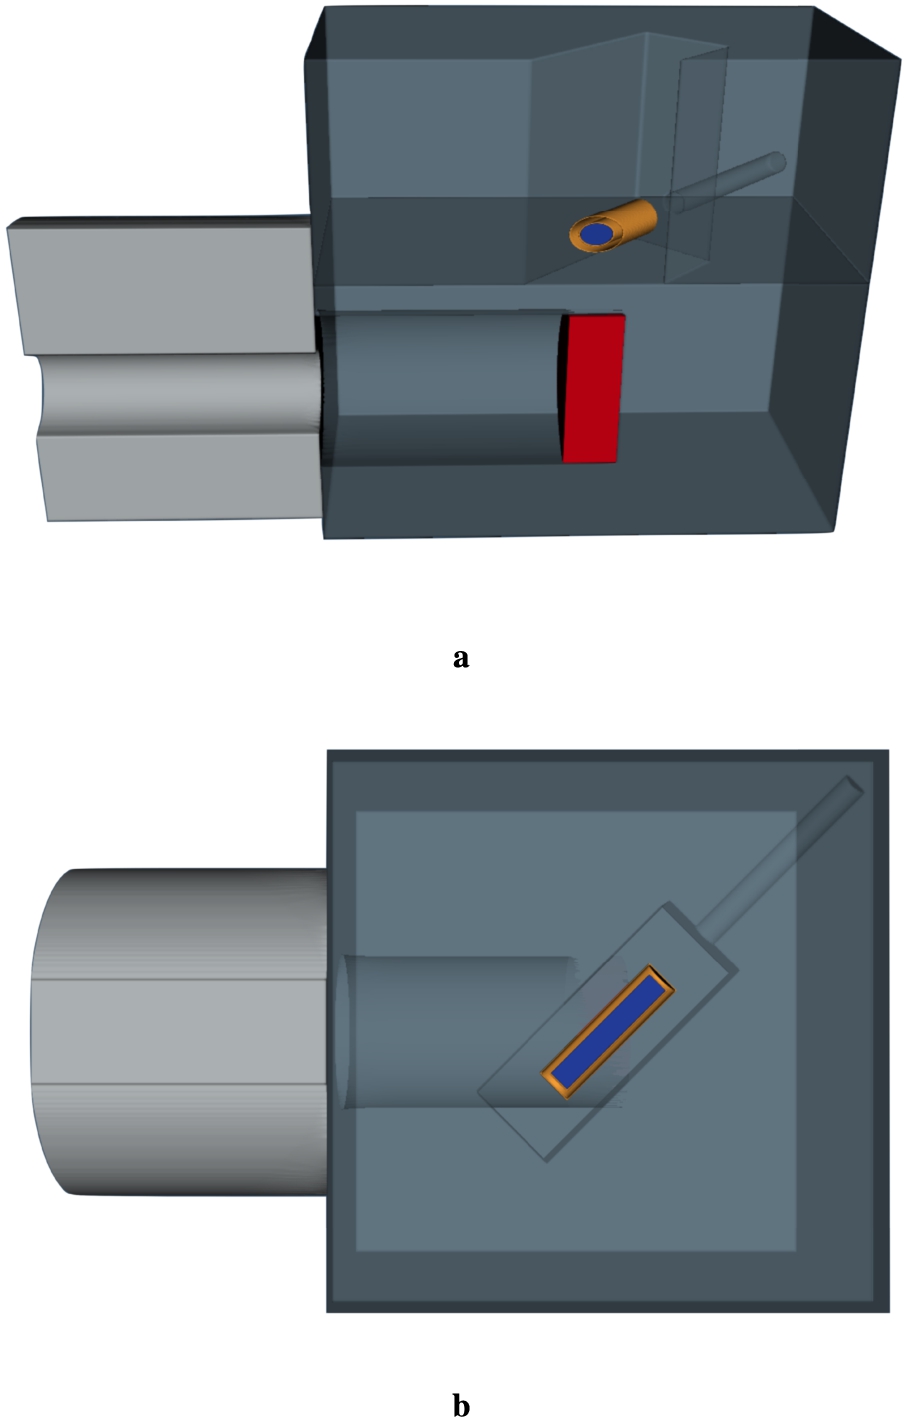
![Neutron source spectrum used in the calculations and showed at ICNS 2022 [193].](https://content.iospress.com:443/media/jnr/2023/25-3-4/jnr-25-3-4-jnr230950/jnr-25-jnr230950-g206.jpg)
10.1.2.Neutronic modeling
The MCNP model of the CMTF moderator, produced based on the technical drawings provided by BNC (Fig. 203), is shown in Fig. 204. The source spectrum coming out of channel 4 (Fig. 205) used in the simulations was calculated from the full MCNPX reactor model and presented in [193]. The spectrum presents both a thermal and a fast peak around, respectively, 70 meV and 2.8 MeV, up to a maximum energy of 12.5 MeV. A more accurate measurement of the source using gold foil activation is foreseen in the future. Preliminary calculations on this starting model confirmed some of the neutronic features one would expect from such a concept:
- Fast and thermal neutrons from the source are diffused by the beryllium disk and the lead blocks. The efficient diffusion of fast and thermal neutrons, although it is optimal to increase the flux at the moderator, is also expected to give a significant contribution to the noise in the extraction channel (Fig. 206a and Fig. 206b);
- In a similar way, an intense fast and thermal flux is coming out of the collimator and the reflector. However, the shielding around these components and, more generally, the issues regarding background and safety (e.g. activation after exposure) have been studied separately.
- The flux map in the cold energy range, below 5.11 meV, (Fig. 206c) shows that the parahydrogen in the moderator vessel is indeed a cold source. The flux map also confirms that a cold neutron reflector capable of reducing the leakage around the moderator would considerably increase the performance of the system.
Fig. 206.
Energy-integrated flux maps in n/cm2 per source neutron. (A) vertical section with energy integrated between 81 meV and 25 MeV. (B) vertical section with energy integrated between 13 meV and 81 meV. (C) horizontal section at the moderator height with energy integrated below 5.11 meV (4 Å).
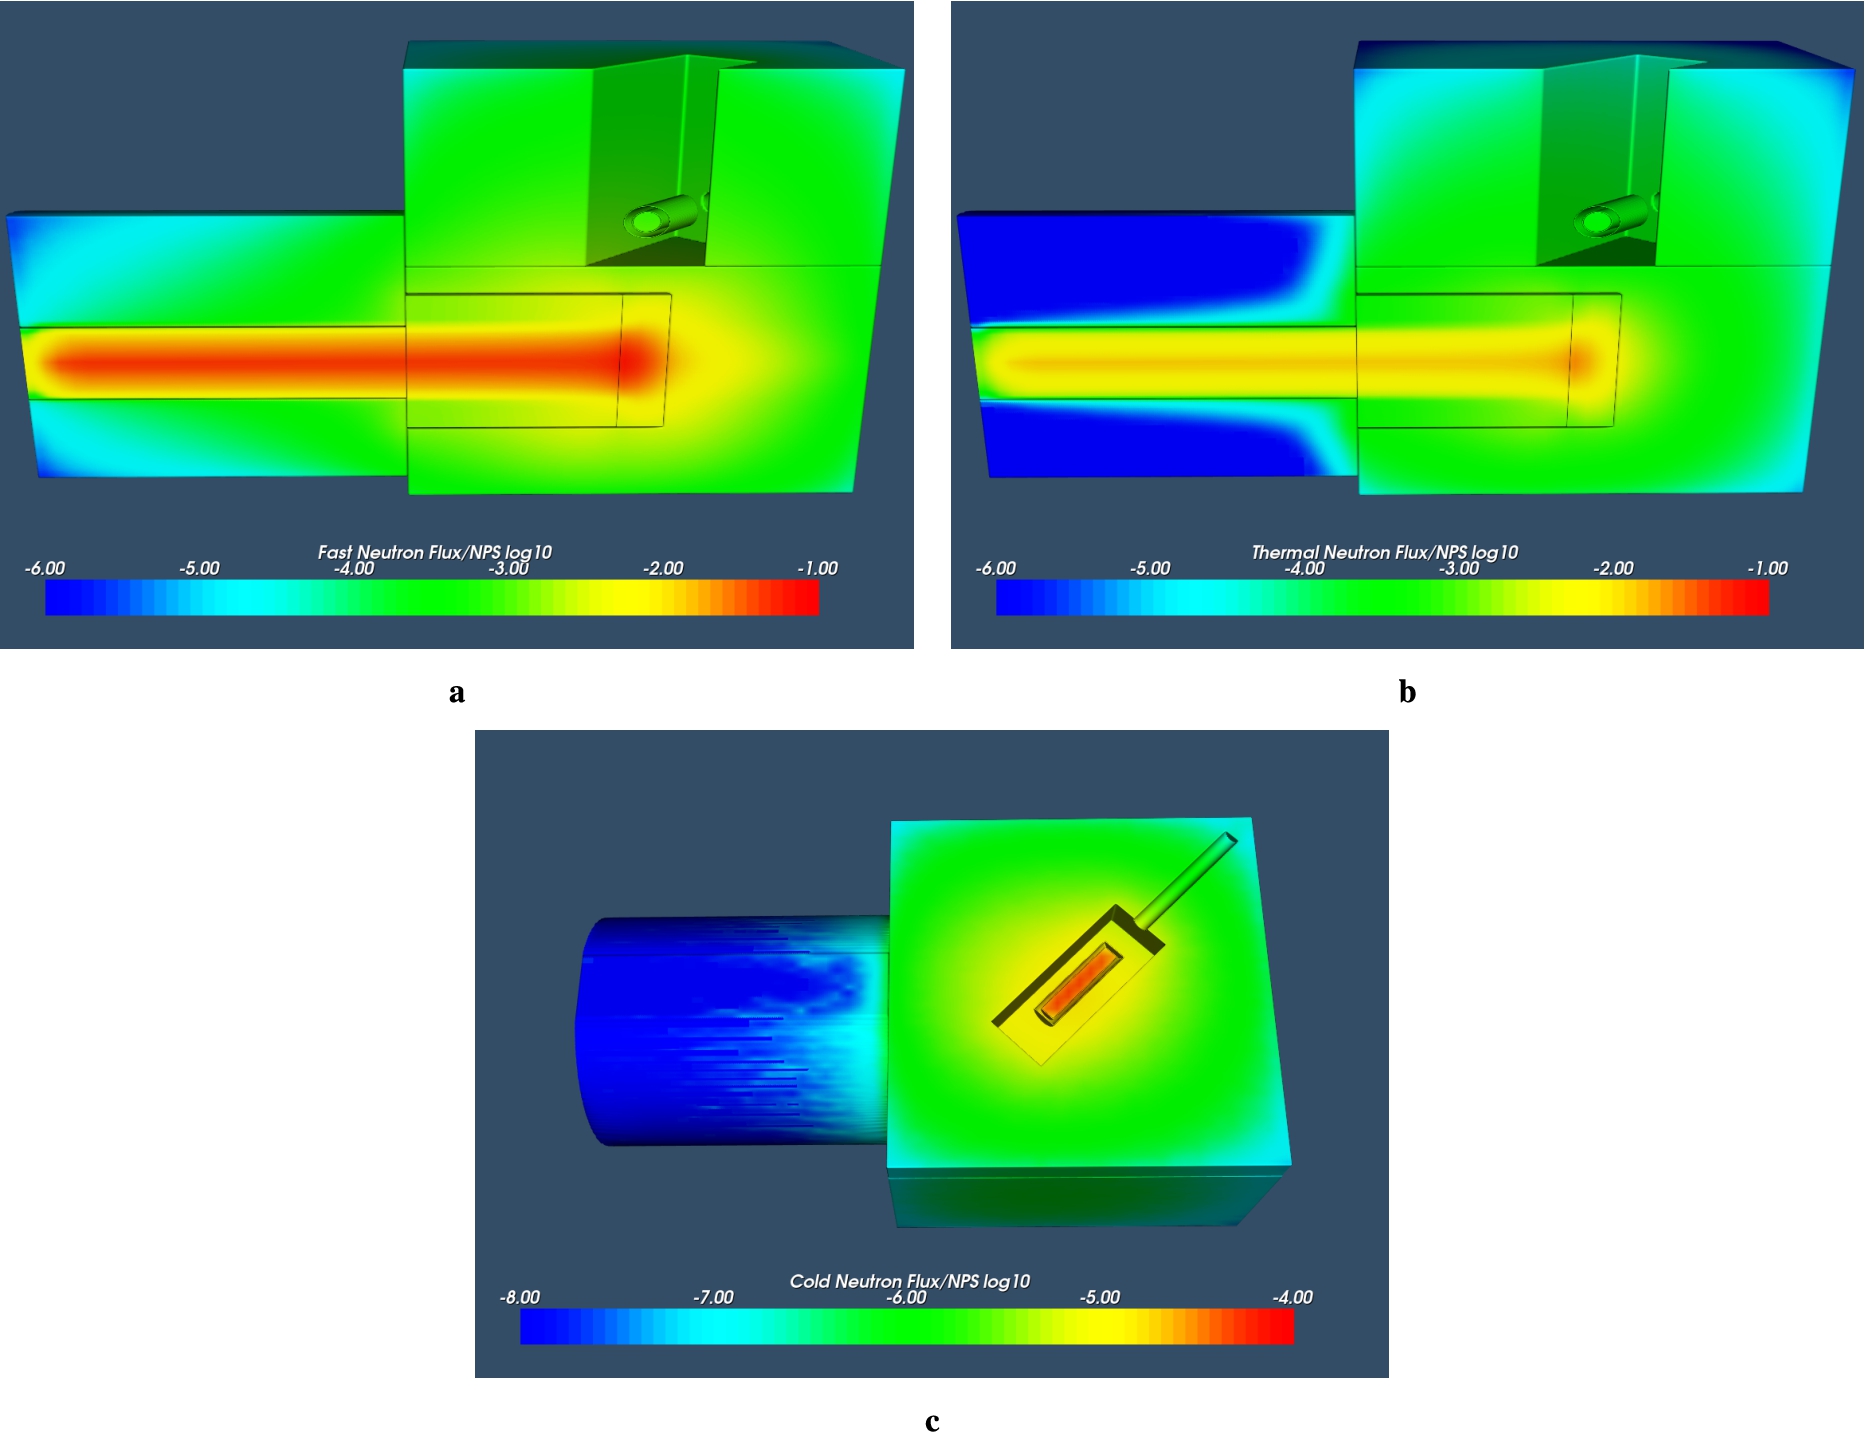
The first test of the HighNESS concept was done with the model described in Fig. 207. The dimensions of the lead reflector were reduced in the inner section to make room for the reflector and the trumpet. In reality, the space for the installation of these external components came from the removal of lead blocks and does not precisely coincide with the simple assumption of the model. Also, details like cooling pipes and metal support structures were not taken into account at this stage of the modeling.
Fig. 207.
MCNP model of the lead reflector-moderator block for the HighNESS experiment. (A) vertical section with a view of the reflector (b) horizontal section at the height of the moderator vessel with a view of the extraction system.
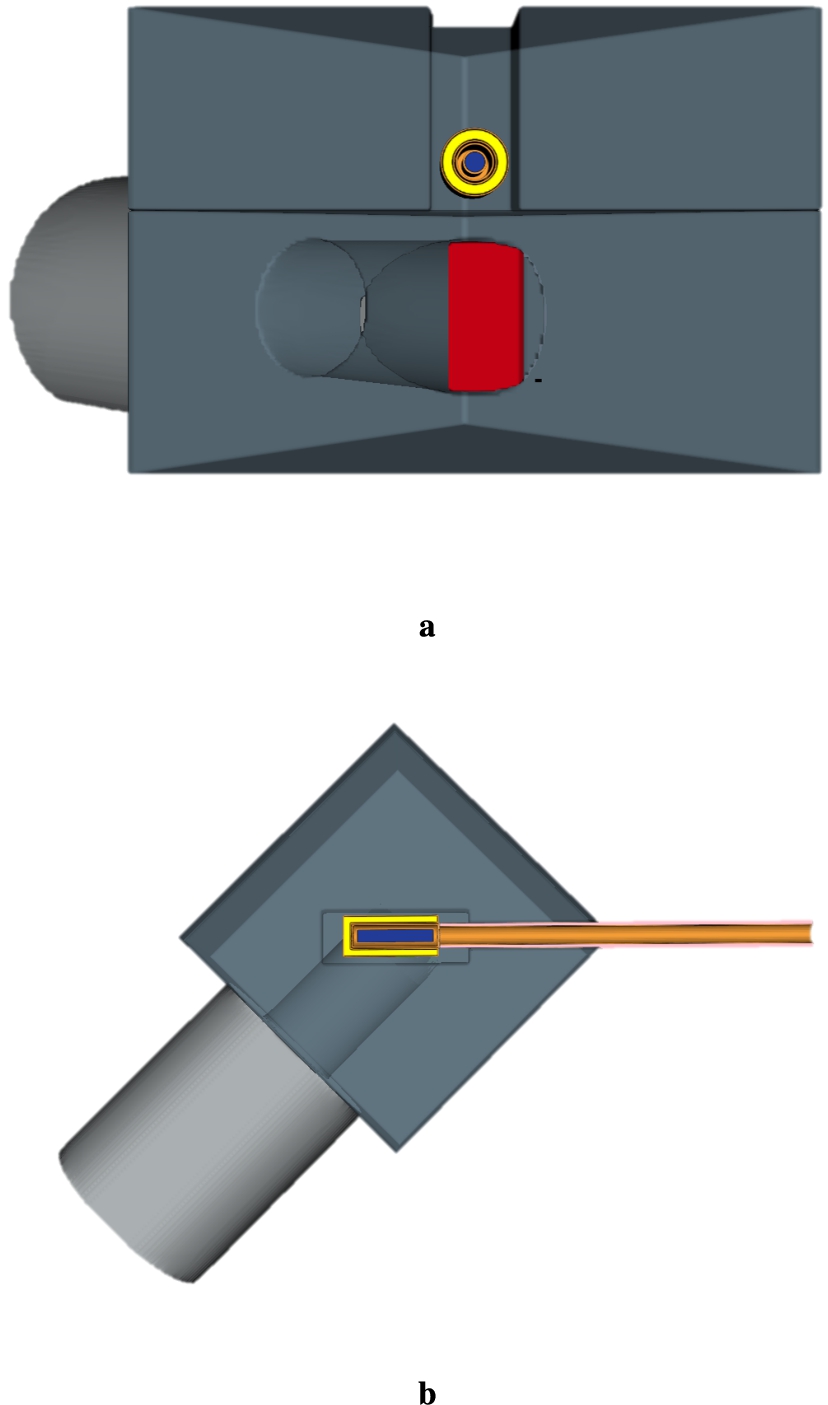
The runs with this model were affected by a crippling low neutron transport efficiency from the source to the exit of the trumpet. As a result, the tallies far from the moderator exit could not statistically converge for any large amount of primary particles in the source. The initial explanation for the problem was a poor definition of geometry importance in the simulation, which would have made MCNP wasting time in tracking the diffused neutrons in the region of the large reflector far away from the extraction channel. The actual reason for this behavior was related to a wrong spatial definition of the source beam. To simplify the problem, we decided to study the extraction with a simpler geometry that has all the essential characteristics of the full model. This corresponding toy model is shown in Fig. 208.
Fig. 208.
MCNP toy model of the lead reflector-moderator block for the HighNESS experiment. (A) vertical section parallel to the neutron beam with a view of the reflector (b) section perpendicular to the neutron beam with a view of the extraction cone.
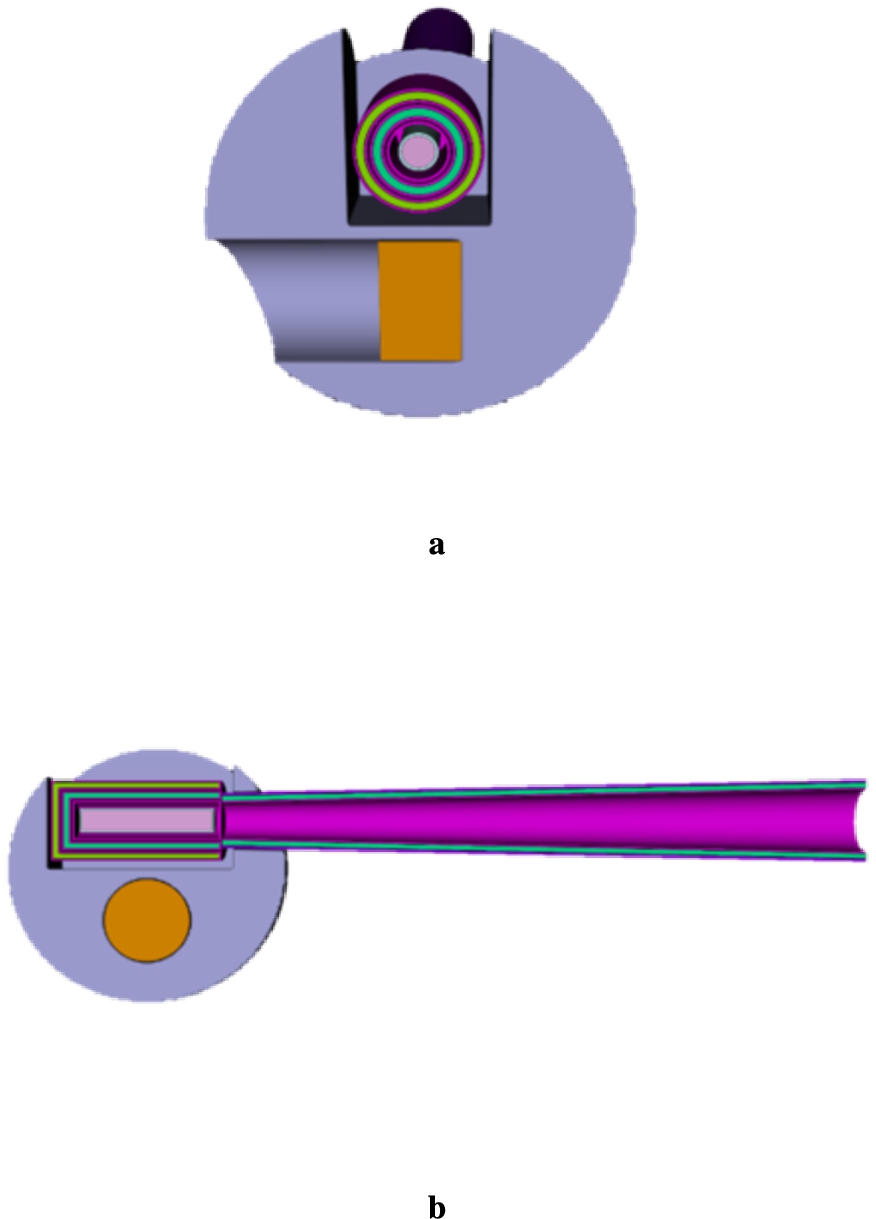
The main difference between the toy model and the original one is the lead reflector. The original 49 cm × 49 cm × 46 cm box-shaped reflector was substituted by a sphere with a radius of 13 cm centered between the moderator and the beryllium disk. The moderator is also closer to the disk and forms a 90° angle with the source beam. The neutron source and the other relevant dimensions (e.g. moderator length and radius etc…) are identical to the ones in the original model. As we are studying relative gains due to the enhancing effect of advanced reflectors, the toy model appears to be a very convenient tool.
10.1.3.Optimization of the source aperture
The moderator vessel is coupled with the extraction system through a cadmium plate with a circular opening. The reason to have a Cd window is to block the diffused thermal neutrons while allowing in the extraction tube mostly the cold neutrons coming from the moderator. To study separately the contributions from the components, we removed the advanced reflector around the source and in the extraction channel. A close-up of this interface in the MCNP model is shown in Fig. 209.
Fig. 209.
Optimization of the CNS aperture with the toy model. (A) MCNP model without reflector and ND in the extraction. The cadmium plate is dark red. (B) SNR, CN, and thermal neutron count as a function of the CNS aperture.
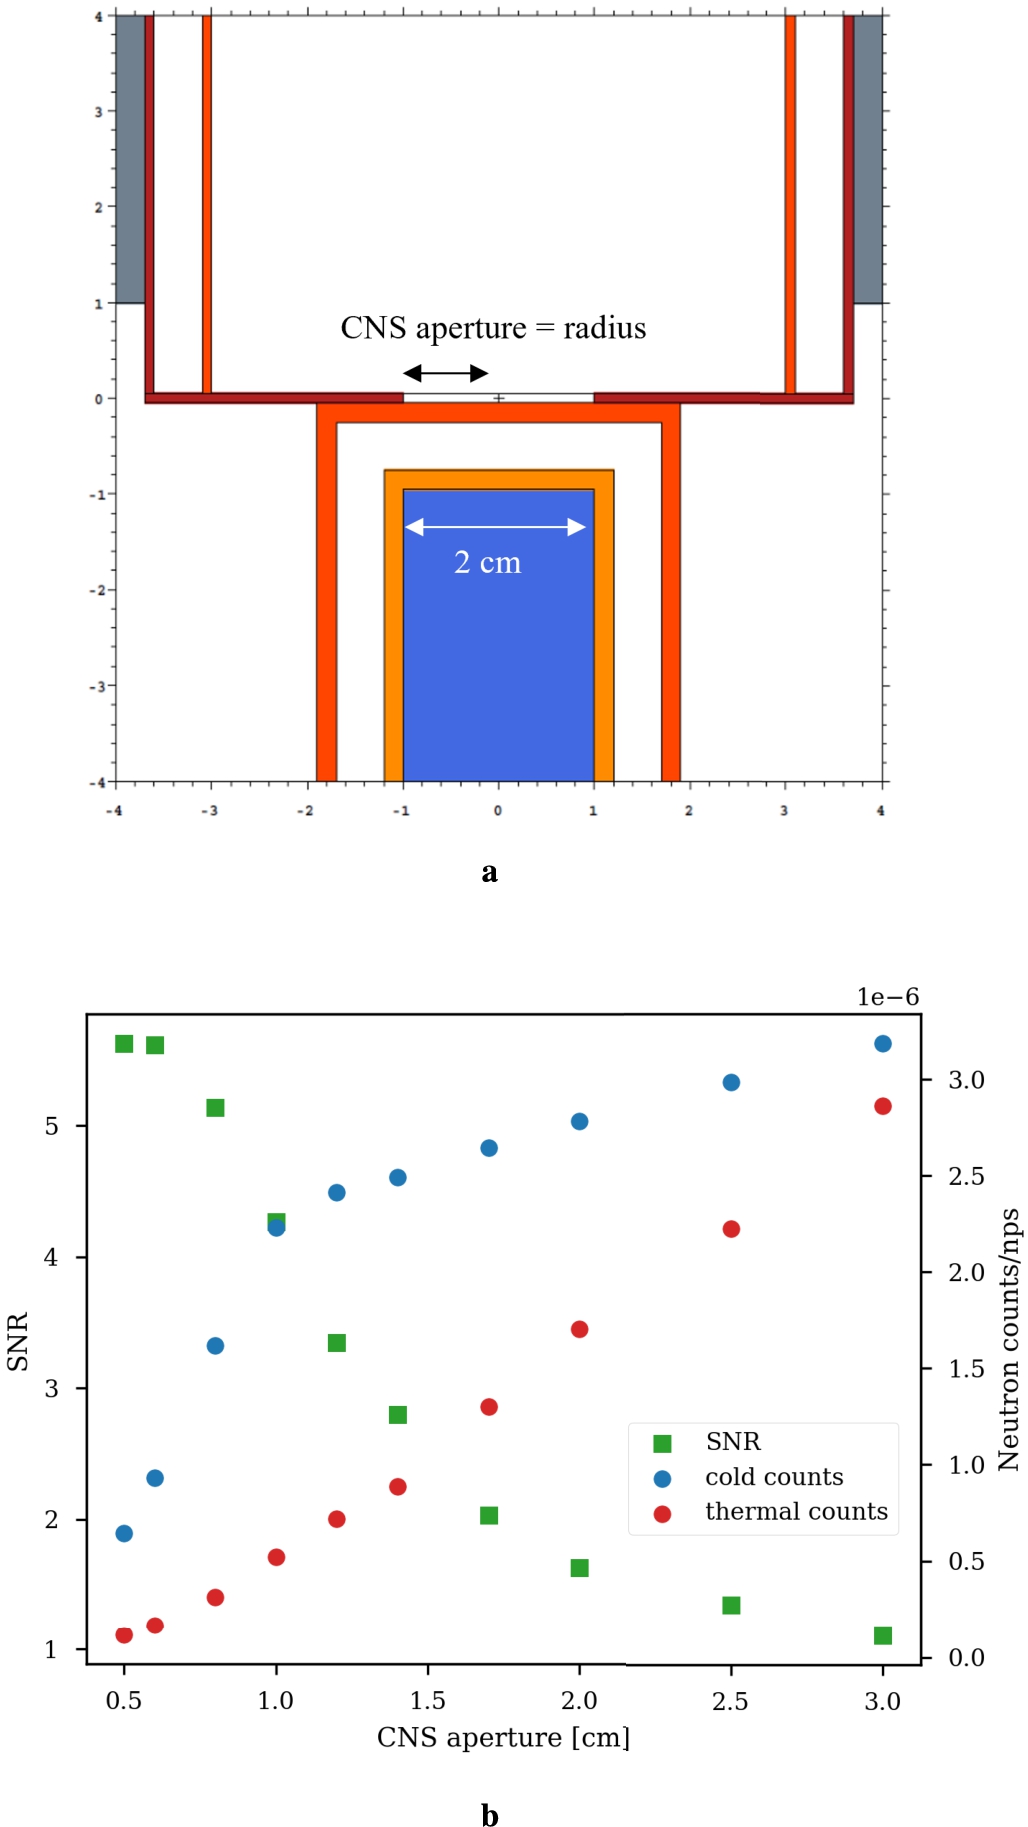
The thickness of the cadmium layer between the moderator and the extraction system is 1 mm in the simulation, but here we assumed perfect collimation, i.e. every neutron that enters the cell is absorbed. Similarly, we added a layer of cadmium around the extraction tube to prevent the thermal neutrons diffused in the lead reflector to reach the detector. The radius of the empty tube at this step is 3 cm, but the aperture in the cadmium is independent of the extraction and its radius can be optimized separately. If we define cold neutrons as all the neutrons with
10.1.4.Optimization of the source reflector
We fixed the CNS aperture to 1 cm and study the optimal size for the advanced reflector around the CNS. The reflector jacket is made of aluminum with 2-mm-thick walls. The gap between the moderator vacuum jacket and the reflector is 1 mm. The close-up of the geometry is shown in Fig. 210a.
Fig. 210.
Optimization of the CNS reflector thickness with the toy model. (A) MCNP model without ND in the extraction. CNS aperture is 1 cm (b) SNR, CN, and thermal neutron counts as a function of the reflector thickness.
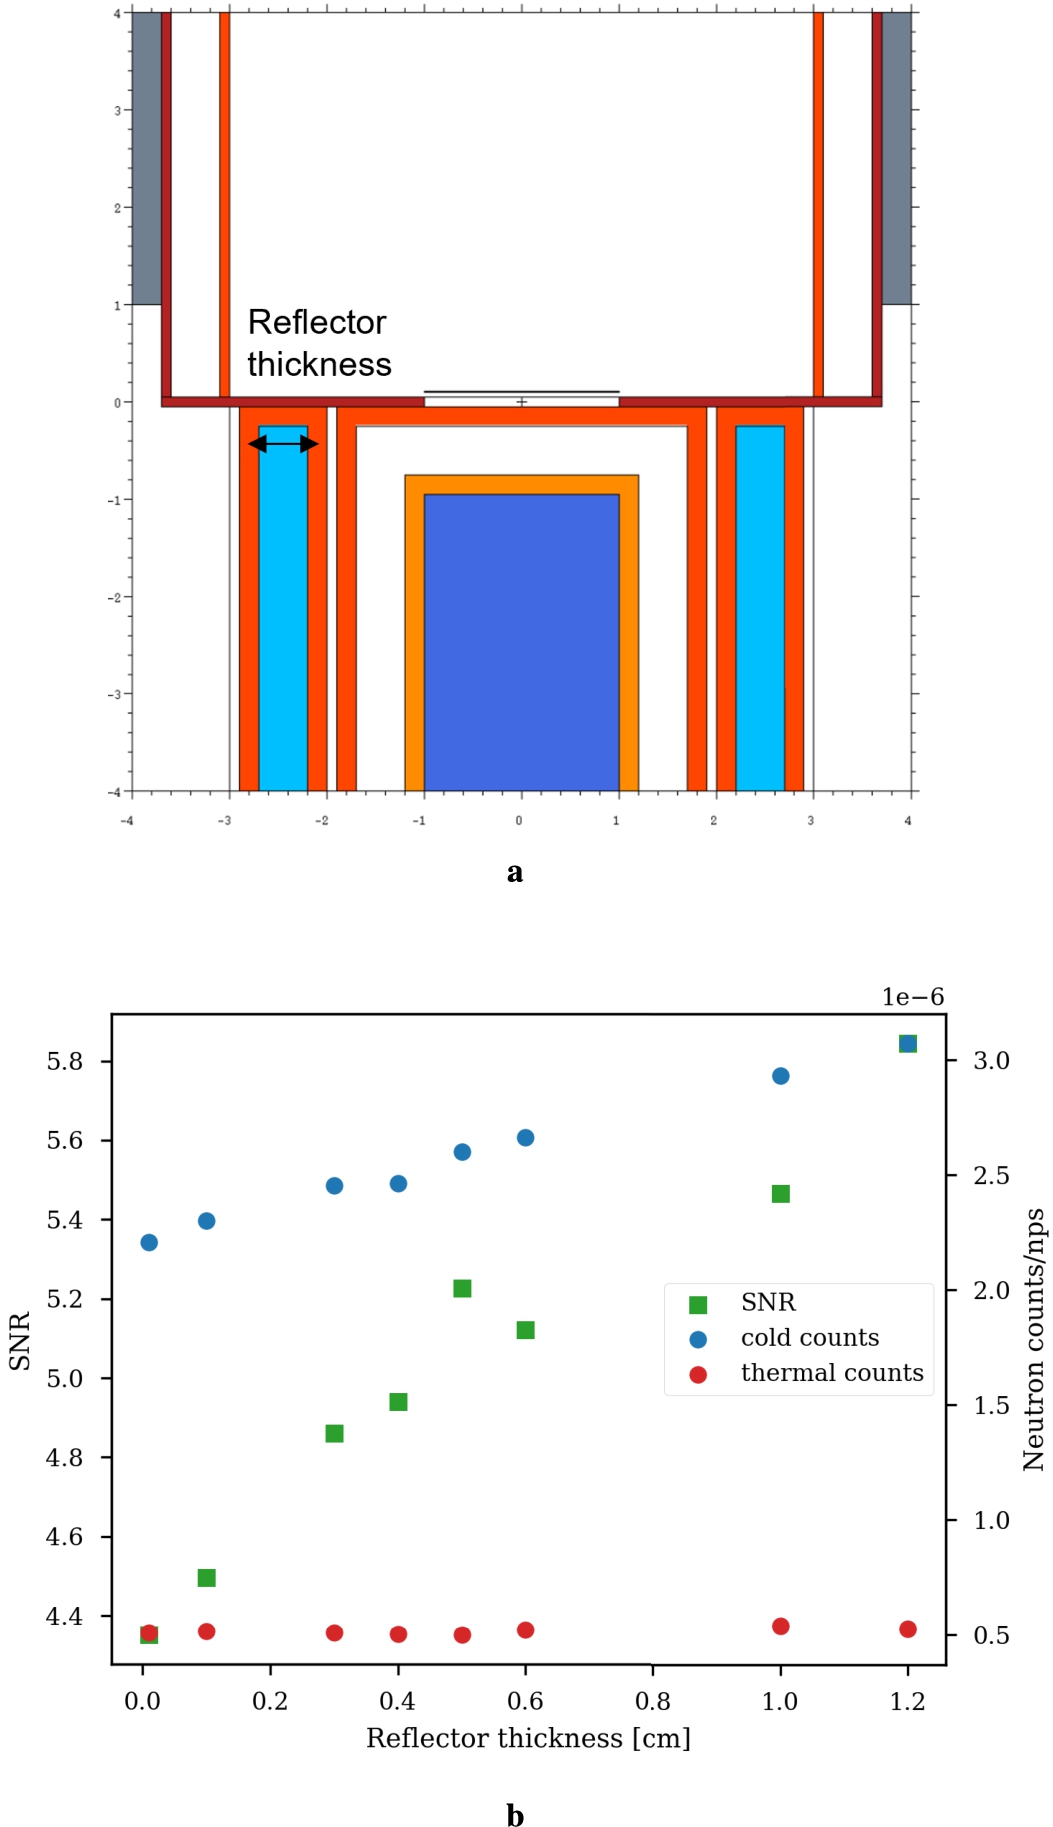
We inserted room temperature MgH2 in the simulation with increasing vessel thickness. The results on the cold and thermal counts and the SNR are shown in Fig. 210b. It is clear that the increase in the cold neutron counts is correlated with the amount of MgH2 in the system, and gains higher than 30% are observed when putting 1.2 cm of this material around the CNS. In this case, where the calculations show that more reflector material leads to better performance, the optimal value 1 cm is the upper limit physically allowed inside the lead reflector. ND was also tested as reflector material, but no gain was observed in the cold range at any thickness value. However, an enhancing effect in the VCN range could not be observed due to poor tally convergence, but it is reasonable to expect a similar, if not higher, gain factor. For this reason, we prepared also a reflector jacket filled with ND.
10.1.5.Optimization of the extraction system
The last component of the HighNESS experiment to study was the extraction system including the layer of ND powder. As a first approximation, we can fix the thickness of the ND layer to 5 mm (and 0.6 g/cm3 as density). The total length of the component was fixed to 60 cm by the available space between the moderator-reflector assembly and the collimation of the pin-hole system. We can also ignore the CNS reflector to isolate the effect of the extraction. The CNS aperture is still 1 cm. Two examples of extraction systems are sketched in Fig. 211.
Fig. 211.
Illustration of the two shapes for the extraction system, straight tube (left) and diverging cone (right) with their parameters. Not to scale.
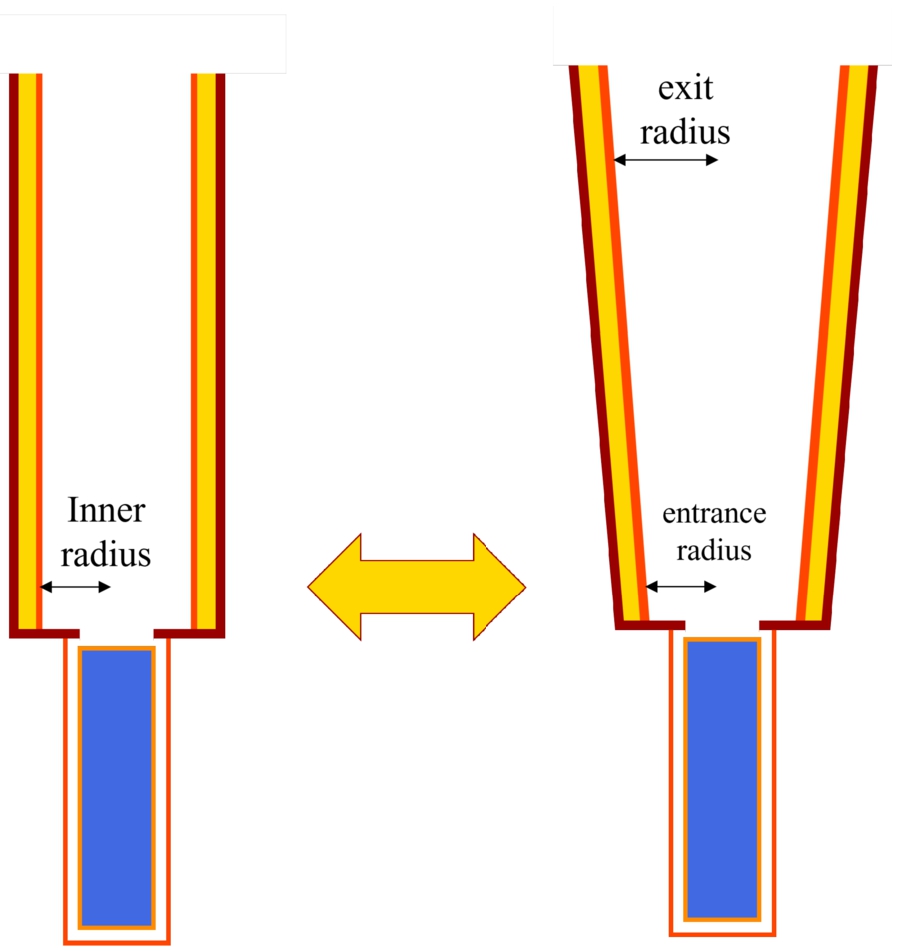
Fig. 212.
SNR values for several configurations of the extraction system. The points where
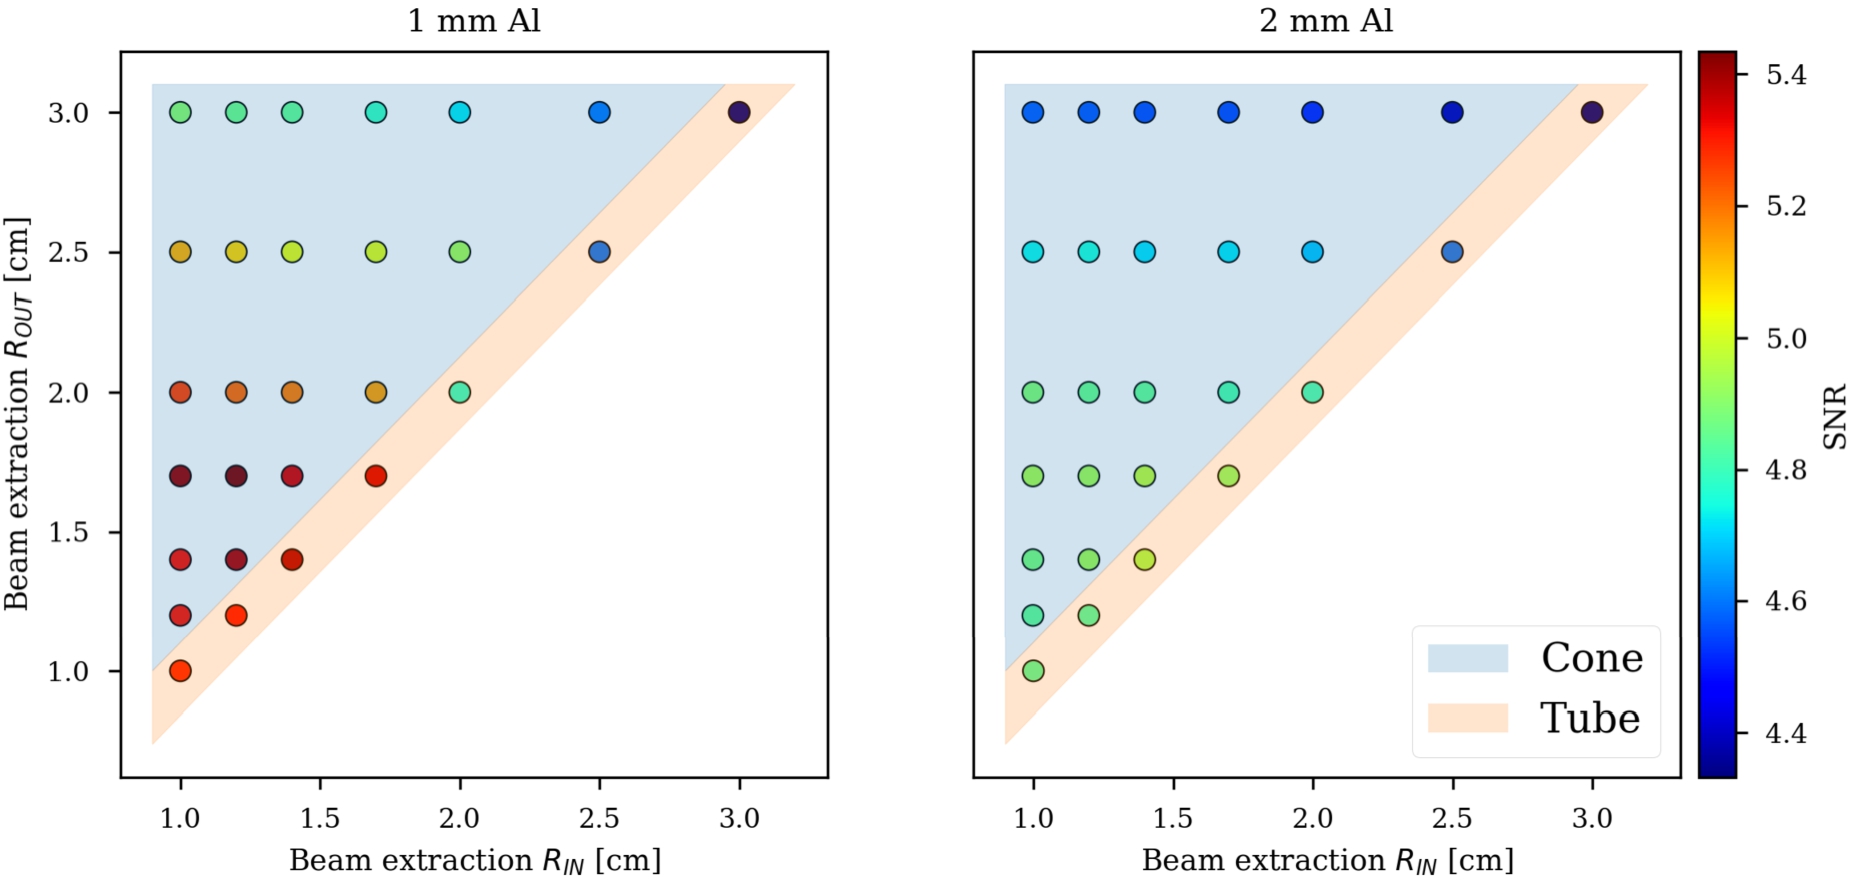
From the neutronic point of view, the most convenient shape is a divergent cone. Similarly to what happens with the total reflection inside a mirror guide, quasi-specular reflections on divergent walls will progressively reduce the divergence of the beam at the expense of a higher emission surface. From the engineering point of view instead, thin aluminum walls are achievable only with cylindrical pipes, while cone-shaped ones can be manufactured with no less than 2 mm walls. At the same time, the thickness of the internal wall can heavily influence the neutronic performance of the extraction system, since the path in the aluminum rapidly increases for grazing neutrons, hence increasing the chances of being absorbed. In Fig. 212 we report the SNR for several combinations of entrance and exit radii (size of the inner vacuum channel) for the extraction system and two Al wall thicknesses, of 1 and 2 mm, respectively.
When
10.1.6.Global optimization
So far we have optimized the setup varying one or two parameters at a time while keeping the others constant. In this section, we wanted to study what would be the optimal solution in a more global sense. In other words, we tried to answer the question: what is the best setup when the CNS aperture, the entrance and the exit extraction radii, the reflector thickness, and the ND layer thickness are all free to vary?
Once again we used Dakota to solve the problem in a fast and robust way. We first studied the parameters by optimizing one FOM at a time. Although they do not properly combine the needs of the experiment, these single-objective designs represent, within the statistical uncertainty, the best possible configurations for each FOM taken individually, so they can be used as maximum achievable values when making compromises in the multi-objective optimization. The results are summarized in Table 43. In light of the previous optimization effort, these values are not surprising: smallest CNS aperture and extraction radius for maximum SNR (opposite for CN counts) and tube over cone shape (1 mm over 2 mm Al walls) for both FOMs.
The ultimate goal is to optimize the setup for both SNR and cold neutron counts, which means optimizing two objective functions at the same time. There are several approaches one can adopt, but the method we chose relies on the concept of the Pareto front. In a multi-objective problem, the optimal design is not a point. Rather, it is a set of points that satisfy the Pareto optimality criterion, which is stated as follows in [2]: “a feasible vector
The first step in the Pareto-set optimization method is reducing the multi-objective problem in a single-objective problem. Namely, Dakota optimizes a weighted sum of SNR and CN counts, each normalized by the maximum value achieved in the respective single-objective optimization. The normalization is essential since the SNR is orders of magnitude bigger than the counts per nps, hence, without the normalization, Dakota would be biased almost entirely toward the SNR. The weighted sum is the new objective function. Finally, the composition of the two FOMs was evaluated using a set of weights (SNR, CN counts). In Table 44 the results of the simulations for a chosen weights set are summarized. As a sanity check, we made sure the results for the weights (
The analysis of the results of a multi-dimensional double-objective optimization is inevitably a complex task. We would like to point out some of the findings arising from this study:
- Despite the increasing importance of the CN counts weight, the CNS aperture is kept small to avoid a quick drop in the SNR. Only when the SNR has a small weight, the CNS aperture is “allowed” to increase. This shows how important it is to shield the extraction system from the intense diffused thermal field;
- increasing the ND thickness in the extraction layer has a minimal impact on the CN counts;
- almost half of the CN, compared to the single objective optimization, are obtained already with a small opening configuration. Hence, there is no need to have a large extraction system to observe the enhancing effect.
Taking into account all the previous optimization results and several iterations with the WP5 team, we decided to build a prototype with the following characteristics:
- The CNS aperture in the cadmium disk is 1 cm, matching the moderator size, to reduce the spurious thermal contribution to the detector;
- the space around the cold source is enough to accommodate a reflector jacket 1 cm thick;
- the extraction system is a tube with an inner radius of 1.4 cm and wall thickness of 1 mm.
Table 43
Optimized designs for single-objective approach. The FOM in bold are the ones optimized for that run
| Parameters [cm] | Optimized FOM | |
| SNR | CN counts [n/nps] | |
| CNS aperture | 1.0 | 3.0 |
| Entrance extraction radius | 1.0 | 3.0 |
| Exit extraction radius | 1.0 | 3.0 |
| CNS reflector | 1.0 | 1.0 |
| ND layer extraction | 1.0 | 1.0 |
| FOMs1 | ||
| SNR | 7.33 | 0.98 |
| CN counts [n/nps] | ||
1In bold the values corresponding to the optimized FOM.
Table 44
Optimized designs from the Pareto-set approach
| Parameters [cm] | Weight sets (SNR, CN counts) | ||||
| CNS aperture | 1.0 | 1.0 | 1.0 | 2.8 | 3.0 |
| Entrance extraction radius | 1.0 | 1.0 | 1.0 | 2.3 | 3.0 |
| Exit extraction radius | 3.0 | 3.0 | 3.0 | 3.0 | 3.0 |
| CNS reflector | 1.0 | 1.0 | 1.0 | 0.89 | 0.85 |
| ND layer extraction | 0.67 | 0.73 | 2.3 | 2.0 | 2.5 |
| FOM ratio to max | |||||
| SNR | 0.80 | 0.80 | 0.80 | 0.16 | 0.14 |
| CN counts | 0.48 | 0.48 | 0.48 | 0.93 | 1.0 |
10.1.7.Expected performance
The values found in the optimization phase are then inserted in the original full model (Fig. 207) to check the expected gains from the setup. We can divide the effect of the reflector from the effect of adding the extraction system filled with ND (sometimes indicated as +ND in the following summary). Hence, we define the common baseline as the model without both reflector and extraction tube and we calculate the gains after adding a 1-cm-thick jacket when it is empty, filled with ND, or with MgH2. All these cases, baseline included, are also calculated with ND in the extraction tube. A scheme summarizing the set of the eight measurements is shown in Fig. 213.
Fig. 213.
Graphical scheme of the measurements to perform at BNC facility in the context of the HighNESS experiment.
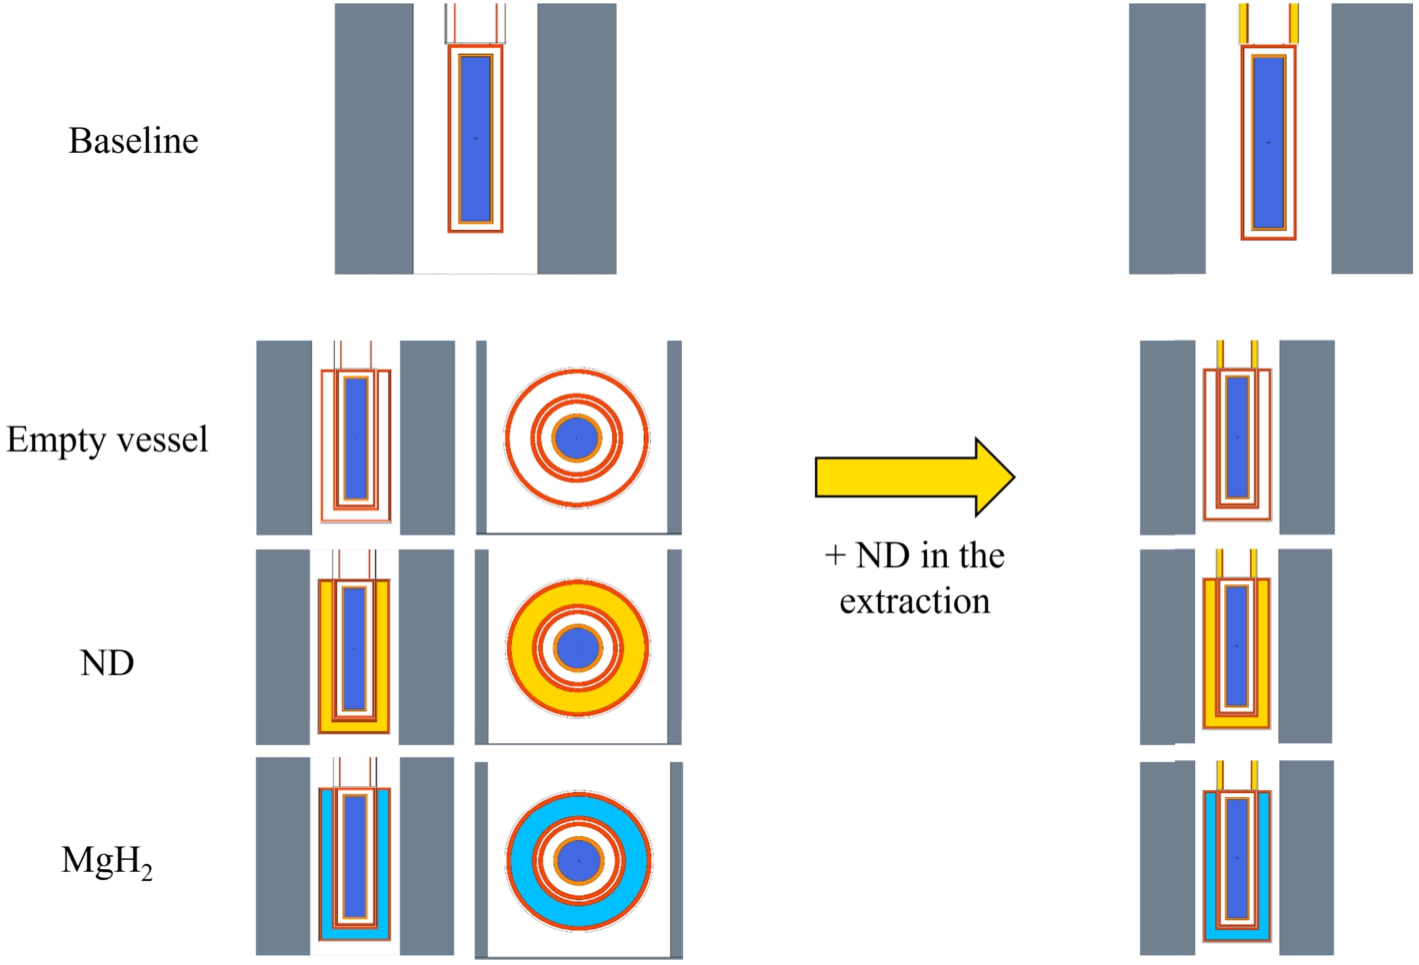
Fig. 214.
(Left) normalized neutron counts at the exit of the extraction tube for five wavelength groups for (a) all the cases without the thin ND layer in the extraction (b) with ND. (Right) counts gains over the baseline.
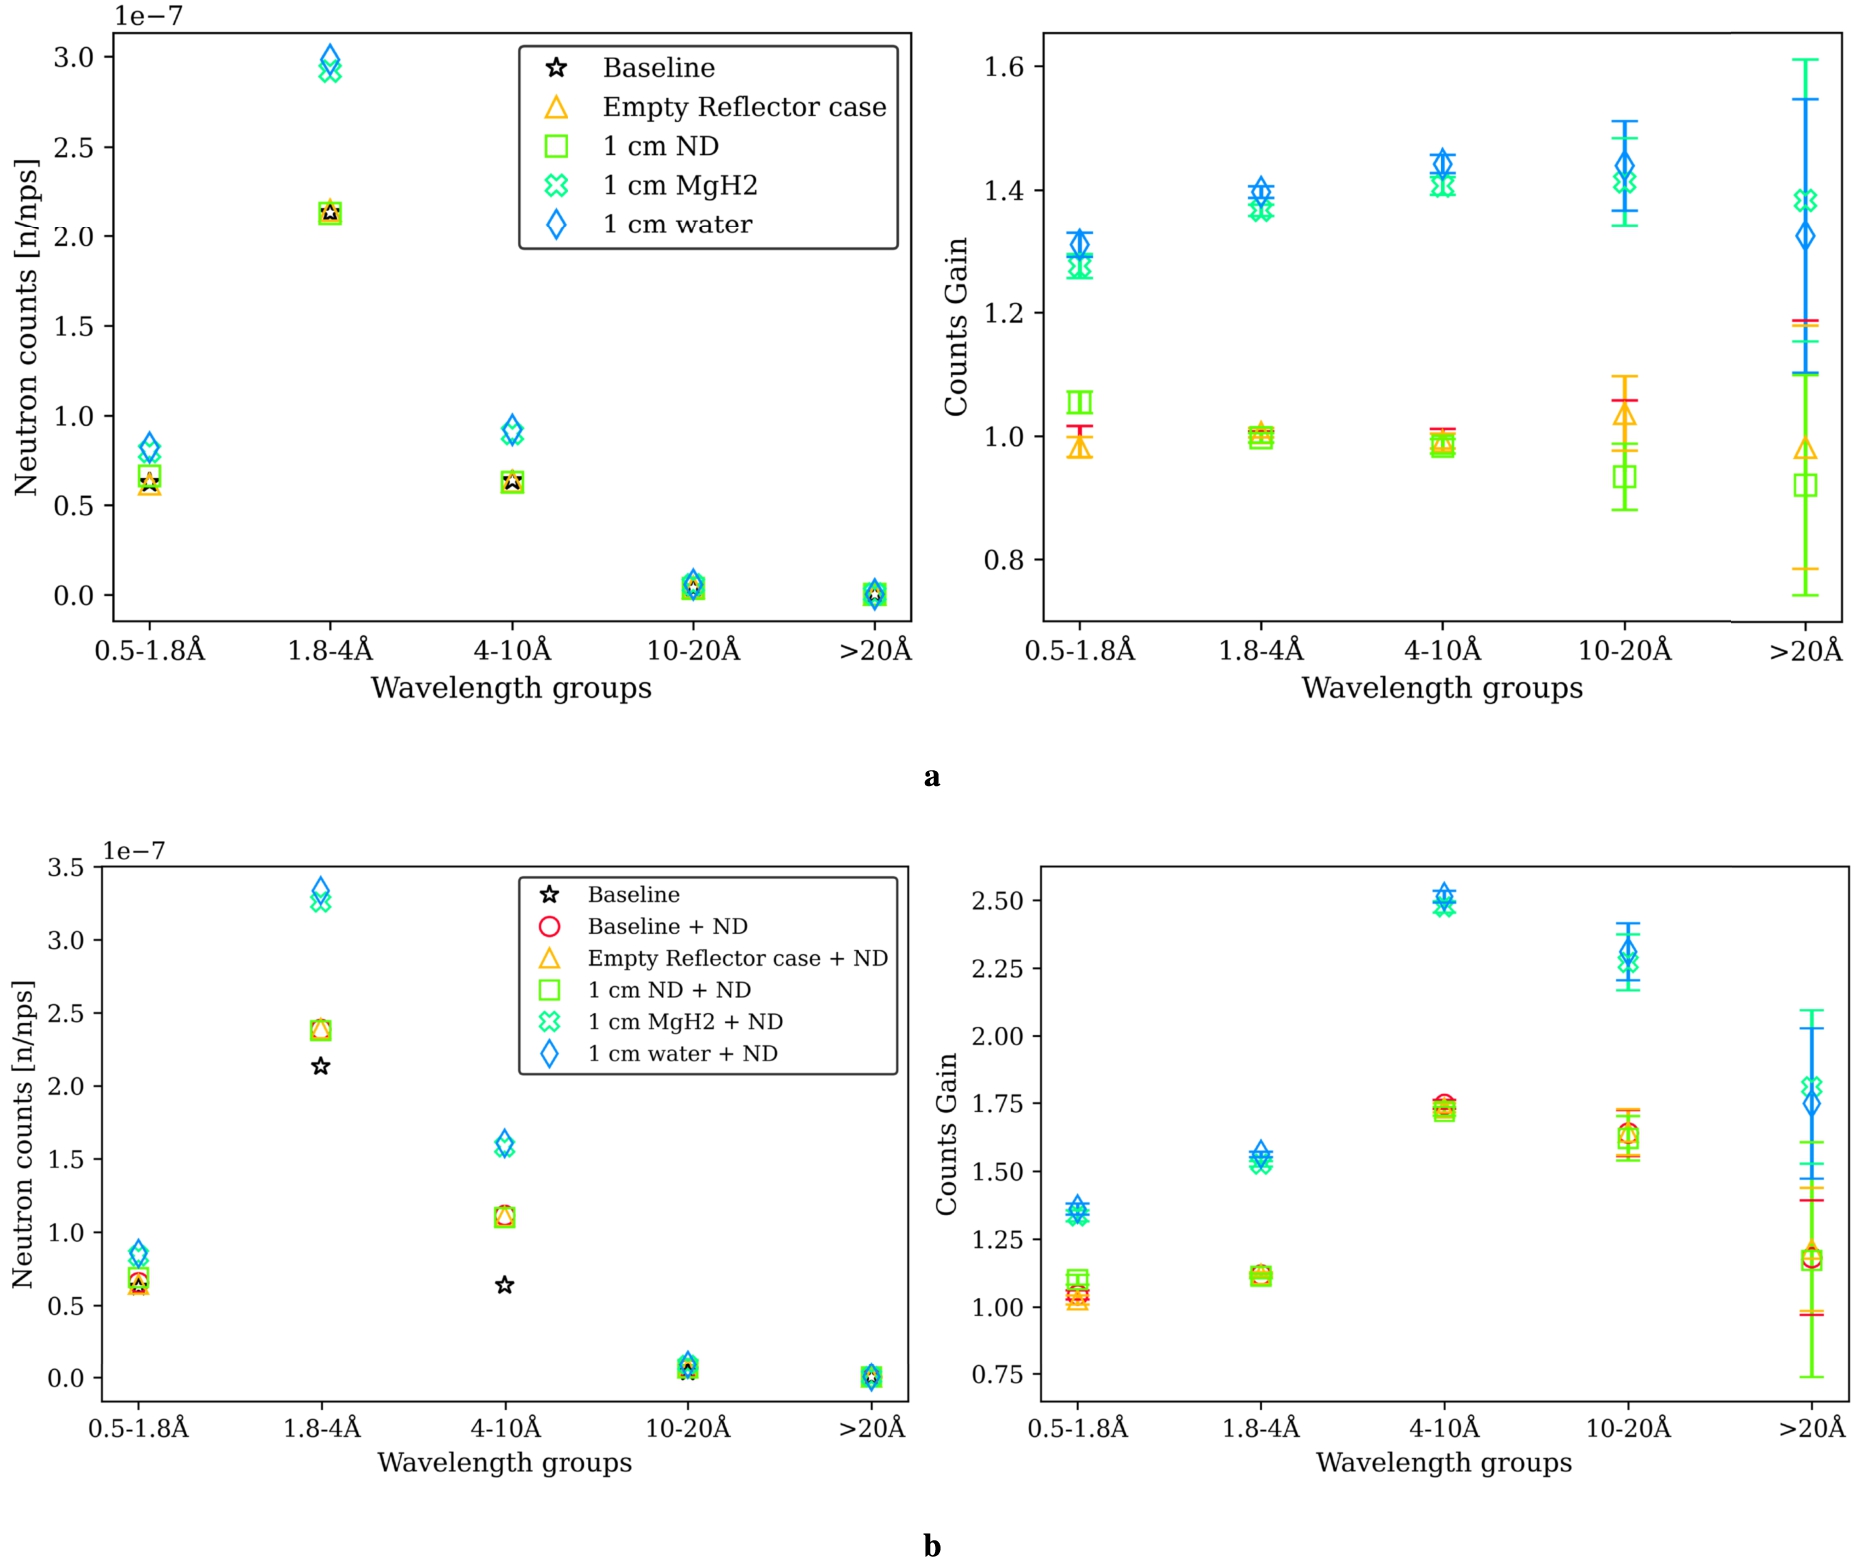
We added one additcional case to this set to test the performance of a standard reflector, i.e. room temperature water. Hence we planned a total of ten measurements during the experiment. The gains we expect to observe are summarized in Fig. 214, while a more detailed overview of the simulation results can be found in Table 45.
In Fig. 214a, we can see how more than 40% gains over the baseline can be obtained with a MgH2 reflector. However, similar performances are observed with standard room temperature water, while ND do not seem to have a measurable effect in the energy range studied. When adding ND to the extraction system, the gain factor goes well above 2 in the 4 Å to 10 Å range, corresponding to the energy peak for quasi-specular reflection. The reason for similar results between water and MgH2 is to be ascribed to the inelastic scattering on H. As shown in Fig. 9 in [83], for energies above 0.1 eV, the inelastic cross section is dominated by down-scattering processes, hence in an intense thermal/fast field the dominating interaction with H is inelastic, while one could expect the reflector behavior to be dominant at low energies. Even though the effect is not purely due to the advanced cold reflector properties of MgH2, it is still interesting to study the material and its applicability in different environments.
Finally, in Fig. 215, we show the calculated spectra for all the cases, where an overview of the gains as a function of energy is given.
10.1.8.Dose and background calculations
The following step was to add increasing details to the model in order to simulate the whole experimental environment. In particular, we studied two quantities that are crucial for the measurements: the neutron and photon dose rates inside and outside the experimental hall and the background level at the detector compared to the signal from the moderator.
Table 45
Overview of the 10 simulations of measurements envisioned to be performed at the CMTF
| Counts/nps | ||||||||||
| Value | % Rel. err. | Value | % Rel. err. | Value | % Rel. err. | Value | % Rel. err. | Value | % Rel. err. | |
| Without ND in the extraction | ||||||||||
| Baseline | 9 | 3 | 0.6 | 0.4 | 0.8 | |||||
| Empty vessel | 11 | 3 | 0.6 | 0.4 | 0.8 | |||||
| ND | 10 | 3 | 0.6 | 0.4 | 0.9 | |||||
| MgH2 | 7 | 3 | 0.6 | 0.3 | 0.7 | |||||
| Water | 7 | 2 | 0.6 | 0.3 | 0.7 | |||||
| With ND in the extraction | ||||||||||
| Baseline | 8 | 2 | 0.3 | 0.4 | 0.8 | |||||
| Empty vessel | 9 | 2 | 0.4 | 0.4 | 0.8 | |||||
| ND | 28 | 2 | 0.4 | 0.4 | 0.8 | |||||
| MgH2 | 6 | 2 | 0.3 | 0.3 | 0.7 | |||||
| Water | 6 | 2 | 0.3 | 0.3 | 0.7 | |||||
The first step toward a more realistic model was made by adding the cryogenic system to the reflector-moderator assembly. In particular, we were interested in quantifying the effect on the neutronic of the piping case as well as the piping itself. These components are made of aluminum to reduce the impact on the performance, however, a strip of reflector must be removed to make space for them, which can be expected to further reduce the initial yield. The MCNP model, manually made from a simplified version of the CAD drawings, is shown in Fig. 216. The components further away from the moderator vessel, like the cryogenic tank and external transfer pipes, are made of stainless steel. The negative impact of the cryogenics at the exit of the extraction tube was estimated to be between 20% to 30% depending on the neutron energy (higher at lower wavelength) for the case with MgH2 as CNS reflector and ND in the extraction. This effect is almost entirely due to the aluminum structure, hence should not affect the relative gains.
To have a better estimate of the background at the detector position, we modeled the essential pieces of the detection system: the chopper, the pin-hole system, and the steel table according to the specifications provided (cfr. Figure 202). In particular, the pin-hole system is made of several layers of metals, like lead and copper, and neutron shielding material like cadmium and boron plastic (Mirrobor™). The result is shown in Fig. 217.
The last piece necessary for the study is the model of the experimental bunker. A temporary model of the neighbor channel #2 was used for preliminary calculations of the background at the detector position, which already highlighted how critical it was to carefully shield the reflector-moderator block and the detector from the intense diffused epithermal and thermal neutron flux. Later we received a close-to-final model of the experimental room designed by BNC, which included a concrete floor, a simple model for the heavy-concrete reactor, and external walls made of boric acid bath and Mirrotron boron concrete. The shielding around the reflector is made of mostly Mirrobor™sheets (80 wt% B4C + CH2O) and paraffin wax. The complete MCNP model used for the exploratory analysis is shown in Fig. 218. In the figure, the geometry is mirrored along the horizontal direction compared to Fig. 202.
At this point it should be noted that this model is still missing a design for the bunker ceiling and the shielding around the collimator at the beam port. At the time of performing the first simulations with this model, the CMTF construction phase was not fully completed and not including the design of the ceiling made of structural steel and several layers of borated HDPE. The space around the collimator, between the reactor’s wall and the reflector, has been filled with paraffin wax blocks. However, these recent changes have not been implemented in the model yet.
10.1.9.Background
A preliminary assessment of the background at the detector position with the full model shown in Fig. 218 can be made by looking at the neutron flux map at different energy-groups. The neutron flux in n/cm2/nps at the height of the moderator is shown in Fig. 219 (fast and epithermal) and Fig. 220 (thermal and cold) with a spatial resolution of 10 cm × 10 cm × 10 cm. The highly diffused neutron field in the epithermal (81.8 meV to 1 MeV) and thermal (13 meV to 81.8 meV) energy range appears to be 1 or 2 orders of magnitude higher than the cold flux in the detector position. While these flux values do not take the energy-dependent resolution of the detector into account, they still highlight the importance of reducing the diffusion out of both the collimator and the reflector. As an example, in the temporary model of the neighbor channel #2 we observed that adding a layer of an ideal absorber (i.e. all neutrons get killed when entering the cell) around both the collimator and the lead block had the effect of reducing the high energy neutron flux by more than a factor 10.
Fig. 215.
Normalized neutron counts wavelength spectra at the exit of the extraction tube for (a) all the cases without the thin ND layer in the extraction (b) with ND.
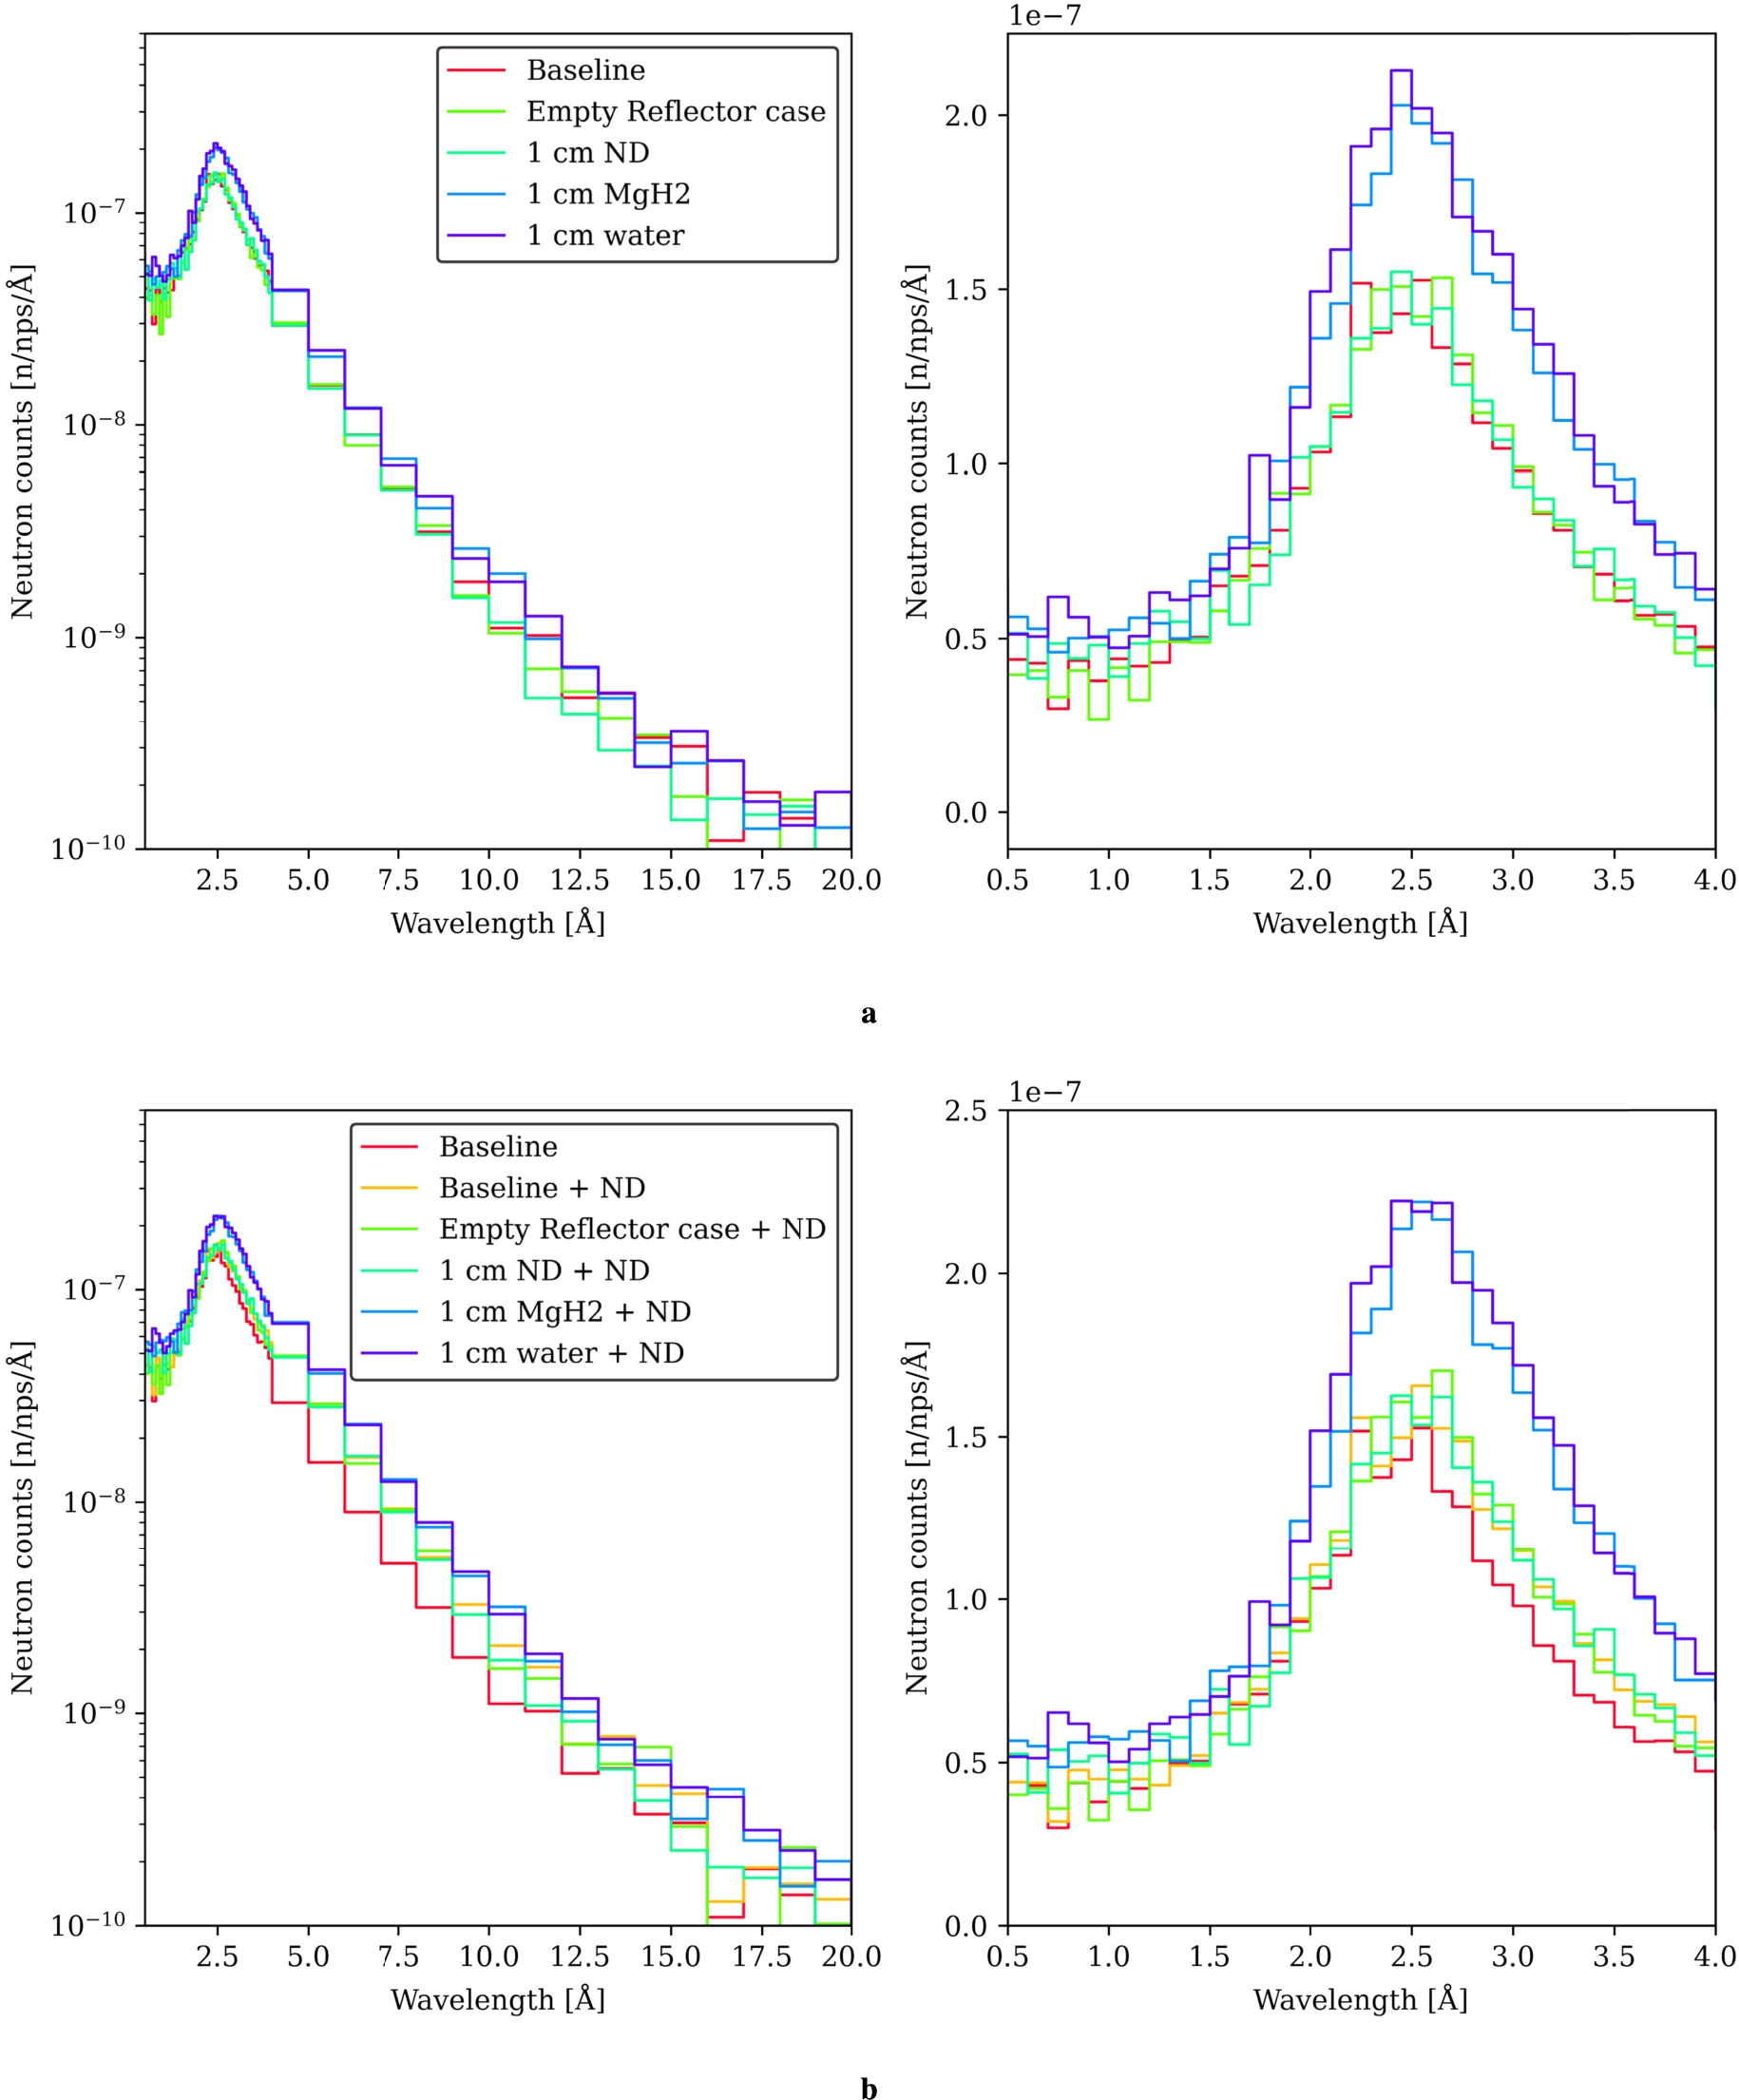
Fig. 216.
MCNP model of the cryogenic system for the HighNESS experiment. The stainless steel cryogenic tank is shown on the left. On the right, an enlarged view of the moderator pipes and case according to the engineering CAD (top right).
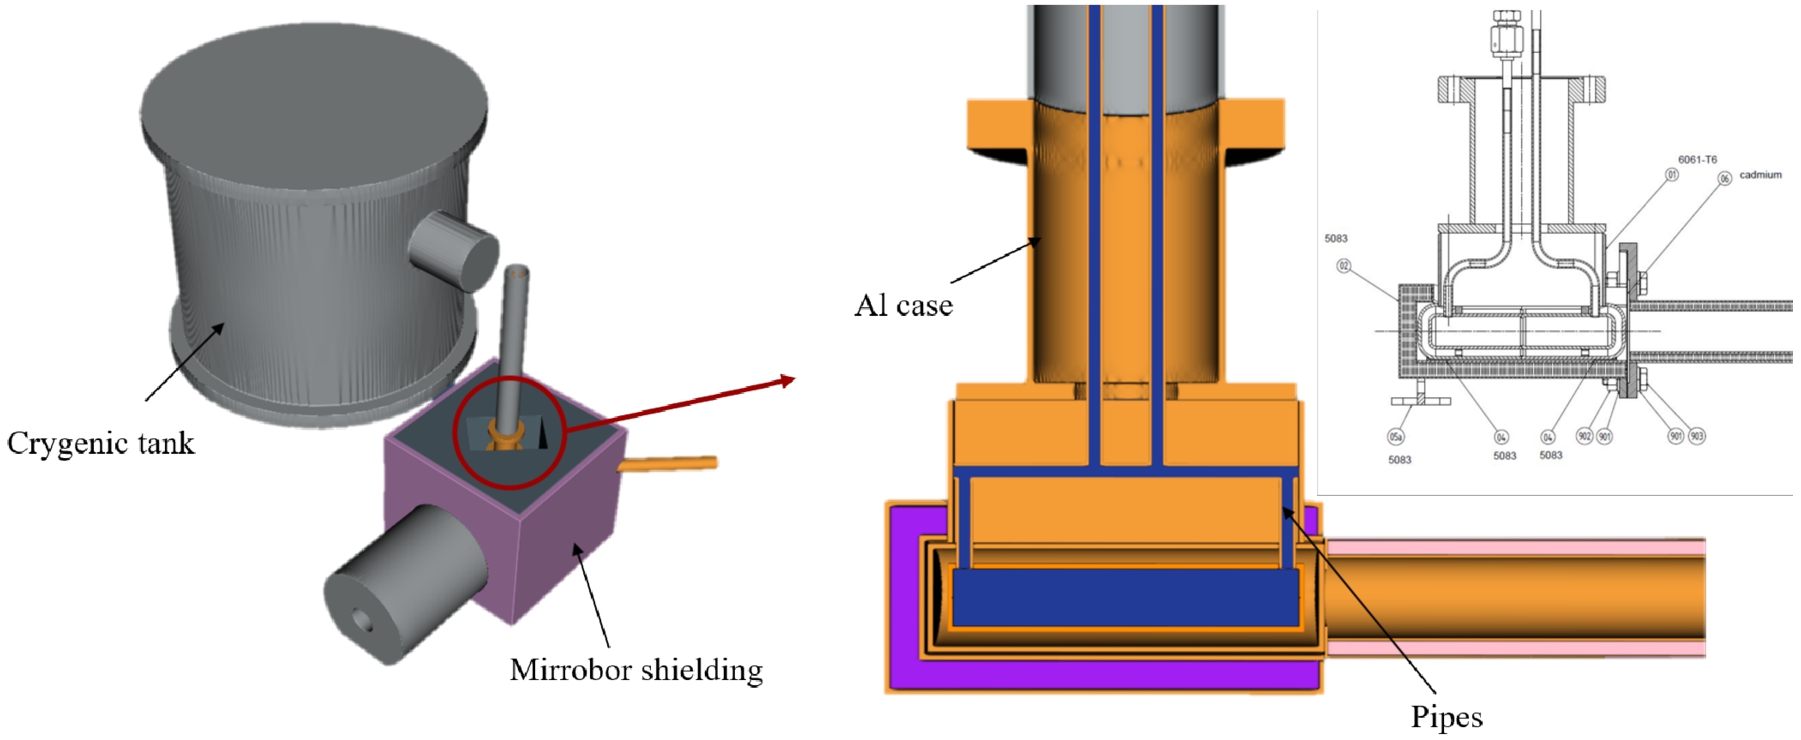
Fig. 217.
MCNP model of the detection system for the HighNESS experiment. The model has only the essential elements: the chopper, the pin-hole system, and the steel table with the support rails for the detector. The detailed drawings of the pin-hole system are reported in the bottom right corner.
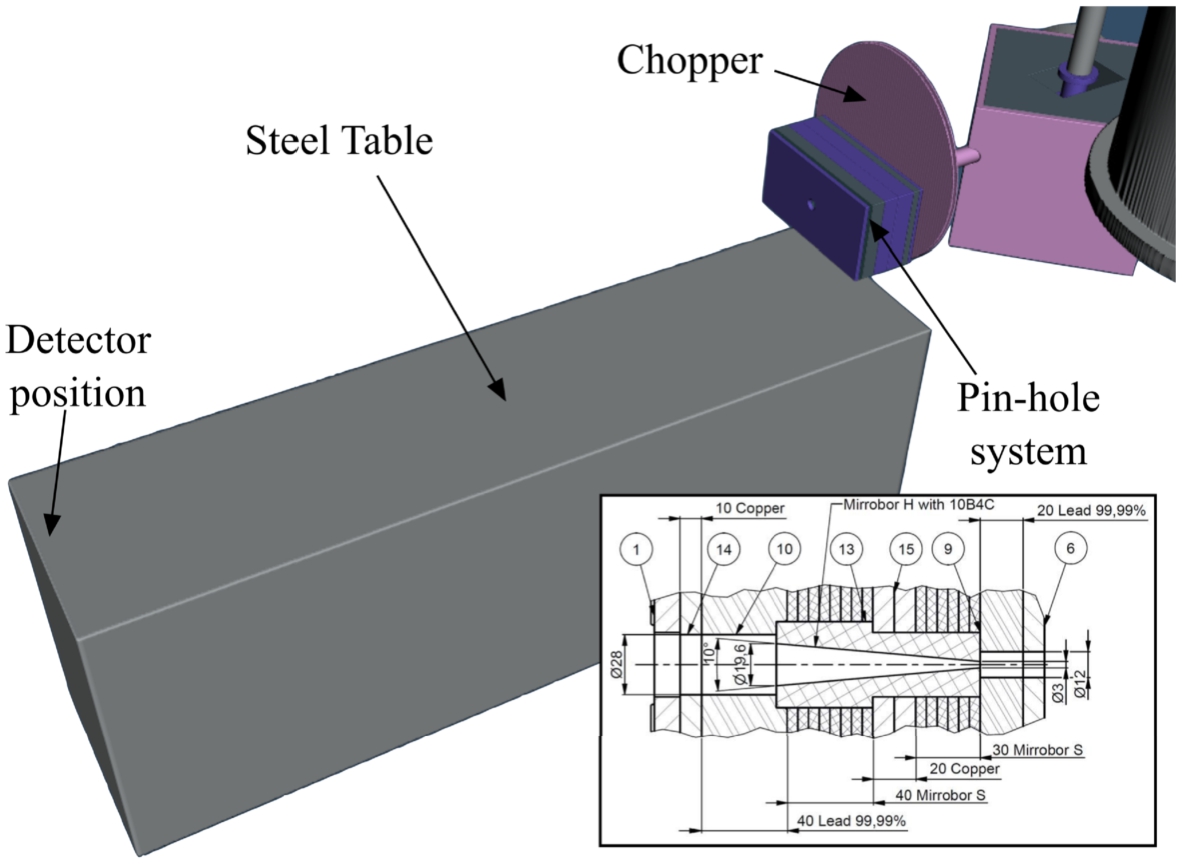
Fig. 218.
MCNP model of the experimental room for the HighNESS experiment. The different materials for the external and reflector shielding are highlighted. Mirrored along the horizontal direction compared to Fig. 202.
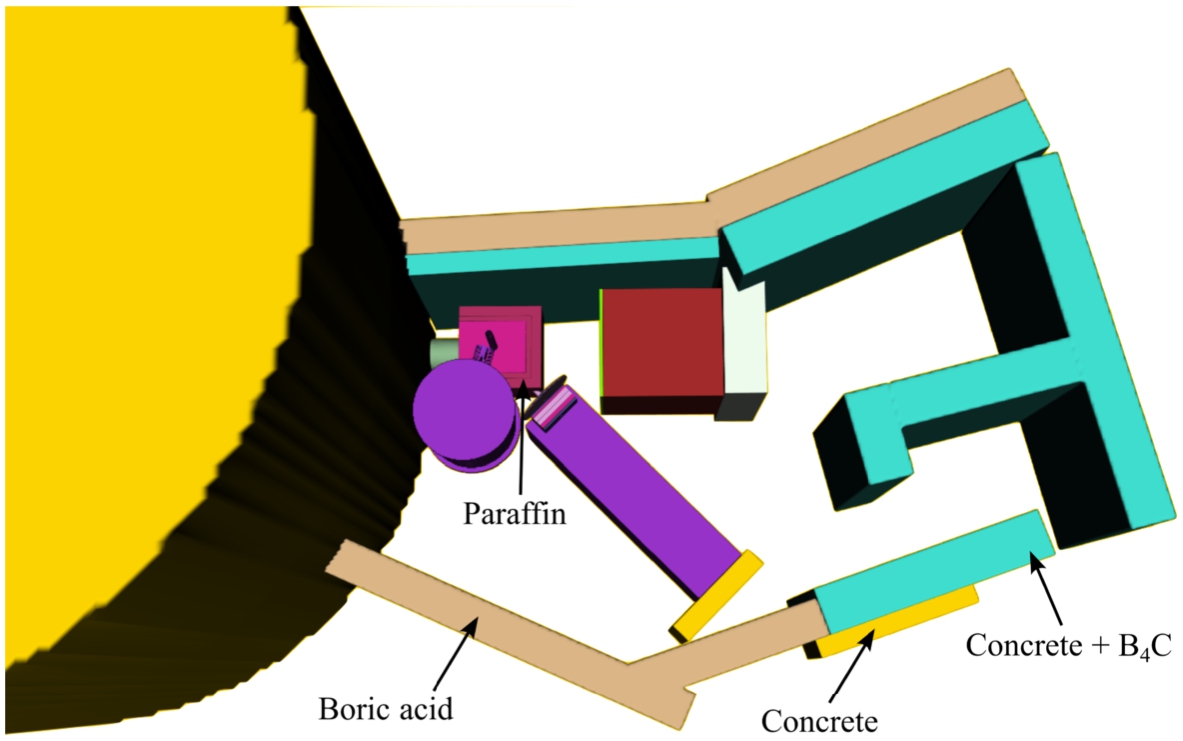
In the case of the latest model, we estimated the effect of shielding the 20 cm × 20 cm detector with 2 cm Mirrobor™sheets all the way from the pin-hole assembly. The model is shown in Fig. 221. The calculations are made with a point detector tally (next-event estimator) placed at the center of the detector position along the beam direction. Due to the incompatibility of the library with the next-event estimator, ND were removed from the extraction tube for this test. The results are reported in Table 46 with the same energy groups as the flux maps. From the reported values, it is clear that this solution is effective in shielding diffused cold and thermal neutrons, but it is not enough for epithermal neutrons.
Fig. 219.
Neutron flux map at the moderator height with a spatial resolution of 10 cm × 10 cm × 10 cm for (a) fast neutrons (1 MeV to 100 MeV) (b) epithermal neutrons (81.8 meV to 1 MeV). Units are n/cm2/nps in log scale.
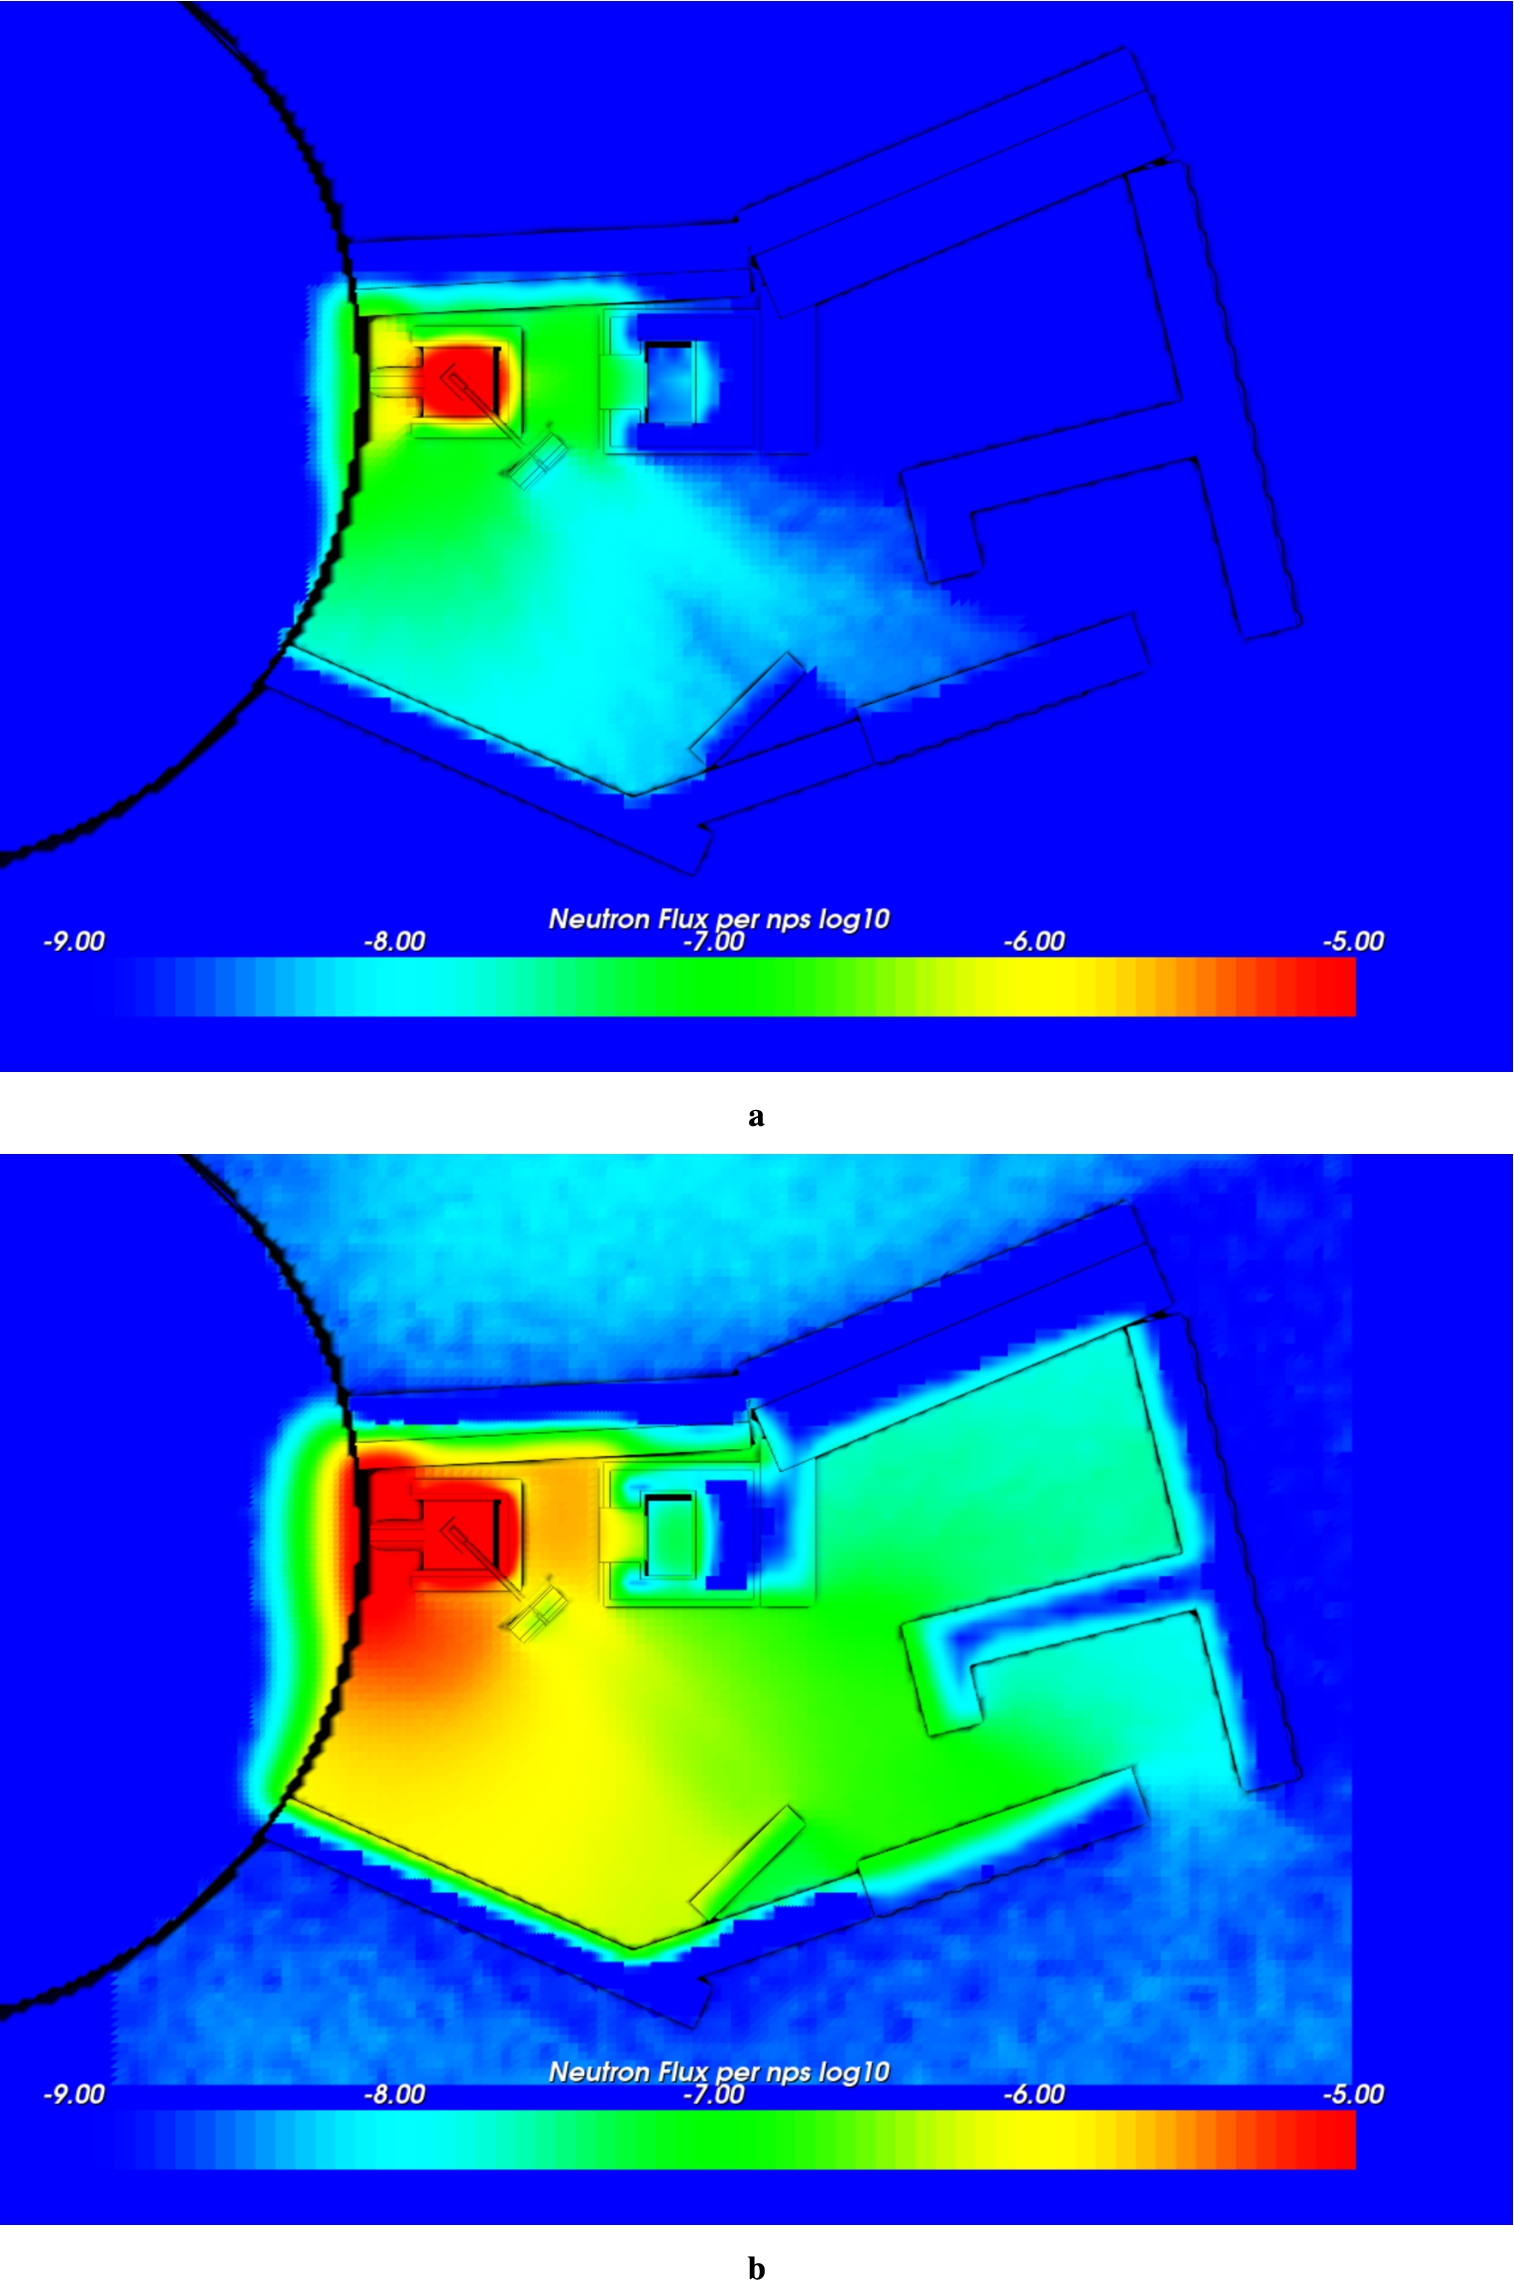
Fig. 220.
Neutron flux map at the moderator height with a spatial resolution of 10 cm × 10 cm × 10 cm for (a) thermal neutrons (13 meV to 81.8 meV) (b) cold neutrons (5.11 meV to 13 meV). Units are n/cm2/nps in log scale.
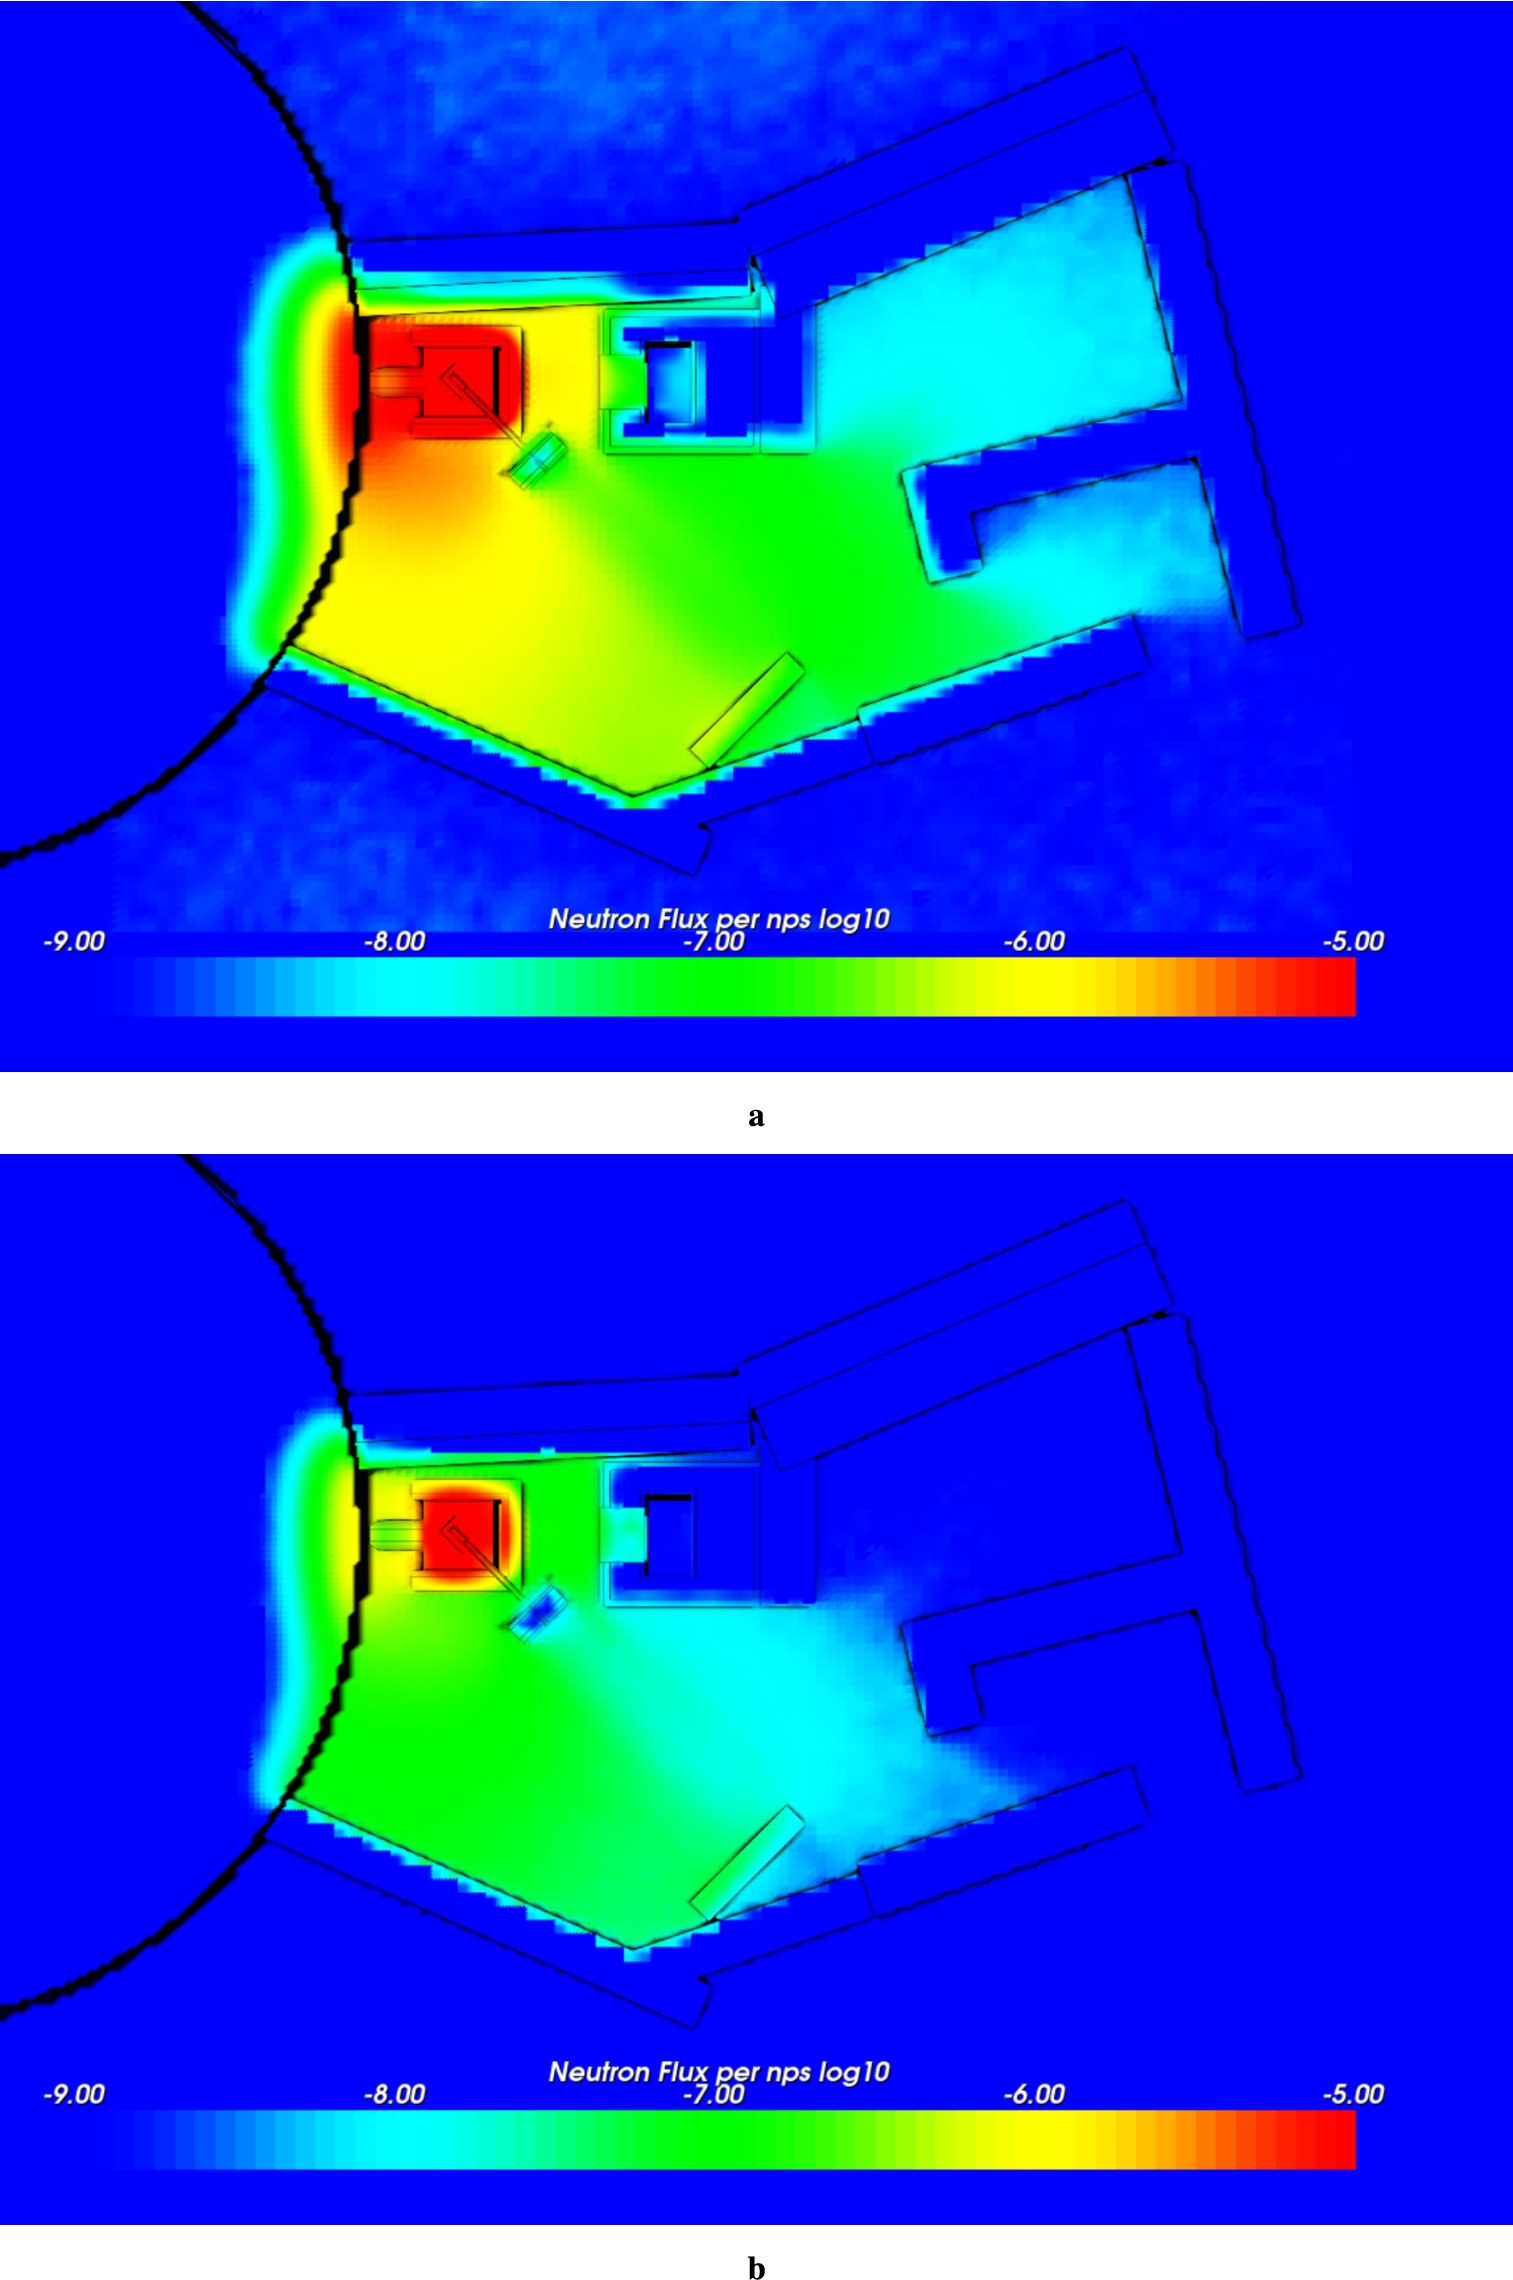
Fig. 221.
MCNP model of the shielded detector for the HighNESS experiment. The shielding is made of 2 cm Mirrobor™(80 wt% B4C + CH2O), is 20 cm × 20 cm and covers the gap from the pin-hole assembly to the detector position.
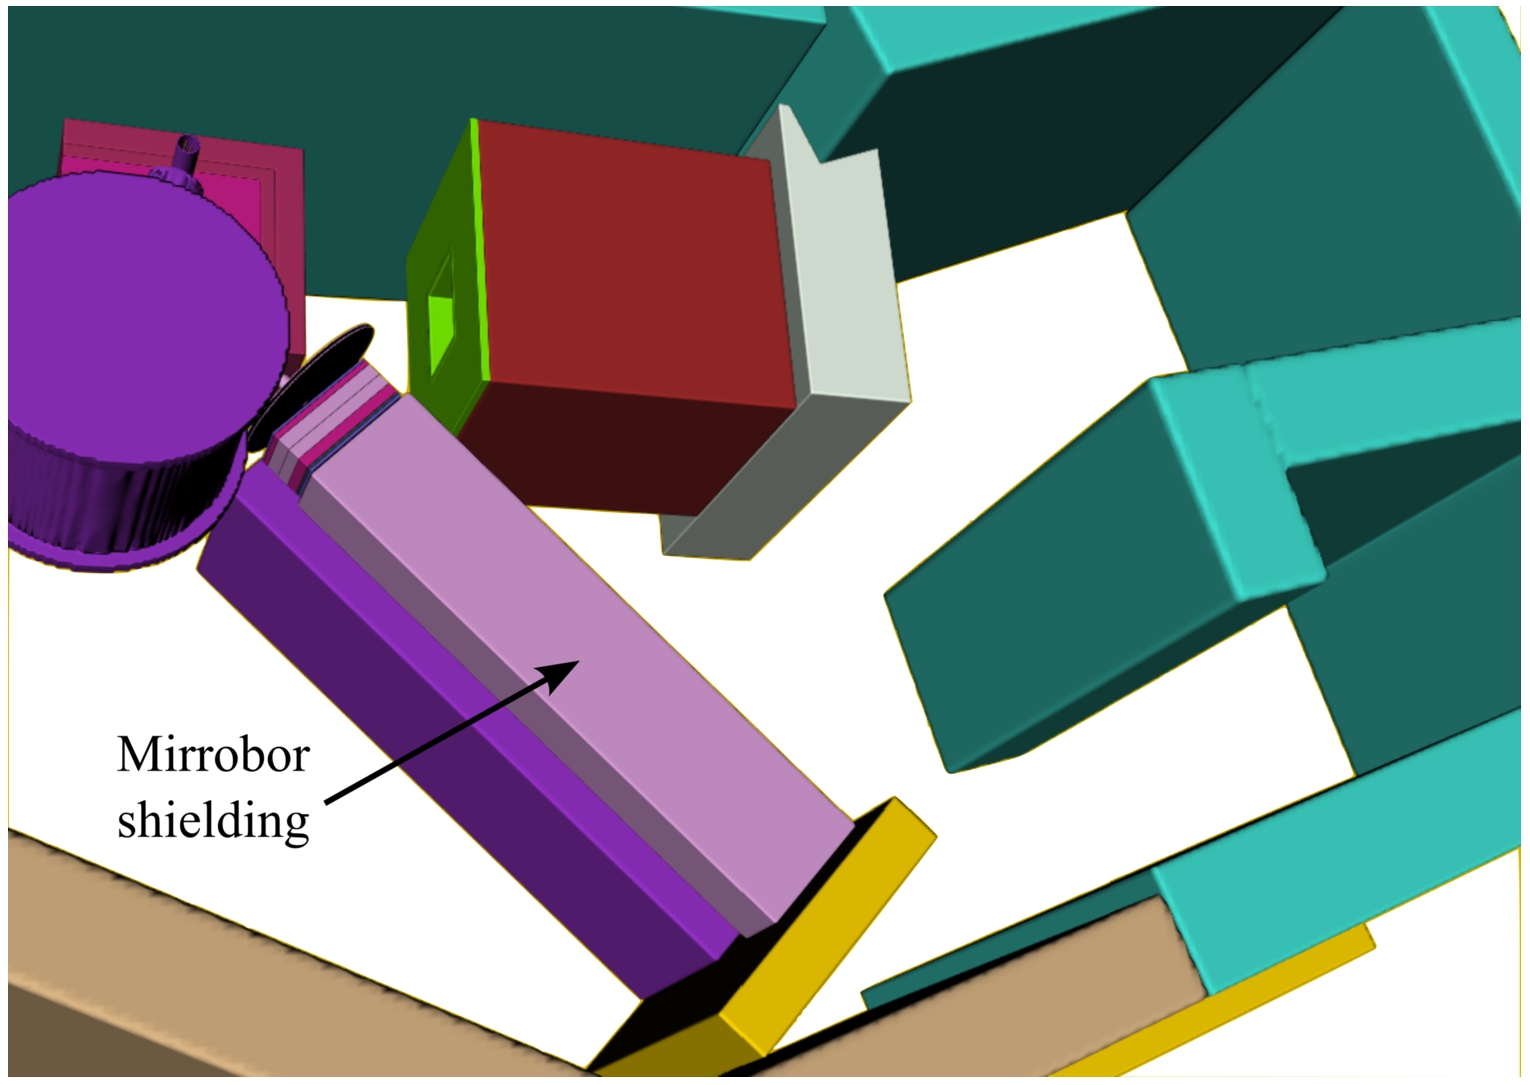
10.1.10.Dose rate
The measurement of the dose rates outside the bunker is an important task to guarantee the safety of the people working at the facility during the experiment. The estimation of the same dose rates with a model is needed not only to ensure the validity of the model itself but also to study what the worst case scenarios are and how to prevent them. A preliminary safety assessment with the channel #4 beam shutter open and reactor power of both 1 and 10 MW was performed by the radiation protection group in week 23 of 2023. A temporary lead reflector and paraffin wax shielding (Fig. 222a) was mounted in the room, and a temporary ceiling made of borated HDPE sheets was built. Neutron and gamma dose rates were measured at five points outside the boron concrete walls. In all the cases, the values were below the legal requirement of 10 µSv/h (see Table 47). We adapted the previous model by adding the dummy lead reflector and the temporary HDPE roof to compare the calculated dose rates with the measured one. The model and the five points measured are shown in Fig. 222b.
The dose rates are calculated using the Neutron Fluence-to-Dose Rate Conversion Factors based on ICRP-116 and assuming a neutron current of 2.81 × 10¹¹ n/s through the beam port of Channel #4 (value calculated with the full reactor model in MCNPX). The resulting dose rate map is shown in Fig. 223. Considering how preliminary these calculations are, we found a good agreement with the measured dose rate, at least in the order of magnitude. It should be noted that it was not possible to compare the gamma dose rate since no gamma source was included in the model. A pessimistic estimation of the gamma flux out of the beam port based on measurements in channel #2 was proposed as a back-of-the-envelope solution to include gammas in the model. Moreover, it is clear that a dedicated study that measures precisely the flux in the five regions and improves the statistical convergence of the tallies is needed.
10.1.11.Activation calculations
Based on the neutronic model previously described, the activation of the experimental setup components was also studied, in particular the activation of the reflector vessels that have to be exchanged during the experiment to assess the effect of the different reflector materials and of the FZJ cryostat for shipping and future re-use purposes. The calculations were performed at the Oak Ridge National Laboratory. The following hypotheses were considered:
- 40 hours of operation at 2.81 × 10¹¹ n/s, which corresponds to 4–5 measurements per day of 1 to 2 hours
- 30 minutes, 1 h, 8 h, 1 day, 1 week and 1 month of decay time.
The dose rate limits to access the bunker are:
- In normal working conditions to access inside the bunker (reactor in operation, channel closed): below 30 μSv/h,
- Extreme conditions, e.g. for short immediate operations (reactor in operation, channel open): below 500 μSv/h – max 1 hour cumulated dose for 2 months span.
Due to issues in using the external supply line of H2, a smaller cryostat than the one initially described, self-supplied, was used for the experiment as described later on in Fig. 234. The cryostat was modelled according to the CAD description of this component. The neutron fluxes were volume-averaged over whole parts. The constant 40 hours of operation were assuming that the chopper and the pin-hole were in closed positions. Regarding the materials definitions, a cobalt percentage of 0.05% in carbon steels and of 0.2% in stainless steel was considered. Figure 224 presents photon dose rate maps through moderator center. After 30 minutes of decay, the limit of 500 μSv/h corresponding to the extreme conditions is exceed in the area where the vessel filled with advanced material is located. It can be also seen that the dose rates in the area where the cryostat is located are exceeding the 30 μSv/h limit for normal operating conditions. After one day of decay, this dose rate decreases to 2.5 μSv/h for both areas of concern. After 8 hours of decay time, the vessels to be exchanged are still in an area where the calculated dose rates are more than 80 μSv/h, which tends to indicate that a tool can be needed for remote handling of that component.
After 40 hours of irradiation and 1 day of decay, the dose rate on contact at the surface of the cryostat is calculated as 2.5 μSv/h. After a week of decay, the dose rate decreases by a factor of 10. The internal copper structure was taken into account. Figure 225 gives the total activity as a function of time of the cryostat. In stainless steel the activation is mainly dominated by 56Mn as shown in Fig. 225. The two other main contributors are 51Mn and 60Co. In copper, the activation is mainly due to 64Cu as reported in Fig. 226. It should be noticed that this model is not taking into account any shielding around nor in the collimator.
Table 46
Neutron flux values in n/cm2/nps measured at the detector position with the next-event estimator (F5) tally with and without the Mirrobor™shielding and for four different energy-groups: fast (1 MeV to 100 MeV), epithermal (81.8 meV to 1 MeV), thermal (13 meV to 81.8 meV) and cold neutrons (5.11 meV to 13 meV). The relative error for all the values is 1% . Due to the incompatibility of the library with the next-event estimator, ND were removed from the extraction tube for this test
| Neutron flux [n/cm2/nps] | Cold | Thermal | Epithermal | Fast |
| Without shielding | ||||
| With shielding |
Fig. 222.
(A) dummy lead reflector with temporary paraffin wax shielding. (B) MCNP model of the experimental room adapted for the configuration of the dose rate measurements with the dummy reflector and the temporary roof. The five points where the dose rates were measured are also shown.
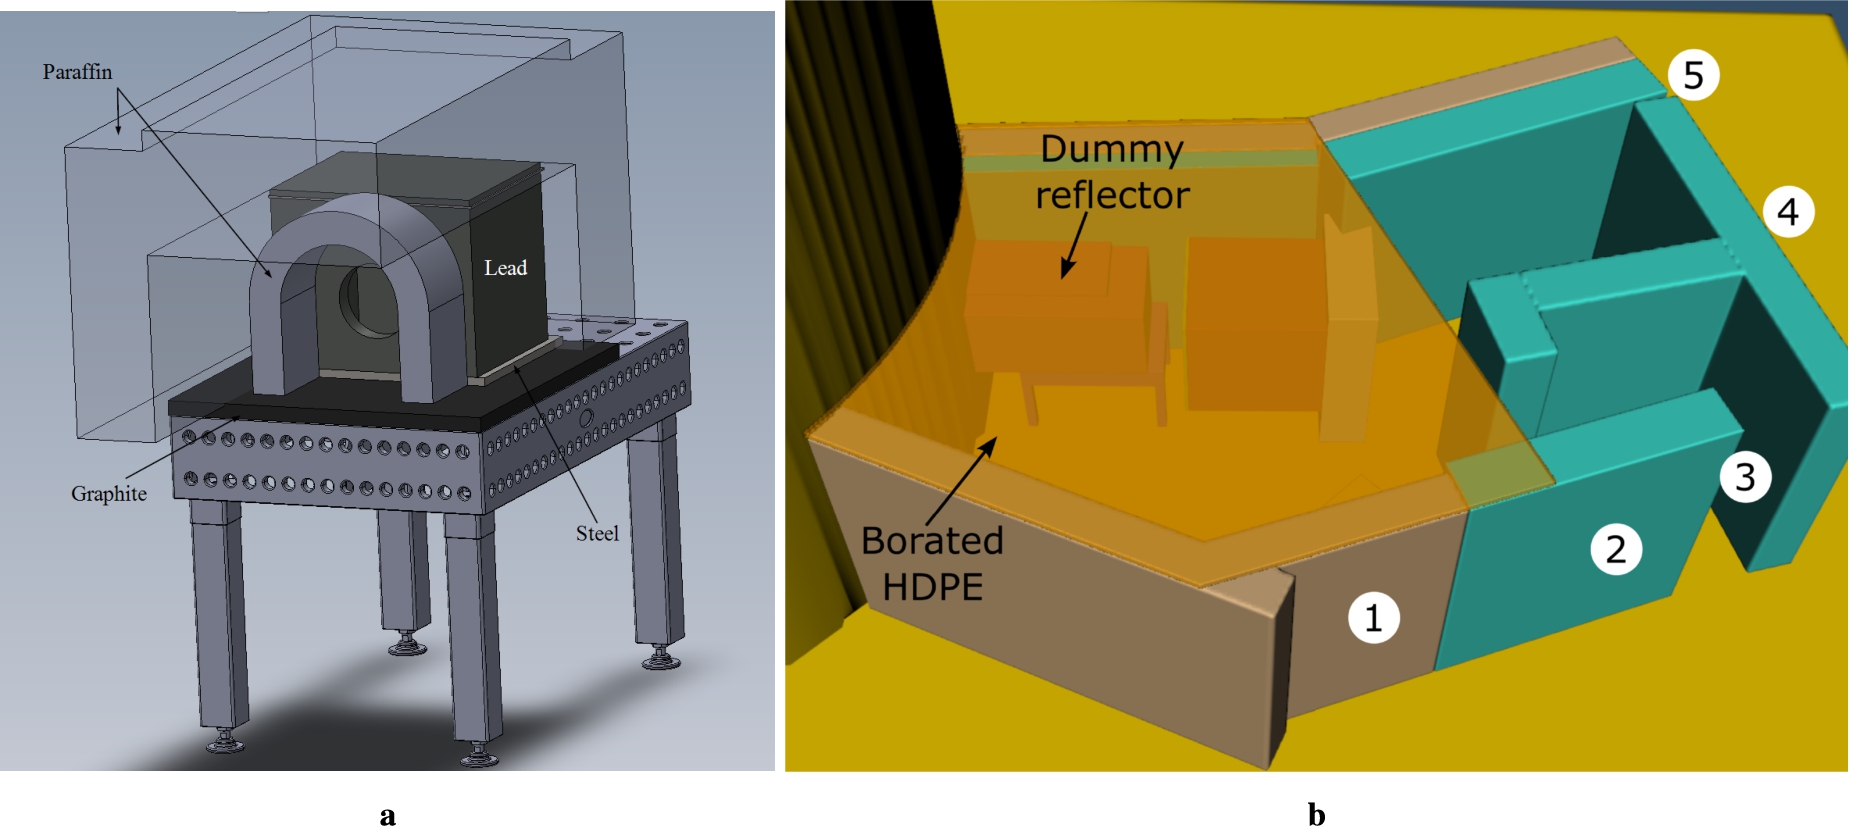
10.2.Engineering of the experimental setup
The engineering team (WP5) designed a moderator & reflector unit, surrounded by advanced reflector materials as well as an associated beam extraction channel based on advanced reflector materials for the BNC experiment. To be able to quantify the effect of the advanced reflectors, a control measurement with an empty reflector vessel should be carried out first as reference. This initial measurement can then be followed by measurements performed with ND and MgH2 vessel respectively. Those interchangeable vessels filled with 10 mm thick layers of ND or MgH2 powder have to be placed around the cold para-hydrogen moderator, which is fed by neutrons of the Budapest research reactor. These reflectors can be exchanged to perform measurements with different configurations, shown in Fig. 227. The moderated neutrons of the moderator/reflector assembly are led into a 600 mm long beam-tube, surrounded by a 5 mm thick ND powder layer to extract the cold neutrons from the moderator. The spectra of the moderator/reflector/guide assembly are measured by a pin-hole (“camera obscura”) time-of-flight (TOF) setup. All structures which are placed in the neutron beam are manufactured of aluminum to reduce activation and allow fast exchanging of the reflector vessels. The H2 supply lines are led into the cryostat system outside the bunker, where the LH2 liquefaction takes place and a high para-H2 concentration will be generated.
Table 47
Neutron and gamma dose rates measured by the reactor radiation protection group in week 23 of 2023. Reactor power was 10 MW. Values obtained by private communication
| Dose rate [µSv/h] | P1 | P2 | P3 | P4 | P5 |
| Neutron | 3 | 3 | 8 | 6 | 1.6 |
| Gamma | 2 | 4 | 2.9 | 2.1 | 2.5 |
Fig. 223.
Neutron dose rate map with a spatial resolution of 10 cm × 10 cm × 10 cm. The dose rates are calculated using the Neutron Fluence-to-Dose Rate Conversion Factors based on ICRP-116 and assuming a neutron current of 2.81 × 10¹¹ n/s through the beam port of channel #4. Units are µSv/h in log scale. The five points where the dose rates were measured are also shown.
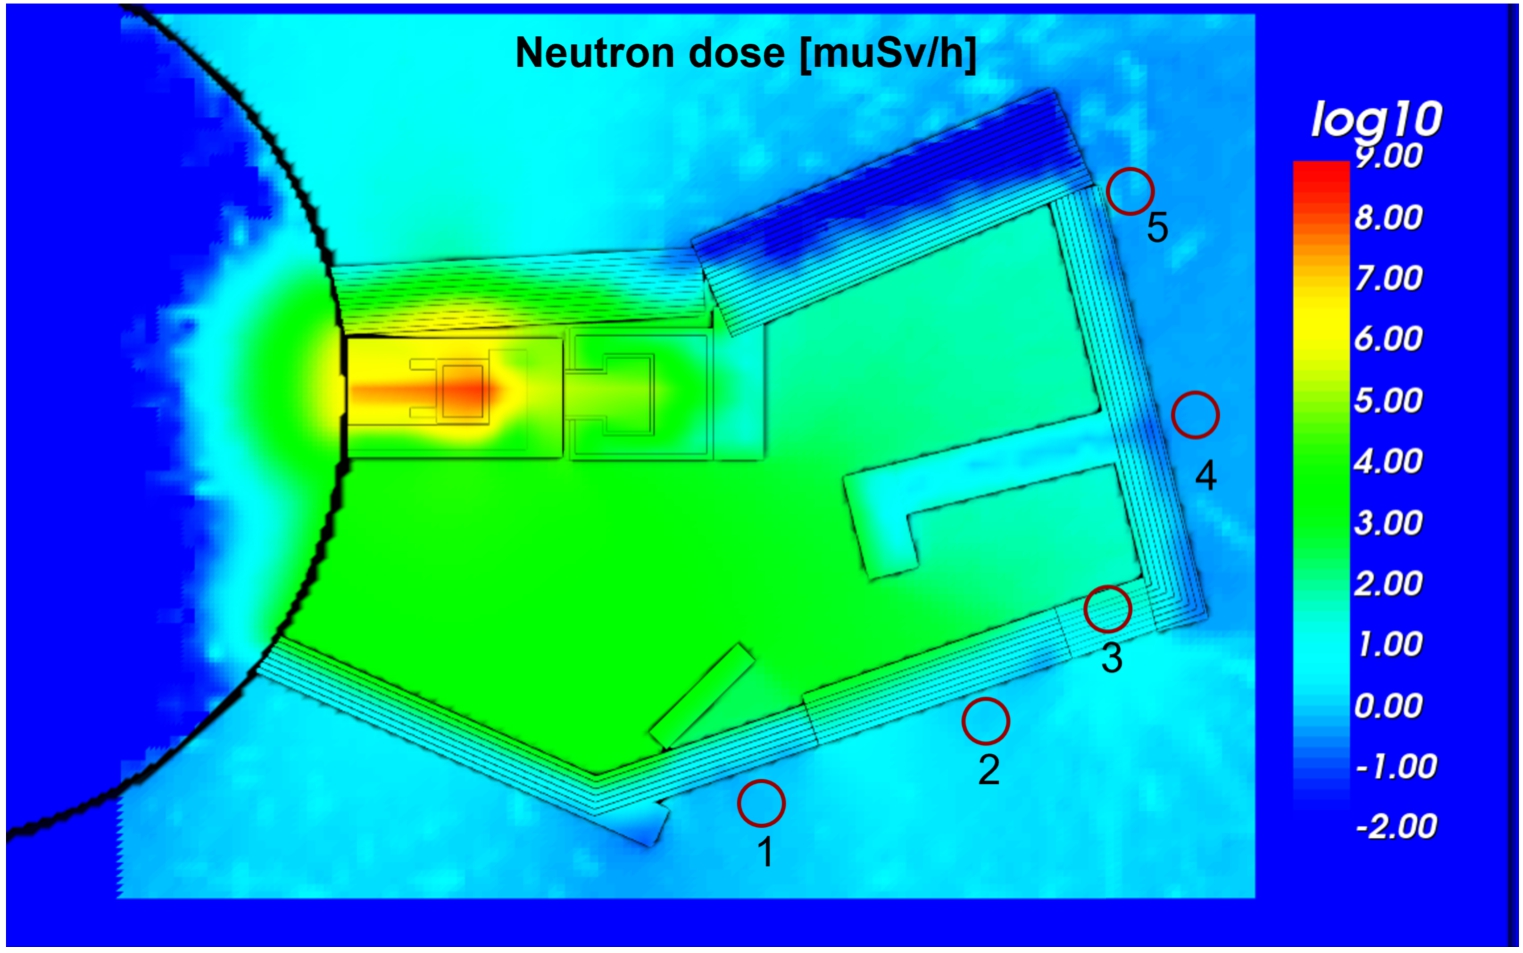
Fig. 224.
Photon dose rates – 30 minutes of decay (a) (b) 1 day of decay.
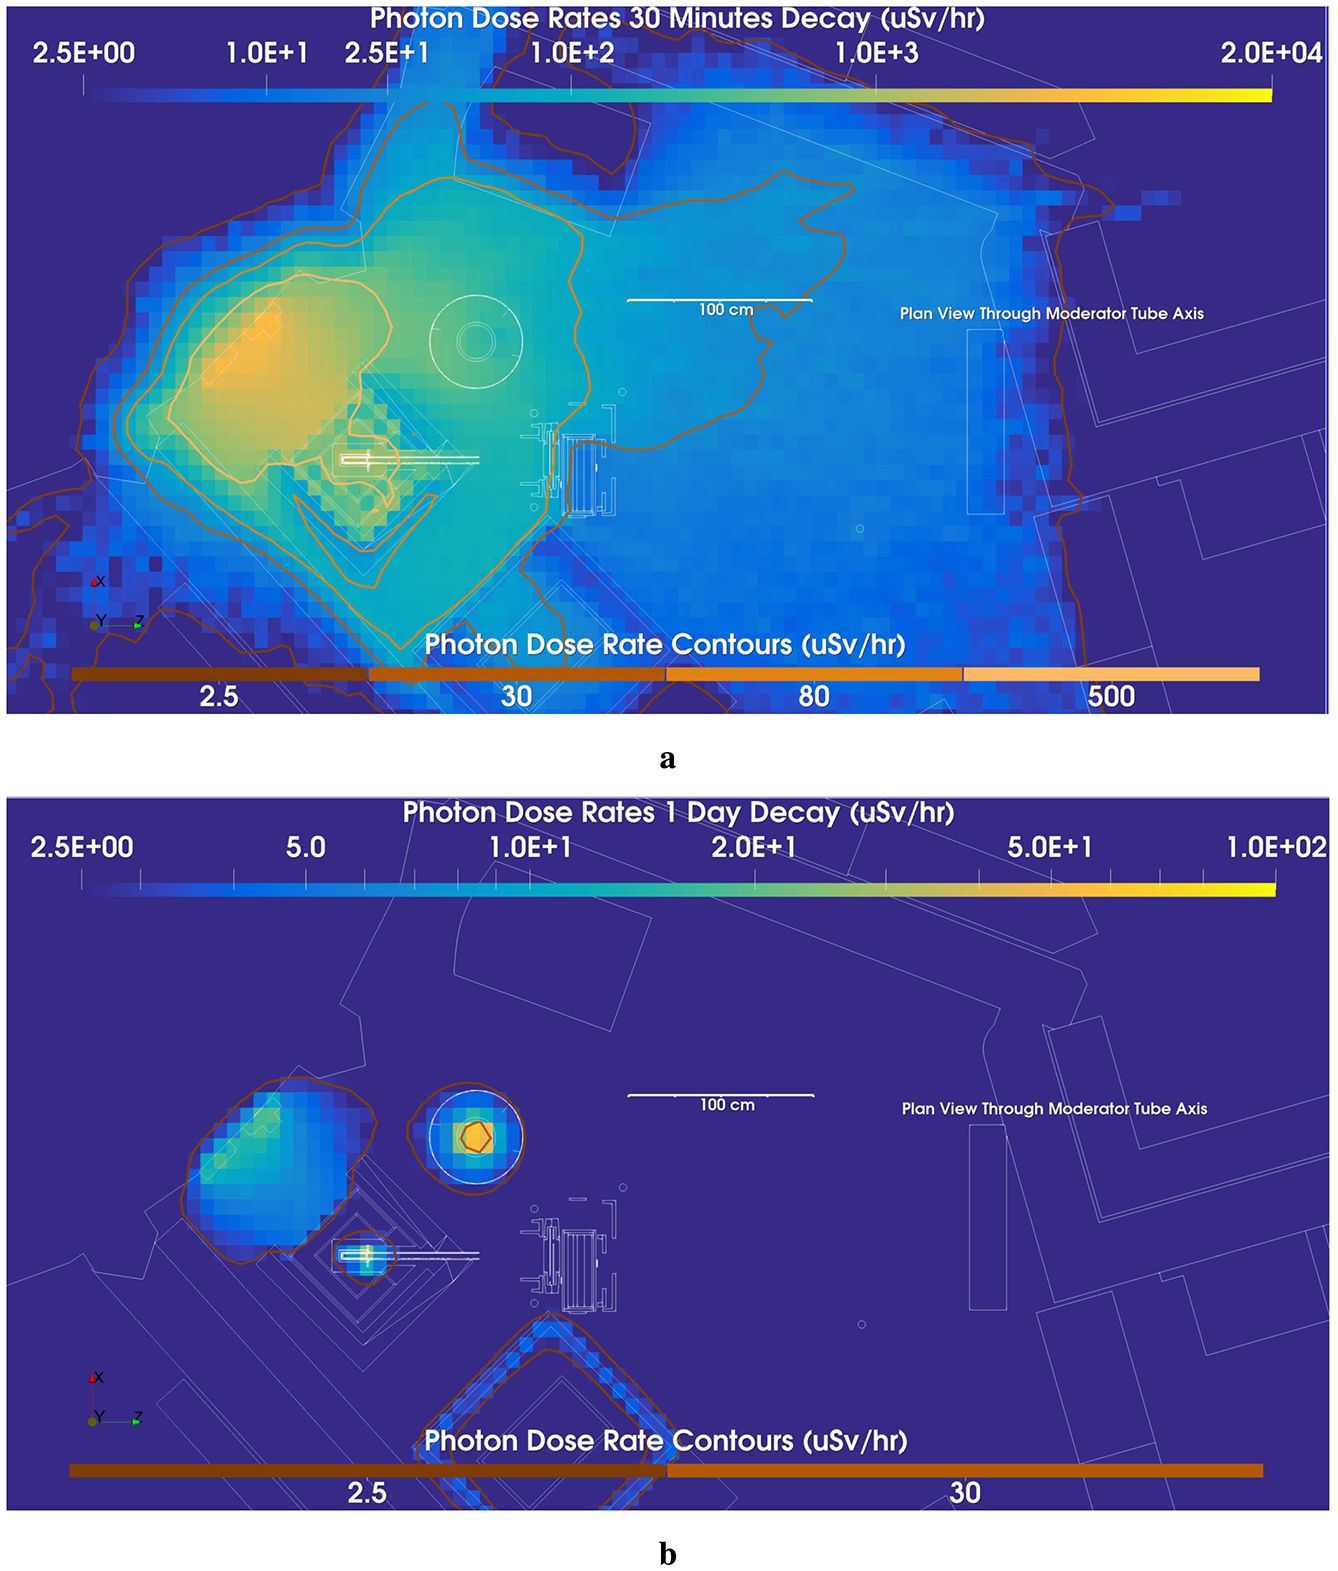
Fig. 225.
Total activity over time of the FZJ cryostat.
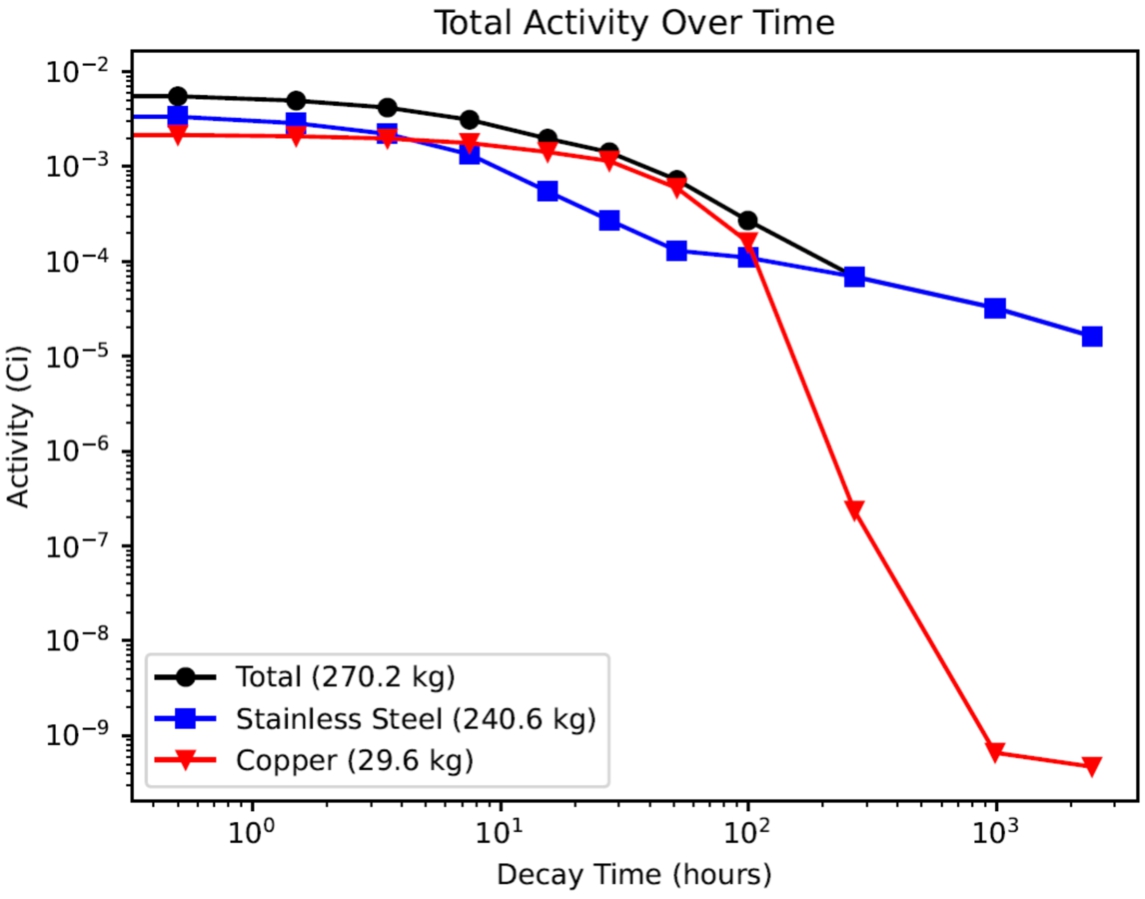
Fig. 226.
(A) activation of the FZJ cryostat – contribution of stainless steel (b) contribution of copper.
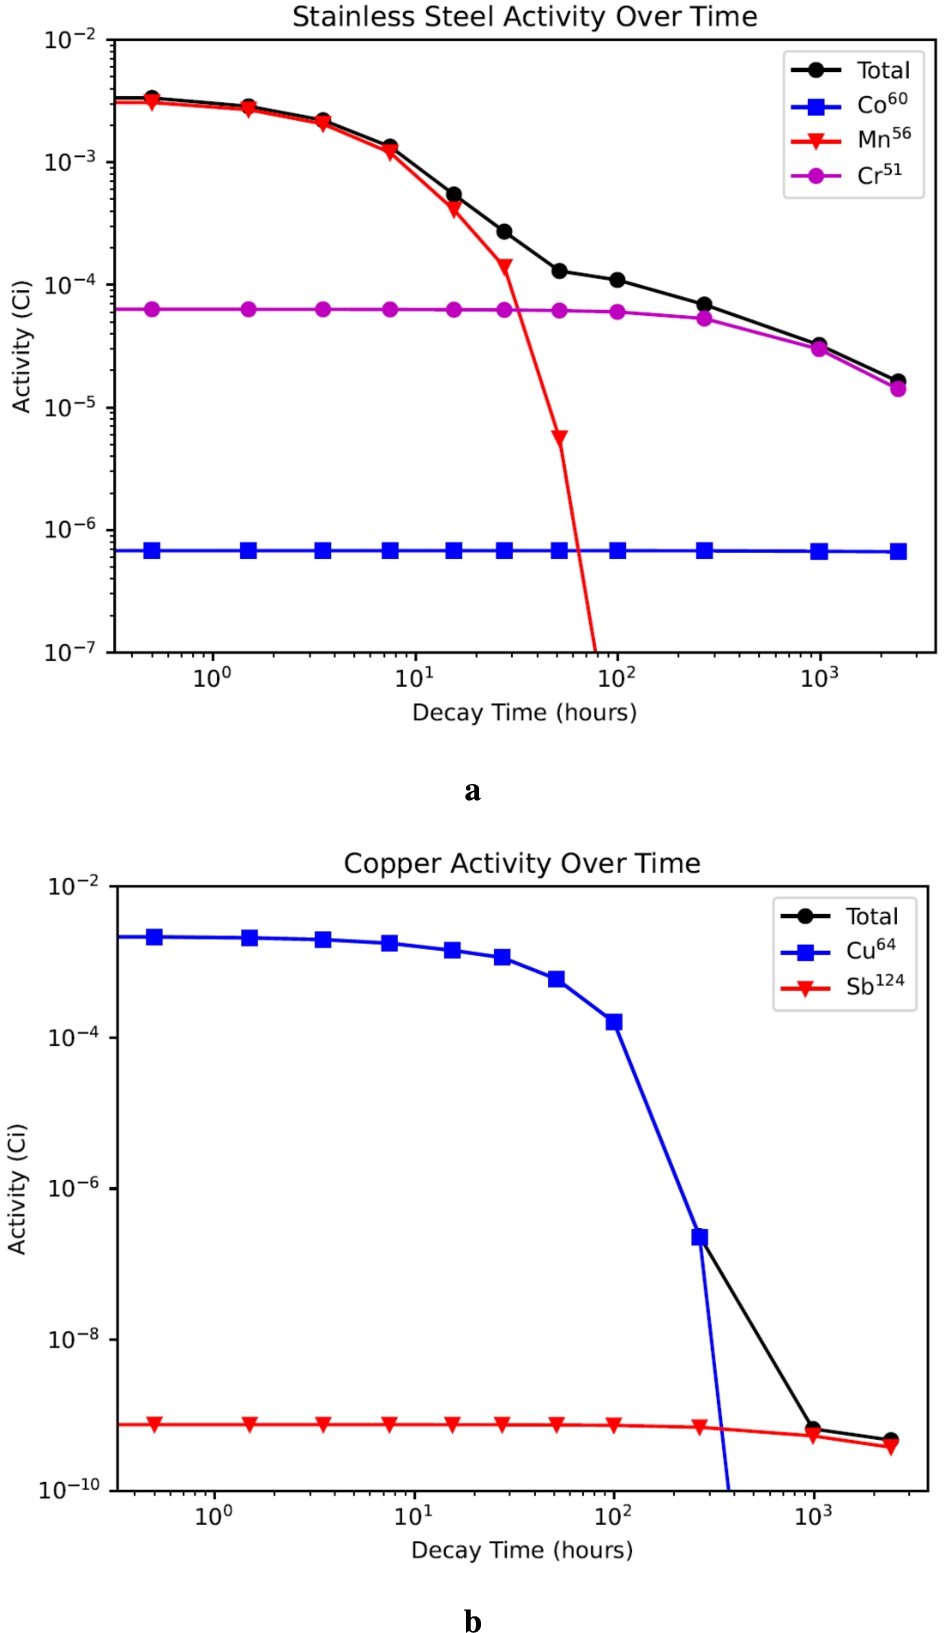
Fig. 227.
Experimental moderator/reflector/guide setup with interchangeable configurations placed inside the neutron beam.
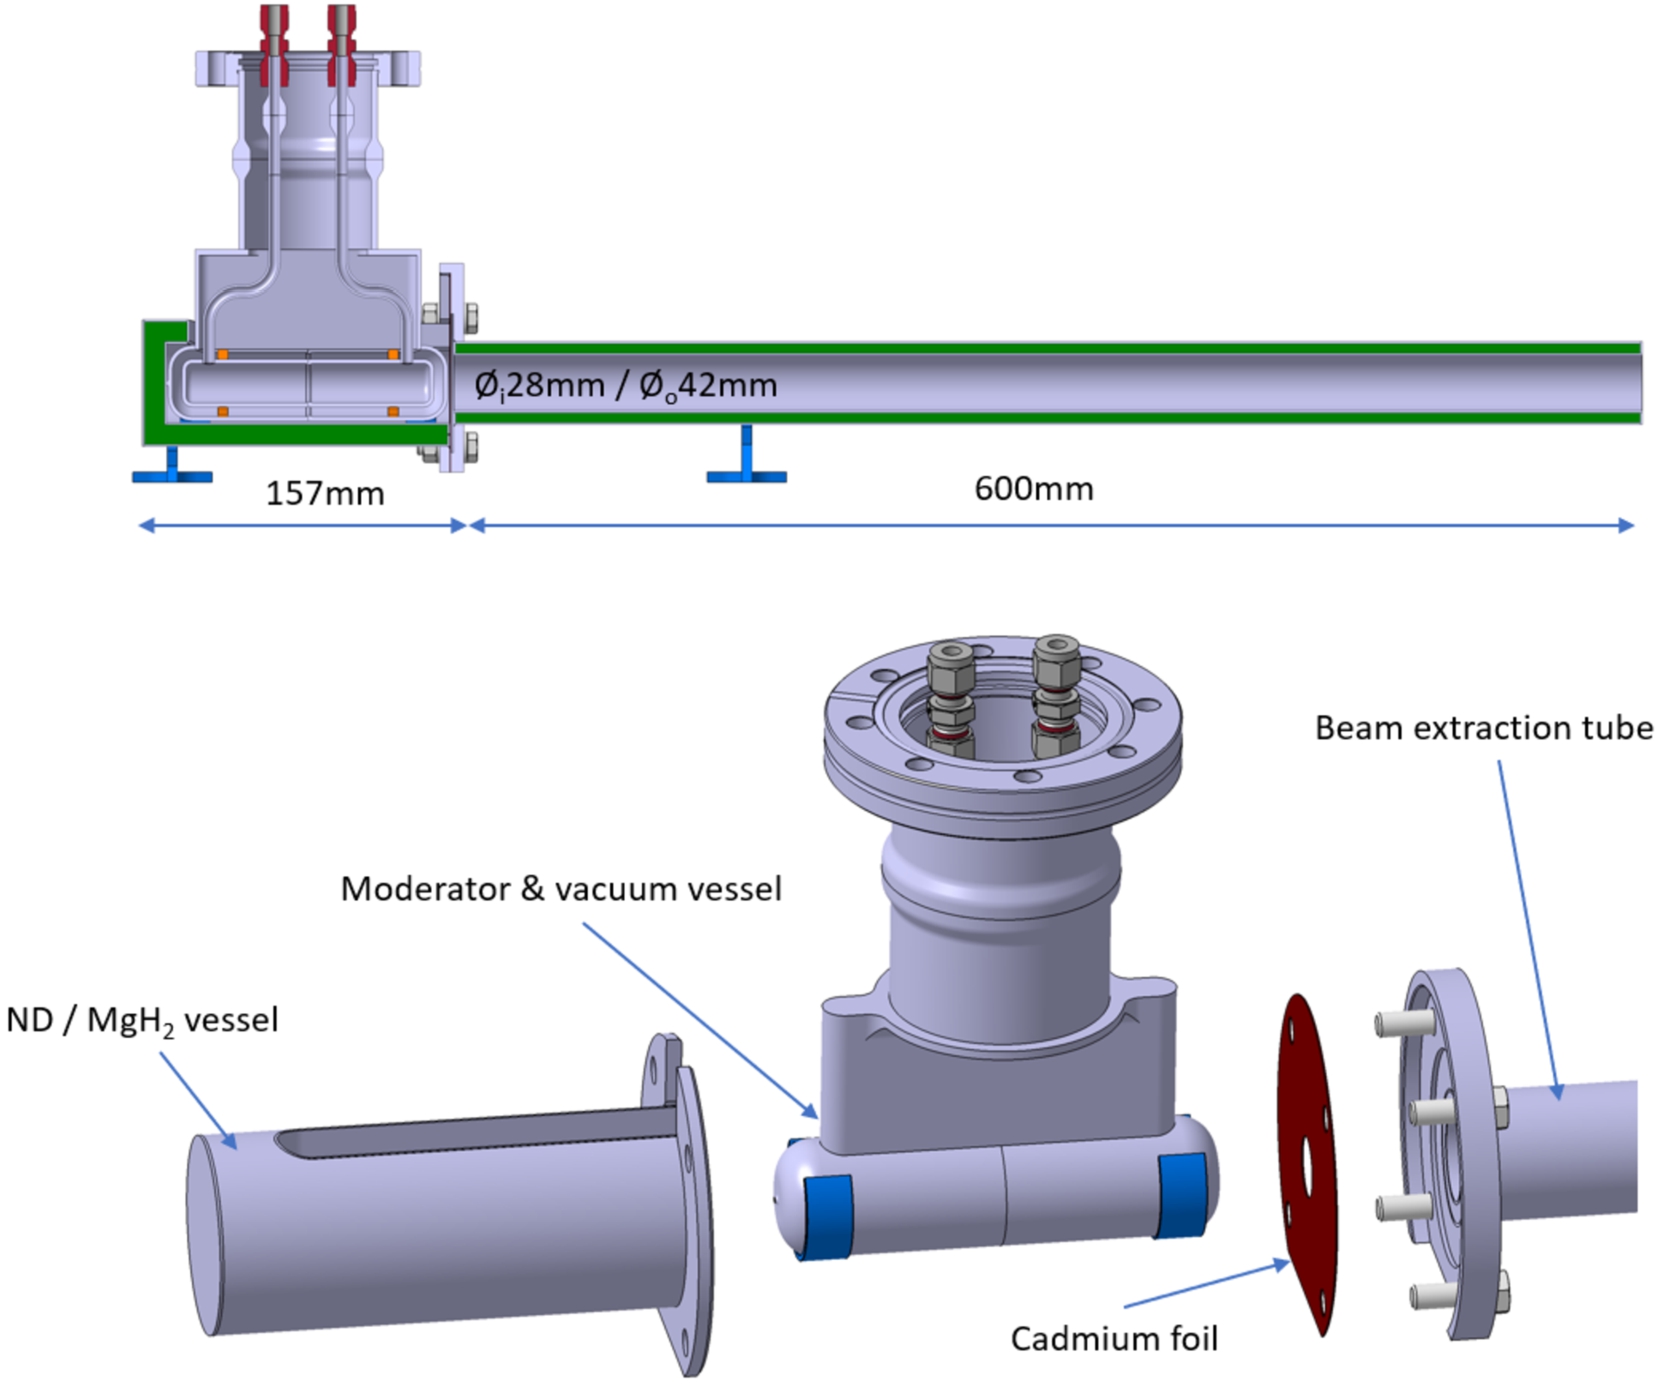
10.2.1.Assembly and welding of the components
The moderator itself consists of two half-tubes with back walls, which are milled from one piece of aluminum EN AW-5083 each. They are joined by EB welding to minimize the heat input during the process. This reduces bending and distortion issues during the welding process significantly. After the welding, spacer rings made of polyimide are put onto the vessel, to ensure proper alignment of the moderator in the surrounding vacuum vessel. Polyimide is chosen as material because of its low heat conductivity while being resistant to the low temperatures the moderator will reach, as it uses LH2 as the moderating medium at a temperature of around 20 K. This reduces the required cooling power of the cryostat, because it reduces thermal losses due to thermal insulation. In the next step, the supply pipes for the LH2 are welded on by tungsten inert gas welding (TIG) (Fig. 228 & Fig. 230 left).
Fig. 228.
Design of the LH2 moderator.
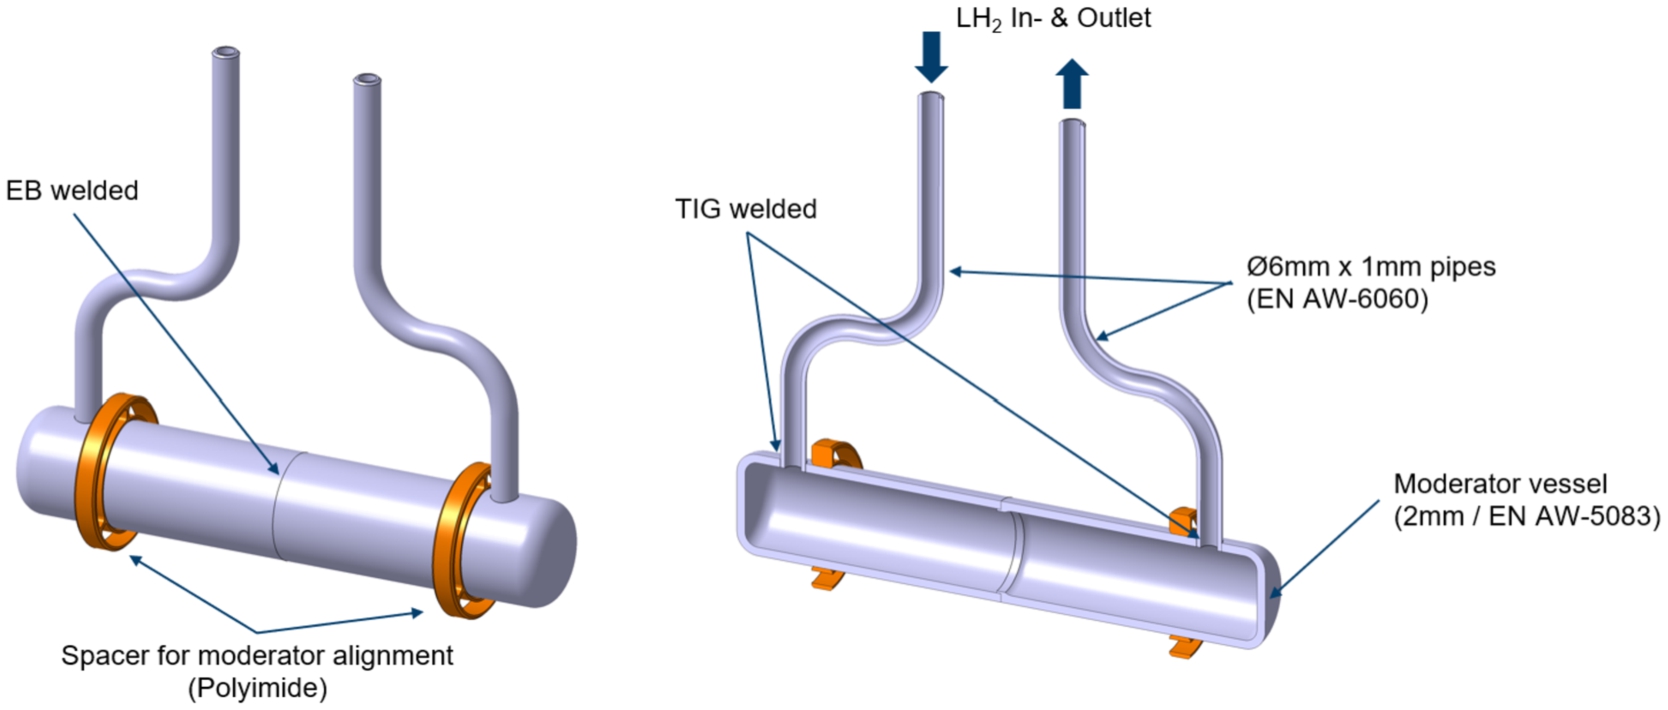
The vacuum vessel shown in Fig. 229 and Fig. 230 (right) ensures the insulation vacuum for the cryogenic parts of moderator system. This is necessary, because it affects the required cooling power that is needed for the low temperature of around 20 K of the moderating medium LH2. The jacket surrounds the moderator and the supply pipes. It is also joined by EB welding, for minimal heat input and less distortion when welding. There are two interfaces in this vacuum vessel. One is the connection of the LH2 supply pipes and the other is the vacuum connection flange. On both interfaces, a transition from aluminum to stainless steel is needed, because aluminum is too soft to ensure a re-useable connection. Therefore, at the pipes, a friction welding adapter is used, so that the cutting ring fitting for the connection to the transfer-lines can be adapted to the stainless-steel end of the adapter. The CF-flange at the outer vacuum jacket is also made of stainless-steel. This transition from aluminum to stainless steel is solved with an explosive cladding adapter, which has a titanium (Ti) layer in between. This material mix is due to the cladding procedure via explosion itself and has no special reason for the usage of the adapter.
Fig. 229.
Design of the vacuum vessel.
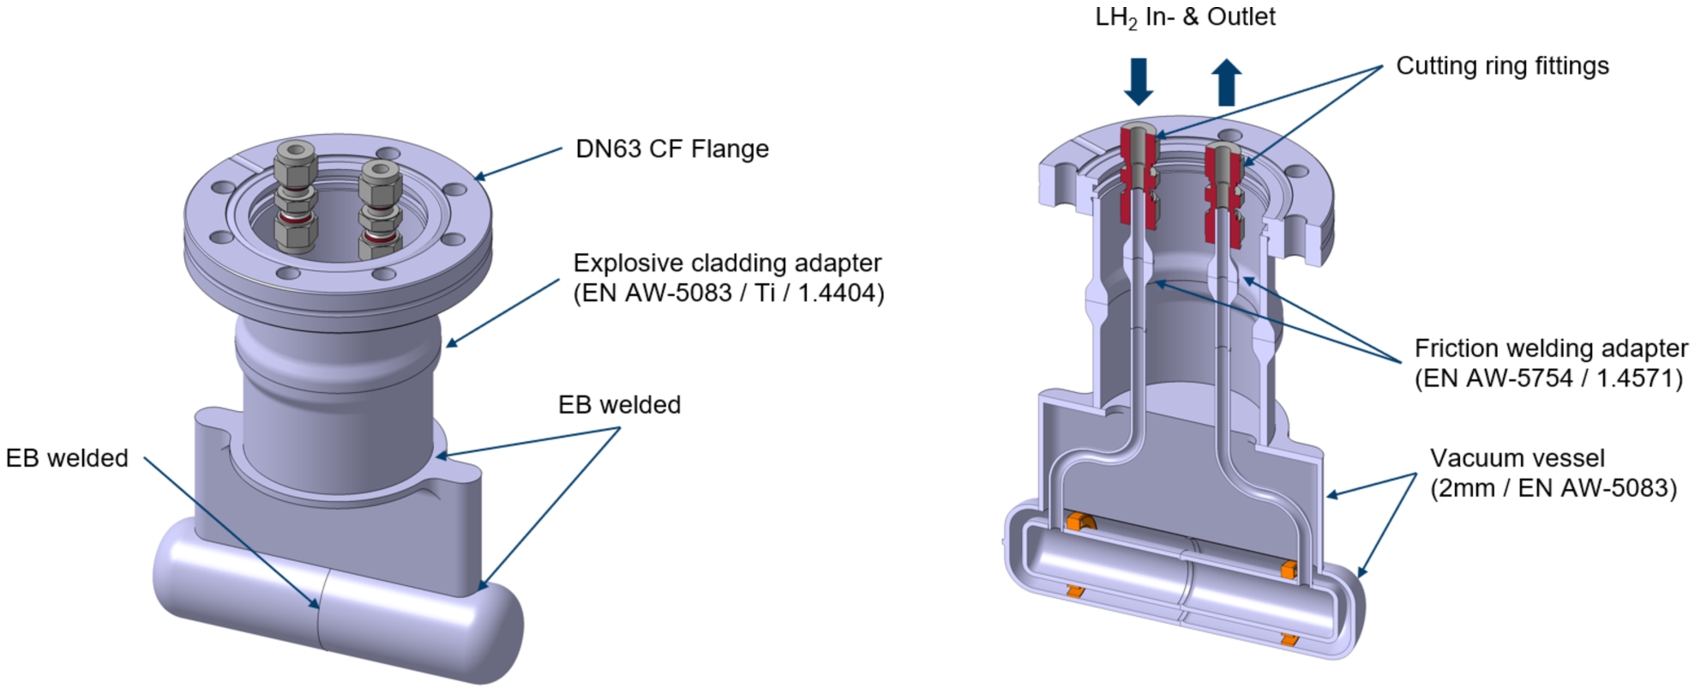
Fig. 230.
Manufactured cold moderator (left: hydrogen vessel, right: vacuum jacket).
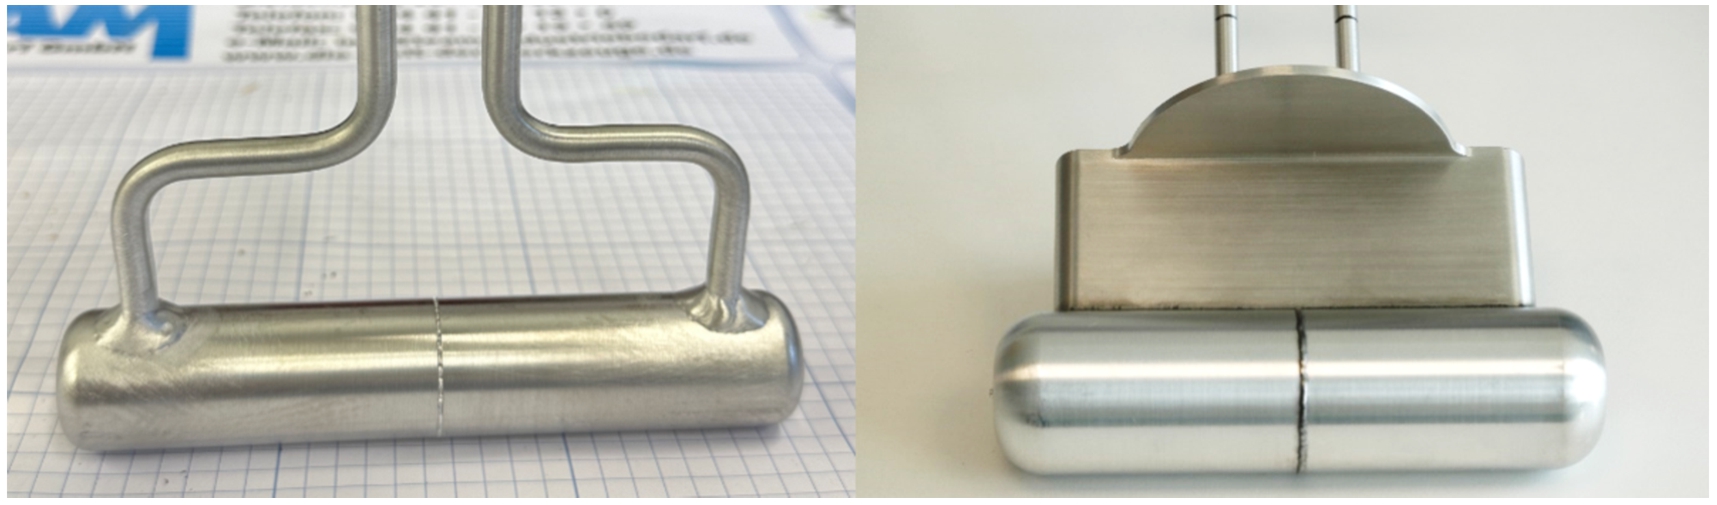
The ND & MgH2 vessels are basically made of an inner and an outer part, as it is shown in Fig. 231. The inner and outer tubes are made of aluminum EN AW-6060 and are both closed with a disc also made of EN AW-6060, which is EB welded, due to the small wall-thicknesses of 1 mm. They form a concentric vessel with a 10 mm overall layer in between, that has been filled with either ND or MgH2. The packing density of the ND vessels is 0.25 g/cm3 and for MgH2 0.60 g/cm3.
For a control measurement, one of the three vessel assemblies will stay empty. After the filling process, the vessels are closed with a ring-shaped disc by EB welding. To be able to connect the assembly to the beam extraction channel, a custom flange is tack welded onto the outer vessel part by laser beam welding.
Fig. 231.
Design of ND & MgH2 vessel.
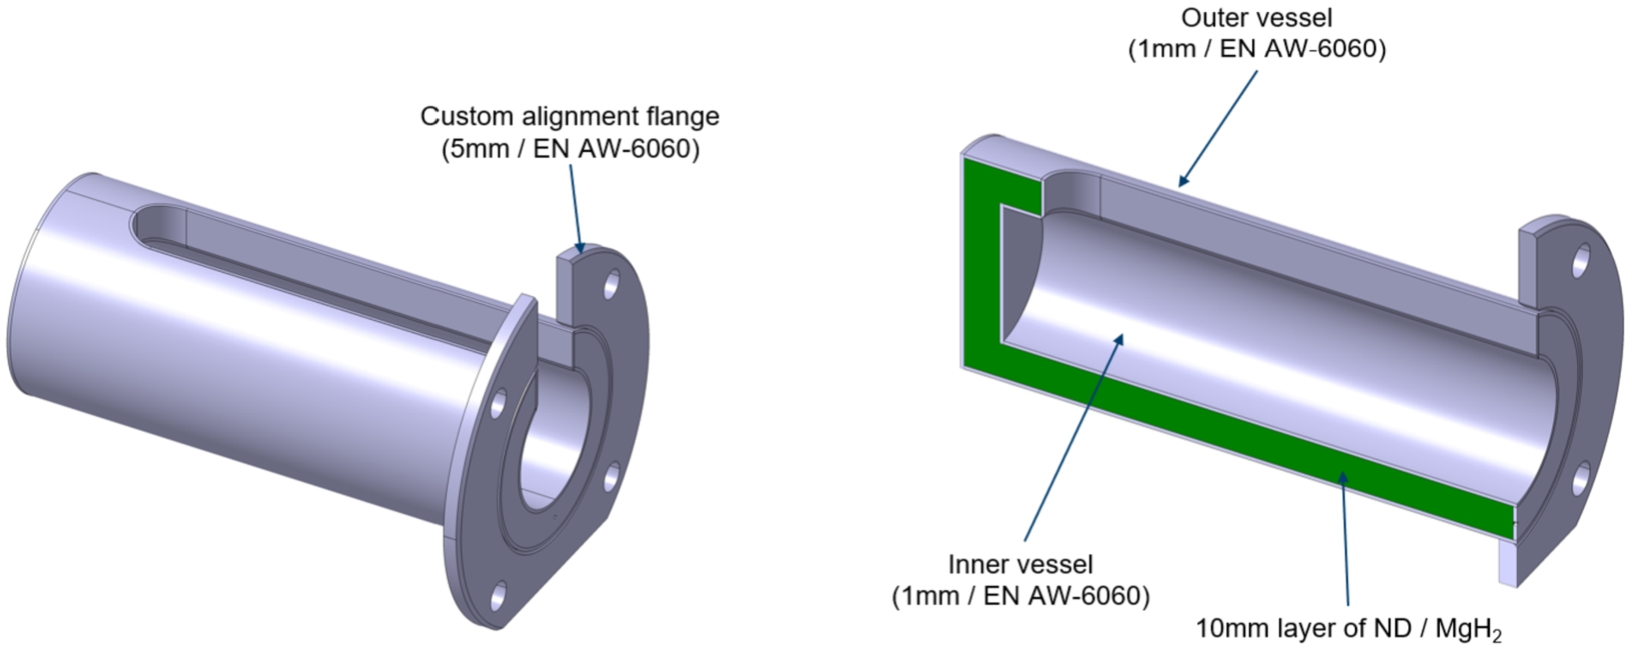
The ND beam extraction channel in Fig. 232 & Fig. 233 is generally of a very similar design, as the vessels described before in Fig. 231. It consists of an inner and an outer tube, which are in a first step closed from one side with a ring-shaped disc. They form a concentric vessel with a 5 mm layer in between, which is filled with ND. The filling was carried out under a fume hood while the tube/vessel was placed on a shaker. After the filling process, the vessel is closed with a second ring-shaped disc. All parts are made of EN AW-6060 and for the joining process, EB-welding is used again, due to the small wall-thicknesses of 1 mm. To be able to connect the assembly to the ND- & MgH2-vessels, a custom flange is tack welded onto the outer tube by laser beam welding.
Fig. 232.
Design of the ND beam extraction channel.
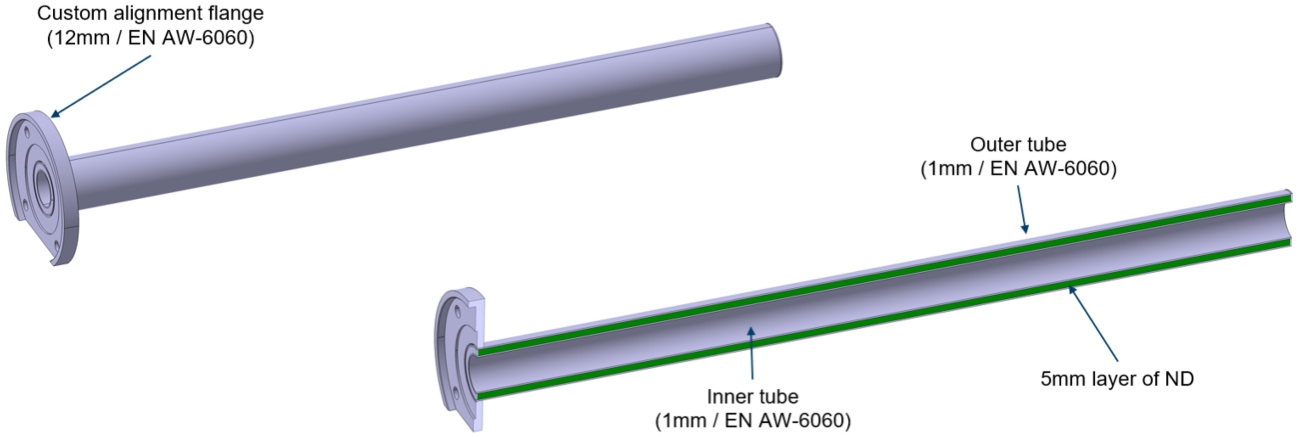
Fig. 233.
Manufactured ND beam extraction channel.
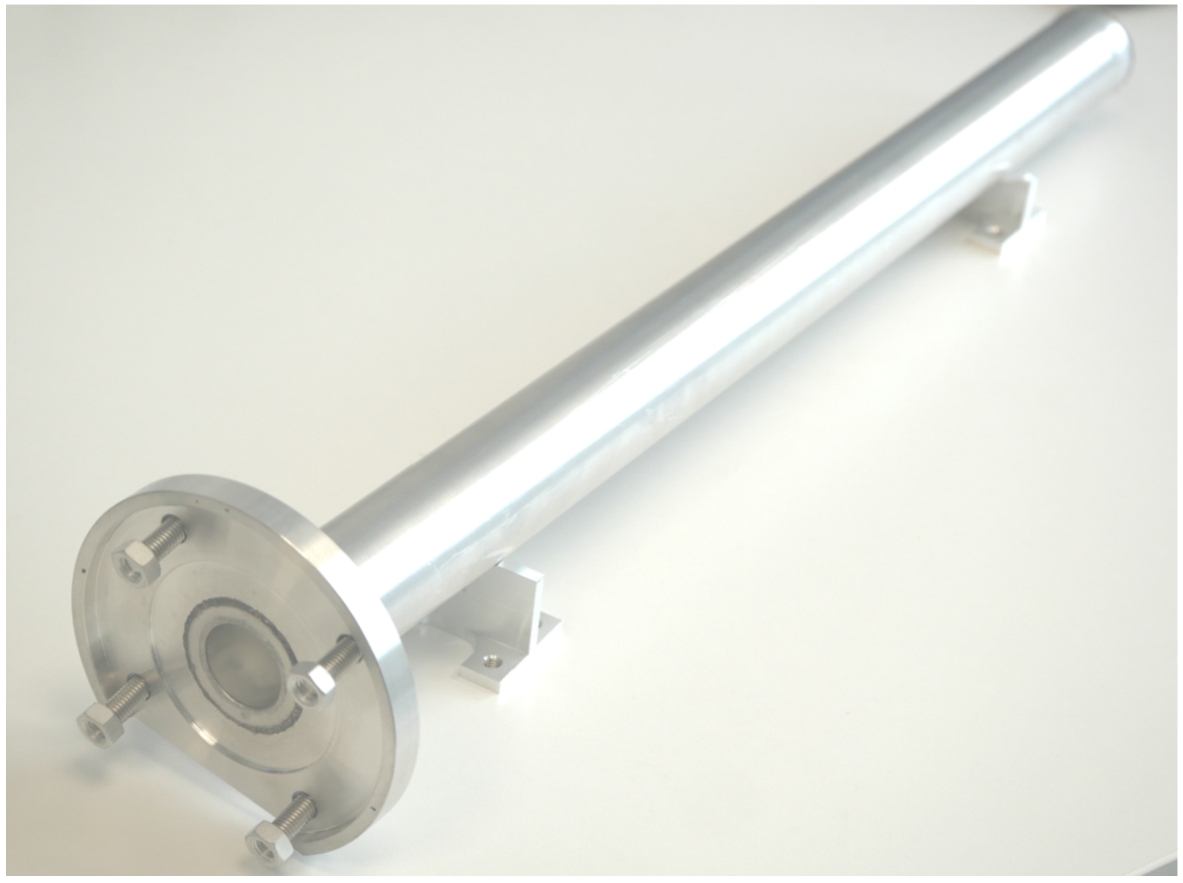
10.2.2.Assembly of the moderator & beam extraction system into the test facility
Figure 234 shows a side view cut-section of the moderator test facility at the Budapest Neutron Centre (BNC) with the integrated moderator and beam extraction systems.
Fig. 234.
Integration into moderator test facility.
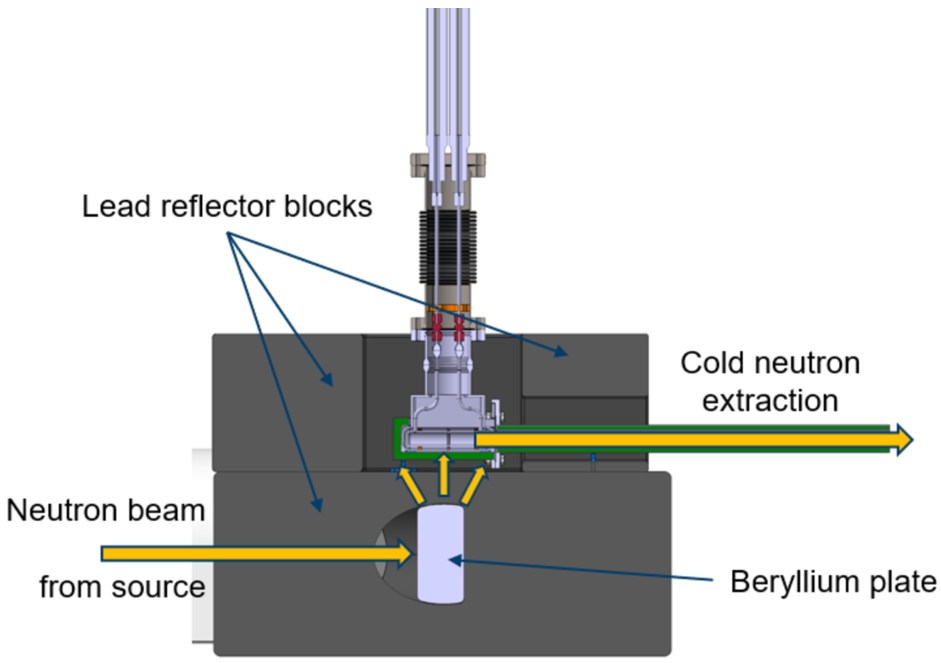
Figure 235 shows the moderator unit and the beam extraction system, located in the Budapest Neutron Centre (BNC) moderator test facility setup. Figure 236 is showing a view of the cryostat. The vacuum vessel surrounding the cold moderator and the LH2 supply pipes are connected via vacuum insulated transfer lines with the cryostat cold box. This cryostat is also made and owned by Forschungszentrum Jülich and was used to perform the experiment. It is needed to supply the cold moderator with LH2 in a closed loop using a circulation pump. A cold head with 40 W @ 20 K is used to liquefy and to cool down the hydrogen to 20 K inside the cryostat via a heat exchanger. In addition, a catalyst ensures that the moderator is supplied with almost 100 % para-hydrogen. The concentration ratio is monitored using Raman spectroscopy. It also supplies the insulation vacuum, which is necessary to maintain the cold temperatures inside the transfer lines and the vacuum jacket.
Fig. 235.
Moderator system with cryostat cold box.
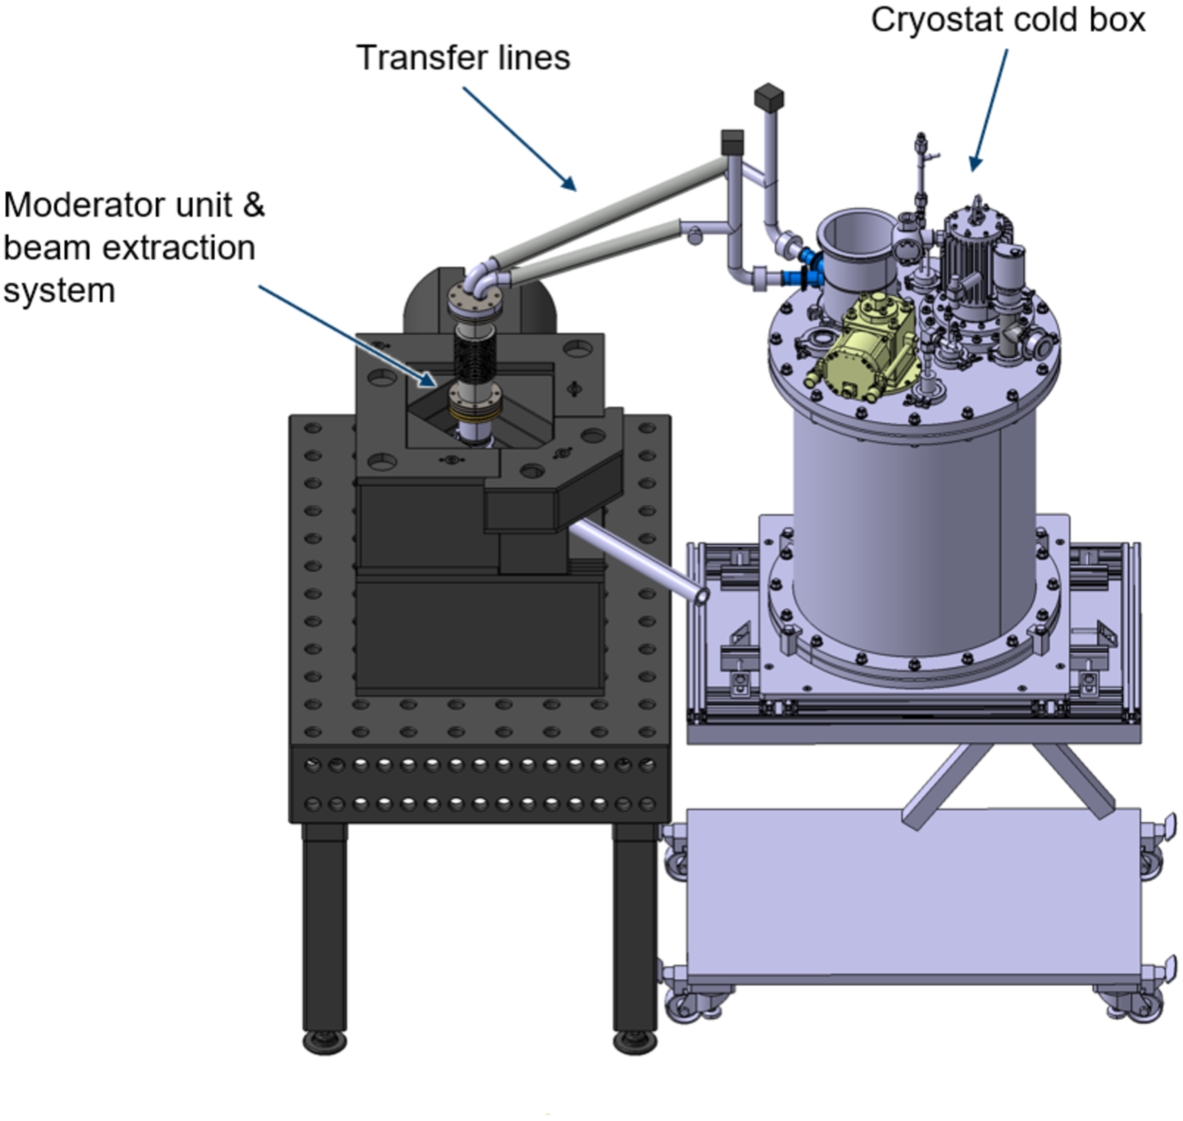
Fig. 236.
Assembled cold moderator system.
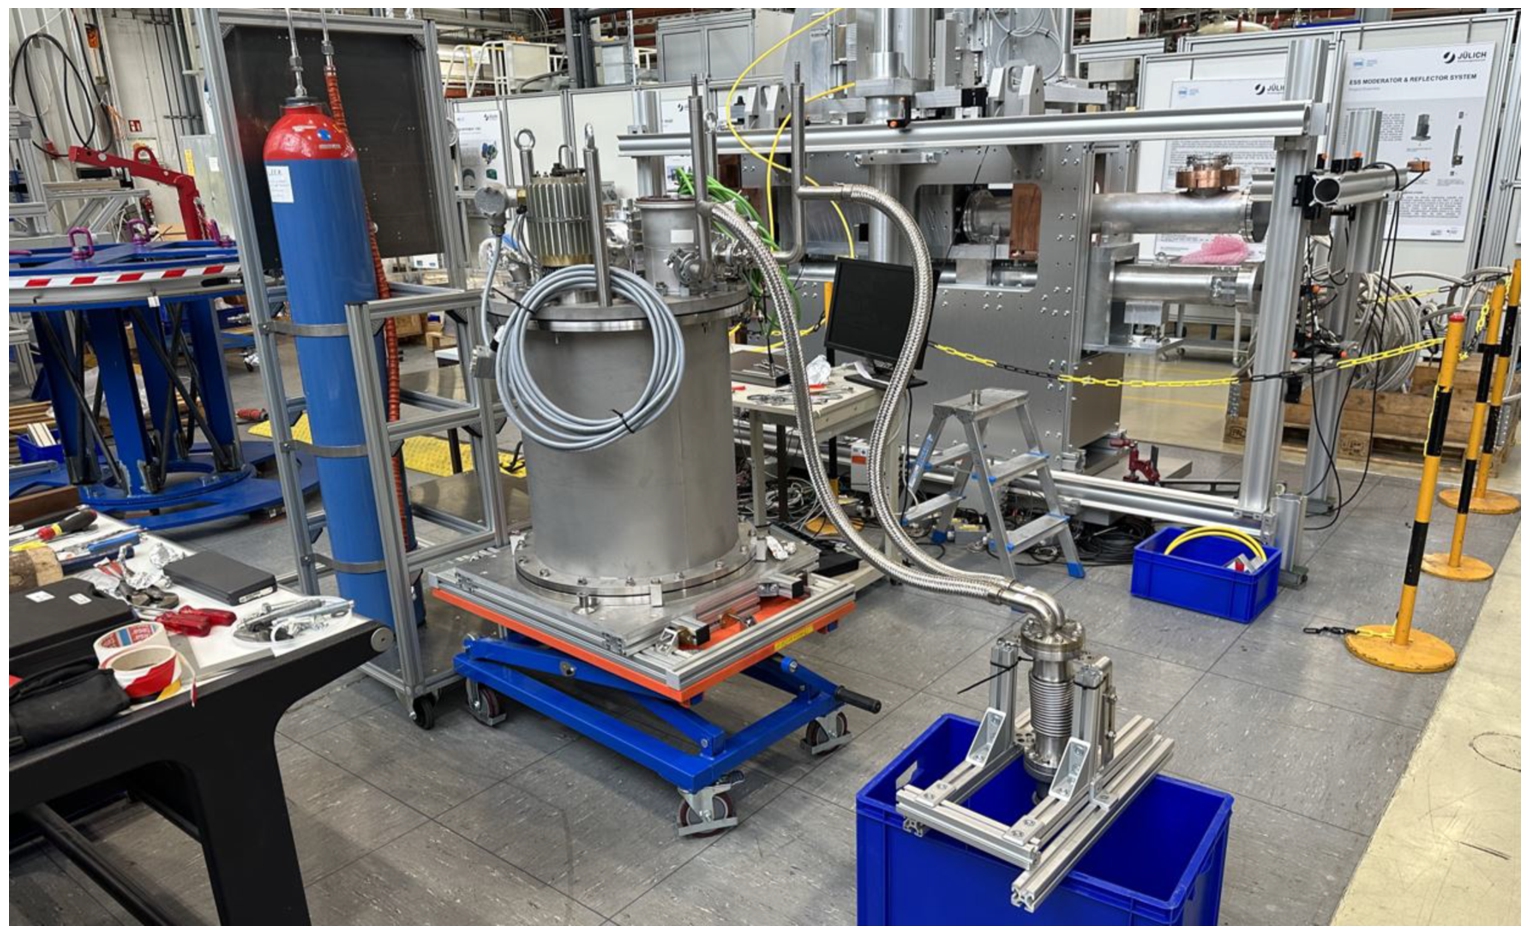
10.2.3.Results and discussion
Fig. 237.
CMTF beamline installed in bunker – June 2023, Courtesy of L. Rosta.
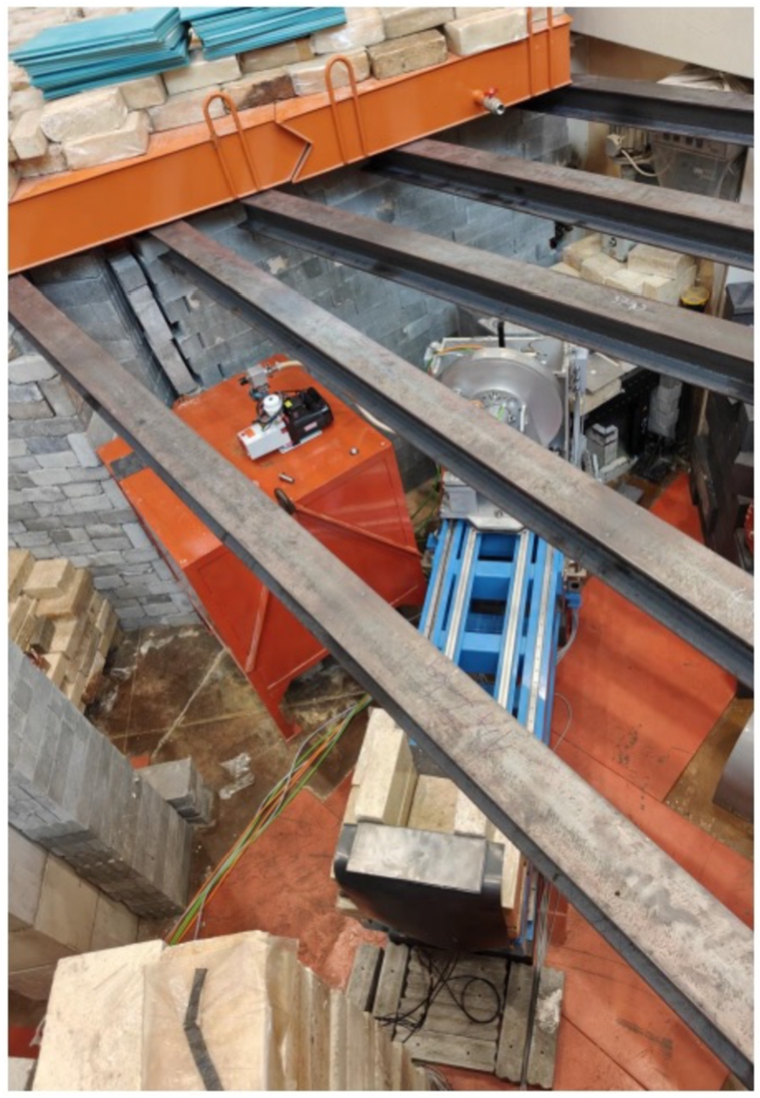
Fig. 238.
(A) 2D image on the He-3 detector from the moderator at 10 MW (b) background at closed beam.
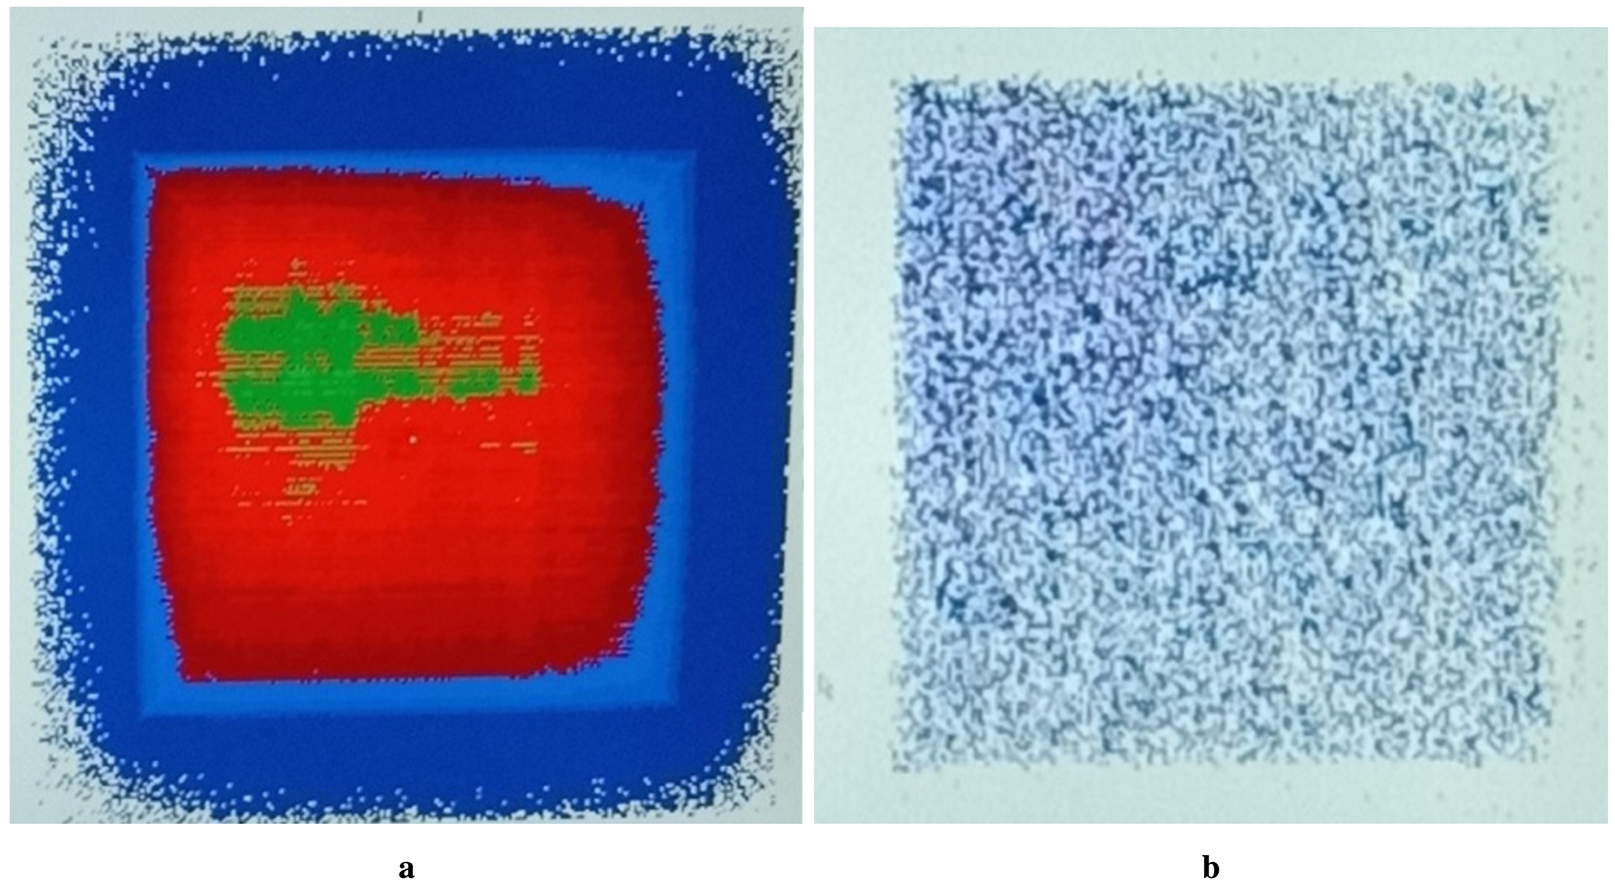
In preparation for experiments to be performed using the channel #4 beam line at the BNC reactor, the radiation protection environment was successfully tested on June 5th 2023 through neutron and gamma dose rates measurements performed at 1 MW reactor power at the channel outlet, near the reflector and outside the bunker area of the channel. The low level of the background allowed for a channel opening at 10 MW. The outside bunker measurements were found to be within the local regulation limits and gave information on how the shielding should be reinforced. In order to benefit from feedback for the future HighNESS measurements, WP4 and WP6 did participate in the setup of the experimental campaign dedicated to the test of a low dimensional moderator performed by the Mirrotron company from June 12th to June 23rd 2023. On June 23rd 2023, the CMTF installation was completed: channel-collimator, reflector, Be, outlet collimator, pin-hole system were fully installed and all components (pin-hole slit system, choppers and the detector) were working as shown in Fig. 237. The roof on top of the experimental room was also completed. A 2D image from the moderator via the pin-hole system was recorded (see Fig. 238). No TOF analysis was performed due to time limitation as the reactor had to stop but a fundamental milestone was reached at this point, showing a proof that the beamline can be operated safely with all the components installed, according to the design documents and the safety analysis report. First neutron measurements were performed at 10 MW reactor power with the completed assembly of the test facility. The HighNess measurement campaign took place from September 18th to September 29th. The roof on top of the experiment room was completed and closed on and the beam was opened on September 21st, allowing for first measurements. In particular, the dose rate measurements confirmed the results given by the activation calculations previously performed at the Oak Ridge National Laboratory. Considering the shutter closed, the dose rate recorded was 80 μSv/h at the moderator position and 400 μSv/h at the reflector surface, at shutdown after 1 hour of irradiation, decreasing to the level of 10 μSv/h, which is below the safety limit, after few hours of cooling time. The measurement performed during the first week of the campaign clearly confirmed the need of reducing the background. As illustrated in Fig. 239, paraffin blocks were added to surround the collimator and the lead shielding encapsulating the experimental set-up. A tunnel made of Mirrobor™ plates (natural rubber and boron powder based flexible plates) was installed on the detector table, also combined with paraffin blocks.
Fig. 239.
(A) paraffin blocks shielding (b) shielding on the detector table.
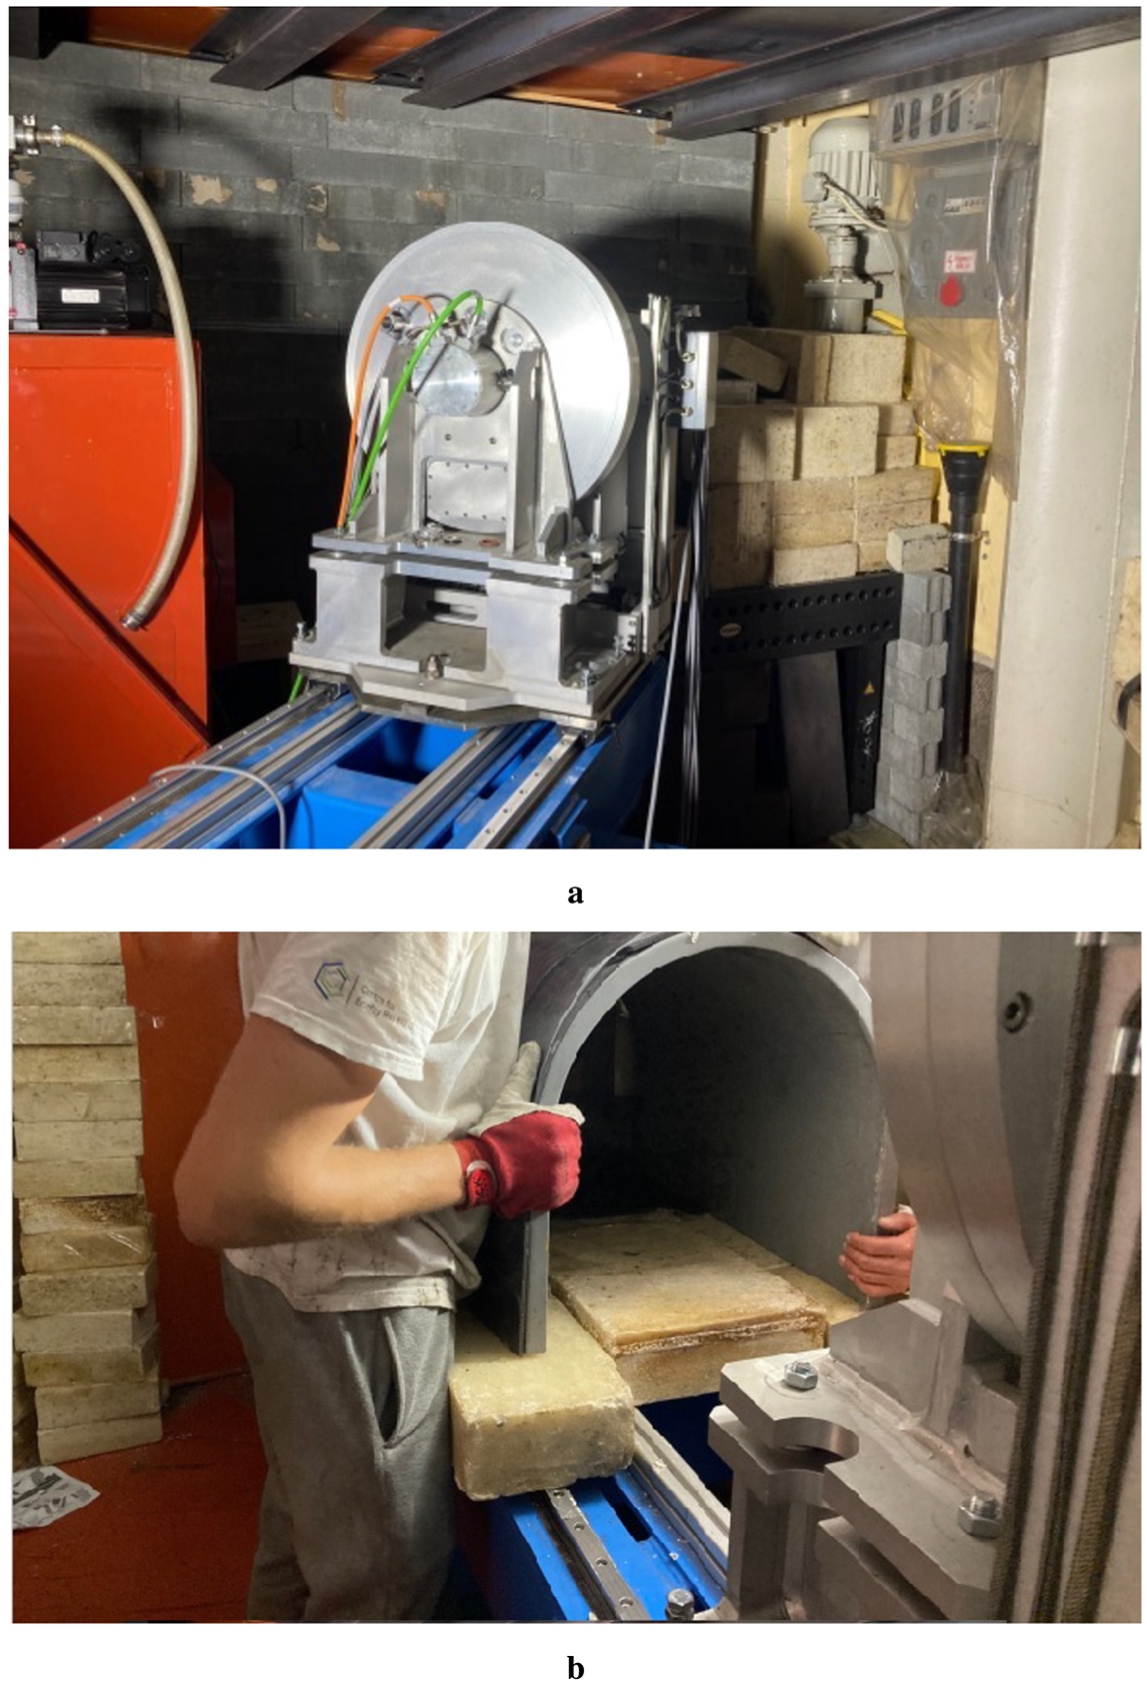
Placing a layer of Mirrobor™ between the chopper and the detector led to a count rate decrease of 10%, highlighting the fact that the background was mainly due to fast neutrons.
The reactor was stopped at 14:00 on September 22nd 2023. A last spectrum was recorded just before this shutdown. The efforts done to reinforce the shielding lead to a significant background reduction. Reinforcing the shielding around the detector and especially from its backside led to a reasonable background-to-noise ratio. In summary, the first week of the campaign was dedicated to the shielding improvement in order to reduce the background. The cryogenic system was put in place during the second week. Cooling of hydrogen started on September 28th. Figure 240 illustrates the status of the facility at this time. Even if no additional measurements were possible in the time frame of the HighNESS project, the successful building of the beamline and manufacturing of the different components of the experimental setup and the first images of the moderator obtained are giving the proof that such measurements can be performed. This already an important milestone reached, and is promising for future campaigns.
Fig. 240.
Status of BNC experiment on September 27th 2023 (a) view of the roof with compressor installed (b) interior of the experimental room.
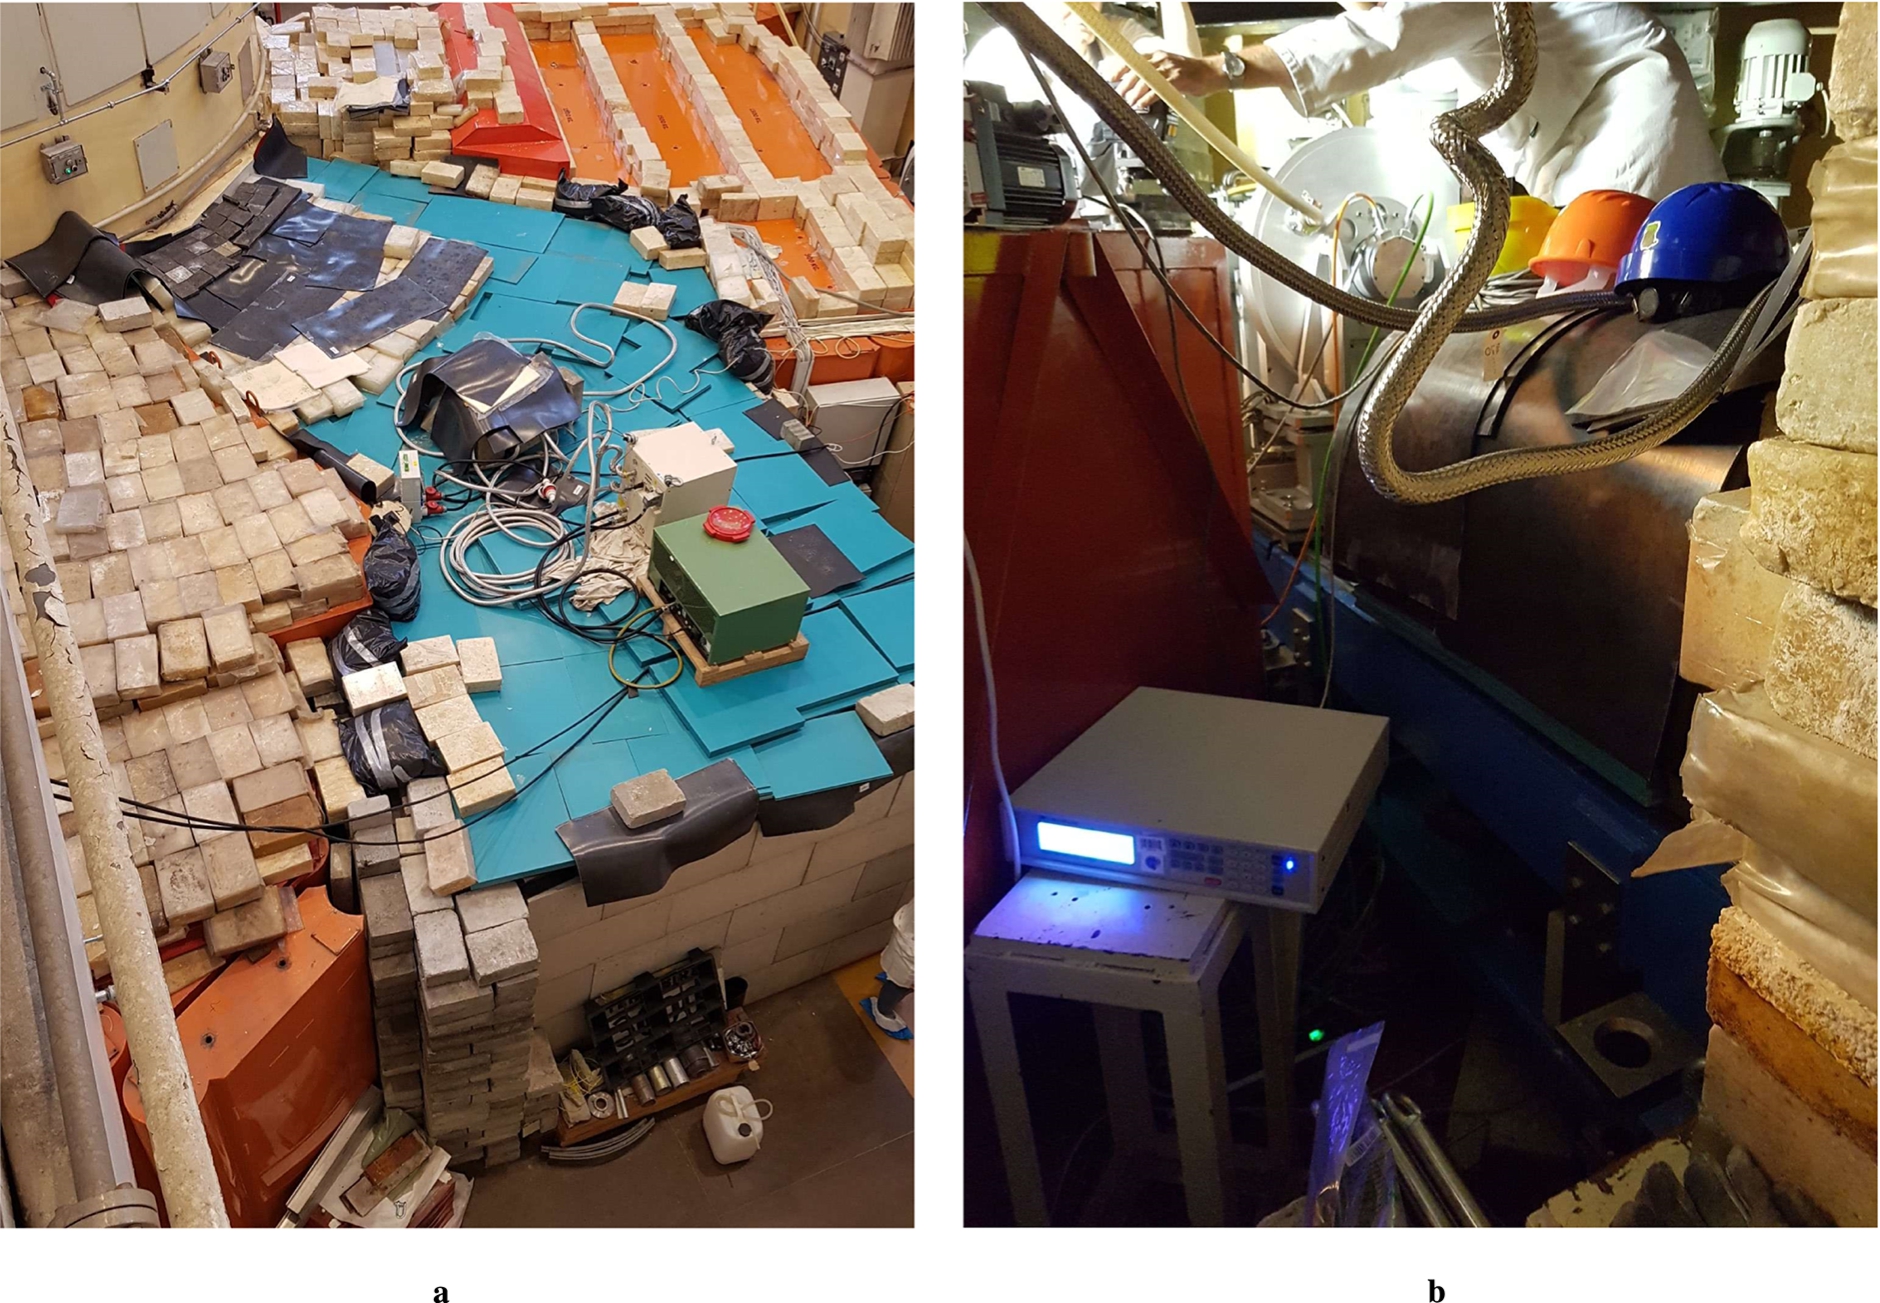
10.3.Experiment at the JULIC neutron platform
The construction of a test Target–Moderator–Reflector (TMR) unit is part of the High Brilliance Neutron Source (HBS) project [220], which aims to develop a High Current Accelerator-driven Neutron Source (HiCANS) which is competitive and cost-efficient. The test TMR station was developed over two years through a collaboration between JCNS and Central Institute of Engineering, Electronics and Analytics (ZEA-1) at FZJ and built in the ‘Big Karl’ area of the IKP. The neutrons are produced by 45 MeV protons accelerated by the JUelich Light Ion Cyclotron (JULIC), delivered via a dedicated proton transfer beamline, and impinging on a newly developed high-power tantalum target with an internal microfluidic water-cooling loop. A schematic representation is shown in Fig. 241. The subsequent fast neutrons emitted are moderated to thermal and cold range by, respectively, a high-density polyethylene (HDPE) premoderator and two cold sources, a low-dimensional hydrogen source and a methane moderator, both at cryogenic temperature. The TMR is surrounded by a 68-ton heavy concrete biological shielding with a unique modular design that can accommodate up to eight individual experiments. The first neutrons were produced on the target on December 12th 2022. Due to the low current of the proton beam (5 µA peak current), the neutron yield produced is relatively low (≈1010 s−1), so the facility is optimal for proof-of-principle experiments like the ones in the HighNESS project. The HighNESS experiment took place at the HiCANS test station from August 30th 2023 to September 3rd 2023.
Fig. 241.
Schematic of the HiCANS test station at the Big Karl area of the IKP.
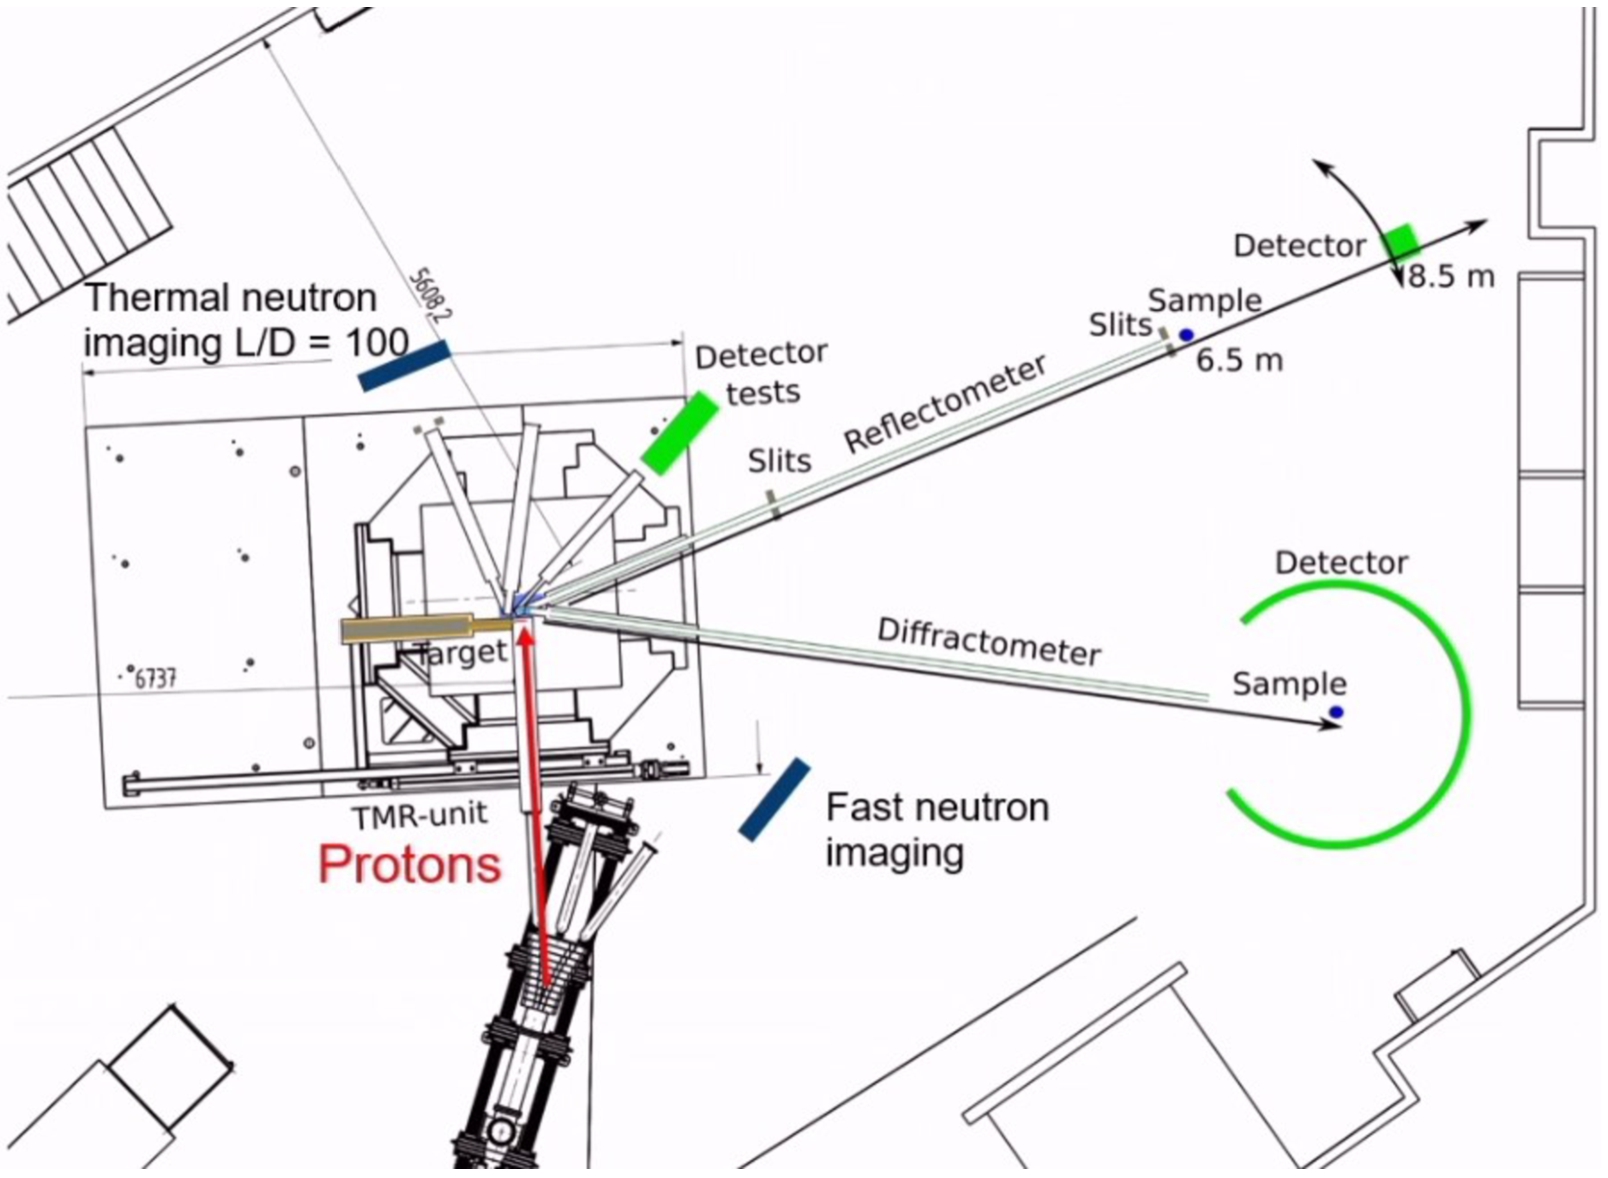
10.3.1.Experimental setup
The protons hitting the target are extracted from the plasma of the ion source for the JULIC Cyclotron, the pre-accelerator of the COoler SYnchrotron (COSY), where they are accelerated from 4 keV to 45 MeV. During the period of the beamtime, the accelerator was operating in two modes:
- 25 Hz frequency and 0.8 ms pulse length
- 10 Hz frequency and 1 or 3 ms pulse length
Fig. 242.
Target–Moderator–Reflector (TMR) area seen from above. Protons are coming from top. Cold neutrons moderated in the solid methane are extracted from beamline number 2.
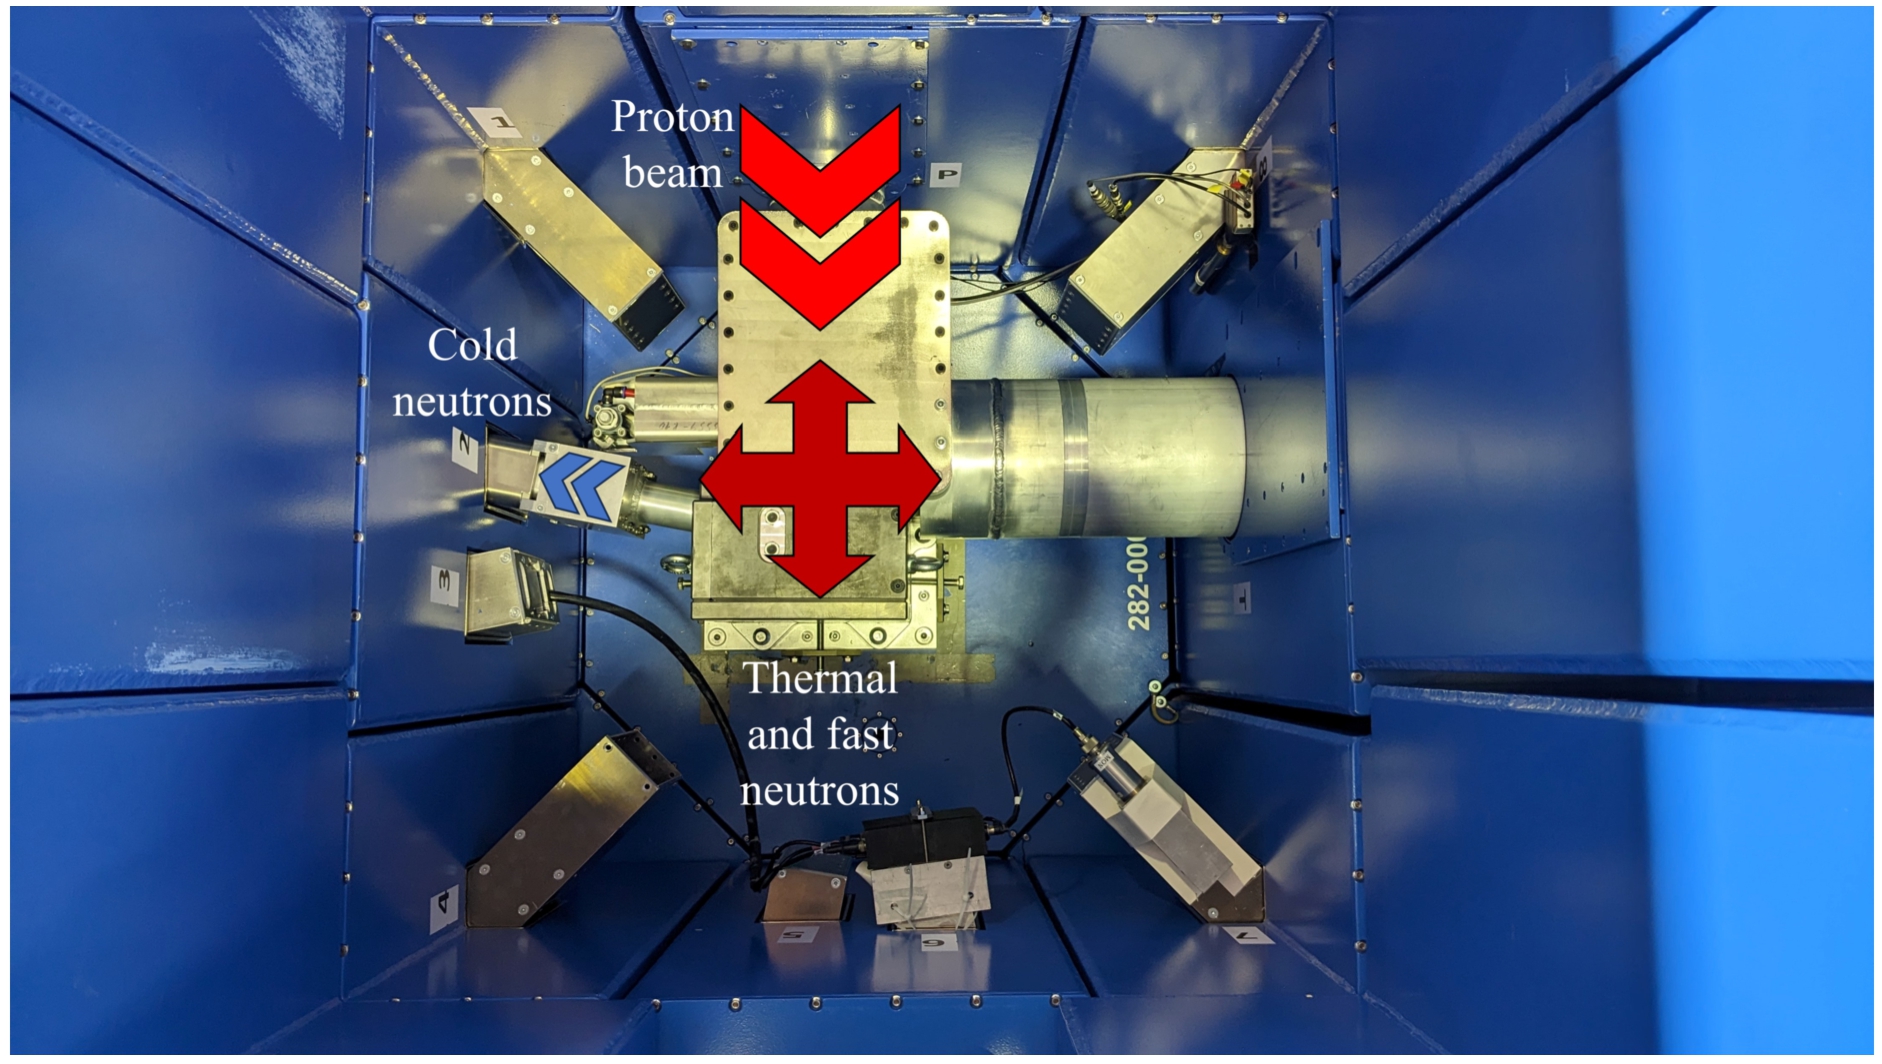
Fig. 243.
Pictures of the (a) TMR with lead shielding around the HDPE premoderator and the extraction system for beamline 2 (b) closer look at the two moderator outer vessels without the HDPE block. Above, the hydrogen moderator and below, the methane one with the HighNESS reflector cup surrounding it. (C) neutron optical guide (d) 3He tube detectors at the sample area. The central tube in front of the guide exit is the detector used to record the signal.
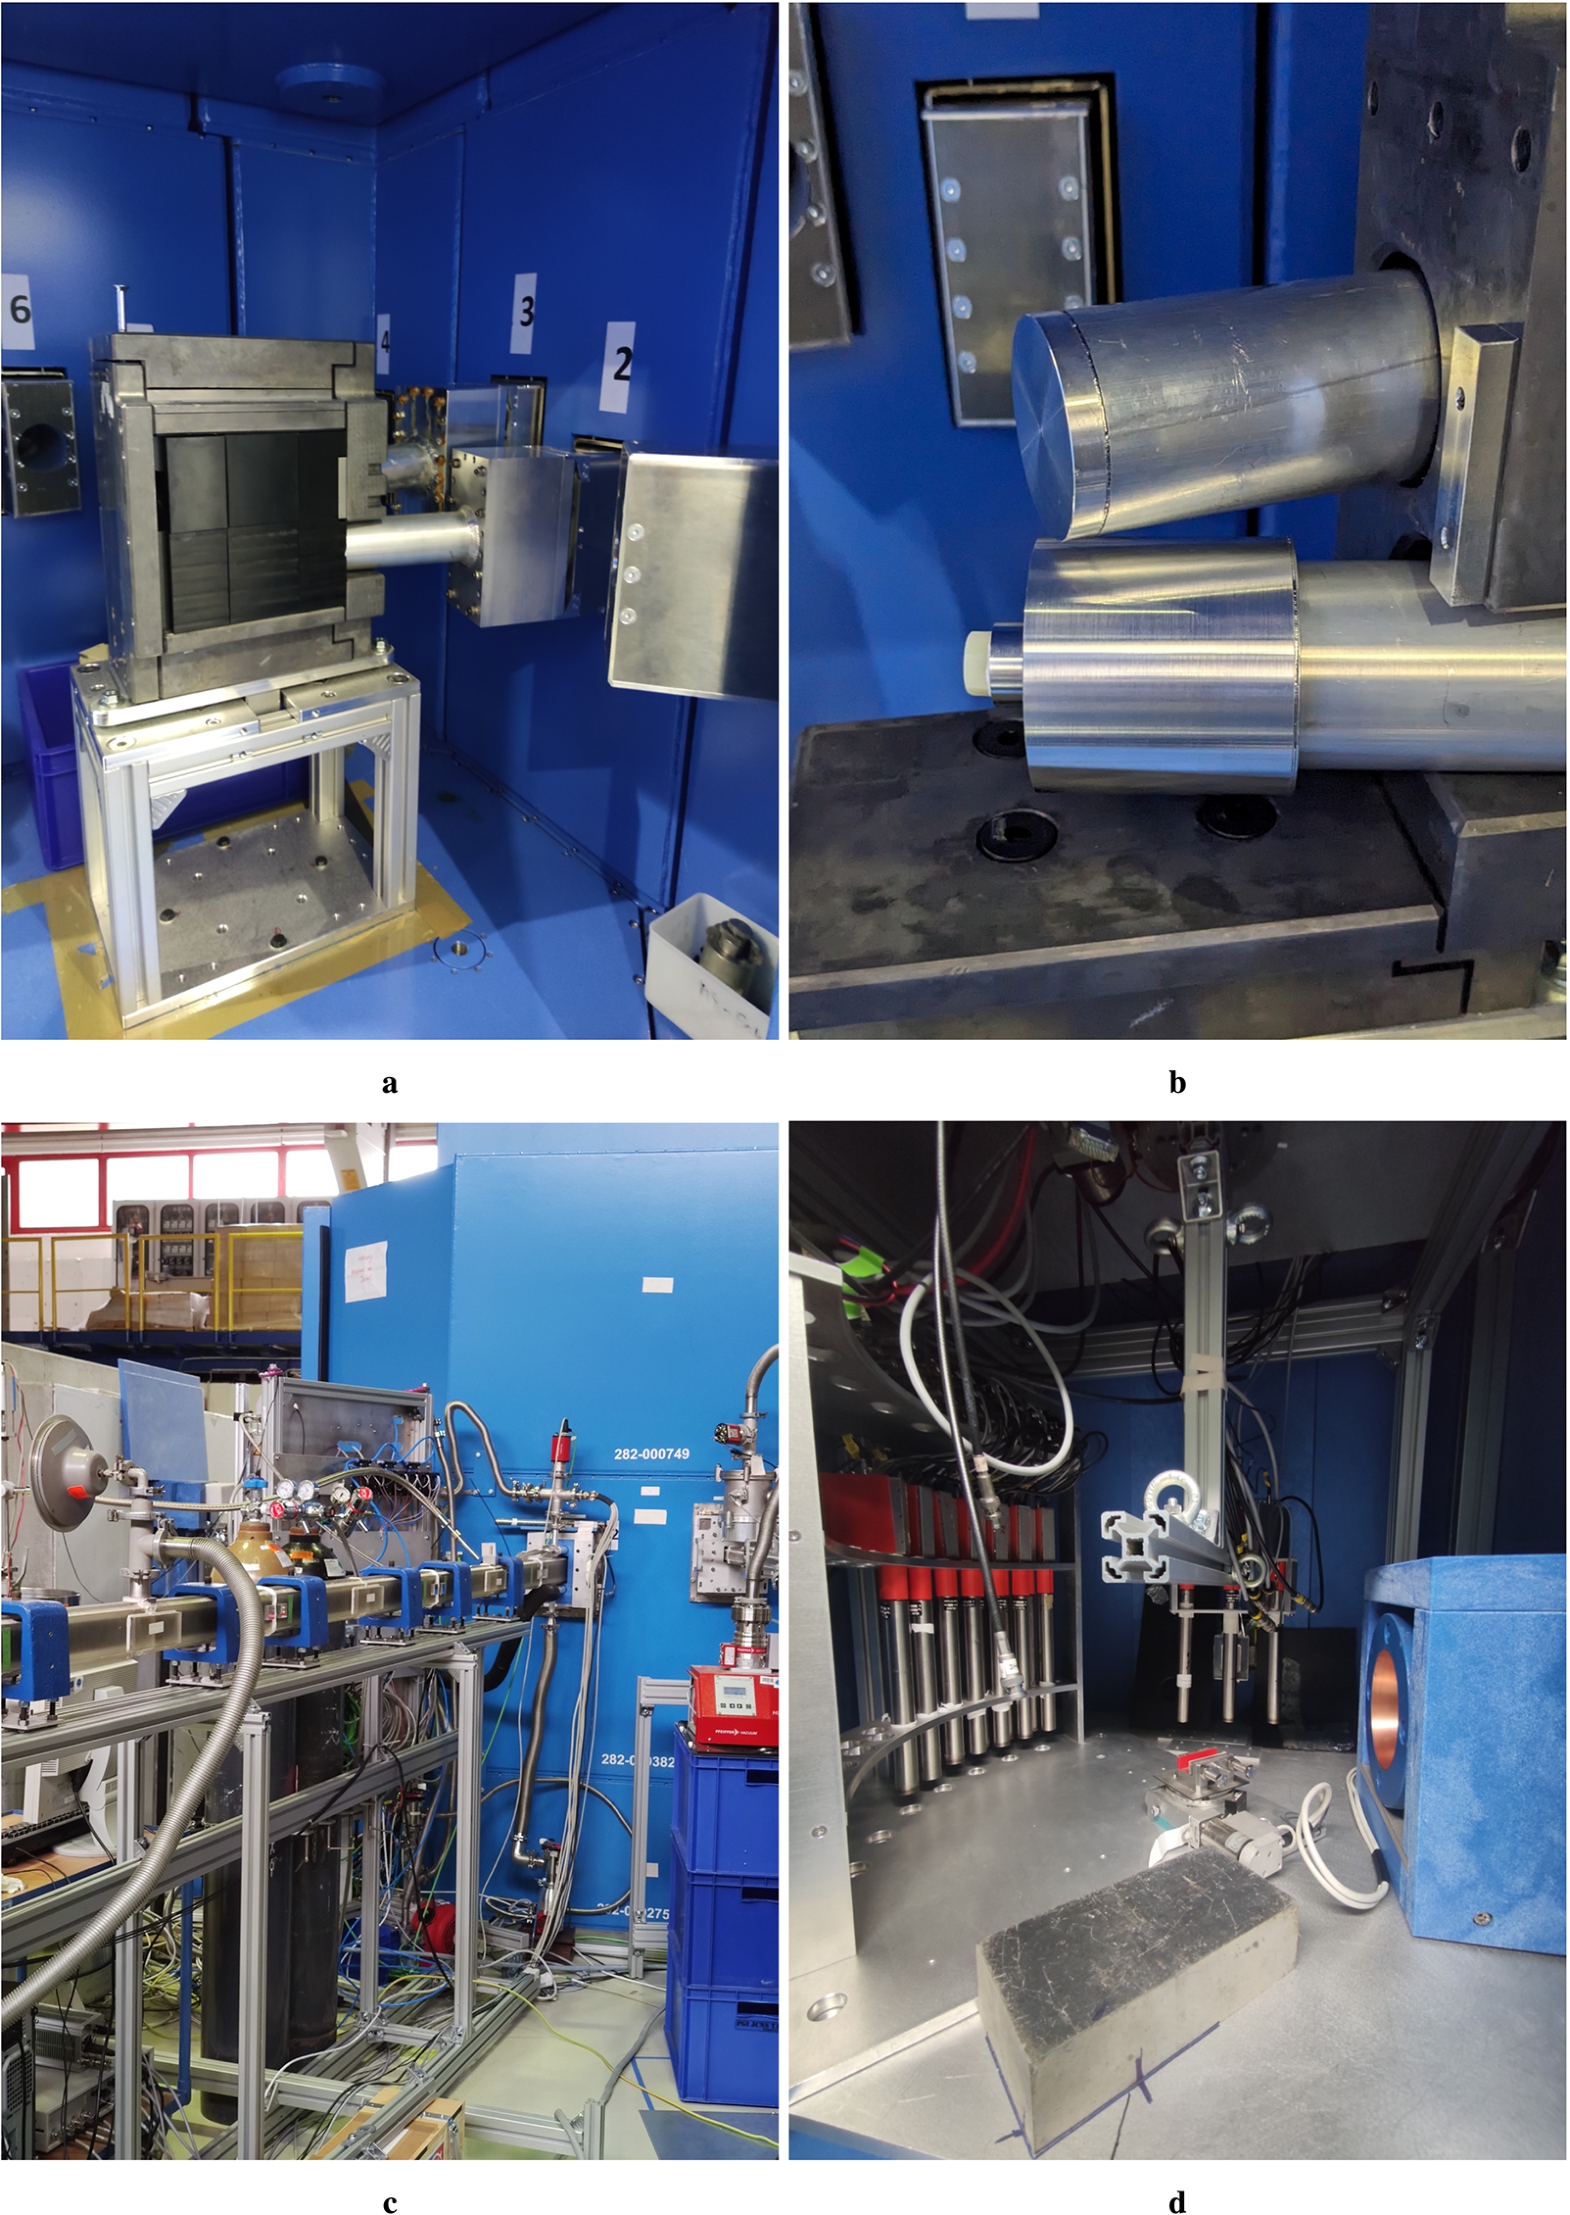
The TMR station presented in Figs 242 and 243a is equipped with two cold sources: a liquid para-hydrogen moderator and a solid methane one (Fig. 243b). The two moderators are embedded in a HDPE block which acts as a premoderator. A lead case around the HDPE reflects the thermal neutrons and shields the sources from the gamma radiations. The effect of the advanced reflectors was tested at the diffractometer of the facility (beamline number 2, see Fig. 241), which looks into the solid methane cold source. The moderator vessel is an aluminum cylinder of 36 mm in diameter and 53 mm in length, with an inner cavity of 22 mm in diameter and 33 mm in length corresponding to the moderating volume. The source is kept at the cryogenics temperatures by liquid helium flowing in channels carved around the outer layer of the vessel. The poor thermal conductivity of solid methane is improved by inserting an aluminum foam which increases the thermal coupling with the vessel for a better heat removal. For the duration of the experiment, the source target temperature was set to 22 K. The choice of the temperature was motivated by the need to keep the moderator conditions as stable as possible. Cooling the moderator at a lower temperature would have implied a higher cold flux, but also a much larger consumption of He to maintain that condition stable. This in turn would have lead to several He tank exchanges with a procedure requiring to warm up and re-solidify the methane, with no guarantee to go back to the same experimental conditions. During the measurements, the temperature stability was checked and noted in the logbook at the beginning and at the end of the run, with a resolution of 1 K. Unfortunately, due to a software crash of the monitoring system, only the logs from the first day were available for the data analysis.
The cold neutrons moderated inside the methane are transported out of the shielding to the sample area by a neutron guide with a 30 × 44 mm section and coated by 58Ni (m = 1.18). The distance from the moderator surface to the guide exit is 6.83 m. A 3He tube placed in front of the window at the exit of the guide measures the intensity of the neutrons as a function of the time of flight. On both sides of the detector, two identical tubes measure the background in its proximity. Since the guide section is bigger than the dimensions of the moderator, also fast neutrons from the TMR are reaching the sample area. Here they can get thermalized or scattered by the borated polyethylene shielding, with a second chance to reach the detector as background. Thus, the tubes on the sides should give a good estimates of this small effect.
A set of useful monitors, synchronized with the same time-of-flight trigger as the detector for the signal, were scattered around the hall at the following locations: inside the TMR station (visible in the bottom right corner in Fig. 242), outside the biological shielding, and inside and outside the sample station shielding. In addition, the array of tubes of the banana detector of the diffractometer (visible in Fig. 243d) was used. The time resolution was 0.2 ms for a full-scale range of 50 ms.
10.3.2.Materials and methods
The experiment consisted in the insertion of several aluminum cups around the methane moderator, as shown in Fig. 243b, two of them had a cavity filled with, respectively, ND and MgH2, one had an empty cavity for comparison, acting as reference, and the last one was entirely made of polyethylene, the same material as the premoderator. The cups, manufactured by the WP5 engineering team in FZJ, are aluminum hollow cylinders with an outer diameter of 74.5 mm and inner diameter of 56.5 mm. In the circular crown, a 5 mm gap hosts the reflector material in powder form, while the walls are 2 mm thick. The powders were poured in the gap from a hole in the back of the cup, and sealed with a screw and a plastic ring.
Fig. 244.
Diagram of the aluminum cap showing the calculated internal volume.
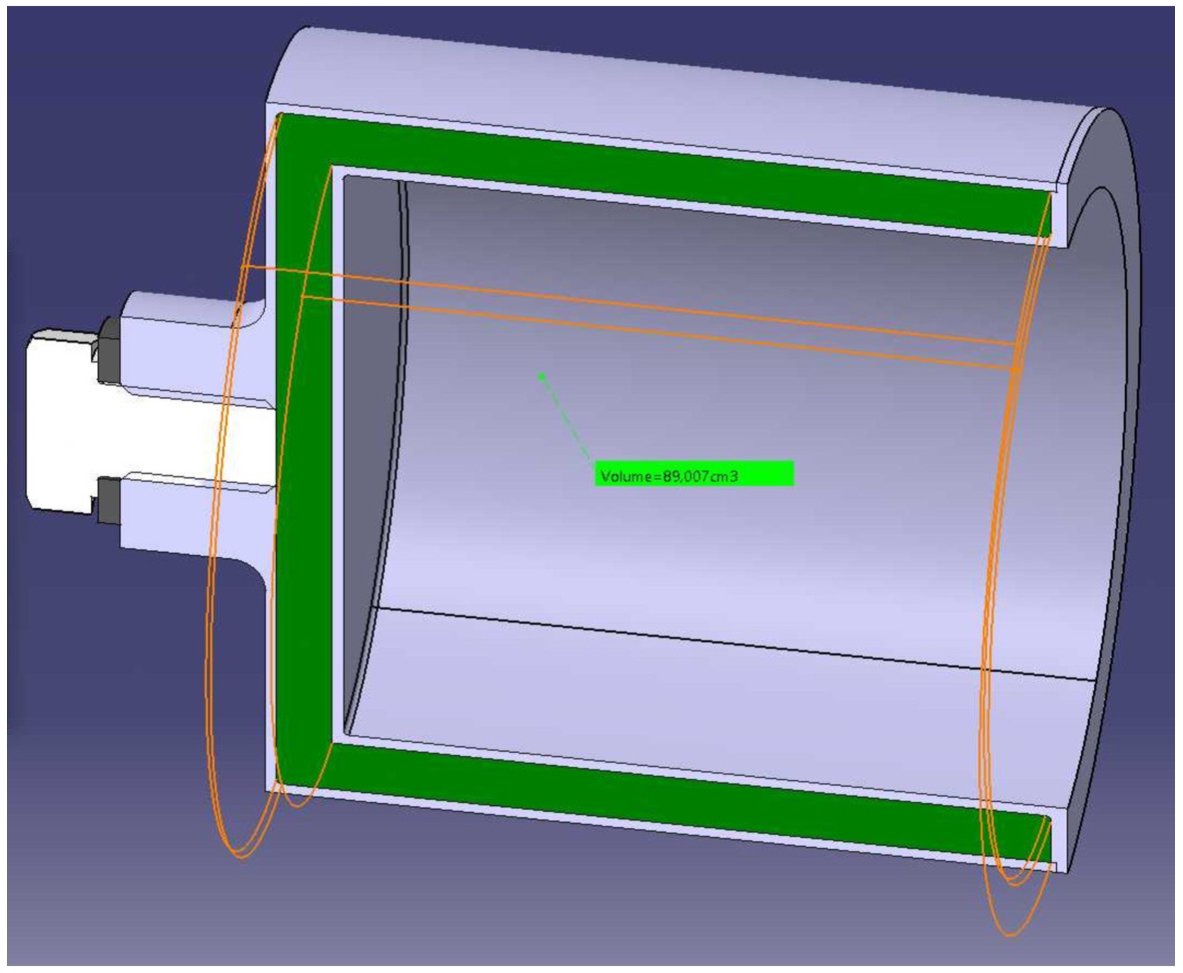
The nanodiamond powder used is commercial Detonation NanoDiamonds (DND) for nuclear applications [163]. The average particle size is 5 nm and the purity declared by the manufacturer for the ash residues is <0.1 wt%. The size distribution of the same product was characterized in [195], while an independent elemental analysis with inductively coupled plasma mass spectrometry (ICP-MS) technique performed in FZJ showed a total metallic impurity content of 185 mg/kg, made up by traces of Ca (60 mg/kg), Mn (49 mg/kg), Na (27 mg/kg), Fe (23 mg/kg) and other elements in lower concentrations. After filling the cup, the mass of powder in the jacket was 21.8 g. This means that, with a jacket volume of 89 cm3 taken from the CAD (Fig. 244), the achieved fill density was 0.245 g/cm3.
Similarly, the MgH2 was used in the form of a powder to fill the cavity of a second cup. The average size of the particles was 15 µm, for a nominal density of 1.45 g/cm3. Also in this case, the manufacturer declared a purity of 99.9% [6]. The powder density measured after filling the cup was 0.66 g/cm3.
During the five days of the beamtime, the schedule of the experiment was meant to limit the change of the accelerator parameters as much as possible, while giving the same share of time to all the users of the facility. The schedule for the first four days is summarized in Fig. 245, while for the last day the accelerator parameters were fixed to a 10 Hz and 3 ms with two cup exchanges. The procedure for the cup exchange consisted in shutting down the accelerator, letting the target decay for at least two hours, perform a radiation survey of the area, entering into the modular biological shielding, removing the back lead panel of the reflector, extracting the old cup from behind and inserting the new one (Fig. 246). Manipulation of activated components was performed by radiologically qualified personnel from FZJ and under supervision of radiation protection officers.
Fig. 245.
Table 48. (Left) schematic of the experiment schedule for the first four days. (Right) reflector cup used for each day of experiment.
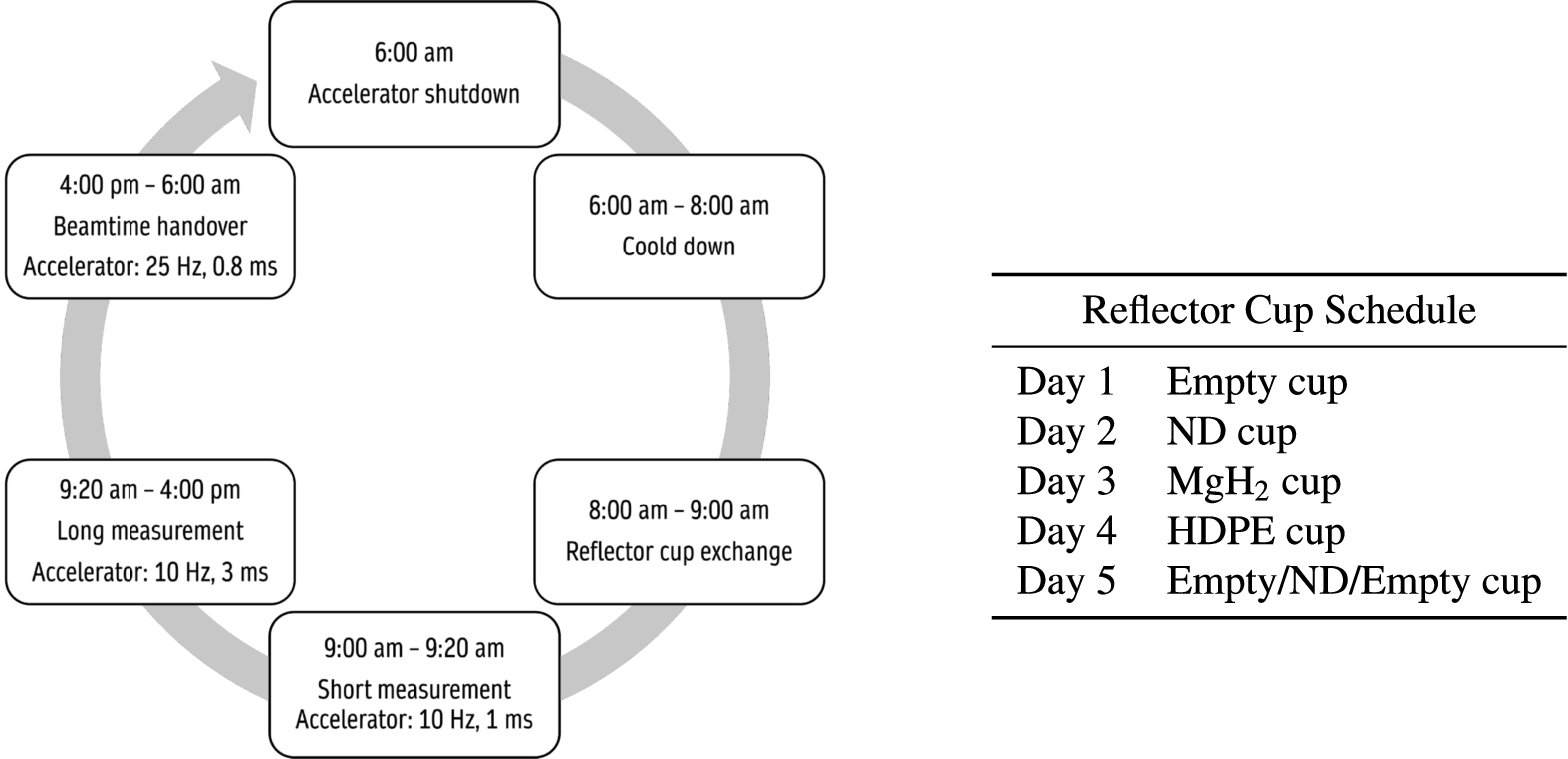
Fig. 246.
(A) opened modular biological shielding with target (b) example of the view of the TMR when the back lead panel of the reflector is removed for the cup exchange.
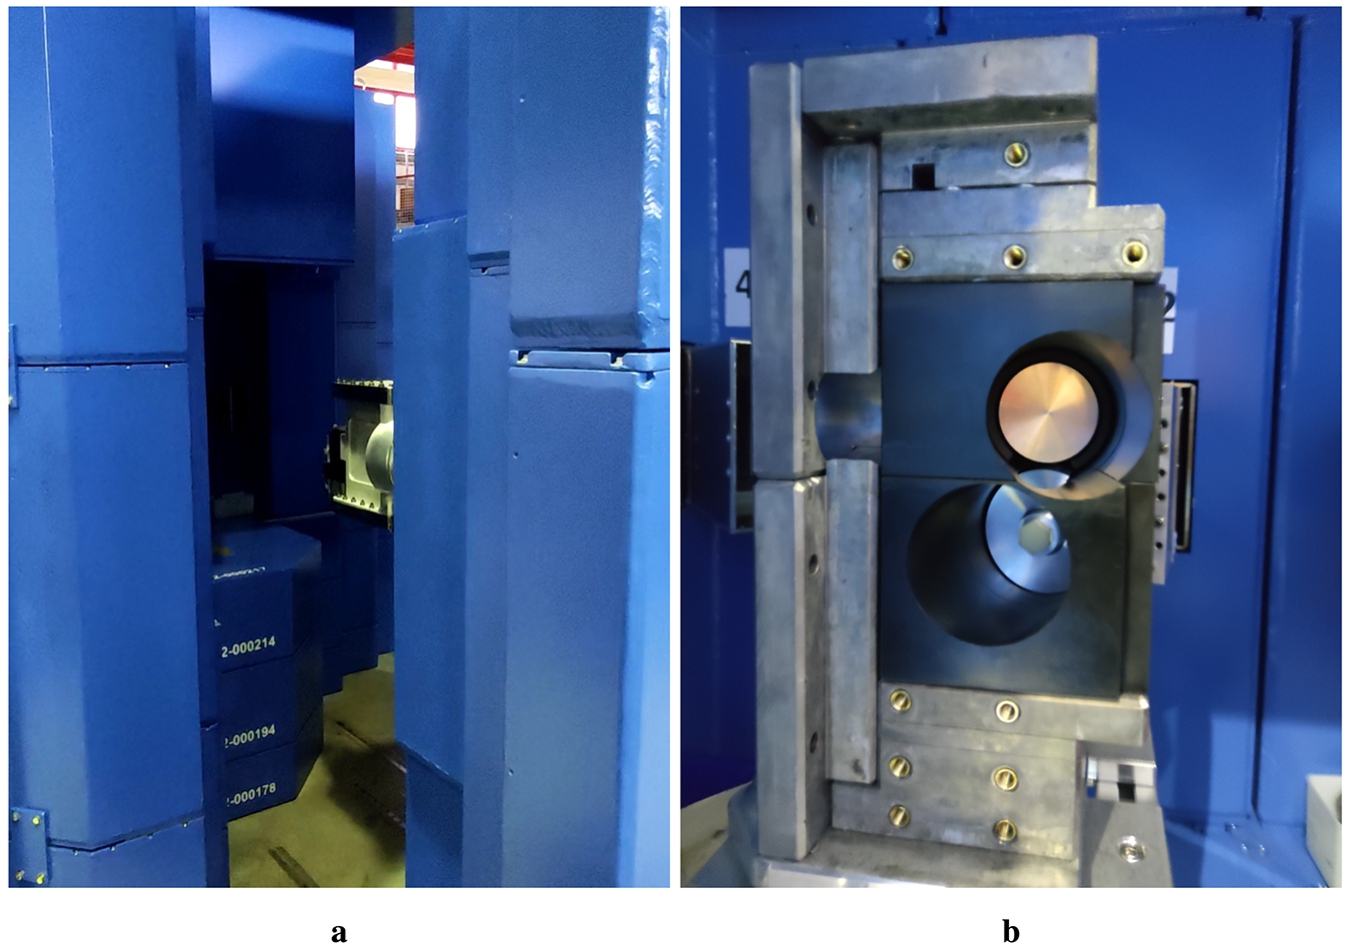
10.3.3.Data analysis
The measurement of the time-of-flight spectrum was subdivided into multiple acquisitions of 20–30 min each. In this way the stability of the source during the data acquisition could be studied. After subtracting the background contribution, which is almost negligible for cold neutrons with this setup, the spectra are normalized with the respective integrated monitor counts. Some of the runs were affected by statistically meaningful deviations from the average measurement, which are related to malfunctioning parts of the setup (more details will be given on this topic in the discussion part). Once identified the cause of the systematic deviation, those runs were discarded from the analysis. The resulting averaged and corrected spectrum was calculated as:
Fig. 247.
Plot showing the correlation between the integrated counts of the monitor outside the TMR shielding and all the other monitors. The counts are normalized by both the acquisition time and the counts for the first run (T0).
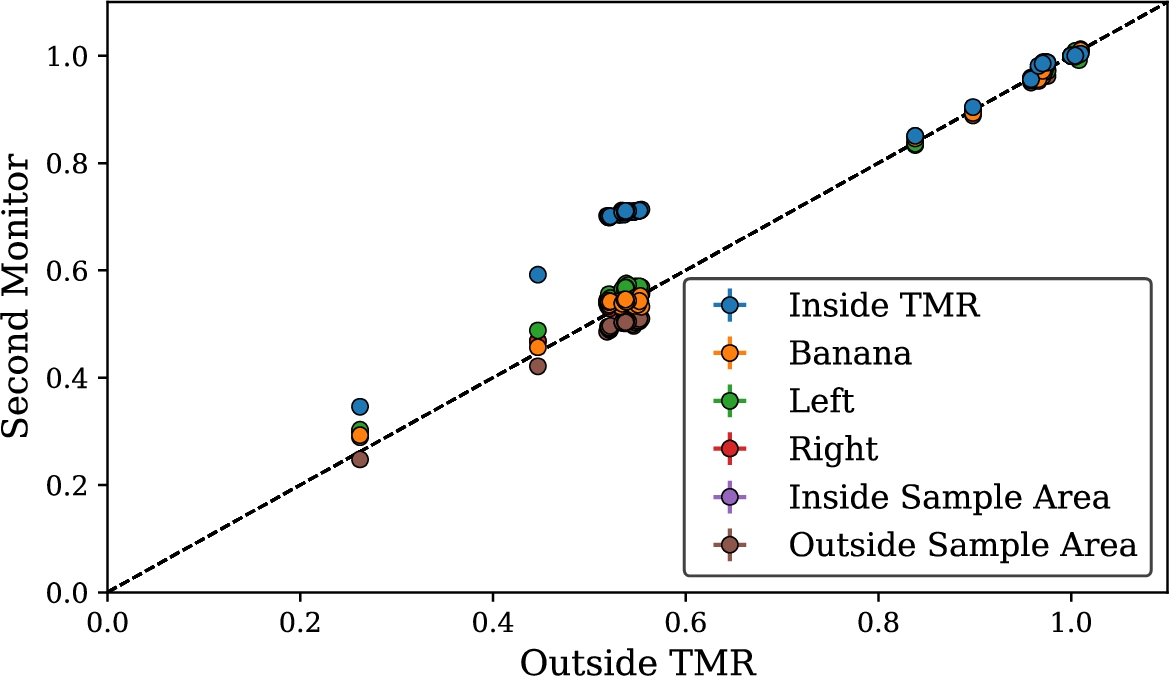
Fig. 248.
Plot showing the correlation between the accelerator monitor counts and all the other monitors. The counts are normalized by both the running time and the counts for the first run at T0. The time window for the exchange of the accelerator cup is shown. The lower peaks in-between the HighNESS experiment correspond to the shorter pulse length regime.
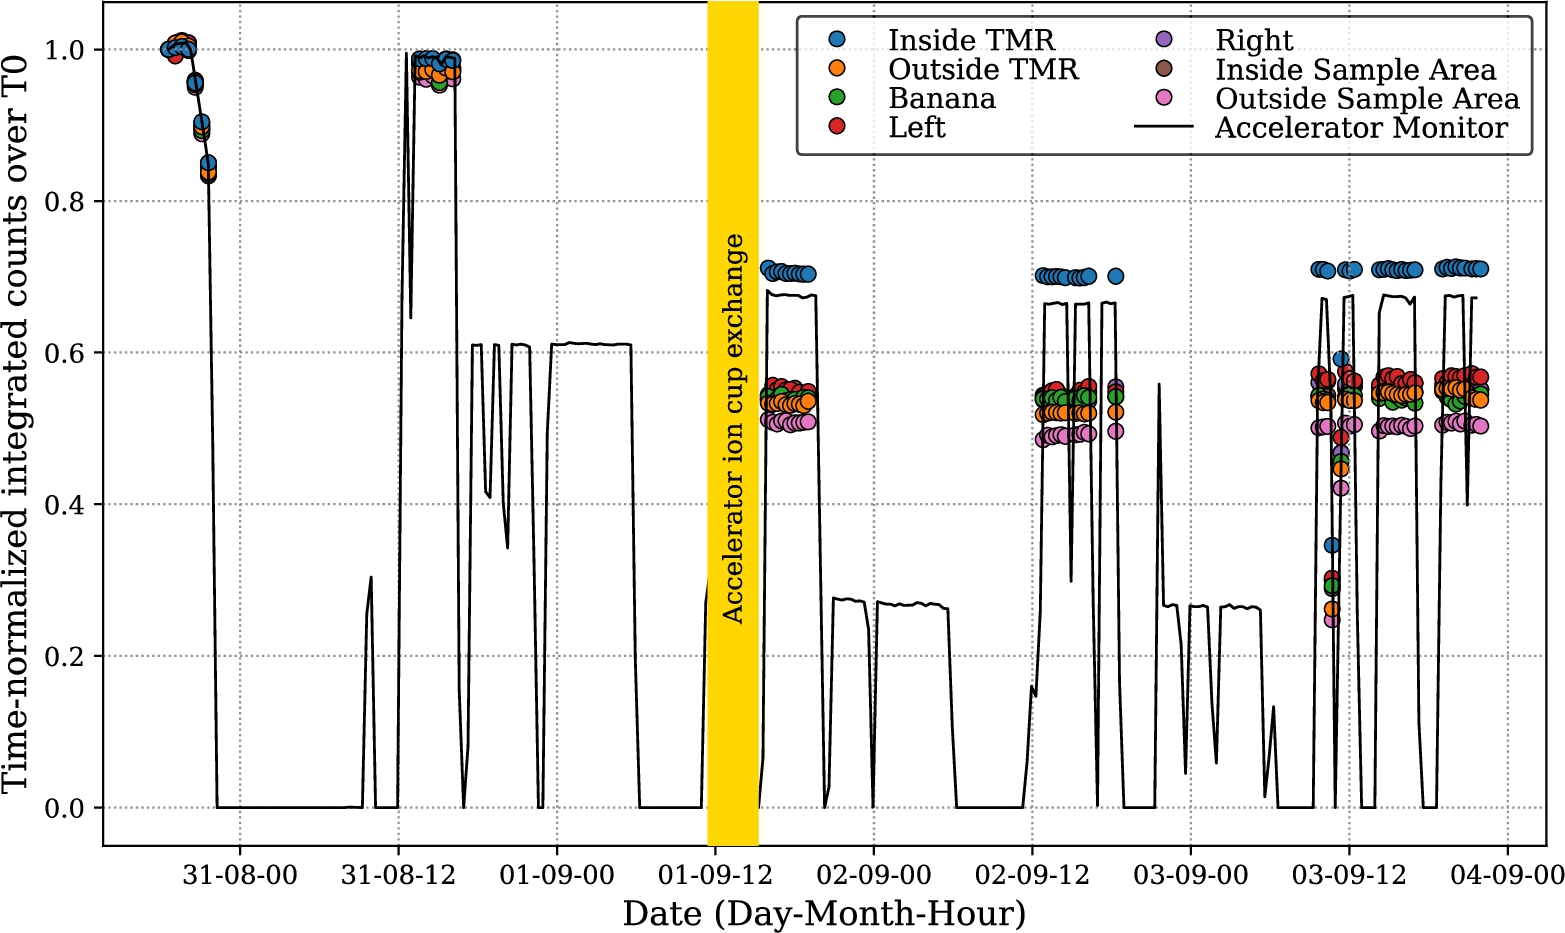
Fig. 249.
(A) monitor counts inside the TMR area as a function of time, divided by the total counts and averaged over the stable runs for measurements from day 1-4. (B) ratio of the same curves over the empty cup. The shaded area indicates the standard deviation.
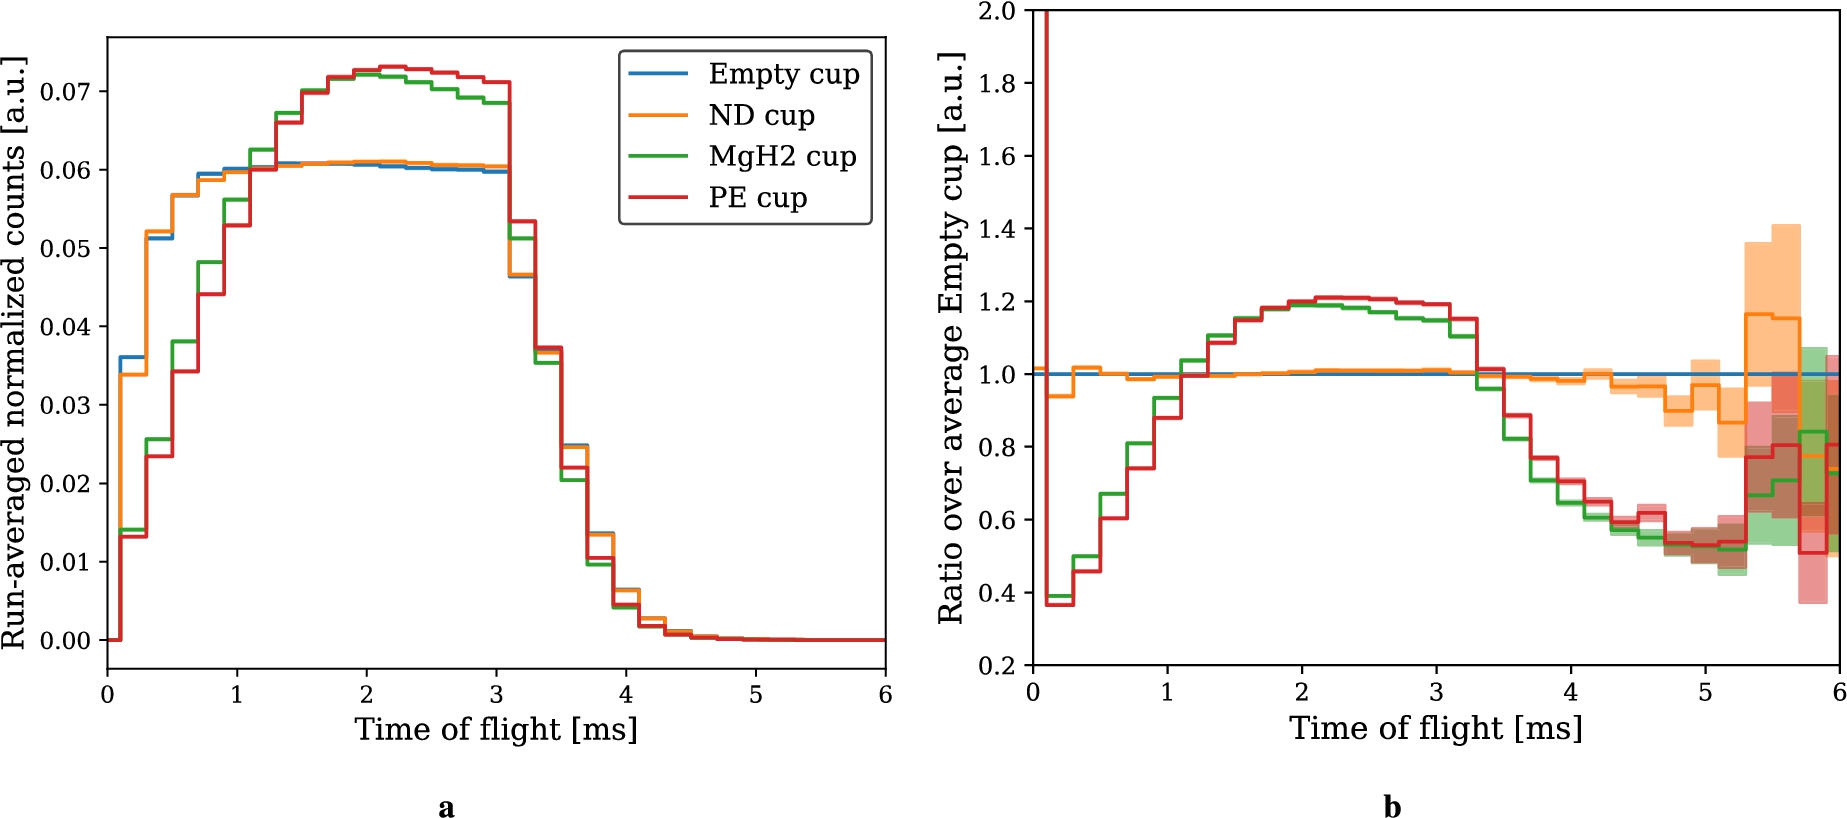
The integrated counts are not the only measure of the system stability. After the exchange of the accelerator ion cup, a different pulse shape was observed. In Fig. 249a the counts of the monitor inside the TMR area, divided by the total counts and averaged over the stable runs, are shown as a function of the time, while in Fig. 249b the ratio of the same curves over the empty cup was calculated. As an example, the monitor inside the TMR area is shown because the pulse shape is easily recognizable, although the same behavior is observed in all the monitors. Also, for the sake of clarity, only the runs from the first four days are shown. The ion cup was exchanged between the ND and MgH2 cup measurements. The question that arises is if this could produce a systematic impact on both the spectra and, most importantly, the ratio with the empty cup. Since a similar effect was also observed the first day during the measurements with the empty cup (Fig. 250), we can study that case to isolate as much variables as possible and try to answer the initial question.
Fig. 250.
Normalized counts for each run and ratio over average for the empty cup measurement for: (a) and (b) monitor inside the TMR area, (c) and (d) main detector. The signal from the main detector is re-binned by a factor 4 (0.46 Å). All the runs not included in the stable average are marked by an x.
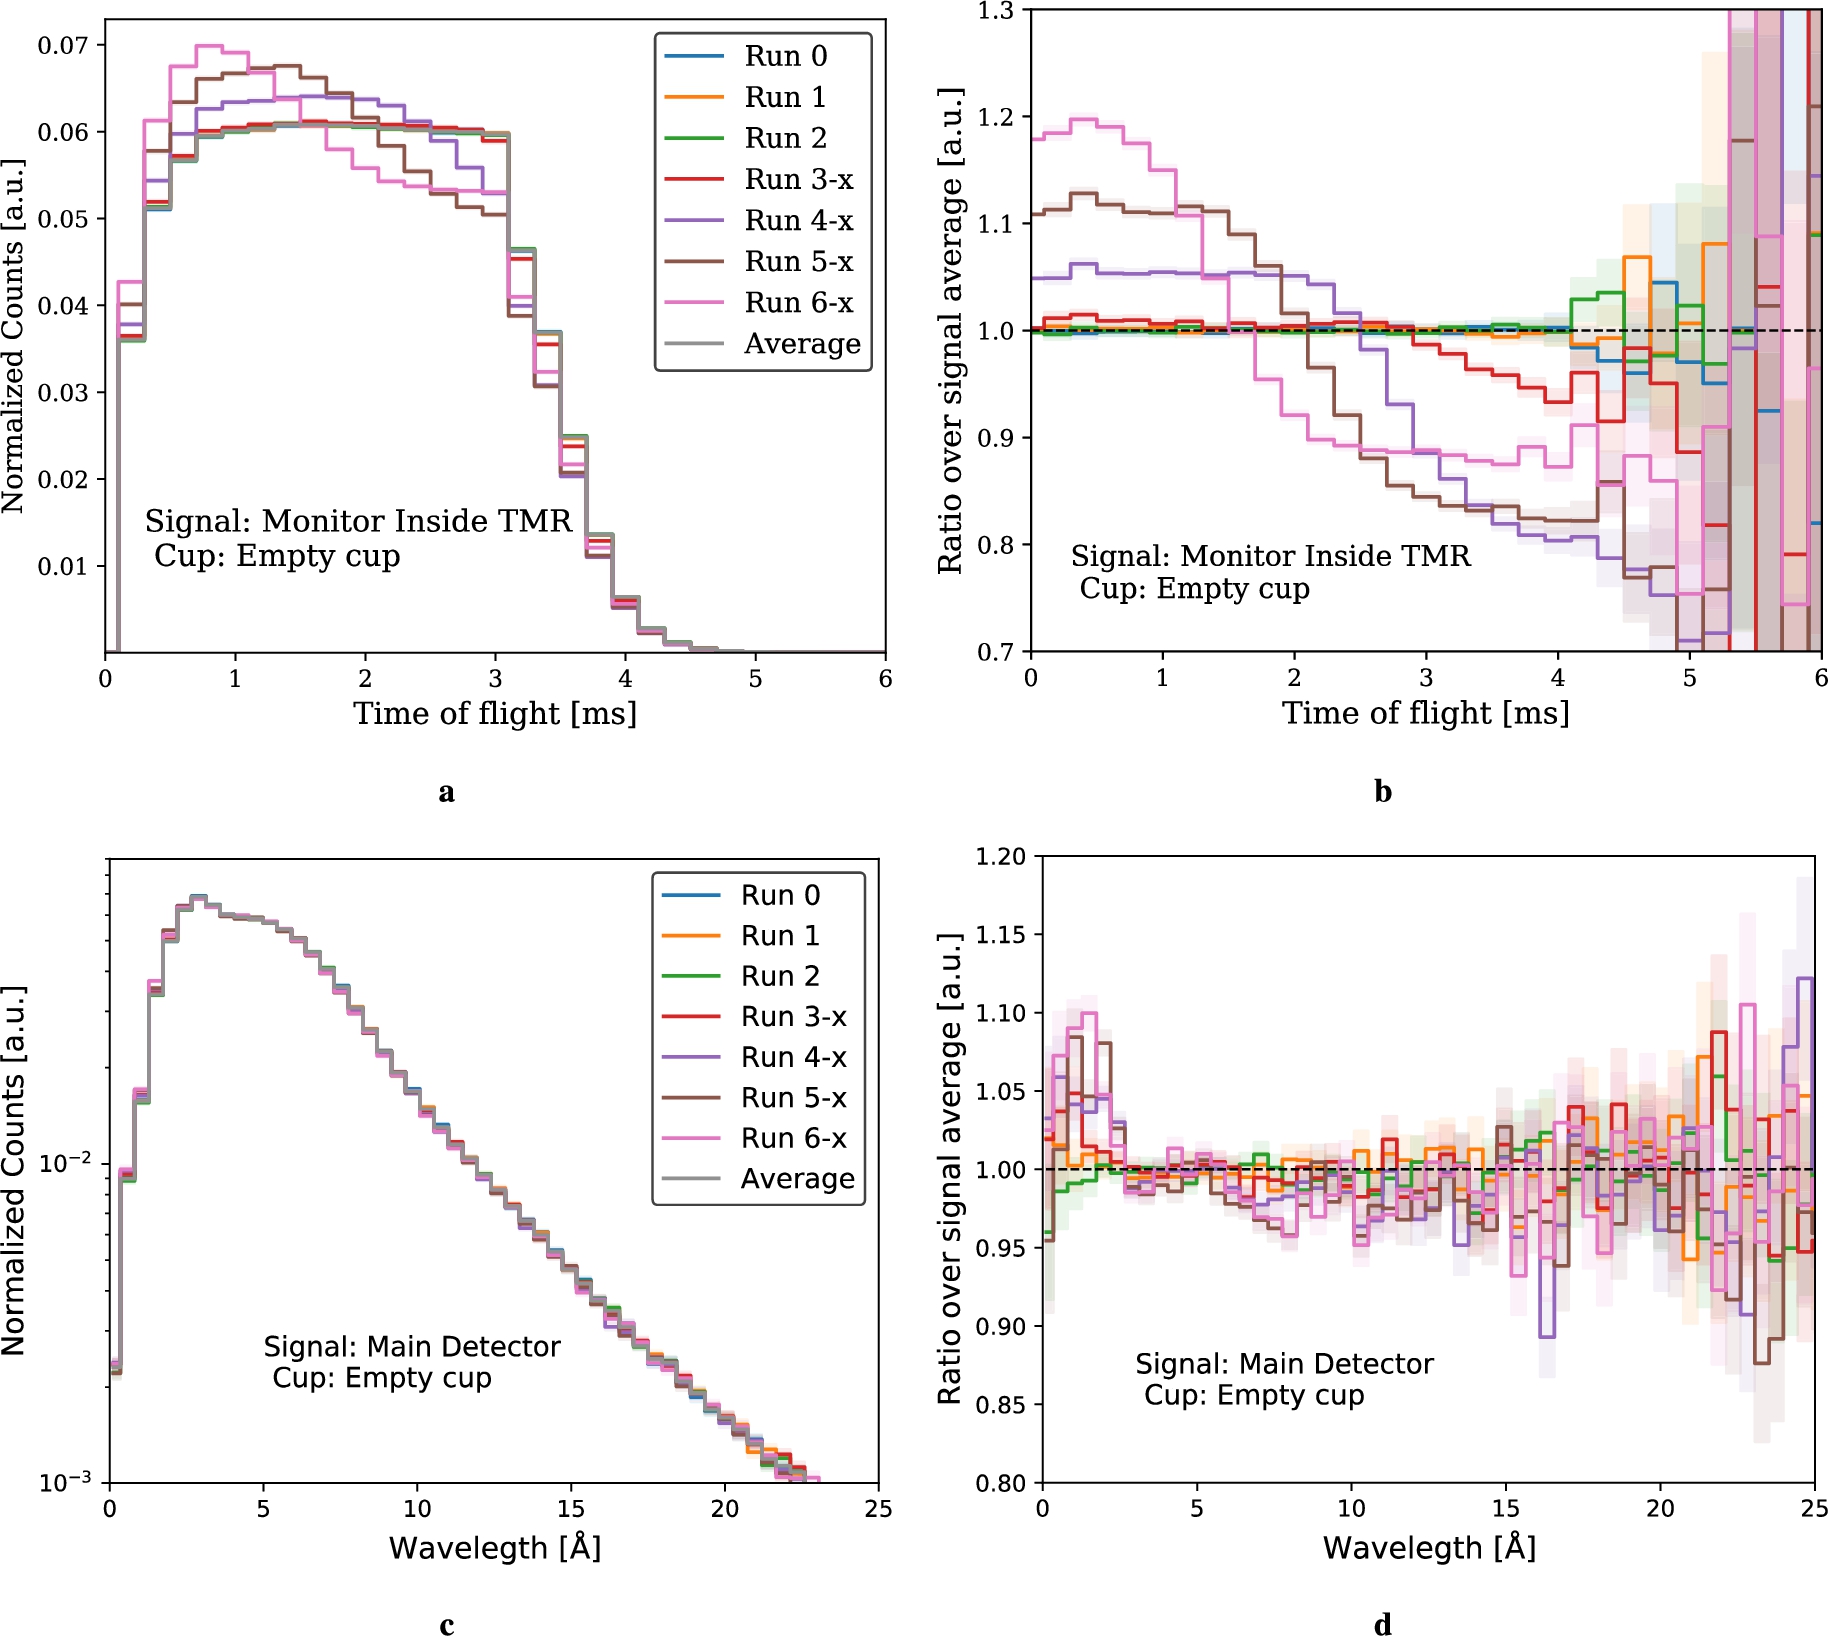
The change of the proton pulse shape on the first day was due to two decoupled clocks signals that were slowly drifting out of synchronization and cutting the proton pulse. Tis drift was only discovered the day after, and the problem was quickly fixed before starting the new measurements. In Fig. 250a, this drift is clearly visible in the runs 4 to 6, althoug it probably already started in run 3. These runs are hence discarded from the calculation of the average and marked with an x in the plots. The normalization hides the differences in absolute counts (lower for runs 3 to 6), but highlights the different shapes and allows to calculate the ratios in Fig. 250b. The study of the signal from the main detector, calculated with Equation (28), in Figs 250c and 250d shows that a drift of 10%-20% in the pulse shape is positively correlated to a statistically significant variation of 5%-10% in the counts of the cold signal up to
Fig. 251.
Variation of the He temperature flowing in and out of the moderator during the empty cup measurement on day 1.
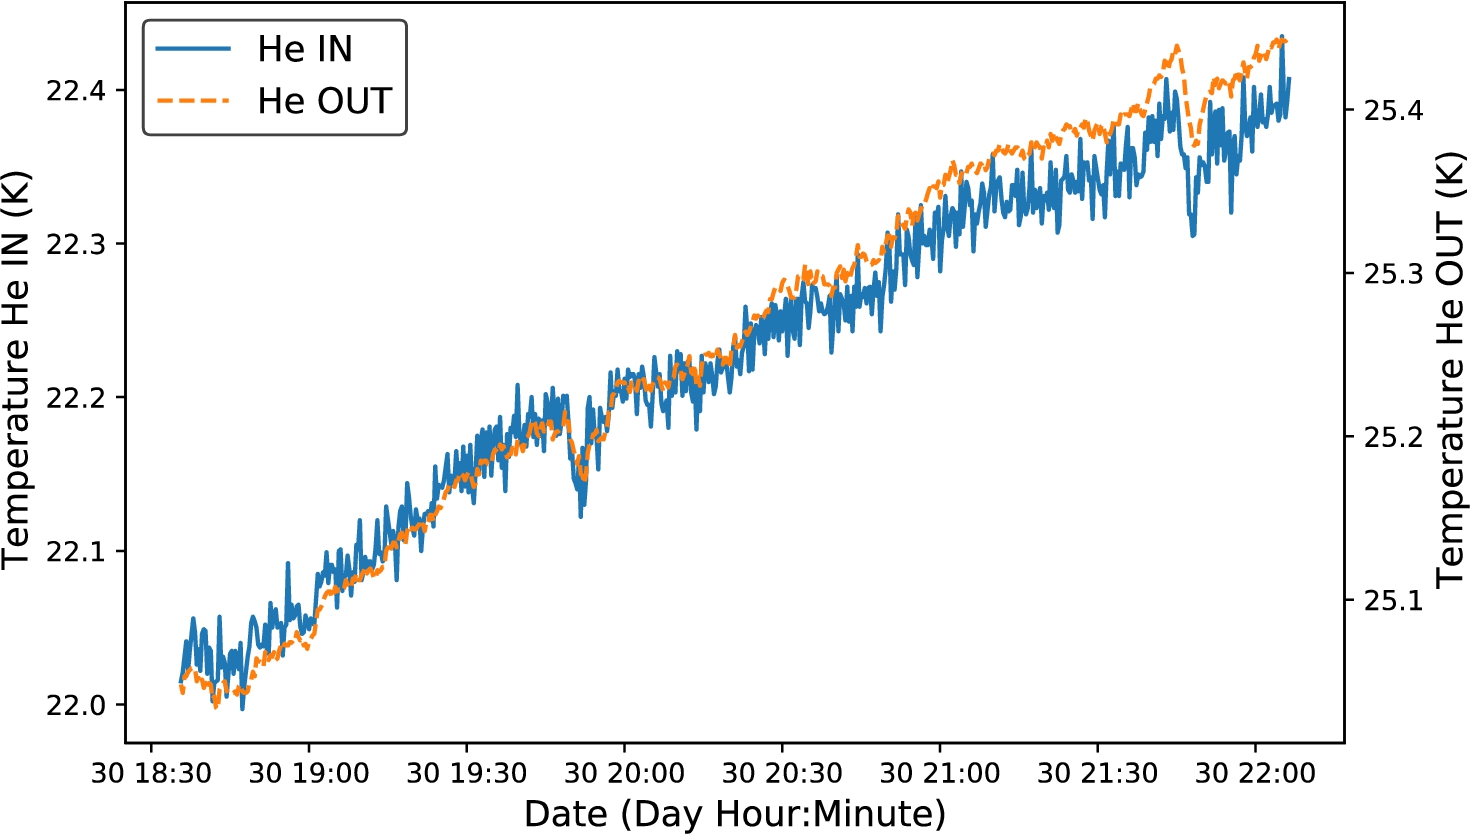
10.3.4.Results
First attempt with ND cup. The first two days we measured the empty cup and the ND cup for the first time. As already mentioned, at the end of the measurement with the empty cup, the accelerator pulse was unstable, but it was promptly fixed by the end of the day. The data collected during the accelerator drifts were not included in the average. For the ND cup, the first thing noticed after the cup exchange was an increase in the moderator temperature. The monitoring system was reporting a liquid He in-flow temperature of 23.8 K. Before starting the runs, the temperature was restored to 22 K by increasing the flow of the coolant. In Fig. 252 the results are presented for both the monitor outside the TMR and the signal from the main detector. The ratio in Fig. 252d is calculated with Equation (30) and shows a small, but statistically significant, increase in counts with the ND cup over the empty cup above 5 Å. The increase reaches up to 5% at longer wavelength. Even if there is a difference in pulse shape in Fig. 252b, it is probably too small to produce the observed effect in the signal. In any case, the increment at such a short wavelengths needs to be investigated further, since the reflectivity of the ND is expected to strongly increase above
Fig. 252.
Run-averaged normalized counts and ratio between signals: (a) and (b) monitor inside the TMR area, (c) and (d) main detector for the ND cup and empty cup cases. The signal from the main detector is re-binned by a factor 4 (0.46 Å).
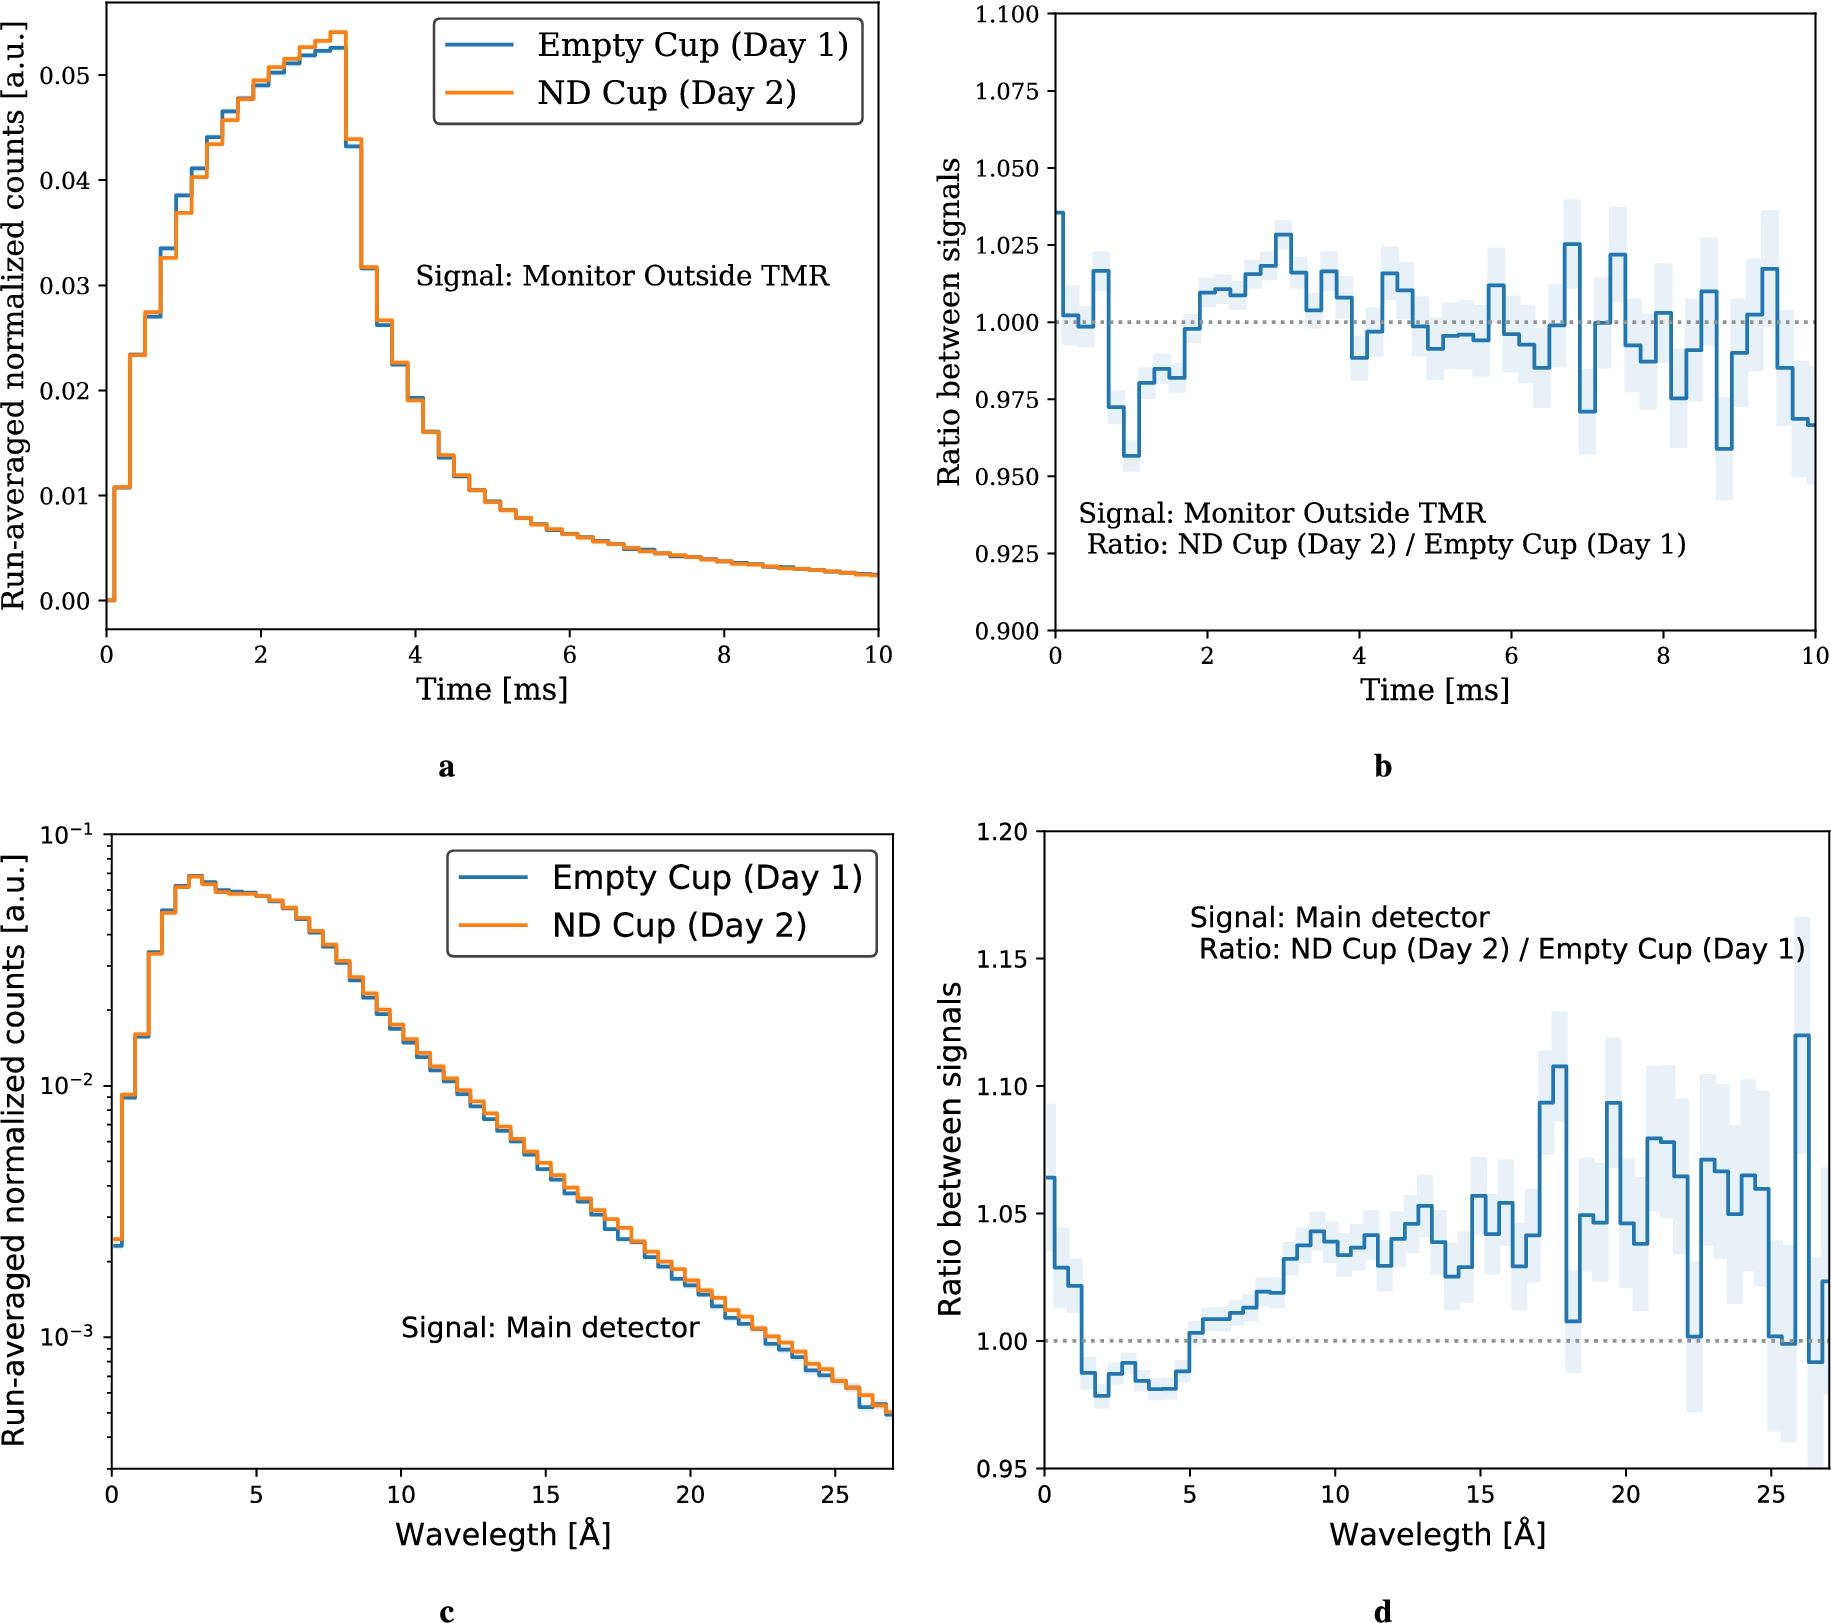
Second attempt with ND cup. During the last day, three measurements with two cup exchanges were performed: empty, ND and empty cup a second time. The reason to plan the first two in the same day was to prevent as much as possible any source of instability, e.g. changes in the accelerator parameters. Unfortunately, even these measurements were not flawless in terms of stability. During the first shutdown to exchange the cup, the moderator cooling control system crashed and the moderator warmed up to 70 K. The methane mass flow was still 0, so most likely it was still frozen by the time it was brought back to 22 K for ND cup runs. After 9 runs with the ND cup, a rise in the moderator temperature to 24 K was noticed because the He flow was getting smaller. This caused a systematic drift in the different ND runs that produced, by the time of the last run, 4% less counts integrated above 5 Å. For this reason, only the first 20 min run, the closest to the nominal temperature of 22 K, were used. For the second cup exchange, the empty cup was put back to rule out any possible spurious contribution from the first re-cooling of the day. The results for both the empty cups and the ND cup are presented in Fig. 253. The ratio between the empty cups in Fig. 253d suggests that the two measurements are not equivalent and the unexpected warm up had, indeed, a negative effect on the initial conditions. In particular, the same trend is also visible when the ND cup signal is compared with the first empty cup. In this regard, the ratio between the signals from the first ND run and the second empty cup is probably the most reliable. The lower statistics, resulting from keeping only the first ND run, does not allow to measure any statistically significant effect above unity. Thus, we could not confirm the result from the first days (Fig. 252d).
Fig. 253.
Run-averaged normalized counts and ratio between signals: (a) and (b) monitor inside the TMR area, (c) and (d) main detector for the ND cup and empty cups cases of day 5. The signal from the main detector is re-binned by a factor 4 (0.46 Å).
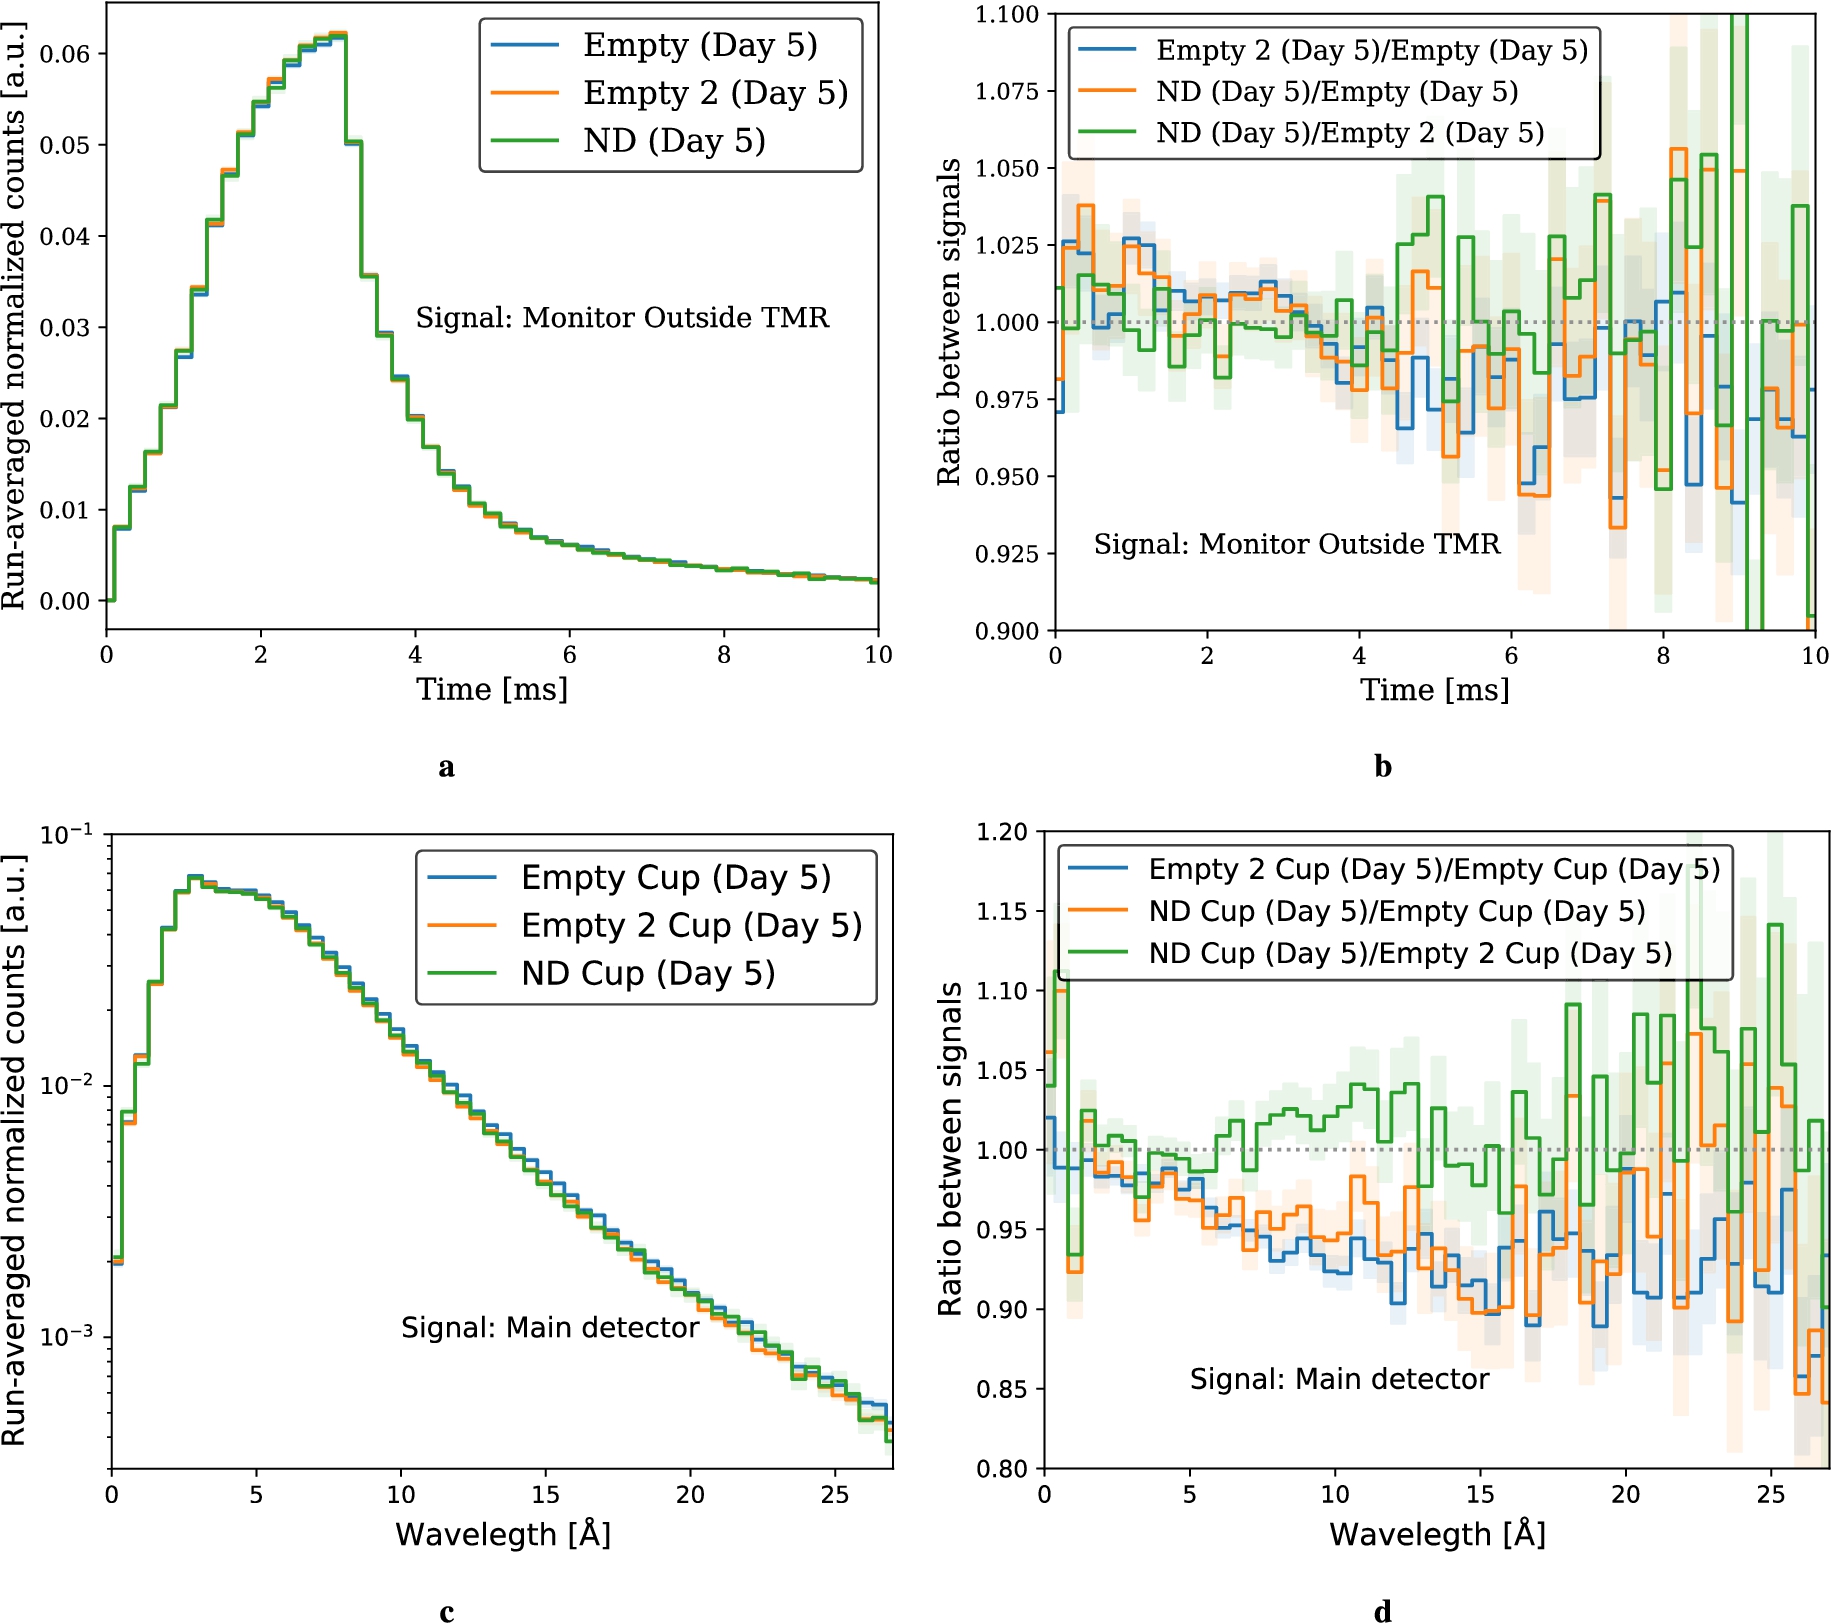
Magnesium hydride cup. The cup with the MgH2 was put in right before the accelerator ion cup broke. After the exchange and the restart of the accelerator, many tests were conducted on the accelerator parameters. The inconsistencies we report in Fig. 254, where we assume that the average is given by the first run only, are most likely due to an unsettled accelerator pulse that lasted for the whole measurement. Unfortunately, we were not able to catch it on time to find a solution. Thus, we conclude that the ratio with the first empty cup signal taken on Day 5 would not be meaningful.
Fig. 254.
Normalized counts for each run and ratio over average for the MgH2 cup measurement for: (a) and (b) monitor inside the TMR area, (c) and (d) main detector. The signal from the main detector is re-binned by a factor 4 (0.46 Å). Only the first run is used for the average, so all the other runs are marked by an x.
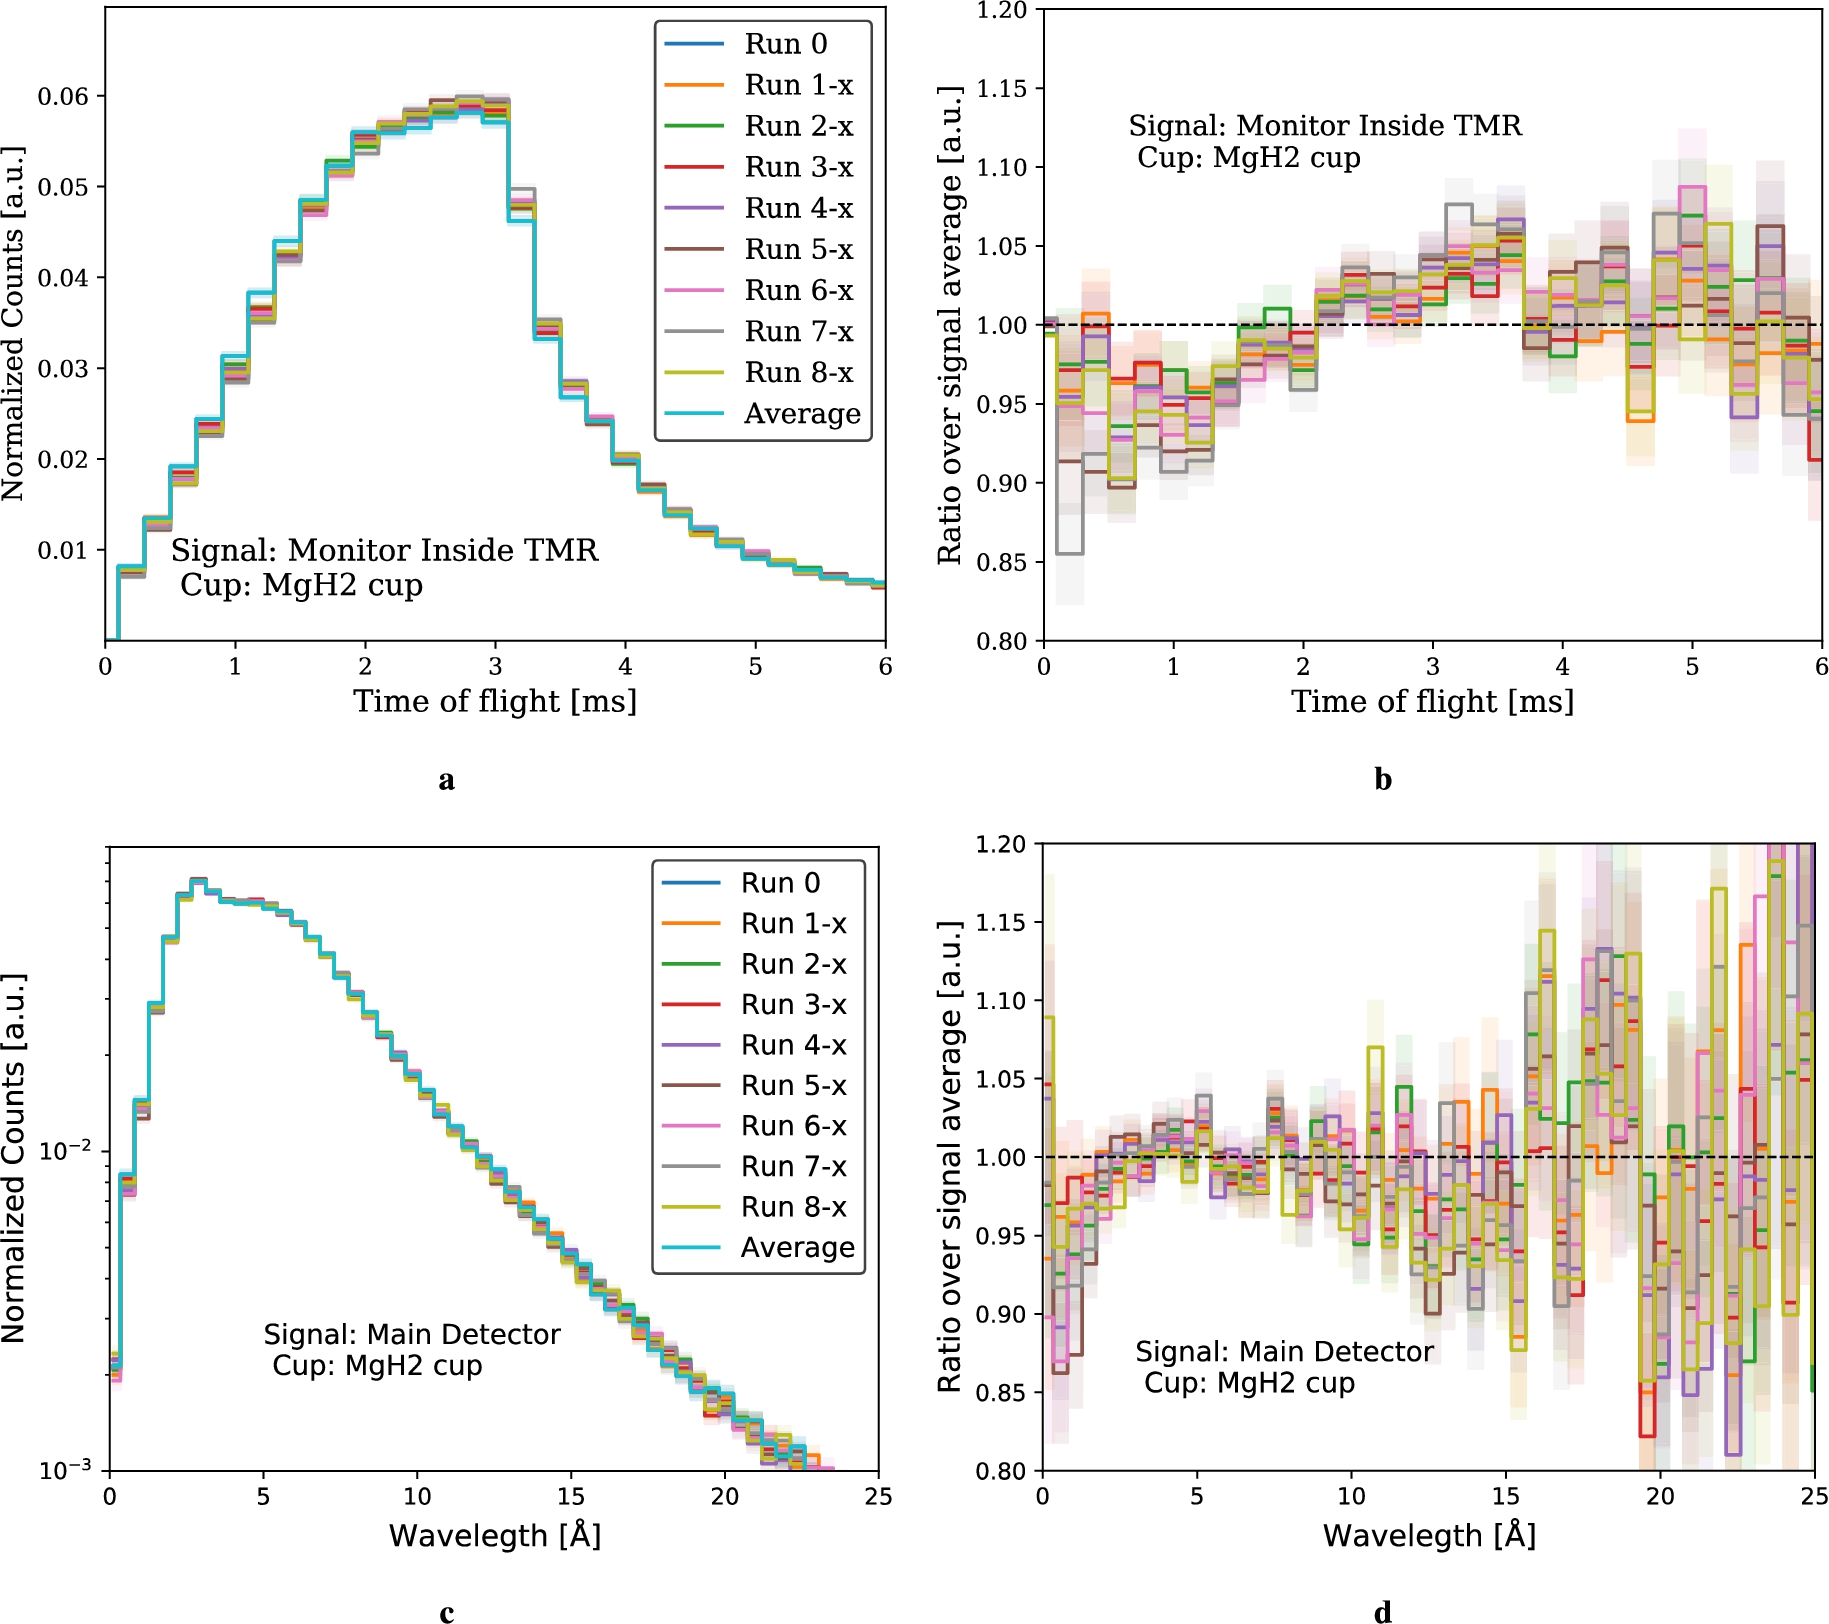
Polyethylene cup. The PE cup inserted on Day 4 benefited from stable accelerator conditions that remained until the next day when the first empty cup measurement on Day 5 was done. However, toward the end of the day the cooling control system crashed, and the moderator melted. After the restart of the system and the slow cooling of the source back to 22 K, one more 20-min-long run was taken. The spectrum from this run was still distinctively a warm-up spectrum, so it is not considered for the average value. Early in the morning the next day, a quick run before the shutdown with the accelerator at 10 Hz and 1 ms was acquired and compared with the equivalent short runs of day before, showing good agreement. This suggests that the cooling process was most likely not over by the time of the last measurement, but it eventually reached the starting point over the course of the evening. Hence, the most reliable data set is the one taken before the melting of the moderator. The results shown in Fig. 255, and in particular Figs 255c and 255d, suggest that the polyethylene cup uniformly increases the thermal and cold production of the source by 15%. Due to its hydrogen content, the removal of pre-moderation material in an intense high-energy neutron field to accommodate an advanced reflector is a key factor to take into account.
Fig. 255.
Run-averaged normalized counts and ratio between signals: (a) and (b) monitor inside the TMR area, (c) and (d) main detector for the PE cup and first empty cup case of day 5. The signal from the main detector is re-binned by a factor 4 (0.46 Å ).
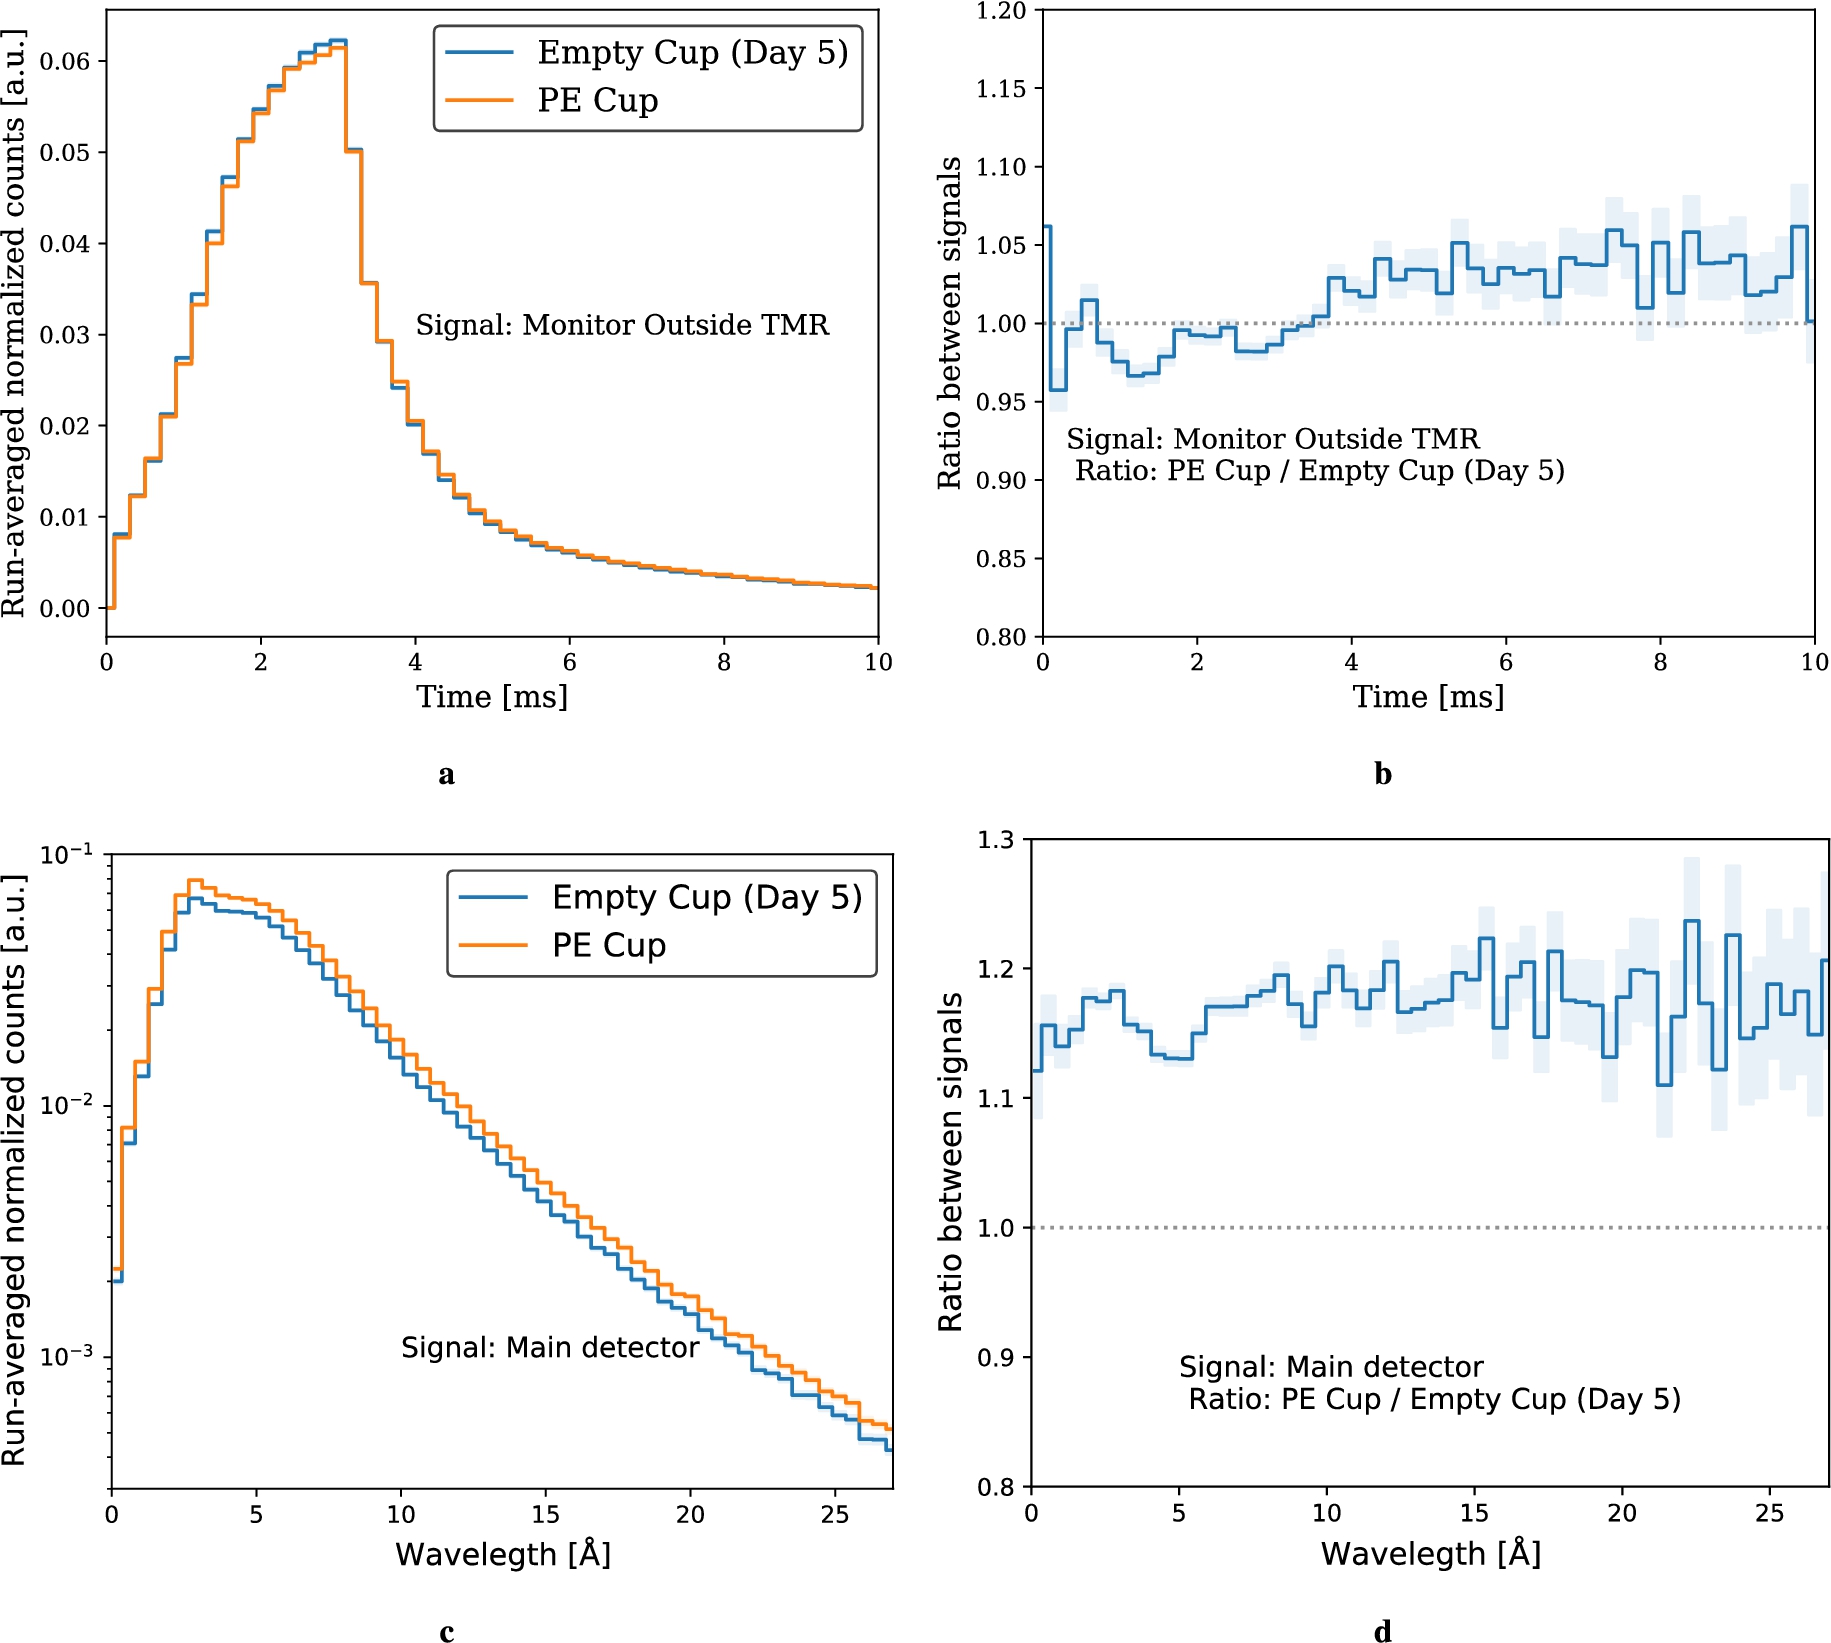
10.3.5.Discussion
The experimental campaign at the HiCANS test station was part of a series of efforts by HighNESS to characterize the advanced reflectors. The models developed and used in the simulations so far confirmed their promising application to cold, very cold and ultracold neutron sources. The experiment, first attempt to verify these effects, was not originally part of the HighNESS plan and it was arranged at the eleventh hour when the opportunity arose. The insights gained from the design of the experiment at BNC were transposed to the setup for the test station, but the impromptu decision made it hard to perform an in-depth study beforehand. This fact may have contributed to the inconclusive results from the beamtime. Nevertheless, this beamtime helped in pinning down critical technical challenges involved in performing this kind of experiment and possible improvements:
- The stability of the source should be the first concern, in terms of both the accelerator and moderator. A careful examination of the options has to take into account how to minimize the risk of disruptions and malfunctioning. In order to quantify the stability sought, the setup can be studied beforehand with simulations that include the relevant features;
- the monitoring of stability of the systems can be improved with a calibrated measurement of the accelerator pulse and a reliable temperature control system;
- The procedure of exchanging the cup required long shutdown/restart time of the facility. An out-of-pile source may possibly be advantageous in this regard, but background could become a problem. Minimizing the exchanges and maximizing the time window for each measurement would be undoubtedly beneficial;
- Studying the possibility of compressing the powder inside the cups, or inserting bigger cups, would increase the relative effect, hence relaxing the requirements on the stability. This contribution should also be investigated with appropriate simulations;
- In order to better understand the limits of application, it would be interesting to test the cup concept in an in-beam setup with a pure cold source. This setup can possibly better highlight the properties of the advanced reflector over common hydrogen-rich materials, e.g. polyethylene, which in almost all cases can provide higher hydrogen density than advanced reflector powders. While this is undoubtedly advantageous for an in-pile source in a high-energy neutron field, a pure cold beam could emphasize the reflector properties without the premoderator component.
11.Conclusions
The primary goal of the HighNESS project was the design of a second neutron source to complement the high-brightness bi-spectral source which is placed above the spallation target and serves all the neutron scattering instruments of the initial suite planned for ESS. To achieve this objective, the HighNESS project outlined a scientific case in its proposal, encompassing various neutron scattering techniques and including the NNBAR experiment, which aims to detect neutron to antineutron oscillation.
At the heart of the project is the design of a high-intensity cold source, which will directly serve instruments and experiments, but also secondary VCN and UCN sources. Without a source delivering at least several times the intensity of the upper moderator, it would not be possible to achieve the ambitious scientific goals outlined in the proposal. The choice of liquid deuterium, used for decades at reactors and continuous spallation sources, was confirmed to be the only viable option for such a source. The final design is able to deliver an intensity above 4 Å of a factor of 10 greater than the upper moderator, thus exceeding the proposal expectations. This remarkable outcome is crucial for enabling the NNBAR experiment to reach its anticipated sensitivity levels, as discussed further in HighNESS Conceptual Design Report Volume II. Additionally, the cold source features an extended emission surface compared to the upper moderator. This property has been duly exploited in the design of novel SANS and imaging instruments that will complement and outperform the ones under construction at ESS.
The design of the cold source was an iterative process between the neutronic and engineering teams. A detailed engineering study of the cold moderator was performed including stress analysis and fluid dynamics simulations, to operate and cool the liquid deuterium, the aluminum structure and the cold beryllium filter that increases the cold flux for NNBAR. The design was reviewed by an international team of experts and a few further investigations are recommended, which are detailed at the end of Section 3.
To guide the optimization of the cold source, the HighNESS project included a design of a small suite of conceptual instruments that takes advantage of the increased source intensity. The suite included two SANS instruments – one using a conventional design and one based on focusing with Wolter optics – as well as an imaging instrument. The performance of these instruments were evaluated with different proposed models for the source, and the results were considered when deciding which source models to pursue further. With the current design of the cold source it was found that the Wolter optics based SANS instrument in particular would have world-leading capabilities with impressive flux, bandwidth, minimum Q, and resolution simultaneously. The larger source also allowed for a simple pinhole imaging beamline that would have a large homogeneous field of view, still offering modest wavelength resolution for advanced imaging techniques, and thus complementing the ESS instrument ODIN, which is under construction.
In addition to the cold source developments, the HighNESS project aimed to ambitiously extend the range of available neutrons for ESS users into the VCN and UCN ranges. The project achieved significant results in both of these areas.
The desire for an intense source of VCNs has been a longstanding aspiration within the user community, spanning at least two decades. The realization of such a source has faced challenges primarily due to the lack of knowledge regarding the properties of low-temperature materials, which were considered the most promising candidates for such a source. To enable reliable Monte Carlo simulations and, consequently, the design of a neutron source, the availability of thermal scattering cross-section libraries is essential. In the HighNESS project, these libraries were developed for candidate VCN moderator and reflector materials, including deuterated clathrate hydrates and nanodiamonds. Additionally, new libraries for solid deuterium were developed through collaboration with another EU program called EURIZON. The development of these libraries stands as a significant achievement within the HighNESS project. It can be deemed a major breakthrough in the field of source design. HighNESS has not only created these thermal scattering libraries but also made them readily accessible to the community, adhering to the open-source policy outlined in the project proposal. This step was taken to ensure the wider dissemination of the project’s outcomes. This contribution unfolded during a period of notably vibrant development, partly due to recent advancements in compact neutron source design.
Thanks to these developments, it was possible to tackle the task of designing a VCN source. The results were very compelling. As in the case of the cold source development, another factor of 10 manifested: this time, it is the increase in the brightness for neutrons above 40 Å, compared to the brightness of a conventional cold source placed in the same location below the spallation target. Such a breakthrough is due to the use of solid deuterium at 5 K, in combination with nanodiamonds, and to its reduced upscattering of VCNs, compared to liquid deuterium at 22 K which is used for the intense cold source. If duly exploited, this type of dedicated VCN source could be a game changer for several neutron scattering techniques such as SANS and spin-echo. However, both SANS and spin-echo beamlines using a VCN source would need optics that counteract the effects of gravity. Such systems were already investigated as a part of the project and highly encouraging results were obtained with focusing optics corrected by prisms.
The scientific case, along with general design concepts for VCN and UCN sources, underwent extensive discussions during two dedicated workshops 1313 1414 organized at ESS by HighNESS in collaboration with the League of European Neutron Sources (LENS). These workshops saw active participation from over 100 members of the community. One of the most encouraging outcomes of these workshops was the multitude of ideas generated for UCN sources at ESS. This not only underscores the potential that ESS offers but also validates the feasibility of the upgrade paths explored by HighNESS. Following the workshop’s directions, the HighNESS team conducted neutronic design studies for most of the proposed UCN source options. Both in-pile and in-beam designs were considered, utilizing two commonly used materials for UCN production: solid deuterium and superfluid helium. The results have been highly promising, positioning ESS for a world-leading UCN source.
The choice of the optimal UCN source for ESS depends on various factors, including technical feasibility (e.g., cooling of the source and UCN extraction) and the integration of the three source categories developed in HighNESS. The project explored at least eight potential integration options for CN, VCN, and UCN sources, as discussed in detail in Section 7. These options should be subject to further study and development in future projects, and they represent a valuable legacy of the HighNESS project.
To achieve its goals, the HighNESS project also conducted an extensive experimental program. This program involved the measurement of cross sections for various materials relevant to the project, with a particular focus on clathrate hydrates and graphite compounds. These measurements were conducted at facilities such as ILL (using the IN5 and PANTHER beamlines) and PSI (utilizing the BOA beamline).
Another aspect of the experimental program involved the measurement of prototype advanced reflectors designed to enhance the VCN flux, as outlined in the HighNESS proposal. In this case, a significant challenge arose due to the limited availability of operational facilities where prototype measurements could be conducted. At the time the proposal was written, there was only one such facility, which was the LENS facility in Indiana. Unfortunately, this facility shut down at the beginning of the HighNESS project. Another facility under construction was located at the Budapest Neutron Center, and the HighNESS project provided strong support for its development. As part of this effort, the project organized a collaborative measurement involving a cold moderator with advanced reflectors made of nanodiamonds and MgH2. However, it is important to note that this moderator test facility was still in the developmental phase throughout the duration of the HighNESS project. During this time, only preliminary measurements involving dose rates and background were conducted using an ambient water moderator. The project team remains hopeful that the planned tests can be carried out in the near future once the facility reaches full operational capacity. Another facility that came online recently (December 2022) is the JULIC Neutron Platform in Forschungszentrum Jülich. The HighNESS team had the opportunity to perform a first pilot measurement of a simplified setup of the Budapest measurement.
Finally, in addition to delivering outstanding results as promised in the proposal, the HighNESS consortium has devoted considerable time and effort to training young scientists, including both Ph.D. students and postdoctoral researchers. This training involved not only supervisory roles but also dedicated activities such as organizing the first International School on Thermal Neutron Scattering Kernel Generation,1515 which took place at ESS from May 22 to May 26, 2023 and attracted 40 participants world wide.
12.Outlook
There are a number of developments recommended to fully capitalize on the success of the HighNESS project, and some of them have already been hinted in the previous section.
Source design. One aspect concerns the technical challenges related to operating the sources at the high power of ESS. ESS will operate for many years at 2 MW, with an eventual upgrade to 5 MW. The liquid deuterium moderator will most likely operate at 2 MW but currently, there is no design that can guarantee its functionality at 5 MW. Toward the conclusion of the HighNESS project, the design was significantly simplified, including a simpler shape for the reentrant hole and fewer flow channels inside the vessel. However, further work is required in this area to develop a high-performing design that can operate reliably at 5 MW.
For a solid deuterium moderator the situation is even more uncertain, since such a moderator has never been operated at the MW power level. We have identified and started to investigate some possible engineering solutions however the development of a VCN source capable of operating in a high radiation environment, would require a major R&D program.
Instrument design. A successful design of a VCN source should be accompanied by a dedicated design of experiments using VCN beams. In fact, most of the instrument design in HighNESS concerned the high intensity cold neutron beams delivered by the liquid deuterium moderator. The study of an optics system to transport VCNs and counteract the effect of gravity mentioned above showed promising results, and could be the basis to begin designing dedicated VCN instruments for neutron scattering. The exploration of the NNBAR with VCN design should be accompanied by the development of a dedicated VCN fundamental physics program.
Experimental program. HighNESS has provided major input toward the development of new facilities to test moderators, in particular the moderator test facility at the Budapest Research Center and the Big Karl facility in Jülich. A key necessary step in the continuation of the research initiated by HighNESS would be the realization of prototypes of VCN sources based on solid deuterium and nanodiamonds, as well as deuterated clathrate hydrates. Prior to the implementation of such prototypes in the in-pile positions of the aforementioned moderator test facilities, characterization with cold and very cold neutron beams are envisaged. Suitable sites for such investigations are the cold neutron beam facility PF1B and the very cold neutron beam of PF2 at the ILL.
Measurement and calculation of cross sections. HighNESS has established a process to calculate thermal scattering libraries and perform experimental validations. More developments are certainly recommended to deepen the experimental and theoretical knowledge of such materials, as well as to support the inclusion of these materials in Monte Carlo simulations. Notable examples are the measurement of the cross sections of solid deuterium at 5 K for VCNs, and superfluid helium below 1 K for UCNs. Furthermore, measurements on binary clathrate hydrates, hosting both fully deuterated THF and molecular oxygen are needed to benchmark the developed scattering kernels for these compounds.
Notes
2 In the direction of neutron extraction perpendicular to the incoming proton beam, neutrons can be extracted from both the cold wings of the butterfly moderator. For each wing the height is 3 cm, and the width is of about 7 cm, cf. Fig. 32 in [222], thus giving a total emission surface of about 42 cm2.
4 The standard cold moderator materials for both spallation and fission sources are liquid or solid deuterium (
5 Note that this list is not exhaustive.
6 Acronym for R. Colella, A. W. Overhauser, and S. A. Werner.
7 It should be noted that VCN might not be competitive with the accuracy of atom interferometers, as pointed out in [162, p. 263f.].
9 This system was studied before and has shown a broad band of low-energy modes, as experimentally demonstrated by [35] and [46].
10 The oxygen abundance is, unlike the THF-d, non-stoichiometric and strongly depends on the sample preparation. This is represented by “~”.
11 It’s important to note that certain experiments depend on a substantial transmitted flux of UCNs rather than a dense storage.
12 Plugin support requires installing NCrystal version 2.2.0 or later: https://github.com/mctools/ncrystal.
Acknowledgements
We would like to acknowledge the Paul Scherrer Institute for access to beam time at the facility under proposal numbers 20212829, 20221100 and 20222657. We acknowledge MAX IV Laboratory for time on Beamline COSAXS under Proposal 20221553. Research conducted at MAX IV, a Swedish national user facility, is supported by the Swedish Research council under contract 2018-07152, the Swedish Governmental Agency for Innovation Systems under contract 2018-04969, and Formas under contract 2019-02496. We would also like to acknowledge the support by ILL services in performing the experiments carried out there. We would also like to thank the ESS Manufacturing Workshop and the ESS sample environment group for machining the triaxial and cylindrical sample holders. HighNESS is funded by the European Union Framework Programme for Research and Innovation Horizon 2020, under grant agreemeent 951782
References
[1] | H. Abele, A. Alekou, A. Algora, K. Andersen et al., Particle physics at the European Spallation Source, Physics Reports 1023: ((2023) ), 1–84. |
[2] | B.M. Adams, W.J. Bohnhoff, K.R. Dalbey, M.S. Ebeida, J.P. Eddy, M.S. Eldred, R.W. Hooper, P.D. Hough, K.T. Hu, J.D. Jakeman, M. Khalil, K.A. Maupin, J.A. Monschke, E.M. Ridgway, A.A. Rushdi, D.T. Seidl, J.A. Stephens, L.P. Swiler and W. Dakota, A Multilevel parallel object-oriented framework for design optimization, parameter estimation, uncertainty quantification, and sensitivity analysis: Version 6.18 user’s manual, Sandia technical report SAND2020-12495, (2023) . |
[3] | A. Addazi, K. Anderson, S. Ansell et al., New high-sensitivity searches for neutrons converting into antineutrons and/or sterile neutrons at the hibeam/nnbar experiment at the European Spallation Source, Journal of Physics G: Nuclear and Particle Physics 48: (7) ((2021) ), 070501. doi:10.1088/1361-6471/abf429. |
[4] | M. Adib and M. Kilany, On the use of bismuth as a neutron filter, Radiation Physics and Chemistry 66: (2) ((2003) ), 81–88. doi:10.1016/S0969-806X(02)00368-7. |
[5] | A. Aleksenskii, M. Bleuel, A. Bosak et al., Clustering of diamond nanoparticles, fluorination and efficiency of slow neutron reflectors, Nanomaterials 11: (8) ((2021) ), 1945 Publisher: Multidisciplinary Digital Publishing Institute. |
[6] | E. American, Commercial magnesium hydride, https://www.americanelements.com/magnesium-hydride-7693-27-8 (online; accessed 17-September-2023). |
[7] | K.H. Andersen, D.N. Argyriou, A.J. Jackson et al., The instrument suite of the European Spallation Source, Nucl. Instr. Meth. 957: ((2020) ), 163402. doi:10.1016/j.nima.2020.163402. |
[8] | K.H. Andersen, M. Bertelsen, L. Zanini, E.B. Klinkby, T. Schönfeldt, P.M. Bentley and J. Saroun, Optimization of moderators and beam extraction at the ESS, Journal of Applied Crystallography 51: (2) ((2018) ), 264–281. doi:10.1107/S1600576718002406. |
[9] | A. Anghel, T.L. Bailey, G. Bison, B. Blau, L.J. Broussard, S.M. Clayton, C. Cude-Woods, M. Daum, A. Hawari, N. Hild, P. Huffman, T.M. Ito, K. Kirch, E. Korobkina, B. Lauss, K. Leung, E.M. Lutz, M. Makela, G. Medlin, C.L. Morris, R.W. Pattie, D. Ries, A. Saunders, P. Schmidt-Wellenburg, V. Talanov, A.R. Young, B. Wehring, C. White, M. Wohlmuther and G. Zsigmond, Solid deuterium surface degradation at ultracold neutron sources, The European Physical Journal A 54: (9) ((2018) ), 148. doi:10.1140/epja/i2018-12594-2. |
[10] | O. Arnold, J.C. Bilheux, J.M. Borreguero, A. Buts, S.I. Campbell, L. Chapon, M. Doucet, N. Draper, R. Ferraz Leal, M.A. Gigg, V.E. Lynch, A. Markvardsen, D.J. Mikkelson, R.L. Mikkelson, R. Miller, K. Palmen, P. Parker, G. Passos, T.G. Perring, P.F. Peterson, S. Ren, M.A. Reuter, A.T. Savici, J.W. Taylor, R.J. Taylor, R. Tolchenov, W. Zhou and J. Zikovsky, Mantid–data analysis and visualization package for neutron scattering and μ sr experiments, Nuclear Instruments and Methods in Physics Research A 764: ((2014) ), 156–166. doi:10.1016/j.nima.2014.07.029. |
[11] | F. Atchison, B. Blau, K. Bodek, B. Van den Brandt, T. Bryś, M. Daum, P. Fierlinger, A. Frei, P. Geltenbort, P. Hautle et al., Cold neutron energy dependent production of ultracold neutrons in solid deuterium, Physical review letters 99: (26) ((2007) ), 262502. doi:10.1103/PhysRevLett.99.262502. |
[12] | F. Atchison, B. Blau, K. Bodek, B. Van den Brandt, T. Bryś, M. Daum, P. Fierlinger, A. Frei, P. Geltenbort, P. Hautle et al., Investigation of solid D2, O2 and CD4 for ultracold neutron production, Nuclear Instruments and Methods in Physics Research Section A: Accelerators, Spectrometers, Detectors and Associated Equipment 611: (2–3) ((2009) ), 252–255. doi:10.1016/j.nima.2009.07.072. |
[13] | F. Atchison, B. Blau, B. van den Brandt, T. Bryś, M. Daum, P. Fierlinger, P. Hautle, R. Henneck, S. Heule, K. Kirch, J. Kohlbrecher, G. Kühne, J.A. Konter, A. Pichlmaier, A. Wokaun, K. Bodek, M. Kasprzak, M. Kuźniak, P. Geltenbort and J. Zmeskal, Measured total cross sections of slow neutrons scattered by solid deuterium and implications for ultracold neutron sources, Physical Review Letters 95: (18) ((2005) ), 182502, Publisher: American Physical Society. |
[14] | F. Atchison, M. Daum, R. Henneck, S. Heule, M. Horisberger, M. Kasprzak, K. Kirch, A. Knecht, M. Kużniak, B. Lauss, A. Mtchedlishvili, M. Meier, G. Petzoldt, C. Plonka-Spehr, R. Schelldorfer, U. Straumann and G. Zsigmond, Diffuse reflection of ultracold neutrons from low-roughness surfaces, The European Physical Journal A 44: (1) ((2010) ), 23–29. doi:10.1140/epja/i2010-10926-x. |
[15] | M.V. Avdeev, V.L. Aksenov, O.V. Tomchuk, L.A. Bulavin, V.M. Garamus and E. Ōsawa, The spatial diamond–graphite transition in detonation nanodiamond as revealed by small-angle neutron scattering, Journal of Physics: Condensed Matter 25: (44) ((2013) ), 445001, Publisher: IOP Publishing. |
[16] | F. Backman, J. Barrow, Y. Beßler, A. Bianchi, C. Bohm, G. Brooijmans, H. Calen, J. Cederkäll, J.I.M. Damian, E. Dian, D.D. Di Julio, K. Dunne, L. Eklund, M.J. Ferreira, P. Fierlinger, U. Friman-Gayer, C. Happe, M. Holl, T. Johansson, Y. Kamyshkov, E. Klinkby, R. Kolevatov, A. Kupsc, B. Meirose, D. Milstead, A. Nepomuceno, T. Nilsson, A. Oskarsson, H. Perrey, K. Ramic, B. Rataj, N. Rizzi, V. Santoro, S. Silverstein, W.M. Snow, A. Takibayev, R. Wagner, M. Wolke, S.C. Yiu, A.R. Young, L. Zanini and O. Zimmer, The development of the nnbar experiment, Journal of Instrumentation 17: (10) ((2022) ), P10046. doi:10.1088/1748-0221/17/10/P10046. |
[17] | M. Baldo-Ceolin et al., A new experimental limit on neutron – anti-neutron oscillations, Z. Phys. C 63: ((1994) ), 409–416. doi:10.1007/BF01580321. |
[18] | H. Barnert-Wiemer, Conceptual design of a cold methane moderator system for the European Spallation Source (ESS), (2002) . |
[19] | S. Baroni, S. De Gironcoli, A. Dal Corso and P. Giannozzi, Phonons and related crystal properties from density-functional perturbation theory, Reviews of Modern Physics 73: (2) ((2001) ), 515–562. doi:10.1103/RevModPhys.73.515. |
[20] | B. Baudouy and A. Four, Low temperature thermal conductivity of aluminum alloy 5056, Cryogenics 60: ((2014) ), 1–4. doi:10.1016/j.cryogenics.2013.12.008. |
[21] | J. Baumann, R. Gähler, J. Kalus and W. Mampe, Experimental limit for the charge of the free neutron, Phys. Rev. D 37: ((1988) ), 3107–3112. doi:10.1103/PhysRevD.37.3107. |
[22] | H.J.C. Berendsen, J.R. Grigera and T.P. Straatsma, J. Chem. Phys. 91: ((1987) ), 6269. doi:10.1021/j100308a038. |
[23] | W. Bernnat, J. Keinert and M. Mattes, Scattering laws and cross sections for moderators and structure materials for calculation of production and transport of cold and ultracold neutrons, Journal of Nuclear Science and Technology 39: (sup2) ((2002) ), 124–127. doi:10.1080/00223131.2002.10875056. |
[24] | W. Bernnat, J. Keinert and M. Mattes, Evaluation of scattering laws and cross sections for calculation of production and transport of cold and ultracold neutrons, in: Proceedings of the 6th International Workshop on Advanced Cold Moderators, Jülich, Sept 11–13, 2002, (2004) . |
[25] | M. Boin, nxs: A program library for neutron cross section calculations, Journal of Applied Crystallography 45: (3) ((2012) ), 603–607. doi:10.1107/S0021889812016056. |
[26] | D.W. Boukhvalov and M.I. Katsnelson, Modeling of graphite oxide, J. Am. Chem. Soc. 130: ((2008) ), 10697. doi:10.1021/ja8021686. |
[27] | D. Broseta, L. Ruffine and A. Desmedt (eds), Gas Hydrates 1: Fundamentals, Characterization and Modeling, 1st edn, John Wiley & Sons, Inc., Hoboken, NJ, USA, (2017) . |
[28] | D.A. Brown, M.B. Chadwick, R. Capote, A.C. Kahler et al., ENDF/B-VIII.0: The 8th major release of the nuclear reaction data library with CIELO-project cross sections, new standards and thermal scattering data, Nuclear Data Sheets 148: ((2018) ), 1–142, Special Issue on Nuclear Reaction Data. doi:10.1016/j.nds.2018.02.001. |
[29] | T. Bryś, Extraction of ultracold neutrons from a solid Deuterium source, Doctoral thesis, ETH, Zurich, Zürich, (2007) , Diss., Eidgenössische Technische Hochschule ETH Zürich, Nr. 17350, 2007. |
[30] | C.J. Burnham and N.J. English, J. Chem. Phys. 144: ((2015) ), 051101. doi:10.1063/1.4941330. |
[31] | X.-X. Cai and T. Kittelmann, NCrystal: A library for thermal neutron transport, Computer Physics Communications 246: ((2020) ), 106851. doi:10.1016/j.cpc.2019.07.015. |
[32] | X.-X. Cai, T. Kittelmann, E. Klinkby and J.I.M. Damián, Rejection-based sampling of inelastic neutron scattering, Journal of Computational Physics 380: ((2019) ), 400–407. doi:10.1016/j.jcp.2018.11.043. |
[33] | J.M. Carpenter and B.J. Micklich, Proceedings of the Workshop on Applications of a Very Cold Neutron Source, (2005) . |
[34] | Carpenter Loong, Elements of Slow-Neutron Scattering, Cambridge University Press, (2016) . |
[35] | M. Celli, D. Colognesi, L. Ulivi, M. Zoppi and A.J. Ramirez-Cuesta, Phonon density of states in different clathrate hydrates measured by inelastic neutron scattering, Journal of Physics: Conference Series 340: (1) ((2012) ), 012051. |
[36] | A. Chambon, D. DiJulio, B. Folsom, J.I.M. Damian, B. Rataj, N. Rizzi, V. Santoro, M. Strothmann, A. Takibayev, R. Wagner, O. Zimmer, L. Zanini and M. Akhyani, HighNESS deliverable 4.4: Report on neutronic design of in-pile UCN moderator, HighNESS Deliverable 4: (4). |
[37] | E. Chanel et al., Concept and strategy of supersun: A new ultracold neutron converter, J. Neutron Research, to be published. |
[38] | E. Chanel, S. Baudoin, M.-H. Baurand, N. Belkhier, E. Bourgeat-Lami, S. Degenkolb, M. van der Grinten, M. Jentschel, V. Joyet, M. Kreuz, E. Lelièvre-Berna, J. Lucas, X. Tonon and O. Zimmer, Concept and strategy of SuperSUN: A new ultracold neutron converter, Journal of Neutron Research 24: (2) ((2022) ), 111–121, Publisher: IOS Press. |
[39] | B. Chazallon, H. Itoh, M. Koza, W.F. Kuhs and H. Schober, Anharmonicity and guest–host coupling in clathrate hydrates, Phys. Chem. Chem. Phys. 4: ((2002) ), 4809–4816. doi:10.1039/B202464K. |
[40] | L. Chen, S. Chen and Y. Hou, Understanding the thermal conductivity of diamond/copper composites by first-principles calculations, Carbon 148: ((2019) ), 249–257. doi:10.1016/j.carbon.2019.03.051. |
[41] | Y.Q. Cheng, L.L. Daemen, A.I. Kolesnikov and A.J. Ramirez-Cuesta, Simulation of inelastic neutron scattering spectra using OCLIMAX, Journal of Chemical Theory and Computation 15: (3) ((2019) ), 1974–1982. doi:10.1021/acs.jctc.8b01250. |
[42] | S.M. Chernyavsky, M. Dubois, E. Korobkina, E.V. Lychagin, A.Y. Muzychka, G.V. Nekhaev, V.V. Nesvizhevsky, A.Y. Nezvanov, A.V. Strelkov and K.N. Zhernenkov, Enhanced directional extraction of very cold neutrons using a diamond nanoparticle powder reflector, Rev Sci Instrum 93: (12), 123302, Publisher: American Institute of Physics. |
[43] | K. Chunhui, C. Liubiao, W. Xianlin, Z. Yuan and W. Junjie, Thermal conductivity of open cell aluminum foam and its application as advanced thermal storage unit at low temperature, Rare Metal Materials and Engineering 47: (4) ((2018) ), 1049–1053. doi:10.1016/S1875-5372(18)30118-8. |
[44] | R. Colella, A.W. Overhauser and S.A. Werner, Observation of gravitationally induced quantum interference, Phys. Rev. Lett. 34: ((1975) ), 1472–1474. doi:10.1103/PhysRevLett.34.1472. |
[45] | H. Conrad, W. Kuhs, K. Nuenighoff, C. Pohl, M. Prager and W. Schweika, Inelastic scattering and spectral measurements of advanced cold moderator media, Physica B 350: ((2004) ), e647. doi:10.1016/j.physb.2004.03.173. |
[46] | H. Conrad, W.F. Kuhs, K. Nünighoff, C. Pohl, M. Prager and W. Schweika, Inelastic scattering and spectral measurements of advanced cold moderator media, Physica B: Condensed Matter 350: (1, Supplement) ((2004) ), E647–E650. doi:10.1016/j.physb.2004.03.173. |
[47] | R. Cubitt, E.V. Lychagin, A.Y. Muzychka, G.V. Nekhaev, V.V. Nesvizhevsky, G. Pignol, K.V. Protasov and A.V. Strelkov, Quasi-specular reflection of cold neutrons from nano-dispersed media at above-critical angles, Nuclear Instruments and Methods in Physics Research Section A: Accelerators, Spectrometers, Detectors and Associated Equipment 622: (1) ((2010) ), 182–185. doi:10.1016/j.nima.2010.07.049. |
[48] | V. Czamler, T.C. Hansen, M.M. Koza, R. Wagner and O. Zimmer, Clathrate hydrates as novel moderator material for sources of very cold neutrons, in: Proceedings of the 8th European Conference on Neutron Scattering, (2023) . |
[49] | A. Dal Corso, Pseudopotentials periodic table: From H to Pu, Computational Materials Science 95: ((2014) ), 337–350. doi:10.1016/j.commatsci.2014.07.043. |
[50] | J.I.M. Damian, D.D. DiJulio and G. Muhrer, Nuclear data development at the European Spallation Source, Journal of Neutron Research ((2021) ), 1–10, Preprint. |
[51] | J. Dawidowski, J.R. Granada, J.R. Santisteban, F. Cantargi and L.A.R. Palomino, Appendix – neutron scattering lengths and cross sections, in: Neutron Scattering – Fundamentals, F. Fernandez-Alonso and D.L. Price, eds, Experimental Methods in the Physical Sciences, Vol. 44: , Academic Press, (2013) , pp. 471–528. doi:10.1016/B978-0-12-398374-9.09989-7. |
[52] | S. Degenkolb, P. Fierlinger and O. Zimmer, In-situ production and detection of ultracold neutrons, Journal of Neutron Research 24: ((2022) ), 123. doi:10.3233/JNR-220044. |
[53] | S. Degenkolb, P. Fierlinger and O. Zimmer, Approaches to high-density storage experiments with in-situ production and detection of ultracold neutrons, Journal of Neutron Research 24: (2) ((2023) ), 123–143. doi:10.3233/JNR-220044. |
[54] | L.L. Dessieux, A.D. Stoica, P.R. Bingham, K. An, M.J. Frost and H.Z. Bilheux, Neutron transmission simulation of texture in polycrystalline materials, Nuclear Instruments and Methods in Physics Research Section B: Beam Interactions with Materials and Atoms 459: ((2019) ), 166–178. doi:10.1016/j.nimb.2019.09.010. |
[55] | D.D. DiJulio et al., EPJ Web of Conf. 284: ((2023) ), 17013. doi:10.1051/epjconf/202328417013. |
[56] | S. Döge, Scattering of ultracold neutrons in condensed deuterium and on material surfaces, PhD thesis, Technical University of Munich, (2018) . |
[57] | K.F. Eckerman, R.J. Westfall, J.C. Ryman and M. Cristy, Availability of nuclear decay data in electronic form, including beta spectra not previously published, 67: (4) ((1994) ), 338–345. |
[58] | K. Eder, M. Gruber, A. Zeilinger, R. Gähler, W. Mampe and W. Drexel, The new very-cold-neutron optics facility at ill, Nuclear Instruments and Methods in Physics Research Section A: Accelerators, Spectrometers, Detectors and Associated Equipment 284: (1) ((1989) ), 171–175. doi:10.1016/0168-9002(89)90273-8. |
[59] | ESS Spallation Physics Group, Thermal scattering files for solid deuterium, (2022) . |
[60] | European Spallation Source, The ESS instrument suite, a capability gap analysis, (2018) , https://europeanspallationsource.se/instruments/capability-gap-analysis. |
[61] | European Spallation Source, Development of high intensity neutron source at the European Spallation Source, proposal. |
[62] | B. Fak, M.M. Koza and O. Meulien, Instrument layout: Thermal neutron time-of-flight spectrometer PANTHER, https://www.ill.eu/users/instruments/instruments-list/panther. |
[63] | M. Ferenc, Very cold neutrons in condensed matter research, Journal of Neutron Research 24: (2) ((2022) ), 205–210. |
[64] | M. Ferenc, Very cold neutrons in condensed matter research, Journal of Neutron Research 24: (2) ((2023) ), 205–210. doi:10.3233/JNR-220012. |
[65] | A. Frei, The source for ultra-cold neutrons at the FRM II, these proceedings. |
[66] | A. Frei, E. Gutsmiedl, C. Morkel, A.R. Müller, S. Paul, S. Rols, H. Schober and T. Unruh, Understanding of ultra-cold–neutron production in solid deuterium, Europhysics Letters 92: (6) ((2011) ), 62001. doi:10.1209/0295-5075/92/62001. |
[67] | Y.A. Freiman and H.J. Jodl, Solid oxygen, Physics Reports 401: (1) ((2004) ), 1–228. doi:10.1016/j.physrep.2004.06.002. |
[68] | J. Füzi, Direct measurement of cold neutron moderator spectra, Nuclear Instruments and Methods in Physics Research Section A: Accelerators, Spectrometers, Detectors and Associated Equipment 586: ((2008) ), 41–45. doi:10.1016/j.nima.2007.11.055. |
[69] | N.C. Gallego and J.W. Klett, Carbon foams for thermal management, Carbon 41: (7) ((2003) ), 1461–1466. doi:10.1016/S0008-6223(03)00091-5. |
[70] | F.X. Gallmeier, T. Hugely, E.B. Iverson, W. Lu and I. Remec, Options for a very cold neutron source for the second target station at SNS, Journal of Physics Conference Series 1021: (1) ((2018) ), 012083. |
[71] | R. Garoby et al., The European spallation source design, Physica Scripta 93: (1) ((2017) ), 014001. doi:10.1088/1402-4896/aa9bff. |
[72] | P. Giannozzi, S. Baroni and N. Bonini et al., QUANTUM ESPRESSO: A modular and open-source software project for quantum simulations of materials, J. Phys.: Condens. Matter 21: (39) ((2009) ), 395502. |
[73] | S. Goedecker and M. Teter, Separable dual-space Gaussian pseudopotentials, Phys. Rev. B 54: ((1996) ), 1703. doi:10.1103/PhysRevB.54.1703. |
[74] | R. Golub, On the storage of neutrons in superfluid 4He, Physics Letters A 72: (4–5) ((1979) ), 387–390. doi:10.1016/0375-9601(79)90505-X. |
[75] | R. Golub, C. Jewell, P. Ageron, W. Mampe and B. Heckel, Operation of a superthermal ultra-cold neutron source and the storage of ultra-cold neutrons in superfluid Helium-4, Z. Phys. B 51: ((1983) ), 187–193. doi:10.1007/BF01307673. |
[76] | R. Golub and J.M. Pendlebury, The electric dipole moment of the neutron, Contemporary Physics 13: (6) ((1972) ), 519–558. doi:10.1080/00107517208228016. |
[77] | R. Golub and J.M. Pendlebury, Super-thermal sources of ultra-cold neutrons, Physics Letters A 53: (2) ((1975) ), 133–135. doi:10.1016/0375-9601(75)90500-9. |
[78] | J. Goorley, M. James et al., Initial MCNP6 release overview, Technical report LA-UR-13-22934, Los Alamos National Laboratory, (2013) . |
[79] | T. Goorley, M. James, T. Booth, F. Brown, J. Bull, L. Cox, J. Durkee, J. Elson, M. Fensin, R. Forster, J. Hendricks, H. Hughes, R. Johns, B. Kiedrowski, R. Martz, S. Mashnik, G. Mckinney, D. Pelowitz, R. Prael and T. Zukaitis, Initial mcnp6 release overview. mcnp6 version 0.1, Nuclear technology 180: ((2012) ), 298–315. |
[80] | J.R. Granada, Neutron scattering kernel for solid deuterium, Europhysics Letters 86: (6) ((2009) ), 66007. doi:10.1209/0295-5075/86/66007. |
[81] | J.R. Granada, F. Cantargi and J.I.M. Damian, Neutron cross sections libraries for methane in phase II and solid deuterium, J. Korean Phys. Soc 59: ((2011) ), 1076. doi:10.3938/jkps.59.1076. |
[82] | J.R. Granada, J.I.M. Damian, J. Dawidowski, J.I. Robledo, C. Helman, G. Romanelli and G. Škoro, Development of neutron scattering kernels for cold neutron reflector materials, Journal of Neutron Research 23: (2–3) ((2021) ), 167–177. doi:10.3233/JNR-210013. |
[83] | J.R. Granada, J.I.M. Damián and C. Helman, Studies on reflector materials for cold neutrons, EPJ Web of Conferences 231: ((2020) ), 04002, Publisher: EDP Sciences. |
[84] | J.R. Granada, D.D. DiJulio, J.I.M. Damian and G. Muhrer, Nuclear Instruments and Methods in Physics Research Section A: Accelerators, Spectrometers, Detectors and Associated Equipment 1053: ((2023) ), 168284. doi:10.1016/j.nima.2023.168284. |
[85] | R. Granada, D.D. DiJulio, J.I.M. Damian and G. Muhrer, Neutron scattering kernel for superfluid he-4, in: ICNS 2022 – International Conference on Neutron Scattering, Buenos Aires, Argentina, (2022) . |
[86] | S. Grimme, Semiempirical gga-type density functional constructed with a long-range dispersion correction, J. Comp. Chem. 27: ((2006) ), 1787. doi:10.1002/jcc.20495. |
[87] | S. Grimme, J. Antony, S. Ehrlich and H. Krieg, A consistent and accurate ab initio parametrization of density functional dispersion correction (DFT-D) for the 94 elements H-Pu, J. Chem. Phys. 132: ((2010) ). |
[88] | M. Herman, A. Trkov et al., ENDF-6 formats manual, Brookhaven National Laboratory, (2009) . |
[89] | B. Hess, C. Kutzner, D. van der Spoel and E. Lindahl, J. Chem. Theory Comput. 4: ((2008) ), 435. doi:10.1021/ct700301q. |
[90] | M. Huerta Parajon, E. Abad and F.J. Bermejo, A review of the cold neutron moderator materials: Neutronic performance and radiation effects, Physics Procedia 60: ((2014) ), 74. doi:10.1016/j.phpro.2014.11.012. |
[91] | D.S. Hussey, M. Abir, J.C. Cook, D.L. Jacobson, J.M. LaManna, K. Kilaru, B.D. Ramsey and B. Khaykovich, Design of a neutron microscope based on wolter mirrors, Nuclear Instruments and Methods in Physics Research Section A: Accelerators, Spectrometers, Detectors and Associated Equipment 987: ((2021) ), 164813. doi:10.1016/j.nima.2020.164813. |
[92] | C. Hutter, D. Büchi, V. Zuber and P. Rudolf von Rohr, Heat transfer in metal foams and designed porous media, Chemical Engineering Science 66: (17) ((2011) ), 3806–3814. doi:10.1016/j.ces.2011.05.005. |
[93] | M. Inagaki, Y. Kaburagi and Y. Hishiyama, Thermal management material: Graphite, Advanced Engineering Materials 16: (5) ((2014) ), 494–506. doi:10.1002/adem.201300418. |
[94] | Inc Ansys, ANSYS CFX-Solver Theory Guide, 2023r2 edn, Canonsberg, PA, (2023) . |
[95] | International Evaluation Collaboration, Thermal scattering law S(a, b): Measurement, evaluation and application, (2020) , https://www.oecd-nea.org/jcms/pl_23901/international-evaluation-co-operation-volume-42. |
[96] | E.B. Iverson and J.M. Carpenter, Kinetics of Irradiated Liquid Hydrogen, H. Conrad, ed., (2004) , pp. 236. |
[97] | O. Iwamoto et al., Japanese evaluated nuclear data library version 5: Jendl-5, Journal of Nuclear Science and Technology 60: ((2023) ), 1–60. doi:10.1080/00223131.2022.2141903. |
[98] | JAHM Software, Inc, Material properties database MPDB v7.91, North Reading, USA. |
[99] | A. Jain, S.P. Ong, G. Hautier, W. Chen, W.D. Richards, S. Dacek, S. Cholia, D. Gunter, D. Skinner, G. Ceder and K.A. Persson, Commentary: The materials project: A materials genome approach to accelerating materials innovation, APL Materials 1: (1) ((2013) ), 011002. doi:10.1063/1.4812323. |
[100] | M. Jamalipour, L. Zanini, E.B. Klinkby, G. Gorini and P.K. Willendrup, Improved beam extraction at compact neutron sources using diamonds nanoparticles and supermirrors, EPJ Web Conf. 1033: ((2022) ), 166719. |
[101] | A.H. Khalid, M.H. Ismail, H.B.A. Kasim, H.F. Pahroraji, M.A.B. Zainol and A.M.B.M. Azaiauddin, Heat conductivity and permeability of aluminium foam, IOP Conference Series: Materials Science and Engineering 834: (1) ((2020) ), 012029. doi:10.1088/1757-899X/834/1/012029. |
[102] | M. Kida, J. Yoneda, A. Masui, Y. Konno, Y. Jin and J. Nagao, Mechanical properties of polycrystalline tetrahydrofuran hydrates as analogs for massive natural gas hydrates, Journal of Natural Gas Science and Engineering 96: ((2021) ), 104284. doi:10.1016/j.jngse.2021.104284. |
[103] | T. Kittelmann and X.-X. Cai, Elastic neutron scattering models for ncrystal, Computer Physics Communications 267: ((2021) ), 108082. doi:10.1016/j.cpc.2021.108082. |
[104] | T. Kittelmann, E. Klinkby, E.B. Knudsen, P. Willendrup, X.X. Cai and K.K. Kanaki, Monte Carlo Particle Lists: MCPL, MCPL. Comput. Phys. Commun. 218: ((2017) ), 17–42. doi:10.1016/j.cpc.2017.04.012. |
[105] | A.G. Klein and A. Zeilinger, Wave optics with cold neutrons, Journal de Physique Colloques 45: (C3) ((1984) ), 239–242. |
[106] | W.H. Kleiner, Magnetic scattering of slow neutrons from |
[107] | J. Klepp, C. Pruner, Y. Tomita, C. Plonka-Spehr, P. Geltenbort, S. Ivanov, G. Manzin, K.H. Andersen, J. Kohlbrecher, M.A. Ellabban and M. Fally, Diffraction of slow neutrons by holographic sio2 nanoparticle-polymer composite gratings, Phys. Rev. A 84: ((2011) ), 013621. doi:10.1103/PhysRevA.84.013621. |
[108] | J.W. Klett, The role of precursor modification on the production of graphite foam, Carbon 144: ((2019) ), 43–54. doi:10.1016/j.carbon.2018.11.046. |
[109] | J.W. Klett, A.D. McMillan, N.C. Gallego and C.A. Walls, The role of structure on the thermal properties of graphitic foams, Journal of Materials Science 39: (11) ((2004) ), 3659–3676. doi:10.1023/B:JMSC.0000030719.80262.f8. |
[110] | E. Klinkby, K. Batkov, F. Mezei, T. Schønfeldt, A. Takibayev and L. Zanini, Voluminous d2 source for intense cold neutron beam production at the ess, (2014) . |
[111] | E. Korobkina, I. Berkutov, R. Golub, P. Huffman, C. Hickman, K. Leung, G. Medlin, M.J. Morano, T. Rao, C. Teander, C. White and A.R. Young, Growing solid deuterium for UCN production, Journal of Neutron Research 24: (2) ((2022) ), 179–191, Publisher: IOS Press. |
[112] | E. Korobkina, R. Golub, B.W. Wehring and A.R. Young, Production of UCN by downscattering in superfluid He4, Physics Letters A 301: , 462–469. |
[113] | A. Kubec, M.-C. Zdora, U.T. Sanli, A. Diaz, J. Vila-Comamala and C. David, An achromatic X-ray lens, Nature Communications 13: (1) ((2022) ), 1305, Publisher: Nature Publishing Group. |
[114] | V. Laliena, M.Á. Vicente-Álvarez and J. Campo, Monte Carlo simulation of neutron scattering by a textured polycrystal, Journal of Applied Crystallography 53: (2) ((2020) ), 512–529. doi:10.1107/S1600576720002290. |
[115] | C.M. Lavelle, C.-Y. Liu, W. Fox, G. Manus, P.M. McChesney, D.J. Salvat, Y. Shin, M. Makela, C. Morris, A. Saunders et al., Ultracold-neutron production in a pulsed-neutron beam line, Physical Review C 82: (1) ((2010) ), 015502. doi:10.1103/PhysRevC.82.015502. |
[116] | K. Lefmann and K. Nielsen, Mcstas, a general software package for neutron ray-tracing simulations, Neutron News 10: (3) ((1999) ), 20–23. doi:10.1080/10448639908233684. |
[117] | A. Lenz and L. Ojamäe, Structures of the I-, II- and H-methane clathrates and the ice-methane clathrate phase transition from quantum-chemical modeling with force-field thermal corrections, The Journal of Physical Chemistry A 115: (23) ((2011) ), 6169. doi:10.1021/jp111328v. |
[118] | A. Lerf, H. He, M. Forster and J. Klinowski, Structure of graphite oxide revisited, J. Phys. Chem. B 102: ((1998) ), 4477. doi:10.1021/jp9731821. |
[119] | C.-Y. Liu and A.R. Young, Ultra-cold neutron production in anti-ferromagnetic oxygen solid, arXiv: Nuclear theory, (2004) . |
[120] | C.-Y. Liu, A.R. Young and S.K. Lamoreaux, Ultracold neutron upscattering rates in a molecular deuterium crystal, Physical Review B 62: (6) ((2000) ), R3581–R3583, Publisher: American Physical Society. |
[121] | C.-Y. Liu, A.R. Young, C.M. Lavelle and D. Salvat, Coherent neutron scattering in polycrystalline deuterium and its implications for ultracold neutron production, arXiv preprint arXiv:1005.1016, (2010) . |
[122] | V.I. Lushchikov, Y.N. Pokotilovskii, A.V. Strelkov and F.L. Shapiro, Observation of ultracold neutrons, JETP Lett. (USSR) (Engl. Transl.), 9: 23-6(Jan. 5, 1969) ((1969) ). |
[123] | R. Macfarlane, D.W. Muir, R.M. Boicourt, A.C. Kahler III and J.L. Conlin, The NJOY nuclear data processing system, version 2016, Technical report, Los Alamos National Lab. (LANL), Los Alamos, NM (United States), (2017) . |
[124] | F. Malamud, J.R. Santisteban, M.A. Vicente Alvarez, R. Bolmaro, J. Kelleher, S. Kabra and W. Kockelmann, Texture analysis with a time-of-flight neutron strain scanner, Journal of Applied Crystallography 47: (4) ((2014) ), 1337–1354. doi:10.1107/S1600576714012710. |
[125] | Mantid, Manipulation and analysis toolkit for instrument data, mantid project, (2013) . doi:10.5286/SOFTWARE/MANTID. |
[126] | E.D. Marquardt, J.P. Le and R. Radebaugh, Cryogenic Material Properties Database, Springer US, Boston, MA, (2002) , pp. 681–687. |
[127] | H. Matsubara, G. Kikugawa, T. Bessho and T. Ohara, Evaluation of thermal conductivity and its structural dependence of a single nanodiamond using molecular dynamics simulation, Diamond and Related Materials 102: ((2020) ), 107669. doi:10.1016/j.diamond.2019.107669. |
[128] | M. Mermoux, Y. Chabre and A. Rousseau, FTIR and 13C NMR study of graphite oxide, Carbon 29: ((1991) ), 469. doi:10.1016/0008-6223(91)90216-6. |
[129] | D.F.R. Mildner, Resolution of small-angle neutron scattering with a reflective focusing optic, Journal of Applied Crystallography 47: (4) ((2014) ), 1247–1251. doi:10.1107/S1600576714011364. |
[130] | D.F.R. Mildner and M.V. Gubarev, Wolter optics for neutron focusing, in: Nuclear Instruments and Methods in Physics Research Section A: Accelerators, Spectrometers, Detectors and Associated Equipment, Vol. 634: , Proceedings of the International Workshop on Neutron Optics NOP2010, (2011) , pp. S7–S11. |
[131] | V.N. Mochalin, O. Shenderova, D. Ho and Y. Gogotsi, The properties and applications of nanodiamonds, Nature Nanotechnology 7: (11) ((2011) ). |
[132] | M. Moeini Sedeh and J.M. Khodadadi, Thermal conductivity improvement of phase change materials/graphite foam composites, Carbon 60: ((2013) ), 117–128. doi:10.1016/j.carbon.2013.04.004. |
[133] | M. Morgano, S. Peetermans, E.H. Lehmann, T. Panzner and U. Filges, Neutron imaging options at the boa beamline at Paul Scherrer Institut, Nuclear Instruments and Methods in Physics Research Section A: Accelerators, Spectrometers, Detectors and Associated Equipment 754: ((2014) ), 46–56. doi:10.1016/j.nima.2014.03.055. |
[134] | C.L. Morris, J.M. Anaya, T.J. Bowles, B.W. Filippone, P. Geltenbort, R.E. Hill, M. Hino, S. Hoedl, G.E. Hogan, T.M. Ito, T. Kawai, K. Kirch, S.K. Lamoreaux, C.-Y. Liu, M. Makela, L.J. Marek, J.W. Martin, R.N. Mortensen, A. Pichlmaier, A. Saunders, S.J. Seestrom, D. Smith, W. Teasdale, B. Tipton, M. Utsuro, A.R. Young and J. Yuan, Measurements of ultracold-neutron lifetimes in solid deuterium, Physical Review Letters 89: (27) ((2002) ), 272501. doi:10.1103/PhysRevLett.89.272501. |
[135] | T. Murata, H. Ishibuchi et al., Moga: Multi-objective genetic algorithms, in: IEEE International Conference on Evolutionary Computation, Vol. 1: , IEEE, Piscataway, (1995) , pp. 289–294. |
[136] | NCrystal development team, Announcement release 2.7.0, https://github.com/mctools/ncrystal/wiki/Announcement-Release2.7.0. |
[137] | NCrystal development team, CHANGELOG, https://github.com/mctools/ncrystal/blob/master/CHANGELOG. |
[138] | NCrystal development team, Forks, https://github.com/mctools/ncplugin-template/network/members. |
[139] | NCrystal development team, NCrystal plugins, https://github.com/mctools/ncrystal/wiki/Plugins. |
[140] | NCrystal development team, https://github.com/mctools/ncrystal/wiki/PluginsDevelopment. |
[141] | V. Nesvizhevsky, Why very cold neutrons could be useful for neutron-antineutron oscillation searches, Journal of Neutron Research 24: (2) ((2022) ), 223–227, Publisher: IOS Press. |
[142] | V. Nesvizhevsky, H. Börner, A. Petukhov et al., Quantum states of neutrons in the Earth’s gravitational field, Nature 415: ((2002) ), 297–299. doi:10.1038/415297a. |
[143] | V. Nesvizhevsky, U. Köster, M. Dubois, N. Batisse, L. Frezet, A. Bosak, L. Gines and O. Williams, Fluorinated nanodiamonds as unique neutron reflector, Carbon 130: ((2018) ), 799–805. doi:10.1016/j.carbon.2018.01.086. |
[144] | V.V. Nesvizhevsky, E.V. Lychagin, A.Y. Muzychka, A.V. Strelkov, G. Pignol and K.V. Protasov, The reflection of very cold neutrons from diamond powder nanoparticles, Nuclear Instruments and Methods in Physics Research Section A: Accelerators, Spectrometers, Detectors and Associated Equipment 595: (3) ((2008) ), 631–636. doi:10.1016/j.nima.2008.07.149. |
[145] | J.S. Nico, M.S. Dewey, D.M. Gilliam, F.E. Wietfeldt, X. Fei, W.M. Snow, G.L. Greene, J. Pauwels, R. Eykens, A. Lamberty, J. Van Gestel and R.D. Scott, Measurement of the neutron lifetime by counting trapped protons in a cold neutron beam, Phys. Rev. C 71: ((2005) ), 055502. doi:10.1103/PhysRevC.71.055502. |
[146] | N. Ohba, K. Miwa, T. Noritake and A. Fukumoto, First-principlin.es study on thermal vibration effects of MgH2, Phys. Rev. B 70: ((2004) ), 035102. doi:10.1103/PhysRevB.70.035102. |
[147] | J. Ollivier, M. Zbiri and J. Halbwachs, Instrument layout: Disk chopper time-of-flight spectrometer IN5, https://www.ill.eu/users/instruments/instruments-list/in5. |
[148] | S.P. Ong, S. Cholia, A. Jain, M. Brafman, D. Gunter, G. Ceder and K.A. Persson, The materials application programming interface (API): A simple, flexible and efficient API for materials data based on REpresentational state transfer (REST) principles, Computational Materials Science 97: ((2015) ), 209–215. doi:10.1016/j.commatsci.2014.10.037. |
[149] | S.P. Ong, W.D. Richards, A. Jain, G. Hautier, M. Kocher, S. Cholia, D. Gunter, V.L. Chevrier, K.A. Persson and G. Ceder, Python materials genomics (pymatgen): A robust, open-source python library for materials analysis, Computational Materials Science 68: ((2013) ), 314–319. doi:10.1016/j.commatsci.2012.10.028. |
[150] | F. Ott, Opportunities in the use of very cold neutrons in reflectometry techniques, Journal of Neutron Research 24: , 211–221. doi:10.3233/JNR-220004. |
[151] | B. Parveez, N.A. Jamal, H. Anuar, Y. Ahmad, A. Aabid and M. Baig, Microstructure and mechanical properties of metal foams fabricated via melt foaming and powder metallurgy technique: A review, Materials 15: (15) ((2022) ). |
[152] | S. Paul, The puzzle of neutron lifetime, Nuclear Instruments and Methods in Physics Research Section A: Accelerators, Spectrometers, Detectors and Associated Equipment 611: (2–3) ((2009) ), 157–166. doi:10.1016/j.nima.2009.07.095. |
[153] | PDG, History plots, (2023) , https://pdg.lbl.gov/2023/reviews/rpp2022-rev-history-plots.pdf. |
[154] | J.P. Perdew, K. Burke and M. Ernzerhof, Generalized gradient approximation made simple, Phys. Rev. Lett 77: ((1996) ), 3865. doi:10.1103/PhysRevLett.77.3865. |
[155] | F.M. Piegsa, New concept for a neutron electric dipole moment search using a pulsed beam, Phys. Rev. C 88: ((2013) ), 045502. doi:10.1103/PhysRevC.88.045502. |
[156] | F.M. Piegsa, Novel concept for a neutron electric charge measurement using a Talbot–Lau interferometer at a pulsed source, Phys. Rev. C 98: ((2018) ), 045503. doi:10.1103/PhysRevC.98.045503. |
[157] | F.M. Piegsa and G. Pignol, Limits on the axial coupling constant of new light bosons, Physical Review Letters 108: (18) ((2012) ), 181801. doi:10.1103/PhysRevLett.108.181801. |
[158] | A.J.M. Plompen et al., The joint evaluated fission and fusion nuclear data library, jeff-3.3, Eur. Phys. J. A 56: ((2020) ), 181. |
[159] | Z. Qiao, J. Li, N. Zhao, C. Shi and P. Nash, Graphitization and microstructure transformation of nanodiamond to onion-like carbon, Scripta Materialia 54: ((2006) ), 225. doi:10.1016/j.scriptamat.2005.09.037. |
[160] | K. Ramic, J.I.M. Damian, D.D. Di Julio, D. Campi, M. Bernasconi, G. Gorini and V. Santoro, NJOY + NCrystal: An open-source tool for creating thermal neutron scattering libraries, (2021) . |
[161] | K. Ramić, J.I.M. Damian, T. Kittelmann, D.D. Di Julio, D. Campi, M. Bernasconi, G. Gorini and V. Santoro, NJOY + NCrystal: An open-source tool for creating thermal neutron scattering libraries with mixed elastic support, Nuclear Instruments and Methods in Physics Research Section A: Accelerators, Spectrometers, Detectors and Associated Equipment 1027: ((2022) ), 166227. doi:10.1016/j.nima.2021.166227. |
[162] | H. Rauch and S.A. Werner, Neutron Interferometry: Lessons in Experimental Quantum Mechanics, Wave–Particle Duality, and Entanglement, 2nd edn, Oxford University Press, Oxford, (2015) . |
[163] | Ray Technicques Ltd, Commercial nanodiamonds, https://nanodiamond.co.il/ (online; accessed 17-September-2023). |
[164] | B. Renker, G. Roth, H. Schober, P. Nagel, R. Lortz, C. Meingast, D. Ernst, M.T. Fernandez-Diaz and M. Koza, Intercalation of molecular gases into |
[165] | I. Rienäcker, Improving ultracold neutron yields and the search for mirror neutrons at the PSI UCN source, Doctoral thesis, ETH, Zurich, Zurich, (2022) . |
[166] | N. Rizzi, J.I.M. Damian, T. Kittelmann, B. Lauritzen, E. Klinkby, Q. Estiez and V. Santoro, Benchmarking of the ncrystal sans plugin for nanodiamonds, Nuclear Science and Engineering 0: (0) ((2023) ), 1–9. |
[167] | H.M. Roder, G.E. Childs, R.D. McCarty and P.E. Angerhofer, Survey of the Properties of the Hydrogen Isotopes Below Their Critical Temperatures, Vol. 8: , (1973) . |
[168] | P.K. Romano, N.E. Horelik, B.R. Herman, A.G. Nelson, B. Forget and K. Smith, OpenMC: A state-of-the-art Monte Carlo code for research and development, Annals of Nuclear Energy 82: ((2015) ), 90–97. doi:10.1016/j.anucene.2014.07.048. |
[169] | P. Rowe, V.L. Deringer, P. Gasparotto and G. Csany, An accurate and transferable machine learning potential for carbon, J. Chem. Phys. 153: ((2020) ), 034702. doi:10.1063/5.0005084. |
[170] | J.R. Santisteban, M.A. Vicente-Alvarez, P. Vizcaino, A.D. Banchik, S.C. Vogel, A.S. Tremsin, J.V. Vallerga, J.B. McPhate, E. Lehmann and W. Kockelmann, Texture imaging of zirconium based components by total neutron cross-section experiments, Journal of Nuclear Materials 425: (1) ((2012) ), 218–227. |
[171] | V. Santoro, K.H. Andersen, P. Bentley, M. Bernasconi, M. Bertelsen, Y. Beßler, A. Bianchi, T. Brys, D. Campi, A. Chambon, V. Czamler, D.D. Di Julio, E. Dian, K. Dunne, M.J. Ferreira, P. Fierlinger, U. Friman-Gayer, B.T. Folsom, A. Gaye, G. Gorini, C. Happe, M. Holl, Y. Kamyshkov, T. Kittelmann, E.B. Klinkby, R. Kolevatov, S.I. Laporte, B. Lauritzen, J.I.M. Damian, B. Meirose, F. Mezei, D. Milstead, G. Muhrer, V. Neshvizhevsky, B. Rataj, N. Rizzi, L. Rosta, S. Samothrakitis, H. Schober, J.R. Selknaes, S. Silverstein, M. Strobl, M. Strothmann, A. Takibayev, R. Wagner, P. Willendrup, S. Xu, S.C. Yiu, L. Zanini and O. Zimmer, The highness project at the European Spallation Source: Current status and future perspectives, Nuclear Science and Engineering 0: (0) ((2023) ), 1–33. |
[172] | V. Santoro, K.H. Andersen, D.D. DiJulio, E.B. Klinkby, T.M. Miller, D. Milstead, G. Muhrer, M. Strobl, A. Takibayev, L. Zanini et al., Development of high intensity neutron source at the European Spallation Source, Journal of Neutron Research 22: (2–3) ((2020) ), 209–219. doi:10.3233/JNR-200159. |
[173] | V. Santoro, M. Strobl, L. Zanini and O. Zimmer, Workshop on very cold and ultra cold neutron sources for ess, Journal of Neutron Research ((2022) ), 73–75. |
[174] | H. Sato, T. Kamiyama and Y. Kiyanagi, A rietveld-type analysis code for pulsed neutron Bragg-edge transmission imaging and quantitative evaluation of texture and microstructure of a welded α-iron plate, MATERIALS TRANSACTIONS 52: (6) ((2011) ), 1294–1302. doi:10.2320/matertrans.M2010328. |
[175] | T. Sato, Y. Iwamoto, S. Hashimoto, T. Ogawa, T. Furuta, S.I. Abe, T. Kai, P.-E. Tsai, N. Matsuda, H. Iwase, N. Shigyo, L. Sihver and K. Niita, Features of particle and heavy ion transport code system (phits) version 3.02, Journal of Nuclear Science and Technology 55: (6) ((2018) ), 684–690. doi:10.1080/00223131.2017.1419890. |
[176] | H.G. Schimmel, M.R. Johnson, G.J. Kearley, A.J. Ramirez-Cuesta, J. Huot and F.M. Mulder, The vibrational spectrum of magnesium hydride from inelastic neutron scattering and density functional theory, Mat. Sci. and Eng. B 108: ((2004) ), 38. doi:10.1016/j.mseb.2003.10.035. |
[177] | P. Schmidt-Wellenburg, K.H. Andersen and O. Zimmer, Ultra cold neutron production by multiphonon processes in superfluid helium under pressure, Nuclear Instruments and Methods in Physics Research Section A: Accelerators, Spectrometers, Detectors and Associated Equipment 611: (2) ((2009) ), 259–262. |
[178] | P. Schmidt-Wellenburg, J. Bossy, E. Farhi, M. Fertl, K.K.H. Leung, A. Rahli, T. Soldner and O. Zimmer, Experimental study of ultracold neutron production in pressurized superfluid helium, 92(2):024004. |
[179] | H. Schober, H. Itoh, A. Klapproth, V. Chihaia and W.F. Kuhs, Guest–host coupling and anharmonicity in clathrate hydrates, The European Physical Journal E 12: (1) ((2003) ), 41–49. doi:10.1140/epje/i2003-10026-6. |
[180] | A. Serebrov and V. Lyamkin, Development of UCN sources at PNPI, Journal of Neutron Research 24: ((2022) ), 145–166. doi:10.3233/JNR-220007. |
[181] | A. Serebrov and V. Lyamkin, Development of UCN sources at PNPI, Journal of Neutron Research 24: (2) ((2023) ), 145–166. doi:10.3233/JNR-220007. |
[182] | A. Serebrov, V. Mityukhlyaev, A. Zakharov, A. Kharitonov, V. Shustov, V. Kuz’minov, M. Lasakov, R. Tal’daev, A. Aldushchenkov, V. Varlamov, A. Vasil’ev, M. Sazhin, G. Greene, T. Bowles, R. Hill, S. Seestrom and P. Geltenbort, Studies of a solid-deuterium source for ultra-cold neutrons, Nuclear Instruments and Methods in Physics Research Section A: Accelerators, Spectrometers, Detectors and Associated Equipment 440: (3) ((2000) ), 658–665. doi:10.1016/S0168-9002(99)01058-X. |
[183] | F.L. Shapiro, Electric dipole moments of elementary particles, Soviet Physics Uspekhi 11: (3) ((1968) ), 345. doi:10.1070/PU1968v011n03ABEH003840. |
[184] | SHARP+ cold neutron time-focussing time-of-flight spectrometer, https://www.ill.eu/users/instruments/instruments-list/sharp/characteristics (accessed: 2023-03-10). |
[185] | Y. Shin, W.M. Snow, C.Y. Liu, C.M. Lavelle and D.V. Baxter, Microscopic model for the neutron dynamic structure factor of solid methane in phase II, Nuclear Instruments and Methods in Physics Research Section A: Accelerators, Spectrometers, Detectors and Associated Equipment 620: (2) ((2010) ), 382–390. doi:10.1016/j.nima.2010.03.109. |
[186] | A.A. Shiryaev, V.B. Polyakov, S. Rols, A. Rivera and O. Shenderova, Inelastic neutron scattering: A novel approach towards determination of equilibrium isotopic fractionation factors. Size effects on heat capacity and beta-factor of diamond, Phys. Chem. Chem. Phys. 22: ((2020) ), 13261–13270. doi:10.1039/D0CP02032J. |
[187] | E.D. Sloan and C.A. Koh, Clathrate Hydrates of Natural Gases, 3rd edn, CRC Press, Taylor & Francis, Berkeley, California, (2008) . |
[188] | I. Souza, J. Iniguez and D. Vanderbilt, Phys. Rev. Lett. 89: ((2002) ), 117602. doi:10.1103/PhysRevLett.89.117602. |
[189] | A. Steyerl, Measurements of total cross sections for very slow neutrons with velocities from 100 m/sec to 5 m/sec, Physics Letters B 29: (1) ((1969) ), 33–35. doi:10.1016/0370-2693(69)90127-0. |
[190] | A. Steyerl, H. Nagel, F.-X. Schreiber, K.-A. Steinhauser, R. Gähler, W. Gläser, P. Ageron, J.M. Astruc, W. Drexel, G. Gervais and W. Mampe, A new source of cold and ultracold neutrons, Physics Letters A 116: (7) ((1986) ), 347–352. doi:10.1016/0375-9601(86)90587-6. |
[191] | S.J. Stuart, A.B. Tutein and J.A. Harrison, A reactive potential for hydrocarbons with intermolecular interactions, J. Chem. Phys. 112: ((2000) ), 6472. doi:10.1063/1.481208. |
[192] | T. Szabó, O. Berkesi, P. Forgó, K. Josepovits, Y. Sanakis, D. Petridis and I. Deékány, Evolution of surface functional groups in a series of progressively oxidized graphite oxides, Chem. Mater. 18: ((2006) ), 2740. doi:10.1021/cm060258+. |
[193] | A. Szakál, Out-of-pile moderator test facility at the Budapest Neutron Centre, in: International Conference on Neutron Scattering (ICNS 2022), Buenos Aires, Argentina, (2022) . |
[194] | I. Tanaka, Refining technology and low temperature properties for high purity aluminium, (2013) . |
[195] | M. Teshigawara, Y. Tsuchikawa, G. Ichikawa, S. Takata, K. Mishima, M. Harada, M. Ooi, Y. Kawamura, T. Kai, S. Ohira-Kawamura et al., Measurement of neutron scattering cross section of nano-diamond with particle diameter of approximately 5 nm in energy range of 0.2 mev to 100 mev, Nuclear Instruments and Methods in Physics Research Section A: Accelerators, Spectrometers, Detectors and Associated Equipment 929: ((2019) ), 113–120. doi:10.1016/j.nima.2019.03.038. |
[196] | A. Togo, Phonon database at Kyoto University, (2015) , http://phonondb.mtl.kyoto-u.ac.jp/ (online). |
[197] | A. Togo and I. Tanaka, First principles phonon calculations in materials science, Scripta Materialia 108: ((2015) ), 1–5. doi:10.1016/j.scriptamat.2015.07.021. |
[198] | Y.S. Touloukian, 1(thermal conductivity-metallic elements and alloys)and 4(specific heat-metallic elements and alloys), in: Thermophysical Properties of Matter, (1970) . |
[199] | R. Tran, Z. Xu, D. Radhakrishnan, B. Winston, W. Sun, K.A. Persson and S.P. Ong, Surface energies of elemental crystals, Scientific Data 3: ((2013) ), 160080. doi:10.1038/sdata.2016.80. |
[200] | C. Uher, Thermal conductivity of several exfoliated graphites from 2 k to 300 k, Cryogenics 20: ((1980) ), 445–447. doi:10.1016/0011-2275(80)90075-2. |
[201] | G. van der Zouw, M. Weber, J. Felber, R. Gähler, P. Geltenbort and A. Zeilinger, Aharonov–Bohm and gravity experiments with the very-cold-neutron interferometer, Nuclear Instruments and Methods in Physics Research Section A 440: (3) ((2000) ), 568–574. doi:10.1016/S0168-9002(99)01038-4. |
[202] | D. Vanderbilt, Soft self-consistent pseudopotentials in a generalized eigenvalue formalism, Phys. Rev. B 41: ((1990) ), 7892–7895. doi:10.1103/PhysRevB.41.7892. |
[203] | J. VandeVondele, M. Krack, F. Mohamed, M. Parrinello, T. Chassaing and J.H. Quickstep, Fast and accurate density functional calculations using a mixed Gaussian and plane waves approach, Comput. Phys. Commun. 167: ((2005) ), 103. doi:10.1016/j.cpc.2004.12.014. |
[204] | O.O. Vasiliev, V.B. Muratov, L.M. Kulikov, V.V. Garbuz and T.I. Duda, Special features of the heat capacity of detonation nanocrystalline diamond, Journal of Superhard Materials 37: ((2015) ), 388. doi:10.3103/S1063457615060039. |
[205] | V.V. Vladimirskii, Magnetic mirrors, channels and bottles for cold neutrons, Zhur. Eksptl’. i Teoret Fiz. 39: ((1960) ). |
[206] | R. Wagner, J. Barrow, C. Bohm, G. Brooijmans, H. Calen, J. Cederkäll, J. Collin, K. Dunne, L. Eklund, P. Fierlinger, U. Friman-Gayer, M. Frost, M. Holl, T. Johansson, Y. Kamyshkov, E. Klinkby, A. Kupsc, B. Meirose, D. Milstead, A. Nepomuceno, T. Nilsson, A. Oskarsson, H. Perrey, B. Rataj, N. Rizzi, V. Santoro, S. Silverstein, A. Takibayev, M. Wolke, S.C. Yiu, A.R. Young, L. Zanini and O. Zimmer, Design of an optimized nested-mirror neutron reflector for a NNBAR experiment, Nuclear Instruments and Methods in Physics Research Section A: Accelerators, Spectrometers, Detectors and Associated Equipment 1051: ((2023) ), 168235. doi:10.1016/j.nima.2023.168235. |
[207] | J. Wang, R.M. Wolf, J.W. Caldwell, P.A. Kollman and D.A. Case, J. Comp. Chem. 25: ((2004) ), 1157. doi:10.1002/jcc.20035. |
[208] | Z. Weng, X. Xu, B. Yang, K. Gu, L. Chen and J. Wang, Cryogenic thermal conductivity of 7050 aluminum alloy subjected to different heat treatments, Cryogenics 116: ((2021) ), 103305. doi:10.1016/j.cryogenics.2021.103305. |
[209] | C.J. Werner, J.S. Bull, C.J. Solomon, F.B. Brown, G.W. McKinney, M.E. Rising et al., MCNP version 6.2 release notes, 2 2018. |
[210] | H. Wolter, Spiegelsysteme streifenden einfalls als abbildende optiken für röntgenstrahlen, Annalen der Physik 445: (1–2) ((1952) ), 94–114. doi:10.1002/andp.19524450108. |
[211] | A.L. Woodcraft, Predicting the thermal conductivity of aluminium alloys in the cryogenic to room temperature range, Cryogenics 45: (6) ((2005) ), 421–431. doi:10.1016/j.cryogenics.2005.02.003. |
[212] | A.L. Woodcraft, M. Barucci, P.R. Hastings, L. Lolli, V. Martelli, L. Risegari and G. Ventura, Thermal conductivity measurements of pitch-bonded graphites at millikelvin temperatures: Finding a replacement for AGOT graphite, Cryogenics 49: (5) ((2009) ), 159–164. doi:10.1016/j.cryogenics.2008.10.024. |
[213] | S.I. Wright, Orientation texture, in: Encyclopedia of Condensed Matter Physics, F. Bassani, G.L. Liedl and P. Wyder, eds, Elsevier, Oxford, (2005) , pp. 221–233. doi:10.1016/B0-12-369401-9/00696-3. |
[214] | S. Xu, D.D. DiJulio, J.I.M. Damian, T. Kittelmann, B. Rataj, M. Bernasconi, D. Campi, O.A.E. Kheir, S.I. Laporte, G. Gorini and V. Santoro, Monte-carlo simulations of inelastic neutron magnetic scattering of oxygen molecules hosted in deuterated clathrate hydrates and fullerite c60, to be submitted for the journal, (2023) . |
[215] | S. Xu, S.I. Laporte, D.D. DiJulio, J.I.M. Damian, J.I. Kittelmann, M. Bernasconi, D. Campi, G. Gorini and V. Santoro, Theoretical calculations of neutron scattering cross sections for tetrahydrofuran-containing clathrate hydrates at low temperature, (2023) . |
[216] | S. Xu, G. Noguere, L. Desgranges and J.I.M. Damian, Atomic scale Monte-Carlo simulations of neutron diffraction experiments on stoichiometric uranium dioxide up to 1664 k, Nuclear Instruments and Methods in Physics Research Section A: Accelerators, Spectrometers, Detectors and Associated Equipment 1002: ((2021) ), 165251. doi:10.1016/j.nima.2021.165251. |
[217] | H. Ye, M. Ma and Q. Ni, An experimental study on mid-high temperature effective thermal conductivity of the closed-cell aluminum foam, Applied Thermal Engineering 77: ((2015) ), 127–133. doi:10.1016/j.applthermaleng.2014.12.029. |
[218] | A.T. Yue, M.S. Dewey, D.M. Gilliam, G.L. Greene, A.B. Laptev, J.S. Nico, W.M. Snow and F.E. Wietfeldt, Improved determination of the neutron lifetime, Phys. Rev. Lett. 111: ((2013) ), 222501. doi:10.1103/PhysRevLett.111.222501. |
[219] | P. Zakalek, J. Baggemann, J. Li, U. Rücker, J. Voigt, F. Löchte, R. Hanslik, Y. Bessler, R. Achten, B. Ottmann, M. Schmitt, E. Mauerhofer, K. Lieutenant, T. Gutberlet and T. Brückel, A flexible target station for Hi-CANS. International Symposium UCANS9, online by RIKEN, Japan (online event), 28 Mar 2022–31 Mar 2022, (2022) . |
[220] | P. Zakalek, T. Cronert, J. Baggemann, P.E. Doege, M. Rimmler, J. Voigt, E. Mauerhofer, U. Rücker, T. Gutberlet, H. Podlech et al., High-brilliance neutron source project, Journal of Physics: Conference Series 1401: ((2020) ), 012010, IOP Publishing. |
[221] | L. Zanini et al., Very cold and ultra cold neutron sources for ESS, Journal of Neutron Research 24: ((2022) ), 77–93. doi:10.3233/JNR-220040. |
[222] | L. Zanini, K.H. Andersen, K. Batkov, E.B. Klinkby, F. Mezei, T. Schönfeldt and A. Takibayev, Design of the cold and thermal neutron moderators for the European Spallation Source, Nuclear Instruments and Methods in Physics Research Section A: Accelerators, Spectrometers, Detectors and Associated Equipment 925: ((2019) ), 33–52. doi:10.1016/j.nima.2019.01.003. |
[223] | L. Zanini, K. Batkov, E. Klinkby, F. Mezei, T. Schönfeldt and A. Takibayev, The neutron moderators for the European Spallation Source, Journal of Physics: Conference Series 1021: (1) ((2018) ), 012066. |
[224] | L. Zanini, D. DiJulio, S. Kennedy, E. Klinkby and V. Santoro, Neutronic design of the bunker shielding for the European Spallation Source, Journal of Surface Investigation: X-ray, Synchrotron and Neutron Techniques 14: (1) ((2020) ), S251–S253. doi:10.1134/S1027451020070538. |
[225] | Y.B. Zeldovich, Storage of cold neutrons, JETP 9: ((1959) ), 1389. |
[226] | M. Zerkle, TSL mixed elastic scattering format, (2020) , https://indico.bnl.gov/event/7233/contributions/43822/. |
[227] | C. Zhang, X. Kong, X. Wang, Y. Du and G. Xiao, A predicting model for the effective thermal conductivity of anisotropic open-cell foam, Energies 15: (16) ((2022) ). |
[228] | L. Zhao, J. Tang, M. Zhou and K. Shen, A review of the coefficient of thermal expansion and thermal conductivity of graphite, New Carbon Materials 37: (3) ((2022) ), 544–555. doi:10.1016/S1872-5805(22)60603-6. |
[229] | O. Zimmer, Superfluid-helium ultracold neutron sources: Concepts for the European Spallation Source?, Physics Procedia 51: ((2014) ), 85–88. doi:10.1016/j.phpro.2013.12.019. |
[230] | O. Zimmer, Neutron conversion and cascaded cooling in paramagnetic systems for a high-flux source of very cold neutrons, Phys. Rev. C 93: ((2016) ), 035503. doi:10.1103/PhysRevC.93.035503. |
[231] | O. Zimmer, Multi-mirror imaging optics for low-loss transport of divergent neutron beams and tailored wavelength spectra, (2016) . |
[232] | O. Zimmer, Imaging nested-mirror assemblies – a new generation of neutron delivery systems?, Journal of Neutron Research 20: (4) ((2019) ), 91–98. doi:10.3233/JNR-190101. |
[233] | O. Zimmer et al., (2020) , https://doi.ill.fr/10.5291/ILL-DATA.1-10-42. |
[234] | O. Zimmer et al., (2021) , https://doi.ill.fr/10.5291/ILL-DATA.1-10-49. |
[235] | O. Zimmer et al., In-beam superfluid-helium ultracold neutron source for the ESS, Journal of Neutron Research 24: ((2022) ), 95–110. doi:10.3233/JNR-220045. |
[236] | O. Zimmer, N. Rizzi, V. Santoro, A. Takibayev, R. Wagner and L. Zanini, HighNESS deliverable 4.3: Report neutronic design of an in-beam UCN source, HighNESS Deliverable 4: (3) ((2023) ). |


