
Characterising the Genetic Landscape of Amyotrophic Lateral Sclerosis: A Catalogue and Assessment of Over 1,000 Published Genetic Variants
Abstract
Background:
Amyotrophic lateral sclerosis (ALS) is a fatal neurodegenerative disease with genetic and phenotypic heterogeneity. Pathogenic genetic variants remain the only validated cause of disease, the majority of which were discovered in familial ALS patients. While causal gene variants are a lesser contributor to sporadic ALS, an increasing number of risk alleles (low penetrance genetic variants associated with a small increase in disease risk) and variants of uncertain significance have been reported.
Objective:
To examine the pathogenic potential of genetic variation in ALS, we sought to characterise variant- and gene-level attributes of previously reported ALS-implicated variants.
Methods:
A list of 1,087 genetic variants reported in ALS to March 2021 was compiled through comprehensive literature review. Individual variants were annotated using in silico tools and databases across variant features including pathogenicity scores, localisation to protein domains, evolutionary conservation, and minor allele frequencies. Gene level attributes of genic tolerance, gene expression in ALS-relevant tissues and gene ontology terms were assessed for 33 ALS genes. Statistical analysis was performed for each characteristic, and we compared the most penetrant variants found in familial cases with risk alleles exclusive to sporadic cases, to explore genetic variant features that associate with disease penetrance.
Results:
We provide spreadsheet (hg19 and GRCh38) and variant call format (GRCh38) resources for all 1,087 reported ALS-implicated variants, including detailed summaries for each attribute. We demonstrate that the characteristics of variants found exclusively in sporadic ALS cases are less severe than those observed in familial ALS.
Conclusions:
We provide a comprehensive, literature-derived catalogue of genetic variation in ALS thus far and reveal crucial attributes that contribute to ALS pathogenicity. Our variant- and gene-level observations highlight the complexity of genetic variation in ALS, and we discuss important implications and considerations for novel variant interpretation.
INTRODUCTION
Amyotrophic lateral sclerosis (ALS) is a fatal neurodegenerative disease caused by the progressive degeneration of both upper and lower motor neurons, which leads to muscle weakness, wasting, spasticity and progressive paralysis, with death typically due to respiratory failure [1, 2]. ALS is phenotypically heterogenous with a median survival of approximately three years from disease onset [3, 4], although survival times vary from less than 12 months to over 20 years [5, 6]. Symptoms can onset in the limbs or bulbar musculature, or in rare cases, the trunk [1, 7], and may occur anywhere from 20 to 90 + years of age, though is most often seen in the sixth decade of life [6]. Significant co-morbidity with frontotemporal dementia (FTD) is evident among ALS cases, where around 13% meet diagnostic criteria, and up to 50% present with some level of cognitive or behavioural impairment [8].
A high degree of genetic heterogeneity is also evident in ALS. Historically, ALS cases have been classified as either familial (FALS, ∼10% of cases) or sporadic (SALS, ∼90% of cases) based on the presence or absence of a known family history of the disease [9]. With variable penetrance seen in familial ALS and variable effect sizes for risk alleles (low penetrance genetic variants associated with a small increase in disease risk), the distinction between familial and sporadic ALS is largely artificial. However, it is a widely accepted convention that is useful in clinical and research settings for informing familial disease risk and study design for gene discovery. Indeed, there exists a spectrum of ALS inheritance ranging from large, fully penetrant monogenic families, through smaller low-penetrance families and “apparently” sporadic cases, to truly sporadic cases. Heritability studies have demonstrated that all forms of ALS have a significant genetic component [10–13]. However, only ∼12% of all patients carry a known ALS-causing genetic variant and most remaining ALS cases have no known predisposition to disease [9].
The discovery of ALS genes has grown dramatically, with genetic variants in at least 33 genes now implicated in the disease. Traditional gene discovery efforts combined linkage analysis with candidate gene sequencing in large ALS families to identify highly penetrant causal variants in genes including SOD1[14], TARDBP [15] and FUS [16, 17]. An acceleration in ALS gene discovery then came in the 2010’s with the advent of next generation sequencing (NGS) technologies that facilitated the discovery of numerous ALS genetic variants in families, such as those in C9orf72 [18, 19], UBQLN2 [20, 21], OPTN [22], TBK1 [23, 24] and CCNF [25]. More recently, the growing affordability of whole-genome sequencing (WGS) has enabled larger-scale studies in SALS cohorts to identify risk genes, including NEK1 [26] and KIF5A [27]. Increasingly powerful NGS technologies, cohort sizes and genome data analysis techniques can detect previously elusive disease relevant variants but also unearth many variants of uncertain significance (VUS; [28]). Interpreting the disease relevance of VUS presents a major challenge and many variants initially reported to be potentially pathogenic are later reclassified as benign after additional evidence is accumulated [29–31]. Understanding the characteristics of ALS variants may assist with evaluating the potential pathogenicity of novel variants.
Here we present a comprehensive in silico assessment of 1,087 genetic variants reported in the literature to be implicated in ALS from July 1993 to March 2021 (as a reference tool, the reported genetic variants are provided here in a spreadsheet [Supplementary Data file 1, including literature references for each genetic variant] and variant call format (VCF) [Supplementary Data file 2]). We investigated key characteristics for these variants including pathogenicity scores, minor allele frequencies, localisation to protein domains and evolutionary conservation. We examined gene-level features including genic tolerance, gene expression in ALS relevant central nervous system tissues and gene ontology term associations. In depth analyses and summaries are provided for each of these features among ALS-implicated variants, providing a comprehensive overview of the ALS genetic landscape thus far.
MATERIALS AND METHODS
Comprehensive cataloguing of > 1,000 genetic variants reported in ALS
The present study extended our previously reported 853-genetic variant survey in McCann et al. (2020). The list of ALS genes (Supplementary Table S1) was updated to include the recently reported ALS/FTD gene CYLD [33] and an updated literature search was performed to include variants from publications published between February 2019 and March 2021. We aimed to compile a catalogue of ALS-implicated variants that included all genetic variants reported in the peer-reviewed literature with evidence that suggested a pathogenic role in ALS. In brief, a PubMed (https://www.ncbi.nlm.nih.gov/pubmed/) search was performed for each ALS gene name (Supplementary Table S1) and ‘amyotrophic lateral sclerosis’, with all resulting publications subsequently manually evaluated for reports of genetic variants identified in ALS patients. Criteria for inclusion of a variant in the reference list (Supplementary Data file 1) was a predicted effect on protein sequence (i.e., non-synonymous/missense, splicing, frameshift, and non-frameshift insertions/deletions) and naming within the main text of the publication (for example, variants included in an aggregate of variants used for burden testing were not added to the list). For each variant, supporting details including genomic location (hg19), transcript accession number, cDNA change and protein change were recorded, as well as case features of ancestry and mode of ALS inheritance. The University of California Santa Cruz (UCSC) Variant Annotation Integrator (http://genome.ucsc.edu/cgi-bin/hgVai) and the associated Human Genome Variation Society (HGVS) variant nomenclature track, were used to resolve any details missing from the original publication(s) or to correct variants not reported according to HGVS nomenclature (e.g., following the 3’ rule). Further, this approach was combined with manual interpretation of sequencing chromatograms from the original publication, and other reported features to correct genomic description inconsistencies such as nucleotide (e.g., forward vs reverse strand) and amino acid identity from the original publication(s).
To enhance usability of the assembled variant catalogue, variant coordinates were transformed from hg19 to GRCh38 using the VEP liftover web service and integrated into HGVS variant identifiers which were verified for consistency with the original hg19 HGVS identifiers using Mutalyzer v2.0.35 [34]. To obtain representations of the variants in VCF, the GRCh38 variant identifiers were used to generate synthetic error-free 150nt paired-end Illumina reads with mean fragment lengths of 380bp centred at the variant position. Synthetic reads were mapped with Burrows-Wheeler aligner [35, 36] (v 0.7.17-r1188) to the GRCh38 reference genome assembly. Variants were identified using the Genome Analysis Toolkit (v4.2.6.1) HaplotypeCaller program in single-sample mode [37–39]. Variant consequences are provided for transcript and protein isoforms from the Matched Annotation from NCBI and EMBL-EBI project (MANE Plus Clinical) [40], a collection of representative transcripts and proteins for each protein-coding gene that exactly match the exonic sequences of the reference genome and can be used synonymously. Importantly, the MANE Plus Clinical collection provides opportunities for clinical communities to include additional transcripts that include loci to represent clinically important variants that cannot be represented in the basic MANE set.
Data exploration and statistical analysis
All analyses were completed in R v4.1.1 using base functions and the packages dplyr [41], ggplot2 [42], purrr [43], readr [44], readxl [45], reshape2 [46], spgs [47], stringr [48], tidyr [49] and tidyverse [50].
Variant level characteristics
Variant type classification
ALS-implicated variants were classed as either a single nucleotide variant (SNV) or an insertion and/or deletion variant (INDEL) based on the CADD annotated variant “type”. Further categorisation was applied using the Variant Annotation Integrator “consequence” annotation.
Allele Frequency
Minor allele frequencies (MAFs) for all ALS-implicated variants were determined in the non-neuro subset of the Genome Aggregation Database (gnomAD, v2.1.1) [51], which excludes individuals affected by neurological disorders. MAF values were recorded across all ethnicities (n = 114,704), as well as specifically among only non-Finnish Europeans (n = 51,592), who represent the majority of patient cohorts in reported ALS genetics studies, and also have the highest reported incidence of ALS [52]. Variant data for each gene was downloaded from the gnomAD web browser (https://gnomad.broadinstitute.org/), and allele counts were annotated to ALS-implicated variants using custom R scripts with subsequent calculation of MAF.
Predicted pathogenicity
Two in silico meta-predictors of genetic variant pathogenicity were used to score ALS-implicated variants: CADD [53–55] and REVEL [56]. CADD scores were computed for all variants using the web-based tool (v1.6; https://cadd.gs.washington.edu/). Pre-computed REVEL scores were available for missense variants only (https://sites.google.com/site/revelgenomics/, downloaded 5th March 2020). To determine the correlation between CADD and REVEL, a Pearson’s correlation test was performed using CADD raw scores (which were log transformed to obtain CADD phred scores) and REVEL scores.
Localisation to protein domains
Following thorough literature review, one representative publication for each ALS gene was selected to define its protein domains (Supplementary Table S1). Representative publications were selected based on publication date, number of citations and journal quality (using metrics including impact factor, SCImago Journal Rank). If exact protein domain bounds were not provided by the representative publication, coordinates were predicted using the PROSITE (release prosite2022_02) [57], SMART (v9) [58] or UniProt (release-2022_04) [59] databases, dependent on which demonstrated greatest concordance with the literature. Custom R scripts were then used to annotate each ALS-implicated variant to their respective protein domain based on cDNA location.
Conservation
Phylogenetic P-value (PhyloP) scores (100 vertebrates Basewise Conservation) were computed for all ALS-implicated variants using the UCSC Variant Annotation Integrator (http://genome.ucsc.edu/cgi-bin/hgVai). Given the nature of PhyloP scores assessing the conservation of existing nucleotide positions, insertion variants were not scored.
Gene level characteristics
Genic tolerance
The tolerance of each ALS gene to genetic variation was assessed using gnomAD (v2.1.1) constraint scores [60] for missense and loss of function (LoF) variants. Positive and negative z-scores indicated intolerance and tolerance to variation, respectively.
Gene expression
To assess the expression levels of ALS genes in disease relevant tissue types, median gene-level expression values were obtained from GTEx (Genotype-Tissue Expression; Analysis V8, https://gtexportal.org/home/datasets/GTEx_Analysis_2017-06-05_v8_RNASeQCv1.1.9_gene_median_tpm.gct.gz) for the tissue types “Brain –Cortex ” (n = 255) and “Brain –Spinal cord (cervical c-1)” (n = 159).
Gene-wise variant visualisation
Graphical representations of each ALS gene, including their protein domains and reported ALS-associated variants were generated using R and the ggplot2 package. The most frequently reported accession number for each gene was selected for plotting of ALS-implicated variant positions and protein domain localisations. Gene plots include variant details of reported ALS inheritance mode, and both CADD and REVEL prediction scores, including density plots to illustrate the most frequent scores by gene.
RESULTS
Characterisation of ALS-implicated variants
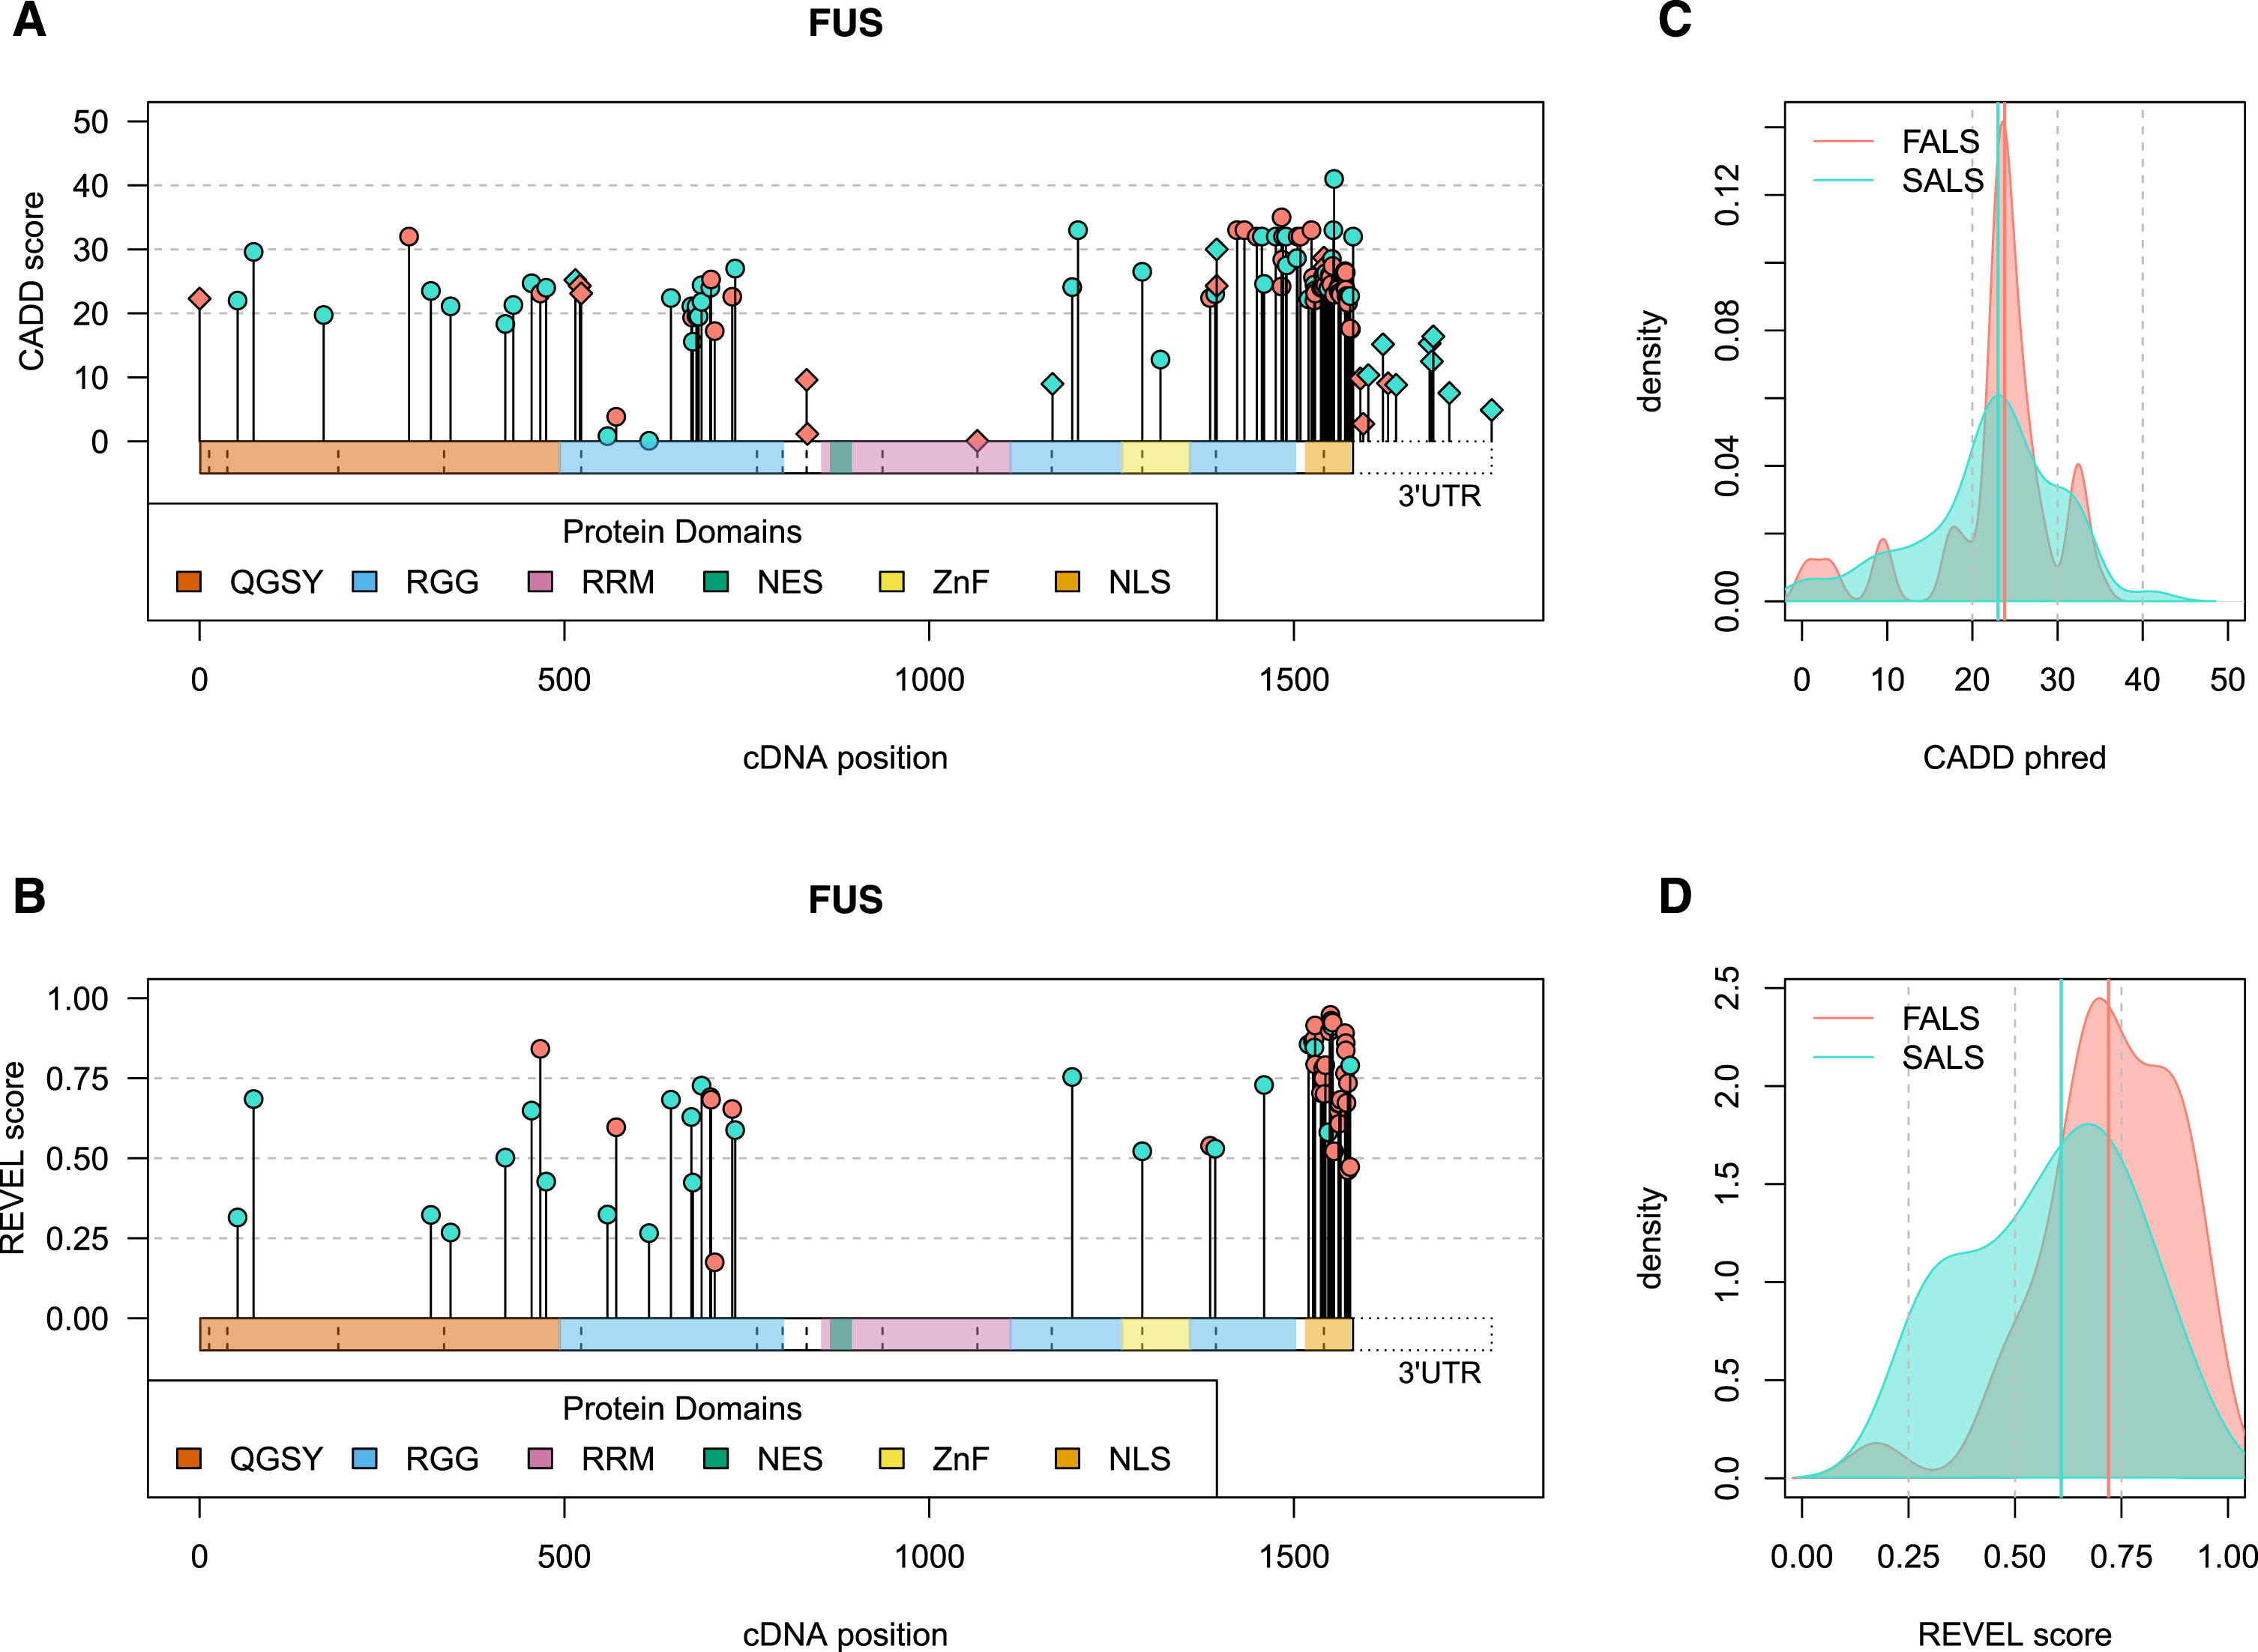
In addition to the 853 ALS-implicated variants we reported in McCann et al. (2020), interrogation of an additional 83 relevant peer-reviewed articles published between February 2019 and March 2021 identified 234 additional ALS-implicated variants, bringing the total number of ALS-implicated variants reported since 1993, to 1,087 (Supplementary Data file 1). These 1,087 ALS-implicated variants are provided in two formats: 1) a spreadsheet containing hg19 and GRCh38 coordinates, detailed in silico annotations and all literature references (Supplementary Data file 1), and 2) a GRCh38 VCF, (Supplementary Data file 2). Of the 1,087 ALS-implicated variants, 942 were SNVs, 103 deletions, 31 insertions, nine deletion-insertions and two repeat expansions. Notably, over 30% of ALS-implicated variants reported in NEFH (34.6%), TBK1 (33.33%) and FUS (30.70%) were indel variants. Missense variants accounted for the majority (75.71%) of ALS-implicated variants across all genes. Figure 1 and Supplementary Table S2 provide a breakdown of variant types in each ALS gene. Graphical summaries of each ALS gene provide a visual representation of variant features on a gene-wise basis and are provided in Supplementary Data file 3, while FUS is shown as an example in Fig. 2.
Fig. 1
Stacked bar chart of variant types in each ALS gene.
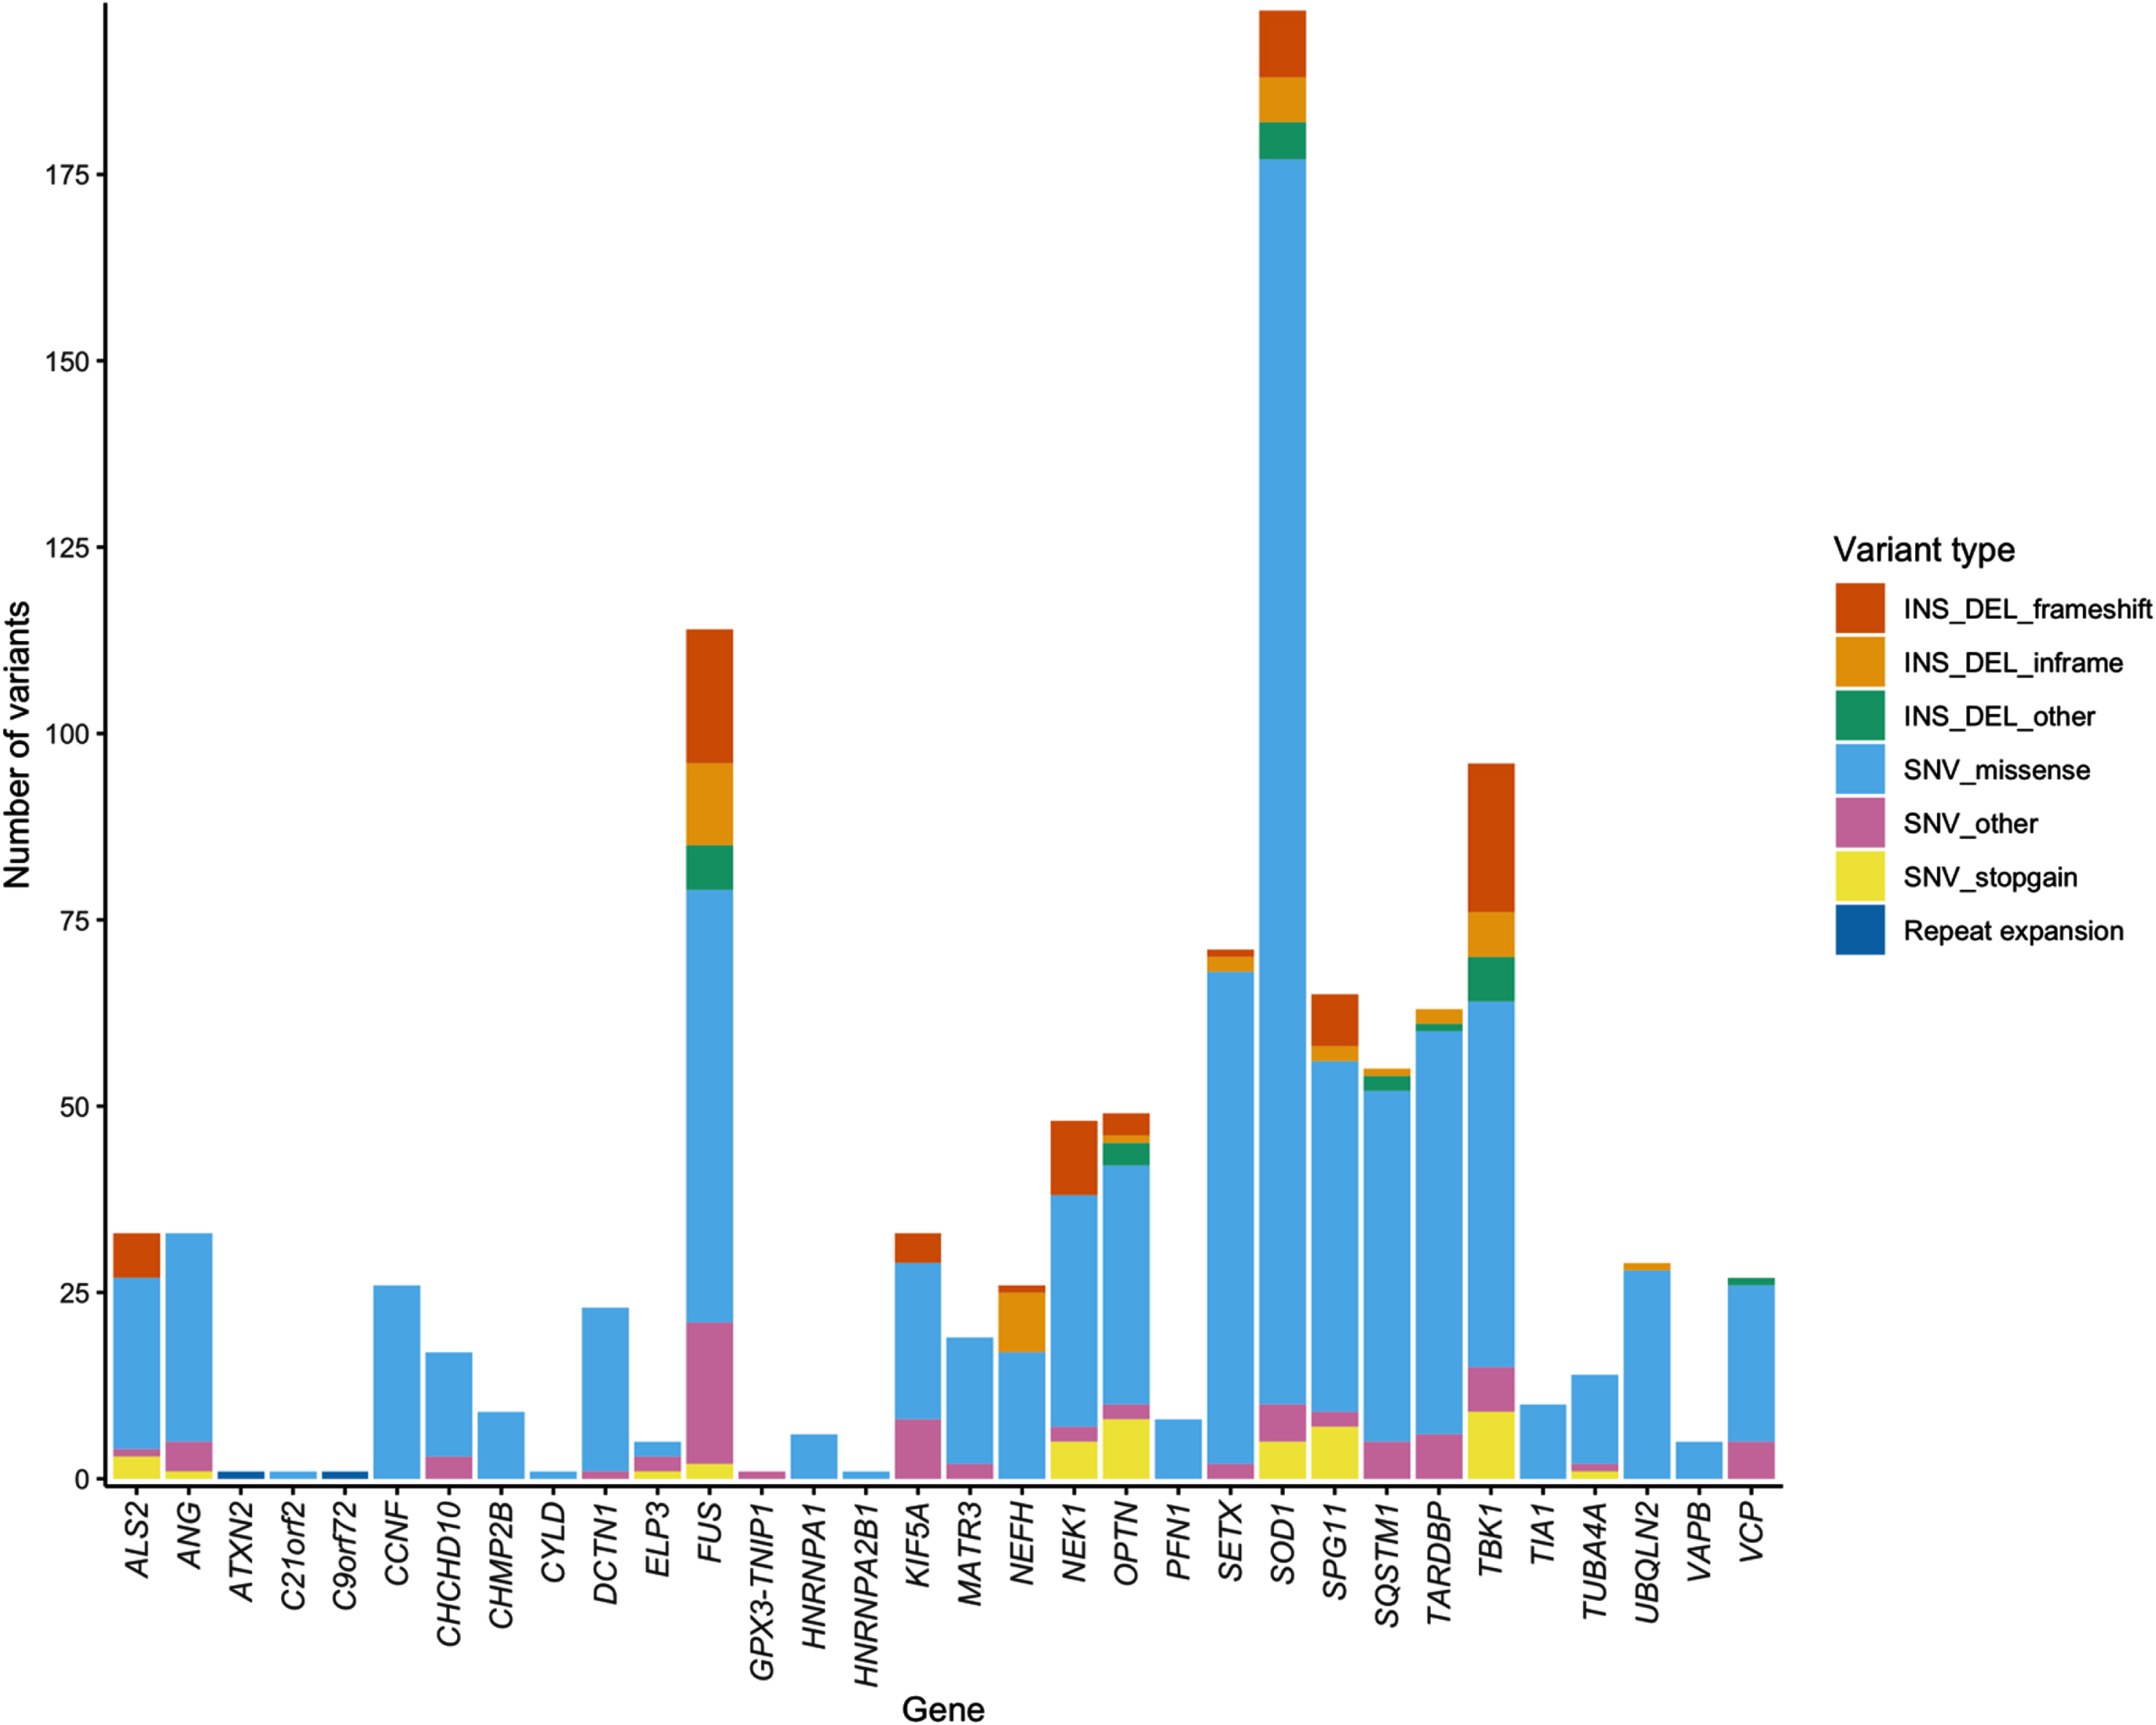
Fig. 2
Visual summary of ALS-implicated variants in the FUS gene. Panels A and B) The horizontal bars on the x-axis represents the cDNA sequence of the gene, with variants plotted along the length of the gene according to their cDNA position. CADD phred (A, all variants) and REVEL (B, missense variants) scores are denoted by the height of points on the y-axis. Genomic context is indicated by point shape, as exonic (circle) and intronic (diamond), with the latter plotted at the exon bounds as indicated by vertical dashed lines. The 3’ untranslated region (UTR) is specifically plotted for FUS due to the large number of variants that lie in this region. Panels C and D) Density plots of CADD phred (C, all variants) and REVEL (D, missense variants) reported in FALS (red) versus SALS exclusively (blue). Bolded vertical lines indicate group median score, while grey dashed lines denote standard threshold bins. Visual summaries of remaining ALS-associated genes can be found in Supplementary Data file 3. QGSY, (glutamine-glycine-serine-threonine)-rich region; RGG, (arginine-glycine-glycine)-rich motif; RRM, RNA recognition motif; NES, nuclear export signal; ZnF, zinc finger domain; NLS, nuclear localisation signal.
Minor allele frequency
Population-based MAF values were obtained from the non-neuro subset of gnomAD (n = 114,704) for all ALS-implicated variants except the polymorphic C9orf72 and ATXN2 repeats (n = 1,085). Other than three common population-based (MAF > 0.5) non-coding SNPs (ELP3 rs2614046 and rs6985069, and GPX3-TNIP1 rs10463311), all other ALS-implicated variants had a MAF < 0.05. Over half (564/1,085, 51.98%) of all ALS-implicated variants were completely absent from this control cohort, and 95% had a MAF below 0.000492705. Statistical analysis using z-scores determined that the three common variants at the ELP3 and GPX3-TNIP1 loci were indeed outliers (z-score>3), and therefore alongside the C9orf72 and ATXN2 repeats, were excluded from further analysis.
Of the remaining 1,082 ALS-implicated variants, MAF values in gnomAD ranged between 0 and 0.045, with a mean of 0.00029 and median of 0. As seen in Fig. 3, comparable MAF values were observed in the non-Finnish European subset with a range of 0 to 0.028, mean of 0.00029 and median of 0. A breakdown of MAF value statistics per gene and by variant type are provided in Supplementary Table S2. To avoid deflation of summary statistics from the high proportion of variants absent from gnomAD, ALS-implicated variants with a MAF of 0 were collapsed into a single representative variant, and summary statistics were recalculated (Table 1). A summary of all variant specific characteristics for the remaining 1,082 rare ALS-implicated variants is provided in Table 1.
Fig. 3
Histogram of minor allele frequency of ALS-implicated variants in the gnomAD non-neuro control cohort based on ethnicity.
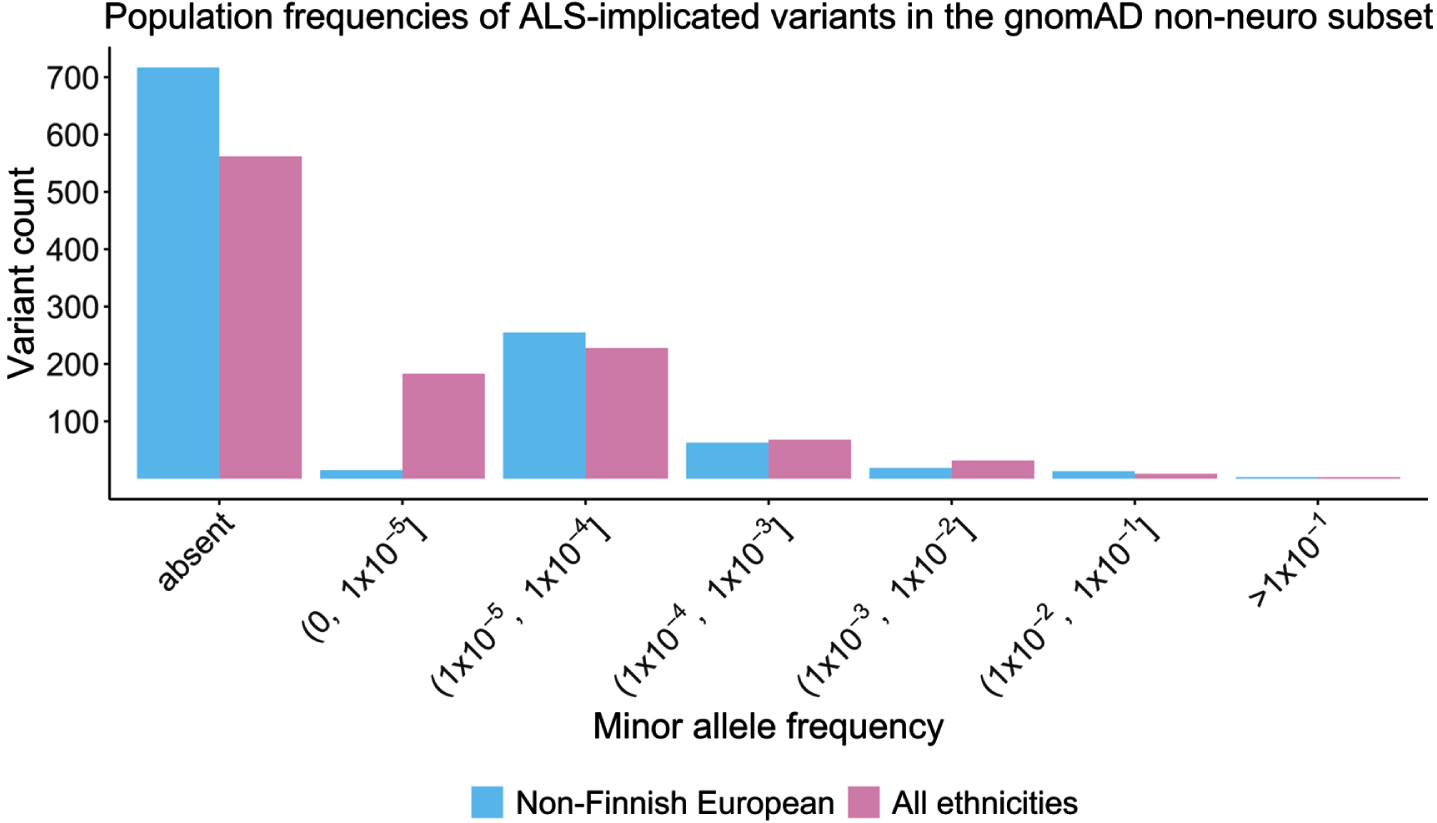
Table 1
Summary statistics for 1,082 ALS-implicated variants across genetic variant-specific characteristics
| Total MAF | Non-Finnish European MAF | CADD phred | REVEL | PhyloP | |||||||||||||
| all variants | collapsed variants† | FALS | SALS only | all variants | collapsed variants† | FALS | SALS only | all variants | FALS | SALS only | all variants | FALS | SALS only | all variants | FALS | SALS only | |
| minimum | 0 | 0 | 0 | 0 | 0 | 0 | 0 | 0 | 0.001 | 0.003 | 0.001 | 0.01 | 0.02 | 0.01 | -3.61698 | -3.17765 | -3.61698 |
| maximum | 4.5084x10-02 | 4.5084x10-02 | 1.7276x10-02 | 4.5084x10-02 | 2.81510x10-02 | 2.8151x10-02 | 2.2680x10-02 | 2.8151x10-02 | 46 | 42 | 46 | 0.992 | 0.992 | 0.98 | 9.814 | 9.7369 | 9.814 |
| mean | 2.9303x10-04 | 6.0856x10-04 | 2.2100x10-04 | 3.5000x10-04 | 2.9016x10-04 | 8.5778x10-04 | 2.7400x10-04 | 3.0300x10-04 | 22.965 | 24.068 | 22.099 | 0.523 | 0.657 | 0.422 | 4.02255 | 4.48152 | 3.66393 |
| median | 0 | 1.9800x10-05 | 0 | 4.9500x10-06 | 0 | 2.9100x10-05 | 0 | 0 | 23.8 | 24.35 | 23.3 | 0.51 | 0.721 | 0.364 | 3.83084 | 4.62953 | 3.4151 |
| 80th | 2.9100x10-05 | 1.0465x10-04 | 9.6000x10-06 | 4.7100x10-05 | 2.2400x10-05 | 1.4500x10-04 | 1.1200x10-05 | 3.2700x10-05 | 18.108 | 21.3 | 16.06 | 0.236 | 0.409 | 0.172 | 0.87184 | 1.07935 | 0.73259 |
| percentile | |||||||||||||||||
Abbreviations: MAF, minor allele frequency; FALS, familial ALS; SALS, sporadic ALS. †To avoid deflation of minor allele summary statistics from a high proportion of gnomAD absent variants, ALS-implicated variants with a MAF of 0 were collapsed, and summary statistics recalculated.
Deleteriousness predictions
Three-quarters of ALS-implicated variants (817/1082, 75.51%) had CADD phred-scaled scores greater than 20, placing them in the top 1% of most deleterious variations in the genome (Fig. 4A). Among these 817 variants, 158 had a CADD phred score between 30-40 (top 0.1%), and 15 a CADD phred > 40 (top 0.001%). The genes SOD1, TBK1 and FUS had the most variants with CADD phred scores falling within these deleterious ranges (Supplementary Fig. S1). A breakdown of CADD scores by variant type, per gene is shown in Supplementary Fig. S2. REVEL scores use an absolute range of 0-1 to score missense variants only. Among the 823 ALS-implicated missense variants, REVEL scores ranged from 0.010-0.992, and 80% had a REVEL score > 0.236 (Fig. 4B).
Fig. 4
Comparison of CADD and REVEL predicted deleteriousness scores for all rare ALS-implicated variants. A) Density plot of CADD phred scores for all 1,082 rare variants of any variant type. Supplementary Fig. S2 provides a further breakdown of CADD phred scores per gene for different variant types. B) Density plot of REVEL scores for the 823 rare missense variants. C) Scatter plot with regression line (cor = 0.5372964) and Pearson’s correlation testing (p < 2.2x10⁻¹⁶) of CADD RawScore and REVEL scores for the 823 rare missense variants. D) Box plots of CADD phred and REVEL scores per ALS gene for the 823 rare missense variants.
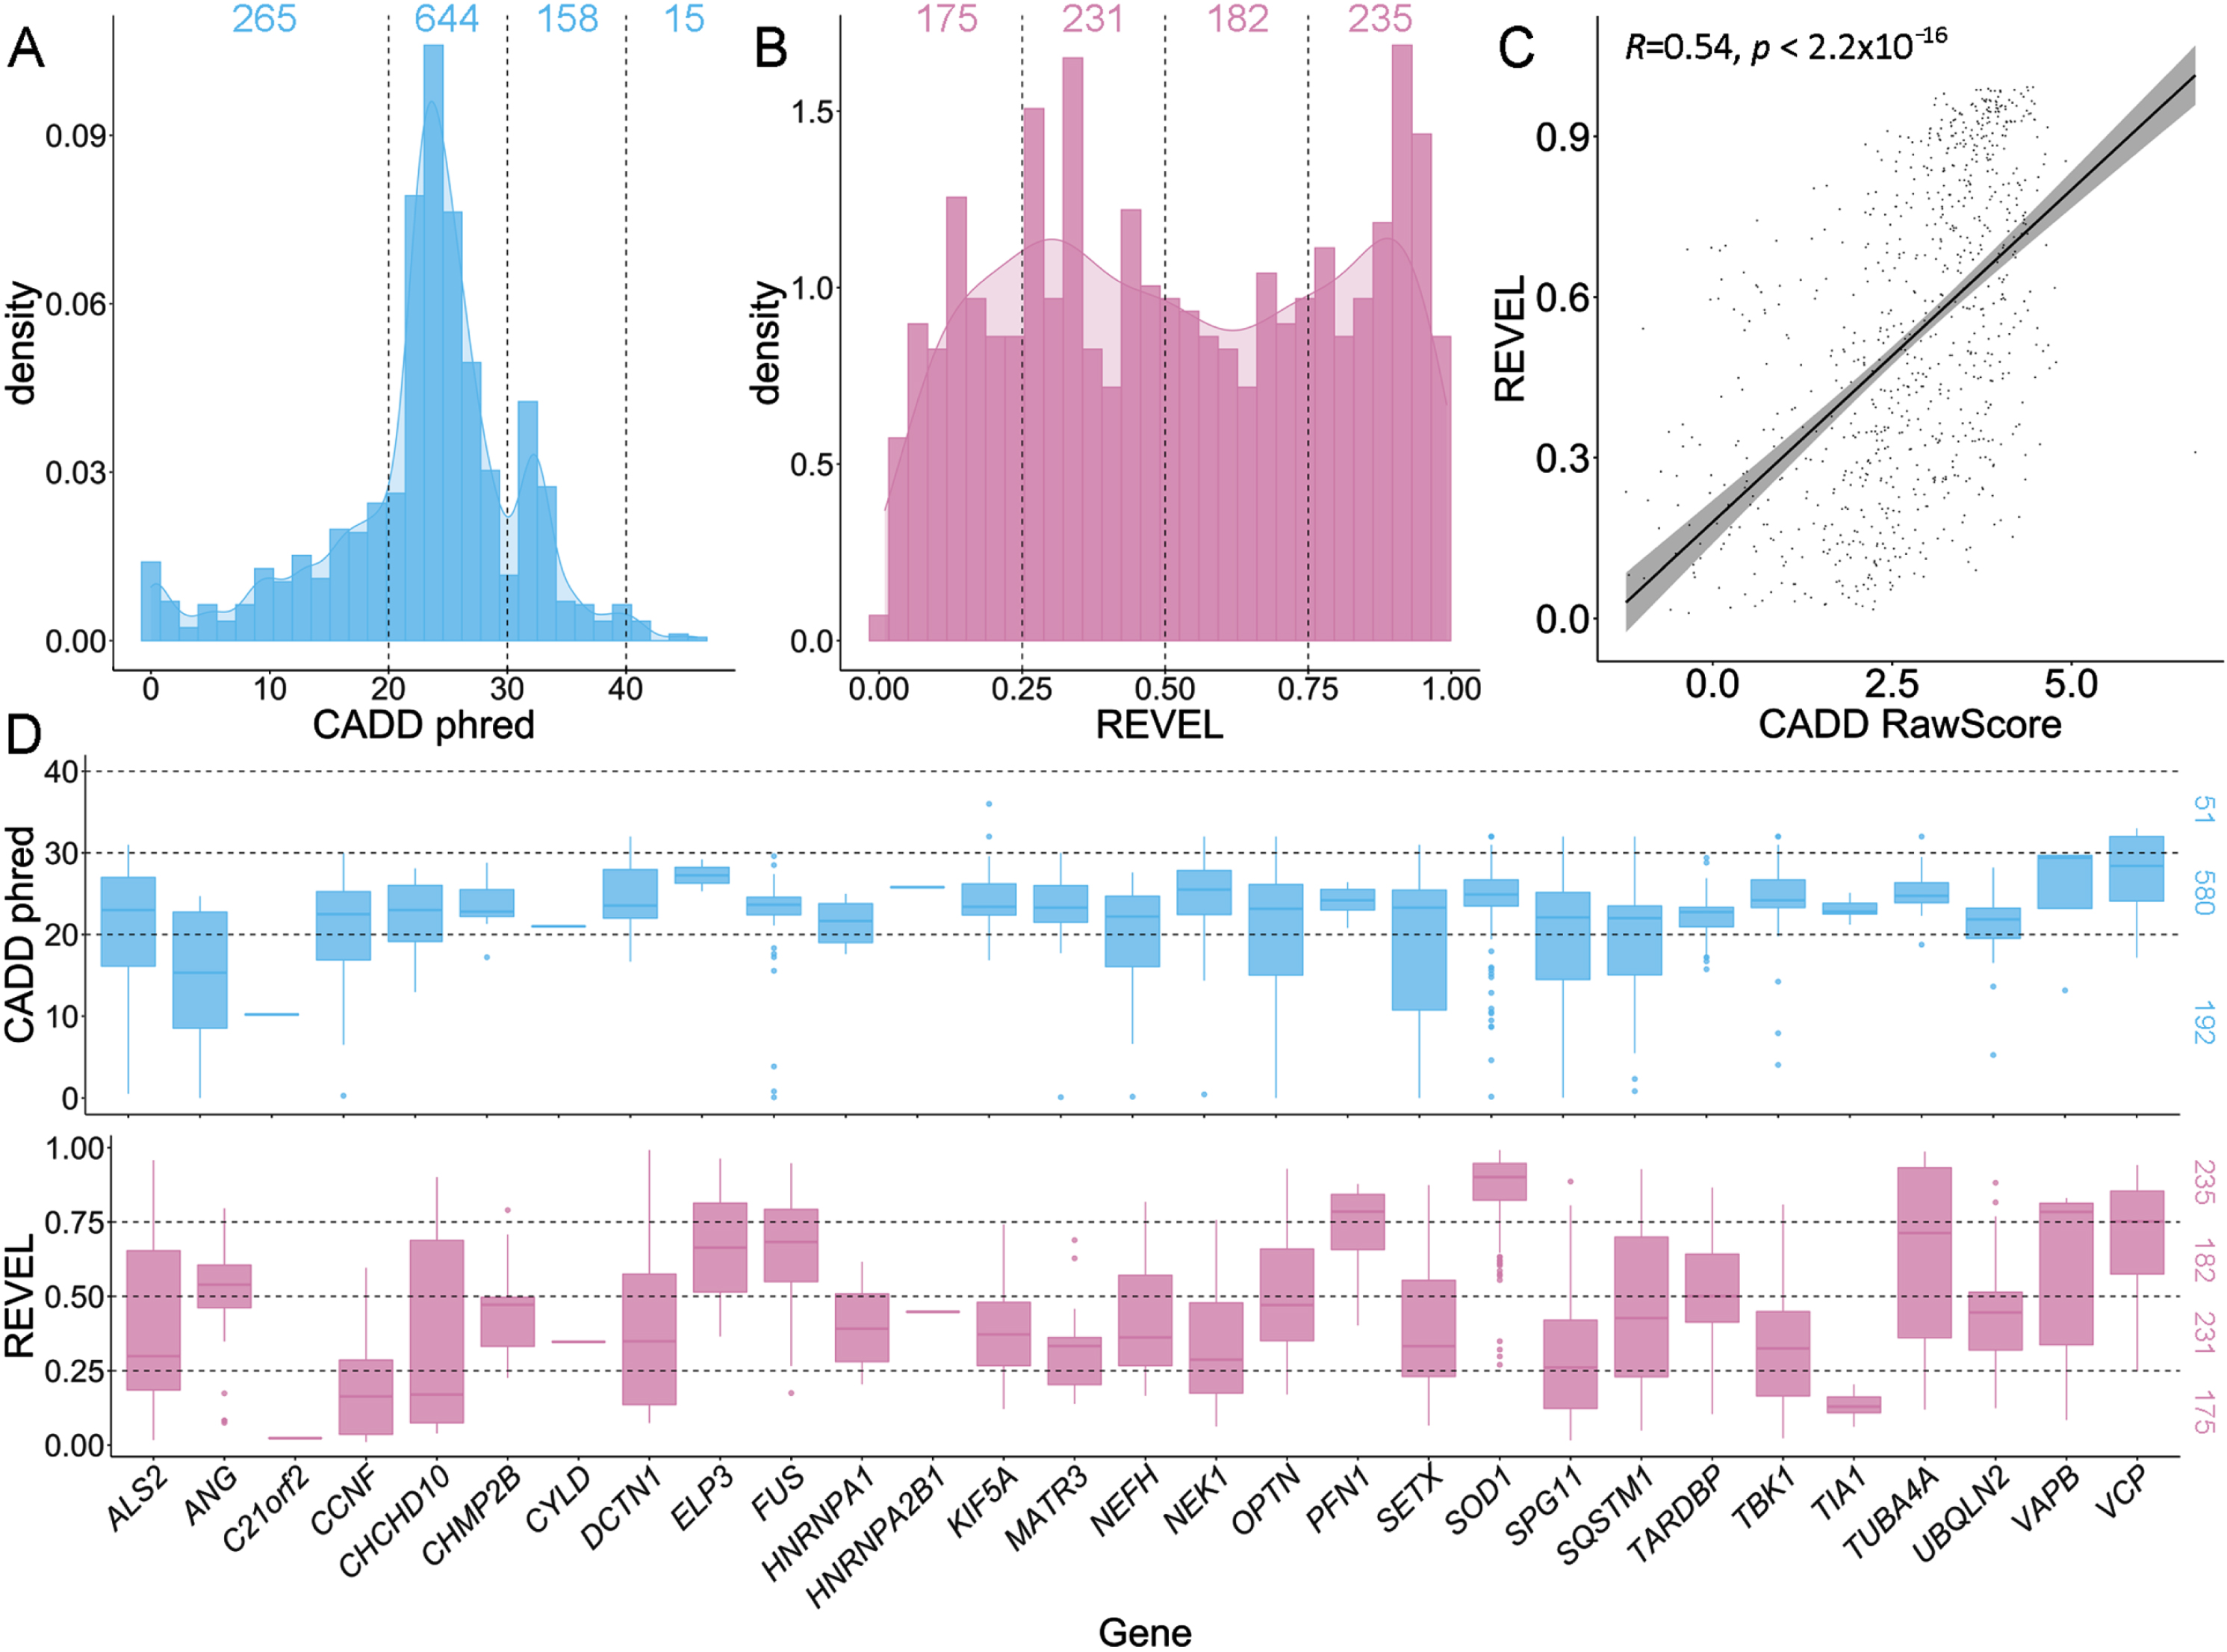
When comparing CADD and REVEL scores for ALS-implicated missense variants using the Pearson’s correlation test, a moderate, significant correlation was apparent (cor = 0.5372964, p < 2.2x10⁻¹⁶, Fig. 4C). Notably, the distribution of CADD scores was concentrated between phred 20-30, while REVEL scores were more widely dispersed (Fig. 4A-B). Further, CADD phred and REVEL scores on a gene-wise basis tended to show similar distributions and trends (Fig. 4D).
Protein domains
Two-thirds of ALS-implicated variants were found to fall within defined protein domains (700/1082, 64.7%). Of 197 SOD1 variants, 177 (89.85%) localised to the protein’s catalytic domain, while 55/63 (87.30%) TARDBP variants were found in the protein’s aggregation-prone C-terminal domain. Among 114 FUS variants, 86 (75.44%) fell within protein domains, including the nuclear localisation signal (38), QGSY-rich region (11), RRG-rich motif (35) and zinc finger domain (2). Across all ALS genes, disease-implicated variants were most frequently observed in coiled-coil domains, ubiquitin related domains and nuclear localisation signals (Supplementary Table S3).
Species conservation
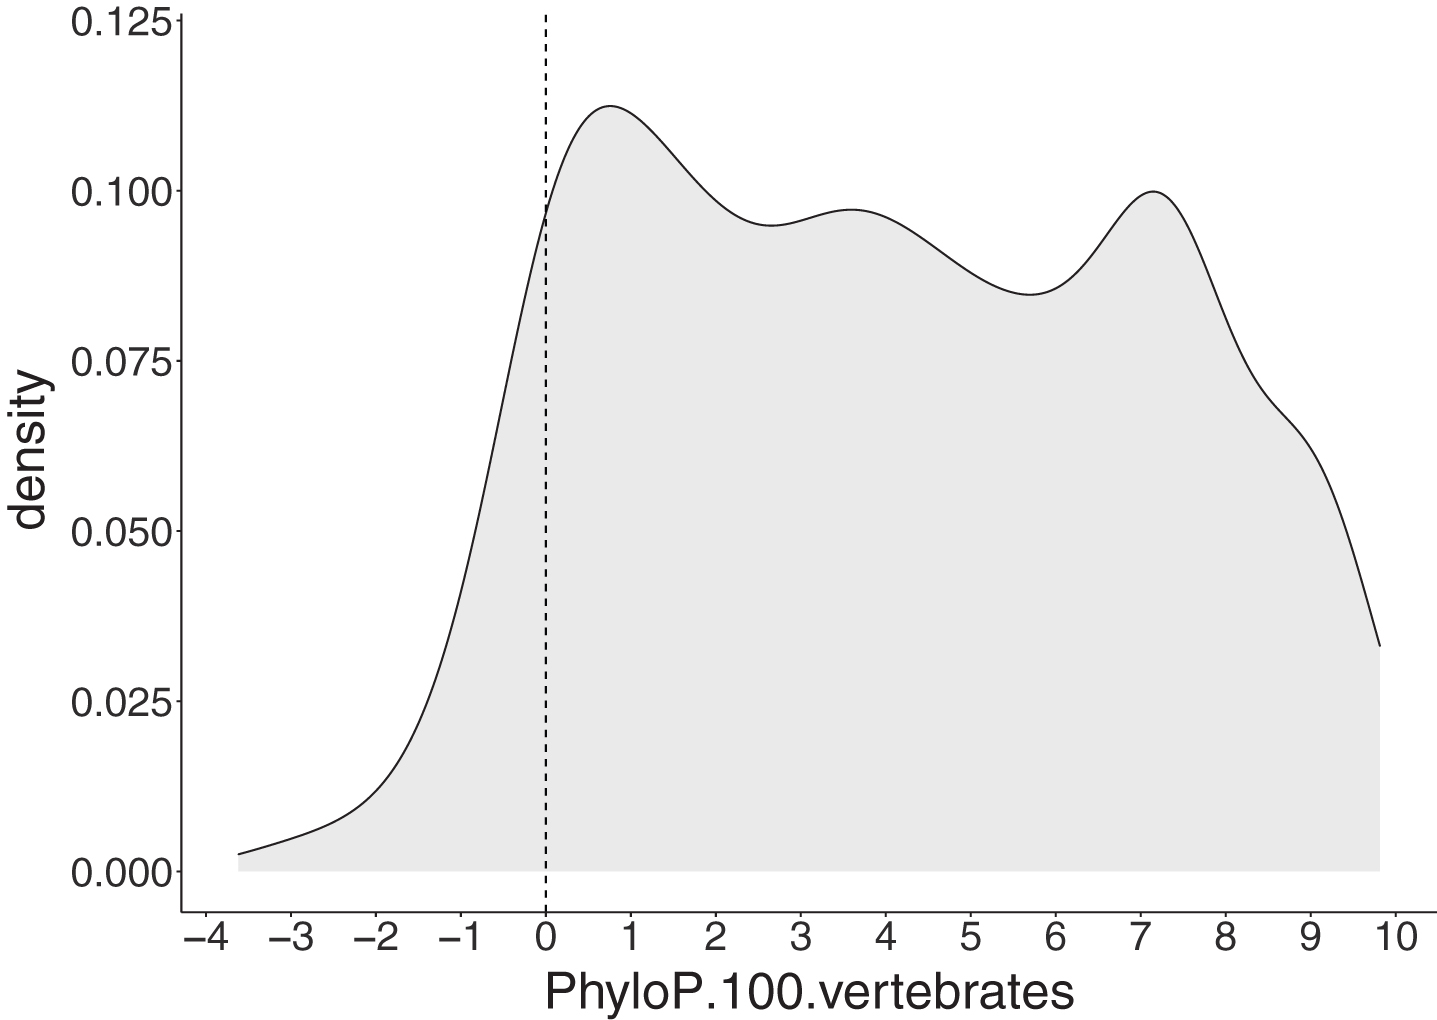
Among 1,051 SNV and deletion ALS-implicated variants, a large proportion (91.44%) had positive PhyloP scores indicating these positions are evolutionarily conserved (Fig. 5).
Fig. 5
PhyloP scores for 1,051 single nucleotide (SNV) and deletion ALS-implicated variants. The grey area represents a density plot for all PhyloP scores across all variants. The dashed line represents the threshold for evolutionary conservation, with positive and negative scores indicating conserved and fast-evolving sites, respectively.
SALS-exclusive variants had weaker evidence of pathogenicity
Among the 1,082 rare ALS-implicated variants, 606 (56.01%) were reported in SALS cases only, whereas the remaining 476 variants (43.99%) had at least one report in a FALS case. Variants reported exclusively in SALS cases had significantly less severe characteristics compared with those seen in FALS cases as determined using Wilcoxon signed-rank testing (Fig. 6 and Table 1). Namely, these SALS-exclusive variants had higher MAF values and lower CADD, REVEL and PhyloP scores. Fisher’s Exact testing showed that significantly fewer SALS-exclusive variants fell within protein domains compared to variants reported in FALS cases (349/606 [57.59% ] and 351/476 [73.74% ] variants fell in protein domains respectively, p = 3.29x10⁻⁸).
Fig. 6
Comparison of variant characteristics between ALS-implicated variants reported in FALS or exclusively in SALS. A) gnomAD allele frequency, including a zoomed-in view to better represent low frequency variants (p = 3.8e-16), B) CADD phred (p = 7.4e-6), C) REVEL (p = 2.2e-16) and D) PhyloP scores (p = 2.9e-5). Statistical testing was performed using Wilcoxon signed-rank testing.
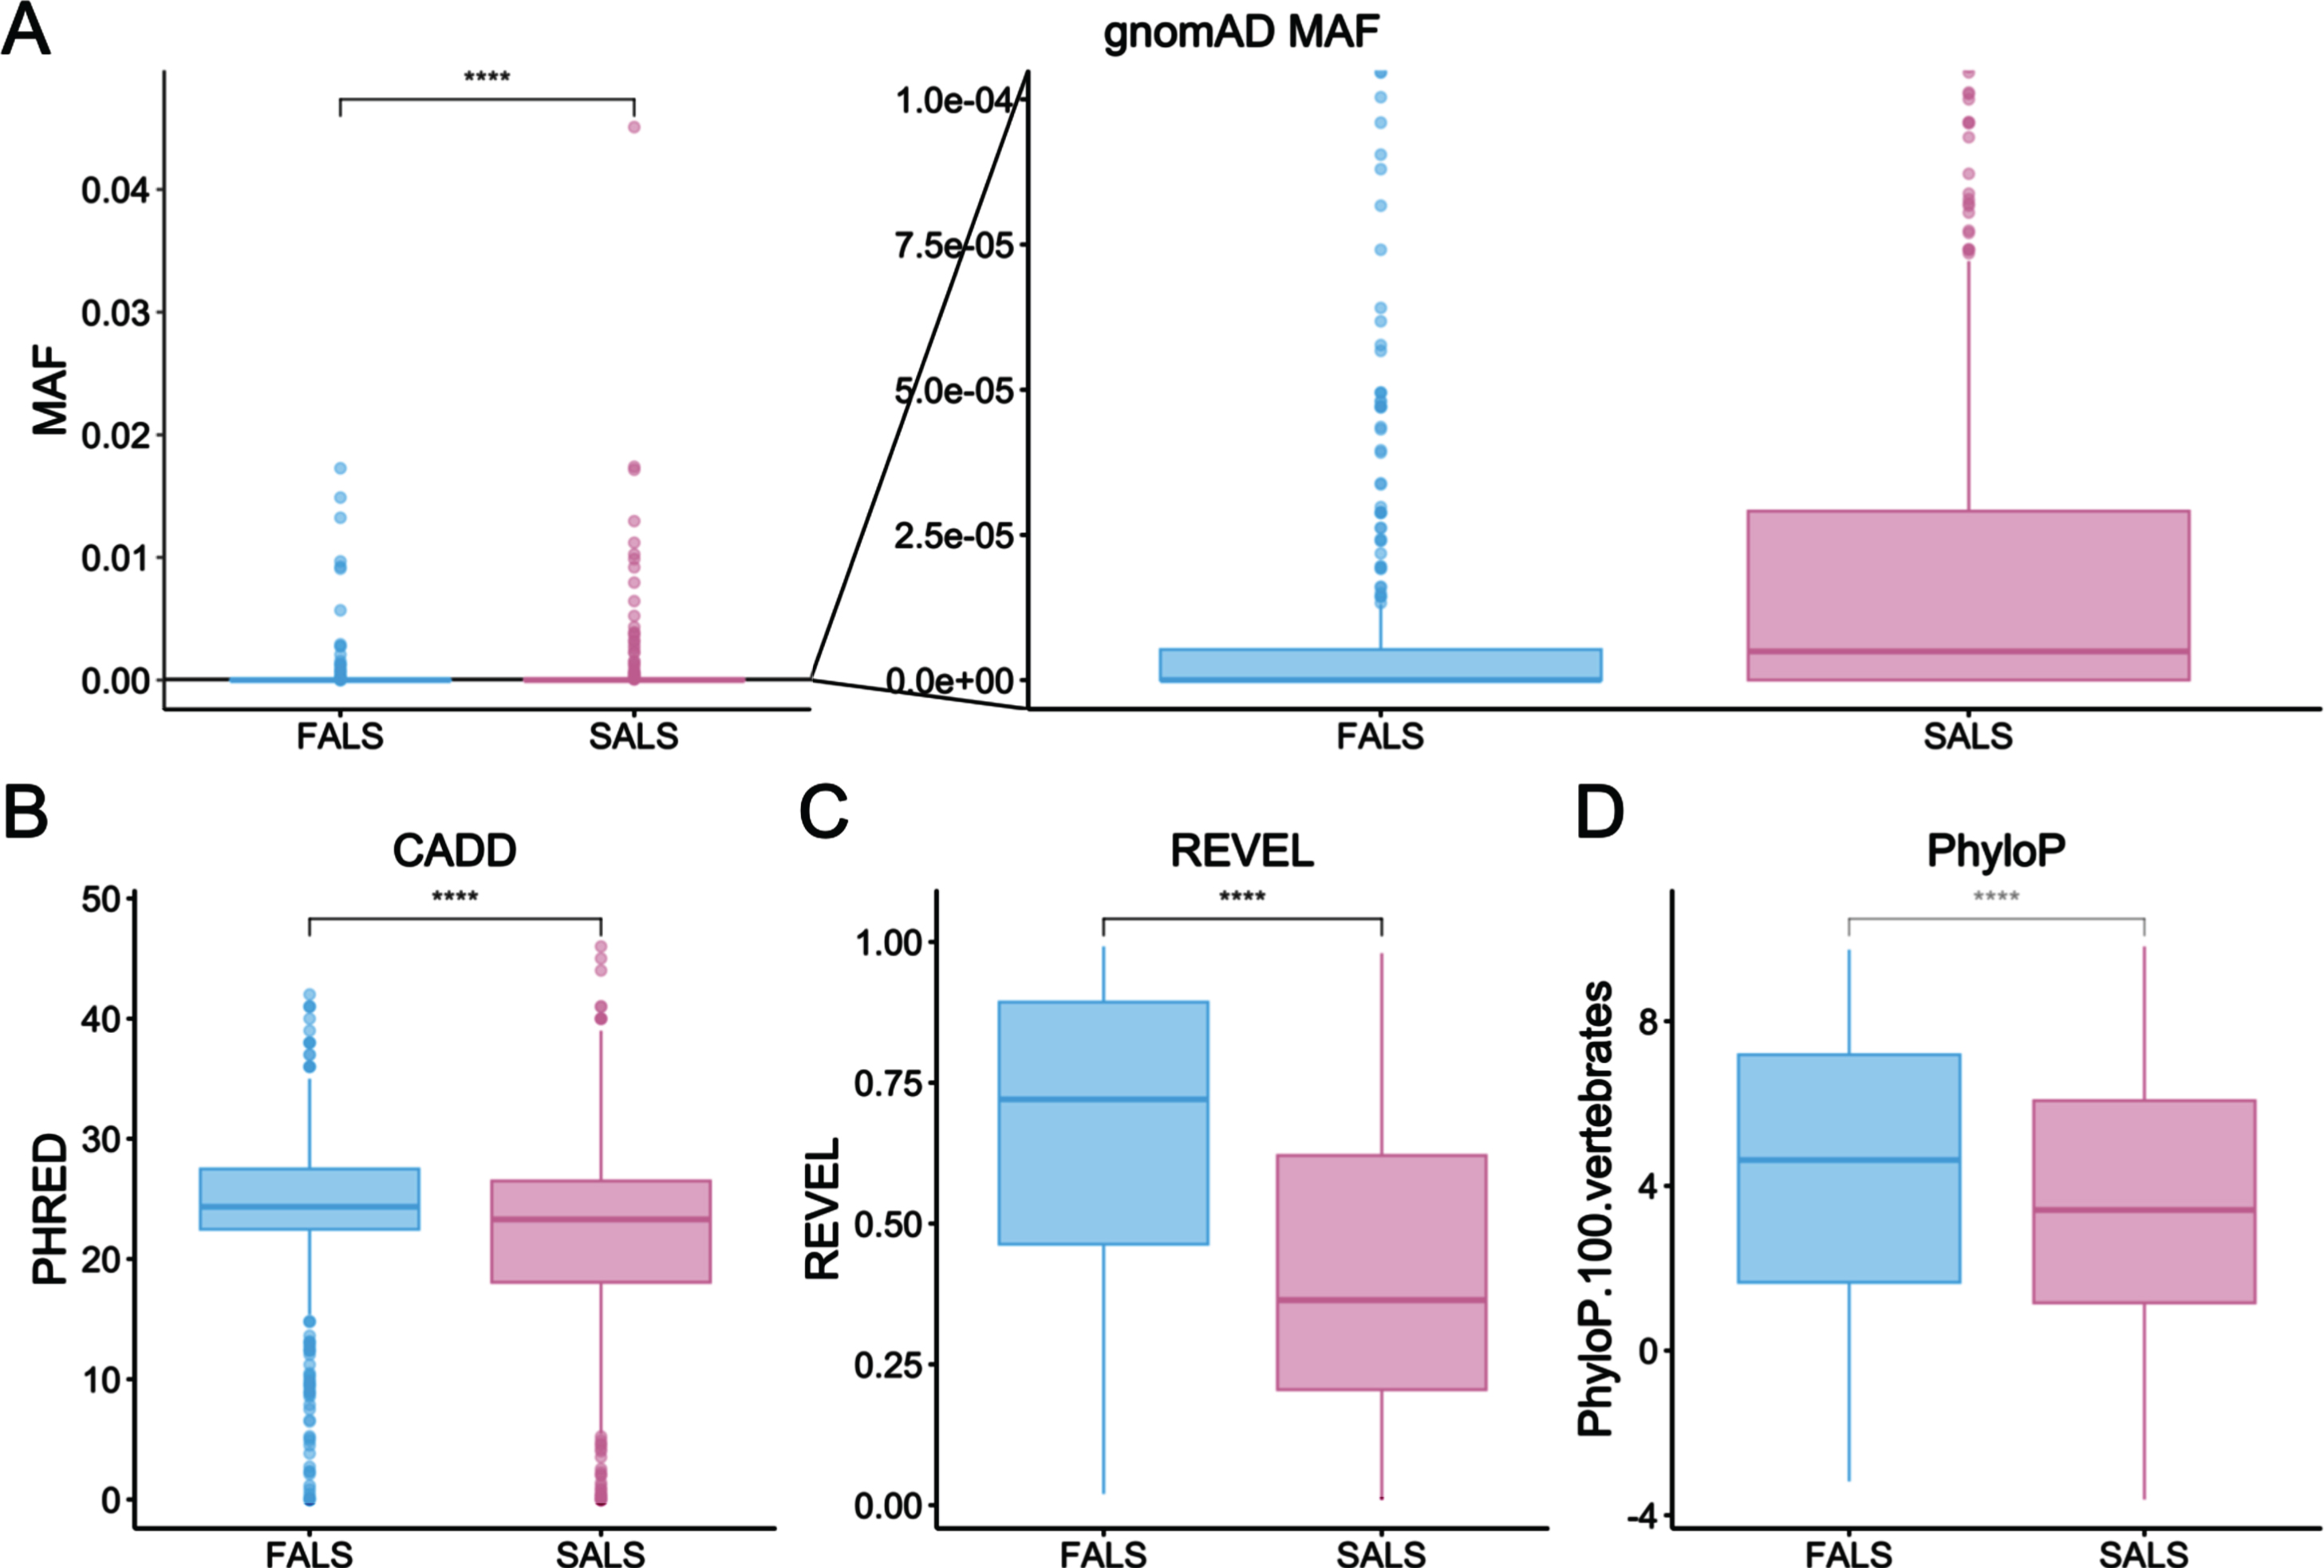
Table 2
Top 10 enriched gene ontology terms for each of three separate ontology categories among 33 ALS genes
| Biological processes | Cellular components | Molecular functions |
| organelle organization | cytoplasmic stress granule | polyubiquitin modification-dependent protein binding |
| cellular component organization | axon | identical protein binding |
| cellular component organization or biogenesis | cytoplasmic ribonucleoprotein granule | protein binding |
| regulation of organelle organization | ribonucleoprotein granule | enzyme binding |
| positive regulation of biological process | cytosol | modification-dependent protein binding |
| cellular component assembly | supramolecular complex | miRNA binding |
| microtubule-based process | intracellular organelle | RNA binding |
| macroautophagy | organelle | regulatory RNA binding |
| endomembrane system organization | autophagosome | pre-mRNA binding |
| cellular response to stress | vacuole | G-rich strand telomeric DNA binding |
Characterisation of ALS genes
ALS genes were found to have varied levels of expression in ALS-specific tissues (cortex and spinal cord). Using gnomAD constraint metrics, 29/33 (87.88%) and 32/33 (96.97%) ALS genes were found to have positive z-scores indicating intolerance to missense and LoF variation, respectively. However, only 9/33 (27.27%) had a pLI score > 0.9 indicating extreme intolerance to protein-truncating variation. A summary of gene expression and constraint metrics across all 33 ALS genes is provided in Supplementary Table S4, including values per gene.
A total of 1,006 GO terms were found to be enriched among the 33 ALS genes (p < 0.05), including 800 biological process, 115 cellular components and 91 molecular functions. The top 10 terms in each ontology category are shown in Table 2, and full details can be found in Supplementary Table S5.
DISCUSSION
The genetic contribution to ALS, while established, is incredibly complex. Causal genetic variants occur across a range of biologically diverse genes, demonstrate a spectrum of genetic inheritance patterns, and have variable influence on clinical phenotype. Further, the late disease onset and apparently sporadic presentation of most patients suggests that genetic variation is but one of multiple contributors to disease onset and progression. While it is therefore difficult to employ strict criteria for ALS variant interpretation, there is a need for strategies to assess the potential pathogenicity of the growing number of VUS. To better understand the defining characteristics of genetic variation in ALS, we investigated key gene and variant level features of > 1,080 published genetic variants implicated in ALS from 1993 to 2021. We have provided a comprehensive characterisation of these genetic variants and anticipate that this resource will be used as a reference point for the interrogation of known and novel ALS candidate variants moving forward.
Defining features of ALS genes
SOD1 had the most reported variants (Supplementary Table S4). The median REVEL score for SOD1 variants was 0.901, the highest score for all genes (Supplementary Table S4). FUS had the second most variants, reflective of the prevalence of FUS variants and the established severity of their associated ALS phenotypes [65]. TARDBP ranked sixth for number of reported variants, below TBK1, SETX and SPG11. However, these three genes are markedly more tolerant to genetic variation than TARDBP, as indicated by gnomAD constraint scores (Supplementary Table S4). Substantially more TARDBP variants (based on both gross number and proportion) were reported in FALS patients, as well as across multiple patients, compared with TBK1, SETX and SPG11 (Supplementary Data file 1). Together this suggests that TARDBP variants confer larger ALS disease effects than those in TBK1, SETX and SPG11, and that many of the variants reported amongst these other genes have lower disease penetrance, and therefore smaller disease effects. While these results support the commonly accepted notion that SOD1, FUS and TARDBP are “major” ALS genes, it is worth noting some inherent biases when scrutinising the number of ALS-implicated variants reported for any given gene. This includes gene size, with larger genes naturally harbouring a higher number of variants, as well as time since the original report of the gene as an ALS gene, which has influence over the number of subsequent studies that have investigated the gene.
ALS gene expression levels were variable in the cortex and spinal cord, ranging from barely detectable (0.93 transcripts per million, TPM) to highly abundant (1160.24 TPM) (Supplementary Table S4). Interestingly, the most common ALS gene C9orf72 had quite low expression in these tissues (8.21 TPM and 11.70 TPM, respectively), while TARDBP, encoding the major constituent of ALS hallmark protein aggregates, exhibited modest expression levels (36.06 TPM and 57.33 TPM). This therefore indicates that ALS genes need not have high baseline expression in central nervous system tissues in order to have strong disease effects. This suggests that gene expression levels obtained from databases should only be used as ancillary information in predicting ALS pathogenicity, rather than required as evidence for disease relevance. This is also supported by functional studies of ALS variants that suggest gain of function mechanisms [66], which may manifest as a change in central nervous system expression levels. This suggests that even genes with no detectable expression in the central nervous system may have potential to gain pathogenic activity leading to aberrant elevated expression in these tissues.
When considering genic tolerance, a large proportion of ALS genes exhibited intolerance to genetic variation (87.88% and 96.97% for missense and LoF variation, respectively), indicating that this is generally required for ALS pathogenicity. While gnomAD suggests that any positive z-score indicates genic intolerance, stricter thresholds are recommended by the ClinGen Sequence Variant Interpretation working group (General Sequence Variant Curation Process Standard Operating Procedure v1.0), where z-scores>3.09 are used to indicate a heightened intolerance to missense variation [67]. Interestingly, only 5/33 (15.15%) of ALS genes reach this stricter threshold of 3.09 (VCP, TARDBP, KIF5A, CYLD and TUBA4A). It is important to note however that the ClinGen threshold is intended for use across a multitude of conditions and mainly aims to capture monogenic disease genes, therefore as a late onset disease with variable penetrance, this may not be appropriate for evaluation of ALS genes. Moreover, it has been suggested that genes causal for late onset diseases including ALS are more tolerant to variation compared to earlier onset conditions [68]. As such, it is more appropriate to determine genic tolerance thresholds for each individual disease [68]. Unsurprisingly, gene ontology analysis identified various terms associated with RNA binding activities and protein homeostasis, both of which are established as central pathways in ALS pathogenesis [1].
Defining features of ALS relevant genetic variants
While the ACMG provide distinct guidelines and thresholds for variant interpretation in classical Mendelian disorders [69], these are not always appropriate for a more complex disease such as ALS. Nevertheless, the general principles of the ACMG guidelines highlight key features that are pertinent to variant interpretation, and these form the foundation of our characterisation of ALS-implicated variants. This includes population frequency and computational data pertaining to both functional predictions and evolutionary conservation.
At the centre of this characterisation is our comprehensive catalogue of > 1,000 ALS-implicated variants. This catalogue was curated from peer-reviewed literature published between 1993 and 2021. For this study, we only included variants reported in the literature and not those solely in databases such ClinVar, Project MinE or ALSKP. While we acknowledge that these databases are invaluable resources for ALS genetics research, they are aggregated catalogues of variants across a cohort of patients rather than a survey of an individuals’ genetic variants. As such, they were unsuitable for the aims of our study.
Importantly, we compiled a list of functional variants believed to exert ALS disease effects, aiming to remove any non-functional marker variants. Most notably this was achieved based on MAF filtering as described below, as well as the literature survey criteria of a predicted effect on protein sequence and/or naming and discussion in the main text of the publication. Of note, upon conversion from hg19 to GRCh38, three variants that had previously been annotated to an 5’ or 3’ untranslated region of SQSTM1 or VCP (NC_000005.9:g.179247900 C>T, NC_000005.9:g.179265085 G>C and NC_000009.11:g.35072710 C>G) were found to no longer overlap a genomic transcript, questioning their pathogenic potential.
Interestingly, we showed that ALS-implicated variants that were observed in familial cases showed stronger pathogenic potential than variants exclusively seen in SALS cases. FALS variants had lower population-based MAF, higher deleteriousness and conservation scores, and were more likely found within recognised protein domains. Although it is well accepted that the phenotypic distinction between FALS and SALS is largely arbitrary, this distinction is useful in that it identifies individuals who have a higher likelihood of developing ALS (that is FALS cases). This was reflected in our data whereby genetic variants that predispose individuals to FALS had larger predicted effects than those only seen in SALS cases.
Predicted deleteriousness
For predicted pathogenicity, the distribution of CADD scores for ALS-implicated variants displayed a far clearer trend than that of REVEL scores, and there was only a moderate correlation observed between the two scores (Fig. 4C). Notably, CADD scores can be applied to all possible SNP and indel variants, while REVEL scores are only available for missense variants, though a large portion of ALS variants (75.71%) are missense. Both CADD and REVEL are meta-predictors that combine the results of multiple protein prediction tools, and while many of these tools overlap, there are a number of tools unique to each. The minimal correlation between CADD and REVEL scores may also reflect that CADD uniquely incorporates sequence context details in addition to the protein prediction results, as well as differences in algorithms and tool weightings. Although both scores indicate relative ranking of variant pathogenicity, CADD phred scores are more easily interpretable, as they directly indicate the genome-wide percentile of deleteriousness, whereas REVEL scores are arbitrary. As such, CADD score thresholds of> ∼15 are routinely used for a variety of conditions, while REVEL thresholds need to be independently determined for each disease [67].
As ALS is a late onset condition, it stands to reason that seemingly less pathogenic variants (i.e., those with lower pathogenicity prediction scores) may not manifest their disease effects until such time that additional contributing factors have compounded to reach a threshold that triggers disease onset, as suggested by the multistep hypothesis of ALS [70]. Interestingly, we can see examples of the penetrance of ALS-implicated variants reflected in REVEL scores. For instance, the highly penetrant SOD1 p.V149 G variant [71] has a REVEL score of 0.948 (approaching the maximum score of one), while the lower penetrance, and often recessive, SOD1 p.D91A variant [72] has a REVEL score of 0.555. Crucially, the risk variant C21orf2 p.V58 L [73] has a REVEL score of just 0.023. This suggests that REVEL scores may be helpful for interpreting the effect size of ALS variants. Although the ClinGen Sequence Variant Interpretation working group (General Sequence Variant Curation Process Standard Operating Procedure v1.0) recommends a general threshold of > 0.75 for REVEL scores to support a pathogenic classification, they do encourage the use of disease specific thresholds [67], and our findings suggest that a far lower threshold around 0.2 (80th percentile of ALS-implicated variants) would be more appropriate for ALS. Such a precedent is reflected in the ClinGen Hearing Loss variant curation panel uses a lower threshold of ≥0.15, as 95% of pathogenic variants met this value [67, 74]. Similarly, ClinGen guidelines recently suggested a CADD phred threshold of 28.1 to provide moderate support for pathogenicity, although only 21.07% (228/1,082) of ALS-implicated variants satisfy this criteria, also suggesting this generalised threshold is not appropriate for ALS. Despite the weak correlation between CADD and REVEL scores for ALS-implicated variants, the scores may serve complementary purposes. CADD scores may serve as a prioritisation or filtering tool for higher penetrance scenarios such as familial gene discovery, while REVEL scores may be used to predict variant effect sizes, which could potentially be correlated with the six steps of the multi-hit hypothesis of ALS [70, 75].
Minor allele frequency
Defining a MAF threshold for ALS is complicated by numerous factors, including the spectrum of disease penetrance, late disease onset, and variable prevalence across ethnicities. Our analysis showed that ALS-implicated variants are typically very rare in the general population, with over half absent from neurologically normal controls, 80% with MAF < 0.000029 and 95% with MAF < 0.00049. There were however three ALS-implicated variants, ELP3 rs2614046 and rs6985069, and GPX3-TNIP1 rs10463311, with a MAF > 0.5. Each of these variants was reported in a genetic association study, thereby implicating their loci in ALS. This method of identification coupled with such a high MAF suggests that these three variants may actually be markers for an associated functional variant rather than themselves exerting disease effects. This contrasts with the C21orf2 p.V58 L risk variant, which was similarly identified by GWAS, though has a far lower MAF of 0.00795770, and has in vitro evidence to support a functional role in ALS [76]. The range of MAFs seen amongst ALS-implicated variants also reflects the fact that there is a spectrum of disease penetrance for ALS, ranging from highly penetrant familial variants (absent from neurologically normal control populations) that cause ALS in almost all carriers, to variants with variably reduced penetrance (absent or exceedingly rare in neurologically normal control populations), and finally to risk variants that confer much smaller, yet highly variable, magnitudes of disease susceptibility (potentially present, however rare, in neurologically normal control populations). This is exemplified when considering MAF for variants found in FALS cases or exclusively SALS cases, where we saw a striking, almost five-fold difference, with 80th percentile values of 0.0000096 in FALS and 0.0000471 in SALS. The more common, SALS-exclusive variants are therefore potentially either markers of rarer functional variants as mentioned above, or themselves risk factors with small disease effects.
The late onset of ALS further complicates the definition of an appropriate MAF threshold. Individuals who will go on to develop ALS later in life may inadvertently be included in control cohorts, and therefore ALS relevant genetic variation may also be present within such cohorts. Given disease onset can be seen anywhere from 20 to 90 + years of age, it is not possible to circumvent this issue by simply applying an age threshold to control cohorts. A further consideration around MAF is ethnicity, with disease related and common benign variants differing in frequency between distinct ethnic populations, as well as the incidence of ALS itself [77, 78]. Interestingly, we did not observe a notable difference in gnomAD MAFs for ALS-implicated variants between non-Finnish European and all ethnicities (Fig. 3), however this could stem from the fact that the non-Finnish European subset accounts for the largest proportion (44.98%) of the entire gnomAD non-neuro cohort.
A substantial proportion of ALS-implicated variants were reported prior to the availability of large public databases of common genetic variation. For these early studies, variants were compared to relatively small control cohorts that were often insufficient in size and power to properly resolve their true population-based frequency. Some historically implicated variants may be more common than originally reported, and in fact represent rare population-based variants rather than true ALS-relevant variation.
Genomic context
Sequence conservation is a strong indicator of potential ALS pathogenicity with 91.44% (961/1051 non-insertion variants) of ALS-implicated variants satisfying this criterion according to PhyloP. While PhyloP is included in the meta-predictor REVEL used as part of the deleteriousness prediction analysis, its use in isolation is necessary to consider conservation across species. Indeed, this more specialised analysis revealed that species conservation was a crucial variant level characteristic for ALS and was the most consistent feature across all ALS-implicated variants. Localisation to a functional protein domain was less prevalent, with only two-thirds of ALS-implicated variants falling within predicted domains. Interestingly, the proportion of ALS-implicated variants found in functional domains varies widely among ALS genes, with the highest percentages seen in the “major” ALS genes SOD1 (89.85%), TARDBP (87.30%) and FUS (75.44%). Variants in these genes have been shown to be among the most penetrant [65, 71, 72]. Further, we found that FALS variants fell in functional domains significantly more frequently than those found exclusively in SALS (p = 3.29x10⁻⁸). Together this suggests localisation to a protein functional domain may be a strong indicator of disease effect size and penetrance of ALS-implicated variants. Furthermore, the individual plots of each ALS gene provided in Supplementary Data file 3, will assist interpretation of novel variants by providing a visual representation of ALS-implicated variant hot spots. Interestingly, three or more ALS genes had ALS-implicated variants reported in Ubiquitin-related (n = 6 genes), Coiled-coil (n = 5 genes), Zinc finger (n = 4 genes) and Nuclear localisation signal (n = 3 genes) domains, suggesting these domain types may have an important role in ALS pathogenesis.
Conclusion
Our characterisation of ALS-implicated variants provides an executive overview of the key characteristics associated with ALS pathogenic potential. In particular, we highlighted the nuanced considerations specific to ALS that must be considered in variant interpretation.
ACKNOWLEDGEMENTS INCLUDING SOURCES OF SUPPORT
The authors thank Professor Benoit Liquet-Weiland from Macquarie University for providing expert advice regarding statistical correlation analyses. This work was funded by Motor Neuron Disease Research Australia (Beryl Bayley Postdoctoral Fellowship to EPM, Bill Gole Postdoctoral Fellowship to JAF and PhD top-up scholarship to NG), FightMND (Angie Cunningham PhD scholarship and grant-in-aid to NG and IPB) and the National Health and Medical Research Council of Australia (grants 1095215, 1176913 to IPB and fellowship 1092023 to KLW).
CONFLICT OF INTEREST
The authors have no conflict of interest to report.
SUPPLEMENTARY MATERIAL
[1] The supplementary material is available in the electronic version of this article: https://dx.doi.org/10.3233/JND-230148.
REFERENCES
[1] | Brown RH , Al-Chalabi A . Amyotrophic Lateral Sclerosis. N Engl J Med. (2017) ;377: :162–72. https://doi.org/10.1056/NEJMra1603471. |
[2] | Oskarsson B , Gendron TF , Staff NP . Amyotrophic Lateral Sclerosis: An Update for 2018. Mayo Clin Proc. (2018) ;93: :1617–28. https://doi.org/10.1016/j.mayocp.2018.04.007. |
[3] | Talbot K . Familial versus sporadic amyotrophic lateral sclerosis–a false dichotomy? Brain. (2011) ;134: :3429–31. https://doi.org/10.1093/brain/awr296. |
[4] | Talbot K . Motor neuron disease: the bare essentials. Pract Neurol. (2009) ;9: :303–9. https://doi.org/10.1136/jnnp.2009.188151. |
[5] | Kiernan MC , Vucic S , Cheah BC , Turner MR , Eisen A , Hardiman O , et al. Amyotrophic lateral sclerosis. Lancet. (2011) ;377: :942–55. https://doi.org/10.1016/S0140-6736(10)61156-7. |
[6] | Swinnen B , Robberecht W . The phenotypic variability of amyotrophic lateral sclerosis. Nat Rev Neurol. (2014) ;10: :661–70. https://doi.org/10.1038/nrneurol.2014.184. |
[7] | Tiryaki E , Horak HA . ALS and other motor neuron diseases. Continuum(Minneap Minn). (2014) ;20: :1185–207. https://doi.org/10.1212/01.CON.0000455886.14298.a4. |
[8] | Phukan J , Elamin M , Bede P , Jordan N , Gallagher L , Byrne S , et al. The syndrome of cognitive impairment in amyotrophic lateral sclerosis: a population-based study. J Neurol Neurosurg Psychiatry. (2012) ;83: :102–8. https://doi.org/10.1136/jnnp-2011-300188. |
[9] | Kim G , Gautier O , Tassoni-Tsuchida E , Ma XR , Gitler AD . ALS Genetics: Gains, Losses, and Implications for Future Therapies. Neuron. (2020) ;108: :822–42. https://doi.org/10.1016/j.neuron.2020.08.022. |
[10] | Al-Chalabi A , Fang F , Hanby MF , Leigh PN , Shaw CE , Ye W , et al. An estimate of amyotrophic lateral sclerosis heritability using twin data. J Neurol Neurosurg Psychiatry. (2010) ;81: :1324–6. https://doi.org/10.1136/jnnp.2010.207464. |
[11] | McLaughlin RL , Vajda A , Hardiman O . Heritability of Amyotrophic Lateral Sclerosis: Insights From Disparate Numbers. JAMA Neurol. (2015) ;72: :857–8. https://doi.org/10.1001/jamaneurol.2014.4049. |
[12] | Ryan M , Heverin M , McLaughlin RL , Hardiman O . Lifetime Risk and Heritability of Amyotrophic Lateral Sclerosis. JAMA Neurol. (2019) ;76: :1367–74. https://doi.org/10.1001/jamaneurol.2019.2044. |
[13] | Wingo TS , Cutler DJ , Yarab N , Kelly CM , Glass JD . The heritabilityof amyotrophic lateral sclerosis in a clinically ascertained UnitedStates research registry. PLoS One. (2011) ;6: :6–10. https://doi.org/10.1371/journal.pone.0s027985. |
[14] | Rosen v . Mutations in Cu/Zn superoxide dismutase gene areassociated with familial amyotrophic lateral sclerosis. Nature. (1993) ;364: :362. https://doi.org/10.1038/364362c0. |
[15] | Sreedharan J , Blair IP , Tripathi VB , Hu X , Vance C , Rogelj B , et al. TDP-43 mutations in familial and sporadic amyotrophic lateral sclerosis. Science (1979). (2008) ;319: :1668–72. https://doi.org/10.1126/science.1154584. |
[16] | Kwiatkowski TJ , Bosco DA , Leclerc AL , Tamrazian E , Vanderburg CR , Russ C , et al. Mutations in the FUS/TLS gene on chromosome 16 cause familial amyotrophic lateral sclerosis. Science (1979). (2009) ;323: :1205–8. https://doi.org/10.1126/science.1166066. |
[17] | Vance C , Rogelj B , Hortobagyi T , de Vos KJ , Nishimura AL , Sreedharan J , et al. Mutations in FUS, an RNA processing protein, cause familial amyotrophic lateral sclerosis type 6. Science (1979). (2009) ;323: :1208–11. https://doi.org/10.1126/science.1165942. |
[18] | DeJesus-Hernandez M , Mackenzie IR , Boeve BF , Boxer AL , Baker M , Rutherford NJ , et al. Expanded GGGGCC hexanucleotide repeat in noncoding region of C9ORF72 causes chromosome 9p-linked FTD and ALS. Neuron. (2011) ;72: :245–56. https://doi.org/doi:10.1016/j.neuron.2011.09.011. |
[19] | Renton AE , Majounie E , Waite A , Simon-Sanchez J , Rollinson S , Gibbs JR , et al. A hexanucleotide repeat expansion in C9ORF72 is the cause of chromosome 9p21-linked ALS-FTD. Neuron. (2011) ;72: :257–68. https://doi.org/10.1016/j.neuron.2011.09.010. |
[20] | Deng HX , Chen W , Hong ST , Boycott KM , Gorrie GH , Siddique N , et al. Mutations in UBQLN2 cause dominant X-linked juvenile and adult-onset ALS and ALS/dementia. Nature. (2011) ;477: :211–5. https://doi.org/10.1038/nature10353. |
[21] | Williams KL , Warraich ST , Yang S , Solski JA , Fernando R , Rouleau GA , et al. UBQLN2/ubiquilin 2 mutation and pathology in familial amyotrophic lateral sclerosis. Neurobiol Aging. (2012) ;33: :3–10. https://doi.org/10.1016/j.neurobiolaging.2012.05.008. |
[22] | Maruyama H , Morino H , Ito H , Izumi Y , Kato H , Watanabe Y , et al. Mutations of optineurin in amyotrophic lateral sclerosis. Nature. (2010) ;465: :223–6. https://doi.org/10.1038/nature08971. |
[23] | Cirulli ET , Lasseigne BN , Petrovski S , Sapp PC , Dion PA , Leblond CS , et al. Exome sequencing in amyotrophic lateral sclerosis identifies risk genes and pathways. Science (1979). (2015) ;347: :1436–41. https://doi.org/10.1126/science.aaa3650. |
[24] | Freischmidt A , Wieland T , Richter B , Ruf W , Schaeffer V , Muller K , et al. Haploinsufficiency of TBK1 causes familial ALS and fronto-temporal dementia. Nat Neurosci. (2015) ;18: :631–6. https://doi.org/10.1038/nn.4000. |
[25] | Williams KL , Topp S , Yang S , Smith B , Fifita JA , Warraich ST , et al. CCNF mutations in amyotrophic lateral sclerosis and frontotemporal dementia. Nat Commun. (2016) ;7: :11253. https://doi.org/10.1038/ncomms11253. |
[26] | Brenner D , Müller K , Wieland T , Weydt P , S B , Lulé D , et al. NEK1 mutations in familial amyotrophic lateral sclerosis. Braine. (2016) ;139: :28. https://doi.org/10.1093/brain/aww033. |
[27] | Nicolas A , Kenna K , Renton A , Ticozzi N , Faghri F , Chia R , et al. Genome-wide Analyses Identify KIF5A as a Novel ALS Gene. Neuron. (2018) ;97: :1268–83. https://doi.org/10.1016/j.neuron.2018.02.027. |
[28] | Liu YT , Lee YC , Soong BW . What we have learned from the next-generation sequencing: Contributions to the genetic diagnoses and understanding of pathomechanisms of neurodegenerative diseases. J Neurogenet. (2015) ;29: :103–12. https://doi.org/10.3109/01677063.2015.1060972. |
[29] | Bennett JS , Bernhardt M , McBride KL , Reshmi SC , Zmuda E , Kertesz NJ , et al. Reclassification of Variants of Uncertain Significance in Children with Inherited Arrhythmia Syndromes is Predicted by Clinical Factors. Pediatr Cardiol. (2019) ;40: :1679–87. https://doi.org/10.1007/s00246-019-02203-2. |
[30] | Mersch J , Brown N , Pirzadeh-Miller S , Mundt E , Cox HC , Brown K , et al. Prevalence of Variant Reclassification Following Hereditary Cancer Genetic Testing. JAMA. (2018) ;320: :1266–74. https://doi.org/10.1001/jama.2018.13152. |
[31] | SoRelle JA , Thodeson DM , Arnold S , Gotway G , Park JY . Clinical Utility of Reinterpreting Previously Reported Genomic Epilepsy Test Results for Pediatric Patients. JAMA Pediatre. (2019) ;173: :e182302. https://doi.org/10.1001/jamapediatrics.2018.2302. |
[32] | McCann EP , Henden L , Fifita JA , Zhang KY , Grima N , Bauer DC , et al. Evidence for polygenic and oligogenic basis of Australian sporadic amyotrophic lateral sclerosis. J ed Genet 2020. https://doi.org/10.1136/jmedgenet-2020-106866. |
[33] | Dobson-Stone C , Hallupp M , Shahheydari H , Ragagnin AMG , Chatterton Z , Carew-Jones F , et al. CYLD is a causative gene for frontotemporal dementia - amyotrophic lateral sclerosis. Brain 2020. https://doi.org/10.1093/brain/awaa039. |
[34] | Lefter M , Vis JK , Vermaat M , den Dunnen JT , Taschner PEM , Laros JFJ . Next Generation HGVS Nomenclature Checker. Bioinformatics. (2021) ;37: :2811–7. https://doi.org/10.1093/bioinformatics/btab051. |
[35] | Li H , Durbin R . Fast and accurate short read alignment with Burrows-Wheeler transform. Bioinformatics. (2009) ;25: :1754–60. https://doi.org/10.1093/bioinformatics/btp324. |
[36] | Li H , Durbin R . Fast and accurate long-read alignment with Burrows-Wheeler transform. Bioinformatics. (2010) ;26: :589–95. https://doi.org/10.1093/bioinformatics/btp698. |
[37] | McKenna A , Hanna M , Banks E , Sivachenko A , Cibulskis K , Kernytsky A , et al. The Genome Analysis Toolkit: a MapReduce framework for analyzing next-generation DNA sequencing data. Genome Res. (2010) ;20: :1297–303. https://doi.org/10.1101/gr.107524.110. |
[38] | der Auwera GA , Carneiro MO , Hartl C , Poplin R , del Angel G , Levy-Moonshine A , et al. From FastQ data to high confidence variant calls: the Genome Analysis Toolkit best practices pipeline. Curr Protoc Bioinformatics. (2013) ;43: :1–33. https://doi.org/10.1002/0471250953.bi1110s43. |
[39] | DePristo MA , Banks E , Poplin R , Garimella K v , Maguire JR , Hartl C , et al. A framework for variation discovery and genotyping using next-generation DNA sequencing data. Nat Genet. (2011) ;43: :491–8. https://doi.org/10.1038/ng.806. |
[40] | Morales J , Pujar S , Loveland JE , Astashyn A , Bennett R , Berry A , et al. A joint NCBI and EMBL-EBI transcript set for clinical genomics and research. Nature. (2022) ;604: :310–5. https://doi.org/10.1038/s41586-022-04558-8. |
[41] | Wickham H , Francois R , Henry L , Müller K . dplyr: A Grammar of Data Manipulation 2021. |
[42] | Wickham H . Elegant graphics for data analysis. vol. Wickham201. 2016. |
[43] | Henry L , Wickham H . purrr: Functional Programming Tools 2020. |
[44] | Wickham H , Hester J , Bryan J . readr: Read Rectangular Text Data 2021. |
[45] | Wickham H , Bryan J . readxl: Read Excel Files 2019. |
[46] | Wickham H . Reshaping Data with the reshape Package. J Stat Softw. (2007) ;21: :1–20. https://doi.org/10.18637/jss.v021.i12. |
[47] | Hart A , Martinez S . {spgs}: Statistical Patterns in Genomic Sequences 2019. |
[48] | Wickham H . stringr: Simple, Consistent Wrappers for Common String Operations 2019. |
[49] | Wickham H . tidyr: Tidy Messy Data 2021. |
[50] | Wickham H , Averick M , Bryan J , Chang W , McGowan LD , Francois R , et al. Welcome to the tidyverse. J Open Source Softw. (2019) ;4: :1686. https://doi.org/10.21105/joss.01686. |
[51] | Wang Q , Pierce-Hoffman E , Cummings BB , Alföldi J , Francioli LC , Gauthier LD , et al. Landscape of multi-nucleotide variants in 125,748 human exomes and 15,708 genomes. Nat Commun. (2020) ;11: :2539. https://doi.org/10.1038/s41467-019-12438-5. |
[52] | Marin B , Boumediene F , Logroscino G , Couratier P , Babron MC , Leutenegger AL , et al. Variation in worldwide incidence of amyotrophic lateral sclerosis: a meta-analysis. Int J Epidemiol. (2017) ;46: :57–74. https://doi.org/10.1093/ije/dyw061. |
[53] | Kircher M , Witten DM , Jain P , O’Roak BJ , Cooper GM , Shendure J . A general framework for estimating the relative pathogenicity of human genetic variants. Nat Genet. (2014) ;46: :310–5. https://doi.org/10.1038/ng.2892. |
[54] | Rentzsch P , Schubach M , Shendure J , Kircher M . CADD-Splice—improving genome-wide variant effect prediction using deep learning-derived splice scores. Genome Med. (2021) ;13: :31. https://doi.org/10.1186/s13073-021-00835-9. |
[55] | Rentzsch P , Witten D , Cooper GM , Shendure J , Kircher M . CADD: predicting the deleteriousness of variants throughout the human genome. Nucleic Acids Res. (2019) ;47: :D886–94. https://doi.org/10.1093/nar/gky1016. |
[56] | Ioannidis NM , Rothstein JH , Pejaver V , Middha S , McDonnell SK , Baheti S , et al. REVEL: An Ensemble Method for Predicting the Pathogenicity of Rare Missense Variants. Am J Hum Genet. (2016) ;99: :877–85. https://doi.org/10.1016/j.ajhg.2016.08.016. |
[57] | Sigrist CJA , de Castro E , Cerutti L , Cuche BA , Hulo N , Bridge A , et al. New and continuing developments at PROSITE. Nucleic Acids Res. (2013) ;41: :D344–7. https://doi.org/10.1093/nar/gks1067. |
[58] | Letunic I , Khedkar S , Bork P . SMART: recent updates, new developments and status in 2020. Nucleic Acids Res. (2021) ;49: :D458–60. https://doi.org/10.1093/nar/gkaa937. |
[59] | Consortium U . UniProt: the universal protein knowledgebase in 2021. Nucleic Acids Res. (2021) ;49: :D480–9. https://doi.org/10.1093/nar/gkaa1100. |
[60] | Karczewski KJ , Francioli LC , Tiao G , Cummings BB , Alföldi J , Wang Q , et al. The mutational constraint spectrum quantified from variation in 141,456 humans. Nature. (2020) ;581: :434–43. https://doi.org/10.1038/s41586-020-2308-7. |
[61] | Ashburner M , Ball CA , Blake JA , Botstein D , Butler H , Cherry JM , et al. Gene ontology: tool for the unification of biology. The Gene Ontology Consortium. Nat Genet. (2000) ;25: :25–9. https://doi.org/10.1038/75556. |
[62] | Gene Ontology Consortium T . The Gene Ontology resource: enriching a GOld mine. Nucleic Acids Res. (2021) ;49: :D325–34. https://doi.org/10.1093/nar/gkaa1113. |
[63] | Ritchie ME , Phipson B , Wu D , Hu Y , Law CW , Shi W , et al. Limma powers differential expression analyses for RNA-sequencing and microarray studies. Nucleic Acids Res. (2015) ;47: :e47. https://doi.org/10.1093/nar/gkv007. |
[64] | Carlson M . org.Hs.eg.db: Genome wide annotation for Human 2021. |
[65] | Lattante S , Rouleau GA , Kabashi E . TARDBP and FUS mutations associated with amyotrophic lateral sclerosis: summary and update. Hum Mutat. (2013) ;34: :812–26. https://doi.org/10.1002/humu.22319. |
[66] | Mejzini R , Flynn LL , Pitout IL , Fletcher S , Wilton SD , Akkari PA . ALS Genetics, Mechanisms, and Therapeutics: Where Are We Now? Front Neurosci. (2019) ;13: :1310. https://doi.org/10.3389/fnins.2019.01310. |
[67] | Zhang J , Yao Y , He H , Shen J . Clinical Interpretation of Sequence Variants. Curr Protoc Hum Genete. (2020) ;106: :98. https://doi.org/10.1002/cphg.98. |
[68] | Petrovski S , Wang Q , Heinzen EL , Allen AS , Goldstein DB . Genic intolerance to functional variation and the interpretation of personal genomes. PLoS Genete. (2013) ;9: :e1003709. https://doi.org/10.1371/journal.pgen.1003709. |
[69] | Richards S , Aziz N , Bale S , Bick D , Das S , Gastier-Foster J , et al. Standards and guidelines for the interpretation of sequence variants: a joint consensus recommendation of the American College of Medical Genetics and Genomics and the Association for Molecular Pathology. Genet Med. (2015) ;17: :405–24. https://doi.org/10.1038/gim.2015.30. |
[70] | Al-Chalabi A , Calvo A , Chio A , Colville S , Ellis CM , Hardiman O , et al. Analysis of amyotrophic lateral sclerosis as a multistep process: a population-based modelling study. Lancet Neurol. (2014) ;13: :1108–13. https://doi.org/10.1016/S1474-4422(14)70219-4. |
[71] | McCann EP , Williams KL , Fifita JA , Tarr IS , O’Connor J , Rowe DB , et al. The genotype-phenotype landscape of familial amyotrophic lateral sclerosis in Australia. Clin Genet. (2017) ;92: :259–66. https://doi.org/10.1111/cge.12973. |
[72] | Andersen PM . Amyotrophic lateral sclerosis associated with mutations in the CuZn superoxide dismutase gene. Curr Neurol Neurosci Rep. (2006) ;6: :37–46. https://doi.org/10.1007/s11910-996-0008-9. |
[73] | van Rheenen W , Shatunov A , Dekker AM , McLaughlin RL , Diekstra FP , Pulit SL , et al. Genome-wide association analyses identify new risk variants and the genetic architecture of amyotrophic lateral sclerosis. Nat Genet. (2016) ;48: :1043–8. https://doi.org/10.1038/ng.3622. |
[74] | Oza AM , DiStefano MT , Hemphill SE , Cushman BJ , Grant AR , Siegert RK , et al. Expert specification of the ACMG/AMP variant interpretation guidelines for genetic hearing loss. Hum Mutat. (2018) ;39: :1593–613. https://doi.org/10.1002/humu.23630. |
[75] | Chio A , Mazzini L , D’Alfonso S , Corrado L , Canosa A , Moglia C , et al. The multistep hypothesis of ALS revisited: The role of genetic mutations. Neurologye. (2018) ;91: :635–42. https://doi.org/doi:10.1212/WNL.0000000000005996. |
[76] | Watanabe Y , Nakagawa T , Akiyama T , Nakagawa M , Suzuki N , Warita H , et al. An Amyotrophic Lateral Sclerosis-Associated Mutant of C21ORF2 Is Stabilized by NEK1-Mediated Hyperphosphorylation and the Inability to Bind FBXO3. IScience. (2020) ;23: :101491. https://doi.org/10.1016/j.isci.2020.101491. |
[77] | Rechtman L , Jordan H , Wagner L , Horton DK , Kaye W . Racial and ethnic differences among amyotrophic lateral sclerosis cases in the United States. Amyotroph Lateral Scler Frontotemporal Degener. (2015) ;16: :65–71. https://doi.org/10.3109/21678421.2014.971813. |
[78] | Roberts AL , Johnson NJ , Chen JT , Cudkowicz ME , Weisskopf MG . Race/ethnicity, socioeconomic status, and ALS mortality in the United States. Neurology. (2016) ;87: :2300–8. https://doi.org/10.1212/WNL.0000000000003298. |


