
Application of neutrosophic optimal network using operations
Abstract
Neutrosophic graphs deals with more complex, uncertain problems in real-life applications which provides more flexibility and compatibility than Intuitionistic fuzzy graphs. The aim of this paper is to enrich the efficiency of the network in accordance with productivity and quality. Here we develop two Neutrosophic graphs into a fully connected Neutrosophic network using the product of graphs. Such a type of network is formed from individuals with unique aspects in every field of work among them. This study proposes extending the other graph products and forming a single valued Neutrosophic graph to find the efficient productivity in the flow of information on a single source network of a single valued Neutrosophic network. An Optimal algorithm is proposed and illustrated with an application.
1Introduction
Graph Theory, a convenient mathematical tool has a broad spectrum of uses in various fields of Science and Technology. The graph is usually a graphical representation of practical, real-world problems. A graph is a collection of sets
There exists many different of information in real-world problems that can be modeled using several types of graphs such as fuzzy graphs, Intuitionistic fuzzy graphs and Neutrosophic graphs [13, 18]. Shannon and Atanassov introduced the concept of Intuitionistic fuzzy graphs [14]. Parvathi et al. [9] proposed some operations between two Intuitionistic fuzzy graphs. Rashmanlou et al. [13] proposed graph operations such as Direct product, semi-strong product, strong product, and Lexicographic on Intuitionistic fuzzy graphs. Mahapatra et al. [15] introduced the fuzzy fractional chromatic number for calculating lexicographic product on two fuzzy graphs, also investigated m-polar fuzzy graphs and their applications [16, 17]. Neutrosophic graphs are used to model real-world problems which consist of in-consistent information. Many Scientists such as Broumi et al. [7], Yang et al. [1] and Akram [3, 4] have researched under a Neutrosophic environment. Single-valued Neutrosophic sets introduced by Haibin Wang are a subclass of Neutrosophic sets that are independent of membership values ranging from [0, 1]. Related work in the extension of the single-valued Neutrosophic set is found in [1, 6].
The main motivation of this research work is to find the most efficient optical network using different operations on single-valued Neutrosophic Graphs- (SVNG) such as Lexicographic, Symmetric difference, Residue product, and Max product based on the domination parameter presented. Further extended our study on its applications and finding the effective minimal spanning tree. In section 2 the motivation and research background is listed with preliminaries for the study. In section 3 we define the different types of operations such as Lexicographic, Symmetric difference, Residue product, Max product and examine the efficiency of the network using the score function. In section 4 the optimal network of symmetric difference is identified and its applications are given for better sales training technology.
2Preliminaries
Definition 2.1. [2] Let
Definition 2.2. [2] Let
i) T μ (x, y) ≤ T σ (x) ∧ T σ (y) , ∀ (x, y) ∈ VG × VG.
ii) I μ (x, y) ≤ I σ (x) ∧ I σ (y) , ∀ (x, y) ∈ VG × VG.
iii) F μ (x, y) ≥ F σ (x) ∨ F σ (y) , ∀ (x, y) ∈ VG × VG.
Definition 2.3. [8] The SVNG
Definition 2.4. [8] The SVNG
Definition 2.5. [8] Let ud be a vertex in a
The minimum degree of
The maximum degree of
Definition 2.6. [12] The cardinality of a vertex
The cardinality of an edge
Definition 2.7. [2] Let
The cartesian product
i)
ii)
iii)
The cartesian product1)
2)
Definition 2.8. [2] The Lexicographic product LP1 · LP2 of two graphs LP1 = (M1, N1) and LP2 = (M2, N2) is such that
i) The vertex set of LP1 · LP2 is the cartesian product V (LP1) × V (LP2).
ii) Any two vertices (m1, n1) and (m2, n2) are adjacent in LP1 · LP2 iff either m1 is adjacent to m2 in LP1 or m1 = m2 and n1 is adjacent to n1 in LP2
Definition 2.9. [8] The residue product of RP1 · RP2 two graphs RP1 and RP2 is defined as
σRP1·RP2 (u1, v1) = σRP1 (u1) ∨ σRP2 (v1)
and μRP1·RP2 ((u1, v1) (u2, v2)) = μRP1 (u1u2),
If
μRP1·RP2 ((u1, v1) (u2, v2)) ≤ σRP1(u1,v1) ∧ σRP2(u2,v2).
Definition 2.10. [2] Let SD1 = (σ1, μ1) and SD2 = (σ2, μ2) be two SVNGs of the graphs GSD1 = (V1, E1) and GSD2 = (V2, E2) respectively. Then the symmetric difference of SD1 and SD2 is defined as
i) ∀ (x, y) ∈ V1 × V2.
ii) ∀ x ∈ V1 and (y, z) ∈ E2,
iii) ∀ x ∈ V2 and (y, z) ∈ E1,
iv) ∀ (x, y) ∉ E1 and (z, w) ∈ E2,
v) ∀ (x, y) ∈ E1 and (z, w) ∉ E2,
Definition 2.11. [8] Let
The Max product of two Intuitionistic fuzzy graph MP1, MP2 and is denoted by
MP1 * MP2
where
Definition 2.12. [12] In a SVNG, NG = (A, B), the domination number is defined by the minimum cardinality among all the minimal dominating set of NG and it is denoted by γSVN (NG).
Definition 2.13. [20] Let
Let
The operations on single-valued Neutrosophic Graphs (SVNG) such as Lexicographic, Symmetric difference, Residue product and Max product are studied from [2, 6, 8].
3Domination on operations of single-valued Neutrosophic graphs
3.1Lexicographic product of two single-valued Neutrosophic graphs
3.1.1Definition
Let LP1 = (M1, N1) and LP2 = (M2, N2) be two single-valued Neutrosophic networks of the graphs GLP1 = (V1, E1) and GLP2 = (V2, E2) respectively. The Lexicographic product graph is denoted as
i)
ii)
iii)
3.1.2Example
Let SVNG
Fig. 1
SVNG
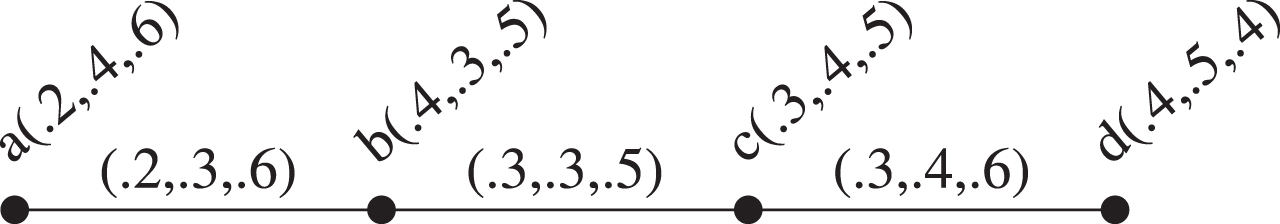
Fig. 2
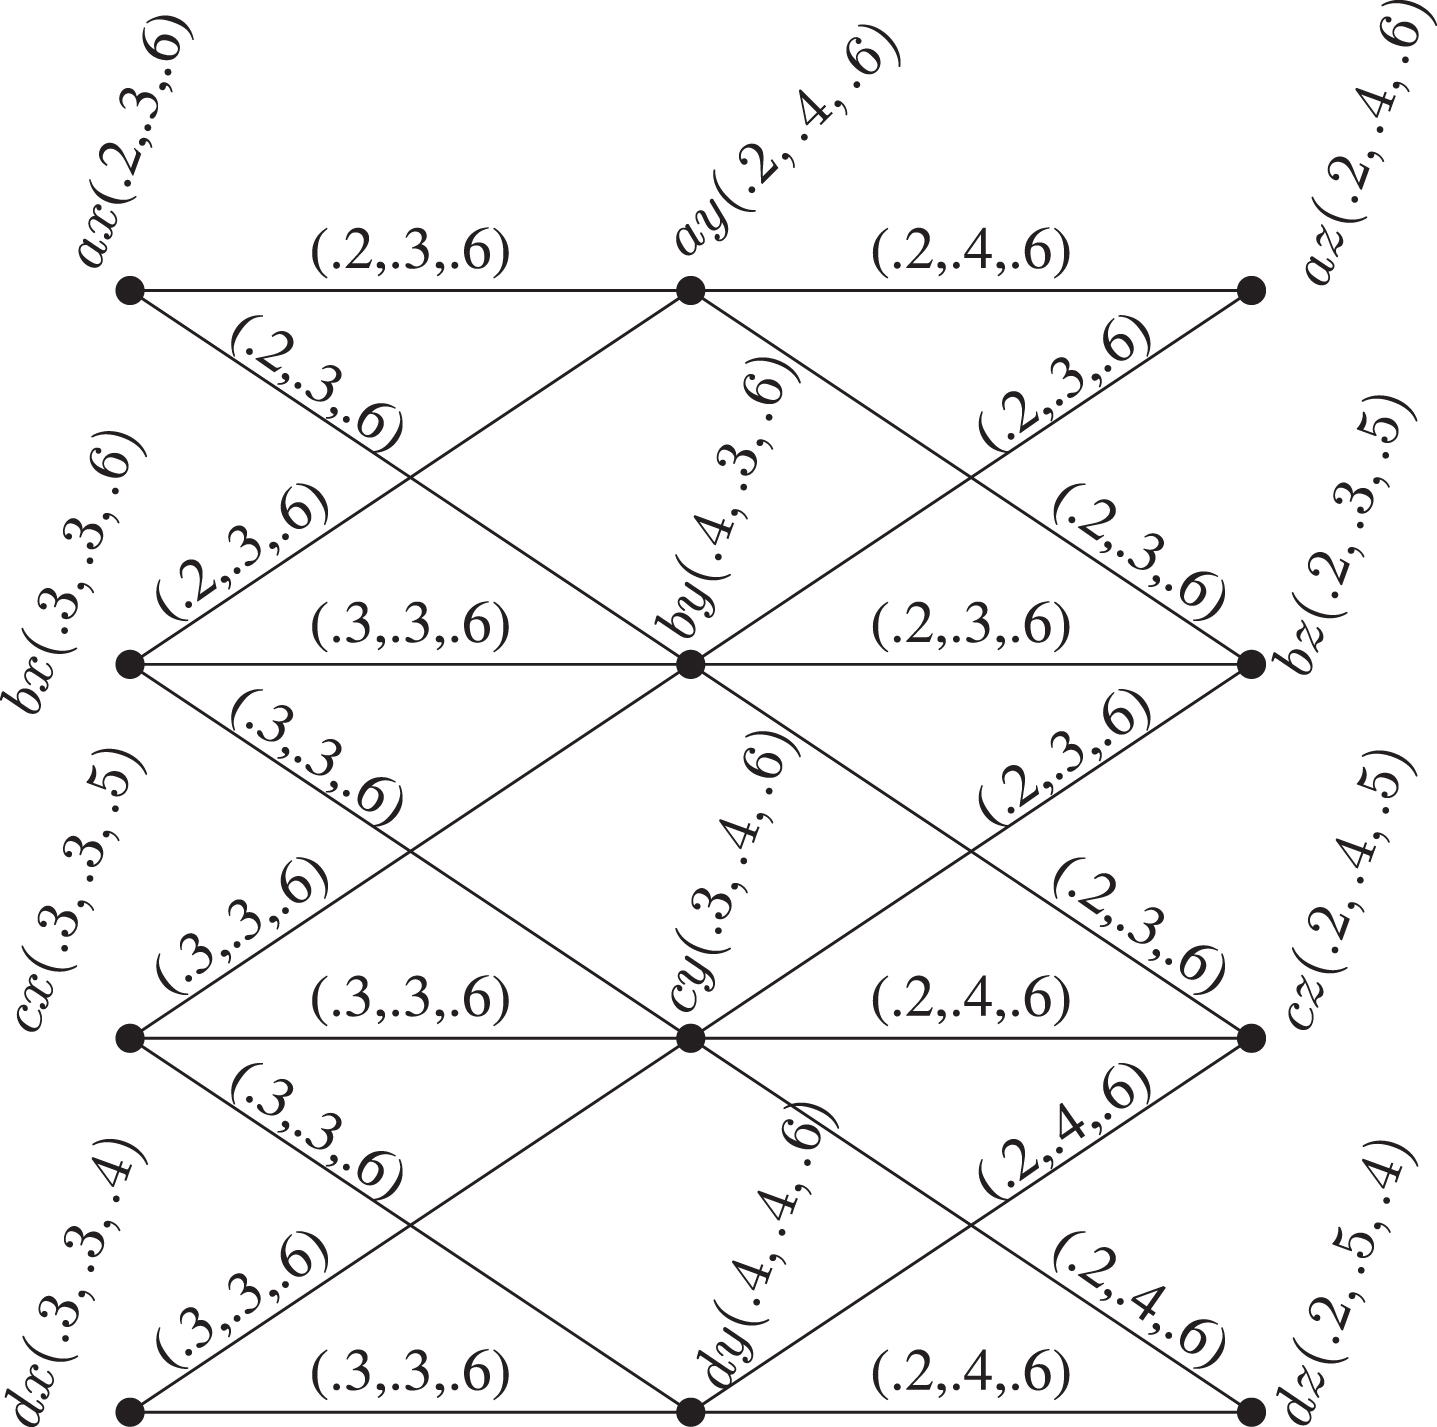
SVNG
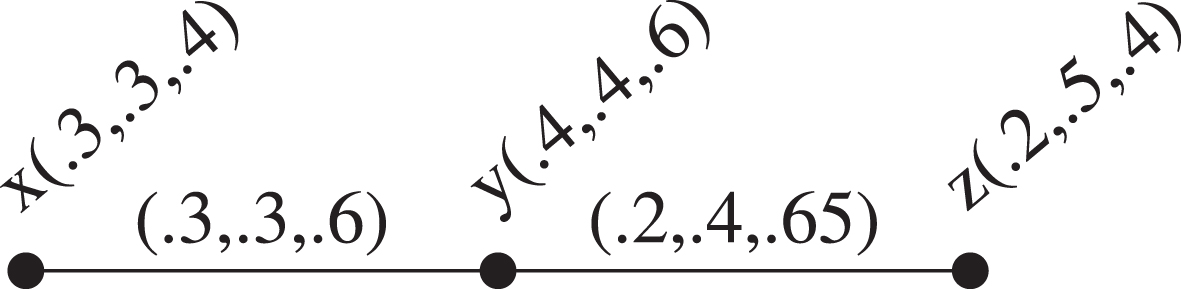
Fig. 3
To analyze the optimal network from the constructed network, we define an efficient score function to find the minimum domination number of the weighted SVNG network. The score function defined by us is more efficient than the existing score function defined in 2.13 since, Indeterminacy value (I) does not depend on both Truth (T) and Falsity (F) value because I is not a complement of T and F and the values of T, I, F are independent of each other. Even though the value of indeterminacy is uncertain, we assume it by taking 0.5 as both chances of truth and falsity which makes our work the significant advantage of defining efficient networks.
Hence, we define the Edge score function (ESF) and Vertex score function (VSF) of a single-valued Neutrosophic graph to find the minimum weight of the spanning tree as follows:
The weighted
Fig. 4
The domination number of the dominating sets S1, S2, S3, S4, S5 are
The minimal spanning tree of the weighted network
Fig. 5
Minimum Spanning Tree of
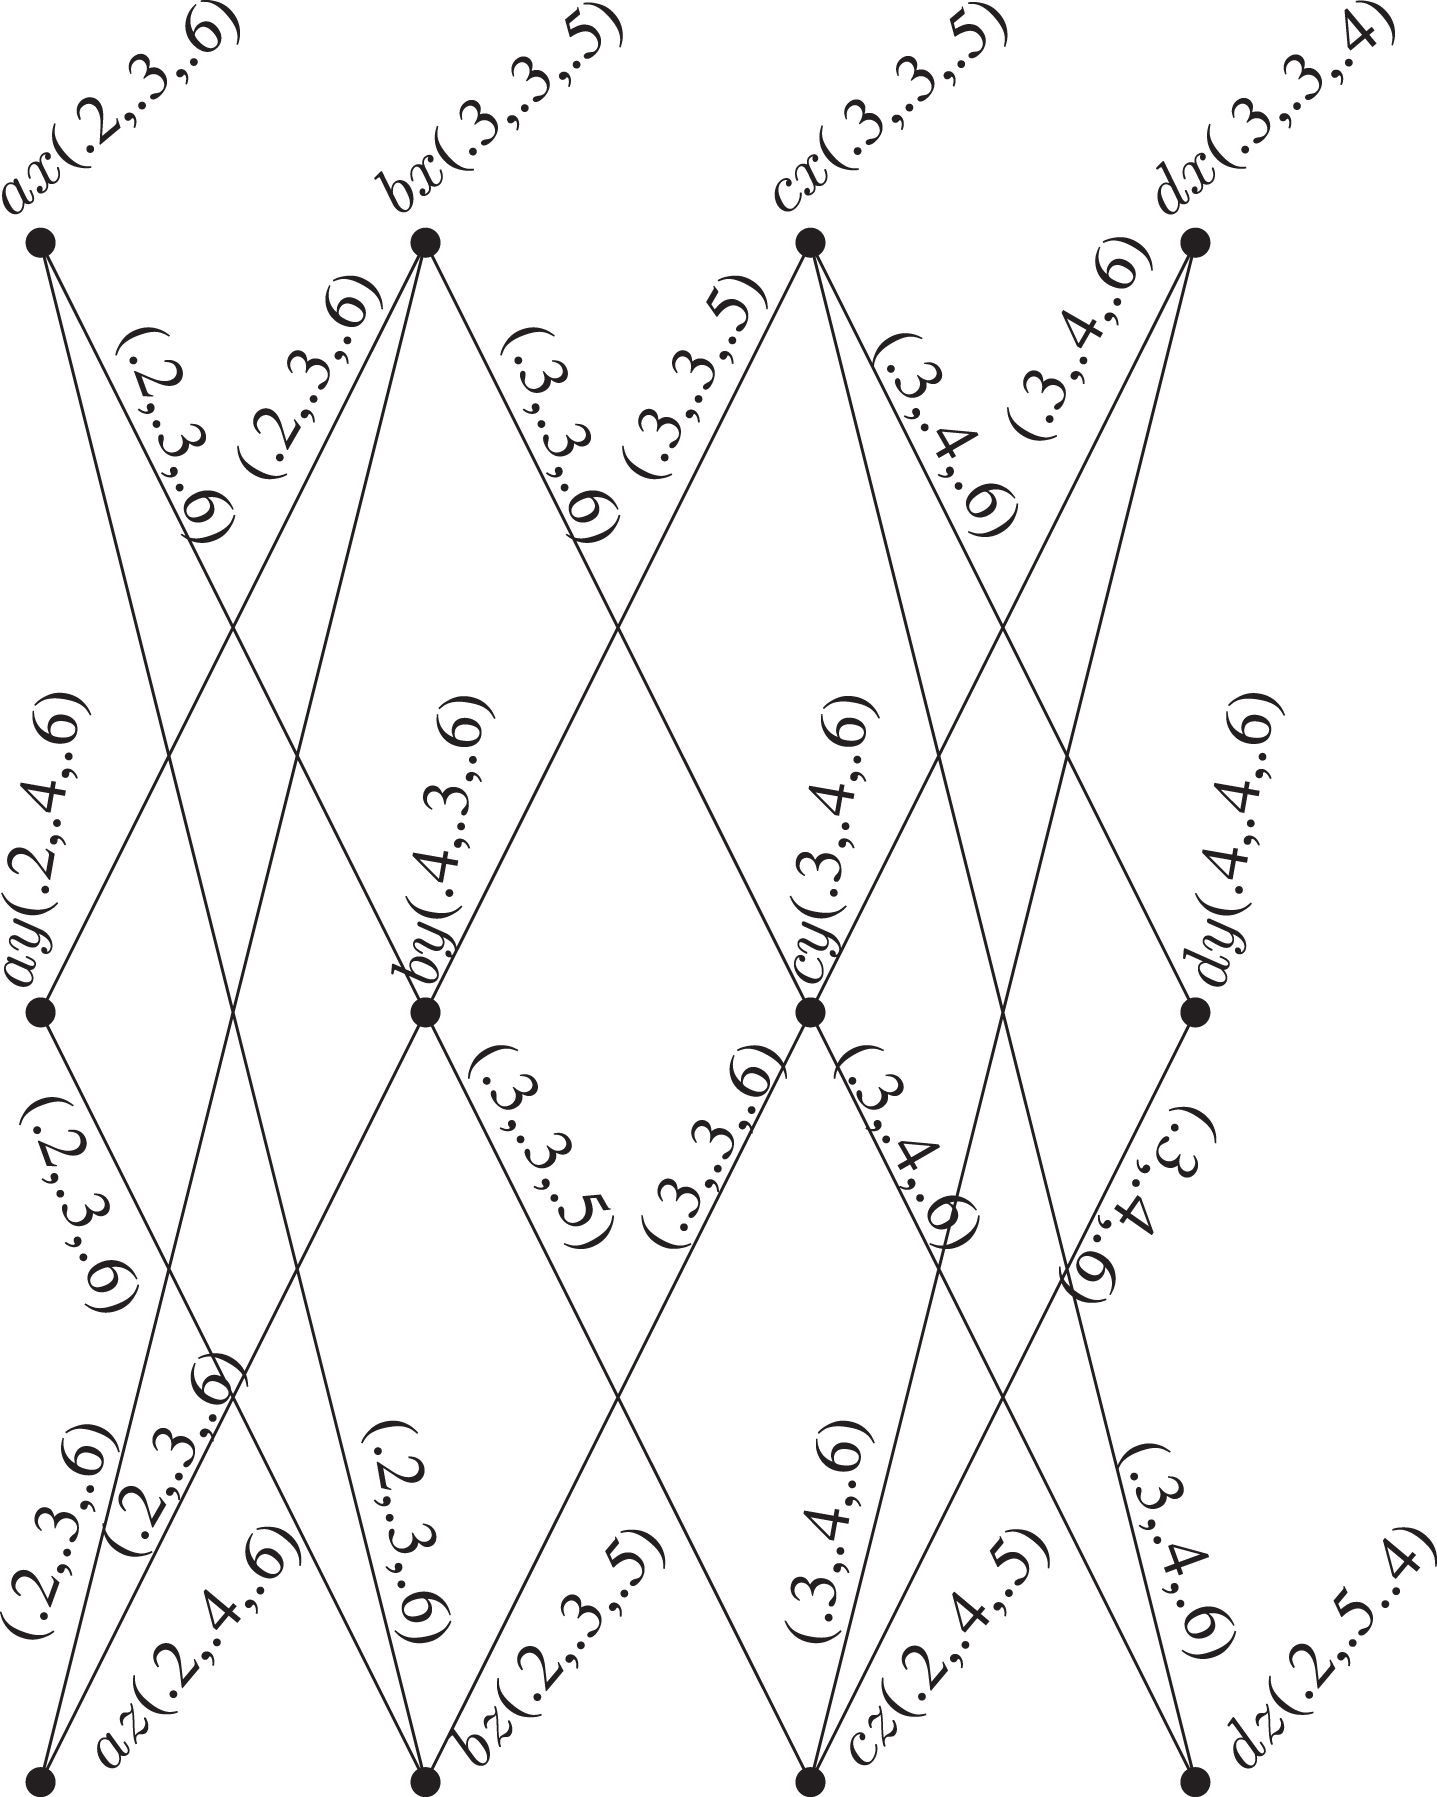
3.2Symmetric difference of two single-valued Neutrosophic graphs
Let SD1 = (σ1, μ1) and SD2 = (σ2, μ2) be two SVNGs of the graphs GSD1 = (V1, E1) & GSD2 = (V2, E2) respectively. Then the symmetric difference of SD1 & SD2 is defined and denoted as
i) ∀ (x, y) ∈ V1 × V2.
ii) ∀ x ∈ V1 and (y, z) ∈ E2,
(a) (T μSD1 ⊕ T μSD2) ((x, y) , (x, z)) = T σSD1 (x) ∧ T μSD2 (y, z);
(b) (I μSD1 ⊕ I μSD2) ((x, y) , (x, z)) = I σSD1 (x) ∧ I μSD2 (y, z);
(c) (F μSD1 ⊕ F μSD2) ((x, y) , (x, z)) = F σSD1 (x) ∨ F μSD2 (y, z);
iii) ∀ x ∈ V2 and (y, z) ∈ E1,
iv) ∀ (x, y) ∉ E1 and (z, w) ∈ E2,
v) ∀ (x, y) ∈ E1 and (z, w) ∉ E2,
3.2.1Example
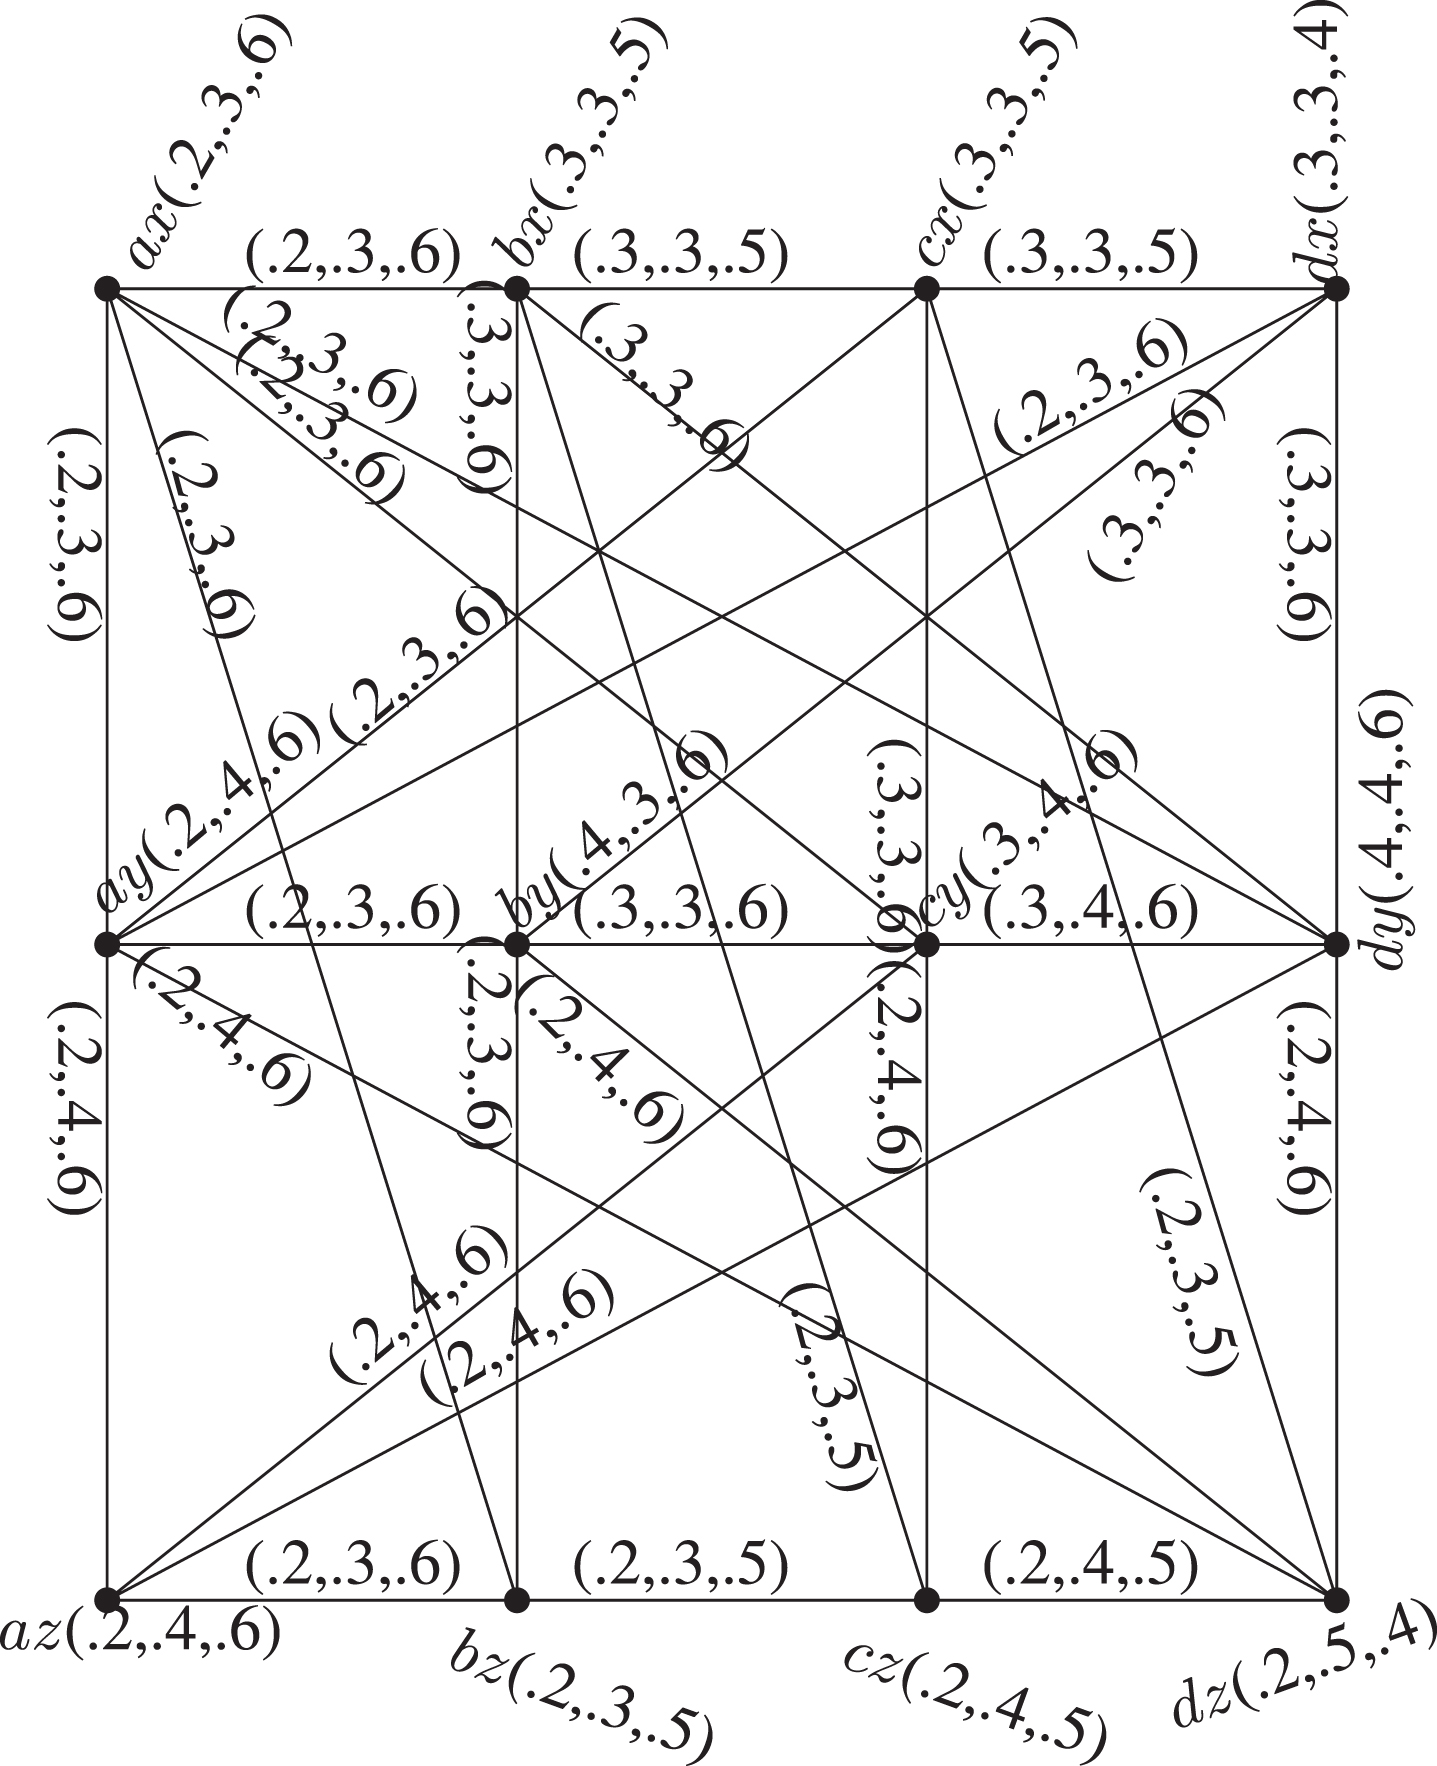
Let SVNG
Fig. 6
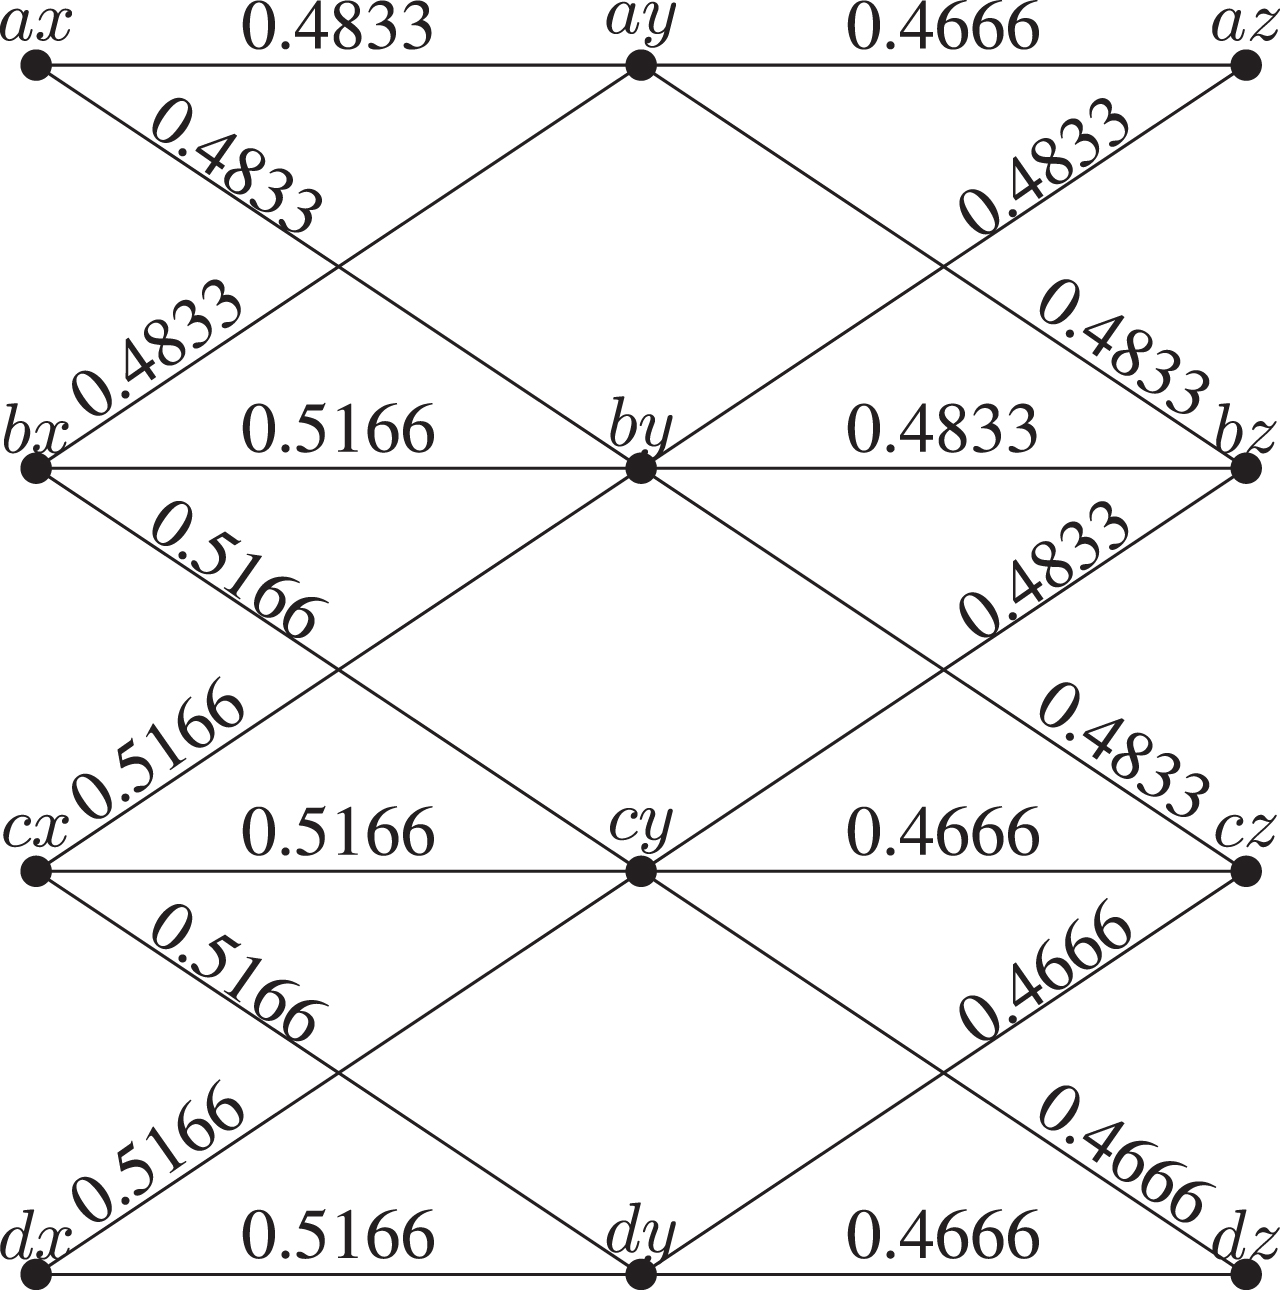
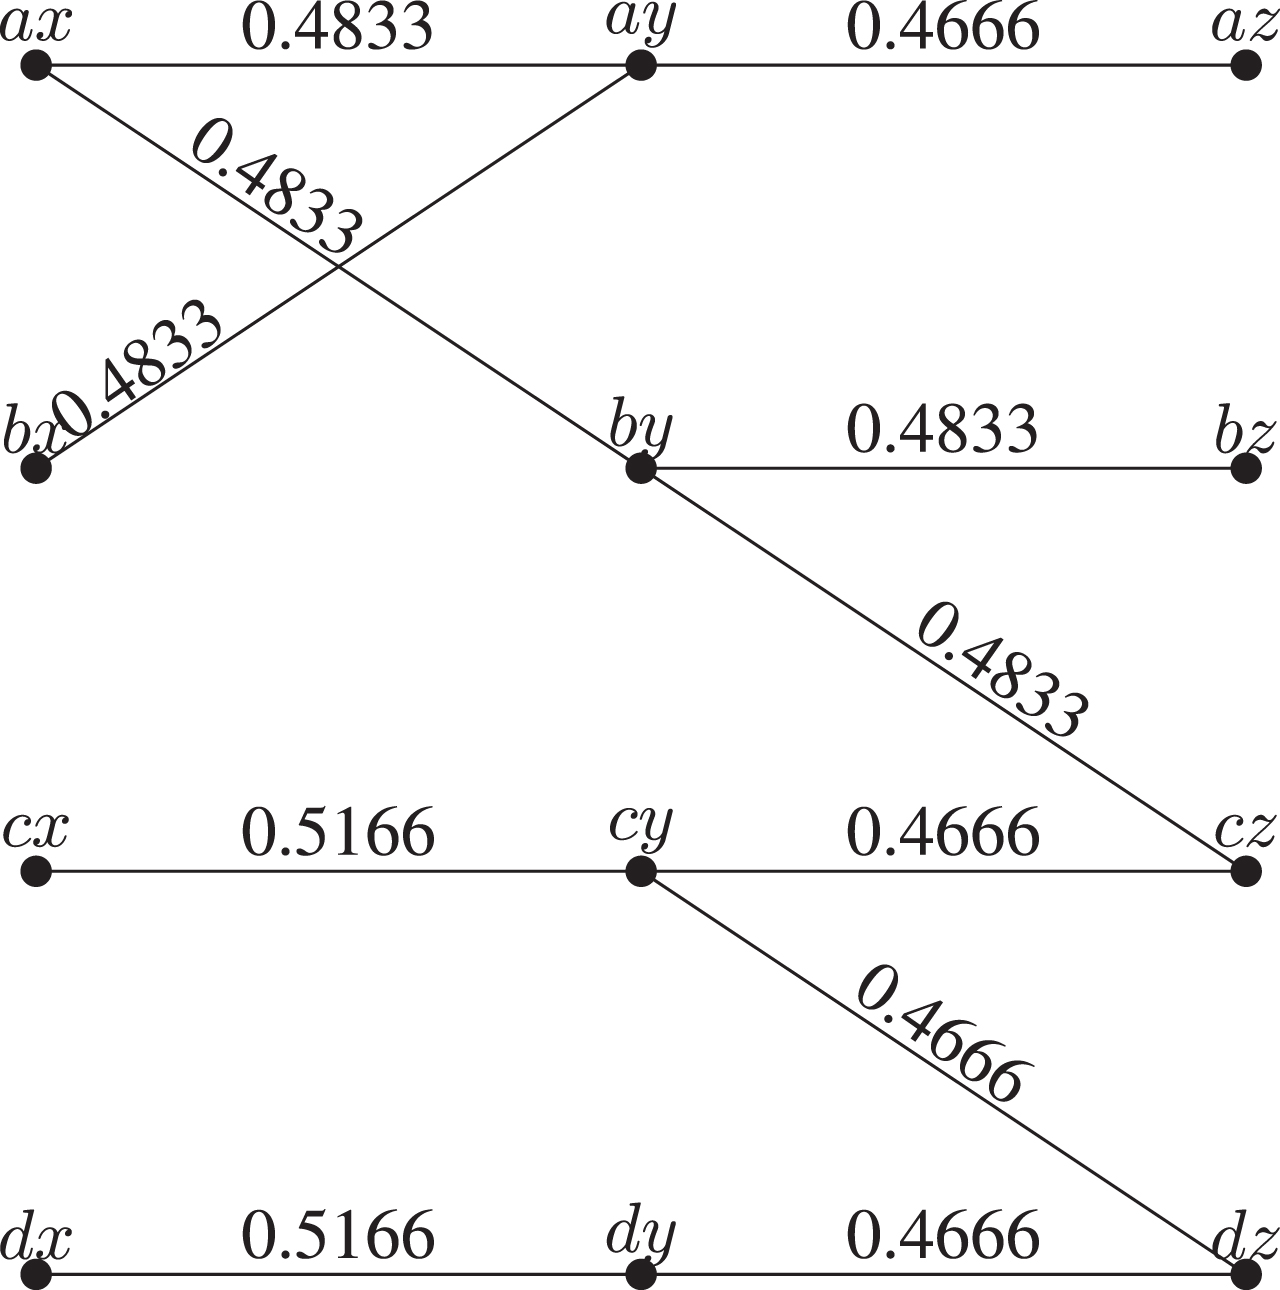
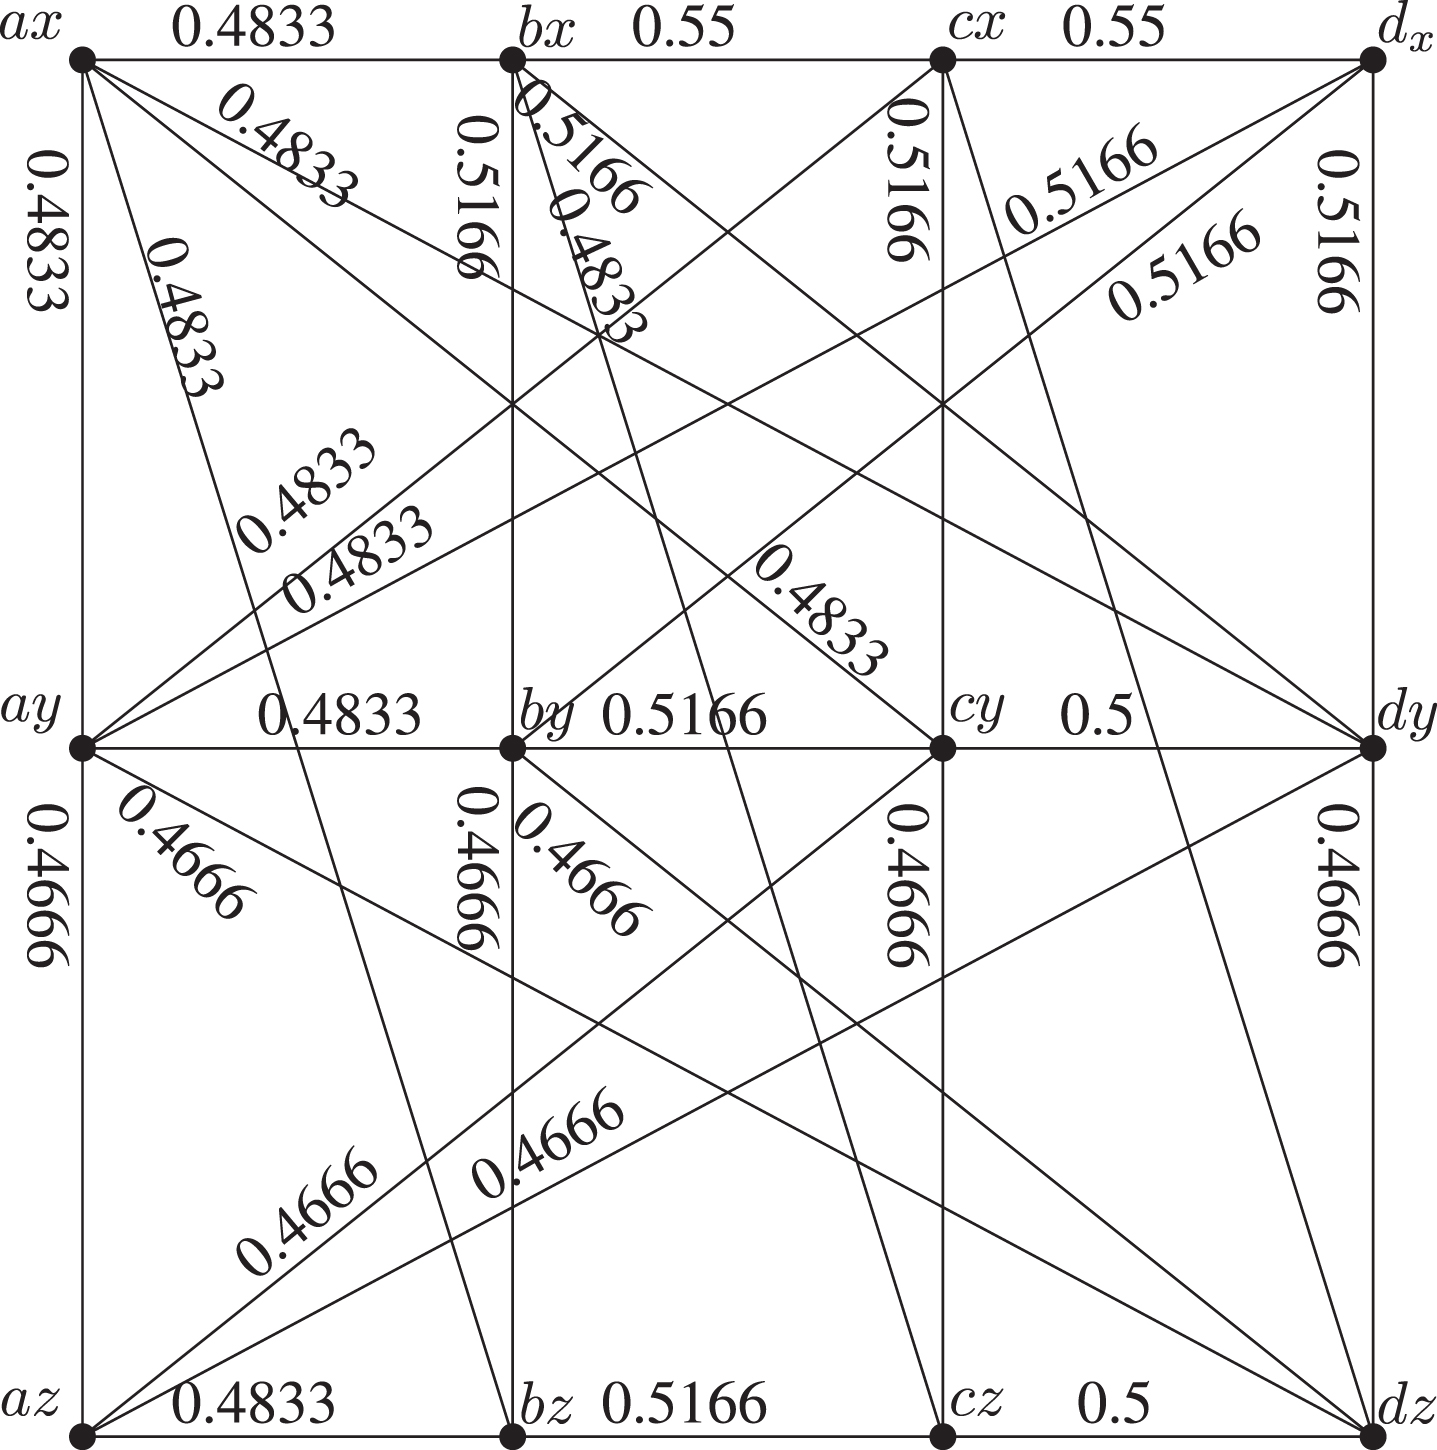
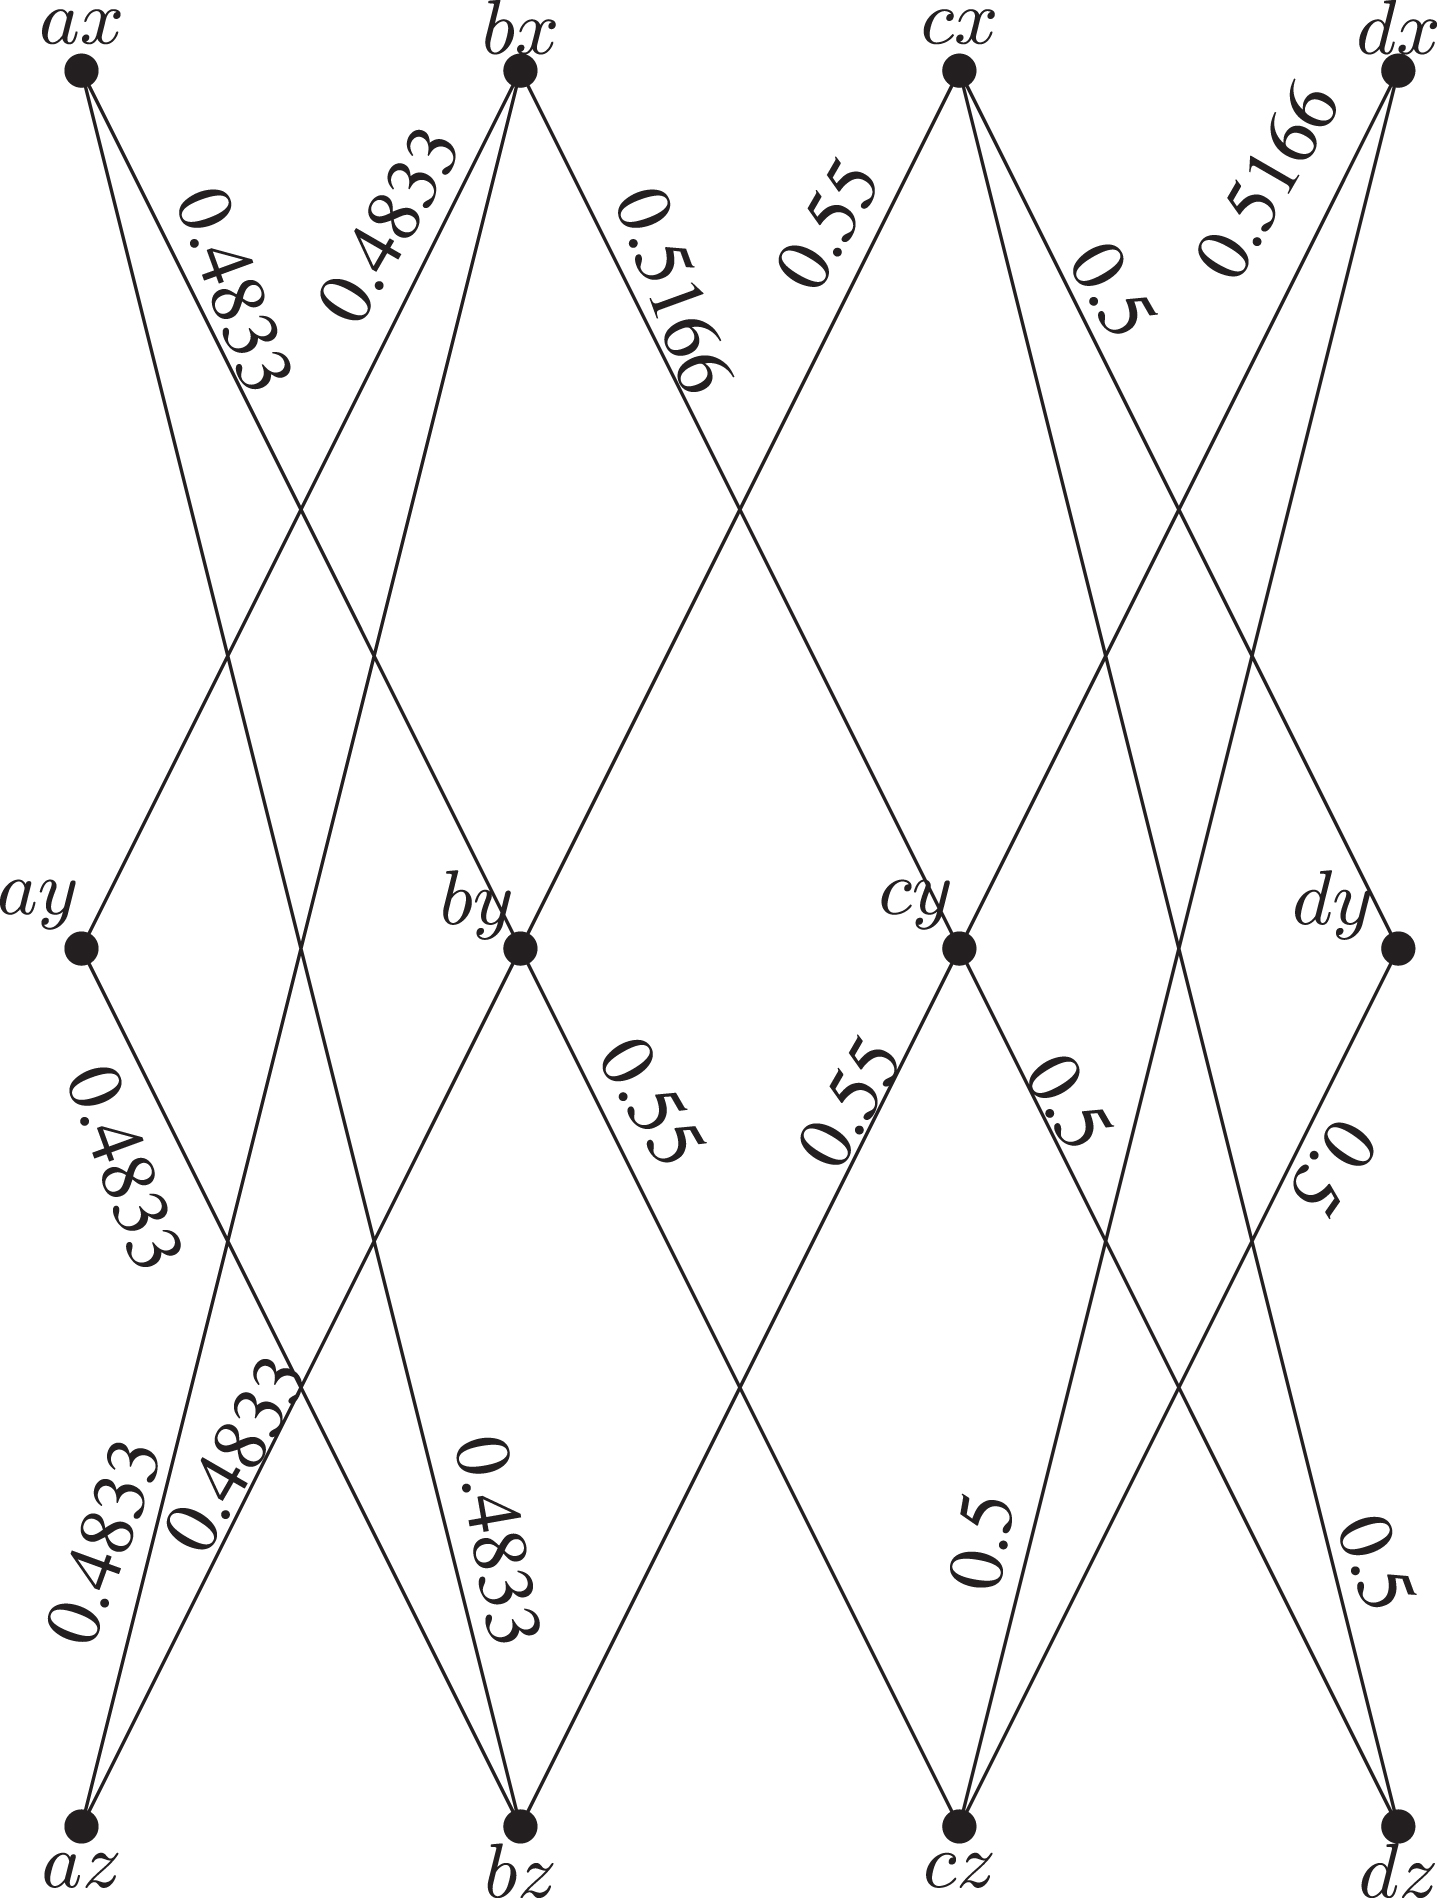
The weighted
Fig. 7
The domination number of the dominating sets S1, S2, S3, S4 are
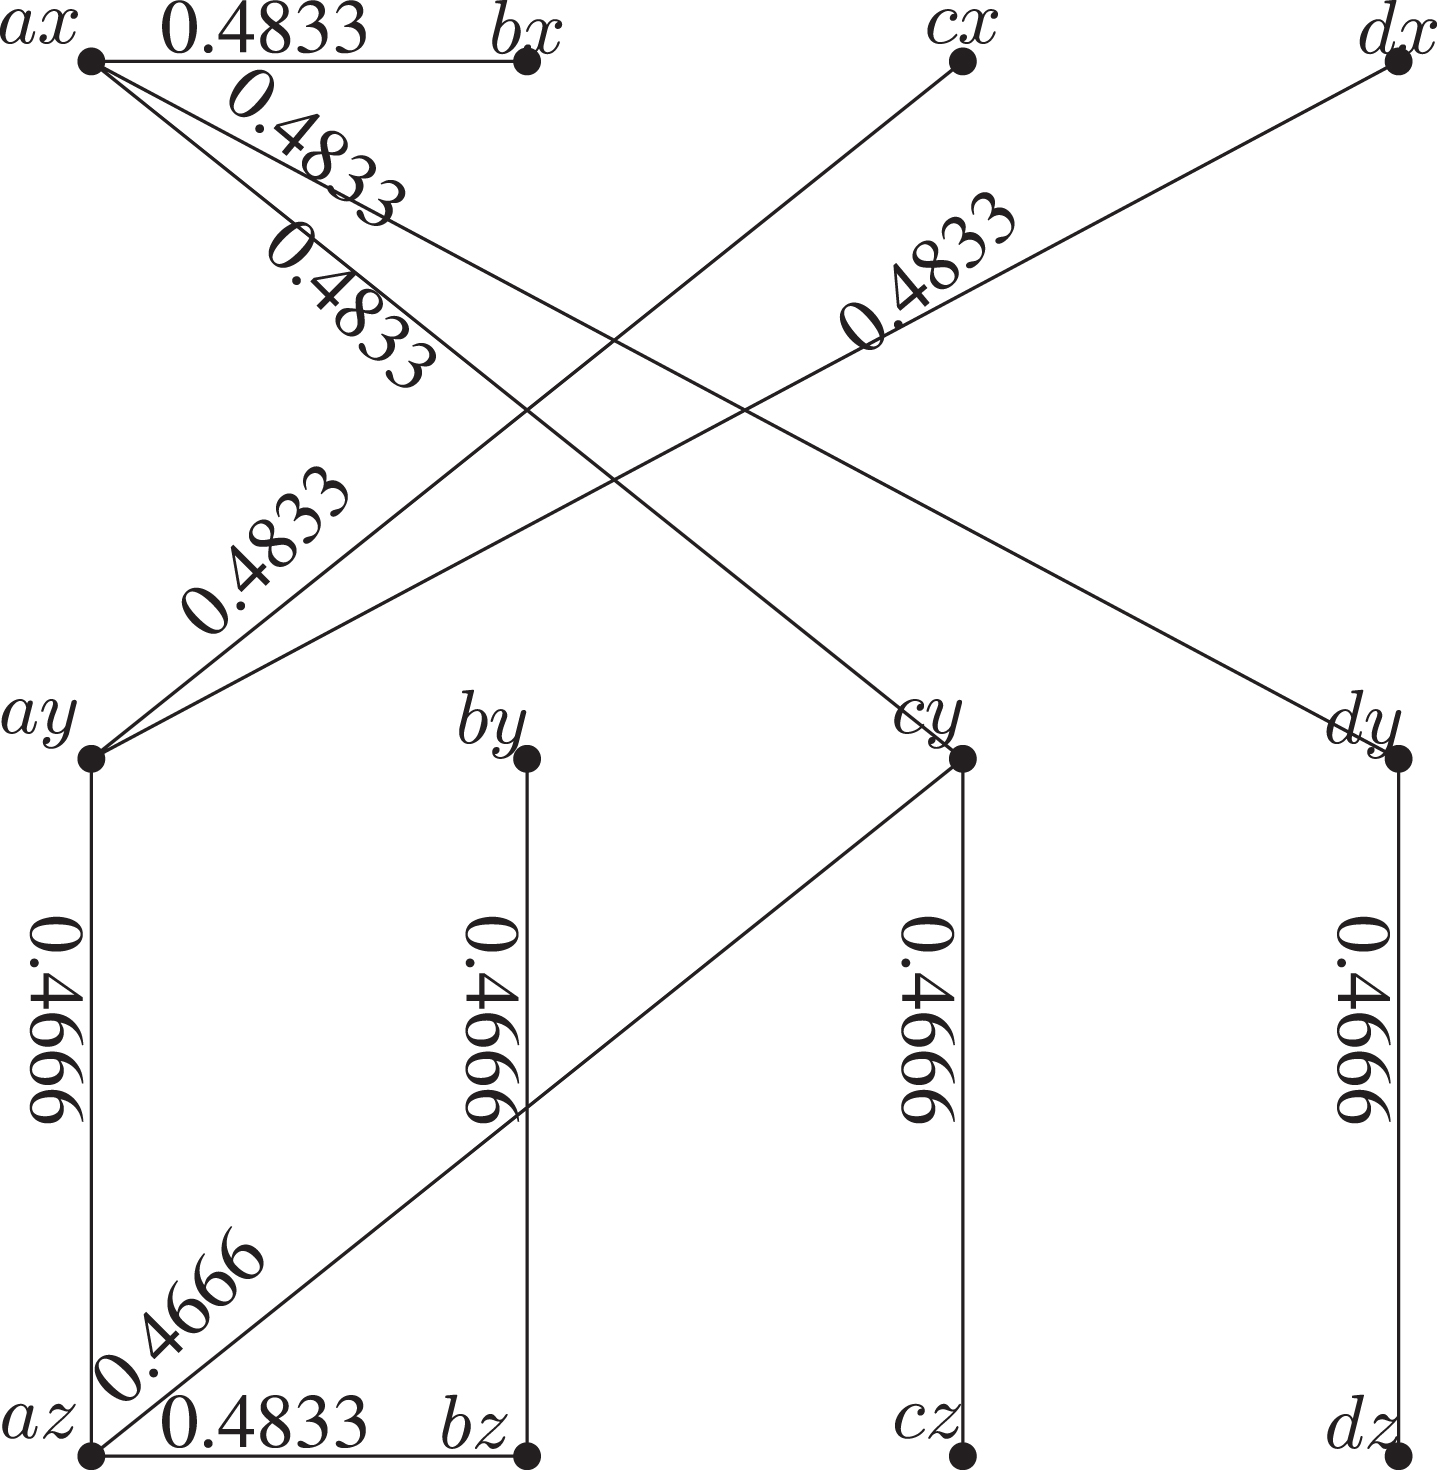
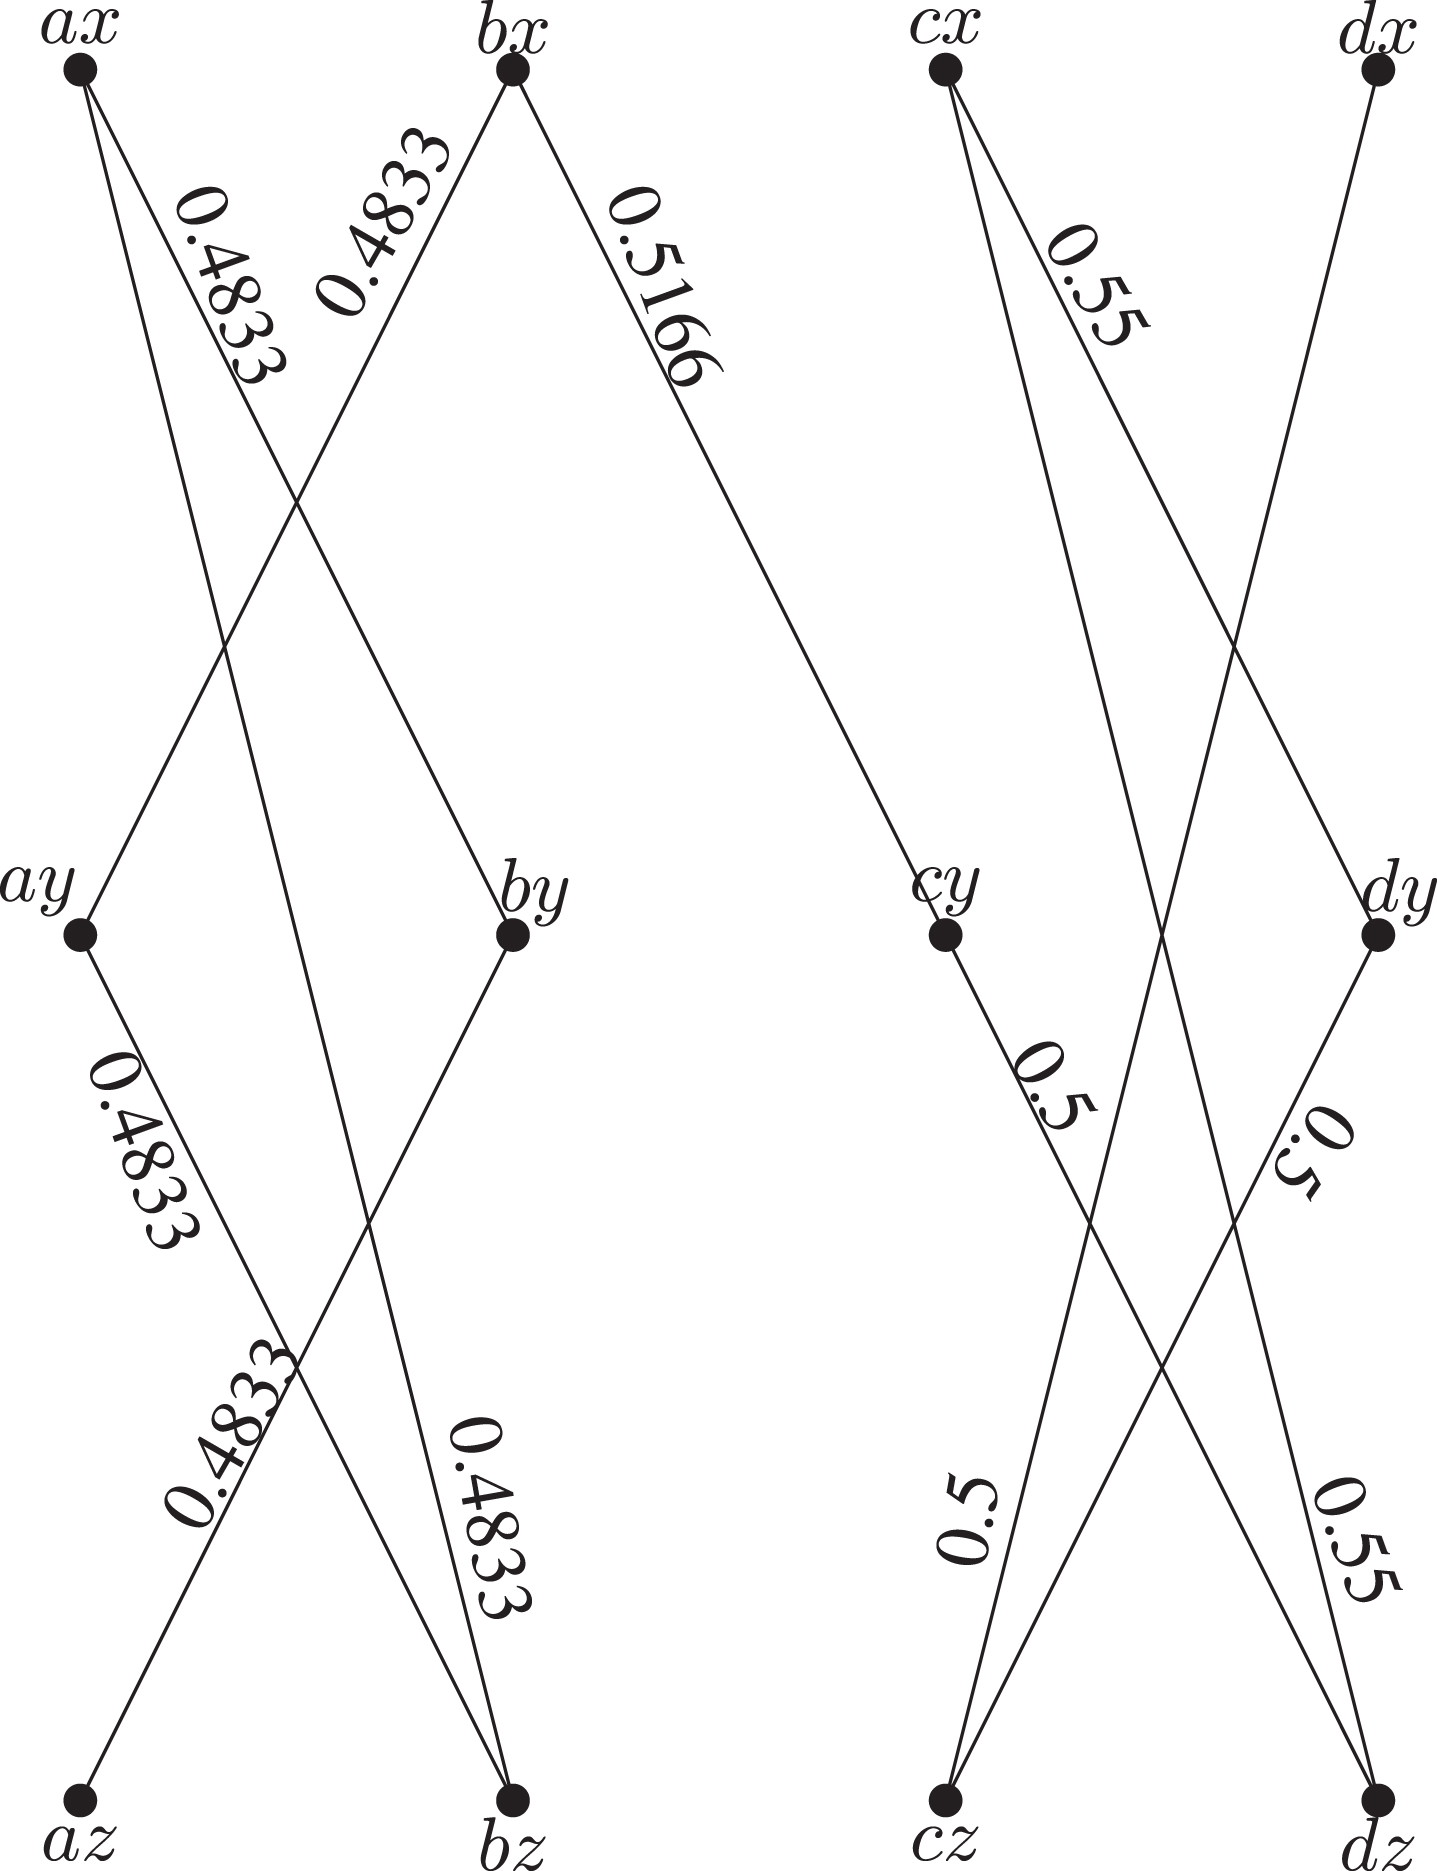
The minimal spanning tree of the weighted network
Fig. 8
Minimum Spanning Tree of
3.3Residue product of two single-valued Neutrosophic graphs
Let RP1 = (σ1, μ1) and RP2 = (σ2, μ2) be two single-valued Neutrosophic networks of the graphs GRP1 = (V1, E1) and GRP2 = (V2, E2) respectively. Then the Residue product
i) ∀ (x, y) ∈ V1 × V2,
ii) ∀ (x, y) ∈ E1 and z ≠ w ∈ V2,
3.3.1Example
Let SVNG
Fig. 9
The weighted
Fig. 10
The domination number of the dominating sets S1, S2, S3, S4 are
The domination number of
The minimal spanning tree of the weighted network
Fig. 11
Minimal Spanning Tree of
3.4Max product of two single-valued Neutrosophic graphs
Let MP1 = (σmp1, μmp1) and MP2 = (σmp2, μmp2) be two single-valued Neutrosophic networks of the graphs GMP1 = (Vmp1, Emp1) and GMP2 = (Vmp2, Emp2) respectively. Then the maximal product of the graphs MP1 and MP2 is denoted by
i) ∀ (x, y) ∈ Vmp1 × Vmp2,
ii) ∀ x ∈ Vmp1 and (y, z) ∈ Emp2,
a) (T μmp1 * T μmp2) ((x, y) , (x, z)) = T σmp1 (x) ∨ T μmp2 (y, z);
b) (I μmp1 * I μmp2) ((x, y) , (x, z)) = I σmp1 (x) ∨ I μmp2 (y, z);
c) (F μmp1 * F μmp2) ((x, y) , (x, z)) = F σmp1 (x) ∧ F μmp2 (y, z);
iii) ∀ x ∈ Vmp2 and (y, z) ∈ Emp1,
a) (T μmp1 * T μmp2) ((y, x) , (z, x)) = T μmp1 (y, z) ∨ T σmp2 (x);
b) (I μmp1 * I μmp2) ((y, x) , (z, x)) = I μmp1 (y, z) ∨ I σmp2 (x);
c) (F μmp1 * F μmp2) ((y, x) , (z, x)) = F μmp1 (z, y) ∧ F σmp2 (x);
3.4.1Example
Let SVNG
Fig. 12
The maximal product of
The weighted
Fig. 13
The domination number of the dominating sets S1, S2, S3, S4 are
The domination number of
The minimal spanning tree of the weighted network
Fig. 14
Minimal Spanning Tree of
4Application
4.1An application of symmetric difference network
Technology salespeople fulfil responsibilities throughout their workday to help consumers find the technology that can benefit them the most. Technology sales are the result of connecting customers with technology that can provide a solution to a specific problem.
Technology sales professionals face a unique set of challenges, such as needing a deep understanding of the complex products they sell and possessing the people’s skills needed to build trust as well as sales abilities to close deals with prospects.
A sales training program is designed to help sales professionals achieve sales success for themselves or for their organizations. Most sales training programs help to develop the sales skills and techniques needed to approach leads, create new sales opportunities, close deals, and build rapport with clients and customers.
Sales team members have the right combination of technical knowledge and practical sales know how to simultaneously do well. For this reason, sales training designed specifically for technology companies is important. Especially whether selling a new technology or in a highly competitive market, these training can help the technology sales team develop the sales skills needed to serve more, reach decision makers and take deals off the line to maximize revenue.
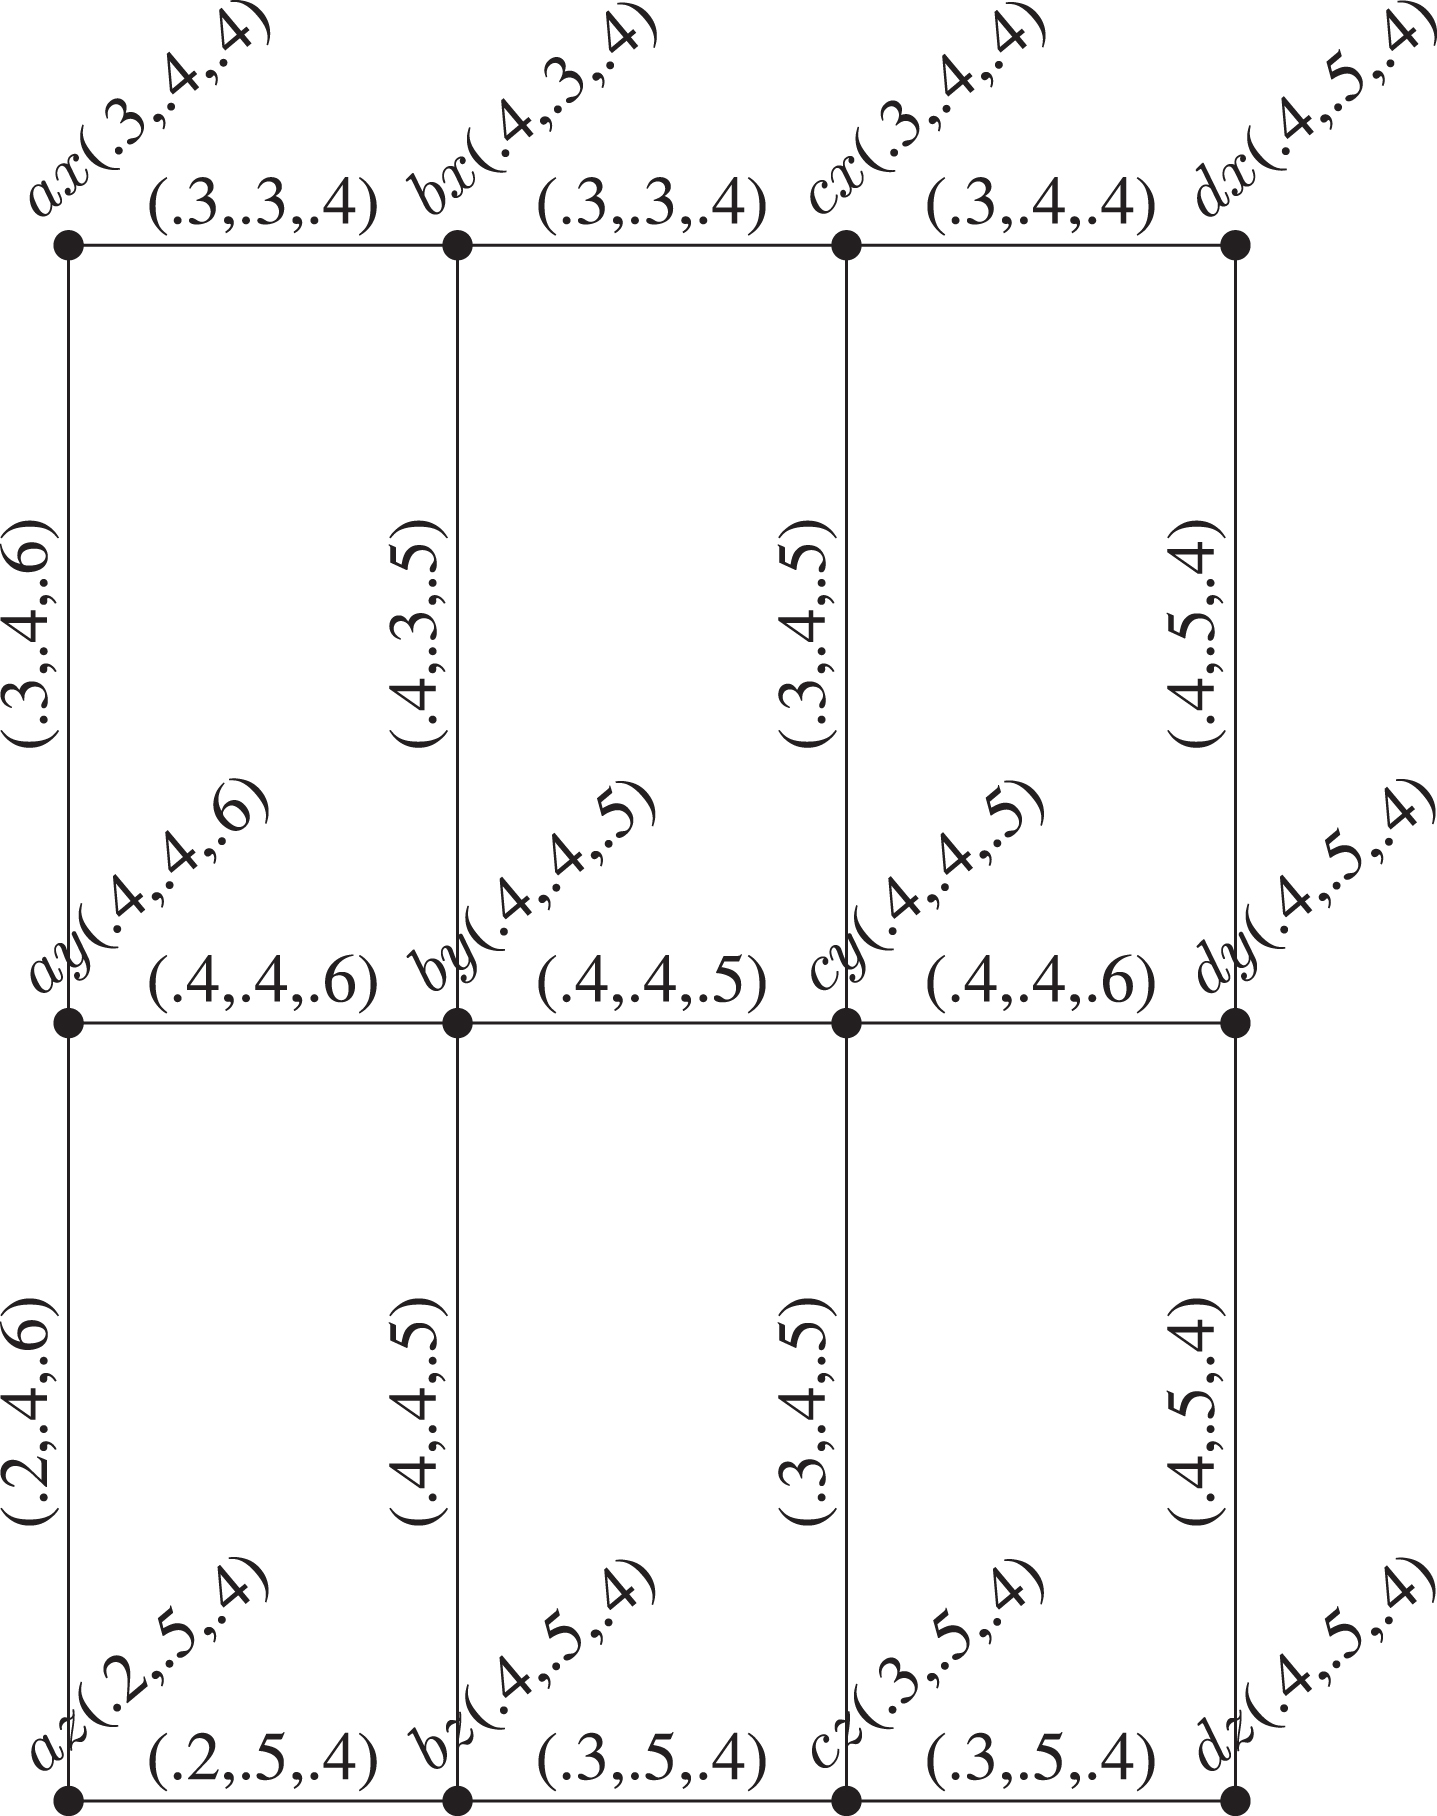
Let us consider a group of experts who will train the group of trainees to develop their sales skills. Assume that Network
Let us assume that Network
The role of each expert in training is different from one another. So, when a skill is trained by an expert to a trainee a new skill is developed by them and also their existing skill will make the sales training more effective in technology. A trainee therefore is trained by experts and does attain other skills expect their own core competency so that the trainee can have a cleaver focus on what they can do the trust to attain and wider the scope to capture high-value opportunities in sales technology.
The experts of Network
For example, ax (.2, . 3, . 6) be the sales executive of the Network developed by the expert ’x(.3,.3,.4)’ with training in inside sales for a trainee who is good at effective communication when ’ax’ is trained they are built into a better sales executive with their existing skill ay (.2, . 4 . , .6) as insurance sales officer with a skill of better communication and training of service sales expert and az (.2, . 4, . 6) the account manager who is trained by the sales management expert by (.2, . 3, . 65) is attained by the trainee ’b(.4,.3,.5)’ with good networking skills who is trained by the expert with service sales [Sales Development Representative] and so on the expertise in each field are developed by the experts to the trainees in sales technology.
The roles of each node are different from one another, when these nodes are connected into a Symmetric difference, the above Network
Symmetric difference Network of the sales technology allows effective management of business and pursue network. Organizational structure in the first place.
Flexibility is one of the main reasons for trained employees to engage in a network organization by outsourcing work. This allows them to complete the tasks in a minimal duration of time without facing major problems.
The neutrosophic network nodes are linked to one another for the flow of information in less time to other nodes. The truth-membership degree of each node indicates the better-skilled person trained in the organization. The indeterminacy-membership degree of each node demonstrates how much the person’s skill is uncertain. The falsity-membership degree of each node tells the fewer skills gained by the person. The flow of information from one node to another the node in the network takes place in effective time management. The truth-membership degree, the indeterminacy-membership degree and the falsity-memb-ership degree of each link is given by effective time management of the node in collaboration. From the above single-valued Neutrosophic network models, we find the Optimal network whose minimal spanning tree make the network more flexible with the minimum possible weights with effective score function are found and thus the optimal network with minimum optimal value increase in profits of the organizations.
The limitations of the study is, an effective optimum network is obtained from the each constructed network with a minimum weight of spanning tree using score function. The score function defined in our study gives an Optimal value from which the effective optimal network is chosen from the various operations applied on single valued Neutrosophic graphs. This study can also be extended to different operations applied on graphs.
4.2Optimal network algorithm
Step-1: Constructed a set of finite networks say N = N1, N2, ⋯ , Nr using the distinct operations on network with vertex set V = V1 × V2.
Step-2: Find the value of score function of each nodes and links of the constructed networks N1, N2, ⋯ , Nr.
Step-3: Find the minimal dominating set and dominating number of each constructed networks N1, N2, ⋯ , Nr.
Step-4: Let the domination number of the constructed network N1, N2, ⋯ , Nr be DN1, DN2, ⋯ , DNr respectively.
Step-5: Discover the minimal spanning trees of the constructed networks and Let it be TST1, TST2, ⋯ , TSTR of the networks N1, N2, ⋯ , Nr respectively and find the minimum weights of TST1, TST2, ⋯ , TSTR using score function.
Step-6: Let the minimum weight of TST1, TST2, ⋯ , TSTR be WST1, WST2, ⋯ , WSTR.
Step-7: Compute the optimal value for each constructed network N1, N2, ⋯ , Nr, where the optimal value is defined as the minimum value of the sum of the domination number and the minimum weight of the spanning tree.
Step-8: Among these values which network gives the optimal value is said to be the optimal network.
From section-3 we arrived at the following;
The domination number of
The domination number of
The domination number of
The domination number of
Minimum weight of spanning tree
Minimum weight of spanning tree
Minimum weight of spannin,g tree
Minimum weight of spanning tree
Using the Optimal network algorithm, symmetric difference
5Conclusion
The single-valued Neutrosophic models give more precision, flexibility, and compatibility to the system as compared to the classical, fuzzy, intuitionistic fuzzy and Neutrosophic models. In this paper, the authors arrive at some operations such as Lexicographic, Symmetric difference, Residue product and Max product on single-Valued Neutrosophic graphs. Also, investigated some of their properties to find their efficiency and discussed the real-world application of the Symmetric difference network with a minimum spanning tree algorithm which is generated to achieve the minimum efficient productivity to complete the tasks in a social network. In the future, the study will be extended to other operations along with strategies to achive the efficiency of the constructed network.
References
[1] | Aggarwal S. , Biswas R. and Ansari A.Q. , Neutrosophic modeling and control, Computer and Communication Technology, 2010. |
[2] | Akram M. and Shahzadi G. , Operations on single-valued Neutrosophic graphs, Journal of Uncertain Systems, 2017. |
[3] | Akram M. and Siddique S. , Neutrosophic competition graphs with applications, Journal of Intelligent Fuzzy Systems, 2017. |
[4] | Akram M. , Waseem N. and Dudek W.A. , Certain types of edge m-polar fuzzy graphs, Iran Journal of Fuzzy System, 2017. |
[5] | Atanassov Krassimir T. , Intuitionistic Fuzzy Sets, Springer, Neywork, 1999. |
[6] | Broumi S. and Smarandache F. , Newdistance and similarity measures of interval Neutrosophic sets, Information Fusion, IEEE 17th International Conference, 2014. |
[7] | Broumi S. , Smarandache F. , Talea M. and Bakali A. , Operations on interval valued Neutrosophic graphs, New Trends in Neutrosophic Theory and Applications, 2016. |
[8] | Mohanta K. , Dey A. and Pal A. , A note on different types of product of Neutrosophic graphs, Complex and Intelligent Systems, 2021. |
[9] | Parvathi R. and Thamizhendhi G. , Domination in intuitionistic fuzzy graphs, Notes Intuitionistic Fuzzy Sets, 2010. |
[10] | Sk Rabiul Islam and Madhumangal Pal , Hyper-Wiener index for fuzzy graph and its application in share market, Journal of Intelligent & Fuzzy Systems, 2021. |
[11] | Sk Rabiul Islam , Madhumangal Pal and Sayantan Maity , Comment onWiener index of a fuzzy graph and application to illegal immigration networks, Fuzzy sets and Systems, 2020. |
[12] | Rajan C. and Senthil Kumar A. , Domination in single-valued Neutrosophic graphs, International Journal of Information and Computing Science, 2019. T. Atanassov Krassimir, Intuitionistic fuzzy sets, Springer, Neywork, 1999. |
[13] | Rashmanlou H. , Samanta S. , Pal M. and Borzooei R.A. , Intuitionistic fuzzy graphs with categorical properties, Fuzzy Information Engineering, 2012. |
[14] | Shannon A. and Atanassov K. , On a generalization of Intuitionistic fuzzy graphs, NIFS, 2006. |
[15] | Tanmoy Mahapatra , Ganesh Ghorai and Madhumangal Pal , Fuzzy fractional coloring of fuzzy graph with its application, Journal of Ambient Intelligence and Humanized Computing, 2020. |
[16] | Tanmoy Mahapatra , Ganesh Ghorai and Madhumangal Pal , Competition graphs under interval-valued m-polar fuzzy environment and its application, Computational and Applied Mathematics, 2022. |
[17] | Tanmoy Mahapatra and Madhumangal Pal , An investigation on m-polar fuzzy threshold graph and its application on resource power controlling system, Journal of Ambient Intelligence and Humanized Computing, 2022. |
[18] | Yang H.L. , Guo Z.L. , She Y. and Liao X. , On single-valued Neutrosophic relations, Journal of Intelligent Fuzzy Systems, 2016. |
[19] | Zadeh L.A. , Fuzzy sets, Information Control, 1965. |
[20] | Zang H.Y. , Wang J.Q. and Chen X.H. , Interval neutrosophic sets and their application in multicriteria decision-making problems, Sci. World Journal, 2014. |


