
Measurement of process capability indices for lower and upper tolerance with fuzzy parameters
Abstract
When the target value (T) is located in the midpoint of the specification interval (m). Traditional process capability indices (PCIs) are often employed for a process with a symmetric tolerance (T = m). In case a process with asymmetric tolerance (T≠m) traditional PCIs can be misleading. Process capability indices (PCIs) with asymmetric tolerance have been designed and successfully used in a crisp form in process capability analysis (PCA). These PCIs with asymmetric tolerance can benefit from the use of fuzzy set theory to deal with ambiguity and to add greater flexibility and sensitivity to mean variance, and target value (T), and specification limits (SLs). In order to produce fuzzy SLs of PCIs with asymmetric tolerance fuzzy mean, fuzzy variance and the fuzzy target value have been used. Furthermore, these PCIs are graphically represented. It is concluded that the intermediate values of fuzzy SLs can be explored, which is not achievable with crisp SLs. Furthermore, it is recommended to utilize fuzzy SLs of PCIs with asymmetric tolerance to monitor goods that fall outside specification limits due to their flexibility and sensitivity in a fuzzy environment. The proposed FPCIs were illustrated with a real-life example using piston diameters that were produced in a factory.
1Introduction
Process capability indices are numerical instruments that measure how effectively a process can adhere to technical tolerances, client needs, and specifications. Lower and upper specification limits, LSL and USL, as well as a target value T that falls within these limits, make up a tolerance interval for a product feature X. If the target value and the midpoint of the specification limits coincide, a process is said to have a symmetric tolerance. But there are enough instances for the goal value to not be the midpoint of the tolerance limits. The tolerance range in these circumstances is referred to as asymmetric. The new class of indices for the process with asymmetric tolerance for crisp SLs was introduced by [1].
[2] analyzed PCIs based on different process features and then present a new class of capability indices to handle processes with asymmetric tolerances. Process yield, process centering, and process characteristics linked to loss functions are compared between the proposed new indices and the current PCIs. The findings show that the new indices outperform the pre-existing capability indices and offer more accuracy in the current applications using PCIs to gauge process potential and performance. Asymmetric tolerance PCIs have been created and effectively used to solve these issues. PCIs are very useful statistics, however, due to the clear definitions of the specification limits (SLs), mean, and variance, they have several restrictions that prohibit a thorough and flexible study. The fuzzy set theory is applied in this situation to enhance the flexibility and information of PCIs with asymmetric tolerances. It was concluded that when compared to the crisp scenario, fuzzy estimations of PCIs with asymmetric tolerances provide more information and flexibility to assess the process performance. Fuzzy formulations of the most often used PCIs with asymmetric tolerances and a real-life case study from an automobile manufacturer were presented and compared to crisp estimations of PCIs with asymmetric tolerances. It was concluded that fuzzy estimations of PCIs with asymmetric tolerances provided more information and flexibility for evaluating process performance [3]. A literature review on fuzzy process capability indices (FPCIs) for PCA was presented [4]. This study aims to give a thorough evaluation of publications that deal with FPCIs. These studies have been examined based on some of their characteristics, including the year, document type, journal name, and nation. In this work, classifications for FPCI, application area, fuzzy parameters, and type of fuzzy sets have also been presented. There have also been some statistical analyses performed. They wanted to showcase the most recent developments in FPCI research and offer a road map for researchers in this area. The primary goal is to highlight potential future areas for fuzzy PCA research. [5] proposed a fuzzy form of loss-based process capability indices Le and Le
″ to overcome uncertainty. These include
[9] suggested the intuitionistic fuzzy set-based fuzzy model of the normal distribution. The neutrosophic process capability indices (NPCIs) were proposed by [10]. It was concluded that these indices performed better than conventional PCIs in a fuzzy environment. [11] introduced a decision-making process based on fuzzy inference to enhance process capability analysis and illustrated with real life data. The indices for one-sided single tolerance were introduced by [12], and the usefulness of these indices was demonstrated using a real-life example. More details can be seen in [13–15].
Analyzing the PCA literature reveals that classical PCA is examined far too extensively. However, there are very few studies that use fuzzy set extensions. Therefore, the purpose of this work is to fill the vacuum in the literature. In order to do this, classic PCIs [12] have been examined and reorganized in this study using triangular fuzzy number (TFNs). A fuzzy formulation of these indices is proposed in the paper. Additionally, newly developed fuzzy indices are presented numerically and graphically in the paper.
2Methodology
Four traditional PCIs with asymmetric tolerance are used in this investigation. These indices undergo a fuzzy transformation. Fuzzy indices are used to construct four theorems. The suggested indices are applied to a sample of 200 piston diameters that were produced in a factory situated in Turkey’s Konya Industrial Area. The R package “Fuzzy numbers” is used to calculate and visualize the result of theorems. TFNs are used as membership functions. The R code can be found in Appendix A.
3Estimation of
C pmk u C pmk l
In this section, conventional process capability indices are transformed into a fuzzy form using the fuzzy parameters. Fuzzy indices are presented in the form of theorems. All four Parameters (SLs, Target value, Mean, Variance) are used as a triangular fuzzy number. Lower and upper fuzzy specification limits are presented as triangular fuzzy number (TFN),
Theorem 3.1: Fuzzy Estimate of
It is presented that crisp CPI
Proof. Formulation of the one-sided tolerance is an upper limit U.
(1)
(2)
(3)
(4)
Where
α - cut of fuzzy estimate
(5)
(6)
(7)
Theorem 3.2. Fuzzy Estimation of
It is shown that crisp CPI
Proof. Formulation of the one-sided tolerance is a lower limit L.
(8)
(9)
(10)
(11)
(12)
(13)
Theorem 3.3. Fuzzy Estimate of Cup (u , v)
In this theorem, it is proved that that crisp Cup (u , v) with asymmetric tolerance can be changed into fuzzy form to make its specification SLs more sensitive and flexible.
Proof. The general formulation of the one-sided tolerance is an upper limit U.
(14)
(15)
(16)
(17)
(18)
Theorem 3.4. Fuzzy Estimate of Clp (u , v)
It is verified that that crisp CPI Clp (u , v) with asymmetric tolerance can be reformed into a vague form to make its specification SLs more sensitive and elastic.
Proof. We get the general formulation if the one-sided tolerance is a lower limit L.
(19)
(20)
(21)
(22)
(23)
(24)
3.5Example
In this real-life example, fuzzy values of parameters discussed by [8] are used to calculate the values of proposed theorems.
4Results and discussion
Figure 1 shows the process capability index
Fig. 1
Triangular fuzzy number of Cupmk (Theorem 3.1).
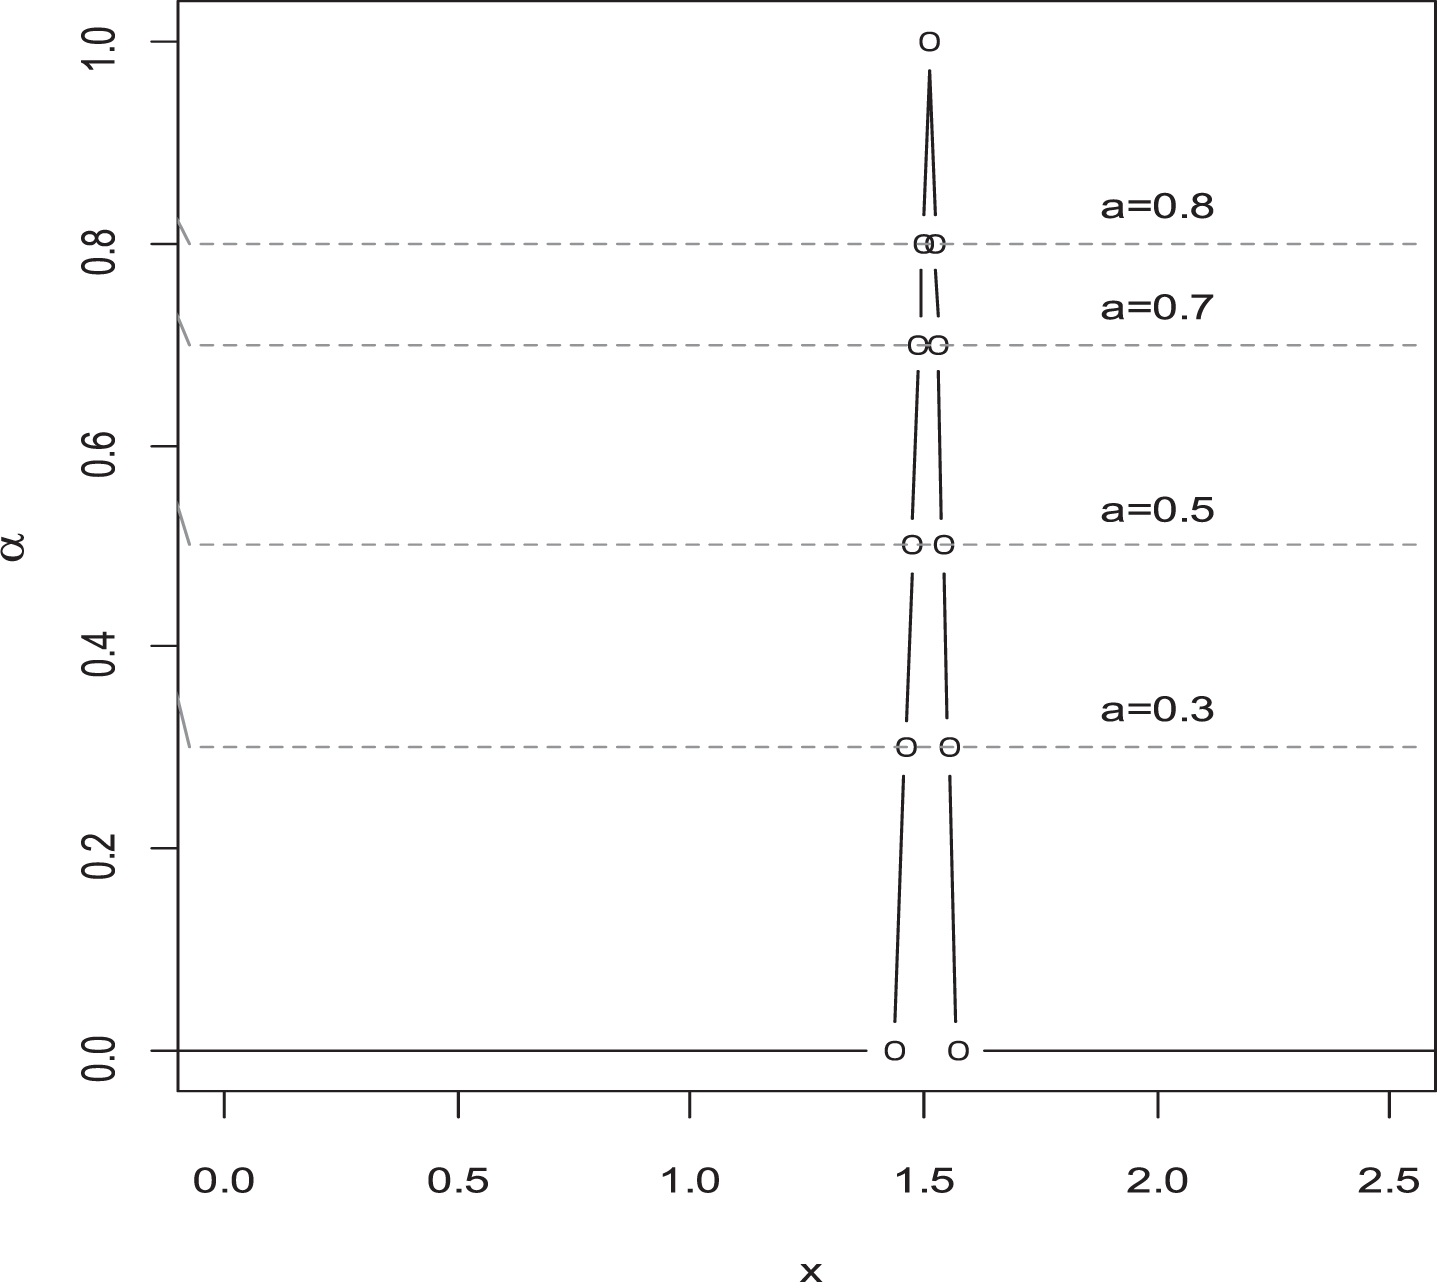
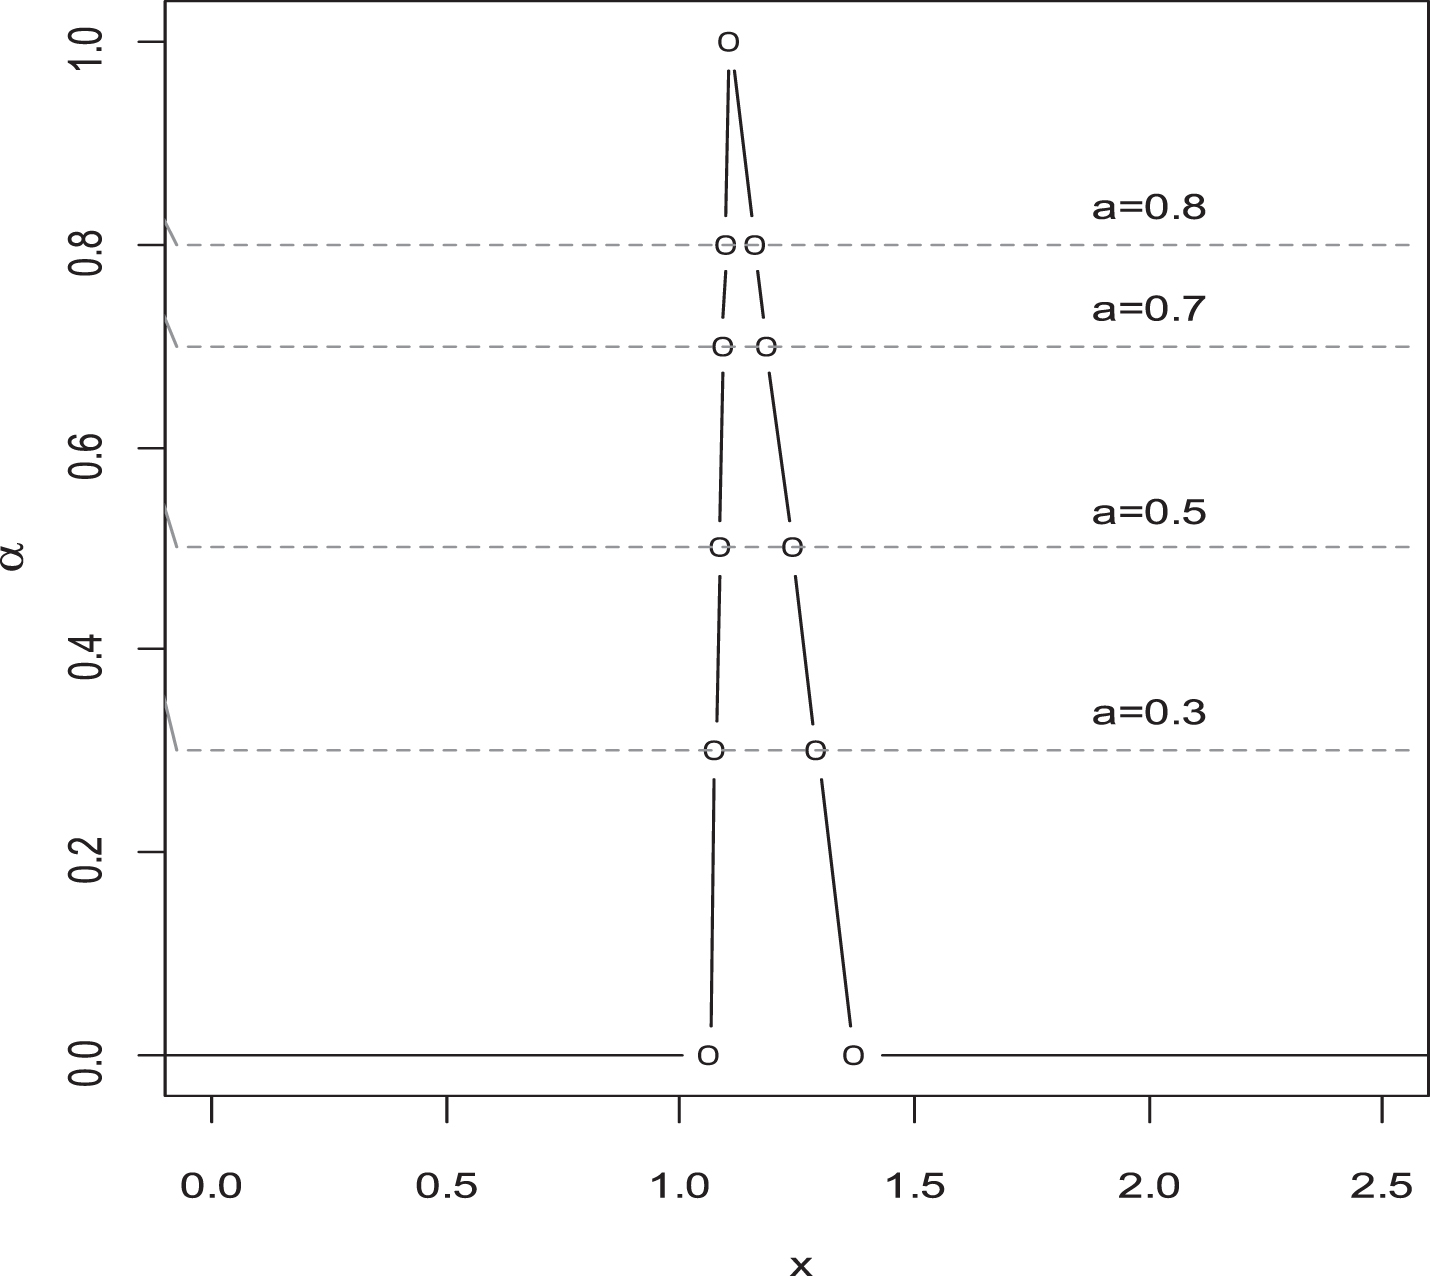
Fig. 2
Triangular fuzzy number of
5Comparative study
Grau, (2009) suggested PCIs with asymmetric tolerance when the parameters are crisp. However, these conventional PCIs are not suitable when parameters and data are fuzzy. When the data are fuzzy, the evaluation of fuzzy PCIs is more appropriate than traditional PCIs. The benefit of the suggested FPCIs is discussed in this section using fuzzy SLs. The recommended FPCIs are compared to two current PCIs proposed by [12] under classical statistics. To compare the effectiveness of the suggested FPCIs, the fuzzy values of all parameters were used. Figures 1 and 2 graphically display the FPCI values. Results in (theorems) show that, in contrast to [12] PCIs, the proposed FPCIs give fuzzy values of SLs. Furthermore, the proposed FPCIs will aid in enhancing the sensitivity and flexibility of tolerance limits. Likewise, comparison study shows, FPCIs with asymmetric tolerance can produce intermediate values. Additionally, the suggested FPCIs are more suitable and realistic to apply in a fuzzy environment.
6Conclusion
PCIs with fuzzy asymmetric tolerance are found to be more sensitive and flexible in a fuzzy environment than traditional PCIs with asymmetric tolerance. The fuzzy form of PCIs with asymmetric tolerance is numerically and graphically demonstrated in this paper. It shows how fuzzy set theory can make indices’ SLs more flexible and sensitive to variation. In comparison to existing PCIs with asymmetric tolerance, the applications of the suggested FPCIs reveal that the proposed FPCIs work better in monitoring the process. SLs with intermediate values can be investigated. Theorems based on triangular fuzzy numbers are proposed. The asymmetric fuzzy PCIs tolerances include the membership value along with the crisp values of 1.00 and display all PCIs that can exist. These outcomes are clearly more beneficial than using only one result by providing a wide variety of perspectives on process engineers adhering to process mean and variance. In the future, trapezoidal numbers can also be used to fuzzify the same indices. Additionally, other crisp indices can also benefit from using this fuzzification technique to increase their flexibility, sensitivity, and reduce information loss.
Data availability statement
The data is given in the paper.
Appendix A
R Code
R CODES
#R CODES THEORAM 1
#Fuzzynumbers pacage p = 13
rm(list = ls())
alpha< - c(0.3, 0.5, 0.7,0.8)
P3< -as.PiecewiseLinearFuzzyNumber(
TrapezoidalFuzzyNumber(1.2025,1.41003,1.41003,1.7016),
knot.n=4, knot.alpha=alpha)
P3
## Piecewise linear fuzzy number with 3 knot(s),
## support = [1,7],
## core = [2.5,4].
plot(P3, type=’b’, from = -1, to = 9, xlim = c(0,2.5))
abline(h = alpha, col=’gray’, lty = 2)
#abline(v = P3[’knot.left’], col=’gray’, lty = 3, lw = 3)
#abline(v = P3[’knot.right’], col=’gray’, lty = 3,lw=3)
text(2.0, alpha, sprintf(’a=% g’, alpha), pos = 3)
####################################################
#R CODES THEORAM 4
#Fuzzynumbers pacage p = 13
rm(list = ls())
alpha< - c(0.3, 0.5, 0.7,0.8)
P3< -as.PiecewiseLinearFuzzyNumber(
TrapezoidalFuzzyNumber(1.3071, 1.3503,1.3503,1.4106),
knot.n=4, knot.alpha=alpha)
P3
## Piecewise linear fuzzy number with 3 knot(s),
## support = [1,7],
## core = [2.5,4].
plot(P3, type=’b’, from = -1, to = 9, xlim = c(0,3))
abline(h = alpha, col=’gray’, lty = 2)
#abline(v = P3[’knot.left’], col=’gray’, lty = 3, lw = 3)
#abline(v = P3[’knot.right’], col=’gray’, lty = 3,lw=3)
text(2.0, alpha, sprintf(’a=% g’, alpha), pos = 3)
Acknowledgments
The authors are deeply thankful to the editor and reviewers for their valuable suggestions to improve the quality and presentation of the paper.
References
[1] | Abbasi Ganji Z. Sadeghpour Gildeh B. , A class of process capability indices for asymmetric tolerances , Quality Engineering 28: (4) ((2016) ), 441–454. |
[2] | Chen K.S. and Pearn W.L. , Capability indices for processes with asymmetric tolerances, , Journal of the Chinese Institute of Engineers 24: (5) ((2001) ), 559–568. |
[3] | Kaya İ. and Kahraman C. , Fuzzy process capability indices withasymmetric tolerances, Expert Systems with Applications 38: (12) ((2011) ), 14882–14890. |
[4] | Kaya İ. and Çolak M. , A literature review on fuzzy processcapability analysis, Journal of Testing and Evaluation 48: (5) ((2018) ), 3963–3985. |
[5] | Abdolshah M. , Measuring loss-based process capability index and its generation with fuzzy numbers, , Mathematical Problems in Engineering 2015: ((2015) ). |
[6] | Hesamian G. and Akbari M.G. , Fuzzy process capability indices based on imprecise observations induced from non-normal distributions, , Computational and Applied Mathematics 37: (5) ((2018) ), 5715–5726. |
[7] | Ganji Z.A. and Gildeh B.S. , A new fuzzy process capability index for asymmetric tolerance interval, International Journal of Fuzzy System Applications (IJFSA) 6: (3) ((2017) ) 74–104. |
[8] | Kaya İ. and Kahraman C. , Fuzzy process capability analyses withfuzzy normal distribution, Expert Systems with Applications 37: (7) ((2010) ), 5390–5403. |
[9] | Hesamian G. and Akbari M.G. , A process capability index for normal random variable with intuitionistic fuzzy information, Operational Research 21: (7) ((2021) ), 951–964. |
[10] | Yalcin S. and Kaya I. , Design and analysis of process capability indices cpm and cpmk by neutrosophic sets, Iranian Journal of Fuzzy Systems 19: (1) ((2022) ), 13–30. |
[11] | Choi Y.-H. , Na G.-Y. and Yang J. , Fuzzy-inference-based decision-making method for the systematization of statistical process capability control, , Computers in Industry 123: ((2020) ), 103296. |
[12] | Grau D. , New process capability indices for one-sided tolerances, Quality Technology & Quantitative Management 6: (1) ((2009) ), 107–124. |
[13] | Shu M.-H. and Wu H.-C. , Measuring the manufacturing process yield based on fuzzy data, International Journal of Production Research 48: (6) ((2010) ), 1627–124. |
[14] | Khodaygan S. and Movahhedy M. , Fuzzy-based analysis of process capability for assembly quality assessment in mechanical assemblies, International Journal of Production Research 50: (12) ((2012) ), 3395–3415. |
[15] | Parchami A. et al. Process capability analysis using interval type-2 fuzzy sets, International Journal of Computational Intelligence Systems 10: (1) ((2017) ), 721. |


