
The burden of low back pain in adolescents and young adults
Abstract
BACKGROUND:
Low back pain is highly prevalent and the main cause of years lived with disability, but data on the burden and trends of low back pain (LBP) in adolescents and young adults (AYAs) are sparse.
OBJECTIVE:
To assess trends in the burden of LBP among AYAs aged 15–39 years at the global, regional and national levels from 1990 to 2019.
METHODS:
Data from the Global Burden of Disease (GBD) 2019 were used to analyze incidence, prevalence and Disability-adjusted life year (DALY) due to LBP at global, regional, and national levels. Joinpoint regression analysis calculated the average annual percentage changes (AAPC). Then analyse the association between incidence, prevalence and DALYs and socioeconomic development using the GBD Socio-demographic Index (SDI). Finally, projections were made until 2030 and calculated in Nordpred.
RESULTS:
The incidence, prevalence and DALYs rates (95%UI) were 2252.78 (1809.47–2784.79), 5473.43 (4488.62–6528.15) and 627.66 (419.71–866.97) in 2019, respectively. From 1990 to 2019, the incidence, prevalence, and DALYs rates AAPC (95%CI) were
CONCLUSION:
LBP in AYAs is a major global public problem with a high burden. There are large differences in incidence, prevalence and DALYs across SDIs, regions and countries. there is still a need to focus on LBP in AYAs and tailor interventions to reduce the future burden of this condition.
1.Introduction
Low back pain (LBP) is characterized by discomfort in the lower back, lumbosacral portion, and buttocks, which may or may not radiate to the lower extremities [1, 2]. In 2019, there were an estimated 223.5 million cases of LBP and 63.7 million disability-adjusted life years (DALYs) due to LBP [3]. Disability-adjusted life year (DALY) is the total number of years of healthy life lost from the onset of illness to death, taking into account a variety of factors such as the severity of the onset of illness, disease, death, disability (incapacity), the relative importance of age, etc., so that it can objectively reflect the degree of harm that illnesses can cause to society and to the population [4]. LBP is already a significant cause of health loss and disability around the globe, and in 2019 it was the ninth-largest disease burden worldwide [5]. The Global Burden of Disease (GBD) database was created with the support of the World Health Organization and the World Bank to research the global disease burden [6]. The database consists of 204 countries and 359 diseases in terms of incidence, prevalence, mortality, and DALYs by age, sex, and year; the GBD is extensively used in research on disease burden [7]. The GBD 2021 Low Back Pain Collaborators examined the global, regional, and national burdens of low back pain in the overall population and found that low back pain remains the leading cause of years lived with disability globally, and although age-standardised prevalence rates have declined slightly over the past three decades, it is projected that more than 800 million people globally will be living with low back pain by 2050 [8]. Wang et al. assess the global, regional, and national burdens of low back pain from 1990 to 2019 in the Global Burden of Disease 2019 study, found that global LBP age standardised prevalence and age-standardised DALY rates trended downwards, especially in East and South Asia [9]. Also some scholars have assessed the disease burden of low back pain in different regions or countries of the total population [10, 11]. However, no study has been conducted on the disease burden of LBP in adolescents and young adults (AYAs). AYAs are individuals between the ages of 15 and 39, a phase of existence that bridges childhood and elderly age [12]. AYAs will experience profound physical, emotional, and psychosocial transformations, and significant life events; it is a characteristic period of life [13]. Current research on the global burden of low back pain focuses on the population as a whole, with insufficient research on the burden of disease in adolescents and young adults, LBP is a serious problem not only among adults but also among adolescents and even children. Therefore, based on the fact that the years of life lost in AYAs will have a significant impact on society [14, 15, 16], the aim of this study was to fill this gap by performing trends in LBP in AYAs based on the GBD 2019 and assessing the diversity caused by the Socio-demographic Index (SDI) and geographic differences.
2.Methods
2.1Overview
GBD 2019 provides global, regional, and national data on LBP. According to previous research [17, 18], LBP is defined as a condition that lasts at least one day per year. The lower back comprises the lumbar spine, pars sacral, bilateral sacroiliac joints, and their adjacent tissues, including muscles, ligaments, fascia, posterior joints, lumbosacral joints, or sacral joints. The International Classification of Diseases (ICD) assigns the ICD-10 codes M54.3, M54.4, and M54.5 to LBP, while the ICD-9 code is 724. AYAs are defined as individuals aged 15 to 39. This study analyzed incidence cases, incidence rates, prevalence cases, prevalence rates, disability-adjusted life years (DALYs), and DALY rates to estimate the burden of LBP.
2.2Data sources
Search for information using the Global Health Data Exchange’s querying utility. The following parameters were set: the “GBD Estimata” parameter was set to “Cause of death or injury”, the “Measure” parameter was set to “Incidence, Prevalence, and DALYs”, the “Metric” parameter was set to “rates” and “Number”, the “Cause” parameter was set to “low back pain”, the “Location” parameter was set to “Global, High SDI, High-middle SDI, Low SDI, Low-middle SDI, Middle SDI, 21 regional and 204 country”, the “Age” parameter was set to “15–39 years”, and “Sex” parameter was set to “Both”. The “Year” parameter is set to “All year”.
2.3Estimation framework
The GBD 2019 methodology has been described in detail in previous studies [19, 20, 21]. The prevalence rates (per 100,000) were calculated by dividing the total number of cases (including new and previously diagnosed cases) by the population size. The incidence rates (per 100,000) were calculated by dividing the new cases by the total population. DALYs represent the total number of healthy life years lost from onset to death, calculated by aggregating the number of years lost to premature mortality and the number of years lost to disability. YLLs (Years of life lost due to premature mortality) are years lost due to disease-related premature death, whereas YLDs (Years lived with disability) are years lost due to disease-induced disability.
2.4Socio-demographic index
The SDI is a composite indicator of a country or region’s development status based on a combination of data, including per capita income, average education level, and fertility rates. Each region (or country) is assigned an SDI value between 0 and 1, with greater values indicating a more developed region (or country). Worldwide, there are 204 regions or countries corresponding to 204 SDI values. Low SDI (41), low-middle SDI (41), middle SDI (40), high-middle SDI (41), and high SDI (41) are the five levels typically used by the academic community to stratify SDI from low to high.
2.5Statistical analysis
From GBD 2019 datasets, incidence cases, incidence rates, prevalence cases, prevalence rates, DALYs, and DALY rates were extracted directly. GBD generates 95% uncertainty intervals (95% UI) for its metrics to characterize the metrics’ confidence level and account for uncertainty in the initial data and subsequent calculations. The average annual percentage changes (AAPCs) and 95% confidence intervals (CIs) were calculated using the Joinpoint regression program, version 4.9.1.0 (Statistical Research and Applications Branch, National Cancer Institute, Bethesda, MD, USA). The AAPC is a summary measure of the trend over a predetermined fixed interval. It is calculated as a weighted average of the annual percentage change, allowing us to characterize the average APCs over multiple years with a single number. For 204 countries, incidence, prevalence, and DALYs rates were represented graphically. A smoothed spline model determined the relationship between global, 21 regions, and SDI from 1990 to 2019. The GBD datasets recommended Nordpred age-period-cohort model was also used to predict the incidence, prevalence, and DALYs in 2030. The Nordpred model has been extensively used for 15 consecutive years to predict maladies, and its underlying principles have been described in detail (http://www.kreftregisteret.no/en/Research/Projects/Nordpred/Nordpred-software/) [23]. The Nordpred model a log-linear age-period-cohort model for predicting the number or rate of new cases. It can be fitted to trends by moderate exponential growth and constrained linear trend projection, showing effective prediction of future trends regarding burden [24, 25].
3.Results
3.1The incidence, prevalence, DALYs of low back pain at global level
Table 1
Incidence case, incidence rate, prevalence case, prevalence rate, DALYs, and DALY rate by global and SDI in 1990 and 2019 and the change in the trends from 1990–2019
| Year | Measure | Global | High SDI | High-middle SDI | Middle SDI | Low-middle SDI | Low SDI | |||||
|---|---|---|---|---|---|---|---|---|---|---|---|---|
| 1990 | Incidence | Cases (95%UI) | 57167274.66 (46060230.26–70393813.82) | 10819323.29 (8675282.92–13497188.23) | 13135922.44 (10561355.14–16106827.45) | 18727245.68 (15043672.45–23004057.04) | 10342884.49 (8304643.26–12771797.49) | 4110487.49 (3307401.85–5027633.43) | ||||
| Rate (95%UI) | 2606.22 (2099.86–3209.21) | 3348.96 (2685.31–4177.86) | 2716.76 (2184.29–3331.2) | 2508.36 (2014.97–3081.2) | 2322.48 (1864.8–2867.89) | 2120.85 (1706.49–2594.06) | ||||||
| Prevalence | Cases (95%UI) | 142555246.08 (118063591.78–170267006.11) | 34897141.05 (29250999.77–41757188.1) | 31218935.54 (25578276.87–37333446.3) | 42946702.35 (35090691.42–51562021.74) | 23961061.77 (19630886.25–28896584.84) | 9456396.2 (7793973.78–11296585.34) | |||||
| Rate (95%UI) | 6499 (5382.44–7762.37) | 10801.9 (9054.22–12925.32) | 6456.68 (5290.08–7721.28) | 5752.35 (4700.1–6906.29) | 5380.43 (4408.1–6488.7) | 4879.13 (4021.38–5828.59) | ||||||
| DALYs | Cases (95%UI) | 16300876.85 (10975150.94–22412318.66) | 3989564.96 (2691855.39–5469759.96) | 3587003.05 (2380051.72–4986090.11) | 4925791.33 (3292677.99–6823802.93) | 2720390.02 (1824299.44–3756913.82) | 1069554.98 (717028.37–1474148.98) | |||||
| Rate (95%UI) | 743.15 (500.35–1021.76) | 1234.91 (833.22–1693.08) | 741.86 (492.24–1031.22) | 659.77 (441.03–913.99) | 610.86 (409.64–843.61) | 551.85 (369.96–760.6) | ||||||
| 2019 | Incidence | Cases (95%UI) | 66859444.59 (53702757.3–82648673.65) | 10515778.04 (8445738.25–13211166.87) | 12303466.39 (9768333.06–15277734.6) | 21210595.87 (17006805.65–26188530.54) | 14071604.88 (11239586.55–17361987.12) | 8710828.79 (6979918.28–10658983.15) | ||||
| Rate (95%UI) | 2252.78 (1809.47–2784.79) | 3174.04 (2549.23–3987.61) | 2381.07 (1890.45–2956.68) | 2268.29 (1818.73–2800.64) | 1913.74 (1528.59–2361.23) | 1945.63 (1559.02–2380.77) | ||||||
| Prevalence | Cases (95%UI) | 162443872.41 (133216148.6–193746587.57) | 31805322.79 (27029470.59–37453228.34) | 29320580.9 (23911188.25–35171029.23) | 49045189.18 (39992020.19–58544631.16) | 32250289.04 (26369161.85–38872486.24) | 19911979.96 (16326725.96–23889756.92) | |||||
| Rate (95%UI) | 5473.43 (4488.62–6528.15) | 9600.00 (8158.48–11304.74) | 5674.37 (4627.5–6806.6) | 5244.96 (4276.8–6260.85) | 4386.04 (3586.21–5286.66) | 4447.5 (3646.71–5335.97) | ||||||
| DALYs | Cases (95%UI) | 18628061.25 (12456349.44–25730426.8) | 3631381.99 (2456768.55–4949133.24) | 3381828.52 (2225319.92–4721565.38) | 5646844.63 (3752655.81–7819644.43) | 3687201.99 (2442095.75–5101521.95) | 2268133.82 (1520184.08–3124363.85) | |||||
| Rate (95%UI) | 627.66 (419.71–866.97) | 1096.08 (741.54–1493.83) | 654.48 (430.66–913.76) | 603.88 (401.31–836.24) | 501.46 (332.13–693.81) | 506.61 (339.55–697.85) | ||||||
|
|
| Incidence rate | ||||||||||
| Prevalence rate | ||||||||||||
| DALYs rate | ||||||||||||
In 2019, the number of cases was 67 million (95%UI: 54 to 83), the incidence rate was 2252.78 (95%UI:1809.47–2784.79) per 100,000 population; the number of diseases was 162 million (95%UI:133–193), the incidence rate was 5473.43 (95%UI:4488.62–6528.15) per 100,000 population; the number of DALYs was 19 million (95%UI:12–26), and the DALYs rate was 627.66 (95%UI:419.71–866.97) per 100,000 population. From 1990 to 2019, the incidence rate AAPC was
3.2The incidence, prevalence, DALYs of low back pain at regional level
Figure 2A illustrates the incidence rates smooth curve for 21 regions. The smoothed spline model showed a trend of increasing and then decreasing morbidity with increasing SDI, analysed as
3.3The incidence, prevalence, DALYs of LBP at country level
Figures 3A and 4A show the incidence rates for 204 countries. With increasing SDI, the smoothed spline model demonstrates an increasing and decreasing trend in prevalence. China, India, and South Africa had prevalence rates significantly below the smooth curve. Eleven nations (Poland, Bulgaria, Hungary, Slovakia, Slovenia, Croatia, Romania, Serbia, Montenegro, the United States, and Albania) had a significantly higher prevalence than the smooth curve. Figures 3A and 4A show the prevalence rates across 204 countries. The prevalence of the smoothed spline model increases with increasing SDI. One country’s (India) prevalence rate is significantly below the smooth curve. The prevalence in one country (the United States) was significantly higher than the smooth curve. Figures 3A and 4A display the DALYs rates for 204 countries. As SDI rises, refined spline models indicate an increasing DALYs rate trend. However, in one country (India), the DALYs rates are significantly below the smooth curve. The rates of DALYs in one country (the United States) are well above the smooth curve.
Table 2
Prediction of incidence rate, prevalence rate and DALYs rate of low back pain from 2020–2030
| Location | 2020 | 2030 | ||||
|---|---|---|---|---|---|---|
| Incidence | Prevalence | DALYs | Incidence | Prevalence | DALYs | |
| Rate per 100,000 people (95%UI) | Rate per 100,000 people (95%UI) | |||||
| Global | 2226.001747 | 5409.507171 | 620.389416 | 2158.822782 | 5218.415942 | 597.871504 |
| Andean Latin America | 2283.396025 | 5210.570754 | 599.709787 | 2270.651466 | 5185.482509 | 596.779717 |
| Australasia | 2800.819001 | 8195.226346 | 931.803026 | 2709.995618 | 7559.829997 | 857.075478 |
| Caribbean | 2475.890585 | 5706.062365 | 653.306484 | 2468.21939 | 5694.958011 | 651.686736 |
| Central Asia | 2505.959036 | 5634.012418 | 650.345925 | 2458.042452 | 5530.737425 | 637.275235 |
| Central Europe | 3852.25996 | 9034.217406 | 1044.517196 | 3745.655283 | 8792.216993 | 1014.36572 |
| Central Latin America | 2754.307124 | 6489.811382 | 745.293067 | 2817.238035 | 6650.595195 | 764.359177 |
| Central Sub-Saharan Africa | 2089.522189 | 4778.787194 | 542.225007 | 2071.62133 | 4739.7498 | 539.02311 |
| East Asia | 1673.169061 | 3847.005702 | 447.569508 | 1698.104844 | 3936.682168 | 456.707372 |
| Eastern Europe | 3183.507913 | 7387.034923 | 851.077629 | 3036.655359 | 7101.893598 | 815.422968 |
| Eastern Sub-Saharan Africa | 1893.128636 | 4241.795183 | 484.599956 | 1909.96299 | 4296.0681 | 491.616085 |
| High-income Asia Pacific | 3176.801533 | 9489.998975 | 1097.470608 | 3173.963676 | 9220.476813 | 1065.215571 |
| High-income North America | 3525.782229 | 11701.8552 | 1325.270183 | 3553.698771 | 11728.48298 | 1324.504503 |
| North Africa and Middle East | 2939.827012 | 6802.528196 | 781.208941 | 2851.398486 | 6549.144145 | 751.074663 |
| Oceania | 3086.722186 | 7040.22849 | 804.511197 | 3034.34008 | 6934.487681 | 792.364261 |
| South Asia | 1535.611344 | 3471.73123 | 395.738122 | 1442.828306 | 3242.310234 | 370.025716 |
| Southeast Asia | 2808.656684 | 6380.343966 | 736.248252 | 2726.737935 | 6235.071505 | 719.493338 |
| Southern Latin America | 2340.321439 | 6355.718999 | 729.294989 | 2382.523587 | 6324.33593 | 725.510111 |
| Southern Sub-Saharan Africa | 1793.346739 | 4054.157898 | 461.510057 | 1781.638987 | 4030.620444 | 458.48576 |
| Tropical Latin America | 3049.965297 | 7289.277629 | 830.105719 | 3040.241121 | 7265.881413 | 824.595541 |
| Western Europe | 2888.373807 | 8669.772477 | 990.722244 | 2829.255415 | 8265.667356 | 943.627288 |
| Western Sub-Saharan Africa | 2145.947461 | 5113.890864 | 583.036729 | 2123.788885 | 5062.688611 | 577.251742 |
3.4Predictions of LBPn from 2020 to 2030 at global and regional level
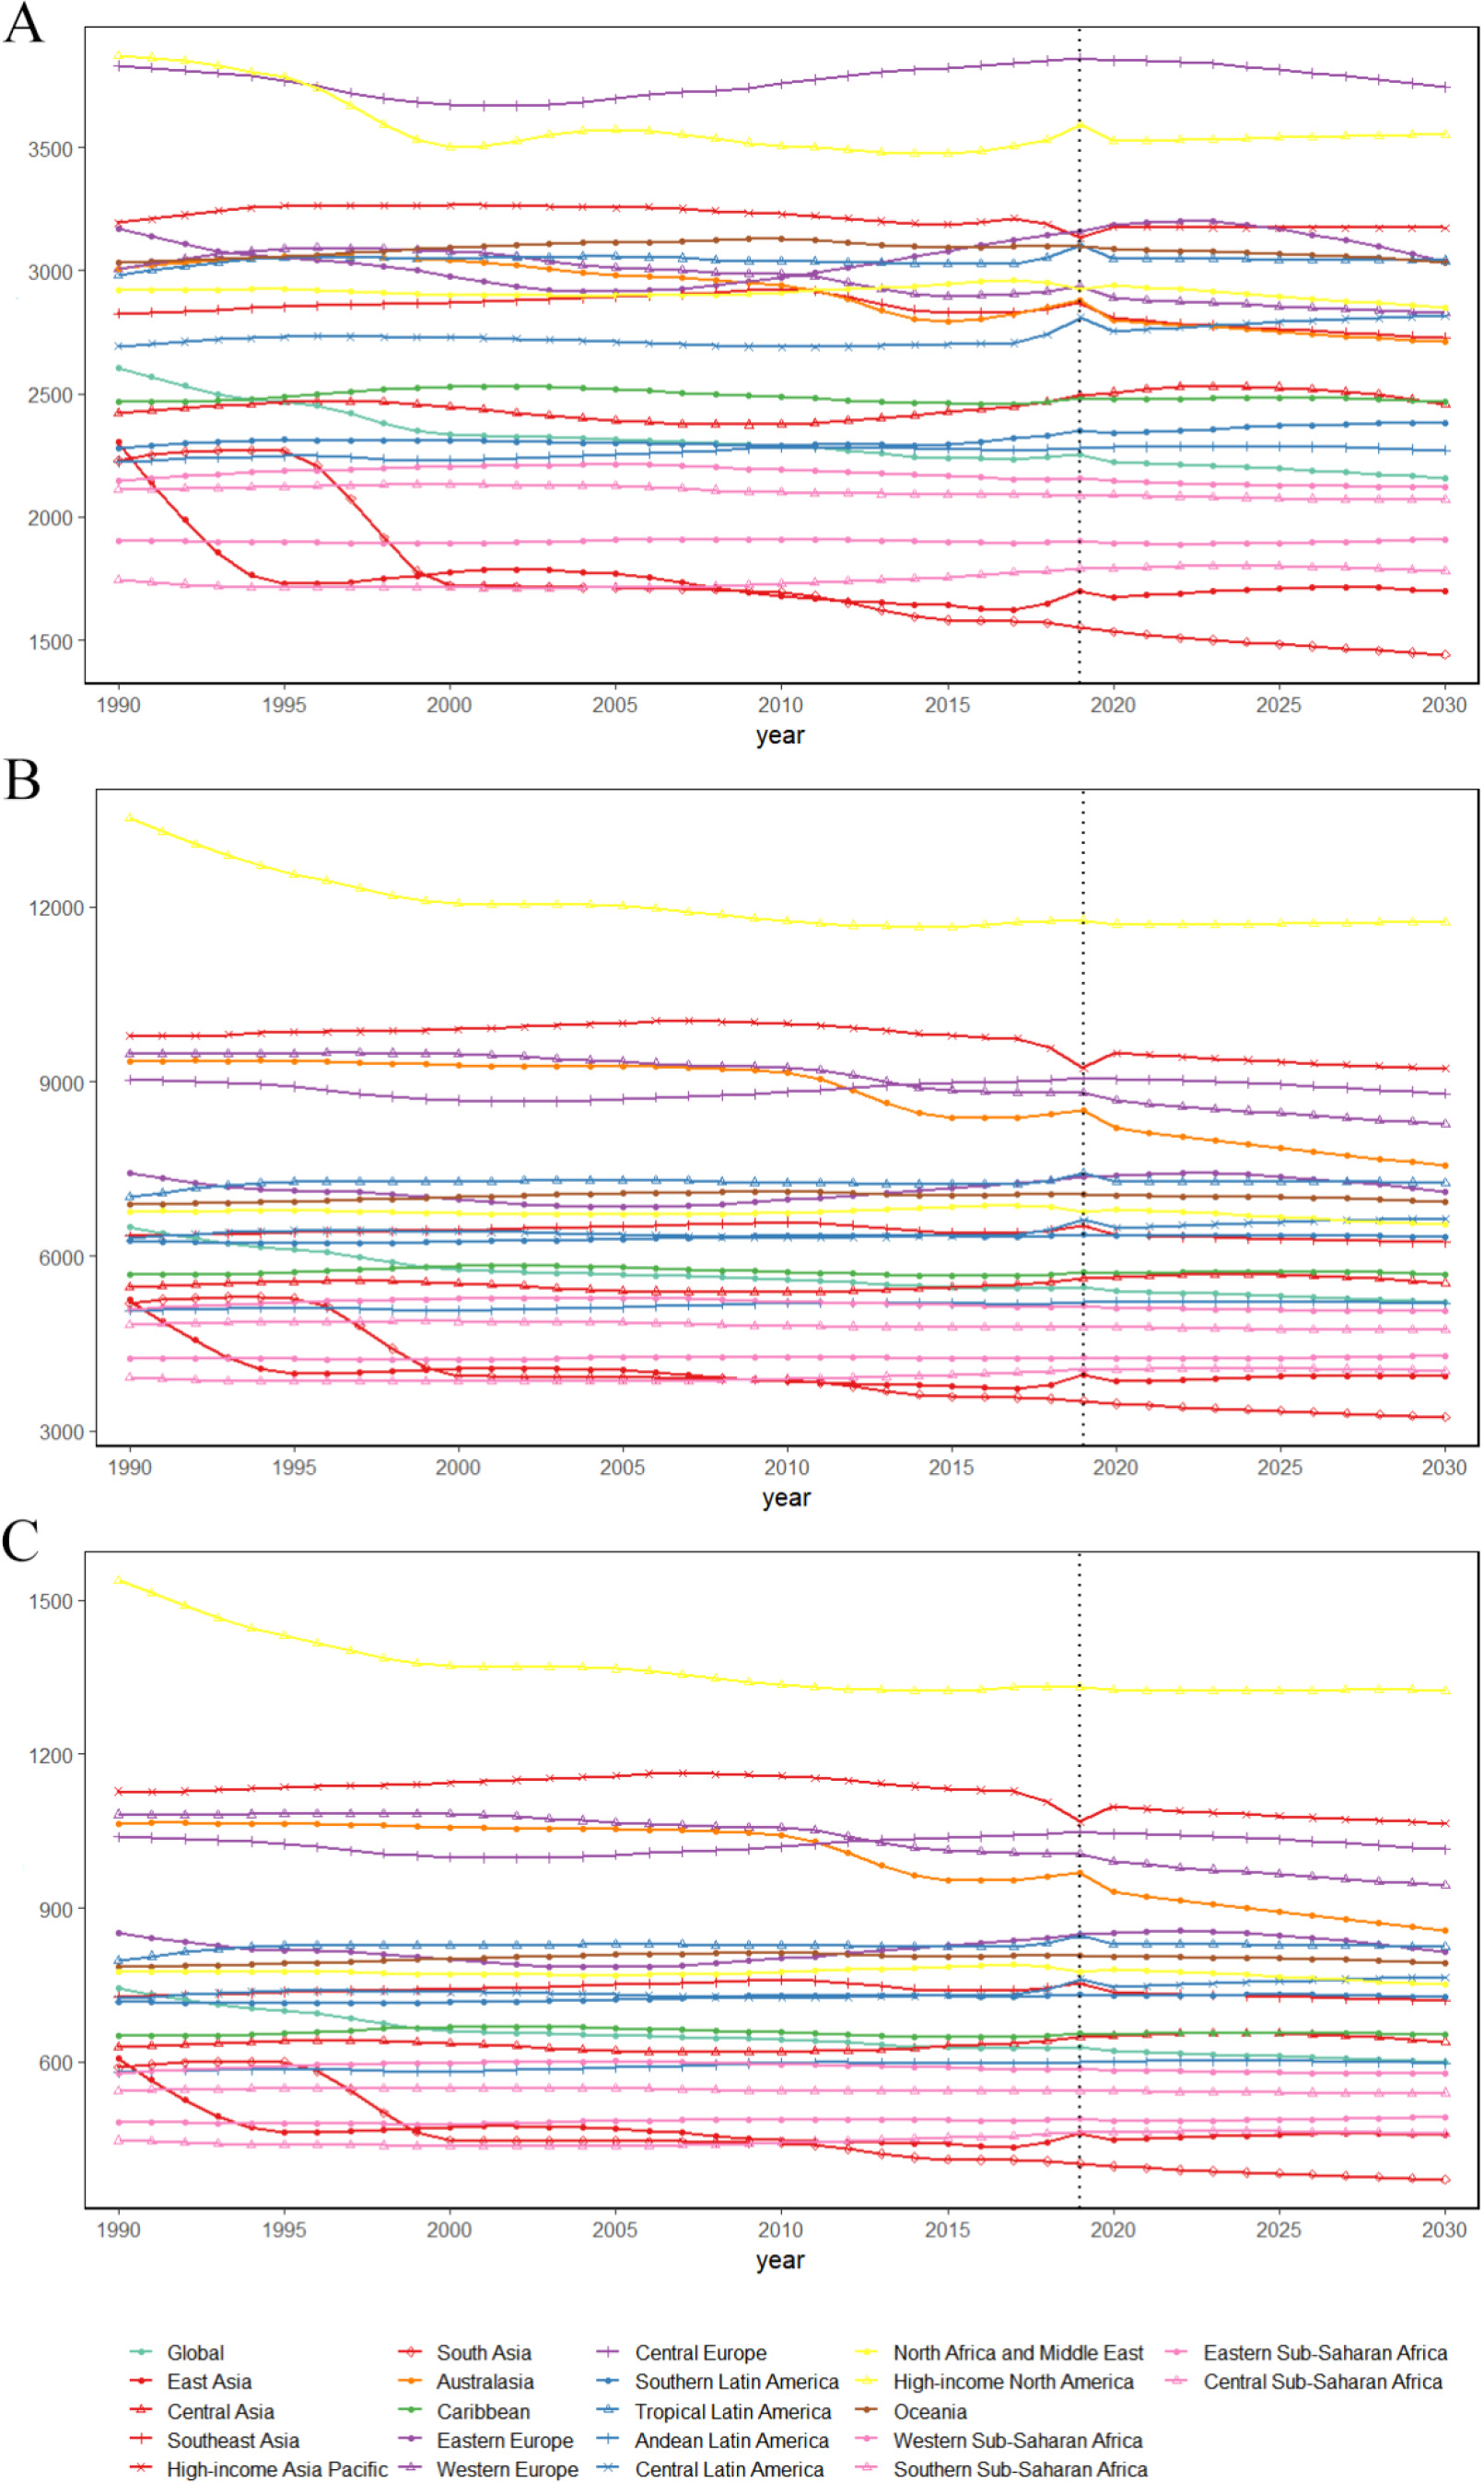
By 2030, it was anticipated that the incidence, prevalence, and DALYs rates would be 2158.822782, 5218.415942, and 587.871504. From 2020 to 2030, the incidence, prevalence, and DALYs rates decreased in most regions, with Central Latin America showing a tremendous increase among regions with an increasing trend. Table 2 and Fig. 4 show the predicted incidence rates, prevalence rates, and DALYs rates for 21 regions.
4.Discussion
To the best of our knowledge, this study is the first to analyze the burden comprehensively and changing trends of LBP in AYAs at the global, regional, and national levels. Over the past 30 years, the incidence, prevalence, and rates of DALYs at global and regional levels were analyzed, as were the incidence, prevalence, and rates of DALYs in various regions and countries as SDI levels changed. Our study adds detailed information on global, regional and national levels to the limited epidemiological data on low back pain in adolescents and young adults.
Figure 1.
Incidence rates, prevalence rates and DALYs rates of low back pain by country in 2019.
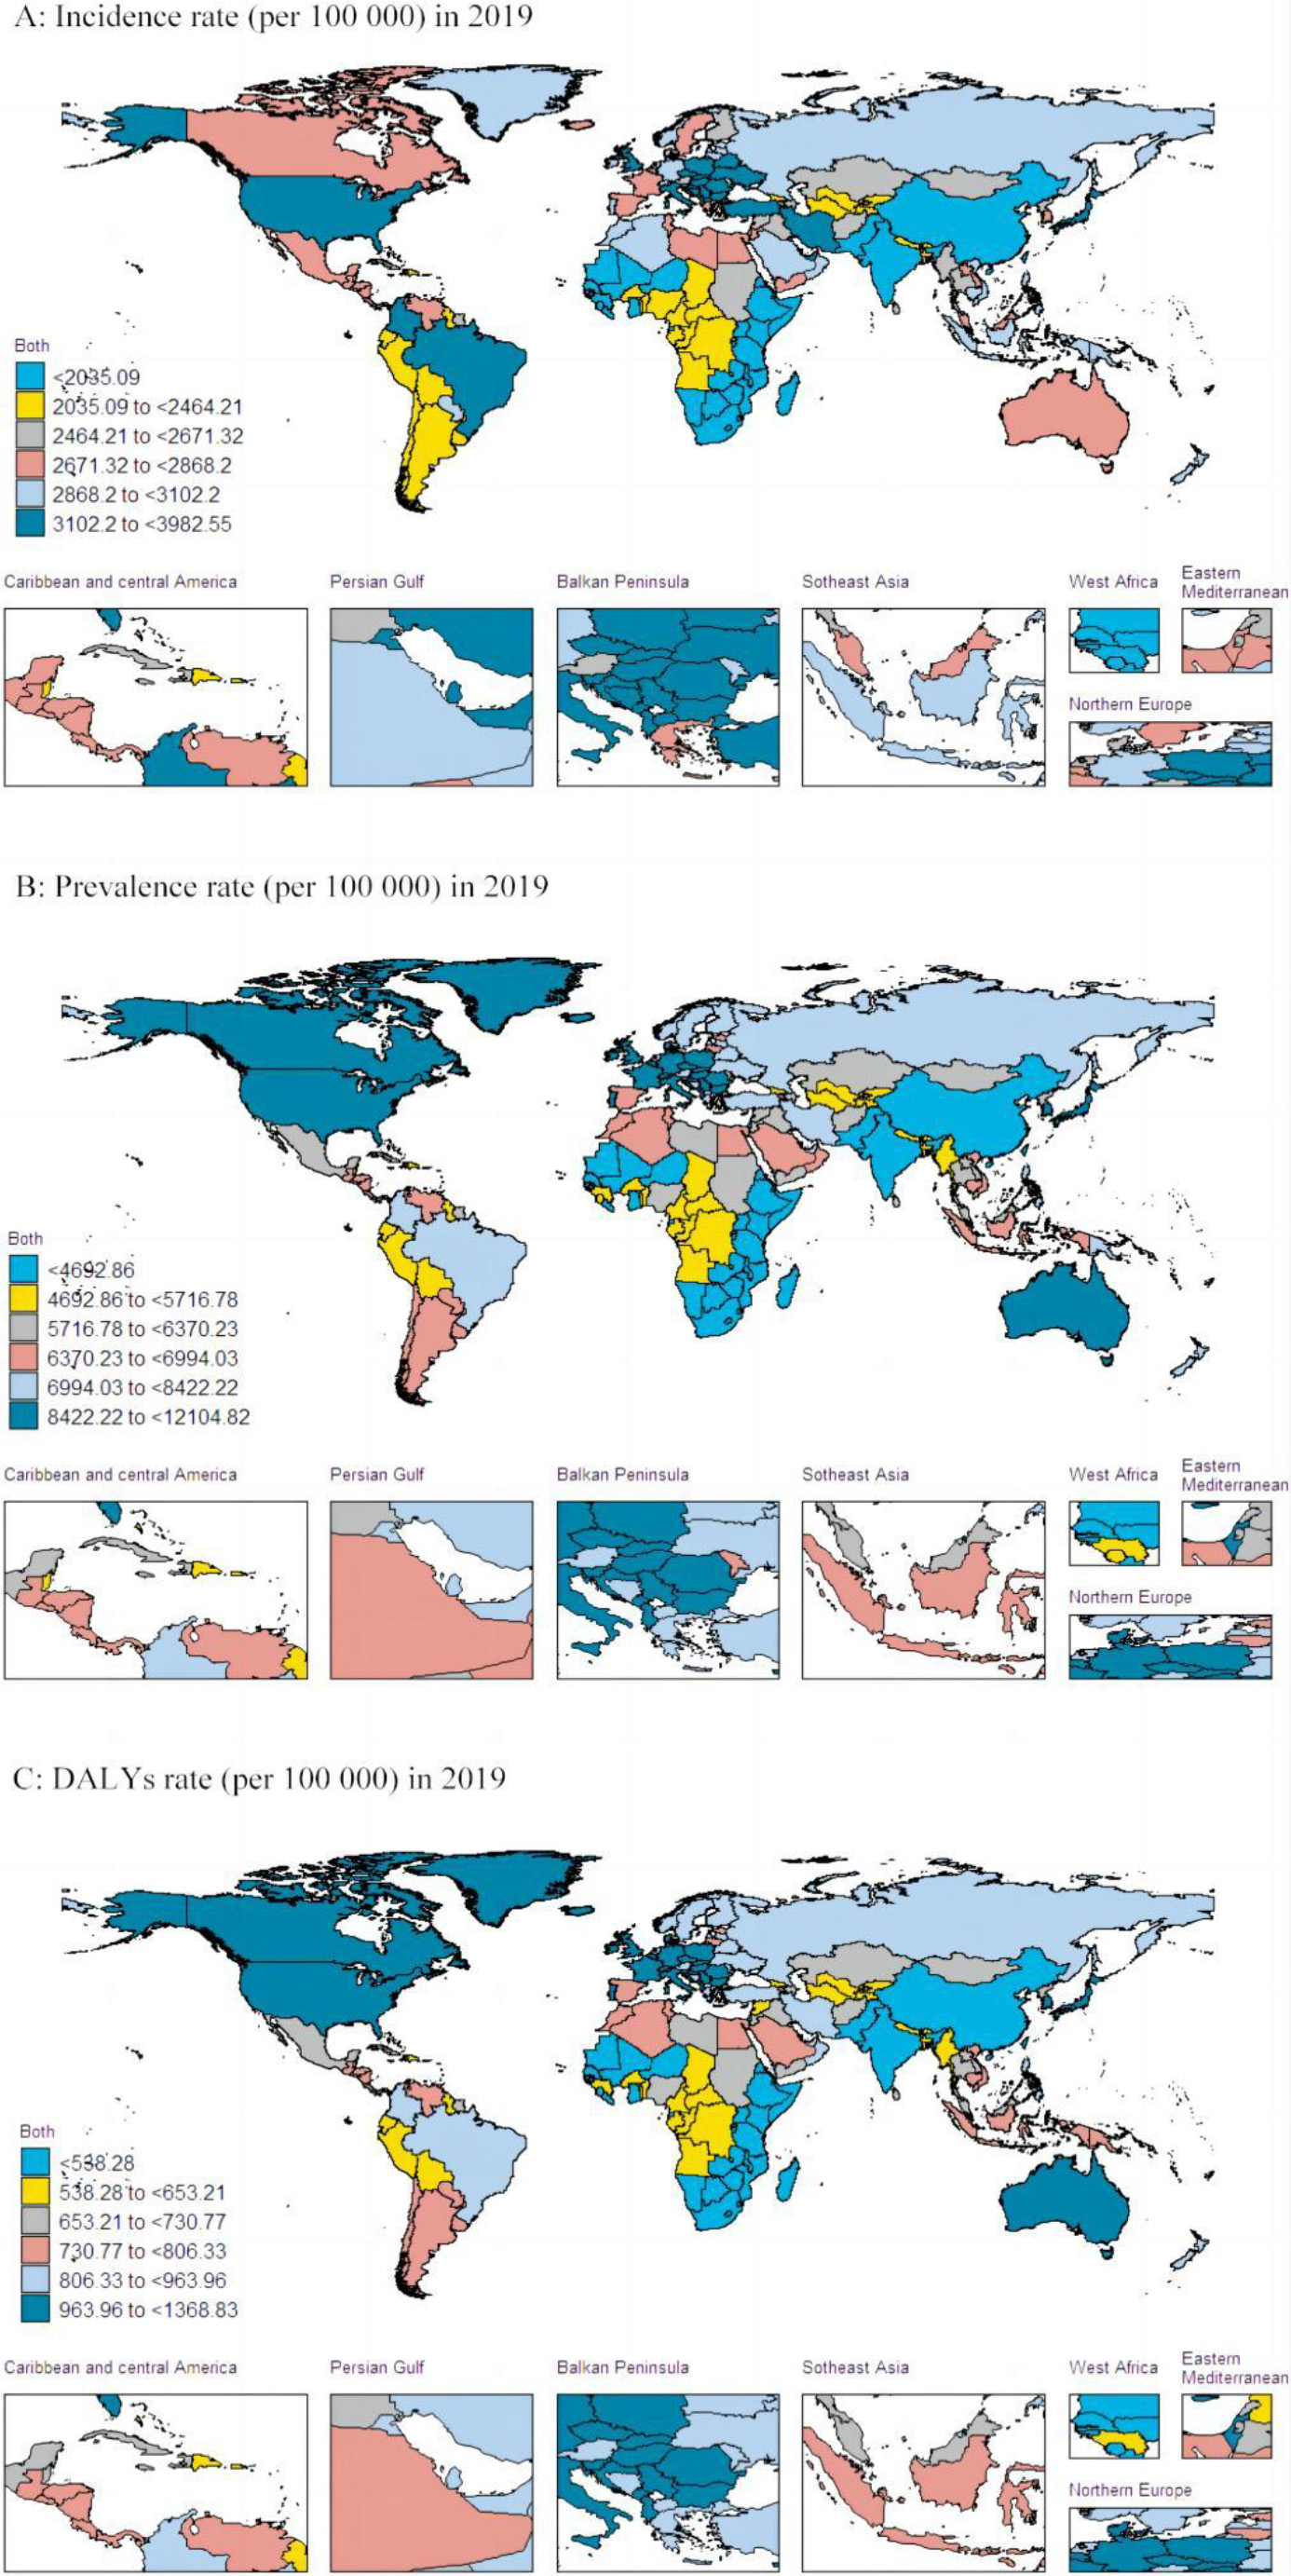
Figure 2.
Incidence rates, prevalence rates and DALYs rates of low back pain for 21 GBD regions by SDI between 1990 and 2019.
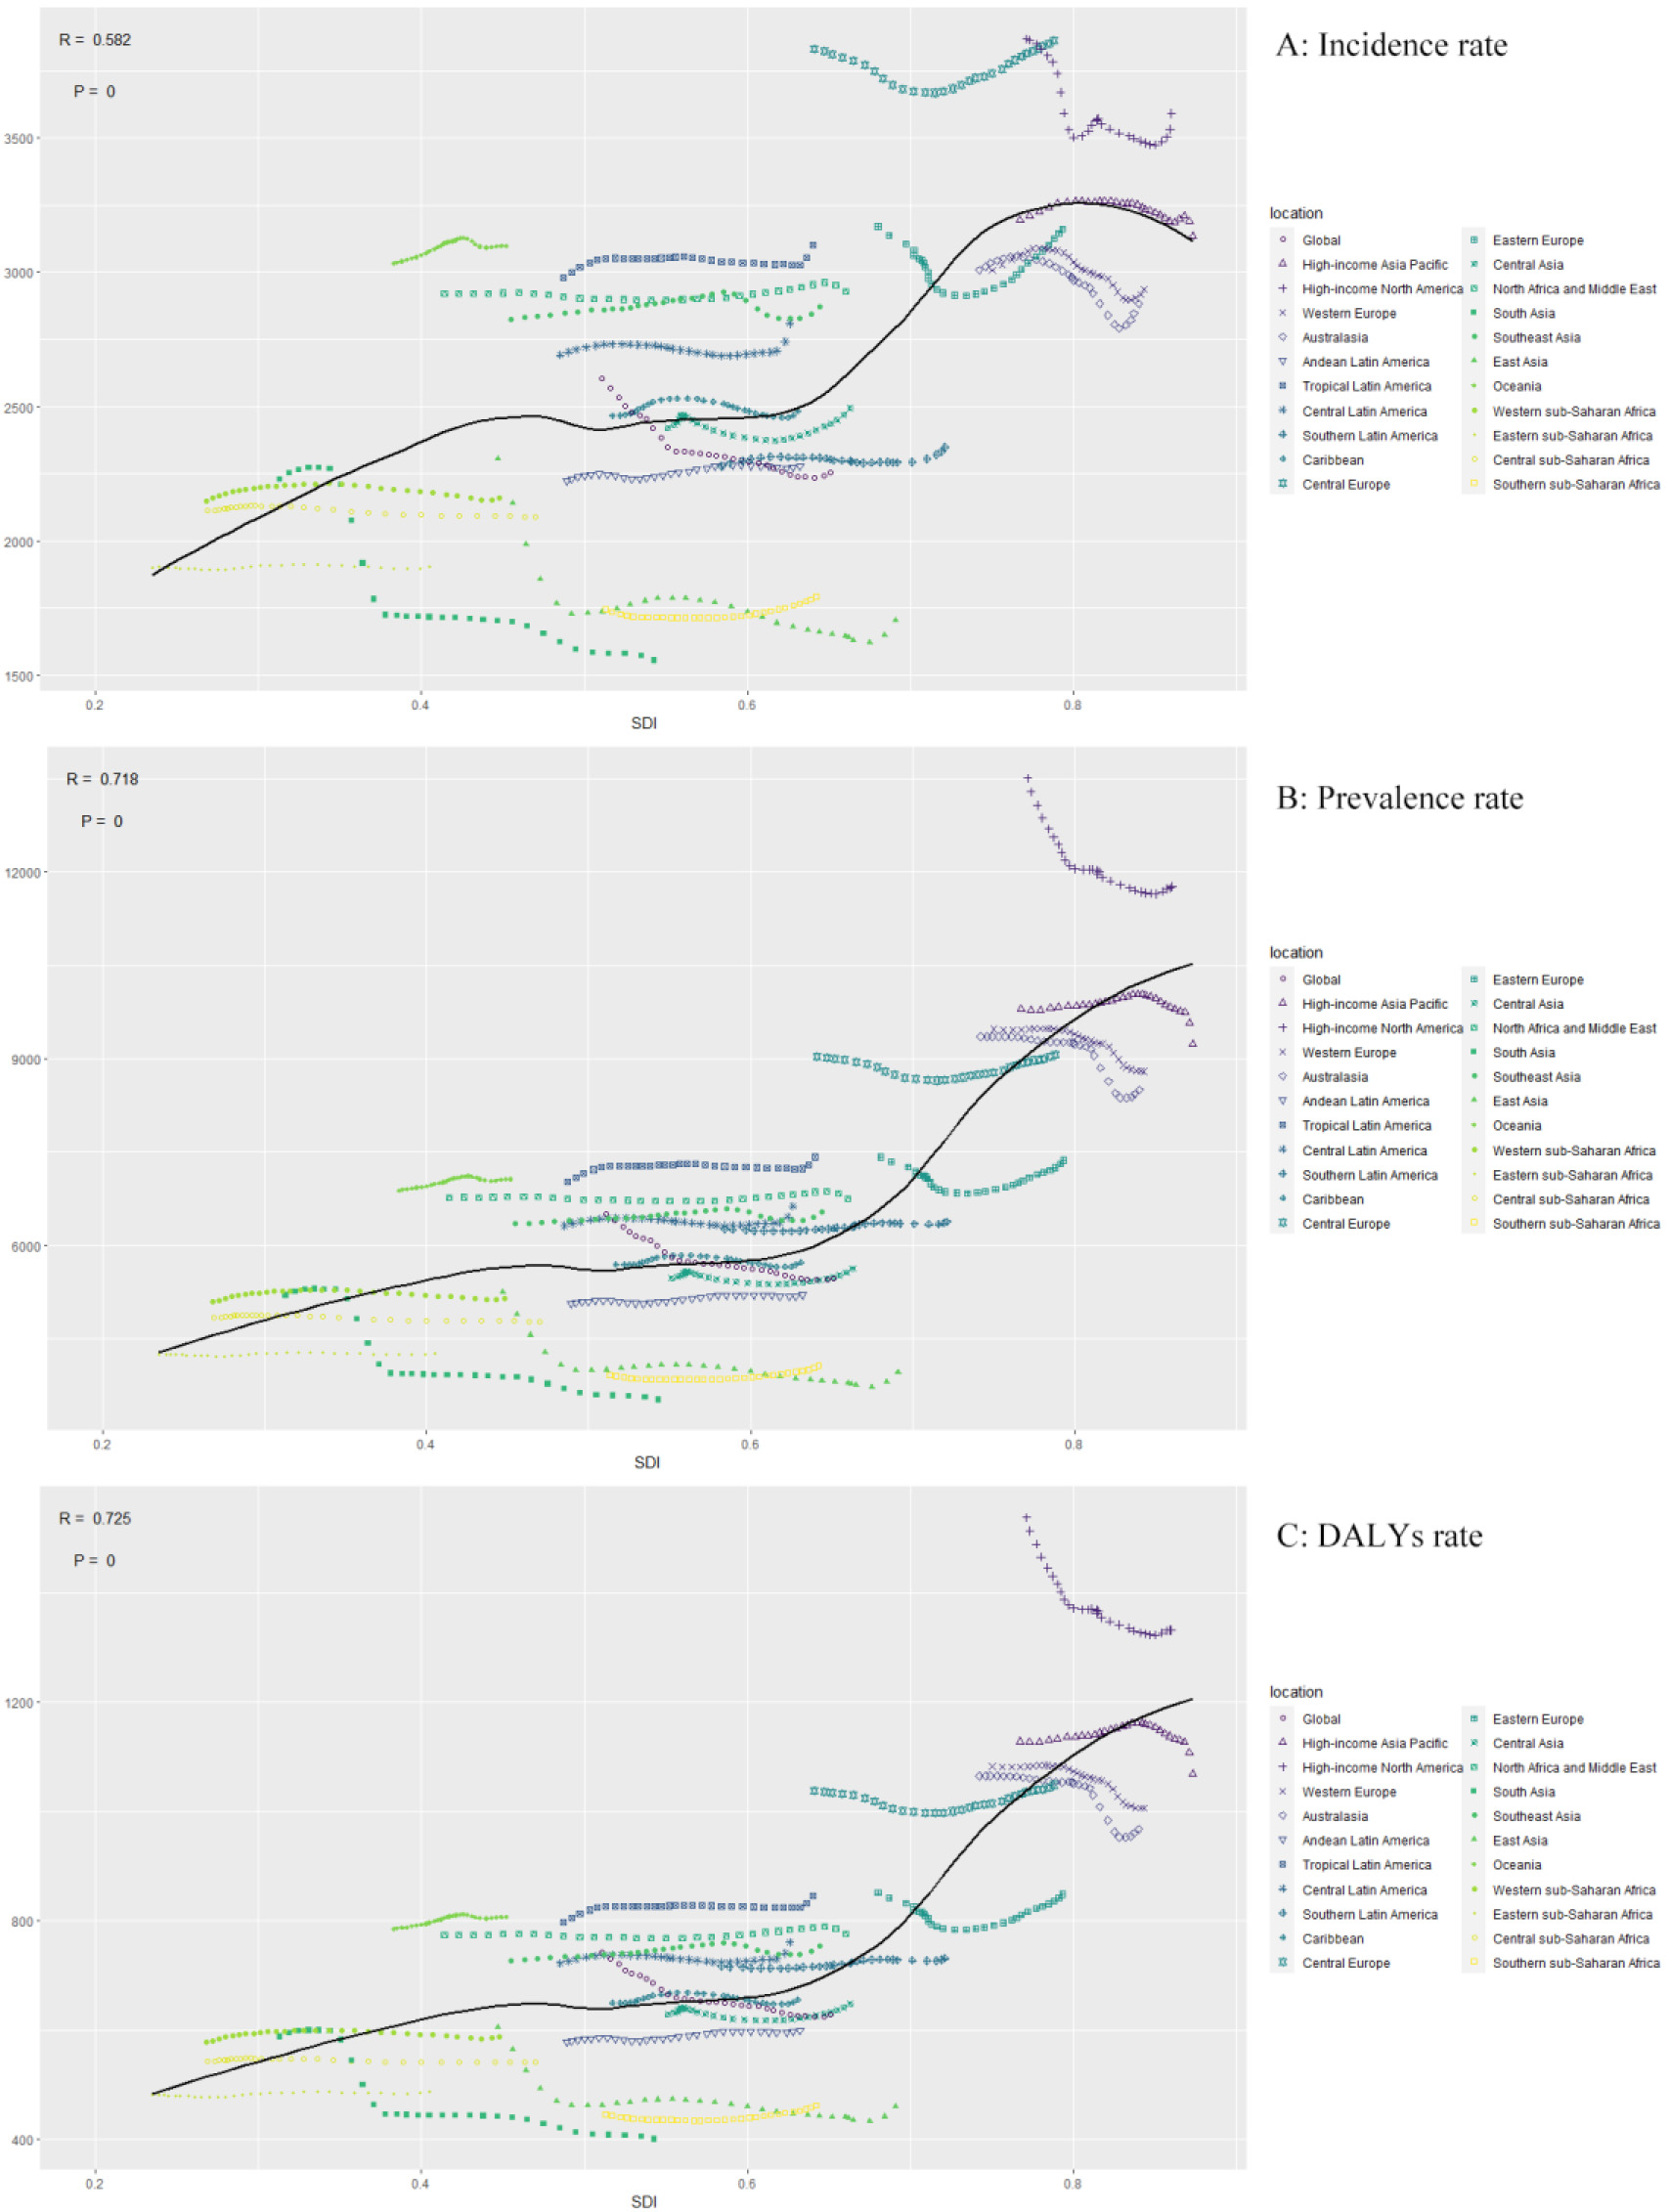
Figure 3.
Incidence rate, prevalence rate and DALYs rate of low back pain by 204 countries and terri-ries and SDI in 2019.
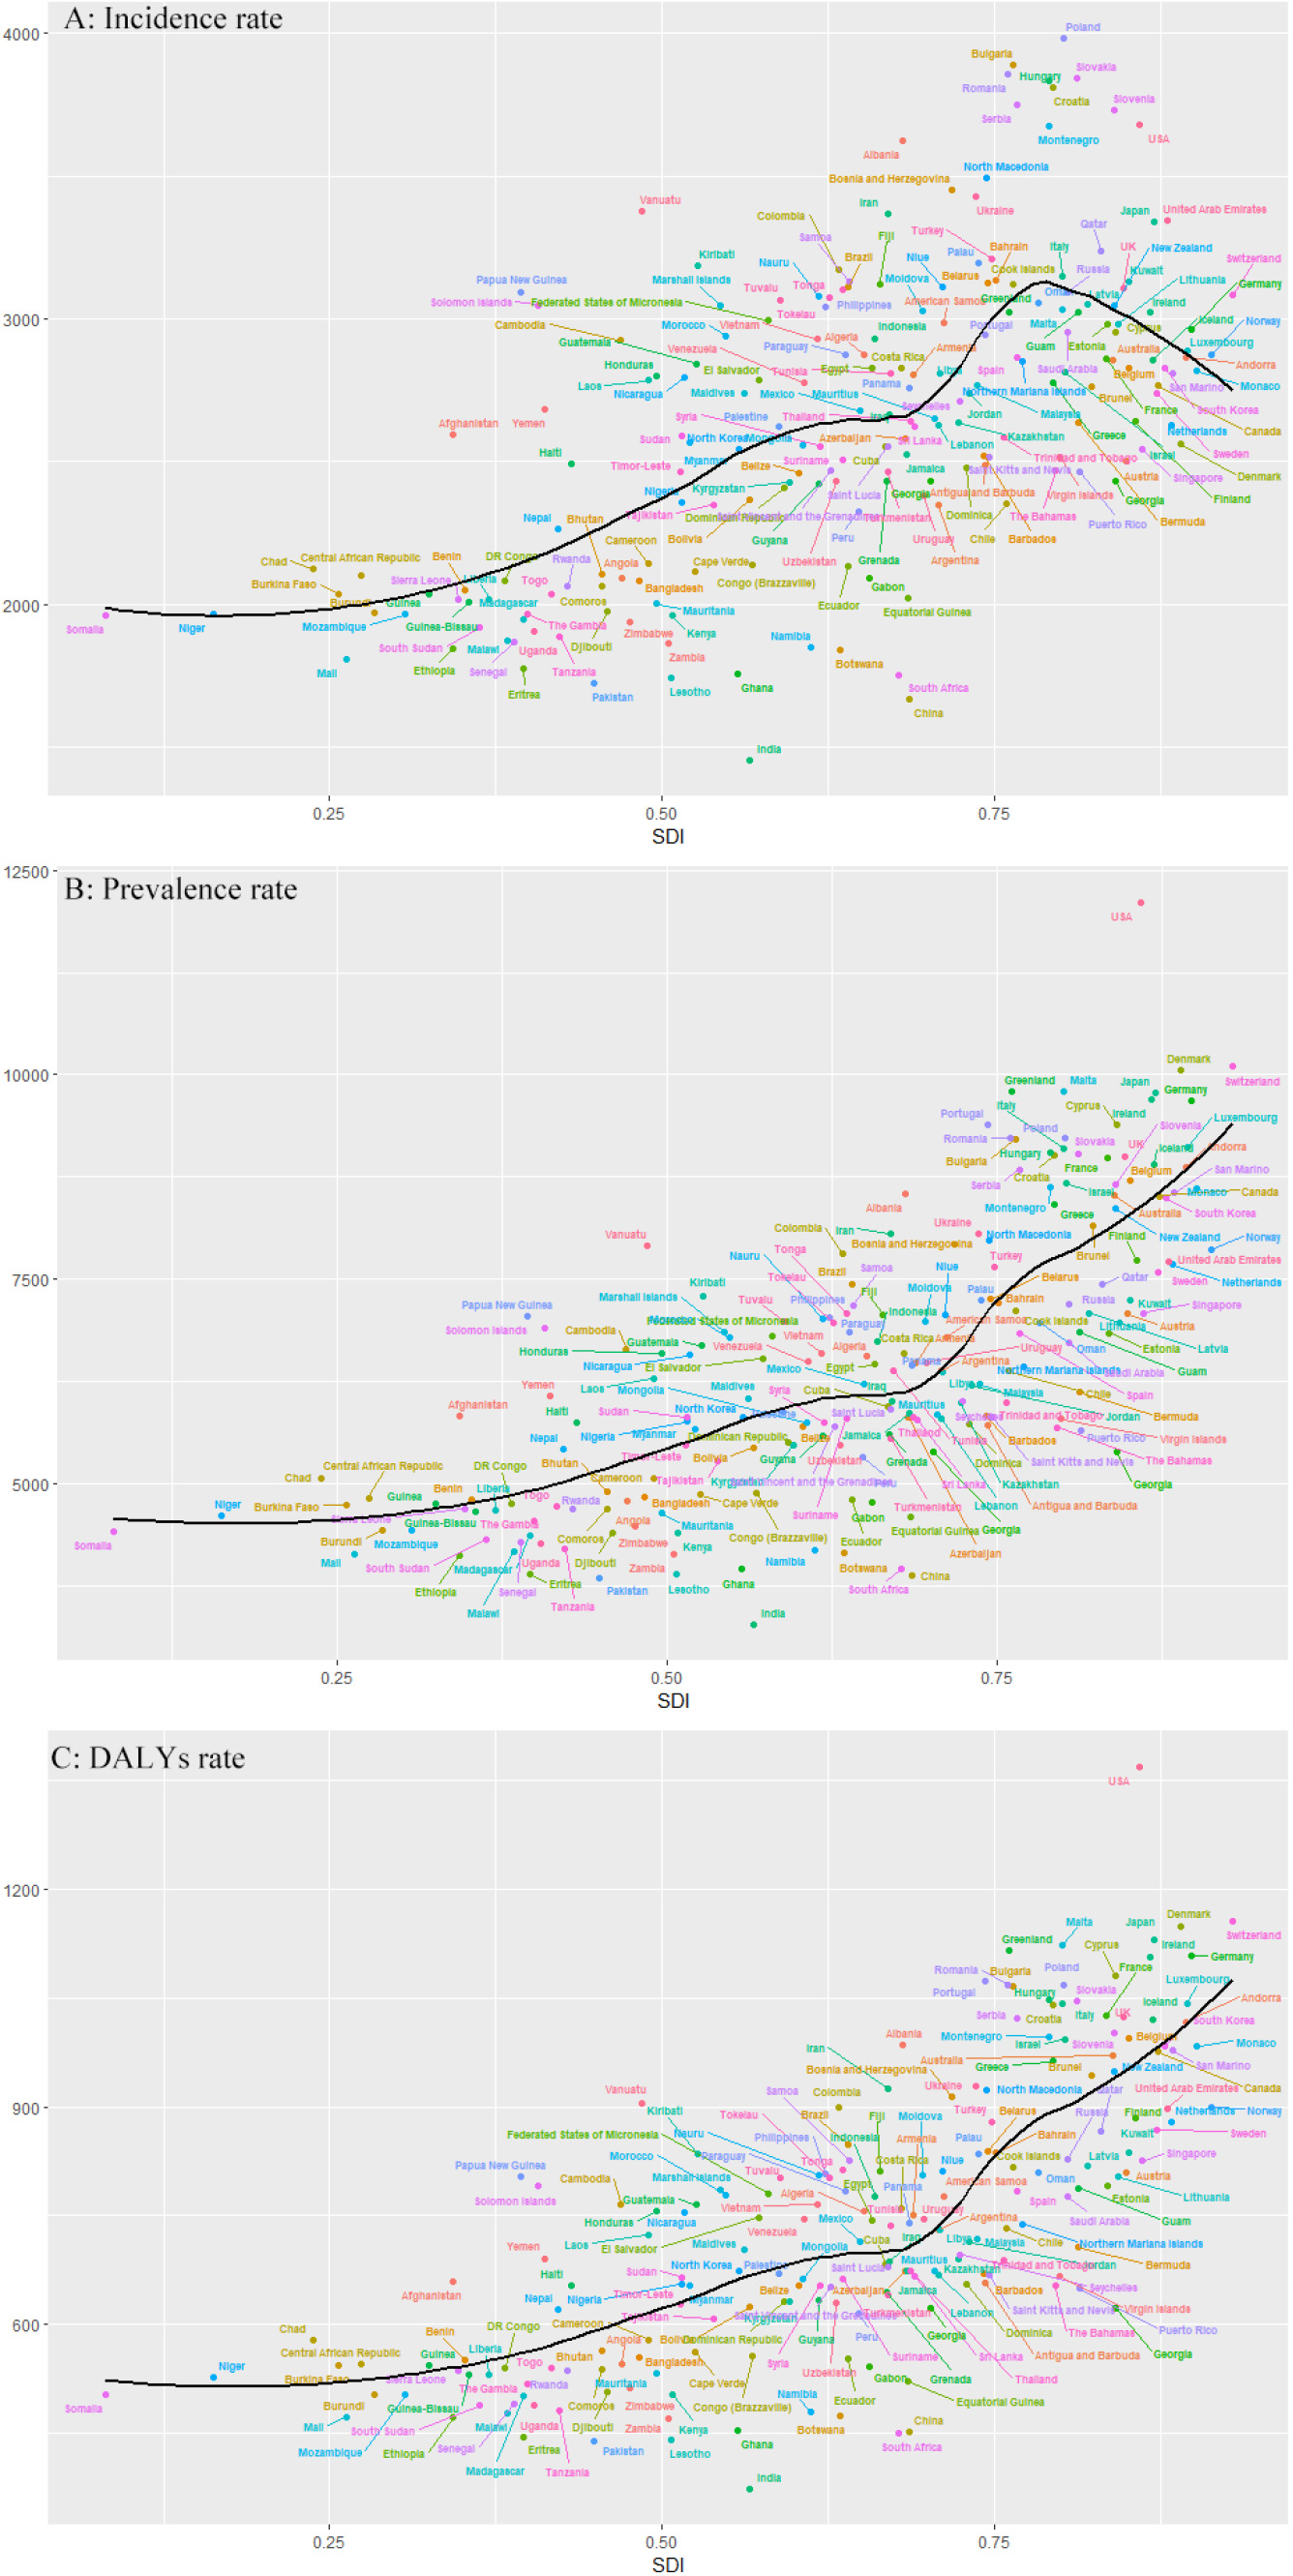
Figure 4.
Prediction of incidence rate, prevalence rate and DALYs rate of low back pain from 1990–2030. (A) Plots of incidence rate; (B) Plots of prevalence rate; (C) Plots of DALYs rate.
In terms of global disease burden, the number of incidence, prevalence, and DALYs increased in 2019 compared to 1990. However, the rates of incidence, prevalence, and DALYs decreased in 2019 compared to 1990, with AAPCs of
Regarding regional disease burden, the incidence, prevalence, and DALYs rates were stable in most regions, indicating that most countries have attained stability in preventing and treating LBP in adolescents and young adults. The incidence rates, prevalence rates, and DALYs rates all decreased in South Asia, East Asia, High-income North America, Western Europe, and Australasia, indicating that these regions have achieved tremendous success in controlling the risk factors of LBP and have also achieved some effect in the treatment of LBP, which should serve as an example for other regions. The incidence, prevalence, and DALYs rates in Central Asia, Central Europe, and Eastern Europe showed a decreasing and then increasing trend, and there have been problems in the prevention and treatment of LBP in these three regions in recent years; therefore, the work in this area should be intensified. Most of these countries are low- and middle-income countries that are experiencing the effects of rising obesity rates, rapid industrial growth and the accompanying decline in physical activity. At the same time, health and social systems in these countries are only able to respond to priorities such as infectious diseases and are not yet equipped to deal with the growing burden of low back pain, which in turn leads to an increasing number of DALYs [28, 29].
In terms of the national disease burden, the incidence rates, prevalence, and DALYs situation is average in most countries. However, eleven countries are above the average incidence rates, whereas the United States is above the average prevalence and DALYs rates. Previous research has demonstrated that LBP is closely associated with obesity, overweight [30], and a sedentary lifestyle, and the rising prevalence of overweight and obesity in the United States may contribute to the high incidence, prevalence, and DALYs rates of LBP [31]. The causes of the high incidence of LBP are complex and may involve differences in economics, culture, history, geographical factors, health systems and policies. However, risk factors such as lifestyle, social factors, place of residence, type of workload, environmental factors and high-risk activities should be controlled [4, 32, 33]. To reduce the disease burden caused by LBP, the United States should strengthen the prevention and treatment of LBP in adolescents and young adults. Meanwhile, the incidence, prevalence, and DALYs rates in India and China are significantly lower than the global average, which may be attributable to the gradual improvement of health awareness among AYAs as a result of India’s and China’s rapid socioeconomic development and the propensity of young people to engage in some light physical labour [7].
Incidence, prevalence, and DALYs rates at the global level all show a decreasing trend from 2020 to 2030, indicating that the disease burden of LBP has been reduced to some extent globally but that the overall disease burden remains high. In terms of incidence, prevalence, and DALYs, most regions exhibited a stable and decreasing trend, with Central Latin America showing a tremendous increase among regions with an increasing trend. In previous studies, the risk factors for LBP in Central Latin America, such as melancholy, obesity and overweight, and smoking, have also increased [34, 35, 36]. Therefore, the burden of LBP could be alleviated over the next ten years, but Central Latin America must still be fortified.
This study is not without limitations. The GBD database data on LBP were derived from participants’ self-reports and largely depended on participants’ perceptions of signs and symptoms. GBD datasets from the GBD database primarily utilise estimated data derived from mathematical-statistical models that are susceptible to distortion. The absence of data typically indicates a deficiency in healthcare resources, so the LBP burden among AYAs was likely underestimated and underreported globally. The absence of data sources may have also introduced bias into our findings. Consequently, national estimates must be interpreted with prudence.
5.Conclusions
The incidence, prevalence and DALYs of LBP in AYAs decreased slightly from 1990-2019, but in 2019, there are still 66859444.59 cases of incidence, 162443872.41 cases of prevalence, and 18628061.25 number of DALYs in the globe. LBP in AYAs is a major global public problem with a high burden. There are large differences in incidence, prevalence and DALYs across SDIs, regions and countries, with Central Asia, Central Europe, Eastern Europe at the regional level and the United States at the national level represented as showing an increasing trend. Therefore, there is still a need to focus on LBP in AYAs and tailor interventions to reduce the future burden of this condition.
Author contributions
Bin Pei and Ying Liu designed the study. Guoxin Huang and Zhiming Wu analyzed and interpreted the data. The manuscript was drafted by Zhiming Wu with contributions from Ying Liu. Jinwei Ai revised the manuscript. Bin Pei is the guarantor of this work. All authors read and approved the final version of the manuscript. All authors agree to be accountable for the work and to ensure that any questions relating to the accuracy and integrity of the paper are investigated and properly resolved.
Data availability statement
The data used are publicly available online on the website of the Institute for Health Metrics and Evaluation (IHME) (http://ghdx.healthdata.org/gbd-resultstool).
Ethical approval
Not applicable.
Funding
None to report.
Informed consent
Not applicable.
Acknowledgments
We thank the collaborators of the Global Burden of Disease (GBD) study 2019 for their excellent work.
Conflict of interest
The authors declare no conflict of interest.
References
[1] | Fares MY, Fares J, Salhab HA, Khachfe HH, Bdeir A, Fares Y. Low back pain among weightlifting adolescents and young adults. Cureus. (2020) ; 12: (7): e9127. |
[2] | Griffin MF, Naderi N, Kalaskar DM, Seifalian AM, Butler PE. Argon plasma surface modification promotes the therapeutic angiogenesis and tissue formation of tissue-engineered scaffolds in vivo by adipose-derived stem cells. Stem Cell Res Ther. 2019: ; 10: (1): 110. |
[3] | Chen S, Chen M, Wu X, Lin S, Tao C, Cao H, Shao Z, Xiao G. Global, regional and national burden of low back pain 1990–2019: A systematic analysis of the Global Burden of Disease study 2019. J Orthop Translat. (2022) ; 32: : 49-58. |
[4] | Xie Y, Bowe B, Mokdad AH, Xian H, Yan Y, Li T, Maddukuri G, Tsai C-Y, Floyd T, Al-Aly Z. Analysis of the Global Burden Of Disease Study highlights the global, regional, and national trends of chronic kidney disease epidemiology from 1990 to 2016. Kidney International. (2018) ; 94: (3): 567-581. |
[5] | Lindstrom M, DeCleene N, Dorsey H, Fuster V, Johnson CO, LeGrand KE, Mensah GA, Razo C, Stark B, Varieur TJ, et al. Global burden of cardiovascular diseases and risks collaboration 1990–2021. J Am Coll Cardiol. (2022) ; 80: (25): 2372-2425. |
[6] | Kyu HH, Abate D, Abate KH, Abay SM, Abbafati C, Abbasi N, Abbastabar H, Abd-Allah F, Abdela J, Abdelalim A, et al. Global, regional, and national disability-adjusted life-years (DALYs) for 359 diseases and injuries and healthy life expectancy (HALE) for 195 countries and territories, 1990–2017: A systematic analysis for the Global Burden of Disease Study 2017. Lancet. (2018) ; 392: (10159): 1859-1922. |
[7] | Collaborators GBDRF. Global, regional, and national age-sex-specific mortality and life expectancy, 1950–2017: A systematic analysis for the Global Burden of Disease Study 2017. Lancet. (2018) ; 392: (10159): 1684-1735. |
[8] | Collaborators GBDRF. Global, regional, and national comparative risk assessment of 84 behavioural, environmental and occupational, and metabolic risks or clusters of risks for 195 countries and territories, 1990–2017: A systematic analysis for the Global Burden of Disease Study 2017. Lancet. (2018) ; 392: (10159): 1923-1994. |
[9] | Wang L, Ye H, Li Z, Lu C, Ye J, Liao M, Chen X. Epidemiological trends of low back pain at the global, regional, and national levels. Eur Spine J. (2022) ; 31: (4): 953-962. |
[10] | de David CN, Deligne LMC, Da SRS, Malta DC, Duncan BB, Passos VMA, Cousin E. The burden of low back pain in Brazil: Estimates from the Global Burden of Disease 2017 Study. Popul Health Metr. (2020) ; 18: (Suppl 1): 12. |
[11] | Safiri S, Nejadghaderi SA, Noori M, Sullman MJM, Collins GS, Kaufman JS, Hill CL, Kolahi AA. The burden of low back pain and its association with socio-demographic variables in the Middle East and North Africa region, 1990–2019. BMC Musculoskelet Disord. (2023) ; 24: (1): 59. |
[12] | Smith AW, Seibel NL, Lewis DR, Albritton KH, Blair DF, Blanke CD, Bleyer WA, Freyer DR, Geiger AM, Hayes-Lattin B, et al. Next steps for adolescent and young adult oncology workshop: An update on progress and recommendations for the future. Cancer. (2016) ; 122: (7): 988-999. |
[13] | Ferrari A, Stark D, Peccatori FA, Fern L, Laurence V, Gaspar N, Bozovic-Spasojevic I, Smith O, De Munter J, Derwich K, et al. Adolescents and young adults (AYA) with cancer: A position paper from the AYA working group of the European Society for Medical Oncology (ESMO) and the European Society for Paediatric Oncology (SIOPE). ESMO Open. (2021) ; 6: (2): 100096. |
[14] | Azevedo N, Ribeiro JC, Machado L. Back pain in children and adolescents: A cross-sectional study. European Spine Journal. (2023) ; 32: (9): 3280-3289. |
[15] | Frosch M, Leinwather S, Bielack S, Bloedt S, Dirksen U, Dobe M, Geiger F, Haefner R, Hoefel L, Huebner-Moehler B, et al. Treatment of unspecific back pain in children and adolescents: results of an evidence-based interdisciplinary guideline. Children-Basel. (2022) ; 9: (3). |
[16] | Guan S-Y, Zheng J-X, Sam NB, Xu S, Shuai Z, Pan F. Global burden and risk factors of musculoskeletal disorders among adolescents and young adults in 204 countries and territories, 1990–2019. Autoimmunity Reviews. (2023) ; 22: (8). |
[17] | Hoy D, Brooks P, Blyth F, Buchbinder R. The epidemiology of low back pain. Best Pract Res Clin Rheumatol. (2010) ; 24: (6): 769-781. |
[18] | Urits I, Burshtein A, Sharma M, Testa L, Gold PA, Orhurhu V, Viswanath O, Jones MR, Sidransky MA, Spektor B, et al. Low back pain, a comprehensive review: Pathophysiology, diagnosis, and treatment. Curr Pain Headache Rep. (2019) ; 23: (3): 23. |
[19] | Collaborators GBDRF. Global burden of 87 risk factors in 204 countries and territories, 1990–2019: A systematic analysis for the Global Burden of Disease Study 2019. Lancet. (2020) ; 396: (10258): 1223-1249. |
[20] | Collaborators GBDRF. Global age-sex-specific fertility, mortality, healthy life expectancy (HALE), and population estimates in 204 countries and territories, 1950–2019: A comprehensive demographic analysis for the Global Burden of Disease Study 2019. Lancet. (2020) ; 396: (10258): 1160-1203. |
[21] | Vollset SE, Goren E, Yuan CW, Cao J, Smith AE, Hsiao T, Bisignano C, Azhar GS, Castro E, Chalek J, et al. Fertility, mortality, migration, and population scenarios for 195 countries and territories from 2017 to 2100: A forecasting analysis for the Global Burden of Disease Study. Lancet. (2020) ; 396: (10258): 1285-1306. |
[22] | Global Health Estimates. Life expectancy and leading causes of death and disability. |
[23] | Møller B, Fekjaer H, Hakulinen T, Sigvaldason H, Storm HH, Talbäck M, Haldorsen T. Prediction of cancer incidence in the Nordic countries: empirical comparison of different approaches. Stat Med. (2003) ; 22: (17): 2751-2766. |
[24] | Luo G, Zhang Y, Etxeberria J, Arnold M, Cai X, Hao Y, Zou H. Projections of lung cancer incidence by 2035 in 40 countries worldwide: Population-based study. Jmir Public Health and Surveillance. (2023) ; 9: (1). |
[25] | Yi X, He Y, Zhang Y, Luo Q, Deng C, Tang G, Zhang J, Zhou X, Luo H. Current status, trends, and predictions in the burden of silicosis in 204 countries and territories from 1990 to 2019. Frontiers in Public Health. (2023) ; 11: . |
[26] | Mikkonen P, Viikari-Juntura E, Remes J, Pienimäki T, Solovieva S, Taimela S, Zitting P, Koiranen M, Leino-Arjas P, Karppinen J. Physical workload and risk of low back pain in adolescence. Occup Environ Med. (2012) ; 69: (4): 284-290. |
[27] | Vuori IM. Dose-response of physical activity and low back pain, osteoarthritis, and osteoporosis. Med Sci Sports Exerc. (2001) ; 33: (6 Suppl): S551-586. discussion 609–510. |
[28] | Fatoye F, Gebrye T, Mbada CE, Useh U. Clinical and economic burden of low back pain in low- and middle-income countries: A systematic review. BMJ Open. (2023) ; 13: (4). |
[29] | Hartvigsen J, Hancock MJ, Kongsted A, Louw Q, Ferreira ML, Genevay S, Hoy D, Karppinen J, Pransky G, Sieper J, et al. What low back pain is and why we need to pay attention. Lancet. (2018) ; 391: (10137): 2356-2367. |
[30] | Chen SM, Liu MF, Cook J, Bass S, Lo SK. Sedentary lifestyle as a risk factor for low back pain: A systematic review. Int Arch Occup Environ Health. (2009) ; 82: (7): 797-806. |
[31] | Garcia JB, Hernandez-Castro JJ, Nunez RG, Pazos MA, Aguirre JO, Jreige A, Delgado W, Serpentegui M, Berenguel M, Cantemir C. Prevalence of low back pain in Latin America: A systematic literature review. Pain Physician. (2014) ; 17: (5): 379-391. |
[32] | Ganczak M, Miazgowski T, Kozybska M, Kotwas A, Korzen M, Rudnicki B, Nogal T, Andrei CL, Ausloos M, Banach M, et al. Changes in disease burden in Poland between 1990–2017 in comparison with other Central European countries: A systematic analysis for the Global Burden of Disease Study 2017. Plos One. (2020) ; 15: (3). |
[33] | Shivakumar M, Welsh V, Bajpai R, Helliwell T, Mallen C, Robinson M, Shepherd T. Musculoskeletal disorders and pain in agricultural workers in Low- and Middle-Income Countries: A systematic review and meta-analysis. Rheumatology International. (2023) . |
[34] | Bardach A, Perdomo HA, Gándara RA, Ciapponi A. Income and smoking prevalence in Latin America: A systematic review and meta-analysis. Rev Panam Salud Publica. (2016) ; 40: (4): 263-271. |
[35] | Collaborators GBDRF. The global burden of adolescent and young adult cancer in 2019: A systematic analysis for the Global Burden of Disease Study 2019. Lancet Oncol. (2022) ; 23: (1): 27-52. |
[36] | Ruilope LM, Nunes FACB, Nadruz W, Jr., Rodríguez RFF, Verdejo-Paris J. Obesity and hypertension in Latin America: Current perspectives. Hipertens Riesgo Vasc. (2018) ; 35: (2): 70-76. |


