
Are the Roland Morris Disability Questionnaire and Oswestry Disability Index interchangeable in patients after lumbar spinal fusion?
Abstract
BACKGROUND:
Low back pain is a common health problem for which there are several treatment options. For optimizing clinical decision making, evaluation of treatments and research purposes it is important that health care professionals are able to evaluate the functional status of patients. Patient reported outcome measures (PROMs) are widely accepted and recommended. The Roland Morris Disability Questionnaire (RMDQ) and the Oswestry Disability Index (ODI) are the two mainly used condition-specific patient reported outcomes. Concerns regarding the content and structural validity and also the different scoring systems of these outcome measures makes comparison of treatment results difficult.
OBJECTIVE:
Aim of this study was to determine if the RMDQ and ODI could be used exchangeable by assessing the correlation and comparing different measurement properties between the questionnaires.
METHODS:
Clinical data from patients who participated in a multicenter RCT with 2 year follow-up after lumbar spinal fusion were used. Outcome measures were the RMDQ, ODI, Short Form 36 – Health Survey (SF-36), leg pain and back pain measured on a 0–100 mm visual analogue scale (VAS). Cronbach’s alpha coefficients, Spearman correlation coefficients, multiple regression analysis and Bland-Altman plots were calculated.
RESULTS:
three hundred and seventy-six completed questionnaires filled out by 87 patients were used. The ODI and RMDQ had both a good level of internal consistency. There was a very strong correlation between the RMDQ and the ODI (
CONCLUSIONS:
The RMDQ and ODI cannot be used interchangeably, nor is there a possibility of converting the score from one questionnaire to the other. However, leg pain and back pain seemed to be predictors for both the ODI and the RMDQ.
1.Introduction
Low back pain is a common health problem. Lifetime prevalence is estimated between 60% and 90% and it is a leading global cause of years lived with disability (YLDs) [1]. Low back pain is a major contributor to global health costs due to activity limitation and secondary costs due to work absenteeism and work cessation [2]. There are several treatment options for low back pain depending on the underlying cause including both surgical and non-surgical options. For optimizing clinical decision making, evaluation of treatments and research purposes it is important that health care professionals are able to evaluate the functional status of patients. In addition to objective information obtained from clinical tests, subjective patient reported outcome measures (PROMs) are widely accepted and even recommended as important outcome tools [3].
To evaluate the functional status in patients with back pain, the Roland Morris Disability Questionnaire (RMDQ) and the Oswestry Disability Index (ODI) are the two mainly used condition-specific patients reported outcome measures [4]. Both instruments are focused on pain and aspects of daily living and are therefore assumed to measure the same constructs [5]. A recent systematic review showed that there are no strong reasons to prefer the RMDQ or the ODI in patients with nonspecific low back pain regarding measurement properties [6].
As a result both outcome measures are used arbitrary depending on the preferences of the clinician or researcher. For example, the North American Spine Society (NASS) have recommended the use of the ODI to assess the functional outcome following spinal fusion [7]. However a recently published study showed the RMDQ is still widely used in practice [8]. This lack of consensus and the different scoring systems of these outcome measures makes comparison of treatment results more difficult. The difference in scaling of the outcome measurements also results in differences in Standard error of measurement (SEM) and the Minimal detectable change (MDC). Furthermore, recently concerns were raised regarding the content and structural validity of the RMDQ and the ODI; suggesting further research to fill existing gaps on content and structural validity [9].
The main research question of this study was if the RMDQ and ODI measure the same construct and can thus both be used in evaluation of treatments and research purposes. As a subsidiary question it was studied if patient characteristics (age, gender, Body Mass Index (BMI), smoking, VAS leg pain and VAS back pain) were predictive for the ODI and RMDQ scores.
2.Materials and methods
2.1Patient sample and data gathering
Clinical data were gathered from patients who participated in a double blinded randomized controlled trial [10]. A summary of the study protocol is available on the clinicaltrails.gov website (Identifier NCT01557829). In short, patients (18 to 75 years old) presenting with a history of chronic low back pain with or without leg pain that did not respond to conservative treatment, and who had lumbar degenerative disc disorders (Pfirrmann Grade III or higher) and/or spondylolisthesis of Grade I or II, confirmed by MRI, received a transforaminal lumbar interbody fusion with an interbody cage. Main exclusion criteria were osteoporosis, prior failed fusion at the same level, degenerative scoliosis, more than two symptomatic levels that needed fusion and active cancer or infection. We refer to the published protocol for the detailed inclusion and exclusion criteria [10]. Clinical assessments were performed preoperative and 3, 6, 12 and 24 months postoperatively. Outcome measures were the RMDQ, ODI, Short Form 36 – Health Survey (SF-36) leg pain and back pain measured on a 0–100 mm visual analogue scale (VAS). A medical ethics committee approved the trial. Informed consent was obtained from all participating patients.
2.2Outcome measures
2.2.1Roland Morris Disability Questionnaire (RMDQ)
The RMDQ is a condition-specific (back pain) self-reported instrument [11]. The validated Dutch version of the RMDQ (version 1) was used [12]. The questionnaire is composed of 24 statements covering a range of aspects of daily living. The maximum score is 24 points (one point per statement) and represents maximum disability. Clinical improvement is shown if the RMDQ score is reduces by 30% from baseline [13].
2.2.2Oswestry Disability Index (ODI)
The ODI provides a self-assessed functional disability score for patients with low back pain [14]. For this study the Dutch ODI version 2.1a was used [5]. The questionnaire is divided into ten sections: one to assess pain and nine to assess limitations of various activities in daily living. Each section is scored on a 0–5 scale, 5 representing the greatest disability. The scores of each section are added up, multiplied by 2 and expressed as a percentage. The maximum score is 100% and expresses maximum disability. For interpretation the ODI is subdivided into five categories: 1) 0–20 %, representing minimal disability meaning; 2) 21–40 %, representing moderate disability; 3) 41%–60%, representing severe disability; 4) 61%–80% representing crippled patients; 5) 81%–100%, representing bedbound patients or patients overestimating their symptoms [14].
2.2.3Short Form 36 – Health Survey (SF-36)
The SF-36 is a widely used generic health status measure [15]. In this study the validated Dutch version of the SF-36 was used [16]. The survey consists of 36 questions with standardized answers divided into eight health concepts. In this study, only the dimensions Physical functioning and Bodily pain were used. The score of each concept is the weighted sum of the answers within that particular concept. Each answer carries equal weight. The weighted sum is then transformed into a 0–100 scale where 0 represents maximum disability and 100 represents no disability.
2.3Statistical analysis
Patient characteristics and questionnaire scores are presented as mean with the standard deviation or as frequencies with percentages. At least 50 patients are needed for reliable comparing measurement properties [17]. No distinction was made between the preoperative or different postoperative measurements as determining improvement was not the goal of this study.
Cronbach’s alpha coefficients (
Spearman correlation coefficients were calculated to measure the strength and direction of association of the total scores of the ODI, RMDQ and pain questions, as well as for the comparison of single similar items of the questionnaires. The levels of correlation were defined as very weak (0.0–0.19), weak (0.2–0.39), moderate (0.4–0.59), strong (0.6–0.79) and very strong (0.8–1.0) [20]. Multiple linear regression analysis (enter method) was used to assess the predictive value of patient characteristics on the ODI and RMDQ scores. Predictive variables that were taken into account were age, gender, BMI, smoking, VAS leg pain and VAS back pain.
Bland-Altman plots (mean difference
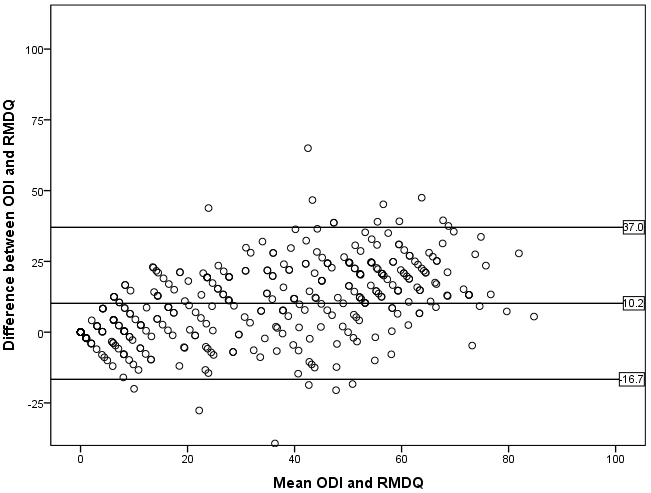
Figure 1.
Bland-Altman plot with the mean and the difference between the ODI and RMDQ on respectively the x-axis and y-axis. The RMDQ was converted to a 0–100 scale. The mean difference and the 95% confidence intervals are indicated with reference lines (
3.Results
In total, 376 completed questionnaires filled out by 87 patients were used: 72 measurements at baseline, 75 at 3 months, 79 at 6 months, 78 at 12 months and 72 at 24 months. The mean number of measurement per patient was 4 (range 1–5). Patients that did not complete both questionnaires at a time point were excluded from that specific time point. Patient characteristics and outcome measurements are presented in Table 1.
Table 1
Patient characteristics (
| Gender | |
| Male | 118 (31.4%) |
| Female | 258 (68.6%) |
| Smoking | |
| Yes | 249 (66.2%) |
| No | 114 (30.3%) |
| Unknown | 13 (3.5%) |
| Mean (standard deviation) | |
| Age (years) | 55.1 (10.8) |
| Body Mass Index (kg/m | 27.0 (4.6) |
| Number of measurements per patient | 4 (1) |
| ODI (0–100) | 28.2 (20.2) |
| RMDQ (0–24) | 9.2 (6.5) |
| Leg pain (VAS 0–100) | 31.3 (28.6) |
| Back pain (VAS 0–100) | 39.0 (24.8) |
| SF-36 physical functioning (0–100) | 60.8 (24.1) |
| SF-36 bodily pain (0–100) | 53.6 (24.9) |
In order to analyze whether the questions in the questionnaires were internally consistent, the Cronbach’s alpha was used. The ODI and RMDQ had both a good level of internal consistency with respectively
3.1Spearman correlations
There was a very strong correlation between the RMDQ and the ODI (
Table 2
Spearman’s rho correlation coefficients for comparing the different questionnaires (
| RMDQ | ODI | |
| RMDQ | 1.00 | 0.87 |
| ODI | 0.87 | 1.00 |
| VAS leg pain | 0.61 | 0.64 |
| VAS back pain | 0.75 | 0.68 |
| SF-36 physical functioning | ||
| SF-36 bodily pain |
Table 3
Spearman’s rho correlation coefficients for comparing separate questions of the RMDQ and ODI questionnaires
| ODI – question | RMDQ – question | Spearman’s rho ( | |
|---|---|---|---|
| Personal care | 2 | 9 | 0.67 ( |
| (washing, | 2 | 16 | 0.55 ( |
| dressing) | 2 | 19 | 0.23 ( |
| Walking | 4 | 3 | 0.46 ( |
| 4 | 17 | 0.55 ( | |
| Standing | 6 | 10 | 0.33 ( |
| Sleeping | 7 | 18 | 0.73 ( |
| Social life | 9 | 1 | 0.57 ( |
Correlations between similar questions of the RMDQ and ODI were also calculated and are described in Table 3. They showed a wide range and varied between weak and strong.
3.2Bland-Altman plot
The Bland-Altman plot (Fig. 1) indicated bad agreement between the ODI and RMDQ as the distance between the upper and lower 95% confidence interval margins were large enough to be clinically important and the variability around the mean was not constant. Furthermore, the two-sided one-sample
Table 4
Multiple linear regression coefficients (
| RMDQ | ODI | |||
|---|---|---|---|---|
| Unstandardized Beta | Unstandardized Beta | |||
| Constant | 0.238 | 3.264 | 0.623 | |
| VAS leg pain (0–100) | 0.069 | 0.278 | ||
| VAS back pain (0–100) | 0.158 | 0.405 | ||
| Age | 0.016 | 0.451 | 0.085 | 0.226 |
| Gender (1 | 0.335 | 0.482 | 1.102 | 0.491 |
| Smoking (0 | 0.796 | 0.826 | ||
| BMI | 0.074 | 0.113 | 0.152 | |
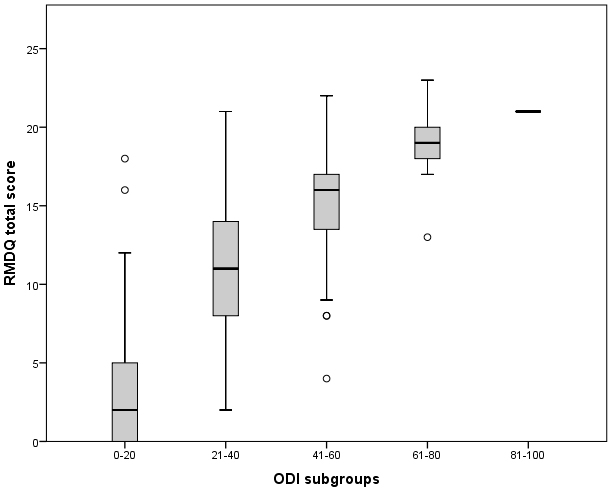
Figure 2.
RMDQ score relative to their ODI score divided in subgroups. The mid-point line (median), lower and upper quartile are presented per subgroup. The upper and lower whiskers represent scores outside the middle 50% of the scores. Outliers are indicated with a circle.
3.3Regression analysis
A multiple linear regression was calculated to predict the RMDQ score based on age, gender, BMI, smoking, VAS leg pain and VAS back pain. The results indicated that the predictors explained 64.2% of the variance (
In Fig. 2 the RMDQ score of the patients is presented relative to their ODI score divided in subgroups. Only one patient fell in the worst category 81–100 of the ODI with a RMDQ score of 21. There is a clear trend visible wherein the mean RMDQ scores are ascending with the ascending ODI subgroups. However, the variability of the RMDQ scores within the subgroups were too large to define a reliable conversion equation. Therefore, it is not possible to transform the score from one questionnaire to the other.
4.Discussion
The RMDQ and the ODI are two frequently used condition-specific patients reported outcome measures. Both are used interchangeably depending on the preferences of the clinician or researcher which makes comparison of treatment results difficult. This study tried to determine if the RMDQ and ODI could be used exchangeable. Secondly, the influence of several patient characteristics (age, gender, BMI, smoking, leg pain and back pain) on the ODI and RMDQ scores was studied
Both the RMDQ and ODI showed good internal consistency. The individual questions of the questionnaires seem to measure one construct as previously determined and are therefore of good consistency. If the cronbach’s alpha is too high (above 0.95) it could be argued that some questions are comparable to the extent that some would be redundant [17]. As the scores are respectively
Regarding floor and ceiling effect no ceiling effects were found in both the ODI and RMDQ however, floor effects were found in both. As lower values represent less disability, many of the subjects showed minimal functional disability which indicates a limitation in distinctive character of the questionnaires.
A strong correlation of 0.87 between the RMDQ and the ODI was found similar to previous reports. A meta-analysis showed a pooled correlation of
The Bland-Altman plots indicated bad agreement between the ODI and RMDQ. In addition, the mean difference between the questionnaires was significantly different from zero. This information contributes to the fact that the questionnaires are not interchangeable. A limitation is that the RMDQ is measured on a different scale (0–24) and needed to be converted to a 0–100 scale which might influence the results of the plots.
From all variables (age, gender, BMI, smoking, VAS leg pain and VAS back pain) only VAS leg pain and VAS back pain seemed to be predictors for both the ODI and the RMDQ. To our knowledge this is the first study reporting about predictors for the ODI and RMDQ.
Lastly the variability of the RMDQ scores within the subgroups were too large to define a reliable conversion equation. Therefore the RMDQ and ODI cannot be used interchangeably, nor is there a possibility of converting the score from one questionnaire to the other. This cannot be explained by the sample size as the sample size is large enough. A possible reason could be that the ODI and the RMDQ are not measuring the same construct and are therefore not exchangeable [3]. Further research should attempt to clarify the use of either the ODI or the RMDQ in specific patient categories. For example, VAS pain scores from mild, moderate to severe could be used to specify patient categories.
4.1Clinical relevance
A previous systematic review [6] compared the measurement properties of the RMDQ with the ODI and stated that there are no strong reasons to prefer the RMDQ or the ODI in patients with nonspecific low back pain. The focus of the current study was not to assess whether one of the two instruments has better measurements properties, but to assess if they can be used exchangeable [6]. Because results showed that the ODI and RMDQ are not interchangeable, consensus on their use in clinical practice is essential to analyze treatment outcomes and provide sufficient patient counseling. To determine treatment outcomes and clinical progression, the SEM and MDC are properties that should be used. The development of national registries with standard validated PROMs could help to gain sufficient data. For example, both the NASS and the Dutch Spine Society (DSS) have already incorporated the ODI into their registries.
4.2Limitations
Limitations of this study include that data was collected from a study with a different goal. Secondly more female participants than male participants and more smoking participants than non-smoking participants completed the questionnaires which could influence the generalizability However, this might be characteristic for this specific patient category. Thirdly, we included multiple measurements per patient at multiple time points (see above). This presents two issues. First including the same patient multiple times might introduce bias; secondly by default these measurements are not independent. However, as determining improvement was not the goal of this study and RMDQ, ODI and SF-36 measurements were paired at the different measurement times it was a priori hypothesized that this would not influenced the results. Lastly the authors recognize that in order to compare two measurement properties, the properties must be calibrated on the same scale preferably. Two ways of doing so is either by the development and evaluation of a crosswalk, or by using item response models. For both of these methods sufficient numbers are needed which the authors unfavorably did not have. This could be a consideration for future research.
5.Conclusion
The RMDQ and ODI are not interchangeable, nor is there a possibility of converting the score from one questionnaire to the other. However, VAS leg pain and VAS back pain seemed to be predictors for both the ODI and the RMDQ. Further research is needed in order to determine in which type of patient which questionnaire should be used.
Conflict of interest
None to report.
References
[1] | Global Burden of Disease Study 2013 Collaborators. Global, regional, and national incidence, prevalence, and years lived with disability for 301 acute and chronic diseases and injuries in 188 countries, 1990–2013: a systematic analysis for the Global Burden of Disease Study 2013. Lancet. (2015) Aug 22; 386: (9995): 743–800. |
[2] | van Tulder MW, Koes BW, Bouter LM. A cost-of-illness study of back pain in The Netherlands. Pain. (1995) Aug; 62: (2): 233–240. |
[3] | Chiarotto A, Terwee CB, Ostelo RW. Choosing the right outcome measurement instruments for patients with low back pain. Best Pract Res Clin Rheumatol. (2016) Dec; 30: (6): 1003–1020. |
[4] | Froud R, Patel S, Rajendran D, Bright P, Bjorkli T, Buchbinder R, et al. A systematic review of outcome measures use, analytical approaches, reporting methods, and publication volume by year in low back pain trials published between 1980 and 2012: respice, adspice, et prospice. PLoS One. (2016) Oct 24; 11: (10): e0164573. |
[5] | van Hooff ML, Spruit M, Fairbank JC, van Limbeek J, Jacobs WC. The oswestry disability index (version 2.1a): validation of a dutch language version. Spine (Phila Pa 1976). (2015) Jan 15; 40: (2): E83–90. |
[6] | Chiarotto A, Maxwell LJ, Terwee CB, Wells GA, Tugwell P, Ostelo RW. Roland-morris disability questionnaire and oswestry disability index: which has better measurement properties for measuring physical functioning in nonspecific low back pain? Systematic review and meta-analysis. Phys Ther. (2016) Oct; 96: (10): 1620–1637. |
[7] | Ghogawala Z, Resnick DK, Watters WC, 3rd, Mummaneni PV, Dailey AT, Choudhri TF, et al. Guideline update for the performance of fusion procedures for degenerative disease of the lumbar spine. Part 2: assessment of functional outcome following lumbar fusion. J Neurosurg Spine. (2014) Jul; 21: (1): 7–13. |
[8] | Kersten RFMR, van Gaalen SM, Willems P, Arts MP, Peul WC, Öner FC. Lumbar spinal fusion: indications, surgical techniques and post-operative management. A survey among spine surgeons in The Netherlands. MedCrave Online Journal of Orthopaedics & Rheumatology. (2016) ; 4: (5): 00155. |
[9] | Chiarotto A, Ostelo RW, Boers M, Terwee CB. A systematic review highlights the need to investigate the content validity of patient-reported outcome measures for physical functioning in patients with low back pain. J Clin Epidemiol. (2018) Mar; 95: : 73–93. |
[10] | Kersten RF, van Gaalen SM, Arts MP, Roes KC, de Gast A, Corbin TP, et al. The SNAP trial: a double blind multi-center randomized controlled trial of a silicon nitride versus a PEEK cage in transforaminal lumbar interbody fusion in patients with symptomatic degenerative lumbar disc disorders: study protocol. BMC Musculoskelet Disord. (2014) Feb 25; 15: : 57-2474-15-57. |
[11] | Roland M, Morris R. A study of the natural history of back pain. Part I: development of a reliable and sensitive measure of disability in low-back pain. Spine (Phila Pa 1976). (1983) Mar; 8: (2): 141–144. |
[12] | Gommans I, Koes BW. Validity and responsiveness of the Dutch adaptation of the Roland disability questionnaire. Low Back Pain. Edited by Tulder MW, Koes BW, Bouter LM. EMGO. (1996) : 57–70. |
[13] | Jordan K, Dunn KM, Lewis M, Croft P. A minimal clinically important difference was derived for the Roland-Morris Disability Questionnaire for low back pain. J Clin Epidemiol. (2006) Jan; 59: (1): 45–52. |
[14] | Fairbank JC, Couper J, Davies JB, O’Brien JP. The Oswestry low back pain disability questionnaire. Physiotherapy. (1980) Aug; 66: (8): 271–273. |
[15] | Ware JE, Jr, Sherbourne CD. The MOS 36-item short-form health survey (SF-36). I. Conceptual framework and item selection. Med Care. (1992) Jun; 30: (6): 473–483. |
[16] | Aaronson NK, Muller M, Cohen PD, Essink-Bot ML, Fekkes M, Sanderman R, et al. Translation, validation, and norming of the Dutch language version of the SF-36 Health Survey in community and chronic disease populations. J Clin Epidemiol. (1998) Nov; 51: (11): 1055–1068. |
[17] | Terwee CB, Bot SD, de Boer MR, van der Windt DA, Knol DL, Dekker J, et al. Quality criteria were proposed for measurement properties of health status questionnaires. J Clin Epidemiol. (2007) Jan; 60: (1): 34–42. |
[18] | Tavakol M, Dennick R. Making sense of Cronbach’s alpha. Int J Med Educ. (2011) Jun 27; 2: : 53–55. |
[19] | McHorney CA, Tarlov AR. Individual-patient monitoring in clinical practice: are available health status surveys adequate? Qual Life Res. (1995) Aug; 4: (4): 293–307. |
[20] | Mukaka MM. Statistics corner: a guide to appropriate use of correlation coefficient in medical research. Malawi Med J. (2012) Sep; 24: (3): 69–71. |
[21] | Bland JM, Altman DG. Statistical methods for assessing agreement between two methods of clinical measurement. Lancet. (1986) Feb 8; 1: (8476): 307–310. |
[22] | Bland JM, Altman DG. Measuring agreement in method comparison studies. Stat Methods Med Res. (1999) Jun; 8: (2): 135–160. |


