
Deployment framework for the Internet of water meters using computer vision on ARM platform
Abstract
This article presents the conception of a new method developed mainly in Python to automate the reading process of water meters with an analog display using computer vision and machine learning. A camera captures the consumption value in the water meter, and the yielded image undergoes image processing until the digits are detected and isolated. Then the digits are passed into an SVM machine-learning model that carries out a high accuracy OCR. The software is executed over an ARM platform running Linux. The data resultant from the automated metering, such as the device identification number, event date and time in UTC, consumption value, volume and time variations, flow, and display image, are locally stored and transmitted to a cloud server through VPN in a Wi-Fi and cellular network connection, or by SMS, enabling a remote supervision. Thereby, the automatic metering method features a new way to perform predictive analysis and management of water and meters proactively and can be replicated for digital-display water meters, as well as extended to handle automatic metering on electricity and gas meters as well.
1.Introduction
With the development of Smart City [15,33], Industry 4.0 [3], and the improvement of the standard of living, there has been a rapid augmentation in the number of residential customers of gas, water or electricity services. As a result, suppliers’ metering fees are increasingly prominent. The drawbacks of the billing and payment management of manual metering become an obstacle for metering companies to improve efficiency, management, and service levels. Below are the problems in the conventional, manual metering:
– Access to the house is difficult because of security and privacy.
– The data collection is not timely, and cannot reflect the real-time system status, nor provide accurate and reliable data for the relevant application system, or effectively monitor user behavior.
– High bills can create disputes with customers, leading to delays in the operation and management of payment processing.
The objective of the present article is to solve the above issues by providing a convenient and innovative method of metering automation that yields accurate data collected from the automatic metering of meter instruments by using computer vision and the Internet of Things (IoT).
With the advent, popularization, and falling costs of ARM (Advanced RISC Machine) computer-based machines with the size of a credit card (85 × 56 × 17 mm) and sufficient processing power to run computer vision applications, the use of boards such as Raspberry Pi, Lemon Pi, Banana Pi, and Orange Pi becomes cost-effective. With less than 35 dollars, it is possible to have an HD camera, Wi-fi, Ethernet, USB, cellular network, GPIO pins, among other features. This set of device features allows the process of automatic reading of flow-instruments by supporting and handling the execution of image processing and machine learning deployment, as well as data transmission through the Internet or SMS.
This work presents a new method developed in Python that uses OpenCV (Open Source Computer Vision Library) to automate the reading process of instruments such as water, gas, and electricity meters with analog or digital display. Briefly, the pipelined algorithm of the method captures the metering value and processes its image to identify the digits shown on the meter display. It uses machine learning to predict the consumption value, and that data digitalized from the metering is published to enable asset management and predictive analysis. Thus, the method adheres to the Internet of Things [2] applied to the automatic reading of meters.
This article is organized as follows: Section II presents related work; Section III introduces an architecture proposal for analog metering digitalization through computer vision; Section IV goes over the computer-vision method that predicts digits of consumption values taken from a water meter display; Section V explains the software implementation; Section VI focus on the experimental setup, performance evaluation, and results; and Section VII concludes this study and points out future works.
2.Related work
Automatic meter reading (AMR) [15,47] is the technology of automatically collecting consumption, diagnostic, and status data from water meter or electricity metering devices and transferring that data to a central database for billing, troubleshooting, and analyzing. AMR has numerous benefits over manual reading, and some of the most important benefits include: (1) accurate meter reading; (2) energy management through data graphs; (3) low cost; (4) reliable data transmission; (5) improved billing; (6) security for premises; (7) less financial burden correcting mistakes; (8) less time to obtain meter readings. This technology mainly saves utility providers the expense of periodic trips to each physical location to read a meter. Another advantage is that billing can be based on near real-time consumption rather than on estimates based on past or predicted consumption.
Sun et al. [38] make some systematical reviews of the development and deployment of smart energy meters, including smart electricity meters, smart heat meters, and smart gas meters. By examining various functions and applications of smart energy meters, as well as associated benefits and costs, their investigation provides insights and guidelines regarding the future development of smart meters. Before smart meters, conventional electromechanical meters were the primary type of devices for measuring electricity flow. These old meters usually display the consumption value on an analog counter, which requires personnel reading to assess usage. Smart meters are electronic devices that measure consumption and operate in two-way communication regarding the usage information and billing, besides providing network status of the grid.
As claimed by Sun et al. [39], the significant increase in energy consumption and the rapid development of renewable energy, such as solar power and wind power, have brought considerable challenges to energy security and the environment, which, in the meantime, stimulate the development of energy networks toward a more intelligent direction. Smart meters are the most fundamental components in intelligent energy networks (IENs). In addition to measuring energy flows, smart energy meters can exchange information on energy consumption and the status of energy networks between utility companies and consumers. Furthermore, smart energy meters also allow monitoring and control of home appliances and other devices according to each costumer’s individual needs.
According to Barbierato et al. [7], a new generation smart meters are a crucial enabler of advanced metering infrastructure (AMI) and foster new energy-related services such as demand response (DR). Aguirre et al. [1] and LeMay et al. [22] presented two smart-meter systems that allow bidirectional communication with a centralized DR management platform. Aguirre et al. [1] presented a new generation smart-meter designed to support new requirements for operation and control of the distribution network grid. LeMay et al. [22] described a meter gateway architecture for integrated control of loads by energy aggregators. Not only smart meters are essential in such a context. For instance, Mashima and Chen [24] presented a DR system framework leveraging on a DR client mobile app able to directly control IoT devices according to user policies. In this scenario, AMI [42] and IoT devices (i.e., smart meters [40] and smart appliances), are key technologies to foster novel services in the smart grid [30], such as the DR in residential contexts. In these regards, smart devices are part of AMI and allow a fine-grained collection of energy measurements. In particular, the new smart meters [40] can sample data spanning in the range of 1 second to 15 minutes [6], depending on the services to provide. Disaggregating and post-processing these measurements allow retrieving information about consumer behavior in households, such as appliance activation and energy usage [25]. These post-processed data can feed other novel energy services, such as DR in households [29].
In the commercial solution [34], there are two alternatives to achieve water-usage reading remotely, which is also true for gas meter and electricity meter. The first alternative consists of a walk-by method, which is encouraged when the amount of homes to cover is reasonably significant. In this method, a resource company personnel is responsible for going through the streets with a data acquisition device composed of a data logger and an antenna, which allows access to each homeowner resource consumption. After collecting all the usage data intended for the day, the collector device syncs with a computer via Bluetooth, which then pushes the just-acquired data onto the company’s database.
The second alternative is composed of one concentrator strategically put in an area where it is capable of collecting data from points in a radius of 0.5 Km. This concentrator receives data periodically from the flow meter in range via GPRS communication, which guarantees an automate and effortless usage reading. At the moment of the signal reception, incoming data is stored in an XML file, which is afterward sent out to the company’s cloud. This second alternative is meant for a smaller amount of residences, as opposed to the walk-by one; however, adding more concentrators makes it possible to attend a more substantial amount of clients.
The solution carried by Ciasey [34] provides a better water consumption management for their customers. Abnormalities and malfunctions in their water meters can be detected using initially-known setup parameters, which are characteristic for their system and their software application. When the reading is not plausible, an alarm goes off, which helps to discover emergent issues instantly, as well as frauds and functioning state.
Concerning other patented solutions, such as the one found on Brazilian National Institute of Industrial Property (INPI), namely PI0901651-1 [13], denominated “Automatized water meter”, they come up with the conception of a water meter with a pulse sensor, battery, GPRS module, and integrated circuitry. To put the work described in this patent into practice, it requires replacing the home’s current water meter with a new one built with the mentioned components. This water meter swapping would undoubtedly turn the solution more costly, both in equipment dimensions and implantation cost. Moreover, the patent cannot be reusable in other sorts of applications, such as in the reading of electricity usage.
Metretek Inc. [27,28] presents apparatus and method for remote sensor monitoring, metering and control (U.S. Patent 4,241,237 and U.S. Patent 4,455,453). Their invention relates to remote monitoring systems and, in particular, to an automatic meter reading and load management system. Examples of metering systems utilizing a power line as the communications link are described in U.S. Pat. Nos. 4,012,734 [19], 3,973,240 [16]), 3,914,757 [14], and 3,445,814 [36]. Similarly, examples of unit metering systems wherein the communication link is provided through an existing telephone system are described in U.S. Pat. Nos. 3,829,835 [37], 3,820,073 [44], 3,492,649 [31], and 4,008,458 [46].
Wi-Fi (Wireless Fidelity) [45] is a versatile platform that can be used by a variety of electrical home appliances to provide wireless TCP/IP communication using the 802.11 protocols. Devices such as the smart thermostat permit a utility to lower a home’s power consumption to help manage power demand. The wireless communication may significantly contribute to their overall battery consumption, and minimizing the energy consumption of wireless interfaces and networking protocols is one of the prerequisites for the IoT.
In the same context, the city of Corpus Christi in Texas [15] became one of the first cities in the United States to implement citywide Wi-Fi, which had been free until May 31, 2007, mainly to facilitate AMR after a dog attacked a meter reader. Today, many meters have Wi-Fi embedded in their transmission design, and a drive-by hand-held receiver reads them through the 802.11 protocol.
The China patent CN107767645A from 2017, denominated “Novel water, electricity, and gas automatic meter reading device” [33], presents a novel water, electricity, and gas automatic meter reading device. This device comprises a meter reader and data collectors linked to it, wherein a low-voltage power circuitry connects data collectors and a data concentrator.
The patent CN108830271A from 2018, denominated “Digital display instrument reading identification method based on convolutional neural network” [23], introduces a method based on a convolutional neural network to read the resource usage in an instrument’s digital display. The method consists of obtaining consumption data, processing that data, constructing a deep-network model, and reading the consumption value in the instrument. The system reaches a high-accuracy on its reading identification, which is realized by a learning and training process grounded in a significant amount of data acquired from the instrument. Another remarkable characteristic of the system is that it also has a high real-time performance.
In the INPI patent PI1101278-1 from 2011, denominated “Digital water meter with wireless network transmission” [12], an electronic system for metering and data transmission replaces the manual process of reading water consumption. The metering is done automatically using electronic components in the digital water meter and transmitted to interjacent devices using ad-hoc wireless networks. Then, other mediate devices relay the signal to a central station via cellular network.
The patent CN208271375U from 2018, denominated “A kind of intelligent meter data recording system and intelligent meter reading robot” [48], presents a utility model for recording data with an intelligent meter by using computer vision.
Another approach currently being used is a solution based on a mobile software application for iOS and Android. In this solution, Anyline’s SDK (https://anyline.com) and Pixometer’s SDK (https://pixometer.io) are utilized to develop optical character recognition (OCR) for flow-meter applications. In Germany, Anyline’s computer-vision SKD is already used by a company named Waterloo, whose goal is to help with water-metering automation and management in several cities of the country. To do that, Waterloo makes its application – Waterloo 365 (https://waterloo.io/en/waterloo-365-my-water-meter-more/) – available for water providers. The application brings a variety of solutions to integrate their customers into better management of water consumption.
Zhao et al. [49] introduce a novel method by designing the architecture of a remote metering system that can read a power meter through computer vision. Differently from the typical automatic metering system that must obtain the resource-consumption value from a digital communication interface, the new method recognizes the meter reading by utilizing computer-vision techniques, which configures a no-touch manner of measuring. In their work, the local metering information of distributed substations is transmitted to a central station through computer network. In an experiment conducted, the results from the computer vision are accurate enough to monitor the running parameters of the remote substation.
Gallo et al. [17] propose an automated solution of gas metering with computer vision for a situation wherein some company personnel has to go to residences or industries and read customers’ gas usage. In addition to the human meter reading, the personnel takes a picture of the flow-instrument display at the scene, which becomes a checking element to try to mitigate human reading mistakes later on. Nonetheless, according to the research, that checking process could take far too long, depending on the number of customers, turning it into a tiresome and costly task.
In their work, Gallo et al. [17] implement an automatic reading algorithm grounded in a big database of different and diverse images taken of gas meters. In this database, there are shots of a large number of gas meters from various angles, with a full diversity of colors, blur, and brightness. From the image capturing until the digital displaying of the usage value, there are fundamentally three steps: the localization of the meter, the detection of the digits on its display, and the computer reading of that arranged set of digits.
Kompf [20] presents an OCR software development for electricity meter, in which the computer code was written in C++, utilizing OpenCV. The flowchart of the algorithm employed by the software is found in Fig. 1.
![Flowchart of a computer-vision metering method for electricity meter [20].](https://content.iospress.com:443/media/ais/2020/12-1/ais-12-1-ais200544/ais-12-ais200544-g001.jpg)
Kompf [20] inspired the development of the method proposed in this work. The difference is that Kompf’s work is implemented for energy meters, whereas this investigation is applied to and validated in water meters. Ultimately, the focus is on deploying the Internet of water meters. However, the solution in this work can be extended to meters of gas and energy as well, relying on the generic framework proposal elaborated.
Lecun et al. [21] reveal a literature review upon machine learning applied to image processing and computer vision. In their investigation, the development of a machine learning solution for digit classification of analog metering systems, with either digital or analog displays, takes place with supervised learning algorithms. To solve the problem, they focus on three different algorithms: k-nearest neighbor (kNN), support vector machine (SVM), and neural network.
Puttnies et al. [32] try to resolve the contemporary matter of integrating conventional devices into the Internet of Things context. More specifically, Puttnies et al. [32] work upon the challenge that is to turn an analog electricity meter into a digital, intelligent one that has the capability of connecting to the internet and using network services to provide a remote reading. The proposed way to tackle this problem is by utilizing computer vision to identify and extract the usage indication from electricity, gas, and water meters.
According to Tafti et al. [41], a set of different OCR platforms are now available. Aside from lending theoretical contributions to other practical fields, such platforms have demonstrated successful applications in real-world problems. Tafti et al. [41] present several qualitative and quantitative experimental evaluations that have been performed using four well-know OCR services, including Google Docs OCR, Tesseract, ABBYY FineReader, and Transym. Their paper analyzes the accuracy and reliability of the OCR packages employing a data set that includes 1227 images from 15 different categories. Furthermore, their investigation reviews the state-of-the-art OCR applications in healthcare informatics. Their work is expected to advance OCR research, providing new insights and consideration to the research area, and assist researchers to determine which service is ideal for optical character recognition.
Cui et al. [11] present an overview of the industrial applications of machine learning in the domain of IoT, in particular, the use of machine learning to improve the efficiency of smart meter operation.
Bae et al. [5] investigate a camera-based character recognition system, which is implemented for mobile devices such as personal digital assistant (PDA) and cellular phones with color cameras. First, a camera-based character recognition system is developed for a personal computer (PC), including techniques such as image enhancement, local adaptive binarization, and blob coloring to effectively extract character region and remove the noise of camera-captured images. Then, Bae et al. [5] converts the PC-based OCR system into an embedded OCR system for cellular phones. Several functions are specially developed since most of the mobile telecommunication devices typically don’t have functions for numerical computing and have a limitation of memory space.
The method created by Oliveira et al. [26] recognizes the characters of a specific type of an electric meter (M1A-T), utilized in Brazil. The algorithm comprises three major steps, processing input images of a fixed size and format. Firstly, the homomorphic filter is applied to reduce the effects of non-uniform illumination. Secondly, binarization and morphological operations are performed to obtain both the ROI and the separated digits. Thirdly, the segmented digits are classified by the kNN algorithm.
According to Chen et al. [9], to build a significant infrastructure of data collection, a network of vision-based smart meter and its gateway are provided to a community of gas supply system that uses traditional mechanical meters. In the network architecture, the gas-meter reading values are captured by embedded image-sensor nodes and then are transmitted to a gateway, designed to implement image recognition, and are collected in the embedded database of that gateway. Moreover, the web-based monitoring system designed in HTML5 allows a household to check the gas consumption and history, as well as the gas company to develop an effective energy management system and analyze energy-consumption models of the community using the database.
Vanetti et al. [43] have a new approach for the automatic gas-meter reading of real-world images. The gas-meter reading, usually done on-site by an operator who takes a picture of it as proof of reading in case needed later, is prone to errors. In this study, the authors present a method to support the validation process to reduce human effort. Their algorithm is trained to detect and recognize the text of a particular region of interest (ROI). Firstly, they detect the ROI and segment the text contained in it using a method based on an ensemble of neural network models. Then, they perform an optical character recognition using Support Vector Machine.
Cerman et al. [8] come up with a mobile platform-based system able to scan electricity, gas, and water meters. The methodology comprises two stages: digits detection and optical character recognition. A pipeline of operations accomplishes the detection of digits. OCR is achieved by employing two different approaches: Tesseract OCR [35] and Convolutional Neural Network. Convolutional Neural Network significantly outperforms the Tesseract OCR for all types of meters.
The approach introduced by Chouiten and Schaeffer [10] is more general. It works on five models of gas meter, which are employed by the major gas provider in France formerly called GDF SUEZ, currently ENGIE. The experiments are carried out by sixteen smartphone models with the Android platform and four smartphone models with the iOS platform. The computation is performed offline to address areas lacking internet connection and takes three seconds at maximum. The ROI is detected using Haar Cascade and converted afterward to the HSV color system. By normalization of the V channel, the image is divided into two sub-images, including the significant consumption part in a black background and the insignificant decimal part in a red background, respectively. The sub-images are thresholded by the Otsu binarization method, and morphological operations are applied, obtaining blobs that are then passed to an OCR module. The final number is validated based on the history of consumption.
In the work fomented by Auerswald [4], the OCR is responsible for recognizing the digits from digital metering instruments with seven-segment displays. The image in which the pattern of segments resides is input into the system algorithm that, in turn, computes and interprets the segment-pattern traces of the numbers and returns the digital, recognized sequence of digits accordingly. Float and negative values are also detected, as well as combinations of both of them.
Cybersecurity is crucial in the Internet of Things. Humayed et al. [18] suggested that only authorized personnel can remotely access field devices and that the access should be strictly secured by using designated devices through Virtual Private Network (VPN).
Several products in the market propose a solution for the problem related to the metering automation and the transmission of its derived data through data collectors or flow-meter with a pulse sensor.
The proposed method is innovative. There is no news about any registered patent or any product in the market that does the real-time and online metering automation of devices with the analog or digital display through image processing and data transmission via a VPN channel or SMS, using an ARM platform. Like never before, the proposal allows users to keep the actual analog flow-instrument and performs the metering on display in an automated fashion. That is, the retrieval of resource usage requires no invasive action, which means no need to disassemble or replace the current flow-meter. On the contrary, commercial solutions available nowadays are grounded in software applications designed to mobile platforms like Android and iOS to assist with the reading of resource consumption and cloud storage of the related data, which are hardly ever real-time and online.
Therefore, the proposal is a kit for non-invasive metering automation of gas, water, and electricity meters, allowing data transmission via the Internet or SMS, flow instrument monitoring, and consumption value estimation through OCR.
3.A new method for automatic metering supervision
The new method consists of a computer-vision machine on an ARM platform that is responsible for automating the metering process and allowing remote supervision. It uses a CCD/CMOS camera and considers the utilization of a solid-state relay to turn off resource supply on-site.
The computer-vision machine takes a picture of the flow-instrument display. That photo undergoes several image-processing algorithms, which leads to the detection of digits from the display. Subsequently, the recognition of digits from the resource consumption takes place using OCR.
Once the OCR outputs the consumption data, a local database stores the string value of the reading, the device identification, the event date and time, the float-type consumption value, and a picture of the meter counter. Then, the system publishes the local data via VPN using a Wi-Fi connection or cellular network, or SMS.
All of the data from the metering enables automatic management. For instance, aside from improving the billing system, it can bring better resource usage analysis to prevent water leakage by looking at the consumption history every ten minutes. Other benefits are the potential capability to turn off the water supply via the internet or SMS and sending emails and SMS to the final customer to let them know about the utility closure, the closing of a bill, or to warn them about the possibility of a leakage detected by an abnormal consumption history.
The cloud server connects to the computer-vision machines via the Internet using one of the following connection architectures: client/server, publisher/subscriber, or SMS data exchange.
The first connection architecture has remote metering devices like media servers, whereas applications such as browsers, remote terminal, and HTML/Web are the clients. That setup makes it possible to access events in real time, such as the image and progressive video of the display. In this connection architecture, one has complete-remote access to the metering device via Secure Shell (SSH) and can eventually turn off the water flow on any site.
The second connection architecture is based on the Message Queuing Telemetry Transport (MQTT) protocol. The publisher is the remote metering device and the subscriber, a cloud server. The cloud server receives the data (device identification, event’s timestamp, usage reading, and images) periodically, within a predetermined period as needed. This data is stored in the cloud accordingly to each flow meter’s unique tag. All of the flow meters installed on final customers’ sites must have their clock synced with a reference clock, namely the Universal Coordinated Time (UTC). The clock synchronization is dictated by a world time server, as opposed to remote automation units of the electrical segment that rely on a GPS synchronization. Such system synchronization is crucial and avoids inconsistencies when calculating the usage automatically, transitioning from/to daylight saving time, or warning about resource leakage or consumption out of the pattern.
The third connection architecture is given by a full-duplex channel, with the employment of SMS over the cloud server. This architecture is a cheap solution that takes advantage of cellular networks to establish a connection. With a SIM card dedicated to only sending and receiving text messages, which has a low operational cost, the communication can carry with just flow-instrument identification and the captured water usage, for instance. There is no need to have an internet plan, which makes the solution ideal for low-income families. Despite that, the resource service shutdown is still technically applicable.
The proposed method allows the final customer to continue utilizing their previously-installed analog flow meter. That is, the solution is cost-effective because it saves one from the hassle of replacing the current and yet-properly-working instrument for a smart version of it. As a result, the installation process cost is minimized, and the only requirement to put the automation system up and running is an outlet plug to feed the little ARM-platform computer.
Although the method does not call for a physical replacement of the flow-instrument, if there is the need for the implementation of service shutdown remotely, an actuator valve has to be installed to block the resource supply.
Fig. 2.
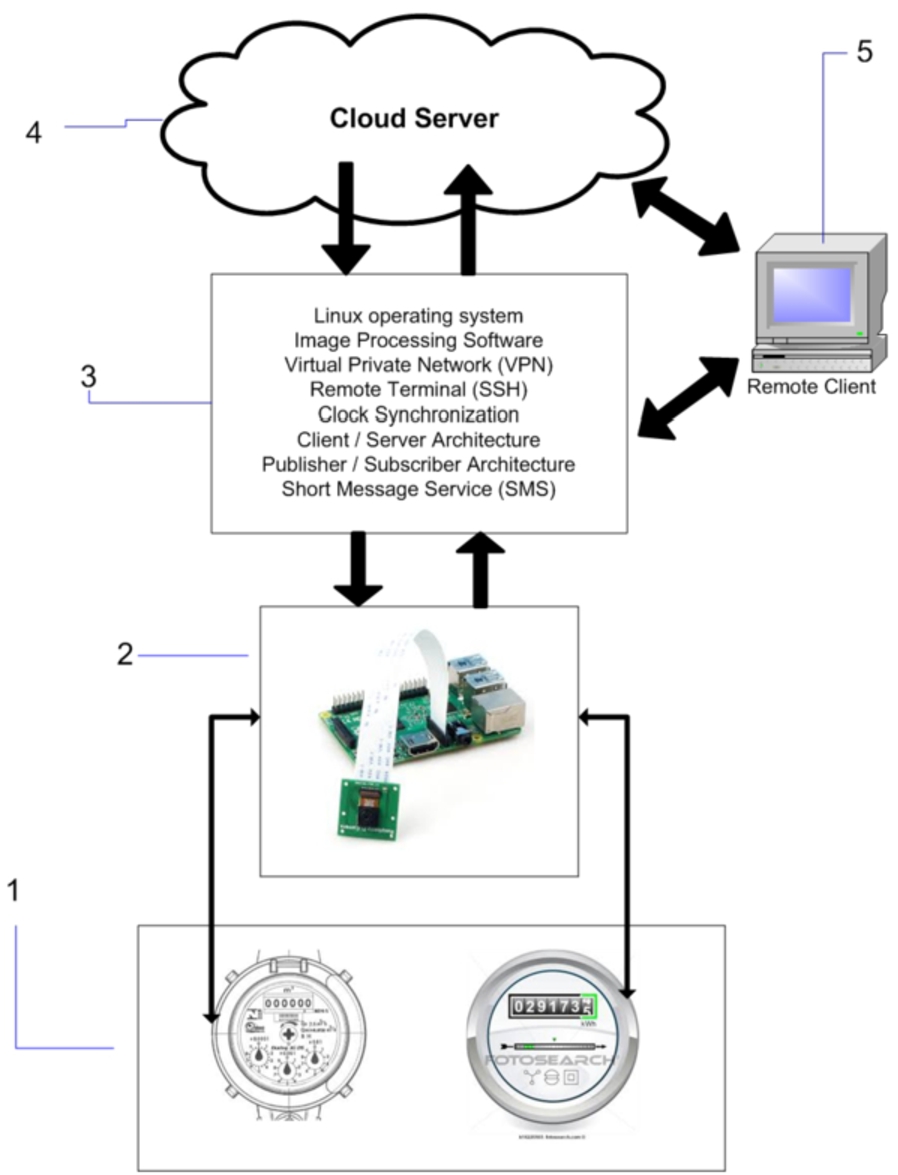
The architecture created for the Internet of water meters.
With the use of this innovative conception of metering automation for water, gas, and electricity meters, the inconvenient home visiting for resource consumption reading is resolved in a practical, cheap, and non-invasive fashion.
3.1.The general architecture
Figure 2 introduces the general architecture of the new analog metering method, which is broken down into five modules:
1. water, gas or electricity meter with an analog (or digital) display carrying no communication interface/protocol, and eventually having a Hall-effect or alike pulse sensor, or even an automatic shut-off actuator valve;
2. ARM-based computer platform such as Raspberry Pi, Orange Pi, Lemon Pi, or alike with GPIO pins to read sensor pulses and turn off the resource supply remotely, camera interface, cellular network through a SIM card, Wi-Fi, ports for Ethernet, USB, HDMI, and power supply, micro SD card slot, among other features;
3. software for capturing, processing, recognizing, storing, and transmitting images and video via TCP/IP, VPN with remote client/server, SMS message exchange with cloud server, local and server storage of events, e.g., resource usage, timestamp, display picture, device identification, Web and SSH access to the device, online interactions (client/server, publisher/subscriber, and clock synchronization) via TCP/IP;
4. cloud server for storing computer-vision metering data received through TCP/IP or SMS and management of flow meters, enabling resource leakage detection based on consumption patterns, and notification to final customer to attempt to diminish resource waste in the case of water leakage; and
5. remote clients to allow TCP/IP connection to the ARM platform via SSH or Web to monitor consumption metrics and supervise the running process through real-time video.
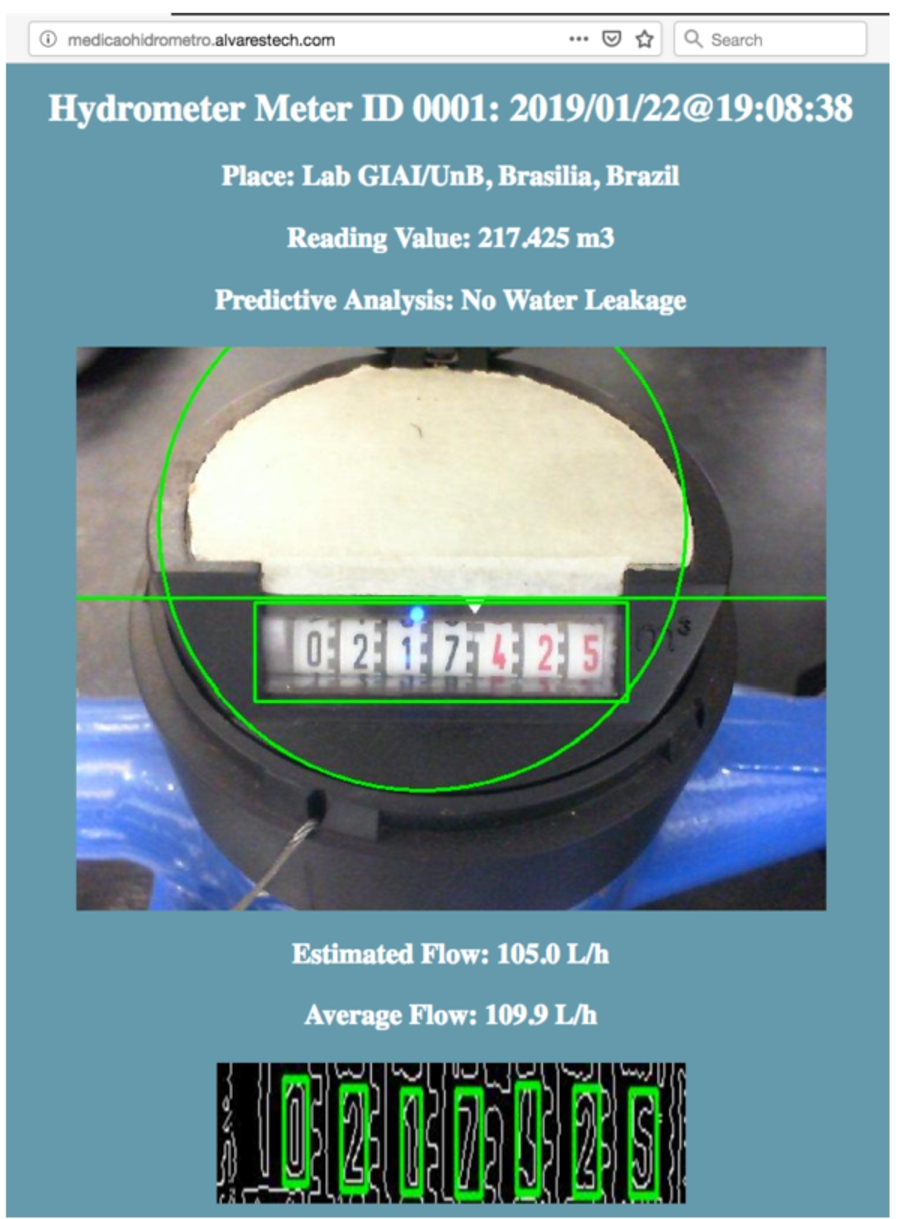
Figure 3 illustrates a monitoring screen as a client of the ARM computer-vision metering device. Via TCP/IP and HTTP, it provides the reading result, estimated flow, leakage-detection status, and the processed image of the water meter in a test bench. The monitoring screen is available on the following URL: http://medicaohidrometro.alvarestech.com.
Fig. 3.
Monitoring screen of water-meter automatic metering via web.
3.2.The novelty of the proposal
Below are the reasons why this work is unprecedented.
1. The method for remote supervision of water, gas, and electricity meter via the Internet and SMS is a new way of automating the flow-metering process on instruments that carry an analog or digital display. The method captures and recognizes the consumption displayed by a counter using image processing and machine learning algorithms, and transmits the metering event data in real time, as explained in Fig. 2. Advantages are the possible leakage detection in water meters, as well as the ability to turn off the service remotely. Therefore, it is a complete solution for the management of assets.
2. The innovative conception to acquire, process, and transmit metering data uses an ARM platform and Linux as the operating system. Pictures of the display are taken with a CCD/CMOS camera and processed with OCR to estimate the consumption value, which in turn can also be read by a pulse sensor, depending on the flow-meter interface. All the data derived from the reading are stored locally and transmitted using SMS or via a VPN on a Wi-Fi or cellular network.
3. The flow metering and data transferring does not depend on communication-channel availability or pulse sensor in the flow meter. The proposed metering automation method is meant not to replace flow meters already in use and provides a non-invasive, automatic instrument reading.
4. The method architecture orchestrates three types of communication: client/server using VPN for the communication channels and TCP/IP protocols such as HTTP and SSH; publisher/subscriber using MQTT, another TCP/IP protocol wherein the cloud server is the subscriber for the publication of metering data; and SMS between the cloud server and the flow-meter automation kit installed in every residence, industry, or commercial site.
4.Proposed computer vision method to recognize consumption value (digits) on a water meter display
The method is developed using the open-source library OpenCV. For the sake of fast and effective prototyping, as well as the availability of language library support, Python was the programming language chosen to implement the computer vision algorithms.
For better comprehension of the method, it is divided into three parts: metering algorithm workflow, machine learning, and computer-vision machine zeroing.
4.1.The metering algorithm workflow
In summary, the metering algorithm follows five steps to recognize the digits of the water meter display: 1) straighten frame, 2) find region of interest (ROI), 3) make sure ROI is upright, 4) locate digits, and 5) recognize digits.
It is worth mentioning that the machine learning process takes place before the software is set up to execute the whole pipeline of the metering algorithm. So between steps 4) and 5), three machine-learning models are generated from their respective algorithms and saved in their files. The three algorithms are k-Nearest Neighbor (kNN), Support Vector Machine (SVM), and Perceptron Multi-Layer (MLP) are trained with 4,500 images – in fact, there are 5000 altogether (500 digit snippets of each class), but 10% are randomly taken and put against the remaining 90% to cross-validate and evaluate the machine learning models. The files can then be easily read to load the models in step 5) of the pipeline to make predictions, saving both time and computer resources (RAM/swap) when the program is in execution.
The 5 steps of the metering algorithm workflow are chronologically introduced one after another as follows.
4.1.1.Frame skew correction
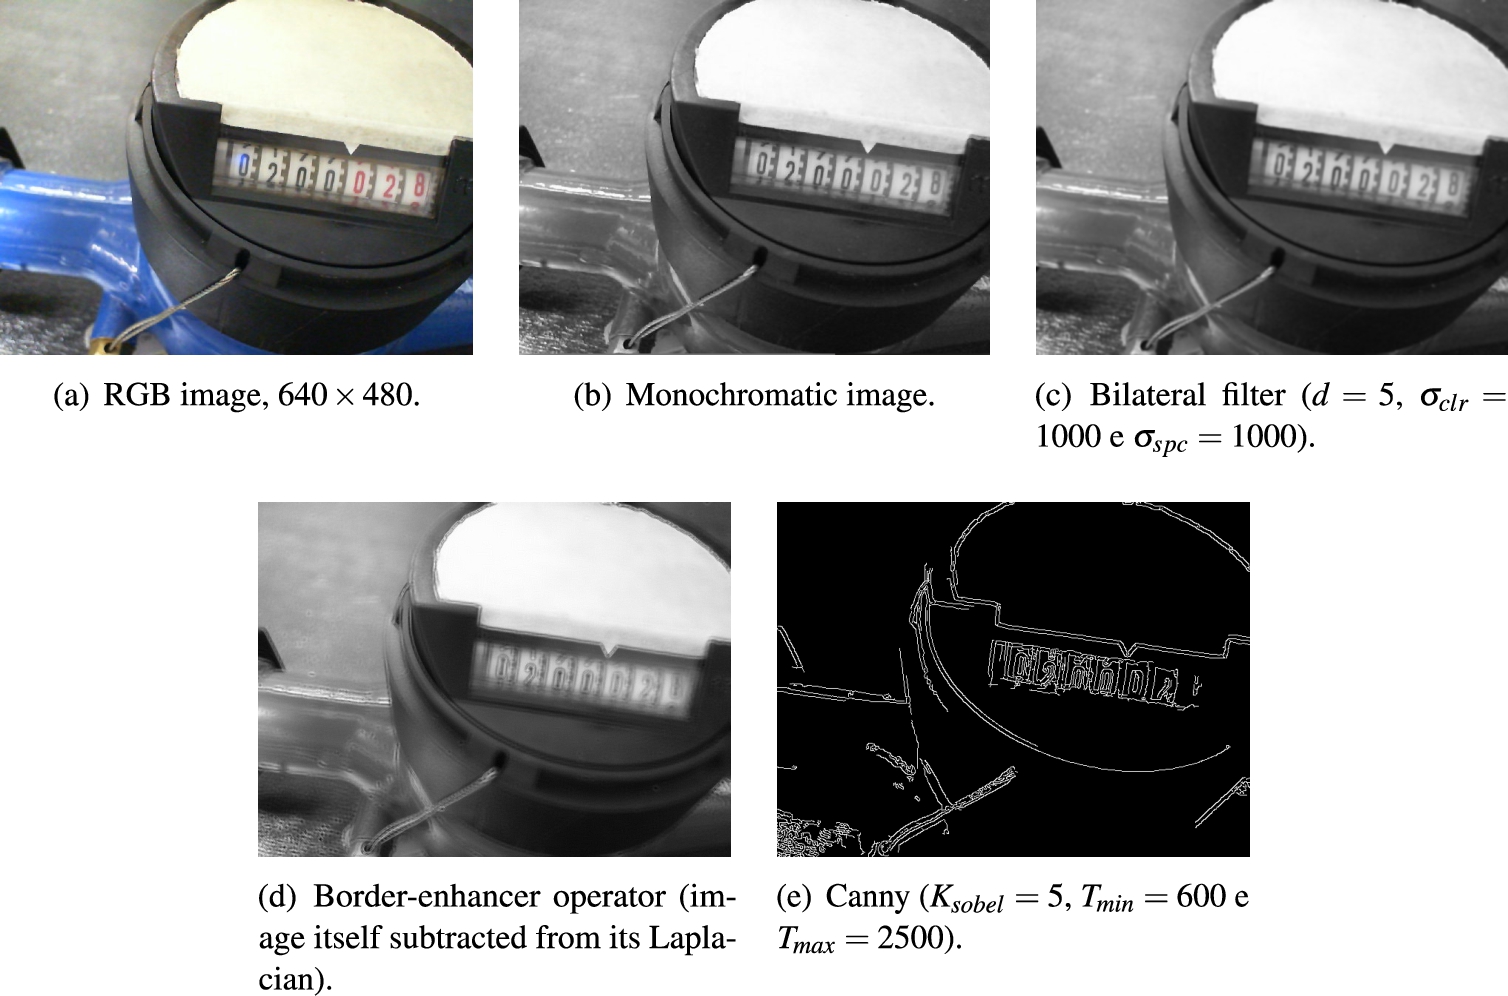
First of all, instead of working with the image in the three-color dimension (RGB), the frame captured by the camera is converted into a monochromatic image with 256 shades of gray.
At this phase, the main goal is to straighten the image. To do that, the angle by which the water-meter display is skewed on the frame needs to be found. Hough Transform for lines is the key to discover such deviation. This way, an image processing is initialized to make the image adequate to undergo the Hough Transform.
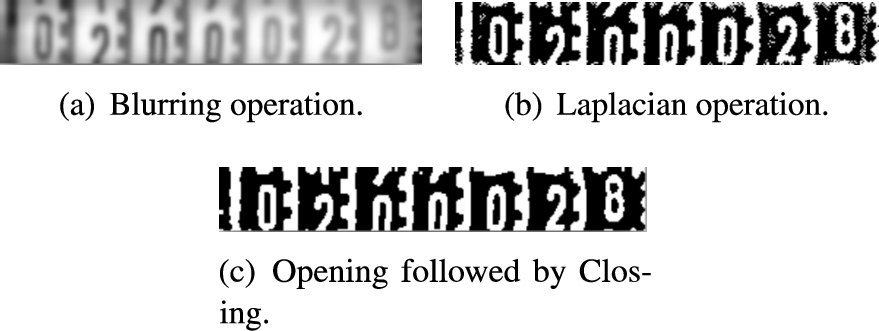
Then, the monochromatic image receives a Bilateral-filter operation to smooth the image but, more importantly, without taking off high-frequency edges. After that, to make those borders even more vivid, the following kernel K is applied in a convolutional manner over the image:
This kernel is given by the subtraction of the Laplacian of the image from the image itself.
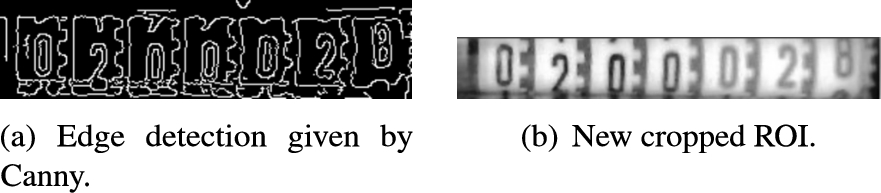
The next operation is driven with Canny to detect the edge in the image, which finishes the current image-processing stage. The results of the operations listed are shown in Fig. 4.
Fig. 4.
Preparation for hough transform for lines.
Although many of the lines revealed by Canny can be used to align the image, the target is a couple of lines above and perpendicular to the digits of the rectangular display.
With that in mind, Hough Transform for lines is applied with a vote threshold of 100. The targeted lines are found, and the angle of its deviation with regard to the vertical is obtained.
Because the 2-D rotational matrix algorithm, used to rotate the image appropriately, has the horizontal axis as a reference, the angle found with Hough Transform is compensated with regard to the abscissa. This way, the angle correction of the frame becomes possible, and the image is straightened. Figure 5 illustrates the straightening process.
4.1.2.Region of interest determination
The ROI is defined as the rectangular box in the water-meter display wherein the sequence of digits that represents the water consumption resides. To get to this rectangular region, a vast series of image processing operations have to come about.
First, the geometric aspect of the water-meter display is exploited in hopes of shrinking down the problem. As the water meter has a circular display that surrounds the ROI, the goal is to detect that circumference.
To do that, the angle-corrected, monochromatic image is taken as input and once more submitted to a Bilateral operator (
Fig. 5.
Frame angle correction through hough transform.
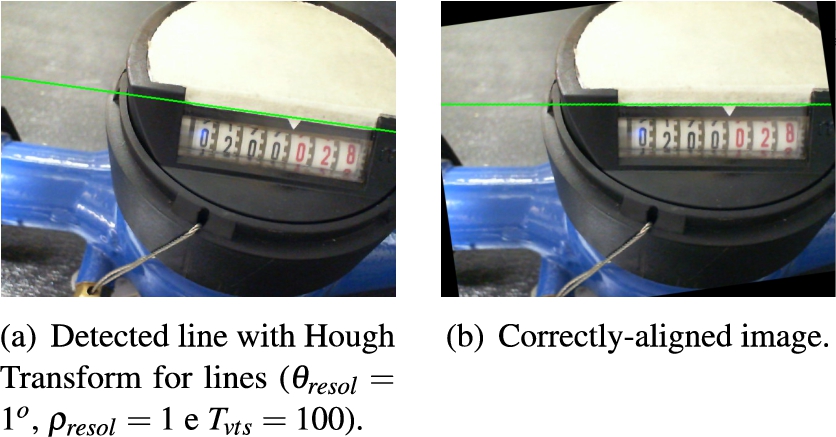
Fig. 6.
Detection of the minimum enclosing circumference that englobes the ROI entirely.
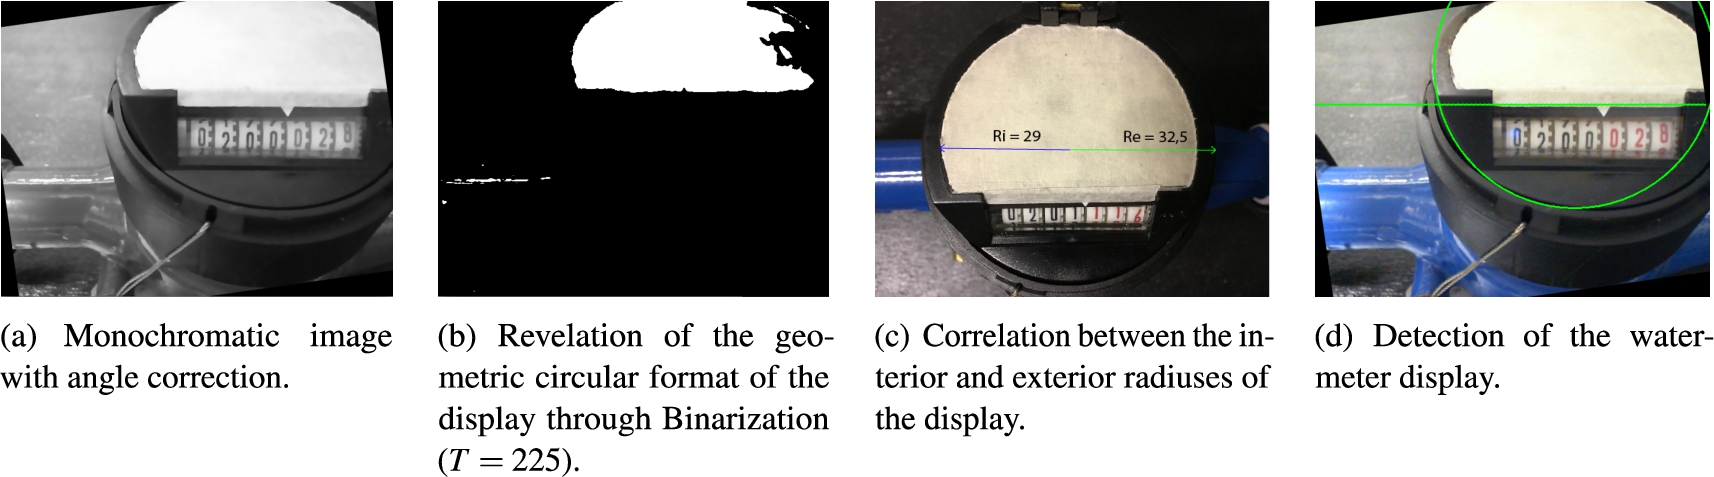
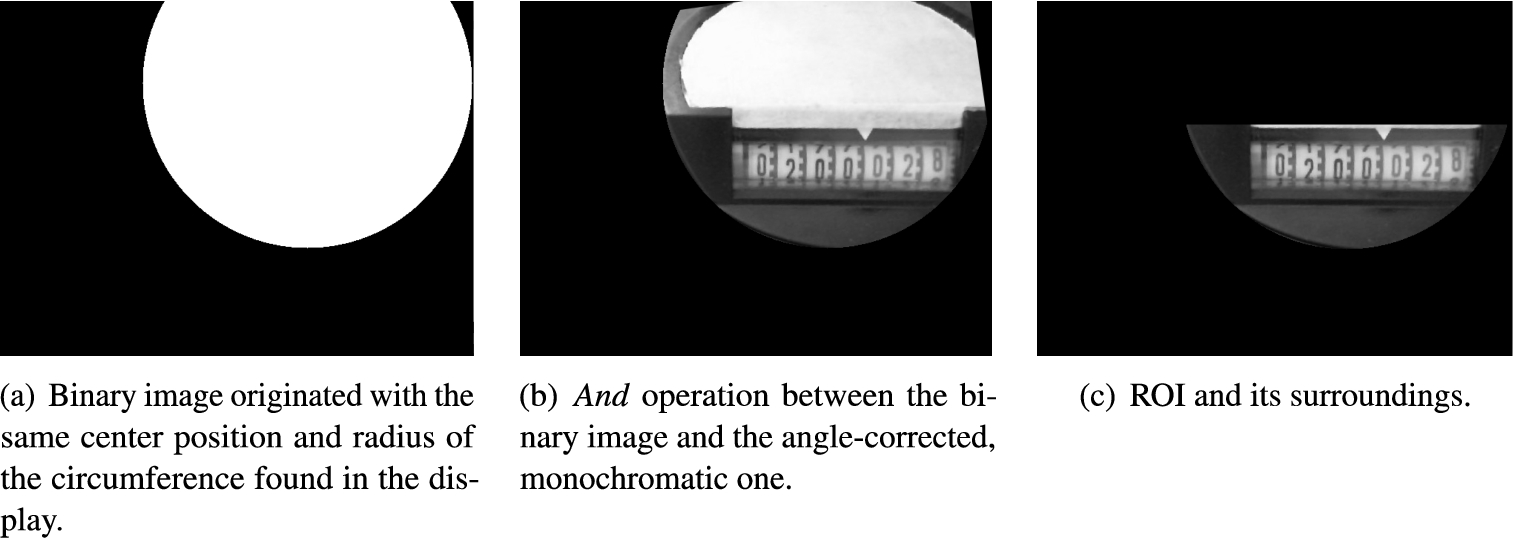
Next, a new binary image is originated with the same center and radius of the circle drawn previously. Inside of the circumference, all the pixels are assigned white (255), and the outer pixels receive black (zero). This binary image is then involved in an and operation with the angle-corrected, monochromatic one. At this stage, the problem of encountering the ROI has decreased significantly in terms of image-convolutional size and present features.
To further simplify the problem in size and feature extension, the height of the point (line) yielded by the Hough Transform for lines is taken into consideration to run an analysis of light-pixel density over the reduced, semi-circular image.
In that direction, the image is divided into two parts through the Hough Transform line. The analysis of light-pixel density evaluates which of the parts has a higher summation in the magnitude of shades of gray. The component pixels of whichever part is the whitest are assigned zero. This way, the remanding part is a smaller semi-circle wrapping the ROI, which can be seen in Fig. 7.
Fig. 7.
Removal of unnecessary information from the image.
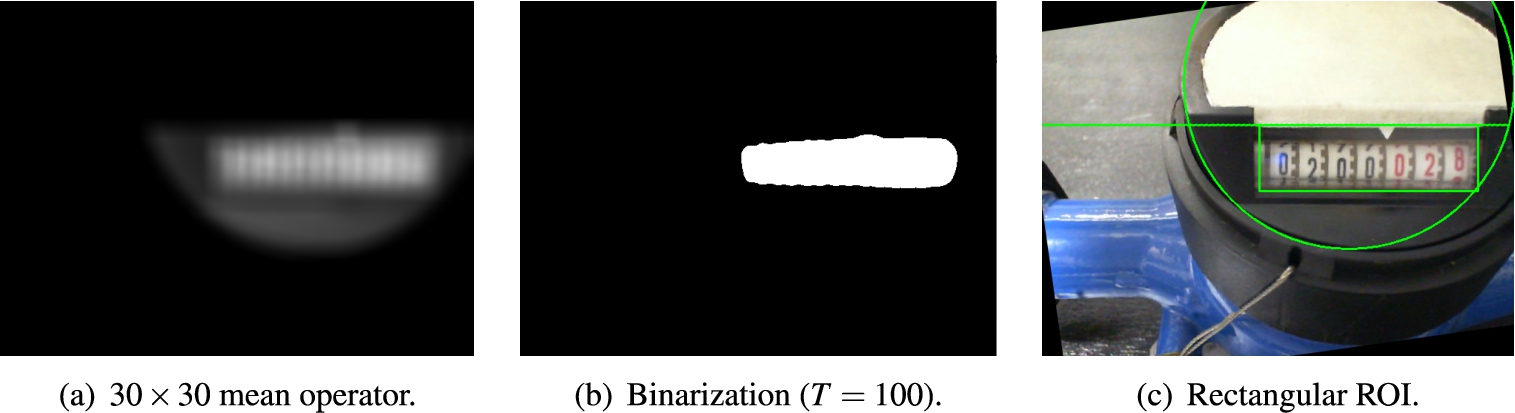
After removing most of the irrelevant information from the captured image, the region where the water-consumption counter is in the display is roughly the only one that has a significant concentration of high-frequency pixels. So the goal is to make the very few segments of low frequency vaguely disappear in the rectangular counter area, which is accomplished by employing a convolution of the reduced, remaining monochromatic image with a reasonably large mean kernel of
Subsequently, the image is subjected to a median threshold to reveal a somewhat rectangular region around the surroundings of the consumption counter as a segmented white object. An adaptive threshold is used to determine the edges of the desired object. Although the response of that operation can produce a little coarse, thick borders, it is already enough to obtain the contours. A rectangle is then generated in a circumscribed way and drawn in the image. That means the region of interest (rectangle) is finally discovered, as presented by Fig. 8.
If the ratio between the base and height of ROI exceeds 2.6, the monochromatic semi-circle undergoes a histogram equalization. That way, the image intensities are adjusted in such a fashion that the contrast is enhanced throughout the image. Once that happens, the process goes back to that same sequel of operations already described, from blurring to drawing the rectangle that eventually surrounds the new and intended ROI.
Fig. 8.
Localization of the region of interest.
4.1.3.Upright state verification
This step is a very straightforward one, but also necessary, especially if the camera is not well-positioned or the best position for it happens to be upside-down when installing.
What the metering algorithm has done so far does not require the camera to have captured an upright frame. That said, even if the captured frame is upside-down, the algorithm does not turn out finding a ROI other than the rectangular region of the water-consumption counter. However, the ROI must be upright for further operations. After all, an irresponsible extraction of upside-down numbers would most likely output mistaken consumption values in the OCR carried out with any classifier in use later on.
Given this circumstance, the solution lies in the same light pixel density analysis used to eliminate the irrelevant part of the exploited display circumference, yet keeping the ROI and its surroundings. But, instead of blacking out the image, the metering algorithm turns back to the circular monochromatic image and takes advantage of that light-pixel density analysis to determine whether an image rotation is necessary. Grounded in the assumption that the concentration of whiter pixels must be at the top, the image is rotated 180 degrees around its central pixel if it is found to be at the bottom. Otherwise, the image is kept the same, with no rotation.
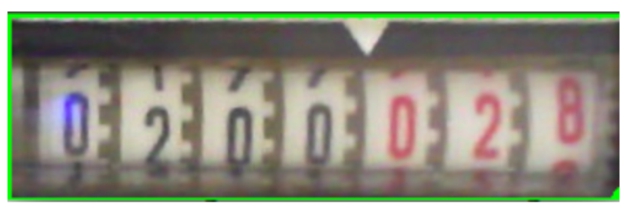
After making sure the image is upright, the ROI is properly cropped and, as of then, referred to in order to execute further operations. The cropped ROI is introduced in Fig. 9.
Fig. 9.
Cropped ROI.
4.1.4.Digit detection
In the first place, global histogram equalization is applied in the image with the intent of raising the image contrast and eventually fading any glare.
As there is still irrelevant information inside the ROI, it still needs to be diminished in a matter of height to make the digit identification processes more effective, controllable, and clear.
So Canny is utilized to locate the top and bottom boundaries of the rolling digit units in the ROI. For that, the lower and upper thresholds are calculated based on the median of the monochromatic ROI. They are, respectively, the minimum between 0 and the image median decreased by a factor of 33% and the maximum between 255 and the image median increased by a factor 33%.
With the detection of the edges done, to find out where to crop the ROI at two different heights, Hough Transform for lines is used with a vote threshold of 100. While Hough Transform loops through the image, a total of 10 lines or whatever number of lines smaller than that found in the image is segregated into two groups in a function of their position with regard to the image centroid’s height. The two groups are the upper and lower lines. The top and bottom cut-off points are derived from whichever horizontal line from each of the groups that are the closest to the ROI centroid. The new cropped region of interest can be seen in Fig. 10.
Fig. 10.
ROI with height reduction.
The next step is to segmentize the new ROI to produce clear and contiguous objects (digits) on the foreground with the least amount of noise. A
Then, a Laplacian operator is employed. This operator produces float signed numbers as pixel intensities in OpenCV, which are corrected by the use of a Binarization operator with a threshold at zero. After that, morphological operations with a flat
Fig. 11.
Discovery of objects (digits).
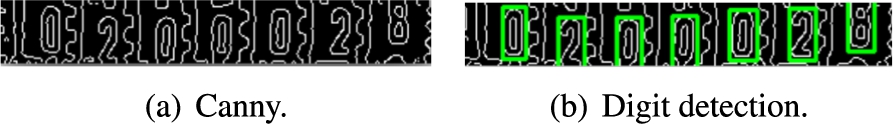
After that, the Canny algorithm takes place one more time over the closed image. This time, the lower and upper thresholds are 1000 and 1500, respectively.
As expected, the set of objects is composed of digits and gaps between one another. The presence of the intermediary, gear-shaped objects is unfortunately inevitable; there is no way to avoid them in the edge detection process. And it turns out that Canny made their edges as noticeable as the intended digits’, which augments the complexity of the digits detection.
All of the most external contours from the top left until the right bottom are then compiled into a list.
Afterward, an algorithm that filters only the digit contours, leaving behind everything else, is done in two phases.
In the first phase, a scanning is conducted in the list of contours L to verify if the ratio
In the second phase, if the new list is not empty, another scanning is run throughout this list (
a) the distance between the centers of
b) the current index i is not equal to two subtracted from the length of the new list.
If the answers for a) and b) are no, the contour
c) the distance between the centers of
d) the x coordinate term from the horizontal center of the contour
If both of these propositions are true, the contour
To obtain the last digit (seventh), another comparison takes places recursively, regarding
In the particular case of the last element, the two subsequent propositions are analyzed:
e) the distance between the centers of
f) the x coordinate term from the horizontal center contour
If both are true,
It is important to mention that, sometimes, depending on the positioning of the least significant rolling-digit unit, the shadow of its gear in the segmented ROI is filtered into the list
Fig. 12.
Result of the digit detection.
4.1.5.Digit classification
The digit classification takes place if, and only if, the desired amount of digits (seven), which integrates the consumption value, is detected in the digit-detection phase.
Whenever all the wanted digits are detected, the algorithm looks for the Python version in execution, whether 2 or 3, and the kind of classifier model among kNN, SVM, and MLP chosen for the optical number recognition. This way, the model originated from the machine-learning training and cross-validation processes of the chosen classifier, in a correspondingly-specific Python version, is loaded from their respective file.
At this point, the snippets of the wanted seven digits are resized accordingly with a standard digit dimension picked out of
Each snippet is input in the prediction model. Iteratively, every snippet is checked whether unacceptably-skewed by utilizing image moments, and they are straightened if so.
Then each of them undergoes a Histogram of Oriented Gradients (HOG). In this process, each snippet is broken down into four cells, and values of magnitude and angle in each cell are divided into sixteen bins. As the HOG features are histograms, Hellinger Distance, under RootSIFT to some extent, is used to produce a vector with sixteen feature descriptors per snippet, with which the predictions are made for the whole set of numbers.
The water consumption usage predicted is transformed into a float number with three decimal places, indicating the amount of water in cubic meters.
At each usage prediction, the system UTC timestamp is regarded and saved, as well as the predicted value, which enables the smart machine to come up with an estimation for the instantaneous water flow and the average water flow.
There are three rules of plausibility employed that determines if the algorithm should proceed with future operations as the water consumption value is predicted. The rules are the following:
i) The current prediction value must be bigger than the previous one;
ii) The volume variation between the current measuring and the previous one must be bigger than a minimum incremental consumption volume of interest specified; and
iii) The estimated instantaneous flow must be smaller than or equal to the nominal water flow of the meter under supervision.
If every of the above rules is attended and the UTC timestamp is always progressive at every iteration, the program will save both the cropped and digit-detected, segmented ROIs (Figs 9 and 12(b)) with a JPEG compression factor of 75%, as well as the processed RGB image of the instrument’s display (Fig. 8(c)), for further presentation of customer history consumption. In addition to that, metering metrics abstracted from the prediction process such as float-point consumption value, UTC timestamp, and derivatives are also stored in two files, differently. The first file is always re-written with the present metering metrics that become the previous ones at the consecutive iteration, which assures a back-on-track operation in case of a system outage. The second file is a log, history one that has the metering metrics appended to itself, and is the object of future data analysis.
In the situation wherein the current predicted consumption value does not change and all the other prepositions are true, only the re-writable file, responsible for storing just the very present/previous metering metrics, is updated. Otherwise, none of the files are modified.
4.2.Machine learning
All the data set necessary to conduct the machine learning is generated through steps 1) to 4) of the metering algorithm. Such pipeline is executed recursively over a four-hour-long period of digit-snippet extraction, in which it gathers a reasonably-big amount of data samples from the counter of the water-meter display. At the moment of extraction, the segmented digit snippets are resized to
Fig. 13.
Machine-learning image data set.
Next, a data preparation process for the training stage aims to transform all the 5,000 digit snippets into 5,000 vectors of feature descriptors. This data preparation is accomplished in three steps.
Fist, a permutated vector with the size of the big data-set picture is created by using a number picked out as a random state seed to do the index permutation throughout that vector. The non-duplicate random values (no duplicates), i.e., random indexes from 1 to 5,000, of such permutated vector are used to randomize the vector of digit snippets as well as the vector of respective labels, keeping the previous correlation between them unaltered.
Secondly, each digit is checked whether its inclination is admissible, which is done using image moments. If the absolute value of the second-order central moment of the image (translation invariant) in y is lower than 0.01, the digit snippet is kept the same. Otherwise, the skew angle is calculated in terms of second-order central moments, input into a 2-D rotation matrix, which then is used to correct digit-snippet skewness.
Thirdly, HOG is employed in the list that contains 5,000 digit snippets, one at a time. It utilizes Sobel operator to obtain image edge components in x and y. Then, each vectorized pixel undergoes a coordinate-system transform from Cartesian to Polar, creating one vector of magnitudes and another one of angles. Both image vectors are broken down into 16 bins, and the angle vector is normalized in a feature-scaling manner, bringing the values in a new range from 0 to 16. Afterward, both vectors, still carrying an image-format pattern, are divided into four cells. Each bi-dimensional values of the two vectors (magnitude and angle) are multiplied, respectively, matching their indexes, finally forming a histogram of 16 bins. From there, the digit-snippet histogram is normalized
Next, the supervised learning starts by separating 90% of the 5,000 feature-descriptor samples randomly mixed in the vector in order to train the machine-learning algorithms, namely Support Vector Machine (SVM), k-Nearest Neighbor (kNN), and Multi-Layer Perceptron (MPL), which are exploited to perform the digit recognition. The remainder 10% are taken to run cross-validation and test on the models of the three mentioned machine-learning algorithms. For both of the subsets, their respective labels are accordingly sub-divided.
The calibration of hyperparameters for each classification algorithm is then carried out in the training process. For that, the implementations of the machine-learning algorithms from Scikit-Learn Developers libraries are leveraged.
Each model’s cross-validation achieves a satisfactory fitting to the recognition problem, by putting together adequate and right parameters. The final tuned hyperparameters of the models are shown subsequently.
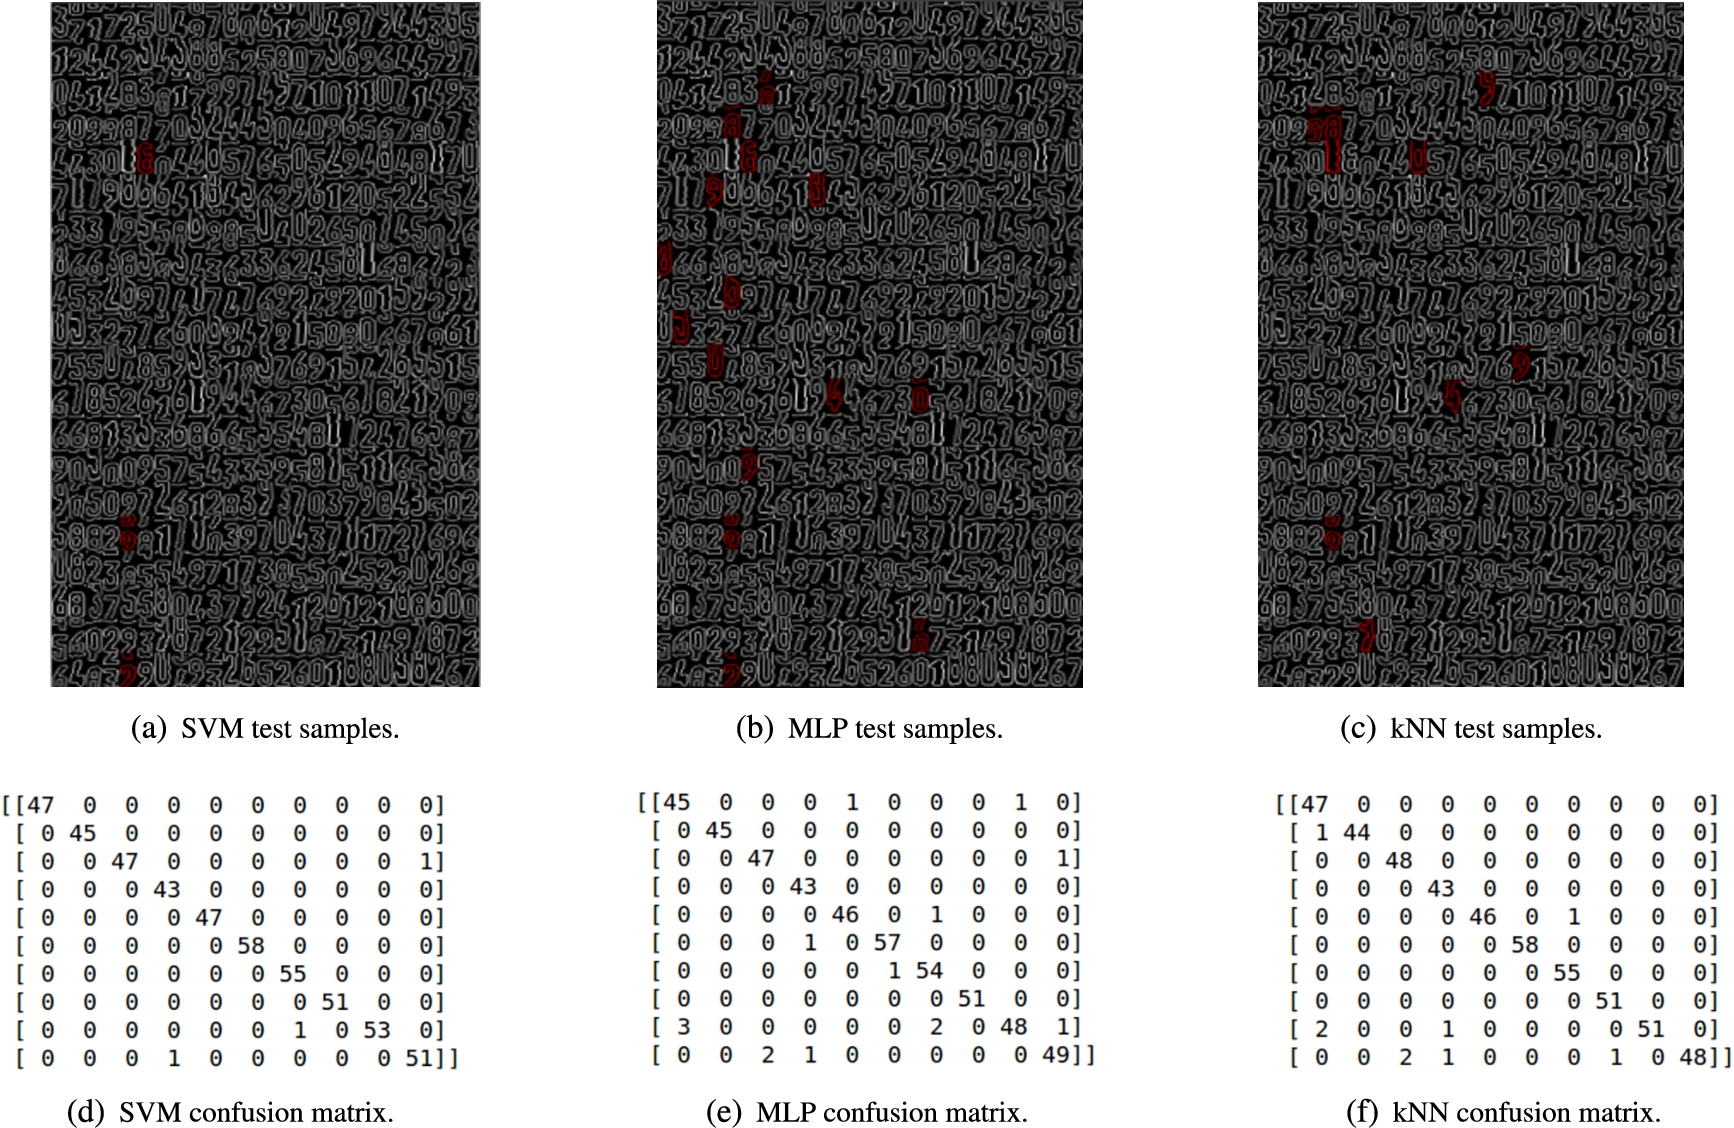
The accuracy of each model is verified and study through a confusion matrix, generated at the end of the training process, and a picture with the 500 test samples (digit snippets), indicating in red which predictions among them are faulty as in Fig. 14.
The trained models are saved into Pickle binary files. Then, the corresponding file of whichever model defined to predict the water consumption is loaded every time the metering algorithm is called.
4.2.1.Support vector machine
The best error penalty C and the kernel coefficient γ found are the following:
The remaining hyperparameters of the algorithm are the default ones. And it is important to highlight that the SVM algorithm used from Scikit implements an “one-against-one” approach for multi-class classification.
4.2.2.Multi-layer perceptron
The hyperparameters calibrated are the hidden layers sizes
4.2.3.k-nearest neighbor
The only hyperparameter chosen here was the number of neighbors to regard to, which is
Fig. 14.
Test samples for each machine-learning model after the training process with a random state,
4.3.Computer vision machine zeroing
The zeroing of the computer-vision machine needs to be executed immediately after the installation of the automation module upon the water meter instrument. Its purpose is to establish a starting point for the machine in terms of water consumption volume and time.
The zeroing algorithm allows better positioning of the module, through real-time visualization of the computer-vision processing, to achieve a correct digit localization in the display. Furthermore, it handles the initialization of important files that deal with installation records, water consumption history, and temporary variables.
To understand the zeroing algorithm workflow, consider the alluded two main tasks as follows.
4.3.1.Computer vision visualization
The computer-vision visualization uses the pipeline from steps 1) to 4) of the metering algorithm to set up the automation module. In a debug mode, this pipeline is executed and intends to show on a screen the outcome of the image processing and the detection of digits utilizing images such as in Figs 5(b) and 12(b). The real-time exhibition of both images aids in verifying a better angle-position adjustment to assure the detection of all the digits in the water-meter display.
4.3.2.Initialization of software files
The initialization of the software files takes advantage of the exhibition of the water-meter display so that the current initial consumption value can be read.
The algorithm launches a terminal in which it asks to input the consumption value seen in the water meter. After that, it starts two quick processes. When both of them end, the program is terminated, and the automated metering is conducted by Crontab, indefinitely.
The first process saves an image of the actual ROI, such as in Fig. 9, naming the image file with the momentary UTC timestamp (Unix time). Besides that, it creates a file in which it stores UTC time and date, the initial consumption value, and the ROI filename. This file gathers information regarding the setup process; therefore, the file is not modifiable.
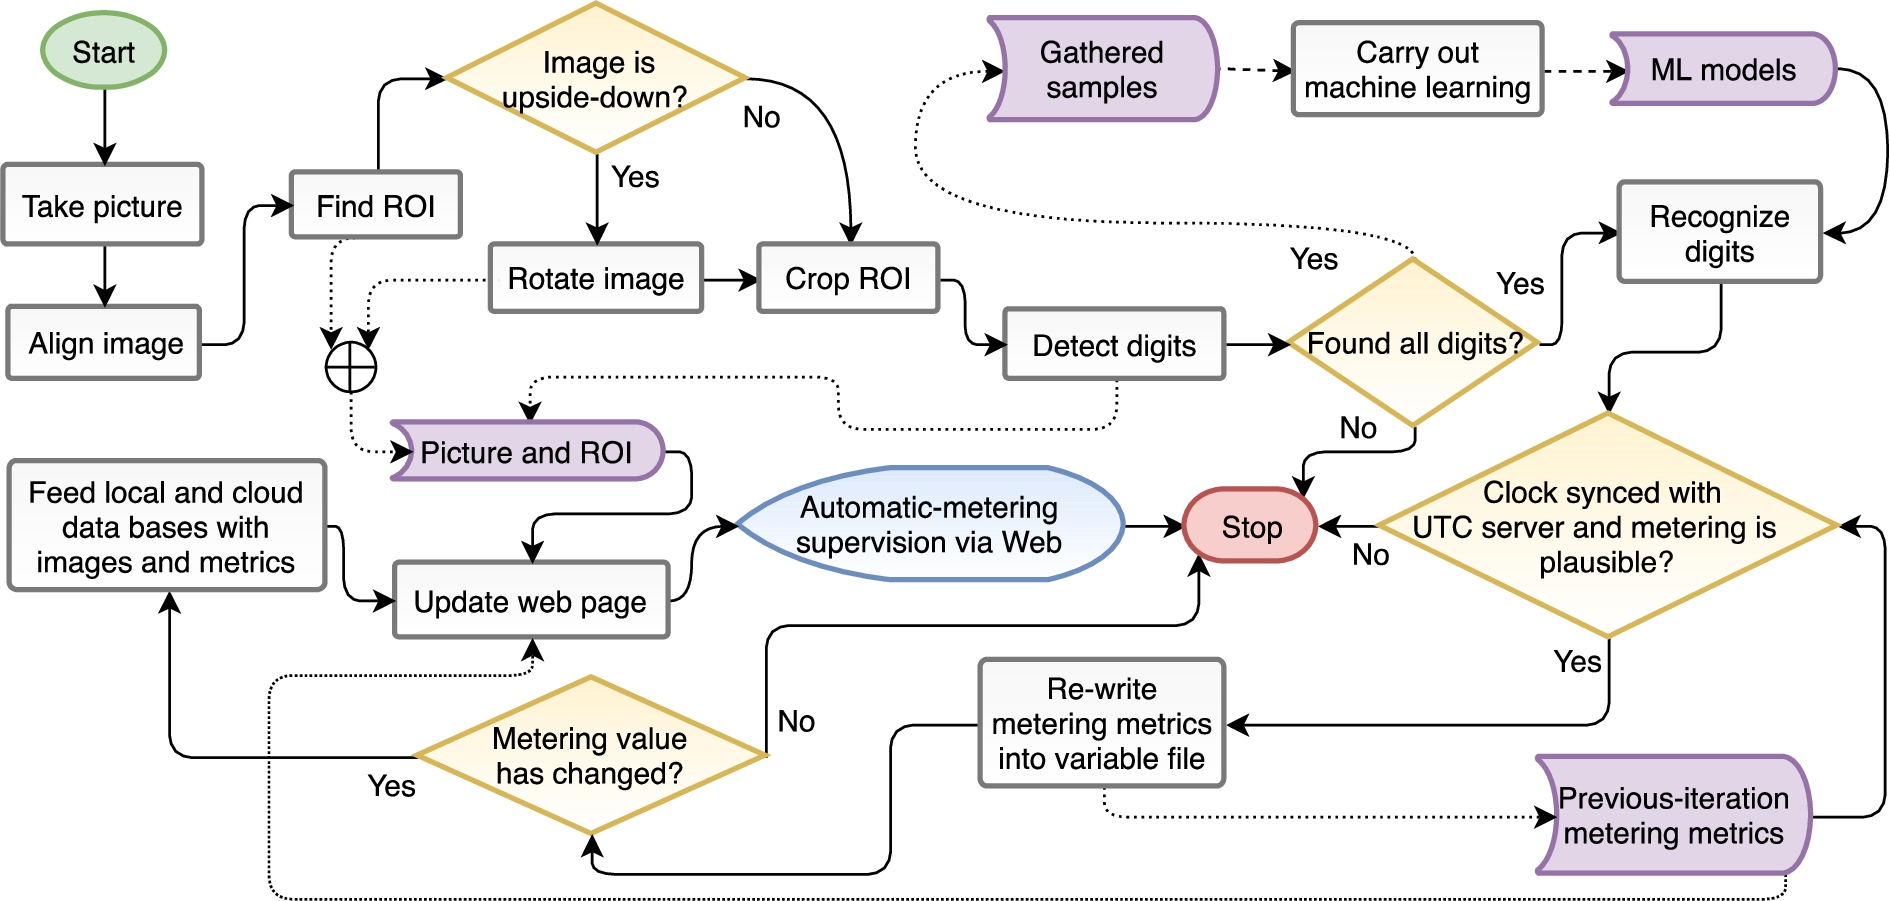
Fig. 15.
Software workflow: metering algorithm with web-page update.
The second process takes care of initializing a temporary-variable file and a history-consumption one. The first file is re-writable and has the UTC timestamp and instantaneous consumption. The second file holds the following metering metrics, which are fed into it every time the detection of all digits is successful and consumption value is unique:
– UTC date and time, Timestamp, Consumption (string), Instant usage (float), Volume variation (liter), Time variation (second), Instant flow (L/h), Average flow (L/h), and Number of attempts
5.Software implementation
The programming paradigm employed to build the software is mostly procedural programming, although OpenCV itself, as well as the libraries from Scikit Learn applied as machine learning tools, is fundamentally object-oriented.
The computer-vision software created also has compatibility with Windows (10, 64-bit) and macOS, even though developed on a Linux platform, which is the target for generally being adopted as the operating system on ARM (Advanced RISC Machine) mini boards. The prerequisite to run the software is having installed a Unix shell application and Python (either 2 or 3) on the computer.
The software is constituted of two scripts by which everything is done. The first script is a setup one that is used likely just once, immediately after the computer-vision machine is physically installed upon the water meter. All it does is to handle the execution and termination of programs needed to perform the computer-vision machine zeroing.
The second script is accountable for carrying out the metering algorithm workflow, which implements the computer vision and OCR to automate the water-consumption metering. Moreover, this script updates a web page with the new metering data available from the very last metering. This web page is the interface that turns possible the supervision of the water consumption remotely. The whole workflow of the second script is presented in Fig. 15.
To run the second script, Crontab, or any other task scheduler alike, is utilized. The task scheduler is input with a time that dictates how soon to re-run the script periodically.
The employment of a task scheduler is very beneficial to the computer-vision machine in a matter of autonomy. If there is an outage, for whatever reason, causing an unexpected shutdown in the machine, it can reboot itself and get right back on track with the water-consumption metering, time to time as designated, when the energy is back.
In this context, the temporary-variable file in which time and consumption value are re-written is crucial as well for the system autonomy hallmark. Through this file, the system can always have a notion of the very previous metering metrics regardless.
As far as the arguments passed in for both of the scripts, the user can specify which version of Python to execute the programs. Besides that, another input argument is the camera device identification. If nothing is provided when calling the scripts, the machine assumes that the default arguments are intended, which are Python 3 and camera identification zero.
In the particular case of the second script, there is a third argument that is reserved for assigning which of the three machine-learning models to utilize for the consumption-value prediction. The argument must be provided according to an enumerate-list fashion. If nothing is provided, the machine uses SVM as the default model.
Inside the main function of the metering algorithm, called by the second script, the computer-vision machine is purposely given a chance of 5 attempts to detect all the digits in the display that compose the consumption value. Each turn ends whenever any step from the start until the digit detection phase of the algorithm fails. When there an execution failure in the workflow between both of the mention stages, the main function restarts. If the machine is not able to find all the digits by the fifth try, it waits for the subsequent execution of the second script by the task scheduler.
Exception handlers are spread all over the metering algorithm, from frame-skew correction to digit classification. So taking into consideration that the software needs a relatively light environment for its computer vision to work properly, any sudden lack of sufficient light does not impact negatively in its performance. The software even saves energy by not going further with the computer-vision processing whenever an exception arises.
When it comes to the upload of metering images and metrics into the database, at every iteration, the RGB, cropped ROI is saved if 1) all digits are detected and the clock is synced with UTC server, 2) the plausibility tests are satisfied, and 3) the metering value has changed. Also, the history file is fed with metering metrics – same is true for the temporary-variable file, but only the most current set of metrics remains in it from one iteration to another. Such ROIs and file are made available online to the user to consult any consumption event of interest or to analyze and predict water-consumption history through graphics.
At the end of the workflow of the second shell script, there is a Python routine called to update an HTML file. The routine looks for parameters of time and volume in the temporary-variable file, as well as the digit-detection ROI and the water-meter picture, to fetch them and update the web page as seen in Fig. 3. Thereby, the automatic-metering supervision via Web can be done wherever and whenever by the user.
6.Results
In order to finish the automatic metering solution, on the one hand, it was necessary to choose a machine-learning model among SVM, kNN, and MLP to carry out the OCR of the water meter. A cross-validation process was then driven with the mentioned models to highlight their performance likelihood and reveal the most likely better model to be employed in the OCR in terms of recognition success rate.
On the other hand, as far as software performance, an evaluation of each machine-learning model embedded alone in the computer-vision software was also led. Several tests were run with the different versions of the software, and the total real and user times of each automatic metering were observed and taken.
From the recognition and runtime assays, SVM was found to be the most appropriate model for the remote metering supervision of the software because of its higher success rate of recognition and its lower runtime when compared to the kNN and MLP models.
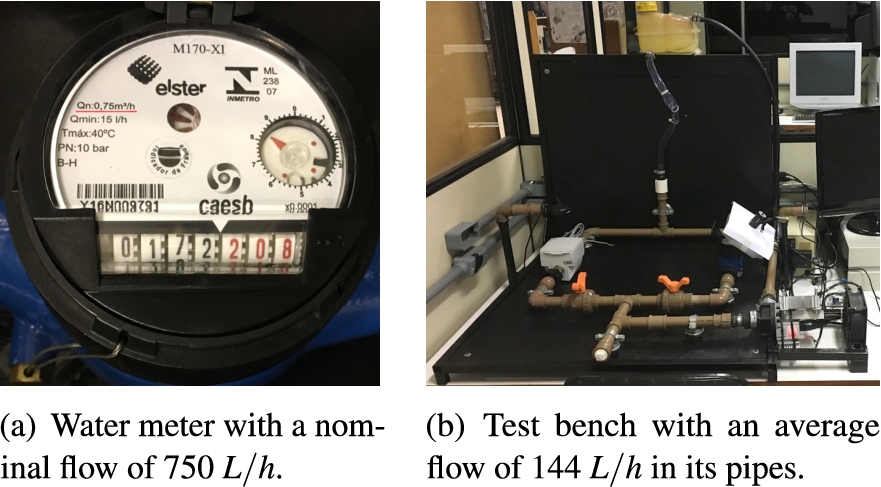
With the software utilizing SVM for OCR, an experiment was conducted on the test bench, where the water meter was. As seen in Fig. 16(a), the water meter’s nominal flow was 750 L/h. The test bench (Fig. 16(b)), in turn, was able to deliver a constant flow charge of approximately 144 L/h by its washer-drain radial pump in normal conditions. That means that the least rolling gear of the water meter kept rolling from one digit to another, marking a new liter consumption, every 25 seconds.
Fig. 16.
Elements with which the experiment was led.
The experiment consisted of letting the computer-vision machine run its automatic metering for 26.3 hours. Environment artificial light was used for most of the period, except when purposely turned off to test the automatic metering device. The system had only five attempts per call, by the task scheduler, to find all digits in each captured frame. Altogether, 773 measurements were successfully collected within the mentioned time. Therefore, the data analysis to be done regards to the space sample comprising these 773 metering vales and their respective derivatives such as time variation
6.1.Validation of the machine-learning models
After the hyperparameter tuning of the machine-learning models, they were an object of cross-validation/test to study their digit-recognition effectiveness. In order to do that, the vector of 5,000 feature-descriptor samples was permuted 10 times. Every time a unique vector permutation took place as a result of the assignment of a new and different random state, and then the SVM, kNN, and MPL’s models were trained with the 90% of the samples and cross-validated with the remaining 10%. The outcome of the cross-validation is presented in Table 1.
Table 1
Cross-validation of the machine-learning models with various random states
| Random state | Error [%] | ||
| SVM | kNN | MLP | |
| 50 | 1.0 | 2.2 | 2.4 |
| 100 | 1.0 | 1.0 | 1.8 |
| 150 | 0.4 | 0.8 | 2.4 |
| 200 | 0.4 | 1.0 | 1.2 |
| 250 | 0.6 | 0.6 | 3.4 |
| 300 | 0.6 | 1.2 | 3.2 |
| 350 | 0.6 | 1.8 | 1.8 |
| 400 | 0.4 | 1.8 | 1.8 |
| 450 | 0.4 | 1.4 | 2.6 |
| 500 | 1.0 | 1.6 | 3.0 |
| Mean | 0.6 | 1.3 | 2.4 |
Overall, the three means computed suggested that SVM was the best out of the three models, with a recognition success rate of 99.4%. Behind, the second-best rate was found with KNN (98.3%), and the third, with MLP (97.6%).
The accuracy level of SVM recognition performance over the MLP’s was somewhat unexpected and caused some strangeness. Although implementing the “one-against-one” approach for multi-class classification, SVM is yet a linear algorithm, and it should not have been better than MLP in a level of accuracy; however, the reverse would have been true and more understandable because of the non-linear aspect of MLP. The reason for that is probably linked to the fact that there was no testing stage for the peculiar model, but only training and cross-validation. There is also a chance the MLP model’s hyperparameters may not have been at their best tuning.
6.2.Software performance
The software performance was analyzed with regard to each of the three machine-learning models. The software assay was carried on a Raspberry Pi 2 Model B (900 MHz quad-core CPU, 250 MHz GPU, and 1 GB RAM shared with GPU) running Arch Linux with Xfce. Instead of a Pi Camera, a Microsoft Lifecam Cinema (webcam) was plugged into the board via USB, and the resolution of the captured frame was always OpenCV’s default
Table 2
Software execution time with each of the three machine-learning models
| Test No. | SVM (s) | MLP (s) | kNN (s) | |||
| Real | User | Real | User | Real | User | |
| 1 | 16.6 | 13.3 | 16.7 | 13.5 | 16.2 | 12.5 |
| 2 | 13.1 | 7.4 | 14.7 | 10.4 | 16.5 | 13.3 |
| 3 | 14.0 | 9.0 | 12.9 | 7.5 | 16.7 | 13.4 |
| 4 | 16.6 | 13.4 | 15.0 | 10.0 | 16.5 | 13.2 |
| 5 | 13.1 | 7.5 | 13.1 | 7.7 | 14.0 | 9.0 |
| 6 | 13.0 | 7.4 | 15.7 | 11.8 | 16.4 | 13.2 |
| 7 | 13.0 | 7.7 | 13.0 | 7.5 | 13.1 | 7.7 |
| 8 | 13.1 | 7.6 | 14.1 | 9.1 | 16.4 | 13.1 |
| 9 | 13.0 | 7.6 | 16.5 | 13.5 | 16.6 | 13.4 |
| 10 | 14.0 | 9.0 | 13.0 | 7.6 | 16.2 | 13.0 |
| Mean | 13.9 | 9.0 | 14.5 | 9.9 | 15.9 | 12.2 |
According to the data acquired, the SVM model is most suitable for the software application because the ARM platform took nearly nine seconds on average to carry out the whole processing and yield the metering value automatically.
Even though a nine-second period seems to be significant for a computer board to be executing the water metering, it is important to bear in mind that the software had five attempts to find all the digits. Depending on the digits’ positioning and rolling speed in the water meter, the computer-vision machine can take up to the fifth attempt – or not even be successful whatsoever with all the chances given.
From a different perspective, a real time of 13.9 seconds on average, considering I/Os and eventually elapsed-time pieces from other processes, implies that the update period specified in Crontab should not be around 15 seconds. Otherwise, the ARM platform would be overloaded with such a use of its operational resources. In addition to that, the constant processing overload could shorten the system’s lifetime and also drain much more energy, which goes against the IoT principle of the energy economy.
6.3.Remote metering supervision
The remote, automatic metering was achieved by applying SVM through the computer-vision software. The task scheduler used to invoke the software was Crontab, and the update time set up within it was one minute.
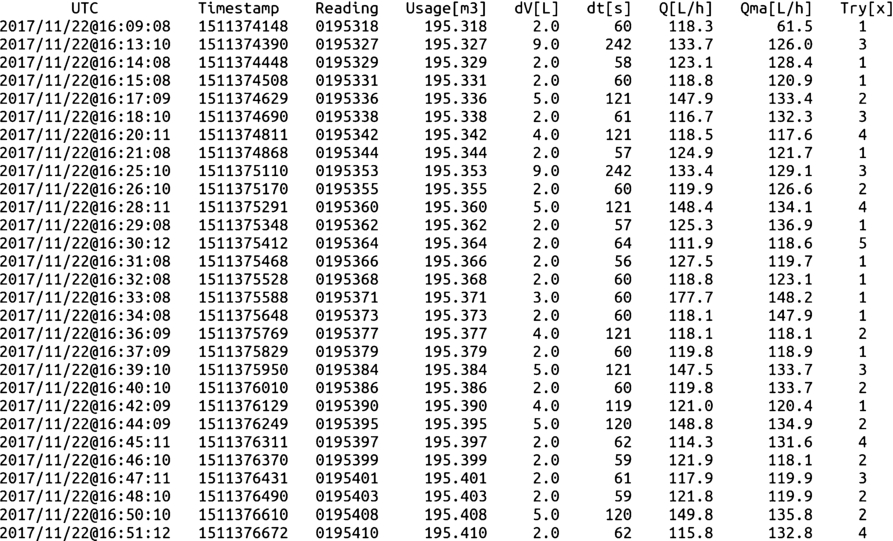
A small sample of the history file used to keep track of all the successful metering performed by the computer-vision machine is introduced in Fig. 17. The metering metrics shown can be accessed online for water-consumption supervision by the user. Additionally, the web page in Fig. 2 is also used for remote supervision.
It is worth mentioning that, as designed to do, the software did not collect any repeated metering value. Just unique metering values were input in the history file.
Fig. 17.
Small sample of metering metrics from the consumption history file.
6.4.Experiment data analysis
In the experiment conducted for 26.3 hours, the software application was able to gather a space sample of 773 metering values and derivatives. That means, at each successful and unique water-consumption metering, besides reading the momentary consumption in the water meter, the software would also store the time variation
Table 3
Statistics measurements of the experiment space sample
| 4.49 | 2.04 | 128.65 | 128.09 | 2.42 | |
| 2 | 1.03 | 121 | 128 | 2 | |
| 2 | 1 | 118 | 118 | 1 | |
| s | 6.31 | 2.83 | 25.84 | 15.49 | 1.41 |
| min | 1 | 0.93 | 15 | 58 | 1 |
| max | 141 | 63.93 | 593 | 360 | 5 |
To better understand how the software application behaved in the experiment and support the statistics and likelihood behind its performance and functionality, the data analysis is broken down into four sections: 1) water usage, 2) volume and time variation, 3) flow estimation, and 4) number of metering attempts.
6.4.1.Water usage
The water usage was supposed to be 144 L per h in the test bench, which was its pump highest flow charge delivered in normal conditions. In counterpart, employing a linear regression upon the water-consumption scatter over time, Fig. 18 shows that the flow consumption was actually about 131.8 L/h. That reveals a relative error of 8.5%, which could be explained by the heating of the pump’s motor over time. That might have diminished the flow charge delivered to the pipes. Despite that, assuming that there could have been an error of such dimension, the computer-vision machine detected the flow in the pipes reasonably well.
Fig. 18.
Automatic metering behavior throughout the experiment.
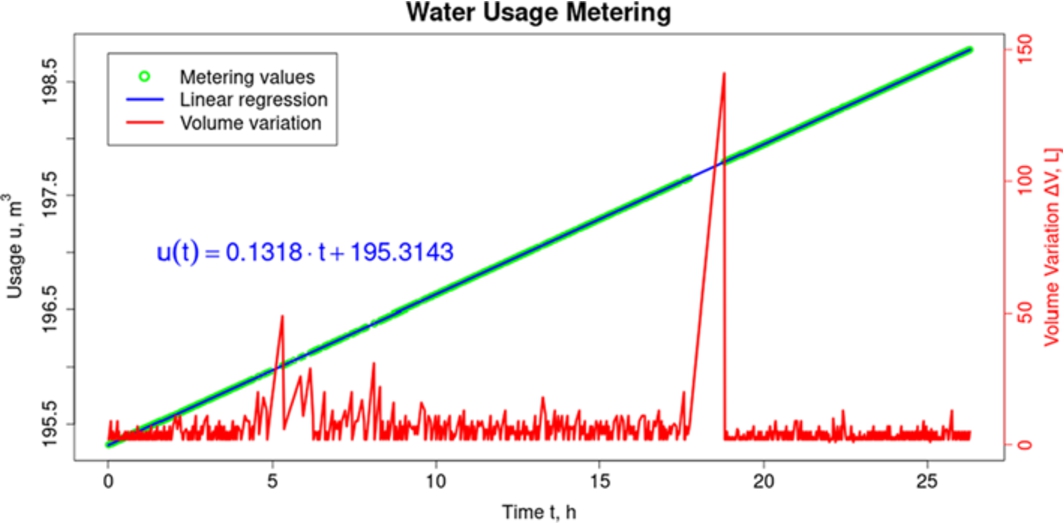
Another finding in Fig. 18 that draws attention is the vast and abrupt change in volume variation
6.4.2.Variations of volume and time
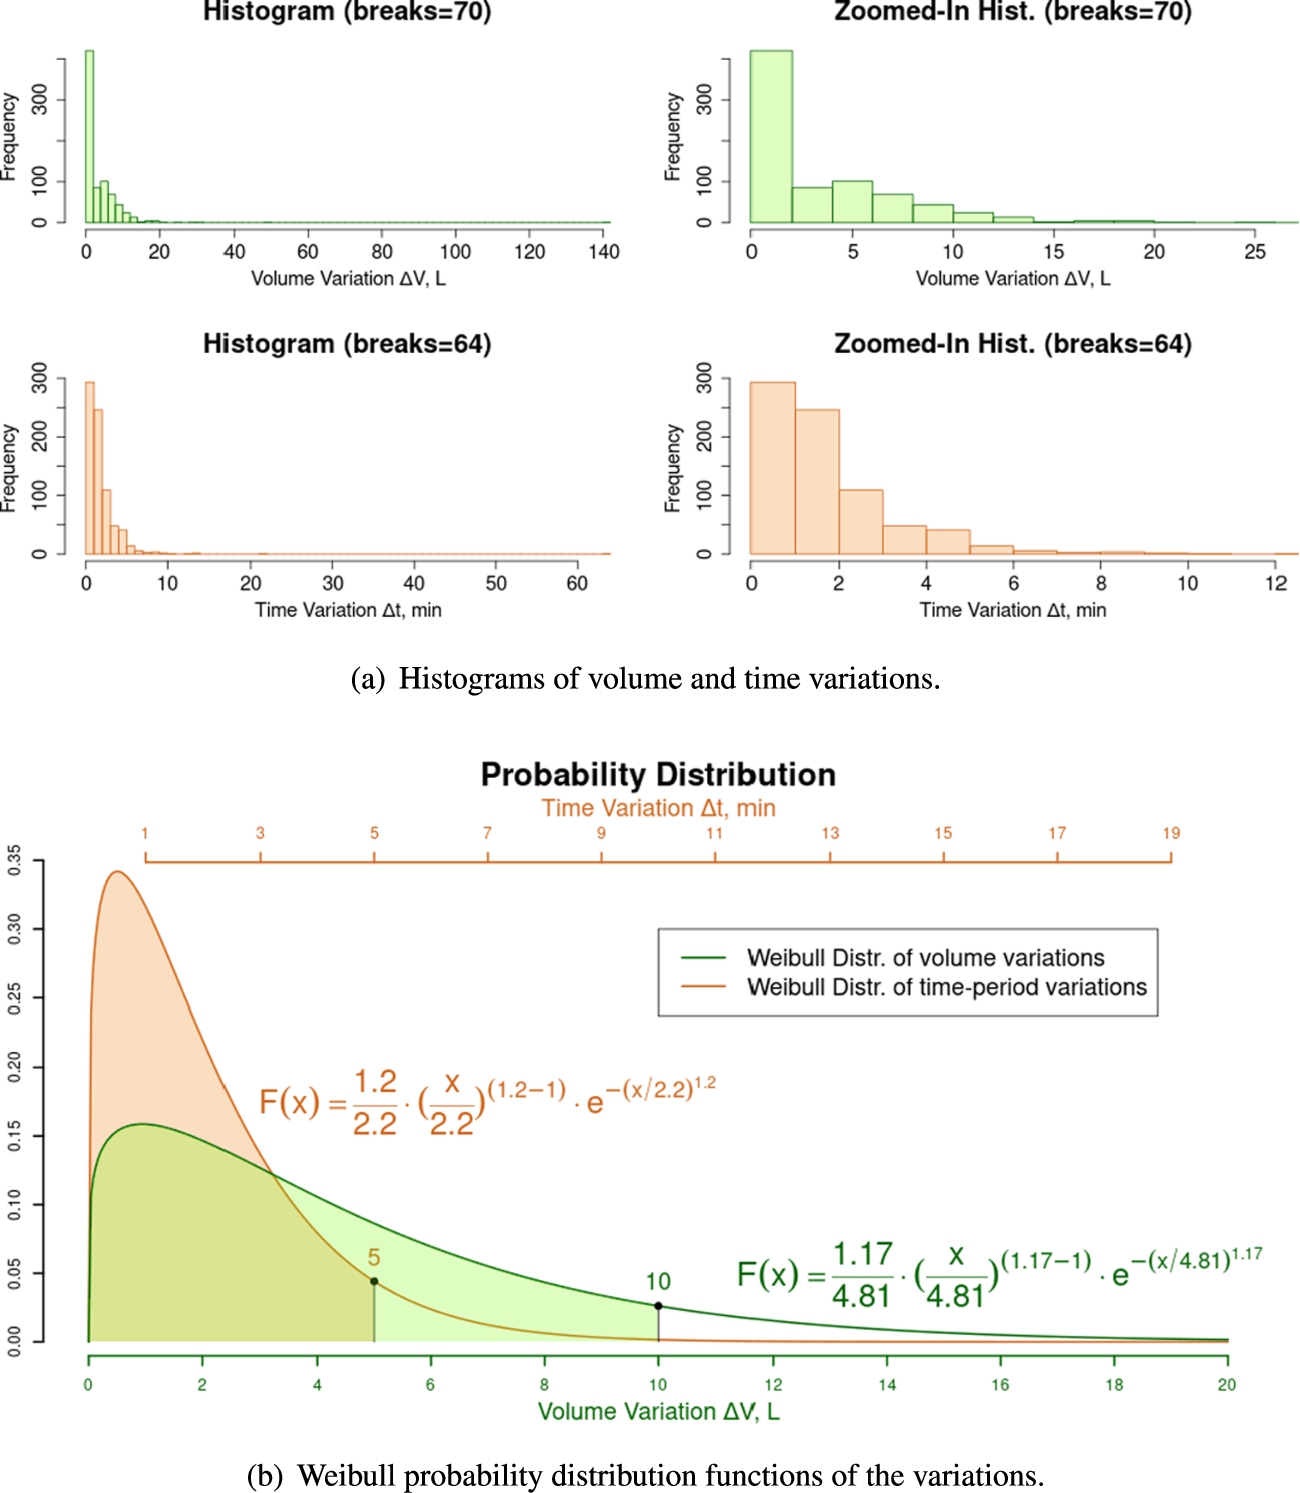
As the computer-vision machine would detect and read unique, new water-consumption values, the amount of volume variation and the time elapsed from one metering to another, respectively
As a matter of fact, by creating a continuous Weibull distribution of the volume and time variations samples as in Fig. 19(b), other inferences were possible to be made. Under the experiment’s constraints, the probability distributions suggest that the computer-vision machine can detect volume and time variations lower than ten liters 90.56% of the time and less than five minutes 93.18% of the time.
Fig. 19.
Statistical analysis of volume and time variations.
6.4.3.Flow estimation
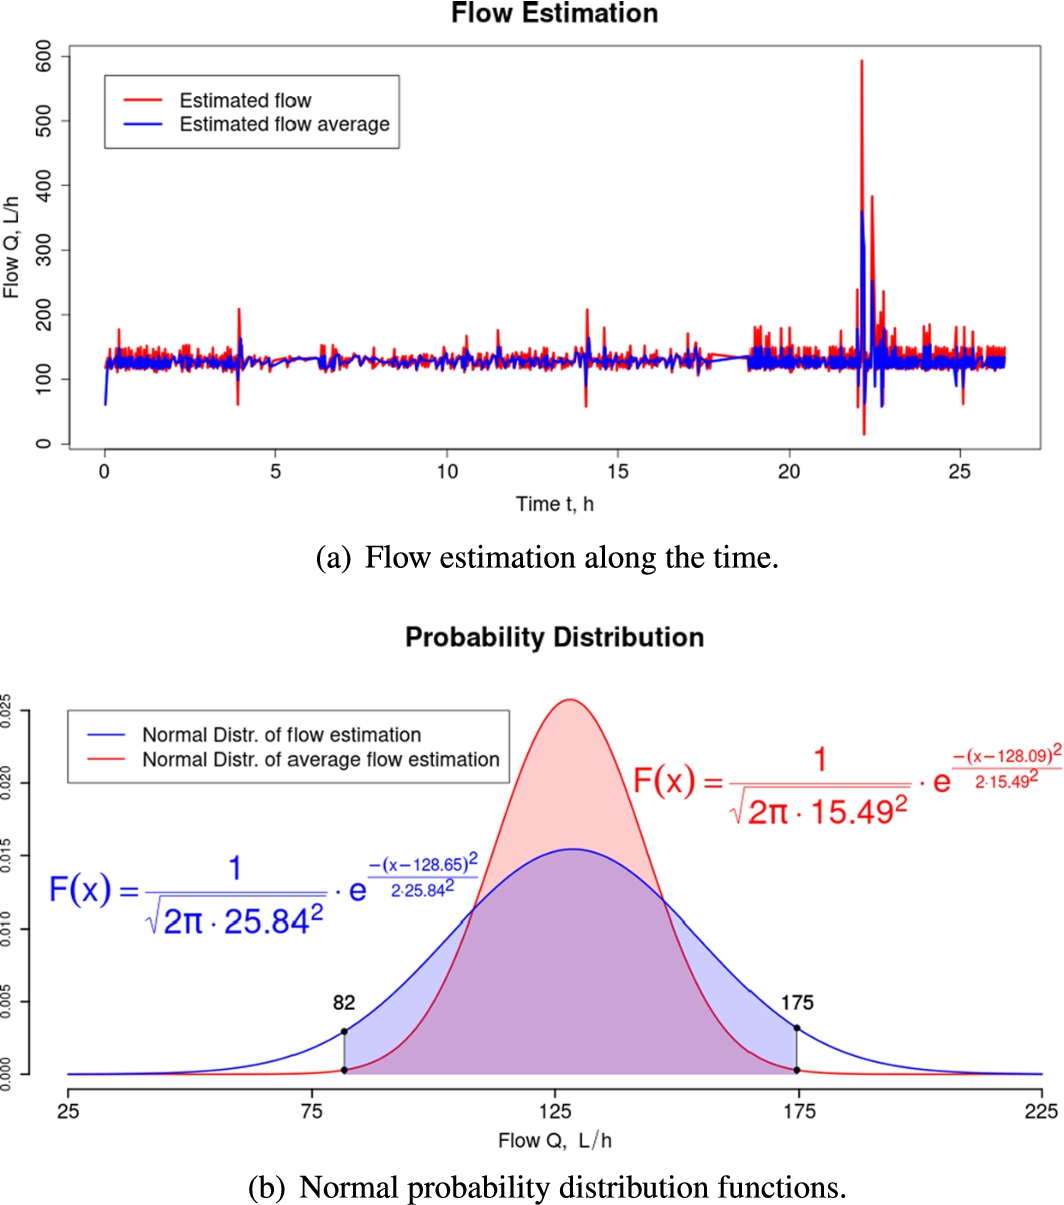
The approach used to estimate the water flow at every successful and unique metering was to divide their respective
The flow estimation within the course of the experiment is displayed in Fig. 20(a). As the hydraulic circuit is expected to have a constant flow of nearly 144 L/h, a few scattering traces of
But the real concern about the digit-recognition performance of the machine-learning model comprises the interval between 22 and 23 h in the time axis, which corresponds to the interval from 198.21 to 198.34 m3 in the usage axis from the linear regression equation
In counterpart, the input moving-average flow values suffered smooth magnitude variations along the experiment as already expected. In fact, as visualized in Fig. 20(b), although
Fig. 20.
Performance of the simple and moving-average flow estimators.
6.4.4.Number of metering attempts
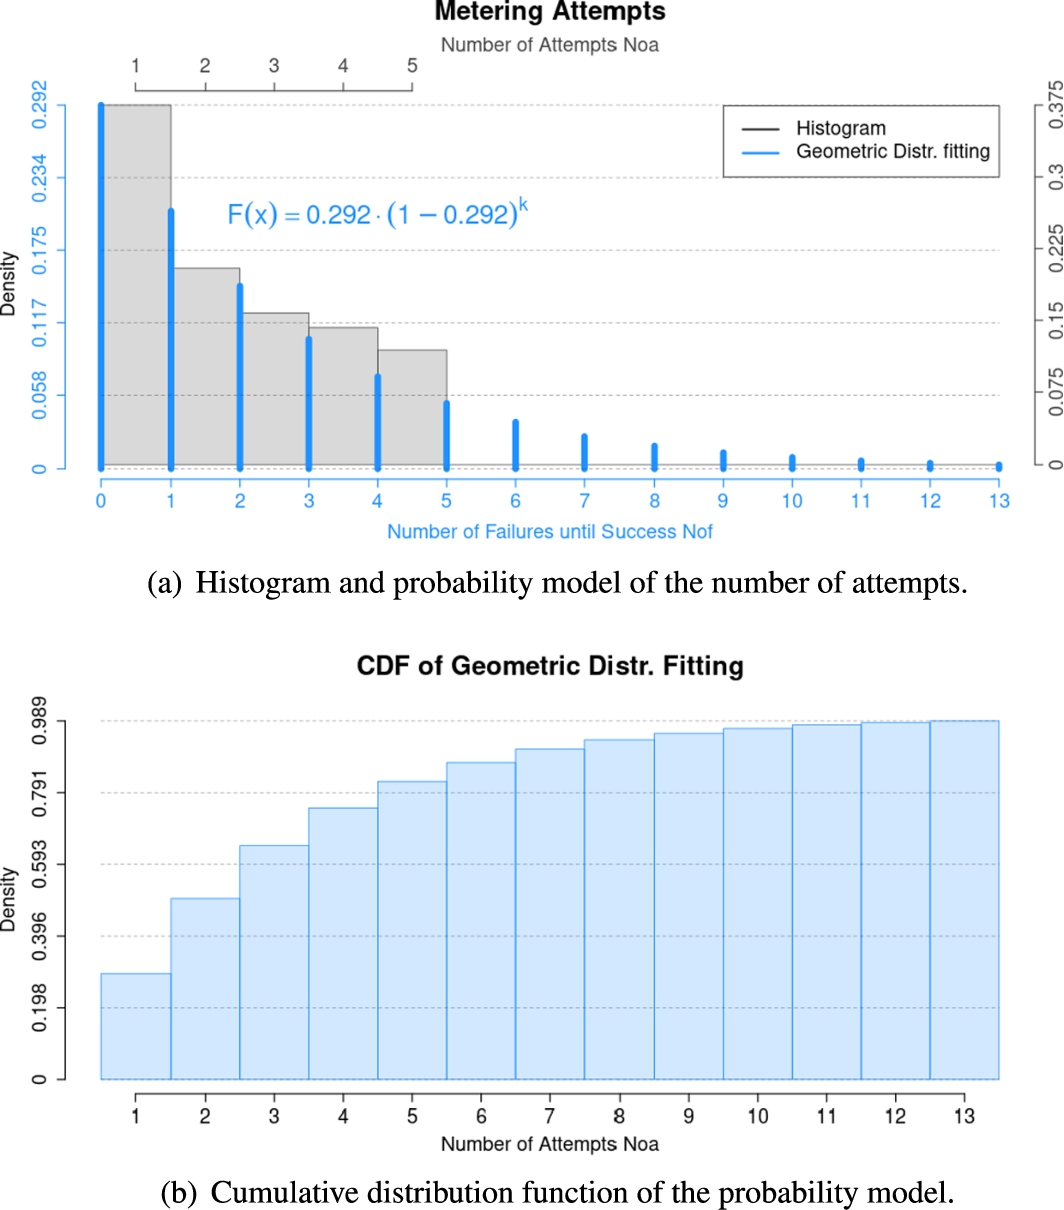
At every call by Crontab, the number of attempts the software had to take to find all the digits in the picture of the water meter was recorded. Such number (
A histogram of the number of attempts from each of the 773 successful and unique metering values is presented in Fig. 21(a). From the histogram, it is perceived that the software accomplished the complete detection of digits with no failure (at the first time) only 35.7% of the time. The remaining part of the histogram appears to be arranged in a geometric-progression pattern.
As the software has the same probability of full-detection success from trial to trial, the histogram of the scatter of the number of attempts was modeled with a Geometric distribution function (Fig. 21(a)). This way, it turned possible to study the computer-vision machine’s number of attempet in an extended range. Figure 21(b) highlights that, if the only constraint changed in the experiment was
From another perspective, the light was off for 64 minutes. Subtracting this period from the experiment’s total time, the computer-vision system acquired 773 metering values, whereas it should have done 1514 ideally – with a call scheduled every one minute. Therefore, the solution designed roughly collects metering values 50% of the time.
Fig. 21.
Analysis of the set of the number of attempts and its geometric distribution.
7.Conclusion
This work presents a new automation architecture for analog metering digitalization through computer vision. The elaborated method recognizes the digits of an analog water meter to obtain a momentary water consumption data through Optical Character Recognition (OCR), in addition to estimating the water flow in the instrument and making the supervision process available online, remotely.
Primarily, the detection of the digits was performed in two steps. First, the image was aligned by correcting its skew angle with Hough Transform, and the water meter display and usage counter were found based on its circular and rectangular shapes, respectively. Second, edges were detected in the rectangular usage counter by Canny, and the desired digits were filtered based on the contours and specific rules of proportion and distances with regard to the digits’ dimensions, yielding the digits’ coordinates. By means of such coordinates, the desired digits were snipped and isolated.
The digit snippets were grouped into a set of 5,000 samples to drive the process of machine learning with the classifiers Support Vector Machine (SVM), implemented in a “one-against-one” approach, k-Nearest Neighbor (kNN), and Multi-Layer Perceptron (MLP). After training and cross-validating the three machine-learning models, their recognition success rates revealed that the SVM model produced the lowest recognition error rate (0.6%), whereas kNN and MLP models were respectively the second and third lowest. Furthermore, as far as the execution time of the software, SVM model took the shortest period (nine seconds), followed by MLP and then kNN, which took the 12.2 seconds on average – the longest as expected due to its computational complexity. Because of SVM model’s outstanding performance in both recognition success rate and software runtime, it was chosen to carry out the OCR in the software.
As the metering values were acquired, it was found that the artificial vision functioned relatively well under certain conditions. With adequate light inside the laboratory and a semi-transparent plastic material around the webcam, used to avoid light reflection on the water-meter display, the detection of the digits was found to be angle-invariant from the camera position within a certain distance.
From an experiment whose duration was longer than 24 hours, with a metering execution scheduled for every one minute, it was possible to derive some important information with respect to the computer-vision machine’s metering ability and capability. Under the constraints already mentioned, it can detect the flow in the test bench’s pipes with a negative, relative error of 8.5%, arguably shorter, with the best flow estimation done by a moving-average estimator, where 99.7% of the time the detected flow lies between
Thus, the proposed architecture and method were validated for analog water meters, obtaining outstanding results in the metering digitalization. The used method could also be replicated for the metering automation of gas and electric meters and carries the potential to be utilized in a metering-automation solution kit to handle the mentioned kinds of meter instruments with either analog or digital display.
The created solution at this point, though, can already deploy the Internet of water meters by publishing metering data into a cloud server for further processing, aiming for some predictive analysis and the consumption management of the finite resource. This way, possible leakage could be detected and better use could be achieved, avoiding waste and improving the resource-distribution service.
Future investigation may concentrate in two aspects: automate the metering of other water-meter models used by the Water Supply Company of Brasilia, Brazil (CAESB), realizing the machine-learning process according to the methodology elaborated; and propose and implement a method of predictive analysis based on the metering data stored on the cloud, perhaps utilizing IBM Watson for this purpose.
The automated metering of the analog water meter, performed by the computer-vision machine in the test bench, can be accessed through the following URL:http://medicaohidrometro.alvarestech.com. The outcome of this framework allowed the validation of the proposed architecture and method using non-invasive and low-budget metering automation, requiring no replacement of the water meter and utilizing a Raspberry-Pi board with Arch Linux and OpenCV.
Acknowledgements
The authors would like to thank the financial support of the Brazilian government agencies CAPES, CNPq, and FAPDF.
References
[1] | F. Aguirre, A. Silvestris, J. Alemany and F. Magnago, A low cost smart metering infrastructure with centralized demand response management, in: 2015 IEEE PES Innovative Smart Grid Technologies Latin America (ISGT LATAM), (2015) , pp. 520–524. doi:10.1109/ISGT-LA.2015.7381209. |
[2] | V. Alcácer and V. Cruz-Machado, Scanning the Industry 4.0: A Literature Review on Technologies for Manufacturing Systems, Engineering Science and Technology, An International Journal, (2019) . http://www.sciencedirect.com/science/article/pii/S2215098618317750. doi:10.1016/j.jestch.2019.01.006. |
[3] | V. Alcacer and V.C. Machado, Scanning the Industry 4.0: A Literature Review on Technologies for Manufacturing Systems, Engineering Science and Technology, An International Journal, (2019) . http://www.sciencedirect.com/science/article/pii/S2215098618317750. doi:10.1016/j.jestch.2019.01.006. |
[4] | E. Auerswald, Seven Segment Optical Character Recognition, Acesso Em: 11, (2017) . https://www.unix-ag.uni-kl.de/~auerswal/ssocr/. |
[5] | K.S. Bae, K.K. Kim, Y.G. Chung and W.P. Yu, Character recognition system for cellular phone with camera, in: 29th Annual International Computer Software and Applications Conference (COMPSAC’05), Vol. 1: , (2005) , pp. 539–544. ISSN 0730–3157. doi:10.1109/COMPSAC.2005.55. |
[6] | A. Bahmanyar, S. Jamali, A. Estebsari, E. Pons, E. Bompard, E. Patti and A. Acquaviva, Emerging smart meters in electrical distribution systems: Opportunities and challenges, in: 2016 24th Iranian Conference on Electrical Engineering (ICEE), (2016) , pp. 1082–1087. doi:10.1109/IranianCEE.2016.7585682. |
[7] | L. Barbierato, A. Estebsari, E. Pons, M. Pau, F. Salassa, M. Ghirardi and E. Patti, A distributed IoT infrastructure to test and deploy real-time demand response in smart grids, IEEE Internet of Things Journal 6: (1) ((2019) ), 1136–1146. doi:10.1109/JIOT.2018.2867511. |
[8] | M. Cerman, G. Shalunts and D. Albertini, A mobile recofnition system for analog energy meter scanning, in: Advances in Visual Computing – 12th International Symposium, ISVC 2016, Proceedings, Part I, December 12–14, 2016, Las Vegas, NV, USA, (2016) , pp. 247–256. doi:10.1007/978-3-319-50835-1_60. |
[9] | C. Chen, C. Chen, C. Hsia and G. Wu, Big data collection gateway for vision-based smart meter reading network, in: 2014 IEEE International Congress on Big Data, (2014) , pp. 266–269, ISSN 2379-7703. doi:10.1109/BigData.Congress.2014.47. |
[10] | M. Chouiten and P. Schaeffer, Vision based mobile gas-meter reading, in: Scientific Cooperations International Workshops on Electrical and Computer Engineering Subfields, (2014) , pp. 94–97. |
[11] | L. Cui, S. Yang, F. Chen, Z. Ming, N. Lu and J. Qin, A survey on application of machine learning for Internet of things, International Journal of Machine Learning and Cybernetics 9: (8) ((2018) ), 1399–1417. doi:10.1007/s13042-018-0834-5. |
[12] | L.R.V. da Silva, J.H. da Silva Neto and L.P.V. da Silva, Hidrômetro Digital com Transmissão de Dados Através de Redes sem Fio, INPI, Brazil, 2011, INPI PI 1101278-1. |
[13] | M. de Melo Costa and S.T.H. Simioni, Hidrômetro Automatizado, INPI, Brazil, 2009, INPI PI 0901651-1. |
[14] | J.A. Finlay, R.E. Dyer and W.D. Kessler, Remote meter reading system using electric power lines, Google Patents, 1974, Patent 3,914,757, https://patents.google.com/patent/US3914757A/en. |
[15] | T. Flick and J. Morehouse, Chapter 1 – smart grid: What is it? in: Securing the Smart Grid, T. Flick and J. Morehouse, eds, Syngress, Boston, (2011) , pp. 1–18. http://www.sciencedirect.com/science/article/pii/B9781597495707000017. ISBN 978-1-59749-570-7. doi:10.1016/B978-1-59749-570-7.00001-7. |
[16] | K. Fong, Synchronous power communicating, Google Patents, 1974, US Patent 3,973,240, https://patents.google.com/patent/US3973240A/en. |
[17] | I. Gallo, A. Zamberletti and L. Noce, Robust angle invariant GAS meter reading, in: 2015 International Conference on Digital Image Computing: Techniques and Applications (DICTA), IEEE, (2015) . doi:10.1109/dicta.2015.7371300. |
[18] | A. Humayed, J. Lin, F. Li and B. Luo, Cyber-physical systems security – a survey, IEEE Internet of Things Journal 4: (6) ((2017) ), 1802–1831. doi:10.1109/JIOT.2017.2703172. |
[19] | N.H. Jagoda, K. Kubierschky, J. Adrian and G. Roy, Synchronous power communicating, Google Patents, 1976, Patent 4,455,453, https://patents.google.com/patent/US4012734A/en. |
[20] | M. Kompf, OpenCV practice: OCR for the electricity meter, Acesso em 11 (2017), https://www.mkompf.com/cplus/emeocv.html. |
[21] | Y. LeCun, Y. Bengio and G. Hinton, Deep learning, Nature 521: (7553) ((2015) ), 436–444, Insight. doi:10.1038/nature14539. |
[22] | M. LeMay, R. Nelli, G. Gross and C.A. Gunter, An integrated architecture for demand response communications and control, in: Proceedings of the 41st Annual Hawaii International Conference on System Sciences (HICSS 2008), (2008) , pp. 174–174. ISSN 1530-1605. doi:10.1109/HICSS.2008.60. |
[23] | J. Lianwen, S. Zenghui and L. Canjie, Digital display instrument reading identification method based on convolutional neural network, Google Patents, 2018, China Patent CN108830271A, https://patents.google.com/patent/CN108830271A/e. |
[24] | D. Mashima and W.P. Chen, Residential demand response system framework leveraging IoT devices, in: 2016 IEEE International Conference on Smart Grid Communications (SmartGridComm), (2016) , pp. 514–520. doi:10.1109/SmartGridComm.2016.7778813. |
[25] | M.A. Mengistu, A.A. Girmay, C. Camarda, A. Acquaviva and E. Patti, A Cloud-based On-line Disaggregation Algorithm for Home Appliance Loads, IEEE Transactions on Smart Grid (2018), 1–1. doi:10.1109/TSG.2018.2826844. |
[26] | D.M. Oliveira, R.d.S. Cruz and K. Bensebaa, Automatic numeric characters recognition of kilowatt-hour meter, in: 2009 Fifth International Conference on Signal Image Technology and Internet Based Systems, (2009) , pp. 107–111. doi:10.1109/SITIS.2009.27. |
[27] | T.G. Paraskevakos and W.T. Bushma, Apparatus and method for remote sensor monitoring, metering and control, Google Patents, 1979, US Patent 4,241,237, https://patents.google.com/patent/US4241237A/en. |
[28] | T.G. Paraskevakos and W.T. Bushma, Apparatus and method for remote sensor monitoring, metering and control, Google Patents, 1980, Patent 4,455,453, https://patents.google.com/patent/US4241237A/en. |
[29] | N.G. Paterakis, O. Erdinç, A.G. Bakirtzis and J.P.S. Catalão, Optimal household appliances scheduling under day-ahead pricing and load-shaping demand response strategies, IEEE Transactions on Industrial Informatics 11: (6) ((2015) ), 1509–1519. doi:10.1109/TII.2015.2438534. |
[30] | E. Patti, A.L.A. Syrri, M. Jahn, P. Mancarella, A. Acquaviva and E. Macii, Distributed software infrastructure for general purpose services in smart grid, IEEE Transactions on Smart Grid 7: (2) ((2016) ), 1156–1163. doi:10.1109/TSG.2014.2375197. |
[31] | W. Polillo, Remote meter reading device having binary coding of meter reading, Google Patents, 1967, Patent 3,492,649, https://patents.google.com/patent/US3492649A/en. |
[32] | H. Puttnies, V. Altmann, F. Golatowski and D. Timmermann, Cost-efficient universal approach for remote meter reading using web services and computer vision, in: IEEE 16th International Symposium on a World of Wireless, Mobile and Multimedia Networks (WoWMoM) 2015, IEEE, (2015) . doi:10.1109/wowmom.2015.7158205. |
[33] | Z. Shuang, Novel water, electricity and gas automatic meter reading device, Google Patents, 2017, China Patent CN107767645A, https://patents.google.com/patent/CN107767645A/en. |
[34] | Sistema de Telemetria para Hidrômetros e Medidores Aquisição de Dados Móvel e Fixa por Rádio Frequência. http://www.ciasey.com.br/materiais/hidrometros-telemetria/sistema-de-telemetria.pdf. |
[35] | R. Smith, An overview of the tesseract OCR engine, in: Ninth International Conference on Document Analysis and Recognition (ICDAR 2007), Vol. 2: , (2007) , pp. 629–633, ISSN 1520-5363. doi:10.1109/ICDAR.2007.4376991. |
[36] | A. Spalti, System for interrogating remote stations via power lines of an electrical distribution network, Google Patents, 1963, Patent 3,445,814, https://patents.google.com/patent/US3445814A/en. |
[37] | V. Stewart, Multi-signal encoder and transponder, Google Patents, 1972, US Patent 3,829,835, https://patents.google.com/patent/US3829835A/en. |
[38] | Q. Sun, H. Li, Z. Ma, C. Wang, J. Campillo, Q. Zhang, F. Wallin and J. Guo, A comprehensive review of smart energy meters in intelligent energy networks, IEEE Internet of Things Journal 3: (4) ((2016) ), 464–479. doi:10.1109/JIOT.2015.2512325. |
[39] | Q. Sun, H. Li, Z. Ma, C. Wang, J. Campillo, Q. Zhang, F. Wallin and J. Guo, A comprehensive review of smart energy meters in intelligent energy networks, IEEE Internet of Things Journal 3: (4) ((2016) ), 464–479. doi:10.1109/JIOT.2015.2512325. |
[40] | Q. Sun, H. Li, Z. Ma, C. Wang, J. Campillo, Q. Zhang, F. Wallin and J. Guo, A comprehensive review of smart energy meters in intelligent energy networks, IEEE Internet of Things Journal 3: (4) ((2016) ), 464–479. doi:10.1109/JIOT.2015.2512325. |
[41] | A.P. Tafti, A. Baghaie, M. Assefi, H.R. Arabnia, Z. Yu and P. Peissig, OCR as a service: An experimental evaluation of Google docs OCR, tesseract, ABBYY FineReader, and transym, in: Advances in Visual Computing – 12th International Symposium, ISVC 2016, Proceedings, Part I, December 12–14, 2016, Las Vegas, NV, USA, (2016) , pp. 735–746. doi:10.1007/978-3-319-50835-1_60. |
[42] | H. Tram, Advanced metering infrastructure as an enabler of demand response, in: IEEE PES T D 2010, (2010) , pp. 1–1, ISSN 2160-8555. doi:10.1109/TDC.2010.5484328. |
[43] | M. Vanetti, I. Gallo and A. Nodari, GAS meter reading from real world images using a multi-net system, Pattern Recognition Letters 34: (5) ((2013) ), 519–526. http://www.sciencedirect.com/science/article/pii/S0167865512003832. doi:10.1016/j.patrec.2012.11.014. |
[44] | L. Vercellotti, J. Cricchi, J. Britton and L. Ottobre, Solid state remote meter reading system having non-volatile data accumulation, Google Patents, 1972, Patent 3,820,073, https://patents.google.com/patent/US3820073A/en. |
[45] | V. Vukadinovic, I. Glaropoulos and S. Mangold, Enhanced power saving mode for low-latency communication in multi-hop 802.11 networks, Ad Hoc Networks 23: ((2014) ), 18–33. http://www.sciencedirect.com/science/article/pii/S1570870514001127. doi:10.1016/j.adhoc.2014.06.001. |
[46] | G.J. Wensley, Remote automatic reading system, Google Patents, 1975, US Patent 4,008,458, https://patents.google.com/patent/US4008458A/en. |
[47] | K. Xie, Automatic Utility Meter Reading, University of Shanghai for Science and Technology, (2007) . |
[48] | Z. Yuhong, Z. Yun Qian and X. Yongg, A kind of intelligent meter data recording system and intelligent meter reading robot, Google Patents, 2018, China Patent CN208271375UA, https://patents.google.com/patent/CN208271375U/en. |
[49] | S. Zhao, B. Li, J. Yuan and G. Cui, Research on remote meter automatic reading based on computer vision, in: 2005 IEEE/PES Transmission Distribution Conference Exposition, Asia and Pacific, (2005) , pp. 1–4, ISSN 2160-8636. doi:10.1109/TDC.2005.1546972. |


