
Mitochondria-Related Candidate Genes and Diagnostic Model to Predict Late-Onset Alzheimer’s Disease and Mild Cognitive Impairment
Abstract
Background:
Late-onset Alzheimer’s disease (LOAD) is the most common type of dementia, but its pathogenesis remains unclear, and there is a lack of simple and convenient early diagnostic markers to predict the occurrence.
Objective:
Our study aimed to identify diagnostic candidate genes to predict LOAD by machine learning methods.
Methods:
Three publicly available datasets from the Gene Expression Omnibus (GEO) database containing peripheral blood gene expression data for LOAD, mild cognitive impairment (MCI), and controls (CN) were downloaded. Differential expression analysis, the least absolute shrinkage and selection operator (LASSO), and support vector machine recursive feature elimination (SVM-RFE) were used to identify LOAD diagnostic candidate genes. These candidate genes were then validated in the validation group and clinical samples, and a LOAD prediction model was established.
Results:
LASSO and SVM-RFE analyses identified 3 mitochondria-related genes (MRGs) as candidate genes, including NDUFA1, NDUFS5, and NDUFB3. In the verification of 3 MRGs, the AUC values showed that NDUFA1, NDUFS5 had better predictability. We also verified the candidate MRGs in MCI groups, the AUC values showed good performance. We then used NDUFA1, NDUFS5 and age to build a LOAD diagnostic model and AUC was 0.723. Results of qRT-PCR experiments with clinical blood samples showed that the three candidate genes were expressed significantly lower in the LOAD and MCI groups when compared to CN.
Conclusion:
Two mitochondrial-related candidate genes, NDUFA1 and NDUFS5, were identified as diagnostic markers for LOAD and MCI. Combining these two candidate genes with age, a LOAD diagnostic prediction model was successfully constructed.
INTRODUCTION
Alzheimer’s disease (AD), the most common form of dementia, is characterized by memory loss and cognitive impairment. Most cases occur after the age of 65, constituting late-onset AD (LOAD), while less than 5% of all cases occur earlier than age 65, which is termed early-onset AD (EOAD) [1]. The current leading hypotheses, the amyloid and tau propagation hypotheses, state that pathological tau and amyloid-β (Aβ) deposits are involved in triggering cascade reactions that occur in the cerebral cortex of patients with AD [2–4]. However, the underlying mechanism remains unclear, and many failures in clinical trials based on Aβ plaques or tau tangles have led to doubt on the hypotheses [5]. In addition to these two mainstream hypotheses, other hypotheses such as the cholinergic [6], mitochondrial cascade and related hypotheses [7–10], synaptic degeneration [11], and inflammatory [12, 13] hypotheses are also important possible explanations for the mechanisms underlying AD.
The onset of AD is insidious [2, 14], and many pathological changes occur before reaching clinical diagnostic criteria [15, 16]. Early detection and treatment of the disease are of great significance for delaying the development of dementia and improving its prognosis. Mild cognitive impairment (MCI) is an important component of predementia. People with MCI have subtle symptoms, such as problems with memory, language, and thinking, and these problems may not interfere with their ability to carry out everyday activities [14]. The cumulative dementia incidence in individuals with MCI older than 65 years who are monitored for two years is 14.9% [17]. Early screening and intervention for MCI is of great significance in the progression of dementia.
The current biological staging model for AD is based on the Aβ-tau-neurodegeneration (ATN) classification system, which assesses three biomarkers: Aβ, tau pathology, and neurodegeneration or neuronal injury [18]. Blood-based markers have emerged as a promising tool for the diagnosis of AD and for improving the design of clinical trials. The Aβ42/Aβ40 ratio and phosphorylated tau have shown potential as blood-based AD biomarkers [19]. However, detecting plasma Aβ and tau presents several challenges, including the expense and slow detection methods such as mass spectrometry and immunoassay, and potential inaccuracies in measurement due to pre-analytical processing and analytical performance [20].
Genetic and genomic analyses are becoming increasingly important in biomedical research because they can reveal the potential modes of action and mechanisms of diseases at the molecular level [21]. At present, there have been some bioinformatics studies on differential gene expression in peripheral blood cells of patients [22–25], including ferroptosis [23] and immune factors [24]. However, most studies have not specifically analyzed gene expression in LOAD, the main subtype of AD.
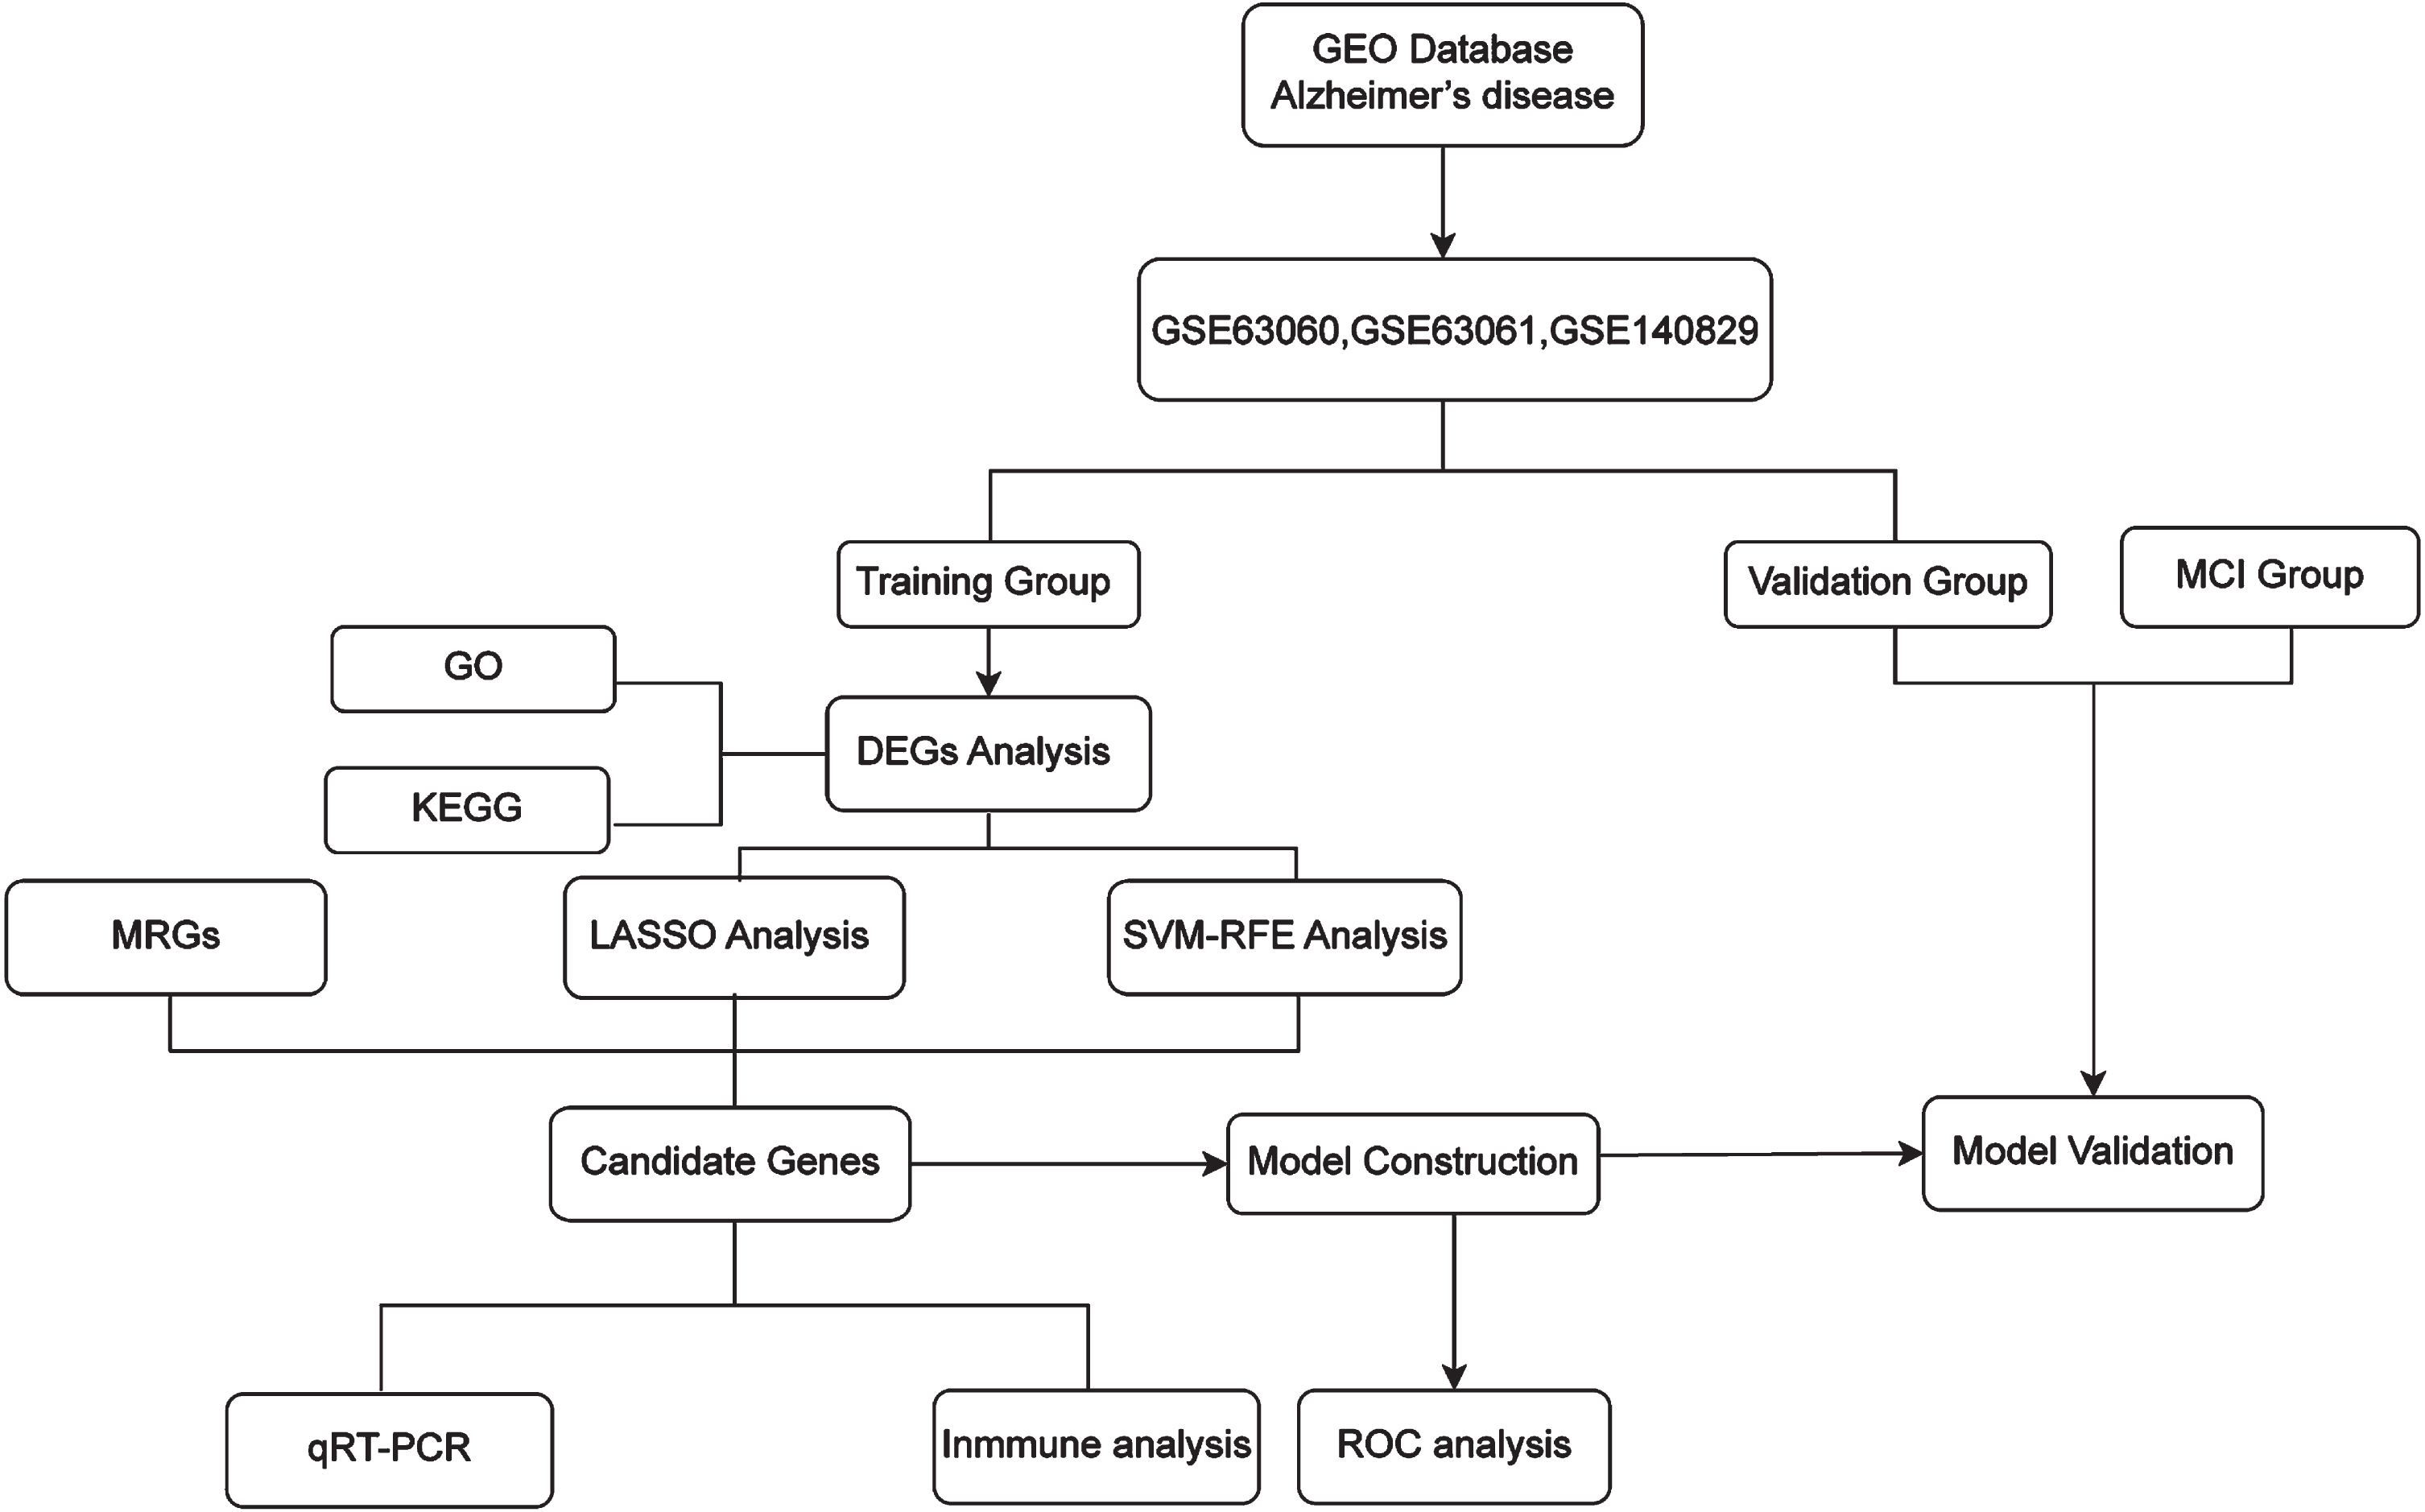
To explore and identify potential biomarkers of LOAD, public datasets GSE63060, GSE63061, and GSE140829 from the National Center for Biotechnology Information (NCBI) Gene Expression Omnibus (GEO) database were used. Using differential expression analysis, least absolute shrinkage selection operator (LASSO), and support vector machine recursive feature elimination (SVM-RFE) analysis, two candidate mitochondria-related genes (MRGs) were identified and used to establish a LOAD prediction model. Gene Ontology (GO) and Kyoto Encyclopedia of Genes and Genomes (KEGG) analyses were used to further investigate biological processes and pathways. Then, the cell-type identification by estimating relative subsets of RNA transcripts (CIBERSORT) algorithm was applied to calculate the immune infiltration of LOAD samples. The workflow of this study is shown in Fig. 1.
Fig. 1
The workflow of the analysis, including data extraction, processing, and analysis.
MATERIALS AND METHODS
Data acquisition
The peripheral blood gene expression data used in this study were obtained from the NCBI GEO database [26]. As LOAD typically occurs after the age of 65, samples from individuals ≤65 years of age were excluded from the analysis. Ultimately, we used three data series for analysis: GSE63060 annotated by GPL6947, which included 134 LOAD samples, 80 MCI samples, and 94 cognitively normal (CN) samples; GSE63061 annotated by GPL10558, which included 133 AD samples, 104 MCI samples, and 131 CN samples; and GSE140829 annotated by GPL15988, which included 168 AD samples, 116 MCI samples, and 229 CN samples. All samples were obtained from individuals over 65 years of age. To perform our analysis, we randomly split the LOAD and CN samples in each data series into 3 : 1 as training and validation groups, respectively. We assigned all 300 MCI samples to the MCI validation group.
The studies involving human participants were reviewed and approved by the Ethics Committee of the Ruijin Hospital affiliated to the Shanghai Jiao Tong University School of Medicine (2018-No.204).
Differential expression analysis
Differential expression analysis of LOAD and CN samples was performed using the “limma” R package [27]. Differentially expressed genes (DEGs) (p_adjust < 0.01) were obtained, volcano plots of the DEGs were created using the “pheatmap” [28] and “ggplot2” R packages.
Bio-functional analysis
To investigate which biological pathways the DEGs in LOAD are involved, we conducted functional enrichment analyses. Using R package “clusterProfile” [29] and “enrichplot” [30] R packages, GO analysis which focuses on three levels including cell component (CC), biological process (BP), and molecular function (MF), and KEGG analysis which is mainly used for pathway enrichment analysis were performed on the DEGs.
LASSO and SVM-RFE analysis
To further identify the diagnostic candidate genes for LOAD from these DEGs, we performed the following two machine learning methods for further screening. LASSO regression analysis was fitted using the “glmnet” package [31], set the “family” parameter as “binomial” and the “alpha” as 1, the cross-validation parameter “nfolds” was adjusted to 10. SVM-FRE is a sequential backward selection algorithm based on the maximum interval principle of SVM. It trains the sample through the model, then sorts the score of each feature, removes the feature with the minimum score, and then trains the model again with the remaining features until selects the required number of features. The SVM-RFE classifiers from R packages “e1071” [32], “kernlab” [33], and “caret” were adopted for the classification analysis of the selected candidate genes in the diagnosis of AD.
Identification of MRG candidates
In this study, MRGs refer to the genes that encode proteins located in any part of the mitochondria including the mitochondrial membrane, stroma, cristae, and mitochondria-associated endoplasmic reticulum. The MitoCarta 3.0 database included 1,136 human mitochondria-located genes [34, 35], and the MRGs list was downloaded for subsequent analysis (Supplementary Table 1).
Immune infiltration and immune-related factors
To evaluate the immune infiltration of LOAD peripheral blood, we applied the CIBERSORT algorithm. CIBERSORT [36] performed deconvolution analysis based on the principle of linear support vector regression, and there were 22 types of immune cells provided, including plasma cell, B cell, T cell, and myeloid cell subpopulations. We used this algorithm to analyze the gene expression data of the training set and calculate the relative proportions of each type of immune cells in each sample. Spearman correlation analysis was used to analyze the correlation between candidate genes and immune cells.
Model construction and evaluation
To assess the ability of candidate genes to distinguish disease states, the receiver operating characteristic curve (ROC) was plotted by “pROC” [37]. ROC could reflect the trend of sensitivity (FPR) and accuracy (TPR) of the model when different thresholds were selected, and the value of the area under the curve (AUC) can be used as an evaluation index. We tested the AUC of candidate genes on the training set data, and subsequently tested them on the MCI and LOAD validation set data. In order to improve the accuracy of disease diagnosis, we combined the two candidate genes with the highest accuracy and age to construct a multi-factor disease prediction model, which was assessed in 3 ways. In addition to the ROC method, calibration curve was plotted to present how close the actual incidence is to the predicted incidence calculated by LOAD prediction nomogram. Considering the impact of false positives and false negatives on patients, the concepts of threshold probability and net benefit are introduced in decision curve analysis (DCA), which was used to assess the benefit of patients using our predictive model in the clinic.
qRT-PCR validation of the candidate genes
Peripheral blood samples of 8 participants who were CN, 8 patients with LOAD, and 10 patients with MCI were acquired for qRT-PCR to verify the expression of candidate genes. Diagnosis was based on NIA-AA Research Framework [14]. Participants were over 65 years old and underwent neuropsychological assessments, including Mini-Mental State Examination (MMSE), Montreal Cognitive Assessment (MoCA), and Clinical Dementia Rating Scale (CDR). Brain magnetic resonance imaging and PET-CT in LOAD and MCI were performed to help diagnose. This study was approved by the Ethics Committee of the Ruijin Hospital affiliated to the Shanghai Jiao Tong University School of Medicine (2018-No.204). The RNAprep Pure Hi-Blood Kit (DP443, TIANGEN) was used to extract total RNA, RNA quality was determined by TGem Plus full-wavelength spectrophotometer (OSE-260-02, TIANGEN), A260/280, A260/230 absorbance ratios of purified RNA between 2.0–2.2, 1.8–2.2 respectively for subsequent experiments. RNA was then reverse-transcribed to cDNA and qRT-PCR was performed with the 2×Hieff® PCR Master Mix (10102ES08; Yeasen). GAPDH was used as an internal reference and the primers used are listed in Table 3. Relative mRNA expression was calculated using the Δ ΔCt method.
Table 3
Primer information
| Primers | Sequence | |
| NDUFA1 | F | ATGTGGTTCGAGATTCTCCCC |
| R | CCTGTGGATGTACGCAGTAGC | |
| NDUFS5 | F | TGCACATGGAATCGGTTATACTC |
| R | CCGAAGCAAACACTCTACGAAAT | |
| NDUFB3 | F | TGCTGTCAGGCAGAAGAACAG |
| R | CTTAGCCCTTTTGCAGCCAG | |
| GAPDH | F | CTGGCCAAGGTCATCCATGAC |
| R | CTTGCCCACAGCCTTGGCAG |
Statistical analyses
The chi-square test was adopted for categorical data (expressed as a percentage), and measurement data were analyzed by t-test (represented by a mean±SEM). A logistic regression algorithm and SVM-RFE were used to construct the prediction model. All statistical analyses were performed using R language software (version 4.2.1) and GraphPad Prism 9. Statistical significance was defined as p < 0.05.
RESULTS
The DEGs in LOAD were related to mitochondria
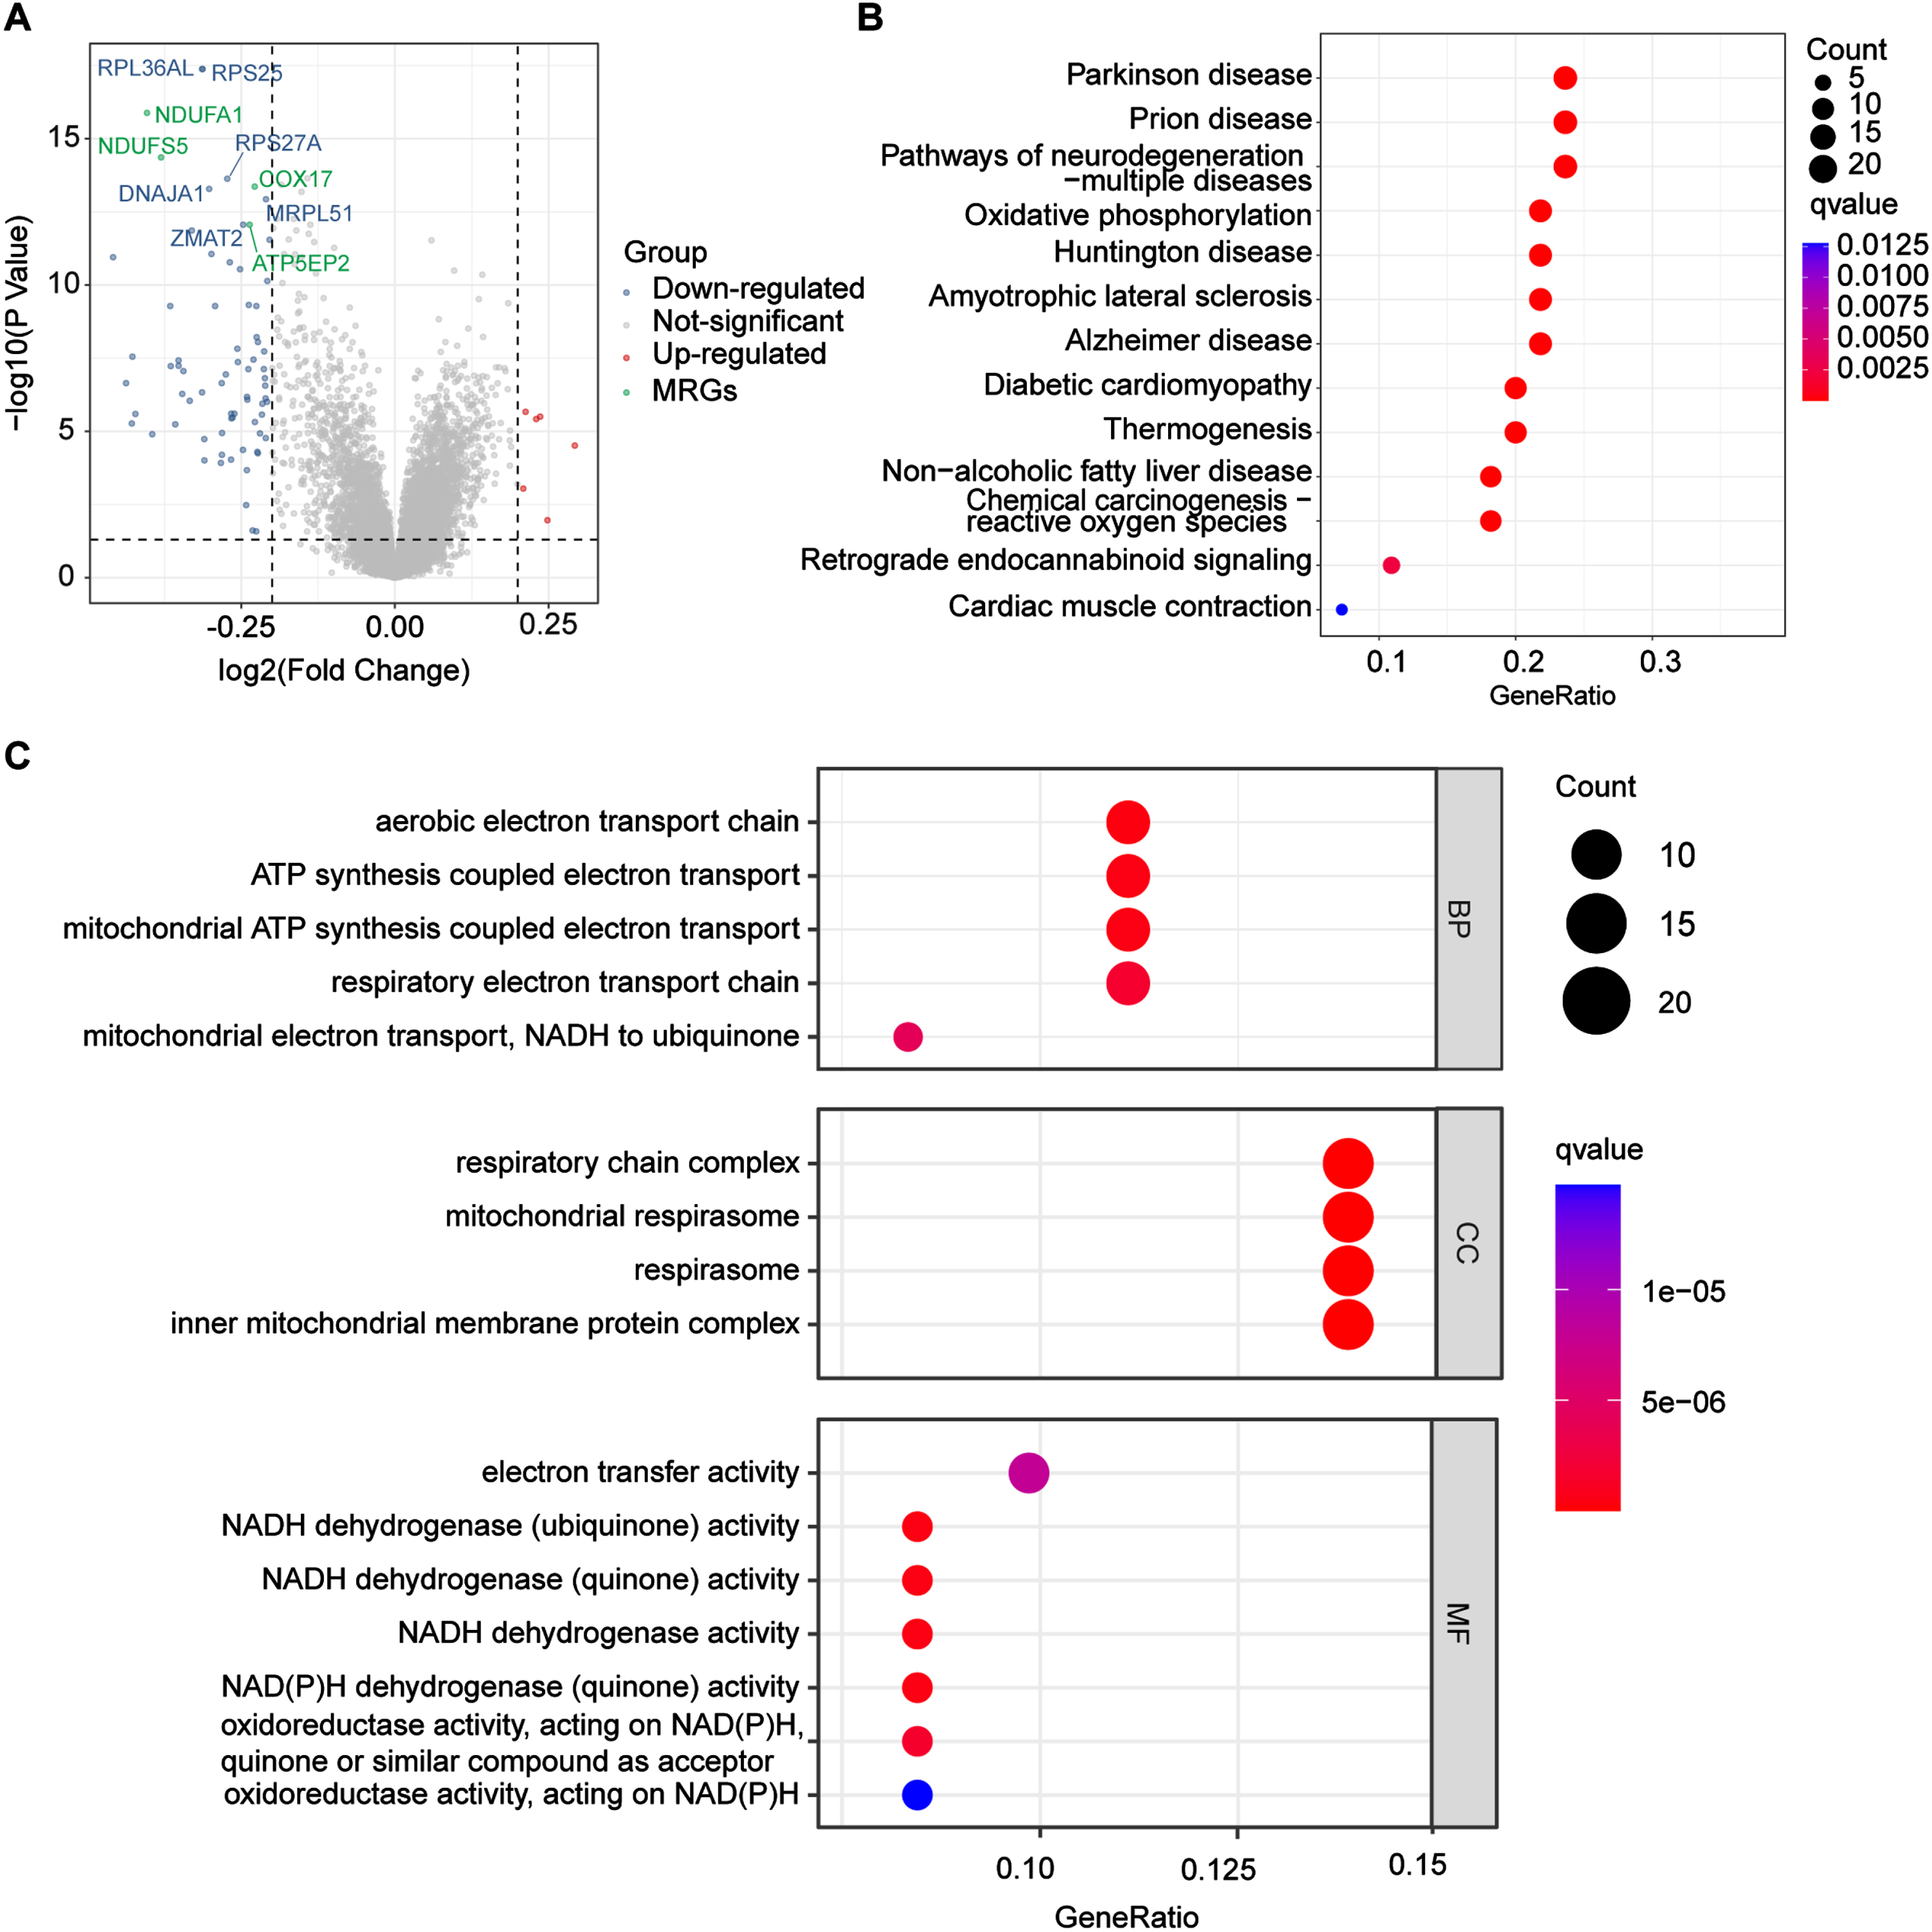
To identify DEGs related to LOAD, we downloaded the GSE63060, GSE63061, and GSE140829 datasets from the NCBI GEO public database, selected samples > 65 years old to match the age of onset of LOAD, and then randomly split each data series into 3 : 1 as training and validation groups. In total, there were 353 people who were CN and 322 patients with LOAD in the training group, and 101 people who were CN and 113 patients with LOAD in the validation group. To explore the biomarkers of LOAD, we first obtained DEGs from training group (p_adjust < 0.01), 78 DEGs were obtained (Supplementary Table 2), and a volcano plot of these DEGs is shown in Fig. 2A. Most of the genes with altered expression were downregulated (blue dots), and interestingly, 40% of the TOP 10 downregulated genes were related to mitochondria (green dots), which suggested that mitochondria-related genes (MRGs) were associated with LOAD.
Fig. 2
Differentially expressed analysis. A) The volcano shows the top 10 genes significantly changed in LOAD groups, red dots and blue dots represent upregulated and downregulated genes in the LOAD group respectively, while green dots represent downregulated mitochondria-related genes in the LOAD group. LOAD, late-onset Alzheimer’s disease. B) TOP 15 enriched KEGG pathways among LOAD DEGs. KEGG, Kyoto Encyclopedia of Genes and Genomes; DEGs, differentially expressed genes. C) TOP 10 enriched GO pathways among LOAD DEGs. Ribosome-related pathways were removed due to low disease specificity. GO, Gene Ontology; BP, biological process, CC, cellular component; MF, molecular function.
Pathway enrichment of DEGs was associated with mitochondrial function
To determine the potential biological roles of the selected DEGs, we performed enrichment analysis. Figure 2B shows the top 15 KEGG pathways (ribosome-related pathways were excluded due to low specificity), in which oxidative phosphorylation pathways changed significantly (q-value<0.0025). The selected DEGs are also involved in disease such as AD, Parkinson’s disease, prion diseases, and multiple neurodegenerative diseases. GO analysis showed that the top 10 pathways changed significantly, and after excluding the ribosome-related pathways, the remaining altered pathways all involved the mitochondria (Fig. 2 C). Target genes were associated with the aerobic electron transport chain (ETC), adenosine triphosphate (ATP) synthesis coupled electron transport in BPs, respiratory chain complex, mitochondrial respirasome, respirasome, and inner mitochondrial membrane protein complex in CCs. In addition, DEGs were involved in MFs such as electron transfer activity and nicotinamide adenine dinucleotide (NADH) dehydrogenase (ubiquinone) activity. Interestingly, the two pathway enrichment analyses both pointed to mitochondrial function changes in LOAD, which indicated that mitochondrial dysfunction played an important role in molecular biological processes of LOAD.
Two MRGs were identified as candidate genes for LOAD and MCI
To screen for the most significant genes that can be used as candidate genes for the diagnosis of LOAD in the selected DEGs, machine learning methods, including feature screening through LASSO regression and SVM-RFE were performed. The results of the LASSO analysis are shown in Fig. 3, which highlighted that the model had minimal cross-validation error when λ = 21, and 21 genes were identified as signature genes in LOAD by LASSO analysis (Fig. 3A, B). Simultaneously, we used the SVM-RFE algorithm to evaluate the characteristic genes, which showed that the model incorporating 31 genes had the best accuracy (Fig. 3 C). Thus, SVM-RFE yielded 31 candidate genes. In addition, 40% of the TOP 10 downregulated genes were related to mitochondria, and two pathway enrichment analyses were involved in mitochondrial function, indicating that there were significant changes in MRGs in LOAD. Based on previous DEGs and enrichment analyses, we decided to focus on MRGs. To define the MRGs from our previous results, 1,136 mitochondria-located genes were downloaded from MitoCarta3.0. We then selected common genes from the LASSO analysis, SVM-RFE analysis, and MRGs. Finally, the common three MRGs, including NDUFA1 (NADH: ubiquinone oxidoreductase subunit A1), NDUFS5 (NADH dehydrogenase (ubiquinone) Fe-S protein 5), and NDUFB3(NADH: ubiquinone oxidoreductase subunit B3) were regarded as candidate genes for the ongoing study (Fig. 3D). The results showed that the LOAD predictive accuracies (AUC values) of the three candidate genes were 0.703 (NDUFA1, Fig. 4A), 0.701 (NDUFS5, Fig. 4B), and 0.594 (NDUFB3, Fig. 4 C) in the training group. NDUFA1 and NDUFS5 had better predictability, but NDUFB3 was not effective. Next, we used the data from the validation group to verify the AUC of the two better-performing candidate genes, the expression of both genes was reduced in LOAD (Fig. 5A, B), and the AUC values of NDUFA1 and NDUFS5 were 0.687 and 0.682 (Fig. 5 C), respectively.
Fig. 3
Selection of diagnostic biomarkers and identification of candidate genes. A, B) The 21 genes that met the diagnostic criteria were determined by LASSO analysis. A) The horizontal axis represents the log value of the gene lambda, and the vertical axis represents the independent gene’s coefficient. LASSO, least absolute shrinkage and selection operator. B) CIs with different values of lambda. C) 31 characteristic genes were identified by SVM-RFE algorithm. The horizontal axis represents the number of genes included, and the vertical axis represents the error of cross validation. SVM-RFE, Support Vector Machine Recursive Feature Elimination. D) Venn diagram of MRGs extracted from LASSO and SVM-RFE methods. MRG, mitochondria-related gene.
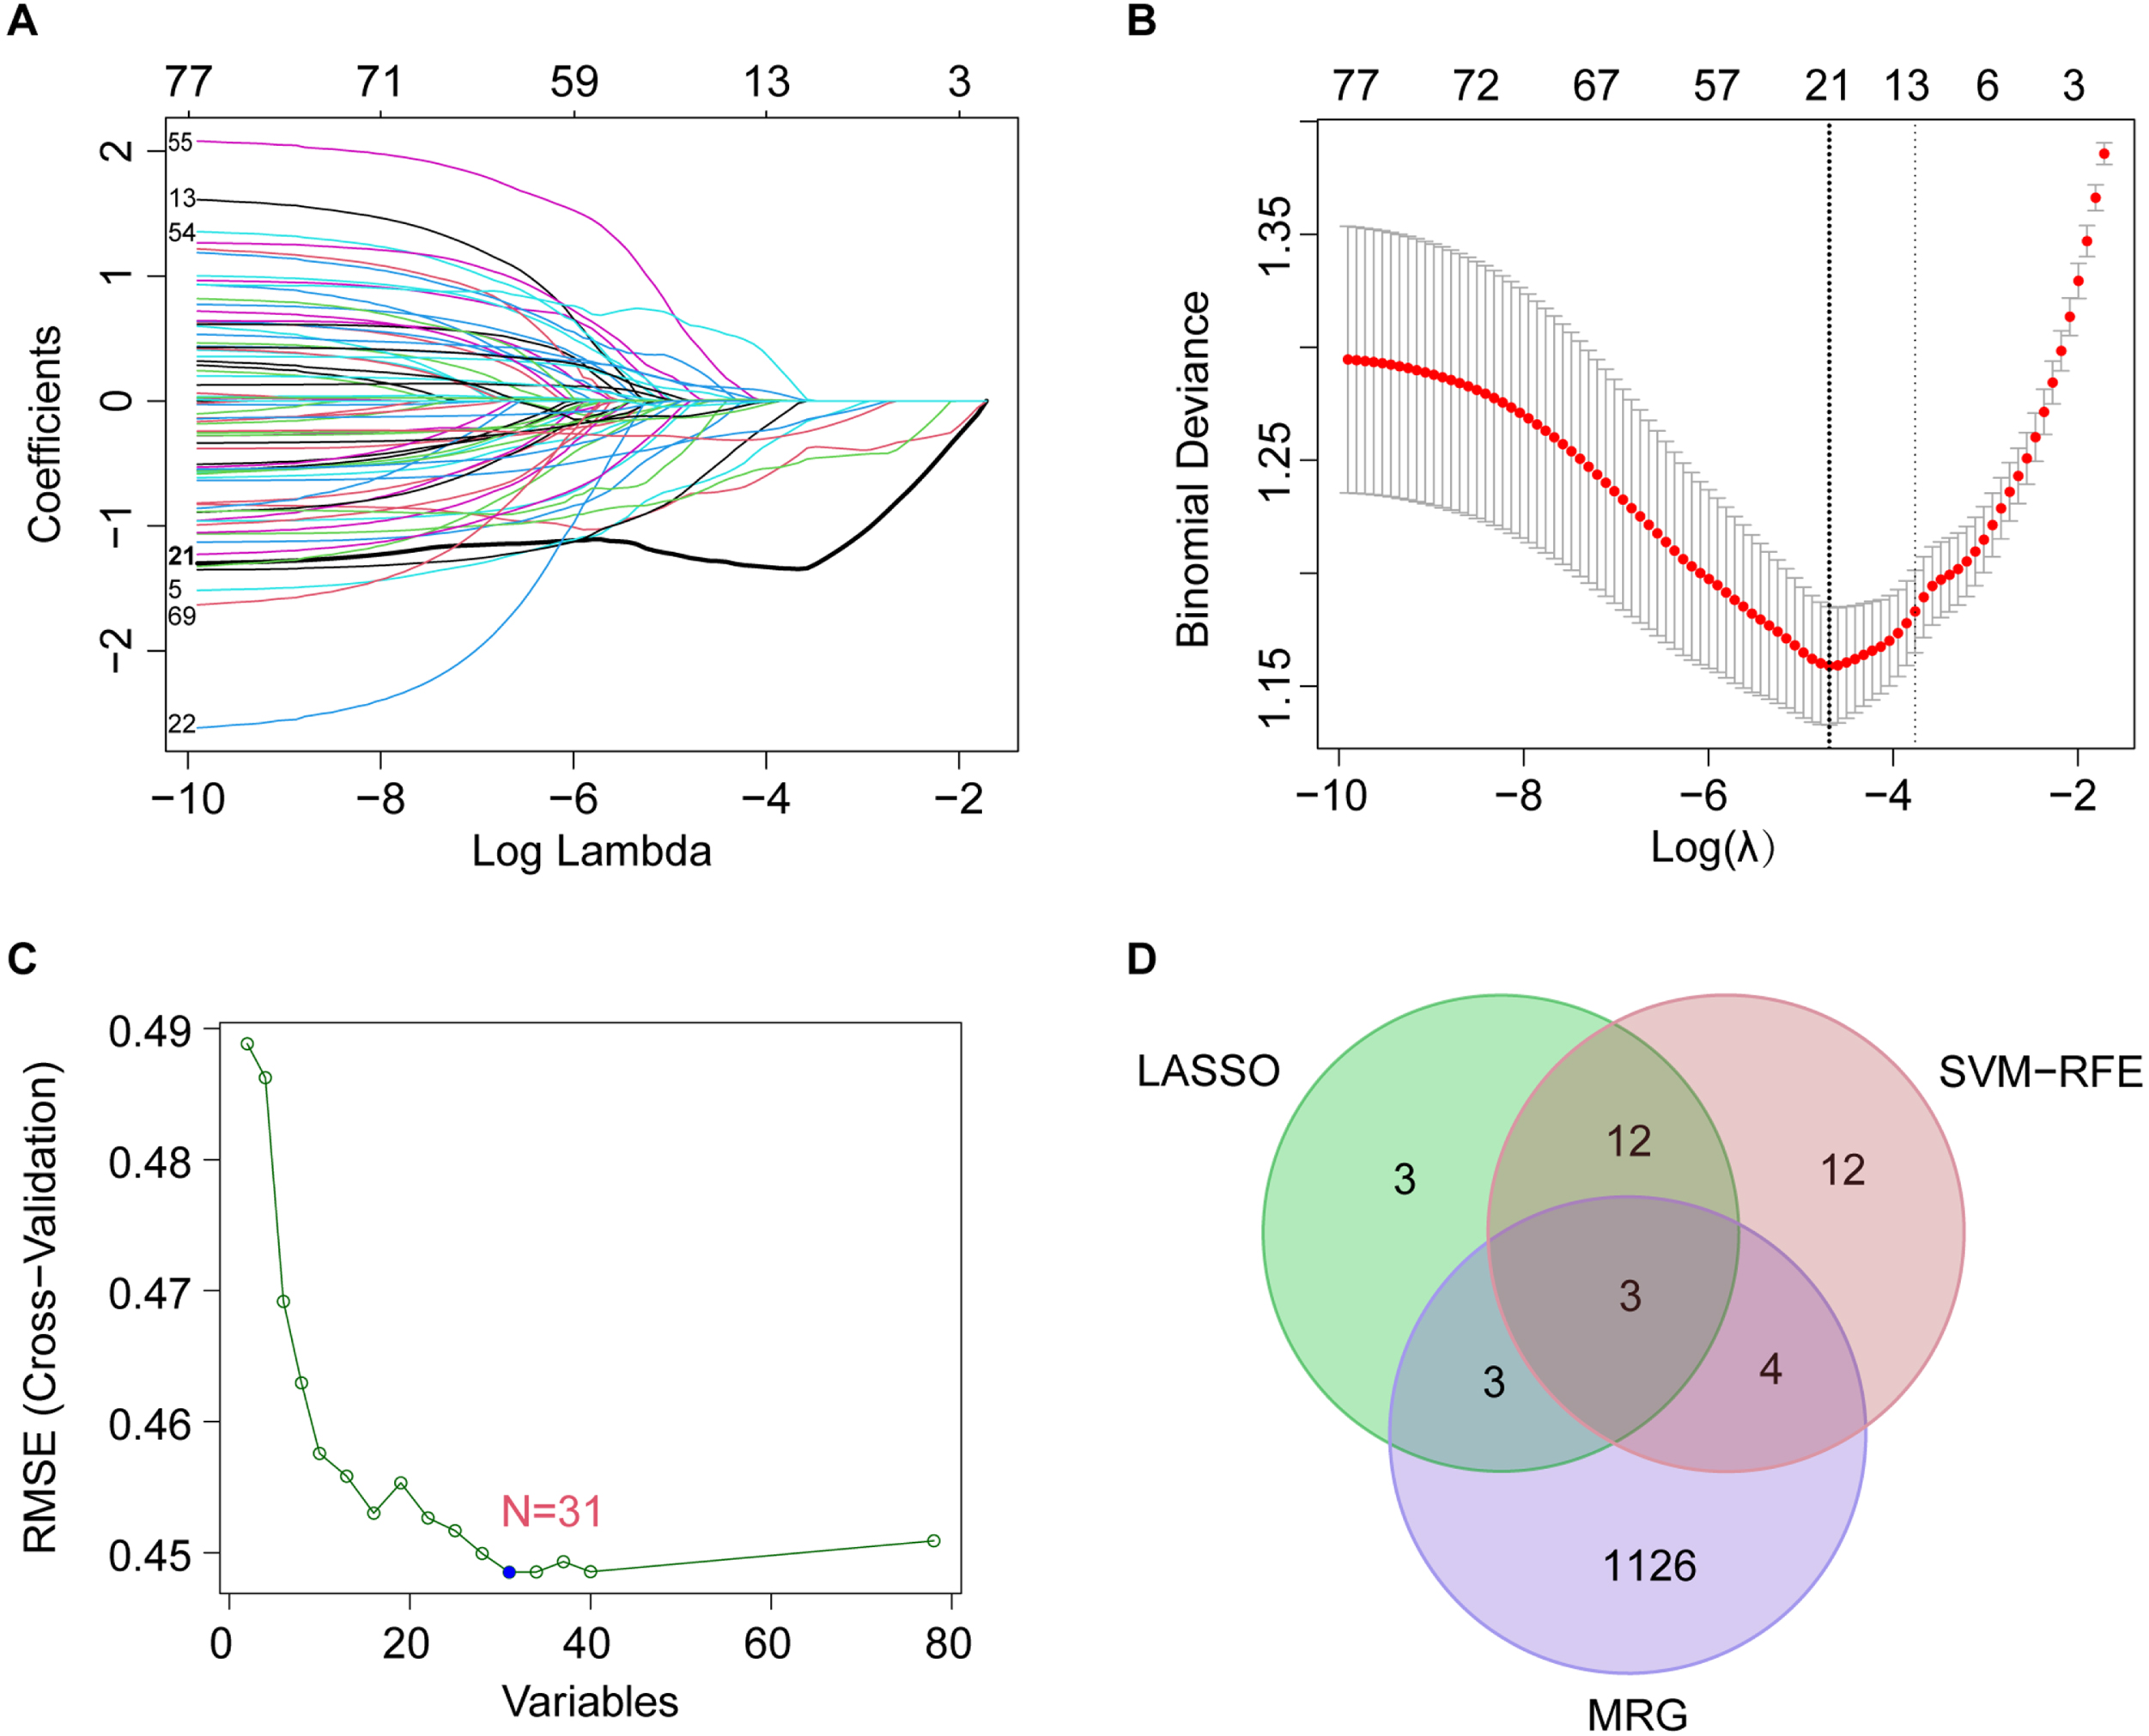
Fig. 4
ROC curves and corresponding AUC values for the training groups. The ROC curves of NDUFA1 (A), NDUFS5 (B), and NDUFB3 (C), AUC values were 0.703, 0.701, and 0.594 respectively.
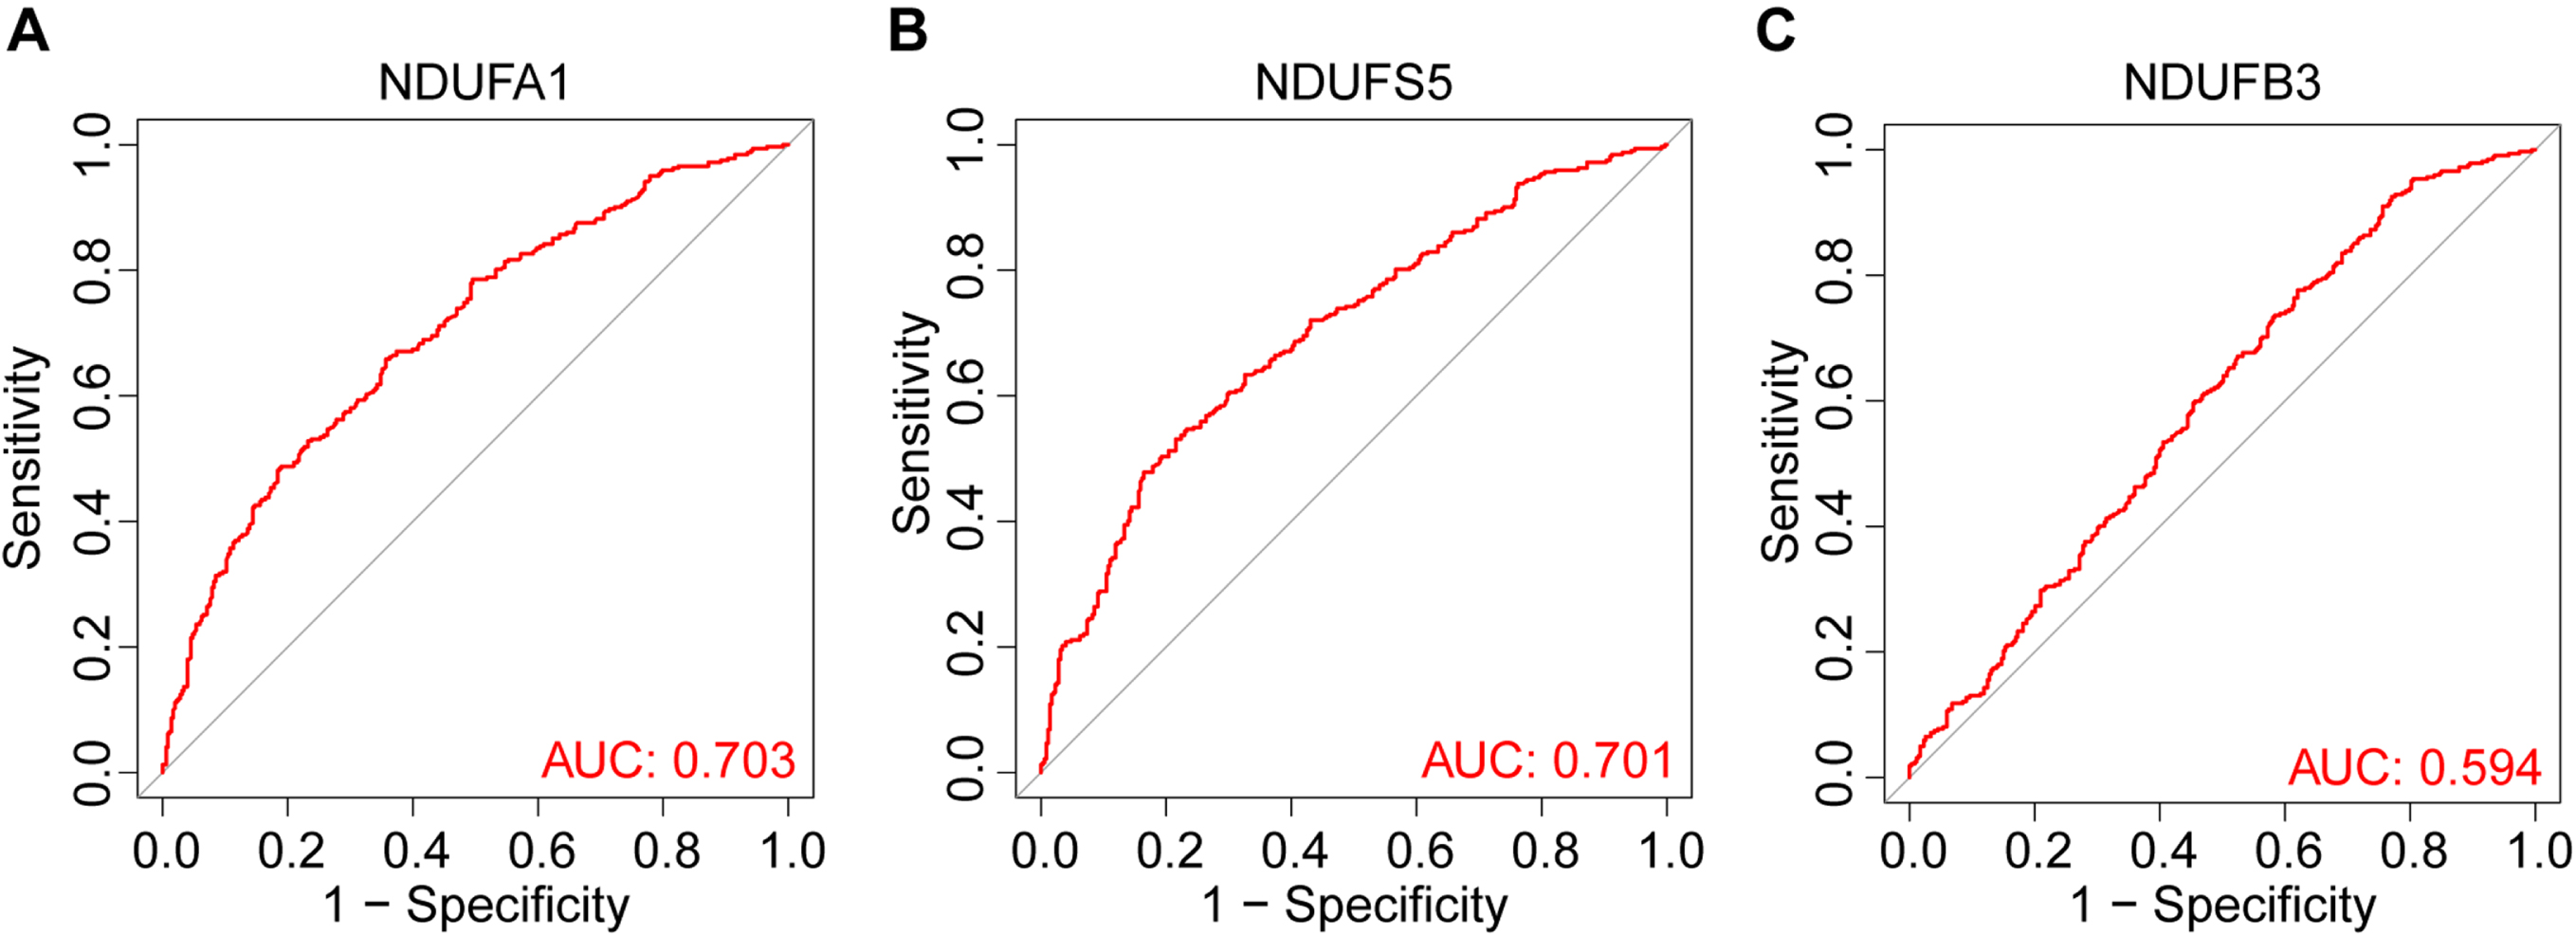
Fig. 5
Expression and corresponding AUC value of candidate genes in the CN, LOAD, and MCI groups in validation groups. The expression of NDUFA1 (A) and NDUFS5 (B) was significantly lower in LOAD and MCI. The ROC curves showed that the AUC values of NDUFA1 and NDUFS5 were 0.687 and 0.682 in the LOAD validation groups (C), and the AUC values of NDUFA1 and NDUFS5 were 0.668 and 0.652 in the MCI validation groups (D).
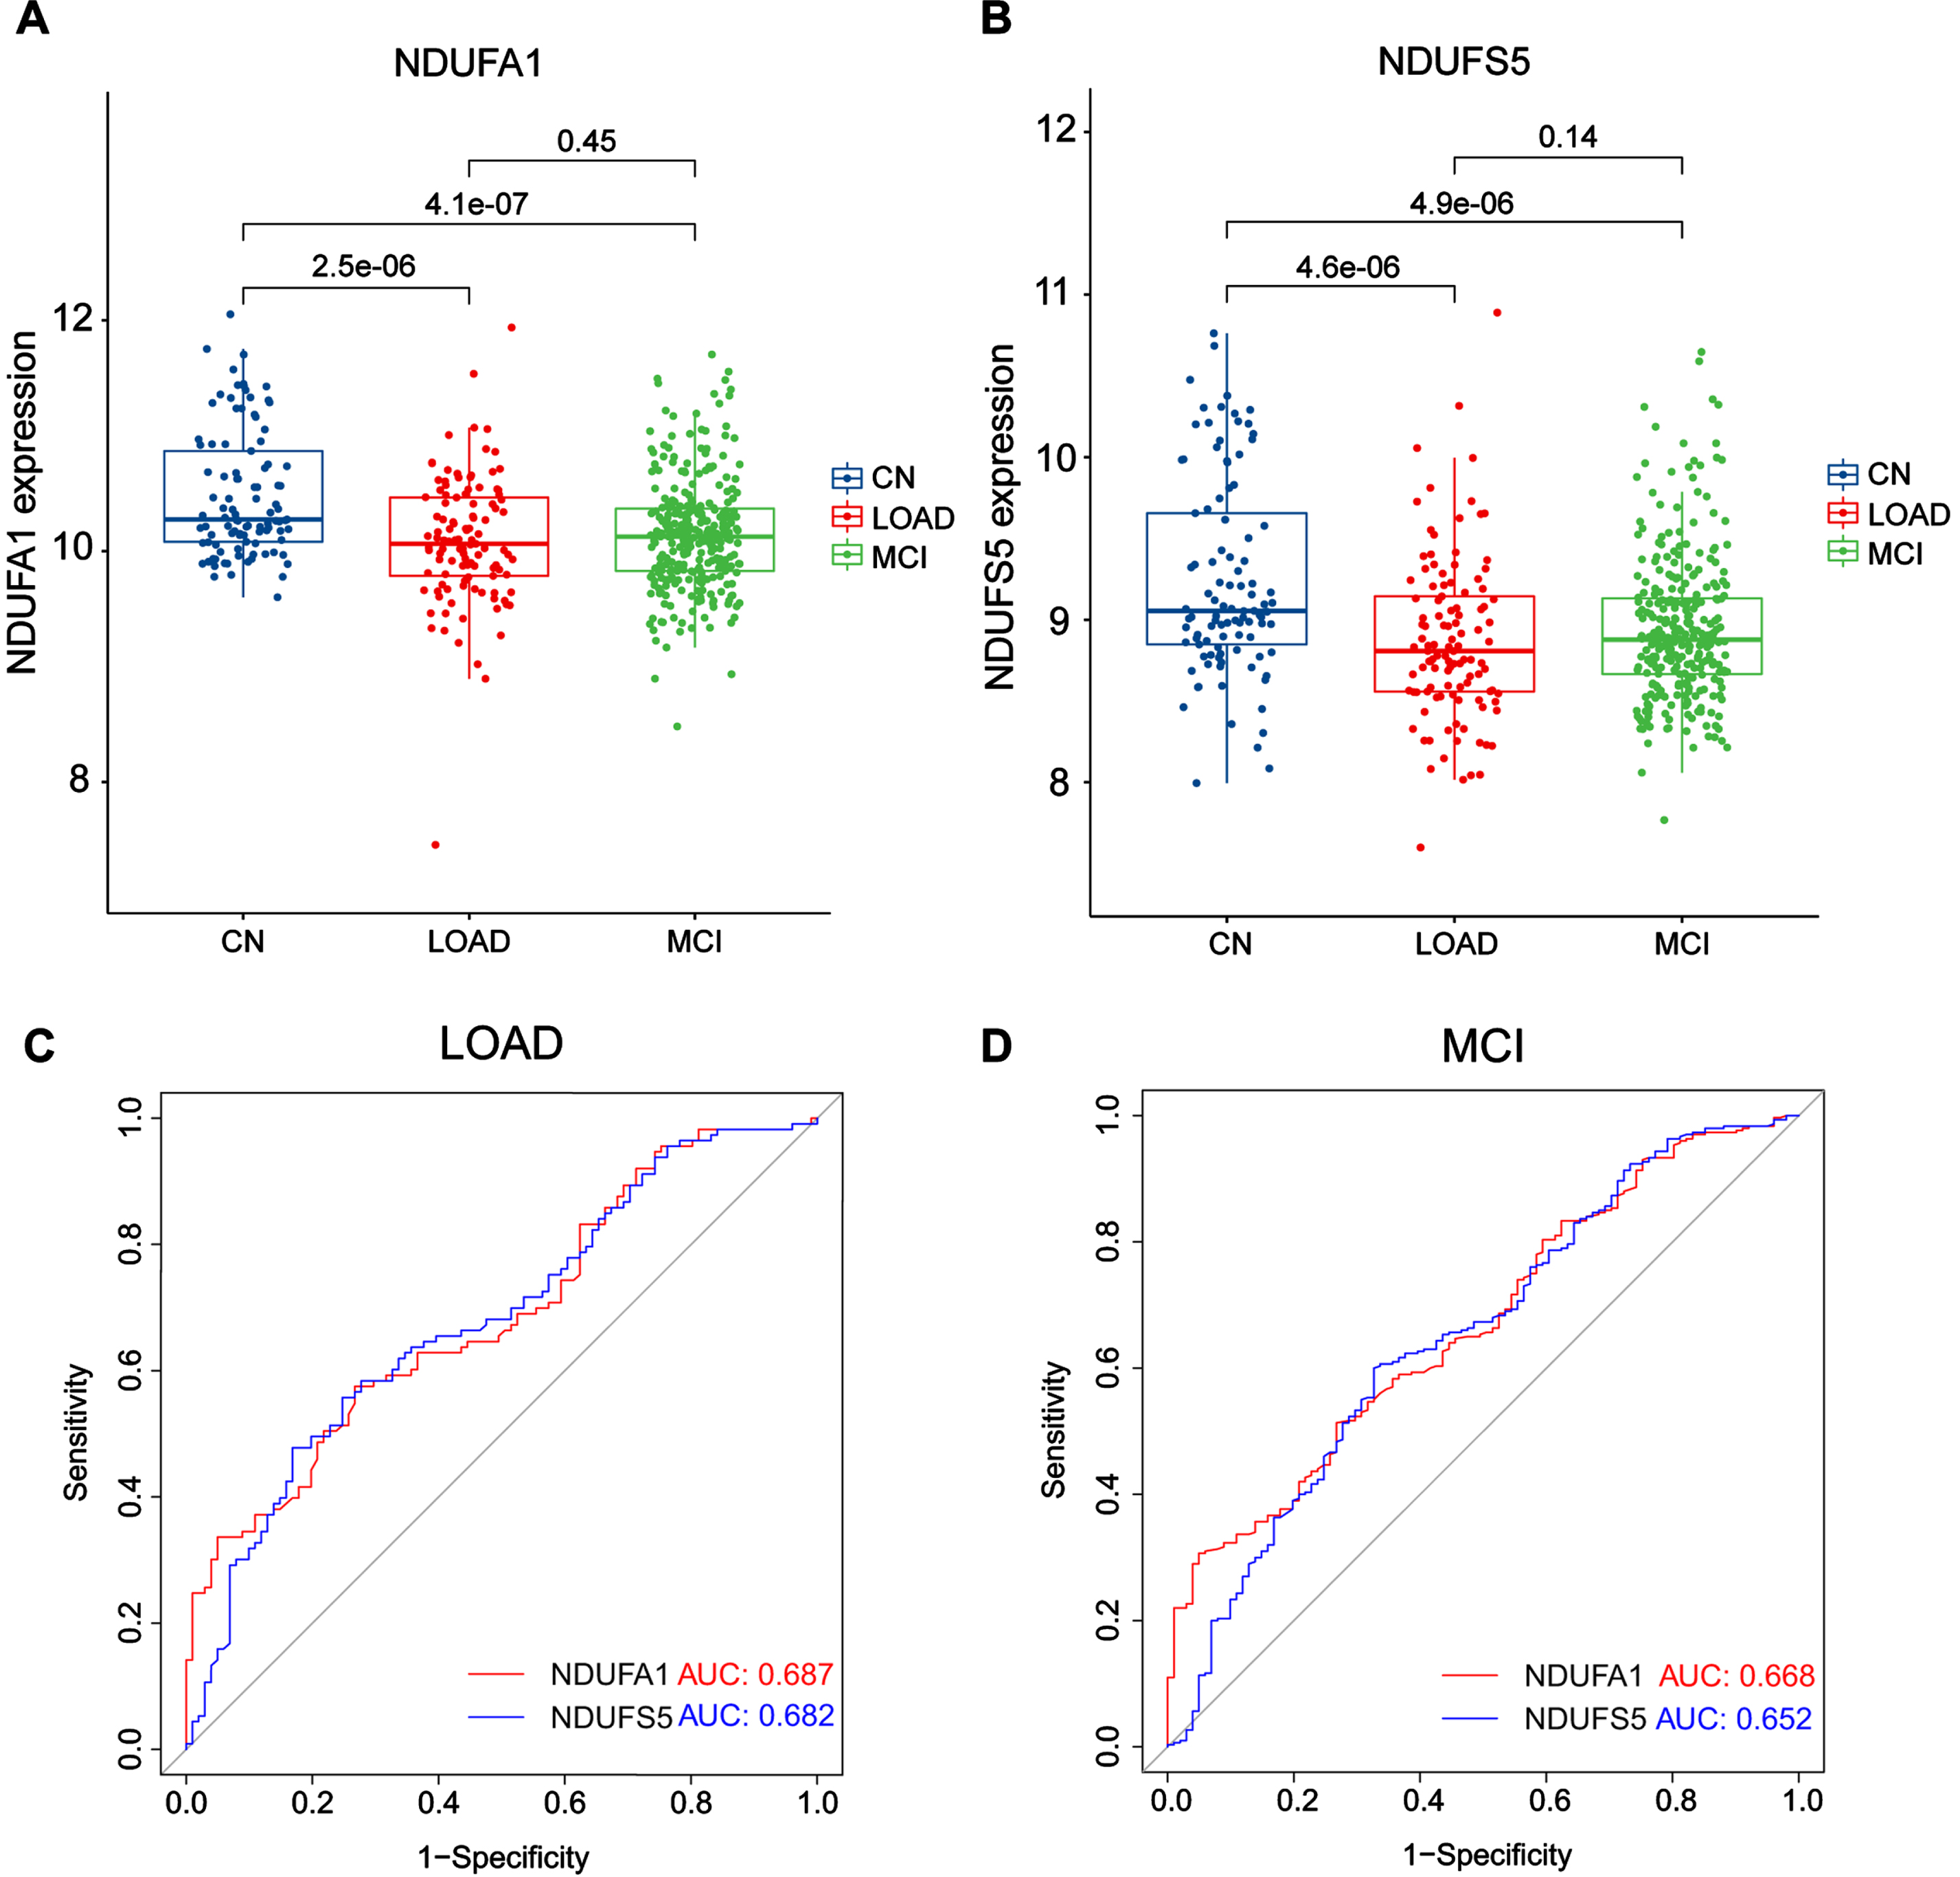
We were curious whether these candidate genes were altered in the MCI stage, which is the pre-AD stage. Therefore, we collected samples from all patients with MCI over 65 years old in the GSE63060, GSE63061, and GSE140829 datasets to test our hypothesis. In the analysis, 300 MCI samples were included. Similar to the results of LOAD, both genes were downregulated in MCI (Fig. 5A, B), and the AUC values of NDUFA1 and NDUFS5 were 0.668 and 0.652 (Fig. 5D), respectively. The number of participants and the AUC values in each group were summarized in Tables 1 and 2. The above results indicated that the two candidate MRGs had high accuracies as single factors to predict both LOAD and MCI.
Table 1
The number of participants in each group
| CN | LOAD | MCI | |
| Training Group | 353 | 322 | |
| Validation Group | 101 | 113 | 300 |
Table 2
The AUC values in each group
| Training | Validation on LOAD | Validation on MCI | |
| NDUFA1 | 0.703 | 0.687 | 0.668 |
| NDUFS5 | 0.701 | 0.682 | 0.652 |
| NDUFB3 | 0.594 |
Immune infiltration and immune-related factors changed in LOAD
Studies have shown that the pathogenesis of AD may be related to the infiltration, interaction, and dysfunction of immune cells [38, 39]. Studying the characteristics of immune cell infiltration in LOAD and the relationship between the candidate genes and immune cells will help to increase our understanding of the importance of immunity in LOAD and identify potential diagnostic and therapeutic targets.
In this study, the CIBERSORT algorithm was used to analyze 22 immune cell components in 322 LOAD samples and 353 CN samples, the results are shown in the histogram (Fig. 6A). Immune cells with significant differences between groups were presented in a violin plot (Fig. 6B), which showed that the LOAD group had significantly higher proportions of regulatory T cells (Tregs) (p = 0.010) and gamma delta T cells (p < 0.001), and lower proportions of naüve B cells (p < 0.001) and resting CD4 memory T cells (p < 0.001). The proportion of immune cells in peripheral blood was altered in LOAD.
Fig. 6
Immune infiltration between LOAD and CN. A) Relative proportion of peripheral blood infiltrates of 22 distinct subtypes of immune cells in LOAD patients. B) Comparison of 22 immune cell types between CN and LOAD. Green represents normal and red represents LOAD. C, D) The correlation of NDUFA1 (C) and NDUFS5 (D) with immune cells.
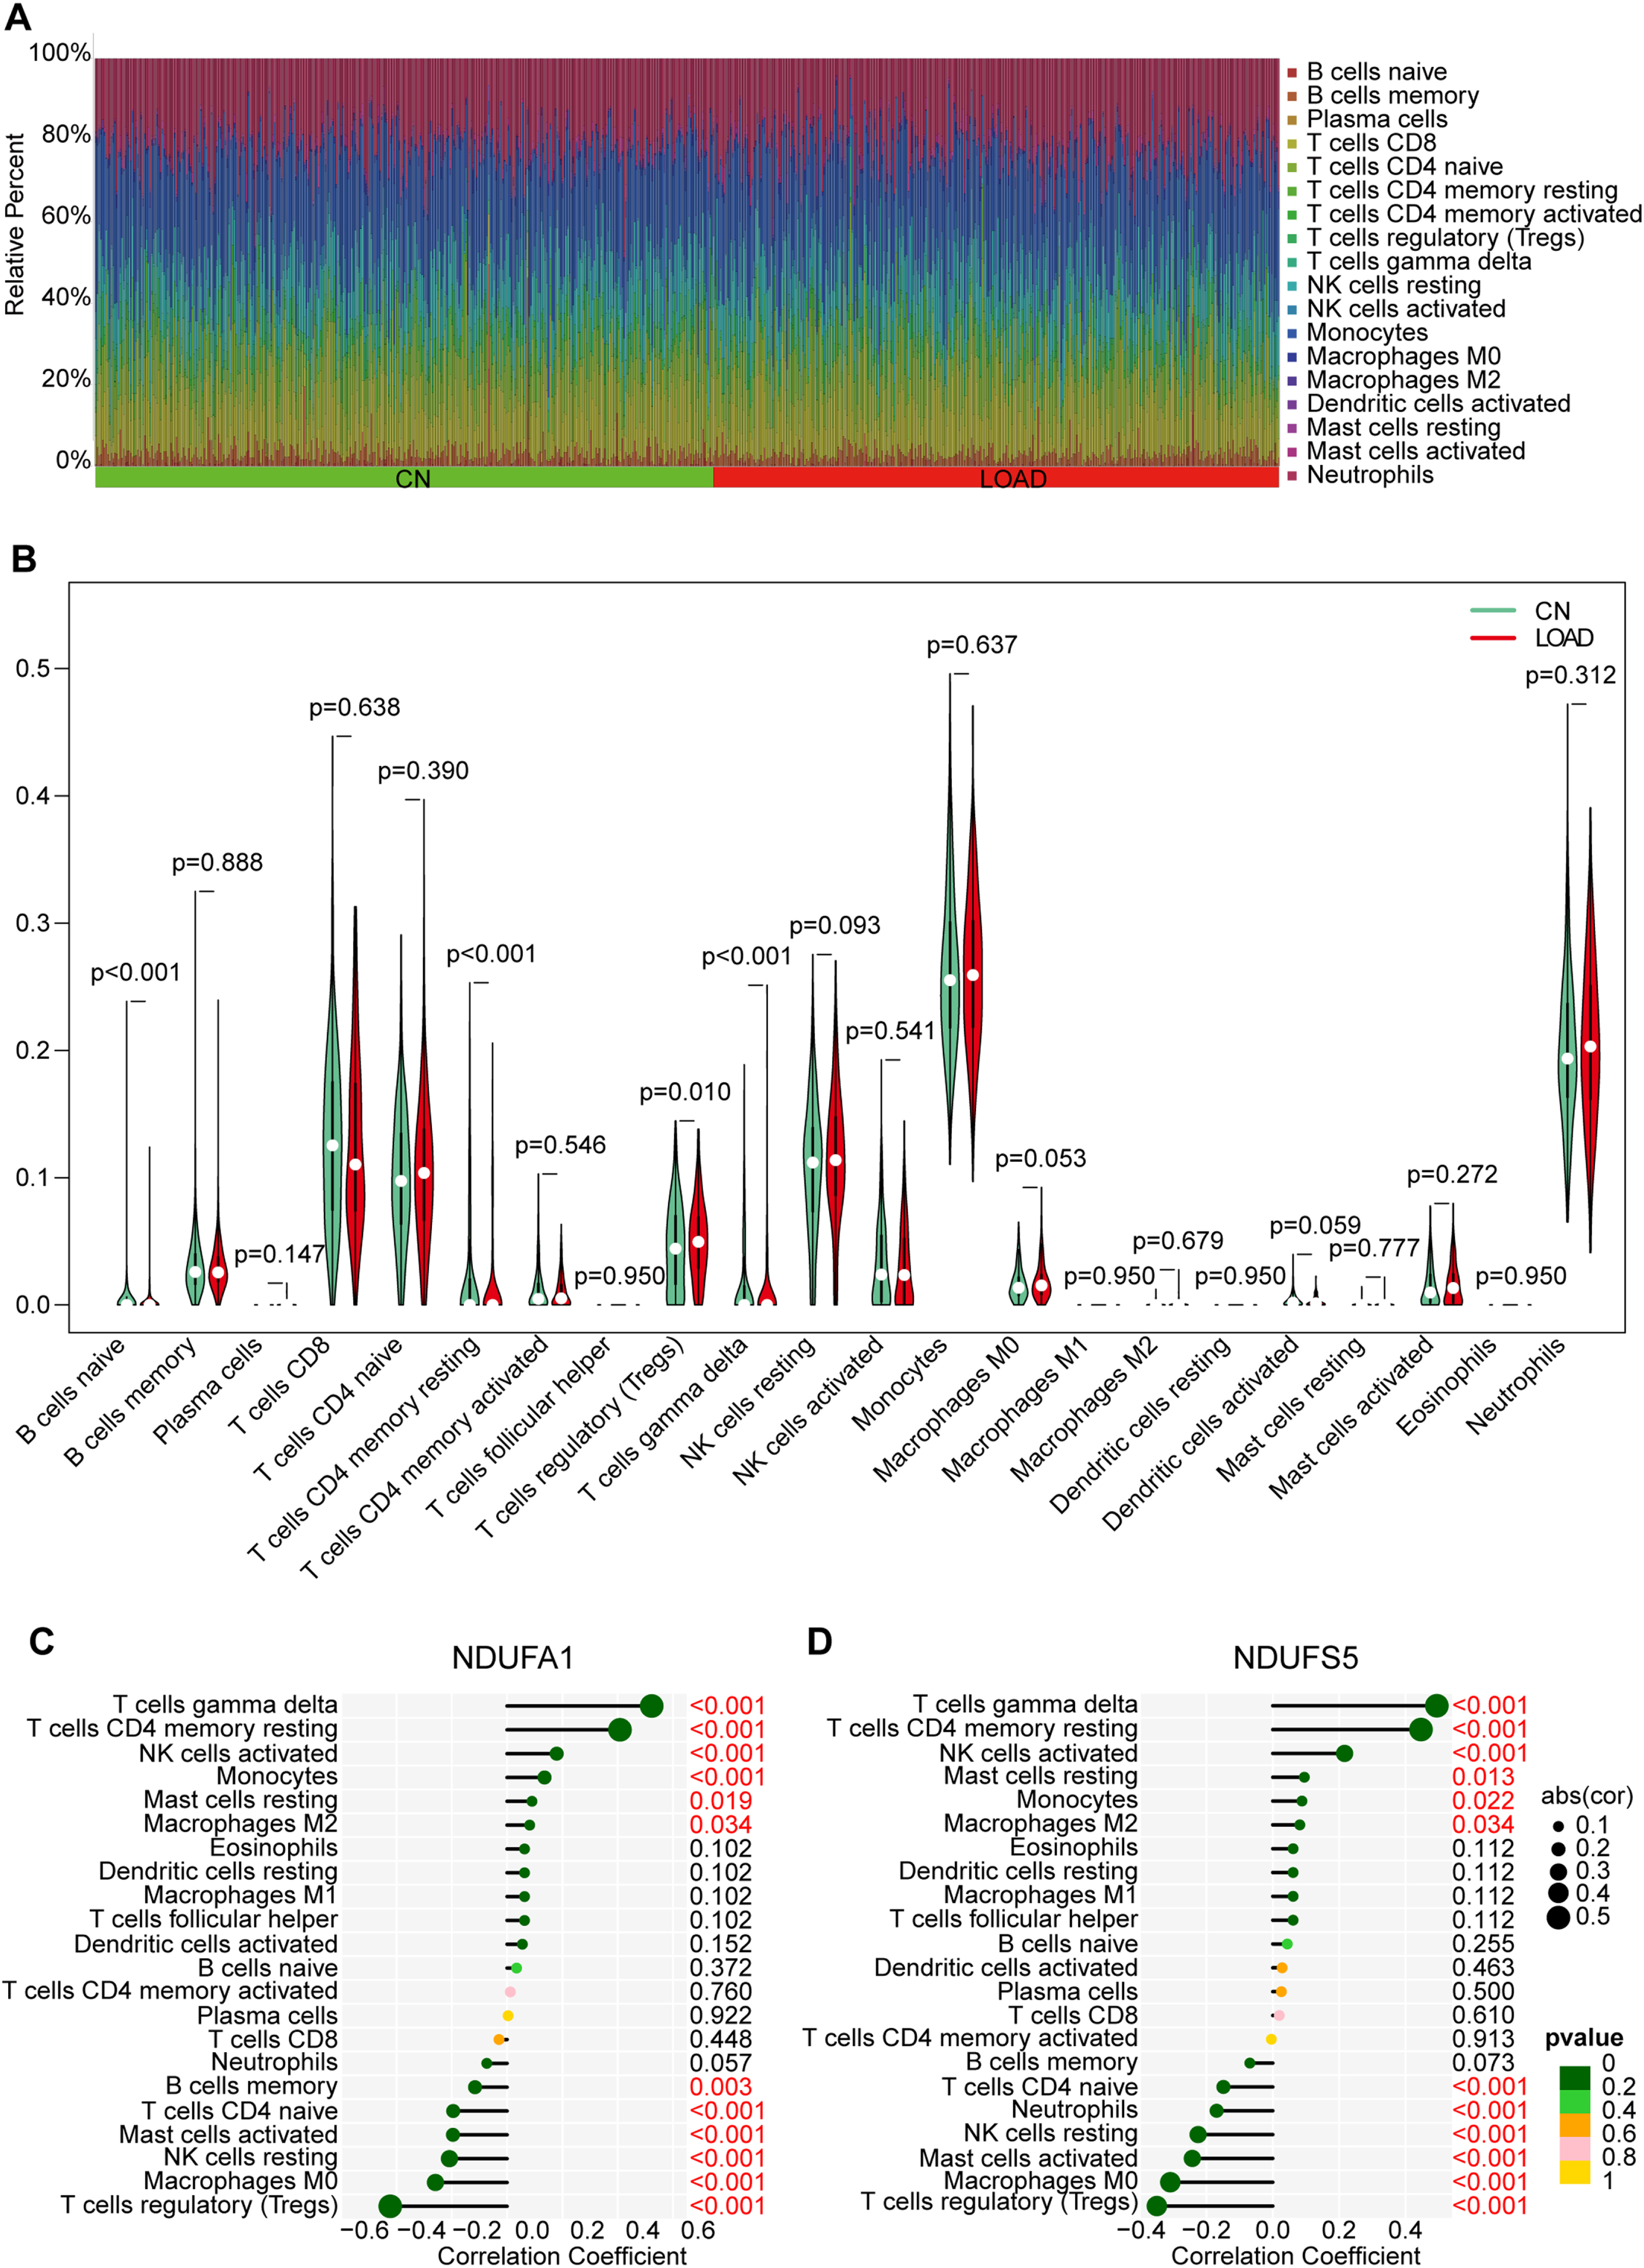
To further explore the relationship between the candidate MRGs and immune cells, we performed correlation analysis and found that NDUFA1 was positively correlated with gamma delta T cells, resting CD4 memory T cells, activated natural killer (NK) cells, and monocytes, and negatively correlated with Tregs, M0 macrophages, resting NK cells, activated mast cells, and naüve CD4 T cells (Fig. 6 C). The relevance between NDUFS5 and immune cells was almost the same as NDUFA1, except that NDUFS5 not positively correlated with monocytes but was negatively correlated with neutrophils (Fig. 7D). The above results suggested that both candidate MRGs were closely related to immune cell types.
Fig. 7
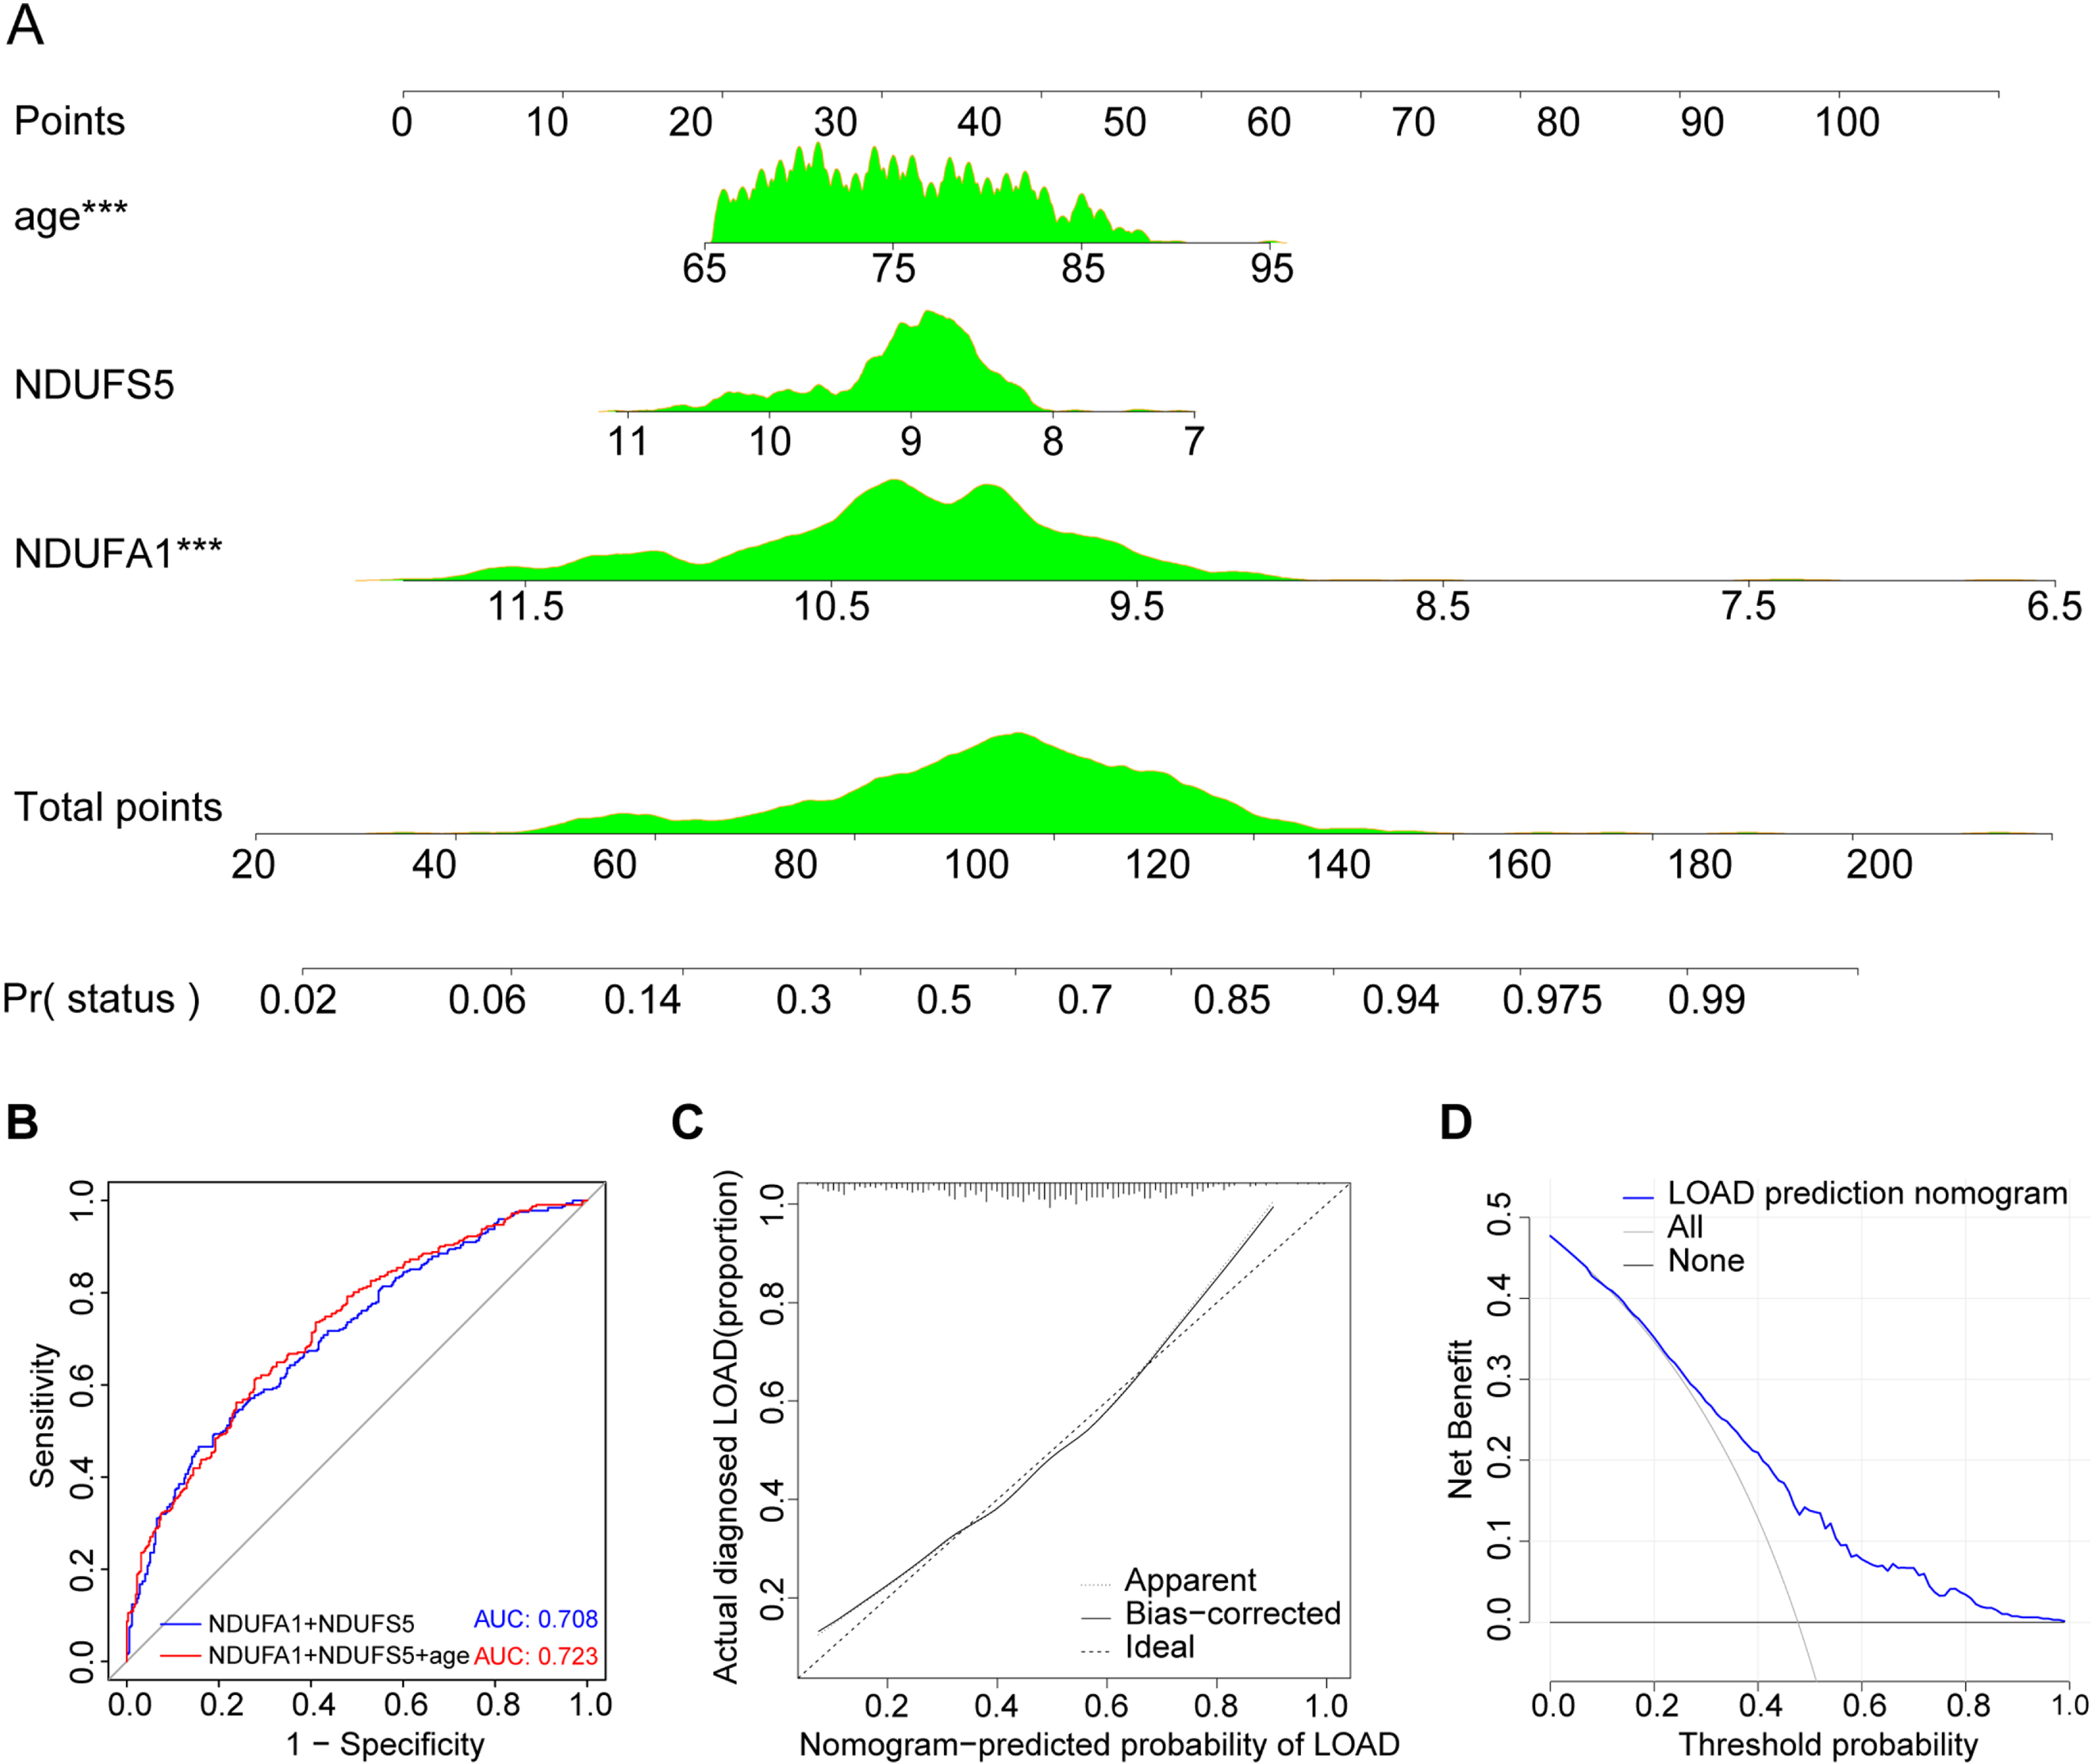
Model construction and evaluation. A) The LOAD nomogram was established for age and expression of NDUFA1 and NDUFS5 in the cohort. B) ROC curve and corresponding AUC value. C) Calibration curves of the prediction nomogram in the cohort. D) Decision curve analysis for the prediction nomogram.
Prediction model was successfully constructed
Age is an important risk factor for the onset of AD. According to U.S. statistical data, the incidence of AD increases sharply with age: 5.0% for people aged 65 to 74 years, 13.1% of people aged 75 to 84, and 33.2% of people aged 85 or older [5]. To further improve the disease prediction accuracy, independent predictors, including age, NDUFA1, and NDUFS5, were selected to construct the LOAD prediction model, which is presented as a nomogram (Fig. 7A). The AUC of the prediction nomogram was 0.723 with all three factors and 0.708 without age (Fig. 7B). The calibration curve of the LOAD nomogram showed that the overall predicted probability matched the actual probability very well (Fig. 7 C). The DCA for the LOAD nomogram presented that if the threshold probability were over 0.04, using this LOAD nomogram to predict LOAD would bring more benefits than risks for patients (Fig. 7D). Prediction model was successfully constructed and the evaluation indicators were good.
Differential expression of MRGs was verified by qRT-PCR
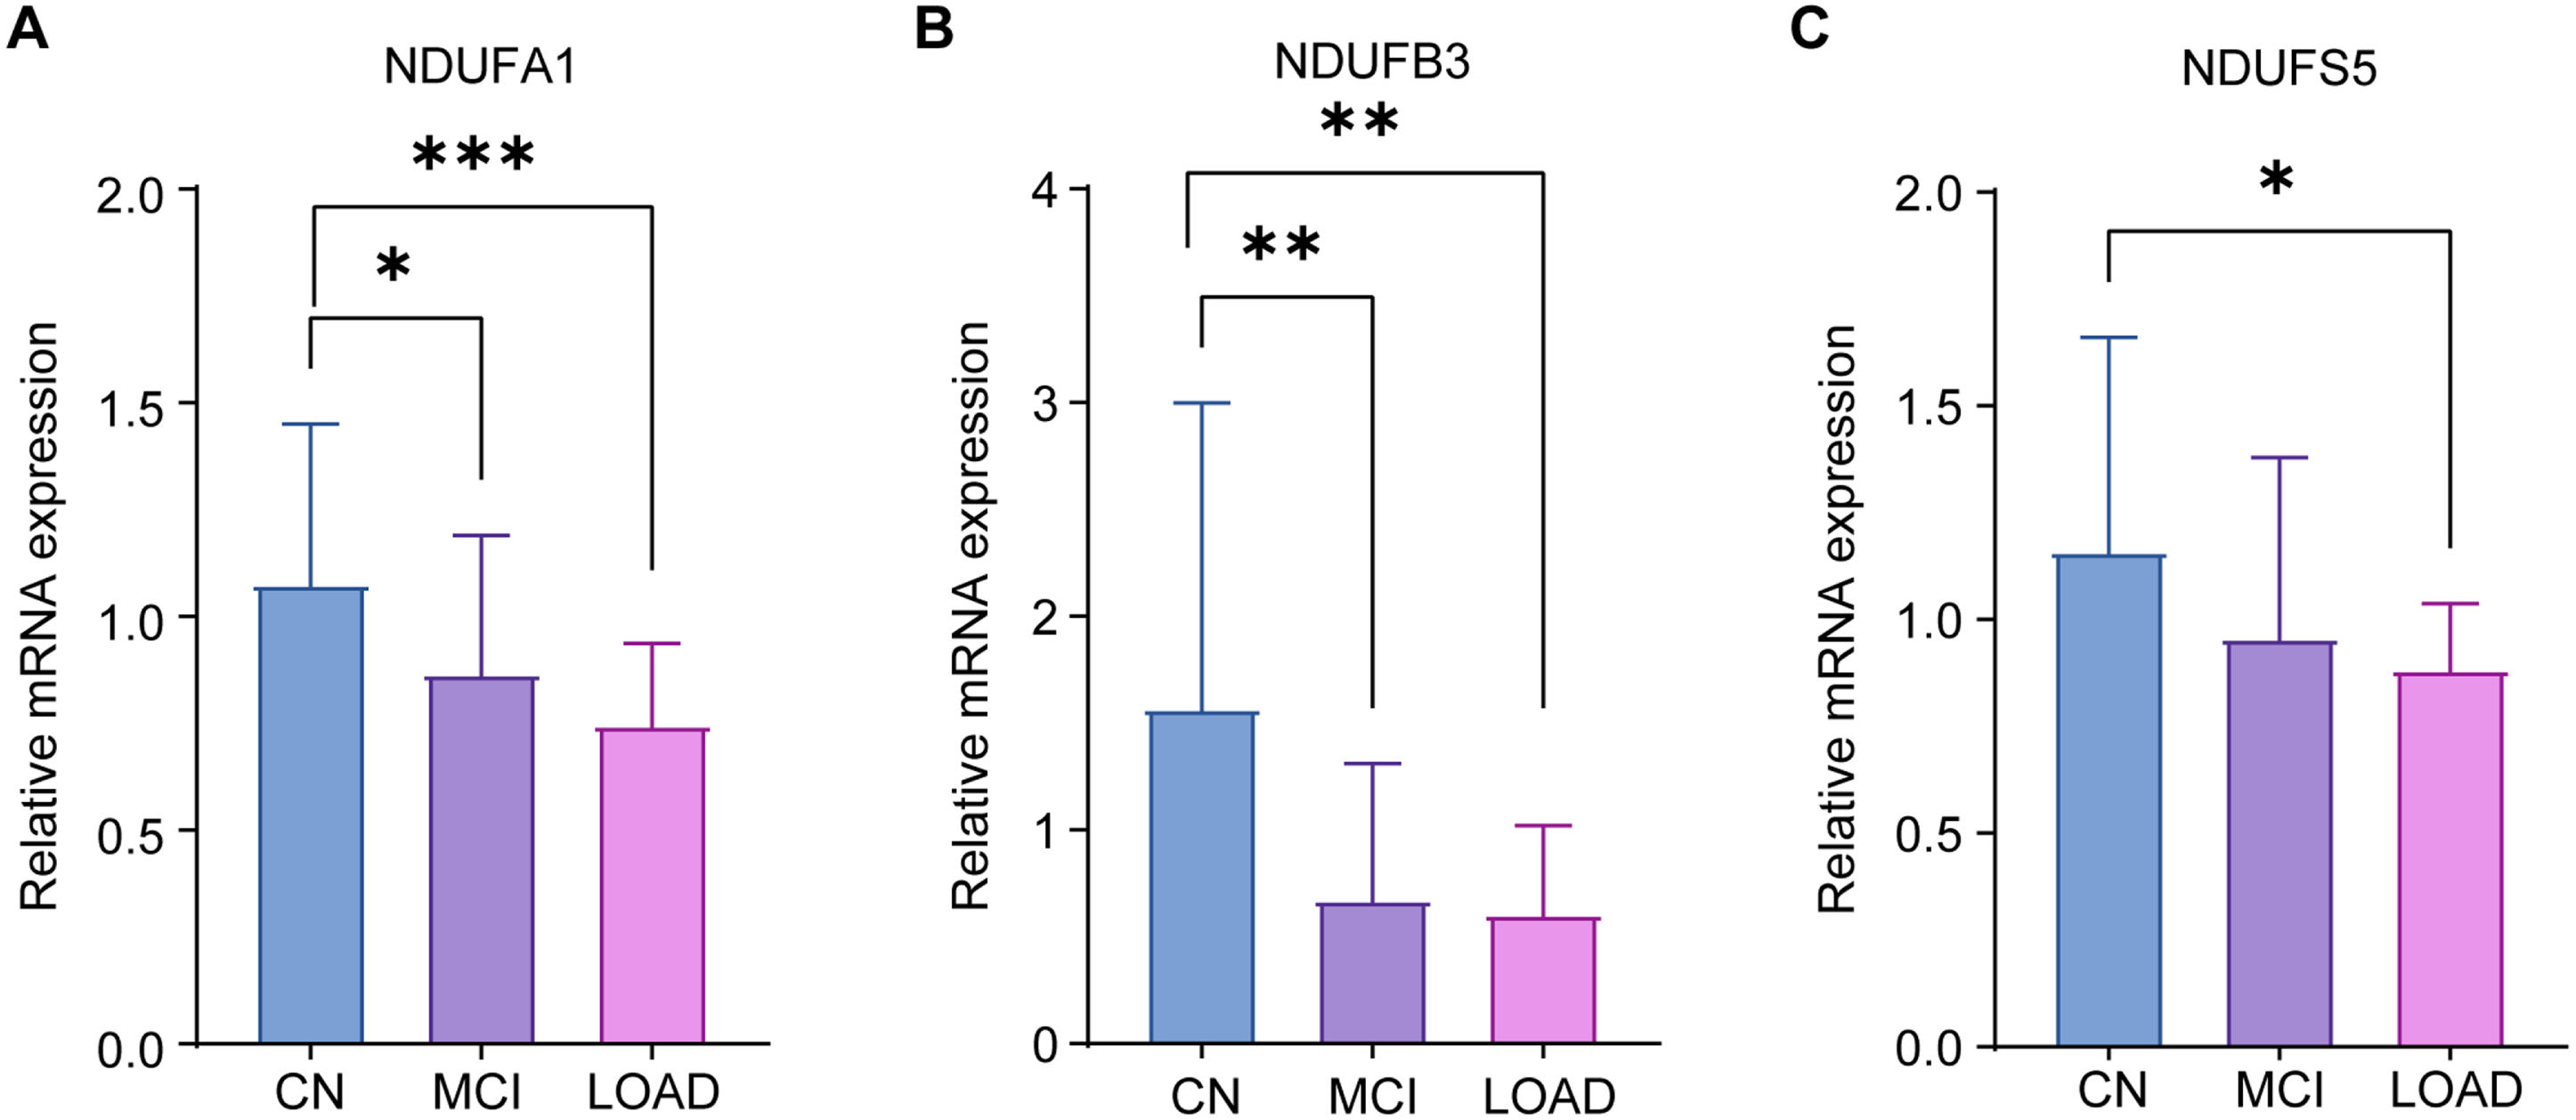
To further verify the differential expression of the candidate MRGs in LOAD, MCI, and CN, peripheral blood samples were collected from Ruijin Hospital for validation by qRT-PCR. We recruited 9 participants who were CN, 8 patients with LOAD, and 10 patients with MCI. Patient information is shown in Table 4, and all participants were over 65 years old. Their blood samples were collected, and the expression of the three candidate genes was verified by qRT-PCR. The results showed that all three genes, NDUFA1 (Fig. 8A), NDUFB3 (Fig. 8B), and NDUFS5 (Fig. 8 C) had lower expression in patients with LOAD than CN. In addition, NDUFA1 and NDUFB3 were significantly decreased in patients with MCI when compared to CN, confirming our conclusions from the public database. The results supported three candidate MRGs as potential diagnostic markers for LOAD and MCI in individuals over 65 years of age.
Table 4
Patients information
| CN | MCI | LOAD | p | |
| N | 9 | 10 | 8 | |
| Age (y, mean±SD) | 72.8±6.6 | 72.2±4.1 | 73.4±7.2 | 0.8189 |
| MMSE score (mean±SD) | 29.8±0.4 | 27.3±1.8 | 20.5±3.2 | <0.0001 |
| MoCA score (mean±SD) | 28.9±0.9 | 22.5±3.5 | 15.83±2.3 | <0.0001 |
MMSE, Mini-Mental State Examination; MoCA, Montreal Cognitive Assessment; SD, standard deviation.
Fig. 8
qRT-PCR validation results. qRT-PCR was used to verify the expression of NDUFA1 (A), NDUFB3 (B), and NDUFS5 (C) in CN, LOAD, and MCI. The experiments were performed in triplicate, and the data were expressed as mean±SEM (*p < 0.05, **p < 0.01, ***p < 0.001; ns, no significance).
DISCUSSION
In this study, we found that the differential expression of two MRGs, NDUFA1 and NDUFS5, in peripheral blood can be used as diagnostic markers for patients with LOAD and MCI over 65 years of age. A LOAD diagnosis model was successfully constructed by combining the two candidate MRGs with age. At the same time, changes were found in the mitochondria-related pathways and immune cell composition in the peripheral blood of patients with LOAD.
The pathological mechanisms and etiology of AD remain unclear, and there is a lack of convenient and quick indicators for early screening and diagnosis. Although the main pathological changes of AD occur in the brain, obtaining brain tissue for research purposes is difficult while patients are alive, and few patients with LOAD donate their bodies for scientific research. Therefore, using brain tissue sample indicators as biomarkers for early AD diagnosis is not feasible. Instead, blood-based markers offer a promising, minimally invasive approach for diagnostic purposes. The Aβ42/Aβ40 ratio and phosphorylated tau have shown potential as blood-based biomarkers for AD [19]. Plasma Aβ42/Aβ40 levels have been demonstrated to predict the status of Aβ deposition in PET-CT. However, the utility of these biomarkers is subject to the variability in detection methods and cohort studies, resulting in varying AUC values ranging from 0.64 to 0.87, mostly between 0.7–0.8 [40–43]. Two large-scale cohort studies reported AUC values of 0.89 versus 0.72 [44] and 0.83 versus 0.76 [45] for p-tau217 and p-tau181, respectively, in distinguishing between AD versus non-AD. Our approach, based on transcriptome analysis, has an AUC of 0.72 for distinguishing between CN and LOAD, which is comparable to the two classic plasma biomarkers mentioned above. While the detection of plasma Aβ and tau is expensive and subject to measurement variations caused by pre-analytical processing and analytical performance [20], our method offers a simple, practical, and cost-effective alternative that can be applied on a large scale in clinical settings.
Several studies have been conducted to screen DEGs as biomarkers for AD, some of which directly screened DEGs [25, 46], and some focused on the specific fields related to the possible etiology and pathology of AD, such as the immune microenvironment [24], iron metabolism [23], and concomitant diseases [22]. However, most studies did not distinguish between LOAD and EOAD. Compared to LOAD, EOAD has heterogeneous clinical manifestations [47], an aggressive clinical course [48], different pathogenic mechanisms, and different gene changes [49], which may have a confounding effect on research results. At the same time, due to the inclusion of EOAD, there were also some younger individuals in the control group, which could not accurately reflect differences due to LOAD. Therefore, we believe that there is a need for more precise biomarker exploration in the LOAD subgroup. In studies of genetic diagnostic markers for AD, blood and brain tissue samples are often used. There is an interaction between immune cells in the blood and central nervous system [50–52], and numerous studies on neurodegenerative diseases have found that changes in the peripheral blood can indicate the state of the disease to a certain extent [38, 53]. Considering the practicability, simplicity, cost, and availability of the samples, we chose blood samples for this study.
We used bioinformatic analyses to identify gene expression changes in LOAD. Seventy-eight DEGs were identified in the peripheral blood of patients with LOAD. SVM–REF and LASSO algorithms were performed to determine three candidate MRGs as potential biomarkers for LOAD. After validation, NDUFA1 and NDUFS5 were selected as the candidate genes for additional analyses. NDUFA1 is one of the “accessory proteins” identified in complex I [54]. Mitochondrial complex I is the primary entry point for electrons in the electron transport chain and is composed of core proteins and accessory proteins that perform bioenergetic functions [55]. Accessory proteins are not directly involved in catalysis but mainly maintain the structural stability of the complex and play a protective role in the response to oxidative damage [56]. The loss of the NDUFA1-encoded protein can cause complex-I deficiency, inhibit caspase activation and apoptosis, and enhance cell death induction [57]. Mutations in NDUFA1 may play a role in early-onset dementia [58]. NDUFS5 is also an accessory subunit of mitochondrial complex I [59]. The ND2-module is one of the seven core mtDNA-encoded subunits in mitochondrial complex I [60–63]. ND2 is critical for complex I assembly, the presence of core ND2-module subunits is a necessary condition for the stability of the complex [60]. Once the accessory subunits cannot enter the complex properly, the cell energy loss will increase and a large number of assembly factors will be required to maintain the biological function of complex 1 [64]. The latest assembly stages of the ND2-module of complex I involve the incorporation of subunits NDUFA1, NDUFA10, and NDUFS5. Changes in the expression of NDUFA1 and NDUFS5 may affect the assembly of the ND2-module, and thus, the structure and function of mitochondrial complex I.
Our findings on MRGs with decreased expression in LOAD and MCI are practical for clinical application and helpful for the understanding of LOAD pathogenesis, diagnosis and prevention. The cause of AD is not clear at present, but like other chronic degenerative diseases, it may be caused by a variety of complex factors [5]. There are many different theories about the pathogenesis of AD, including the mitochondrial cascade hypothesis, an important theory considering that mitochondrial dysfunction causes energetic and metabolic dysfunction and also drives the pathogenesis of AD, including Aβ plaque formation and tau deposition [65]. Evidence demonstrates both metabolic defects and oxidative damage occur in AD. Further, a mitochondrial complex I inhibitor restored synaptic activity and cognitive function in 3xTg-AD mice and significantly reduced the levels of pTau [66]. In another study, the mitochondrial function of peripheral blood mononuclear cells and platelets were measured, and the bioenergetic parameters, in descending order, were MCI, CN, and AD. They also found that respiration was positively associated with hippocampal volume, and systemic mitochondrial dysfunction was associated with cognitive decline [67]. It would be intriguing to investigate whether the three markers we identified also contribute to the pathological mechanisms of LOAD in the brain.
The interaction between immune signaling and the intrinsic cellular metabolic program determines the functional state of T lymphocytes [68]. Both mitochondrial oxidative phosphorylation (OXPHOS) and glycolysis are important metabolic pathways that promote T-cell proliferation [69]. In terms of biological energy, resting T cells are characterized by low metabolic requirements, dependence on OXPHOS-derived ATP, and inhibition of glycolysis [70]. Mitochondrial ATP production is essential for T cell activation, and their proliferation is associated with significant glucose uptake and glycolysis, which are the main sources of ATP. Mitochondrial respiration is enhanced by T-cell activation [53, 71]. The expression changes of MRGs in LOAD, such as NDUFA1, NUDFS5, and NDUFB3, may be related to changes in the immune cells in AD peripheral blood, the specific biological processes affected will be explored in our following studies. Our study showed that the LOAD group had significantly higher proportions of Tregs and gamma delta T cells, and lower proportions of resting CD4 memory T cells and naüve B cells. Among the proportion of changed cells, three candidate genes were positively correlated with gamma delta T cells and resting CD4 memory T cells, and negatively correlated with Tregs. Studies on Tregs in AD have been inconsistent. Some studies have revealed that the frequency of Tregs increases with age and is accompanied by intensified suppressive activity of Tregs in patients with AD [39, 72, 73], which is consistent with our results. However, a recent study found that the proportion of circulating Tregs in descending order was MCI, CN, and AD [74], which is inconsistent with our analysis. Differences in results are probably due to different research methods and samples. The CDR3 region of T-cell receptor γ genes in AD brain tissue and peripheral blood is unique. AD brain hydrophilic residues increased, as well as clones with larger volumes [75], which may be related to the inflammatory process of AD. As for the relationship between resting CD4 memory T cells and AD, one study found six kinds of inflammatory cells infiltrating 13 brain regions, and resting CD4 memory T cells had the highest proportion [76]. Some studies suggest that resting CD4 memory T cells may be involved in the AD process [77, 78]. It has also been reported that there is a significant reduction in naive B cells in the peripheral blood of patients with AD [79, 80].
The changes in peripheral blood mitochondrial function found by our enrichment analysis may reflect the dysfunction of brain mitochondria in patients with LOAD to a certain extent, and the specific correlation and mechanism need to be further explored. Peripheral circulating immune cells may have crosstalk with the central nervous system (CNS). Immune cells in the peripheral blood also exist in the CNS, and immune surveillance through the selected peripheral white blood cells provides a maintenance mechanism that is essential for brain function [81]. Episodes in neurodegenerative diseases occur when the presence of pathological mediators in the CNS overrides this capacity for immune surveillance [82]. Along the gut-brain axis, Tregs interact with a variety of resident cells in the CNS, including immune, epithelial, and neuronal cells, to produce a powerful neuroprotective effect in neuronal diseases [50, 51]. It has also been shown that Chlamydia pneumoniae infection may lead to dysregulation of key pathways involved in AD pathogenesis after intranasal inoculation [83]. Moreover, circulating blood cells are exposed to paracrine factors that regulate mitochondrial function throughout the body, possessing high ETC activity and metabolic flexibility [84], and have long been considered as a potential sensitive marker of mitochondrial dysfunction [85]. Blood cell bioenergetics can indicate the bioenergetics of high metabolically active tissues such as brain [86].
AD is a neurodegenerative disease with insidious onset and gradual development [2]. Pathological changes such as tau protein deposition occur before clinical symptoms [15], and mitochondrial dysfunction in the brain can be detected in the MCI stage [87]. We were curious whether the MRG alterations identified in this study occurred in the MCI stage, so we validated them on the gene datasets and collected clinical peripheral blood samples. Dataset analysis showed that NDUFA1 and NDUFS5 were significantly decreased in patients with MCI compared to the CN group, and both had good prediction accuracy for MCI. The two candidate genes we identified can predict LOAD earlier and provide help for early detection and intervention of LOAD.
We performed qRT-PCR validation on clinical peripheral blood samples, and found that NDUFA1, NDUFS5, and NDUFB3 were significantly decreased in LOAD compared to CN. NDUFA1 and NDUFB3, but not NDUFS5, were significantly decreased in patients with MCI compared to CN. LOAD exhibited more significant changes in MRGs. This may be related to the different sources and scales of patients between the clinical samples and datasets, and the reason needs to be further explored.
Although we identified some MRGs that can serve as candidate genes for LOAD and MCI using bioinformatics methods and qRT-PCR experiments, our study still has limitations. First, the clinical validation sample size in this study was small and came from a single center, therefore, the conclusion may lack the universality of other regions and populations. In the future, more samples should be collected to verify the correlation between MRGs and LOAD. Second, the experiments in this study did not classify peripheral blood leukocytes, subsequent studies could classify leukocytes to explore specific cell groups with significant changes in MRGs expression. Third, the molecular biological mechanisms between down regulated MRGs and LOAD needs to be further explored, which will be shown in our following work.
Conclusion
Using the GEO public database and machine learning methods, including LASSO and SVM-RFE, we identified two MRGs, NDUFA1 and NDUFS5, which can be used as candidate genes of MCI and LOAD, and we constructed a disease prediction model. The results were verified by qRT-PCR of clinical blood samples. Biological function analysis showed that the expression of mitochondria-related pathways was significantly changed. This study also reported changes in LOAD peripheral circulating immune cells, and Tregs and resting CD4 memory T cells were closely related to changes in candidate genes, the specific mechanism will be further explored.
ACKNOWLEDGMENTS
We thank all patients and healthy volunteers who were recruited in this study. We thank all the members of Yang and Xu Labs for their insightful discussions. We would like to thank Editage (http://www.editage.cn) for English language editing.
FUNDING
This study was supported by grants from the National Natural Science Foundation of China (81600920).
CONFLICT OF INTEREST
The authors declare no conflict of interest.
DATA AVAILABILITY
The datasets presented in this study can be found in online repositories. The names of the repository/repositories and accession number(s) can be found in the article material. The original data supporting this study can be obtained by contacting the corresponding author.
SUPPLEMENTARY MATERIAL
[1] The supplementary material is available in the electronic version of this article: https://dx.doi.org/10.3233/JAD-230314.
REFERENCES
[1] | Long JM , Holtzman DM ((2019) ) Alzheimer disease: An update on pathobiology and treatment strategies. Cell 179: , 312–339. |
[2] | Knopman DS , Amieva H , Petersen RC , Chetelat G , Holtzman DM , Hyman BT , Nixon RA , Jones DT ((2021) ) Alzheimer disease. Nat Rev Dis Primers 7: , 33. |
[3] | Liu P-P , Xie Y , Meng X-Y , Kang J-S ((2019) ) History and progress of hypotheses and clinical trials for Alzheimer’s disease. Signal Transduct Target Ther 4: , 29. |
[4] | Ittner LM , Götz J ((2011) ) Amyloid-β and tau — a toxic pas de deux in Alzheimer’s disease. Nat Rev Neurosci 12: , 67–72. |
[5] | ((2022) ) 2022 Alzheimer’s disease facts and figures. Alzheimers Dement 18: , 700–789. |
[6] | Hampel H , Mesulam MM , Cuello AC , Farlow MR , Giacobini E , Grossberg GT , Khachaturian AS , Vergallo A , Cavedo E , Snyder PJ , Khachaturian ZS ((2018) ) The cholinergic system in the pathophysiology and treatment of Alzheimer’s disease. Brain 141: , 1917–1933. |
[7] | Ashleigh T , Swerdlow RH , Beal MF ((2023) ) The role of mitochondrial dysfunction in Alzheimer’s disease pathogenesis. Alzheimers Dement 19: , 333–342. |
[8] | Swerdlow RH , Burns JM , Khan SM ((2014) ) The Alzheimer’s disease mitochondrial cascade hypothesis: Progress and perspectives. Biochim Biophys Acta 1842: , 1219–1231. |
[9] | Swerdlow RH , Khan SM ((2004) ) A “mitochondrial cascade hypothesis” for sporadic Alzheimer’s disease. Med Hypotheses 63: , 8–20. |
[10] | Butterfield DA , Halliwell B ((2019) ) Oxidative stress, dysfunctional glucose metabolism and Alzheimer disease. Nat Rev Neurosci 20: , 148–160. |
[11] | Tzioras M , McGeachan RI , Durrant CS , Spires-Jones TL ((2023) ) Synaptic degeneration in Alzheimer disease. Nat Rev Neurol 19: , 19–38. |
[12] | Heppner FL , Ransohoff RM , Becher B ((2015) ) Immune attack: The role of inflammation in Alzheimer disease. Nat Rev Neurosci 16: , 358–372. |
[13] | Leng F , Edison P ((2021) ) Neuroinflammation and microglial activation in Alzheimer disease: Where do we go from here? Nat Rev Neurol 17: , 157–172. |
[14] | Jack CR Jr., Bennett DA , Blennow K , Carrillo MC , Dunn B , Haeberlein SB , Holtzman DM , Jagust W , Jessen F , Karlawish J , Liu E , Molinuevo JL , Montine T , Phelps C , Rankin KP , Rowe CC , Scheltens P , Siemers E , Snyder HM , Sperling R ((2018) ) NIA-AA Research Framework: Toward a biological definition of Alzheimer’s disease. Alzheimers Dement 14: , 535–562. |
[15] | Scholl M , Maass A , Mattsson N , Ashton NJ , Blennow K , Zetterberg H , Jagust W ((2019) ) Biomarkers for tau pathology. Mol Cell Neurosci 97: , 18–33. |
[16] | Saykin AJ , Shen L , Yao X , Kim S , Nho K , Risacher SL , Ramanan VK , Foroud TM , Faber KM , Sarwar N , Munsie LM , Hu X , Soares HD , Potkin SG , Thompson PM , Kauwe JS , Kaddurah-Daouk R , Green RC , Toga AW , Weiner MW ((2015) ) Genetic studies of quantitative MCI and AD phenotypes in ADNI: Progress, opportunities, and plans. Alzheimers Dement 11: , 792–814. |
[17] | Petersen RC , Lopez O , Armstrong MJ , Getchius TSD , Ganguli M , Gloss D , Gronseth GS , Marson D , Pringsheim T , Day GS , Sager M , Stevens J , Rae-Grant A ((2018) ) Practice guideline update summary: Mild cognitive impairment: Report of the Guideline Development, Dissemination, and Implementation Subcommittee of the American Academy of Neurology. Neurology 90: , 126–135. |
[18] | Hansson O , Edelmayer RM , Boxer AL , Carrillo MC , Mielke MM , Rabinovici GD , Salloway S , Sperling R , Zetterberg H , Teunissen CE ((2022) ) The Alzheimer’s Association appropriate use recommendations for blood biomarkers in Alzheimer’s disease. Alzheimers Dement 18: , 2669–2686. |
[19] | Imbimbo BP , Watling M , Imbimbo C , Nisticò R (2023) Plasma ATN(I) classification and precision pharmacology in Alzheimer’s disease. Alzheimers Dement. doi: 10.1002/alz.13084. |
[20] | Rózga M , Bittner T , Batrla R , Karl J ((2019) ) Preanalytical sample handling recommendations for Alzheimer’s disease plasma biomarkers. Alzheimers Dement (Amst) 11: , 291–300. |
[21] | Larson NB , Oberg AL , Adjei AA , Wang L ((2023) ) A clinician’s guide to bioinformatics for next-generation sequencing. J Thorac Oncol 18: , 143–157. |
[22] | Wang Z , Meng Z , Chen C ((2022) ) Screening of potential biomarkers in peripheral blood of patients with depression based on weighted gene co-expression network analysis and machine learning algorithms. Front Psychiatry 13: , 1009911. |
[23] | Gu X , Lai D , Liu S , Chen K , Zhang P , Chen B , Huang G , Cheng X , Lu C ((2022) ) Hub genes, diagnostic model, and predicted drugs related to iron metabolism in Alzheimer’s disease. Front Aging Neurosci 14: , 949083. |
[24] | Liu Z , Li H , Pan S ((2021) ) Discovery and validation of key biomarkers based on immune infiltrates in Alzheimer’s disease. Front Genet 12: , 658323. |
[25] | Lee T , Lee H ((2020) ) Prediction of Alzheimer’s disease using blood gene expression data. Sci Rep 10: , 3485. |
[26] | |
[27] | Ritchie ME , Phipson B , Wu D , Hu Y , Law CW , Shi W , Smyth GK ((2015) ) limma powers differential expression analyses for RNA-sequencing and microarray studies. Nucleic Acids Res 43: , e47. |
[28] | |
[29] | Wu T , Hu E , Xu S , Chen M , Guo P , Dai Z , Feng T , Zhou L , Tang W , Zhan L , Fu X , Liu S , Bo X , Yu G ((2021) ) clusterProfiler 4.0: A universal enrichment tool for interpreting omics data. Innovation (Camb) 2: , 100141. |
[30] | Kanehisa M , Furumichi M , Sato Y , Ishiguro-Watanabe M , Tanabe M ((2021) ) KEGG: Integrating viruses and cellular organisms. Nucleic Acids Res 49: , D545–D551. |
[31] | Friedman J , Hastie T , Tibshirani R ((2010) ) Regularization paths for generalized linear models via coordinate descent. J Stat Softw 33: , 1–22. |
[32] | |
[33] | Karatzoglou A , Smola A , Hornik K , Zeileis A ((2004) ) kernlab - An S4 Package for Kernel Methods in R. J Stat Softw 11: , 1–20. |
[34] | Mitocarta3.0., https://www.broadinstitute.org/files/shared/metabolism/mitocarta/human.mitocarta3.0.html |
[35] | Rath S , Sharma R , Gupta R , Ast T , Chan C , Durham TJ , Goodman RP , Grabarek Z , Haas ME , Hung WHW , Joshi PR , Jourdain AA , Kim SH , Kotrys AV , Lam SS , McCoy JG , Meisel JD , Miranda M , Panda A , Patgiri A , Rogers R , Sadre S , Shah H , Skinner OS , To TL , Walker MA , Wang H , Ward PS , Wengrod J , Yuan CC , Calvo SE , Mootha VK ((2021) ) MitoCarta3.0: An updated mitochondrial proteome now with sub-organelle localization and pathway annotations. Nucleic Acids Res 49: , D1541–D1547. |
[36] | Newman AM , Liu CL , Green MR , Gentles AJ , Feng W , Xu Y , Hoang CD , Diehn M , Alizadeh AA ((2015) ) Robust enumeration of cell subsets from tissue expression profiles. Nat Methods 12: , 453–457. |
[37] | Robin X , Turck N , Hainard A , Tiberti N , Lisacek F , Sanchez JC , Muller M ((2011) ) pROC: An open-source package for R and+to analyze and compare ROC curves. BMC Bioinformatics 12: , 77. |
[38] | Saresella M , Calabrese E , Marventano I , Piancone F , Gatti A , Calvo MG , Nemni R , Clerici M ((2010) ) PD1 negative and PD1 positive CD4+T regulatory cells in mild cognitive impairment and Alzheimer’s disease. J Alzheimers Dis 21: , 927–938. |
[39] | Torres KC , Araújo Pereira P , Lima GS , Bozzi IC , Rezende VB , Bicalho MA , Moraes EN , Miranda DM , Romano-Silva MA ((2013) ) Increased frequency of T cells expressing IL-10 in Alzheimer disease but not in late-onset depression patients. Prog Neuropsychopharmacol Biol Psychiatry 47: , 40–45. |
[40] | Janelidze S , Teunissen CE , Zetterberg H , Allué JA , Sarasa L , Eichenlaub U , Bittner T , Ovod V , Verberk IMW , Toba K , Nakamura A , Bateman RJ , Blennow K , Hansson O ((2021) ) Head-to-head comparison of 8 plasma amyloid-β 42/40 assays in Alzheimer disease. JAMA Neurol 78: , 1375–1382. |
[41] | De Meyer S , Schaeverbeke JM , Verberk IMW , Gille B , De Schaepdryver M , Luckett ES , Gabel S , Bruffaerts R , Mauroo K , Thijssen EH , Stoops E , Vanderstichele HM , Teunissen CE , Vandenberghe R , Poesen K ((2020) ) Comparison of ELISA- and SIMOA-based quantification of plasma Aβ ratios for early detection of cerebral amyloidosis. Alzheimers Res Ther 12: , 162. |
[42] | Li WW , Shen YY , Tian DY , Bu XL , Zeng F , Liu YH , Chen Y , Yao XQ , Li HY , Chen DW , Zhou FY , Yang H , Li QM , Bao WQ , Guan YH , Zhou HD , Jin RB , Wang YJ ((2019) ) Brain amyloid-beta deposition and blood biomarkers in patients with clinically diagnosed Alzheimer’s disease. J Alzheimers Dis 69: , 169–178. |
[43] | Rabe C , Bittner T , Jethwa A , Suridjan I , Manuilova E , Friesenhahn M , Stomrud E , Zetterberg H , Blennow K , Hansson O ((2023) ) Clinical performance and robustness evaluation of plasma amyloid-β(42/40) prescreening. Alzheimers Dement 19: , 1393–1402. |
[44] | Palmqvist S , Janelidze S , Quiroz YT , Zetterberg H , Lopera F , Stomrud E , Su Y , Chen Y , Serrano GE , Leuzy A , Mattsson-Carlgren N , Strandberg O , Smith R , Villegas A , Sepulveda-Falla D , Chai X , Proctor NK , Beach TG , Blennow K , Dage JL , Reiman EM , Hansson O ((2020) ) Discriminative accuracy of plasma phospho-tau217 for Alzheimer disease vs other neurodegenerative disorders. JAMA 324: , 772–781. |
[45] | Yu L , Boyle PA , Janelidze S , Petyuk VA , Wang T , Bennett DA , Hansson O , Schneider JA (2023) Plasma p-tau181 and p-tau217 in discriminating PART, AD and other key neuropathologies in older adults. Acta Neuropathol. doi: 10.1007/s00401-023-02570-4. |
[46] | Rodriguez S , Hug C , Todorov P , Moret N , Boswell SA , Evans K , Zhou G , Johnson NT , Hyman BT , Sorger PK , Albers MW , Sokolov A ((2021) ) Machine learning identifies candidates for drug repurposing in Alzheimer’s disease. Nat Commun 12: , 1033. |
[47] | Sirkis DW , Bonham LW , Johnson TP , La Joie R , Yokoyama JS ((2022) ) Dissecting the clinical heterogeneity of early-onset Alzheimer’s disease. Mol Psychiatry 27: , 2674–2688. |
[48] | Mendez MF ((2017) ) Early-onset Alzheimer disease. Neurol Clin 35: , 263–281. |
[49] | Goate A , Chartier-Harlin MC , Mullan M , Brown J , Crawford F , Fidani L , Giuffra L , Haynes A , Irving N , James L , Mant R , Newton P , Rooke K , Roques P , Talbot C , Pericak-Vance M , Roses A , Williamson R , Rossor M , Owen M , Hardy J ((1991) ) Segregation of a missense mutation in the amyloid precursor protein gene with familial Alzheimer’s disease. Nature 349: , 704–706. |
[50] | Ito M , Komai K , Mise-Omata S , Iizuka-Koga M , Noguchi Y , Kondo T , Sakai R , Matsuo K , Nakayama T , Yoshie O , Nakatsukasa H , Chikuma S , Shichita T , Yoshimura A ((2019) ) Brain regulatory T cells suppress astrogliosis and potentiate neurological recovery. Nature 565: , 246–250. |
[51] | Liston A , Dooley J , Yshii L ((2022) ) Brain-resident regulatory T cells and their role in health and disease. Immunol Lett 248: , 26–30. |
[52] | Wohleb ES , Delpech JC ((2017) ) Dynamic cross-talk between microglia and peripheral monocytes underlies stress-induced neuroinflammation and behavioral consequences. Prog Neuropsychopharmacol Biol Psychiatry 79: , 40–48. |
[53] | Klein Geltink RI , Kyle RL , Pearce EL ((2018) ) Unraveling the complex interplay between T cell metabolism and function. Annu Rev Immunol 36: , 461–488. |
[54] | Au HC , Seo BB , Matsuno-Yagi A , Yagi T , Scheffler IE ((1999) ) The NDUFA1 gene product (MWFE protein) is essential for activity of complex I in mammalian mitochondria. Proc Natl Acad Sci U S A 96: , 4354–4359. |
[55] | Weidner U , Geier S , Ptock A , Friedrich T , Leif H , Weiss H ((1993) ) The gene locus of the proton-translocating NADH: Ubiquinone oxidoreductase in Escherichia coli: Organization of the 14 genes and relationship between the derived proteins and subunits of mitochondrial complex I. J Mol Biol 233: , 109–122. |
[56] | Formosa LE , Dibley MG , Stroud DA , Ryan MT ((2018) ) Building a complex complex: Assembly of mitochondrial respiratory chain complex I. Semin Cell Dev Biol 76: , 154–162. |
[57] | Yadav N , Kumar S , Kumar R , Srivastava P , Sun L , Rapali P , Marlowe T , Schneider A , Inigo JR , O’Malley J , Londonkar R , Gogada R , Chaudhary AK , Yadava N , Chandra D ((2016) ) Mechanism of neem limonoids-induced cell death in cancer: Role of oxidative phosphorylation. Free Radic Biol Med 90: , 261–271. |
[58] | Huttula S , Väyrynen H , Helisalmi S , Kytövuori L , Luukkainen L , Hiltunen M , Remes AM , Krüger J ((2022) ) NDUFA1 p.Gly32Arg variant in early-onset dementia. Neurobiol Aging 114: , 113–116. |
[59] | Loeffen J , Smeets R , Smeitink J , Triepels R , Sengers R , Trijbels F , van den Heuvel L ((1999) ) The human NADH: Ubiquinone oxidoreductase NDUFS5 (15 kDa) subunit: cDNA cloning, chromosomal localization, tissue distribution and the absence of mutations in isolated complex I-deficient patients. J Inherit Metab Dis 22: , 19–28. |
[60] | Formosa LE , Muellner-Wong L , Reljic B , Sharpe AJ , Jackson TD , Beilharz TH , Stojanovski D , Lazarou M , Stroud DA , Ryan MT ((2020) ) Dissecting the roles of mitochondrial complex I intermediate assembly complex factors in the biogenesis of complex I. Cell Rep 31: , 107541. |
[61] | Signes A , Fernandez-Vizarra E ((2018) ) Assembly of mammalian oxidative phosphorylation complexes I-V and supercomplexes. Essays Biochem 62: , 255–270. |
[62] | Manczak M , Kandimalla R , Yin X , Reddy PH ((2019) ) Mitochondrial division inhibitor 1 reduces dynamin-related protein 1 and mitochondrial fission activity. Hum Mol Genet 28: , 177–199. |
[63] | Manczak M , Jung Y , Park BS , Partovi D , Reddy PH ((2005) ) Time-course of mitochondrial gene expressions in mice brains: Implications for mitochondrial dysfunction, oxidative damage, and cytochrome c in aging. J Neurochem 92: , 494–504. |
[64] | Stroud DA , Surgenor EE , Formosa LE , Reljic B , Frazier AE , Dibley MG , Osellame LD , Stait T , Beilharz TH , Thorburn DR , Salim A , Ryan MT ((2016) ) Accessory subunits are integral for assembly and function of human mitochondrial complex I. Nature 538: , 123–126. |
[65] | Swerdlow RH ((2018) ) Mitochondria and mitochondrial cascades in Alzheimer’s disease. J Alzheimers Dis 62: , 1403–1416. |
[66] | Stojakovic A , Chang SY , Nesbitt J , Pichurin NP , Ostroot MA , Aikawa T , Kanekiyo T , Trushina E ((2021) ) Partial inhibition of mitochondrial complex I reduces tau pathology and improves energy homeostasis and synaptic function in 3xTg-AD mice. J Alzheimers Dis 79: , 335–353. |
[67] | Mahapatra G , Gao Z , Bateman JR , 3rd, Lockhart SN , Bergstrom J , DeWitt AR , Piloso JE , Kramer PA , Gonzalez-Armenta JL , Amick KA , Casanova R , Craft S , Molina AJA ((2023) ) Blood-based bioenergetic profiling reveals differences in mitochondrial function associated with cognitive performance and Alzheimer’s disease. Alzheimers Dement 19: , 1466–1478. |
[68] | Holthaus L , Sharma V , Brandt D , Ziegler AG , Jastroch M , Bonifacio E ((2021) ) Functional and metabolic fitness of human CD4(+) T lymphocytes during metabolic stress. Life Sci Alliance 4: , e202101013. |
[69] | Tiwari-Heckler S , Robson SC , Longhi MS ((2022) ) Mitochondria drive immune responses in critical disease. Cells 11: , 4113. |
[70] | O’Neill LAJ , Kishton RJ , Rathmell J ((2016) ) A guide to immunometabolism for immunologists. Nat Rev Immunol 16: , 553–565. |
[71] | Weinberg Samuel E , Sena Laura A , Chandel Navdeep S ((2015) ) Mitochondria in the regulation of innate and adaptive immunity. Immunity 42: , 406–417. |
[72] | Rosenkranz D , Weyer S , Tolosa E , Gaenslen A , Berg D , Leyhe T , Gasser T , Stoltze L ((2007) ) Higher frequency of regulatory T cells in the elderly and increased suppressive activity in neurodegeneration. J Neuroimmunol 188: , 117–127. |
[73] | Baruch K , Rosenzweig N , Kertser A , Deczkowska A , Sharif AM , Spinrad A , Tsitsou-Kampeli A , Sarel A , Cahalon L , Schwartz M ((2015) ) Breaking immune tolerance by targeting Foxp3+regulatory T cells mitigates Alzheimer’s disease pathology. Nat Commun 6: , 7967. |
[74] | Fu J , Duan J , Mo J , Xiao H , Huang Y , Chen W , Xiang S , Yang F , Chen Y , Xu S ((2020) ) Mild cognitive impairment patients have higher regulatory T-cell proportions compared with Alzheimer’s disease-related dementia patients. Front Aging Neurosci 12: , 624304. |
[75] | Aliseychik M , Patrikeev A , Gusev F , Grigorenko A , Andreeva T , Biragyn A , Rogaev E ((2020) ) Dissection of the human T-cell receptor γ gene repertoire in the brain and peripheral blood identifies age- and Alzheimer’s disease-associated clonotype profiles. Front Immunol 11: , 12. |
[76] | Nevalainen T , Autio A , Hurme M ((2022) ) Composition of the infiltrating immune cells in the brain of healthy individuals: Effect of aging. Immun Ageing 19: , 45. |
[77] | Zhang T , Liu N , Wei W , Zhang Z , Li H ((2021) ) Integrated analysis of weighted gene coexpression network analysis identifying six genes as novel biomarkers for Alzheimer’s disease. Oxid Med Cell Longev 2021: , 9918498. |
[78] | Pérez-González M , Badesso S , Lorenzo E , Guruceaga E , Pérez-Mediavilla A , García-Osta A , Cuadrado-Tejedor M ((2021) ) Identifying the main functional pathways associated with cognitive resilience to Alzheimer’s disease. Int J Mol Sci 22: , 9120. |
[79] | Bulati M , Buffa S , Martorana A , Gervasi F , Camarda C , Azzarello DM , Monastero R , Caruso C , Colonna-Romano G ((2015) ) Double negative (IgG+IgD –CD27 –) B cells are increased in a cohort of moderate-severe Alzheimer’s disease patients and show a pro-inflammatory trafficking receptor phenotype. J Alzheimers Dis 44: , 1241–1251. |
[80] | Busse M , Michler E , von Hoff F , Dobrowolny H , Hartig R , Frodl T , Busse S ((2017) ) Alterations in the peripheral immune system in dementia. J Alzheimers Dis 58: , 1303–1313. |
[81] | Schwartz M , Shechter R ((2010) ) Protective autoimmunity functions by intracranial immunosurveillance to support the mind: The missing link between health and disease. Mol Psychiatry 15: , 342–354. |
[82] | Schwartz M , Shechter R ((2010) ) Systemic inflammatory cells fight off neurodegenerative disease. Nat Rev Neurol 6: , 405–410. |
[83] | Chacko A , Delbaz A , Walkden H , Basu S , Armitage CW , Eindorf T , Trim LK , Miller E , West NP , St John JA , Beagley KW , Ekberg JAK ((2022) ) Chlamydia pneumoniae can infect the central nervous system via the olfactory and trigeminal nerves and contributes to Alzheimer’s disease risk. Sci Rep 12: , 2759. |
[84] | Tyrrell DJ , Bharadwaj MS , Jorgensen MJ , Register TC , Molina AJA ((2016) ) Blood cell respirometry is associated with skeletal and cardiac muscle bioenergetics: Implications for a minimally invasive biomarker of mitochondrial health. Redox Biol 10: , 65–77. |
[85] | Chacko BK , Kramer PA , Ravi S , Johnson MS , Hardy RW , Ballinger SW , Darley-Usmar VM ((2013) ) Methods for defining distinct bioenergetic profiles in platelets, lymphocytes, monocytes, and neutrophils, and the oxidative burst from human blood. Lab Invest 93: , 690–700. |
[86] | Tyrrell DJ , Bharadwaj MS , Jorgensen MJ , Register TC , Shively C , Andrews RN , Neth B , Dirk Keene C , Mintz A , Craft S , Molina AJA ((2017) ) Blood-based bioenergetic profiling reflects differences in brain bioenergetics and metabolism. Oxid Med Cell Longev 2017: , 7317251. |
[87] | Terada T , Therriault J , Kang MSP , Savard M , Pascoal TA , Lussier F , Tissot C , Wang YT , Benedet A , Matsudaira T , Bunai T , Obi T , Tsukada H , Ouchi Y , Rosa-Neto P ((2021) ) Mitochondrial complex I abnormalities is associated with tau and clinical symptoms in mild Alzheimer’s disease. Mol Neurodegener 16: , 28. |


