
What Threshold of Amyloid Reduction Is Necessary to Meaningfully Improve Cognitive Function in Transgenic Alzheimer’s Disease Mice?
Abstract
Background:
Amyloid-β plaques (Aβ) are associated with Alzheimer’s disease (AD). Pooled assessment of amyloid reduction in transgenic AD mice is critical for expediting anti-amyloid AD therapeutic research.
Objective:
The mean threshold of Aβ reduction necessary to achieve cognitive improvement was measured via pooled assessment (n = 594 mice) of Morris water maze (MWM) escape latency of transgenic AD mice treated with substances intended to reduce Aβ via reduction of beta-secretase cleaving enzyme (BACE).
Methods:
Machine learning and statistical methods identified necessary amyloid reduction levels using mouse data (e.g., APP/PS1, LPS, Tg2576, 3xTg-AD, control, wild type, treated, untreated) curated from 22 published studies.
Results:
K-means clustering identified 4 clusters that primarily corresponded with level of Aβ: untreated transgenic AD control mice, wild type mice, and two clusters of transgenic AD mice treated with BACE inhibitors that had either an average 25% “medium reduction” of Aβ or 50% “high reduction” of Aβ compared to untreated control. A 25% Aβ reduction achieved a 28% cognitive improvement, and a 50% Aβ reduction resulted in a significant 32% improvement compared to untreated transgenic mice (p < 0.05). Comparatively, wild type mice had a mean 41% MWM latency improvement over untreated transgenic mice (p < 0.05). BACE reduction had a lesser impact on the ratio of Aβ42 to Aβ40. Supervised learning with an 80% –20% train-test split confirmed Aβ reduction was a key feature for predicting MWM escape latency (R2 = 0.8 to 0.95).
Conclusions:
Results suggest a 25% reduction in Aβ as a meaningful treatment threshold for improving transgenic AD mouse cognition.
INTRODUCTION
Dementia is a term used to describe the deterioration of the mind through behavior, memory, and language [1, 2]. One of the most common forms of dementia is Alzheimer’s disease (AD). AD is characterized as the decline in cognition that affects behavior and body function simultaneously [3]. The Amyloid Cascade Hypothesis has long been among the leading theories of causation of AD [4]. It postulates that the accumulation of amyloid-β (Aβ) protein in the brain is a key event in the pathogenesis of AD [3, 4]. Aβ is produced by the cleavage of amyloid-β protein precursor (AβPP) by β-secretase (BACE) and γ-secretase enzymes. Two major forms of Aβ are produced: Aβ40 and Aβ42. Aβ40 is more abundant, but Aβ42 is more prone to aggregation and is believed to be the main component of amyloid plaques [5]. Additionally, Aβ can exist in both soluble and insoluble forms, which may have different effects on the brain. Insoluble Aβ refers to Aβ that has aggregated into fibrils, which can form amyloid plaques in the brain. These plaques are a hallmark of AD and are believed to disrupt communication between neurons, leading to neuronal dysfunction and death. Soluble Aβ, on the other hand, refers to Aβ that has not aggregated into fibrils and remains in a soluble form in the brain [6, 7]. Soluble Aβ can also have toxic effects on neurons and has been implicated in synaptic dysfunction and neuronal damage [8, 9].
A recent in-depth review on the role of Aβ in AD presented evidence from multiple studies that patients with more severe AD pathology typically have significantly higher levels of Aβ [10]. The levels of soluble Aβ are often considered a better predictor of the degree of neurodegeneration than the levels of insoluble Aβ [11]. As such, targeting soluble Aβ may be a potential therapeutic strategy. A recent meta-analysis of 14 randomized trials illustrated that the pooled estimate for the effect of reducing amyloid levels by 0.1 standardized uptake value ratio units was an improvement in the Mini-Mental State Examination score of 0.03 (95% confidence interval –0.06 to 0.1) points [12].
A recent report discussed the great potential for anti-amyloid therapies like lecanemab and aducanumab to become an eventual standard of care treatment for clinical AD [13]. Patients who received lecanemab had a significantly slower rate of cognitive and functional decline compared to those who received a placebo. However, the increased risk of amyloid-related imaging abnormalities with lecanemab warrant close monitoring and additional longitudinal follow-up [14]. Future research is necessary to determine if and when at-risk, asymptomatic patients should initiate an anti-amyloid therapy to potentially stave off AD before clinical symptoms manifest.
Transgenic mice present a unique experimental paradigm to expedite clinical research and successful therapeutic translation and have been pivotal to AD research. For a recent comprehensive review on transgenic AD mouse models, please see Sanchez-Varo et al. [15]. Briefly, mouse models enable the assessment of multi-scalar, multi-factorial pathological mechanisms and initial drug safety profiles that cannot be easily or ethically tested in humans. Transgenic AD mice are genetically engineered to express human genes that are associated with the development of AD. By first testing in transgenic mice, researchers can more quickly and cost effectively screen drug candidates and potential doses necessary for a positive outcome. As such, understanding the pooled effect size of amyloid reduction with anti-amyloid therapy in transgenic AD mice is pivotal for AD mechanism examination and improving anti-amyloid drug protocols.
Transgenic AD mouse cognitive function can be measured with a variety of tests. One of the most popular cognitive assessments is the Morris water maze (MWM), which tests spatial memory and learning. In the MWM, transgenic AD mice undergo repeated training to find a hidden platform within a cold-water bath [16]. Mice use visual and spatial clues to “remember” where the platform is located so they can more quickly escape the cold water. After a pre-determined number of trials, mice are timed to see how quickly they find the platform. The amount of time it takes to find the platform is called the MWM escape latency. Faster MWM escape latency is analogous to improved cognitive performance.
The absolute levels of Aβ may not always reflect the severity of the disease. For example, in some cases, mice with relatively low levels of Aβ may still show signs of cognitive impairment, while mice with high levels of Aβ may not [17]. Similarly, meta-analysis of multiple experimental mouse studies, which examined only Aβ or the ratio of Aβ42 to Aβ40 found a weak trend with cognition [18]. Further, pooled analysis comparing the impact of Aβ and phosphorylated tau found that the impact of phosphorylated tau far exceeded Aβ in transgenic AD mice [19]. However, there has not been a pooled estimate of amyloid reduction in transgenic mice treated with substances meant to decrease Aβ. Comparing the multi-study pooled estimate of Aβ reduction to the analogous pooled clinical estimate of Aβ reduction [12] would provide critical insight for future translational research.
The goal of this study was to determine the mean threshold of Aβ reduction necessary to achieve a specific quantitative threshold of cognitive improvement in transgenic AD mice treated with anti-amyloid therapies. Prior transgenic AD mice studies that used therapeutic substances to directly or indirectly reduce BACE have widely varied in their ability to reduce Aβ and improve cognition. The present study determines the mean Aβ reduction necessary to achieve meaningful cognitive improvement in transgenic AD mice treated with substances that either directly or indirectly reduce or inhibit BACE. Knowing such aggregate effect sizes is crucial for planning future anti-amyloid preclinical and clinical therapeutic studies. Here we perform statistical analysis and machine learning on a carefully curated pool of published transgenic AD mouse data to determine the average threshold of Aβ reduction necessary to achieve meaningful improvement in MWM escape latency.
METHODS
The following two questions guided the methodological framework: 1) By how much does Aβ need to be reduced (via BACE inhibitors) before there is a meaningful decrease in transgenic AD mouse MWM escape latency (e.g., improved cognition)? 2) What measured features are most important to predicting transgenic AD mouse MWM escape latency? Statistical methods were used in tandem with machine learning algorithms to infer answers from the aggregated experimental data.
Inclusion and exclusion criteria
The experimental data collected for this study was extracted and curated from the peer-reviewed, published literature. Studies were identified through key term searches in PubMed and PubMed Central. The terms searched were “Alzheimer’s disease”, “amyloid-beta”, “beta-secretase”, and “Morris Water Maze”. Searches also included synonyms, possible variations in terms or phrases, or abbreviations. Treatments included substances that inhibited BACE, whether a traditional pharmacological BACE inhibitor or a natural, biologically active substance like Vitamin D. Included studies must have provided quantifiable data for Aβ levels and quantifiable data for MWM escape latency on day 1 and either day 4 or day 5. Day 1 was used as the baseline performance and day 4 or day 5 was used to assess differences in cognition. Day 4 or day 5 was previously determined by prior work [18–20] to be optimal for measuring differences in cognition without risk of overtraining or undertraining the mice on the MWM task. To maximize overall included sample size, MWM escape latency from either day 4 or day 5 in each study was an acceptable measure for study inclusion. Only full text published articles in English were considered for inclusion. Figure 1 illustrates the PRISMA diagram for article inclusion. Table 1 illustrates the full list of included articles and extracted data.
Fig. 1
Prisma flow diagram for the systematic review of articles related to AD BACE. Once included, data was carefully curated into a relational database.
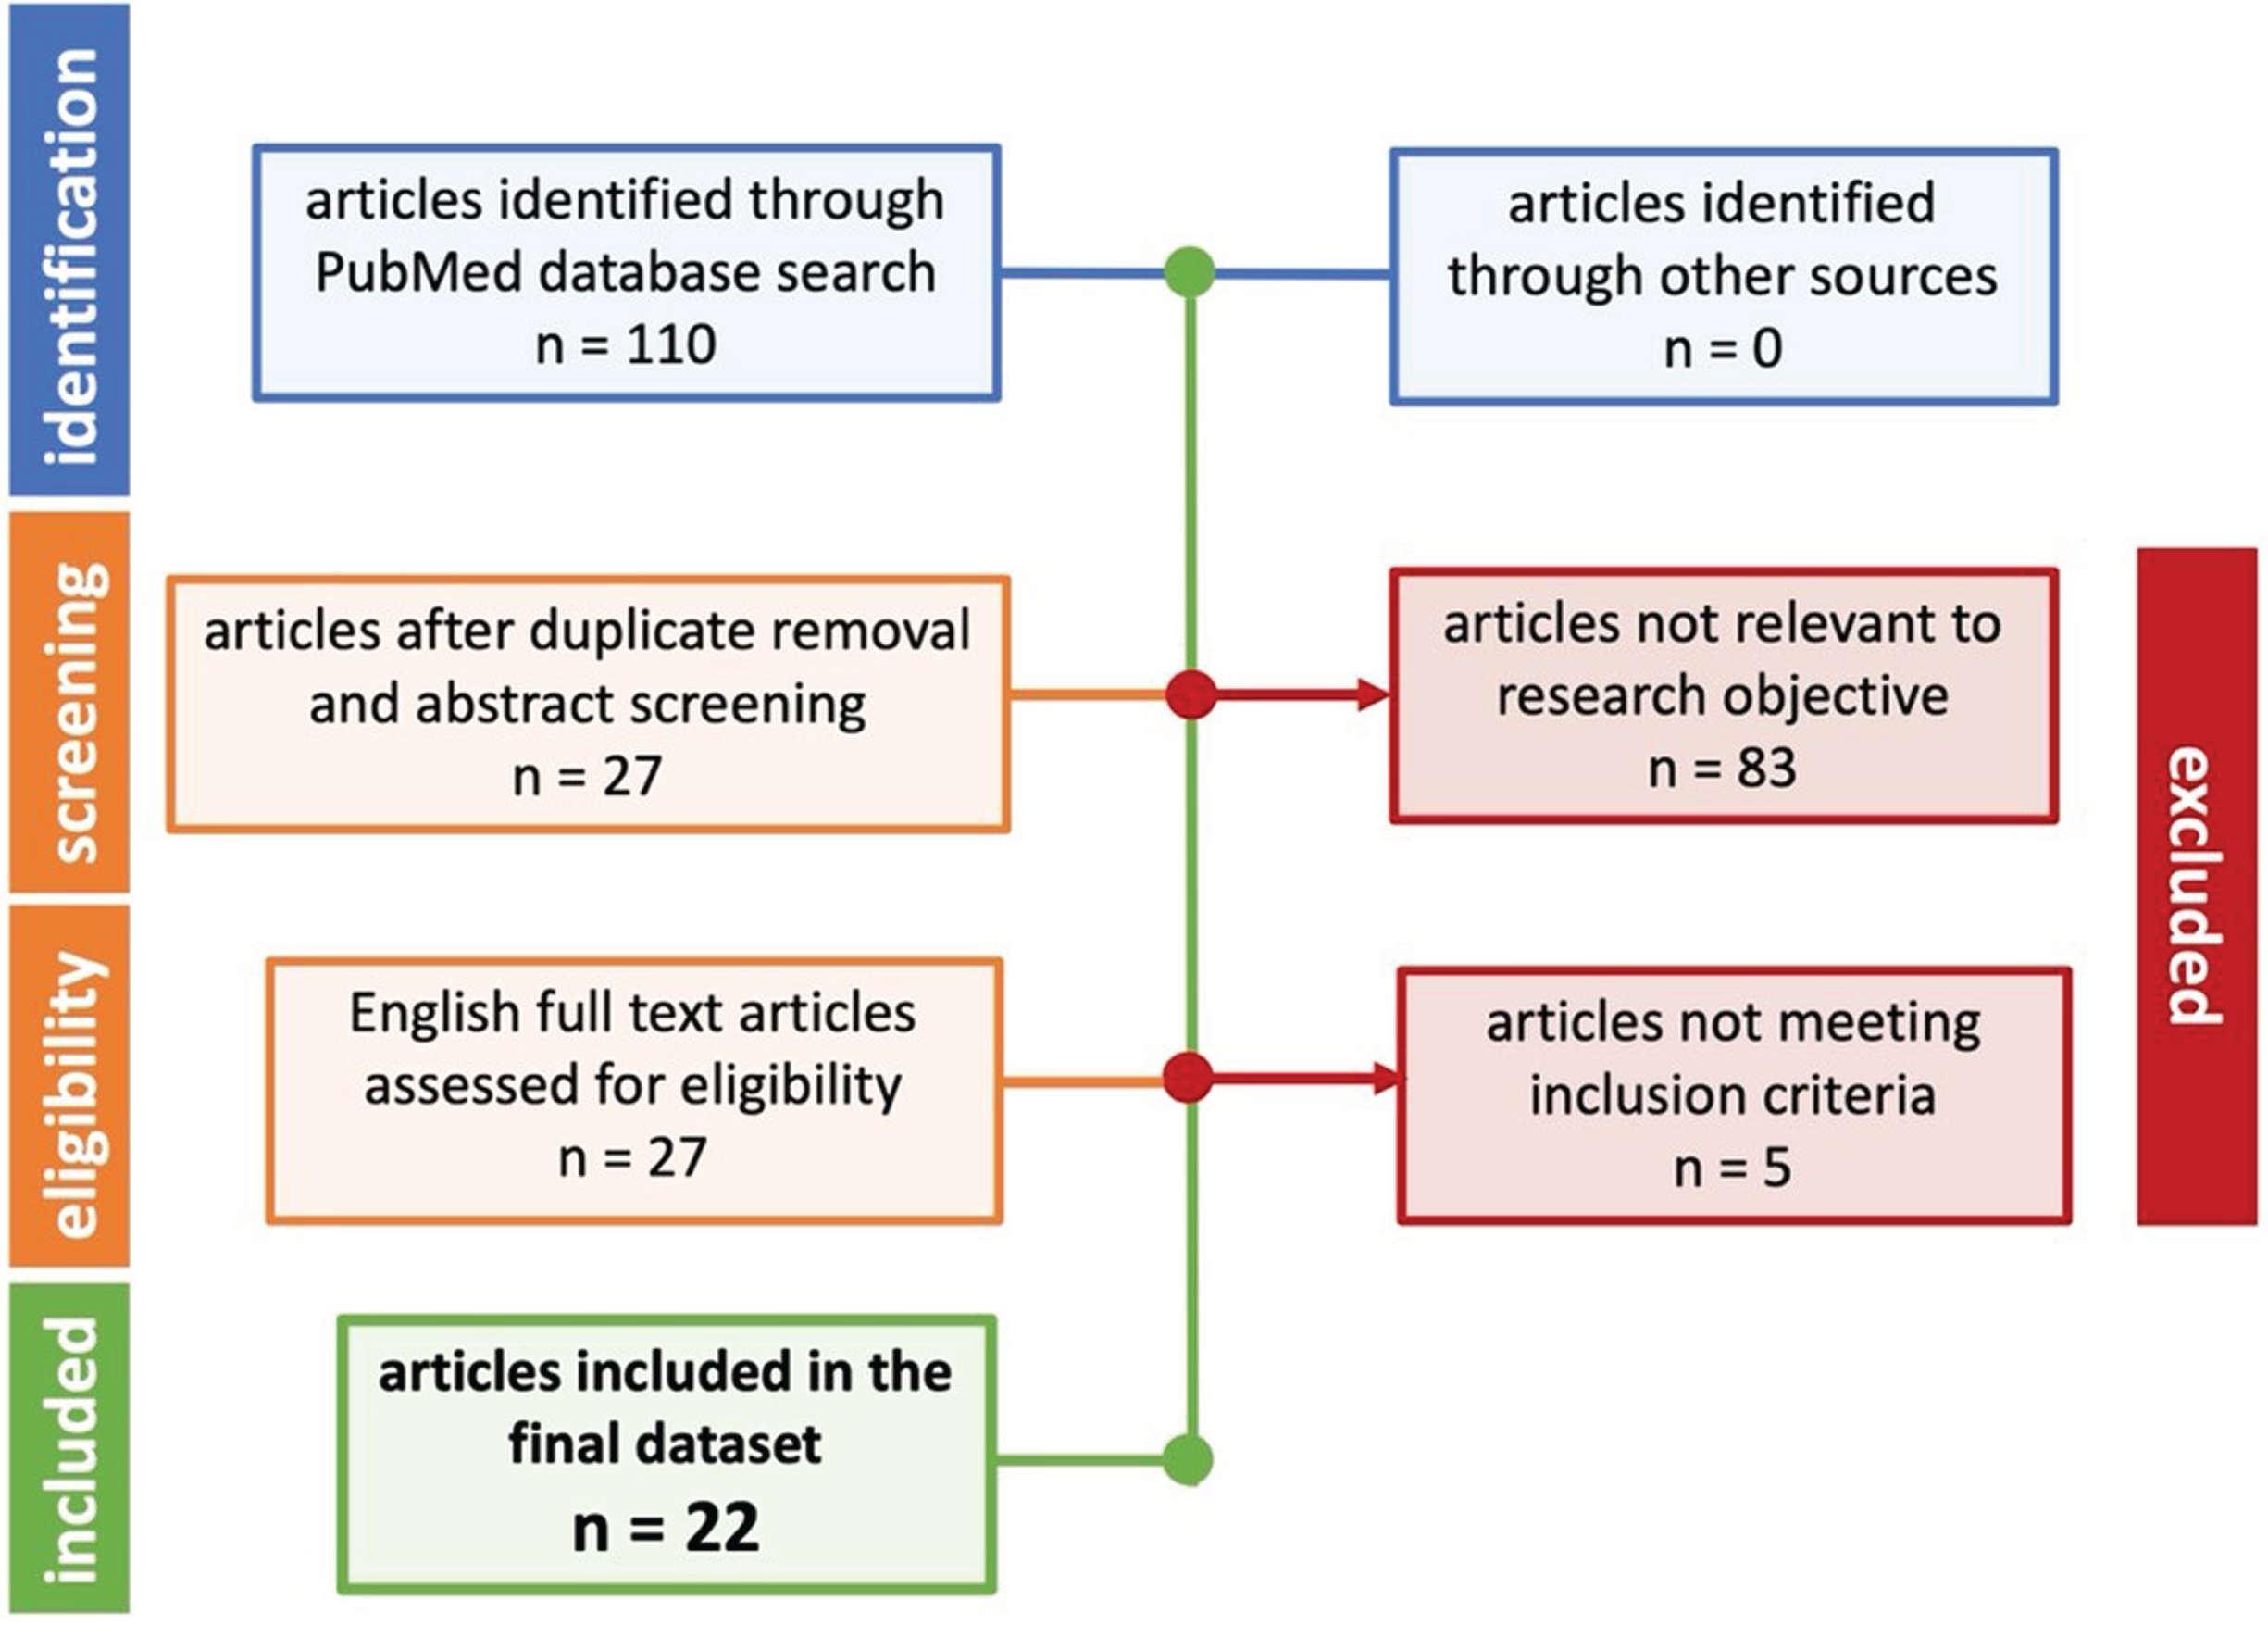
Table 1
List of included mouse type, mouse type sample size, and included study citations
| Mouse type | Sample size | Citations |
| 3xTg-AD | 116 | [29–32] |
| Aβ1 -- 42 | 50 | [33] |
| APP/PS1 | 200 | [24, 34–40] |
| LPS | 30 | [26, 41] |
| SAMP8 | 30 | [27] |
| SAMR1 | 10 | [27] |
| Tg2576 | 112 | [25, 28, 42–45] |
| Wild Type | 46 | [24, 28, 39, 42, 45] |
| TOTAL | 594 |
Data curation
Data curation protocols with follow-up quality control by trained curators were as previously described [21]. Briefly, curators were trained to collect quantitative mouse model data and descriptive methods from full text articles downloaded from PubMed Central or through online e-journal subscriptions available from Georgia Institute of Technology or Emory University. A minimum of 3 curators separately entered the values for all features and marked missing values as null within a relational database. Then, a project-specific curation quality control manager checked all data to ensure veracity. Tabular data was directly extracted from the original experimental studies and entered into the corresponding relational database fields. Quantitative data from graphs was extracted from the original experimental studies using WebPlot Digitizer and exported to the relational database. The final pooled dataset was exported into a standard spreadsheet conducive for follow-up analysis in Microsoft Excel and Python SciKitLearn.
The fields of the relational database and corresponding features of the dataset utilized by this study were guided by our prior work analyzing transgenic AD mouse data [18–20]. Feature definitions are briefly described here with comprehensive definitions provided in the Results. Continuous features included Aβ42 level, Aβ40 level, ratio of Aβ42 to Aβ40, BACE level, MWM experimental latency (on day 4 and/or day 5), MWM original latency (on day 1). Continuous features were also calculated as percentage of untreated control in each original study. Categorical features include mouse genotype, mouse treatment status (control or treated), significance of BACE level as reported in the original study, significance of Aβ42 as reported by the original study, and solubility status of the curated Aβ measurement (soluble or insoluble).
Data processing
The primary analysis was to assess MWM as a function of Aβ reduction. As noted in the Inclusion Criteria, MWM escapes latency was captured for day 4 and/or day 5 and compared to day 1. Specifically, MWM escape latency on day 4 was calculated as percent of MWM escape latency on day 1. Likewise, MWM escape latency on day 5 was calculated as a percent of MWM escape latency on day 1. In studies where both day 4 and day 5 data were available, the average of the day 4 and day 5 measurement was utilized such that there was a single MWM escape latency measurement from each study. Due to a lack of measured feature uniformity across original studies, the Aβ and BACE metrics were converted to percent of control on a per-study basis. All MWM measurements were first converted into units of seconds before being standardized into percentage-based features to normalize for any experimental set-up differences across studies [18–20].
There were no missing values for features related to Aβ42 level, MWM escape latency, or BACE level. However, about 20% of the samples were missing values for either Aβ40 and/or the Aβ42 to Aβ40 ratio. Missing features were imputed using the k-nearest algorithm (kNN). The kNN algorithm used the five nearest neighbors to impute the missing value. Prior to clustering features were processed to remove skew, which is otherwise known to adversely impact machine learning algorithms. Finally, a 5% outlier detection and removal were performed in Python using the isolation forest algorithm.
Statistical analysis
Statistical analysis was performed to compare features between clusters identified from unsupervised learning. When comparing two or more continuous features, a two-tailed student’s t-test was performed using an alpha of 0.05 to identify significant differences between groups. When comparing two or more categorical features, a Chi Square analysis was performed at an alpha of 0.05. In the case of multiple comparisons for either t-test or Chi-Square, a Bonferroni correction with a family-wise alpha of 0.05 was utilized to prevent a Type I error. Statistical analysis was performed in Microsoft Excel.
Unsupervised learning
Unsupervised learning enables the elucidation of patterns from unlabeled data. Here two different forms of unsupervised learning were performed together, dimensionality reduction and clustering, to determine the best underlying grouping or “thresholds” of Aβ reduction in transgenic AD mice treated with BACE inhibitors. Dimensionality reduction algorithms minimize the number of features utilized to explain the preponderance of variance. Clustering algorithms take unlabeled data and use the measured features to cluster the samples into groups that are most similar. Prior work has shown that utilizing dimensional reduction prior to clustering can improve the clustering patterns and improve separability of clusters [22]. Here we perform PCA followed by k-means clustering. Silhouette analysis was performed to determine the optimal number and separability of clusters [23]. All unsupervised learning was performed in Python SciKitLearn using both continuous and categorical features.
Supervised machine learning
Supervised machine learning was used to assess how well the identified thresholds from unsupervised learning could be used to predict MWM escape latency. The data was analyzed with and without feature selection. As is standard in machine learning, a set of traditional supervised algorithms were utilized: linear regression, ridge regression, polynomial ridge regression, decision tree, and tuned decision tree. Synthetic minority oversampling (SMOTE) was used to balance the data set. The data was randomly partitioned into 80% and 20% splits. The 80% split was used for model training and the 20% split was used as held-out test set. Model performance was measured using R2. All supervised learning was performed in Python SciKitLearn.
RESULTS
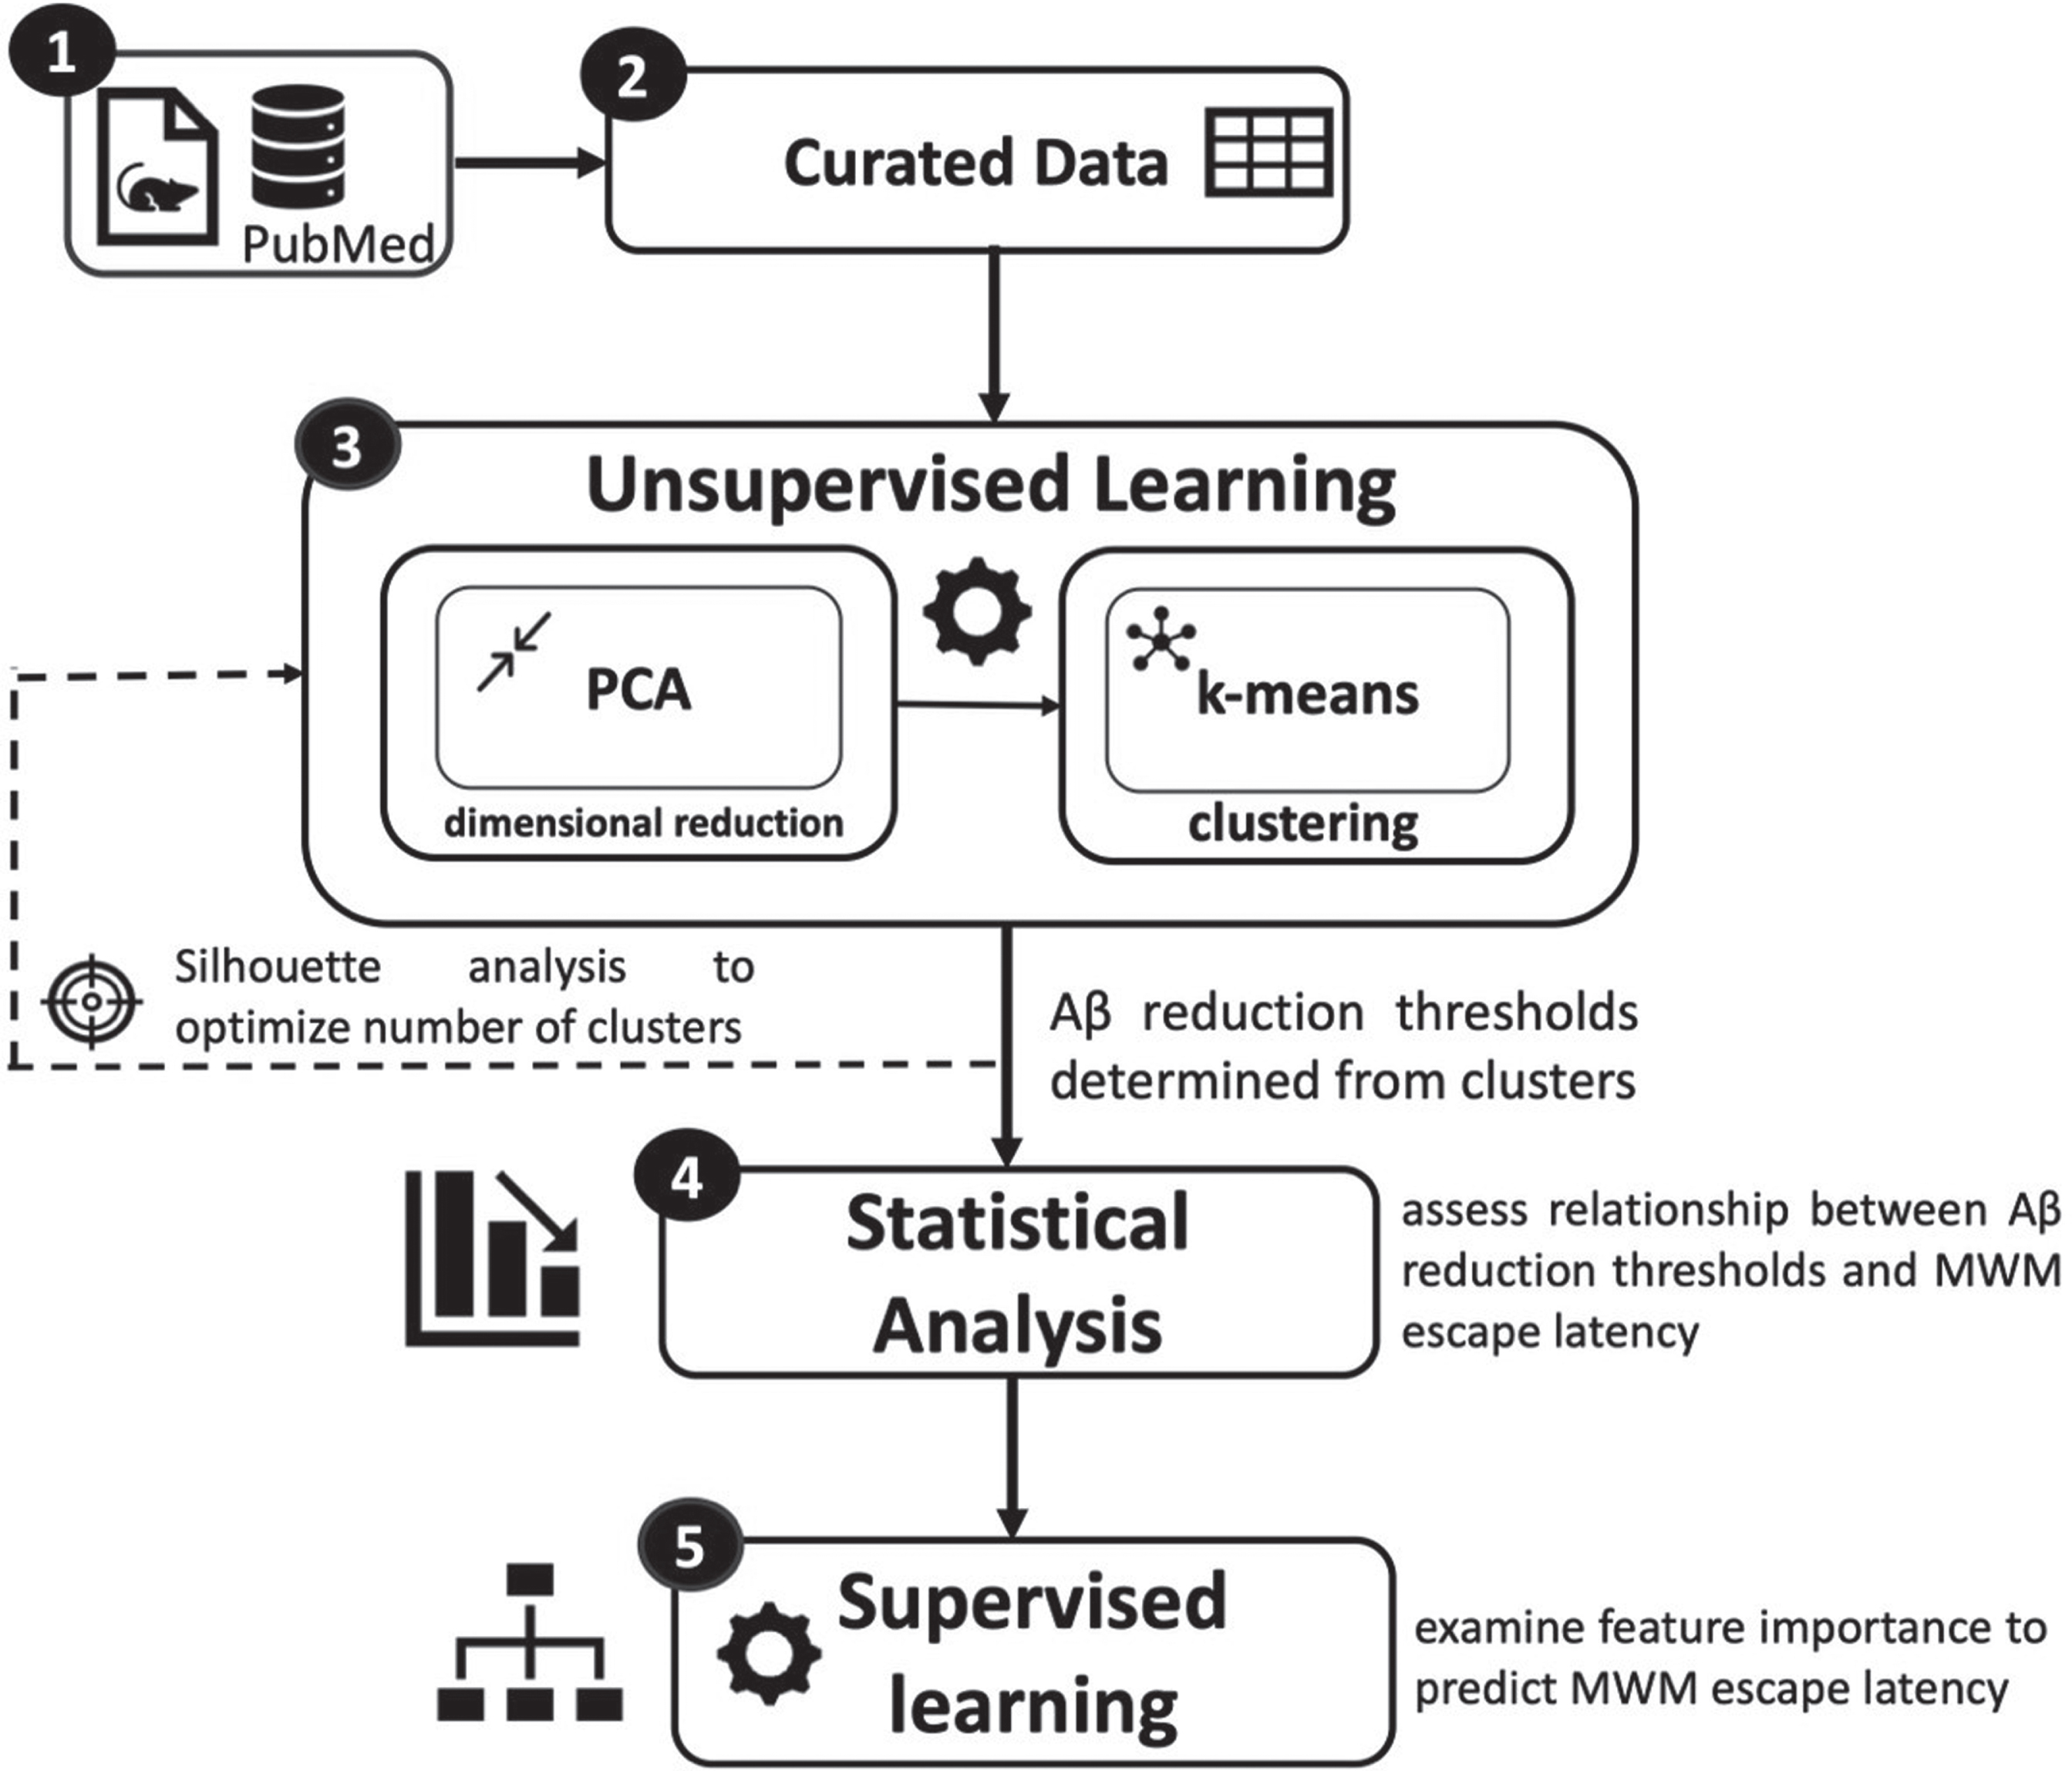
A combination of statistical analysis and machine learning was utilized to quantify the mean reduction of Aβ necessary to achieve significant and meaningful improvements in MWM escape latency. Figure 2 illustrates the analysis pipeline. First, a total of 22 journal articles with transgenic AD mouse data met the study’s inclusion criteria. Second, the data from the original articles (n = 594 mice) were curated to obtain a set of continuous and categorical features necessary for analysis. Third, unsupervised learning identified the clusters used to infer potential mean Aβ reduction thresholds necessary for meaningful improvement of MWM escape latency. Fourth, statistical analysis was performed to determine if the identified Aβ reduction thresholds significantly improved MWM escape latency. Finally, supervised learning algorithms were utilized to assess feature importance in predicting MWM escape latency.
Fig. 2
Overview of data pipeline and analysis. Continuous and categorical features were curated from 22 journal articles. A combination of machine learning and statistical analysis techniques were utilized to quantify Aβ reduction thresholds necessary to meaningfully improve AD transgenic mouse cognition measured via the Morris Water Maze escape latency.
A summary of the aggregated sample sizes is shown in Table 1. There was a total of 594 mice from 7 mouse types: 3xTg-AD, Tg2576, APP/PS1, Aβ1–42, APP/PS1, LPS, SAMP8, SAMR1, and wild type. The largest samples sizes were from APP/PS1 (n = 200), 3xTg-AD (n = 116), and Tg2576 (n = 112) transgenic AD mouse genotypes. Each mouse model was split into control or treated. The treated mice consisted of approximately 65% of the total samples. Treatments for directly or indirectly reducing or inhibiting BACE and/or Aβ varied with examples including traditional BACE inhibitors like 2,2′,4′-Trihydroxychalcone [24] or GRL-8234 [25], a plant extract like 4-O-methylhonokiol [26], a nutritional supplement combination of vitamin D and reservatol [27], and behavior modifying treatments like cognitive stimulation [28].
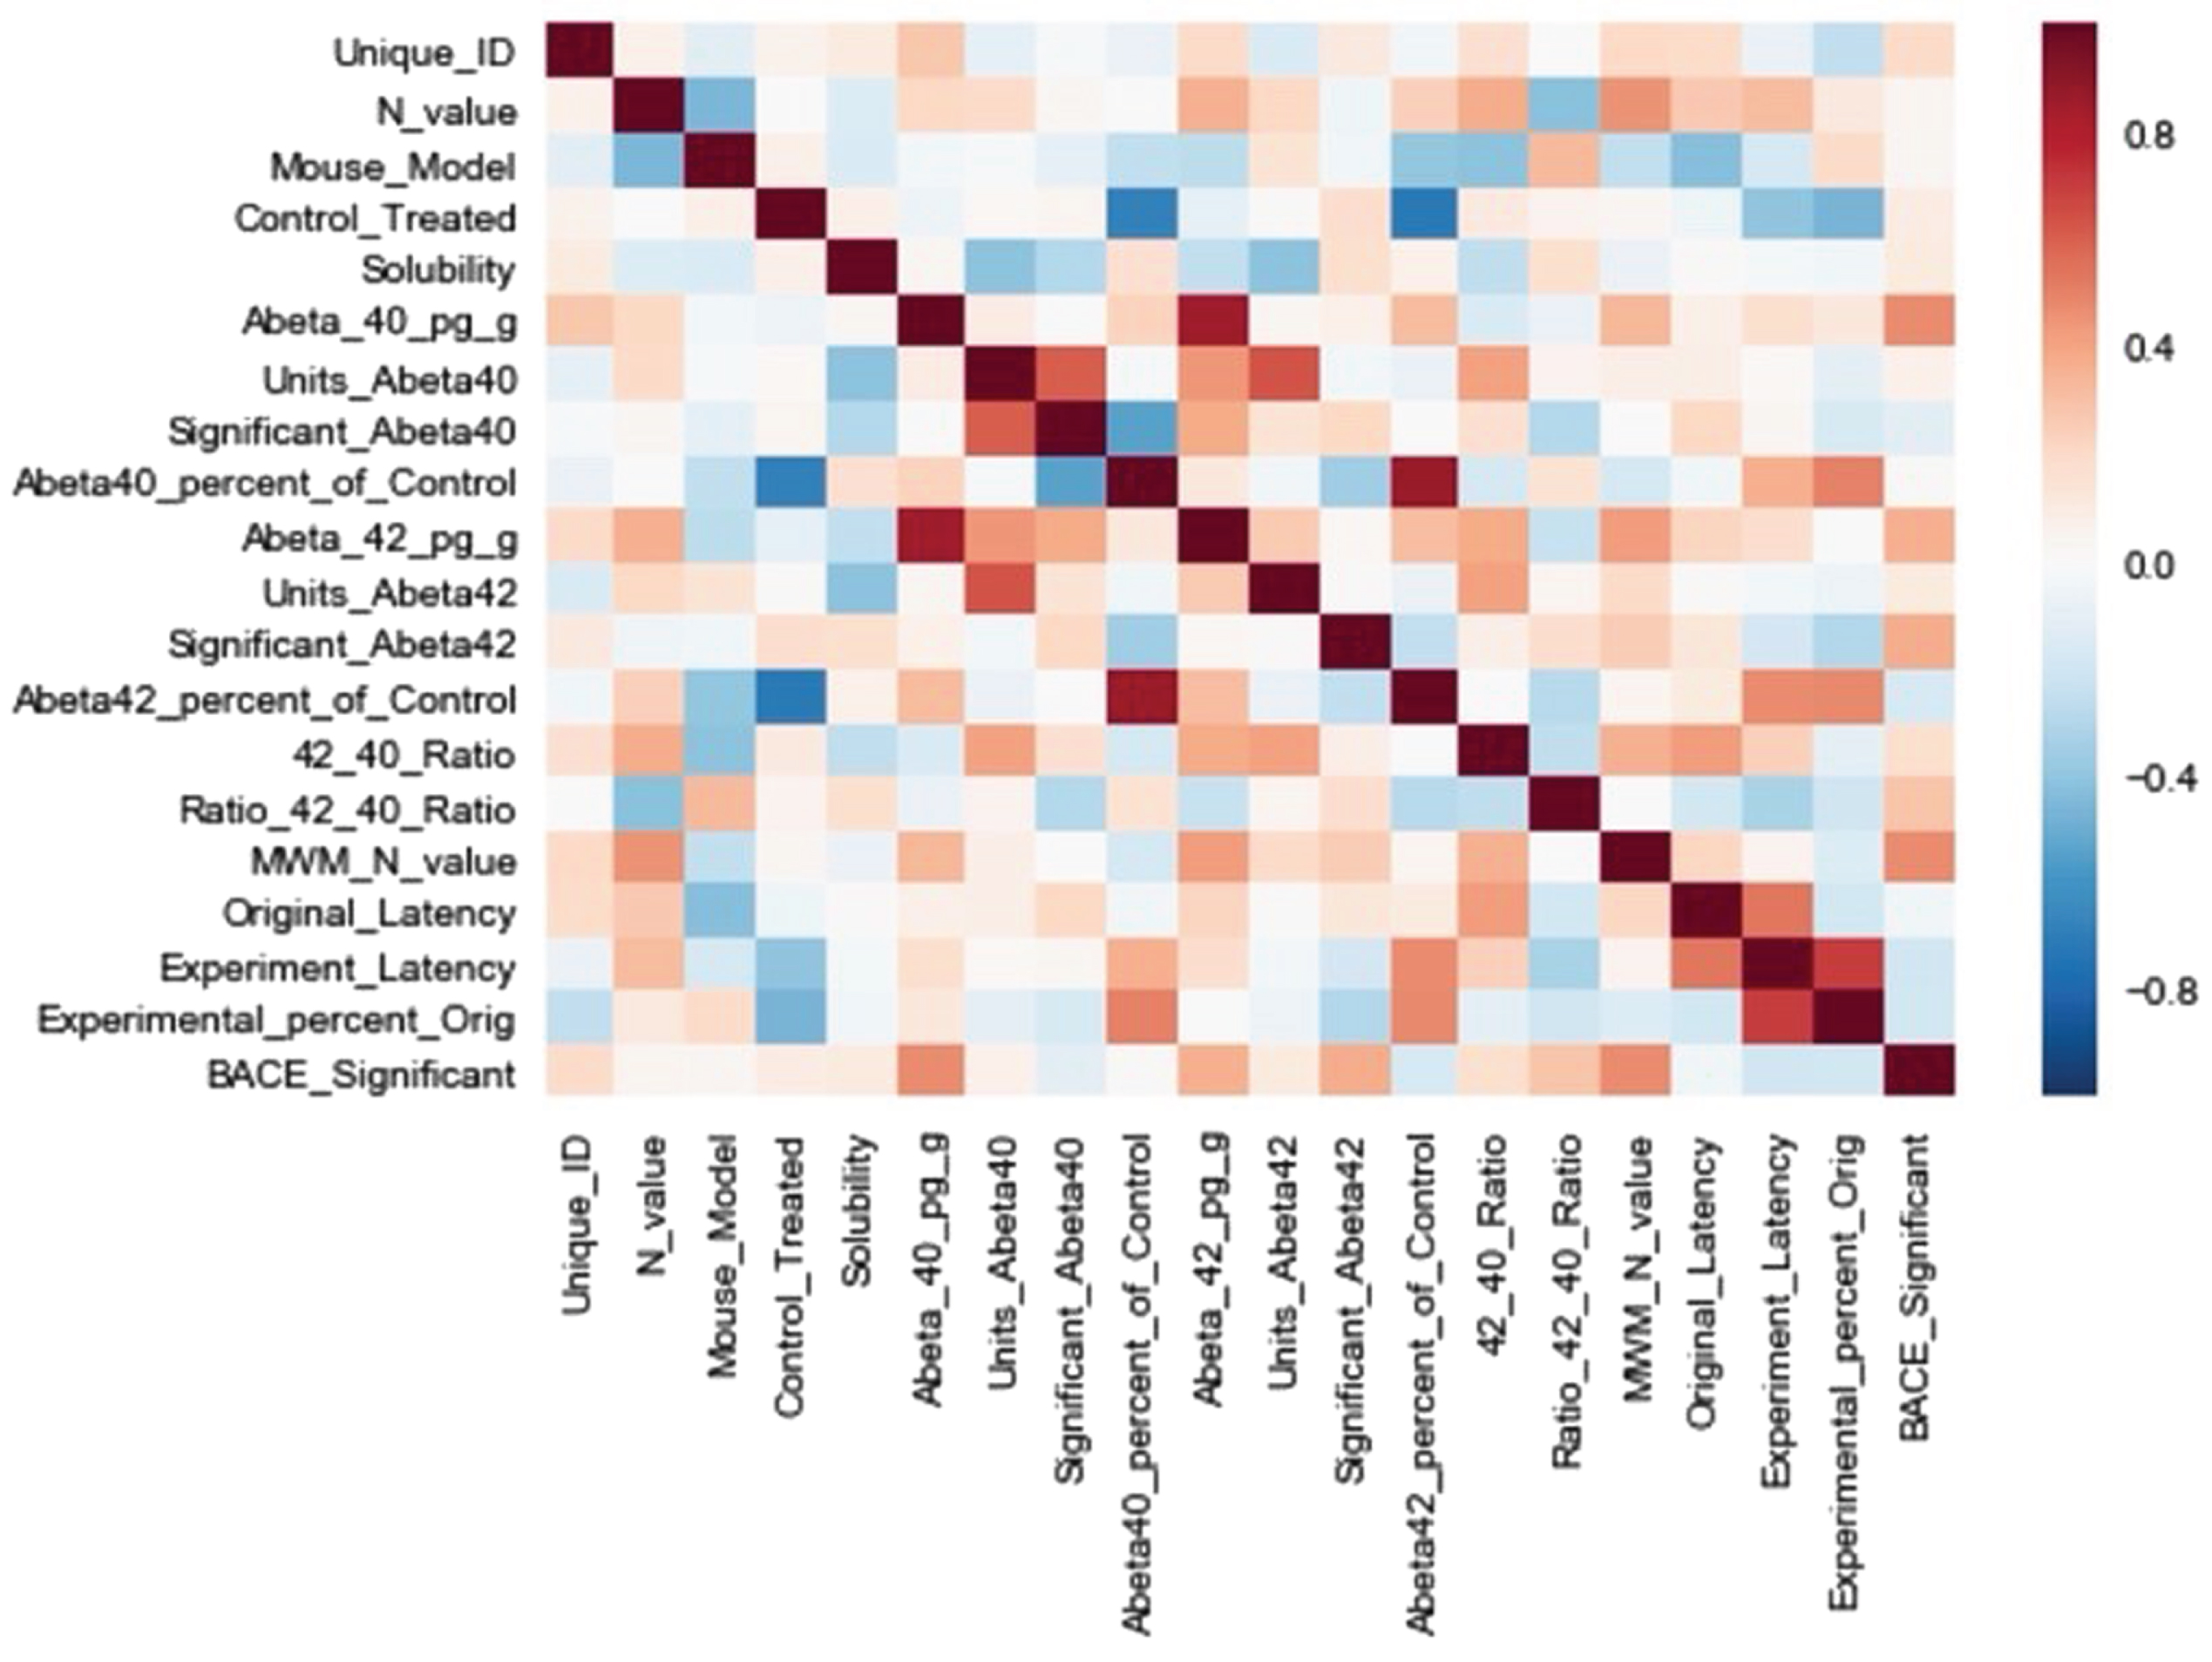
The following primary metrics were either directly curated from the original published studies or derived using the curated data. The naming convention of the features matches those shown in Fig. 3.
Fig. 3
Pearson cross-correlation matrix of extracted features. Feature definitions are defined in the main article text.
• Unique_ID –this feature assessed the potential for study-specific biases in the aggregated data.
• N_value –the sample size of the feature was collected to perform aggregate statistical analysis and to assess for potential sample size related biases.
• Mouse_Model –this categorical feature included the various types of mouse model genotypes included for analysis. Genotypes included wild type, APP/PS1, Aβ1–42, Tg2576, LPS, 3xTg-AD, SAMP8, SAMR1.
• Control_Treated –this categorical feature stated whether the sample was treated or untreated with the intention of decreasing Aβ.
• Solubility –this categorical feature stated whether the measured Aβ was soluble or insoluble.
• Abeta40_pg_g –this feature measured the quantitative level of Aβ40 in units of pg per gram. If a study had other units, it was converted to pg_g for this feature.
• Units_Abeta40 –this categorical feature stated the original units of the Aβ40 measurement prior to normalization. This feature was included only as a sanity check to the normalization process.
• Significant_Abeta40 –this categorical feature stated whether the measured Aβ40 was significant compared to control in the original data source.
• Abeta40_percent_of_control –this continuous feature measured the Aβ40 as a percentage relative to untreated transgenic control within the same original study.
• Abeta42_pg_g –this feature measured the quantitative level of Aβ42 in units of pg per gram. If a study had other units, it was converted to pg_g for this feature.
• Units_Abeta40 –this categorical feature stated the original units of the Aβ40 measurement prior to normalization. This feature was included only as a sanity check to the normalization process.
• Significant_Abeta42 –this categorical feature stated whether the measured Aβ42 was significant compared to control in the original data source.
• Abeta42_percent_of_control –this continuous feature measured the Aβ42 as a percentage relative to untreated transgenic control within the same original study.
• 42_40 ratio –this continuous feature measured the ratio of Aβ42 to Aβ40 within a given study for each mouse type sample.
• Ratio_42_40_ratio –this continuous feature measured the ratio of Aβ42 to Aβ40 in BACE inhibitor treated mice to the ratio of Aβ42 to Aβ40 in non-treated mice for a given mouse sample type within the same original study.
• Overall_Abeta_percent_of_control –calculated overall average of Aβ relative to untreated transgenic control for a given mouse type within the same original study.
• MWM_N_value - the sample size was collected to perform aggregate statistical analysis and to assess for potential sample size related biases.
• Original latency –the MWM escape latency for a given mouse type within a given study prior to training. It is essentially a baseline measurement of innate swimming ability and/or differences in maze set-up and used to normalize Experiment_Latency.
• Experiment_Latency –this continuous feature measured the MWM latency at day 4 and/or day 5. Once normalized, it was the measure of cognition used to compare mouse types and the efficacy of amyloid-reducing BACE inhibitor treatment(s).
• BACE_level_percent of_control –this continuous feature measured the level of BACE compared to untreated transgenic control mice within the same study.
• BACE significant –this categorical feature measured whether there was a significant difference in BACE for a given mouse type within a given study.
A correlation matrix was produced (Fig. 3) to illustrate the association(s) between the features. The correlations with Experiment_Latency were deemed most relevant to the present study’s goals. The features with the strongest correlations to Experiment_Latency were: Original_Latency, 0.62; Abeta42_percent_of_control, 0.44; Control_Treated, 0.38; Abeta40_percent_of_control, 0.34; Ratio_42_40_Ratio, 0.32. There was a relatively lower correlation with Mouse_Model, 0.17.
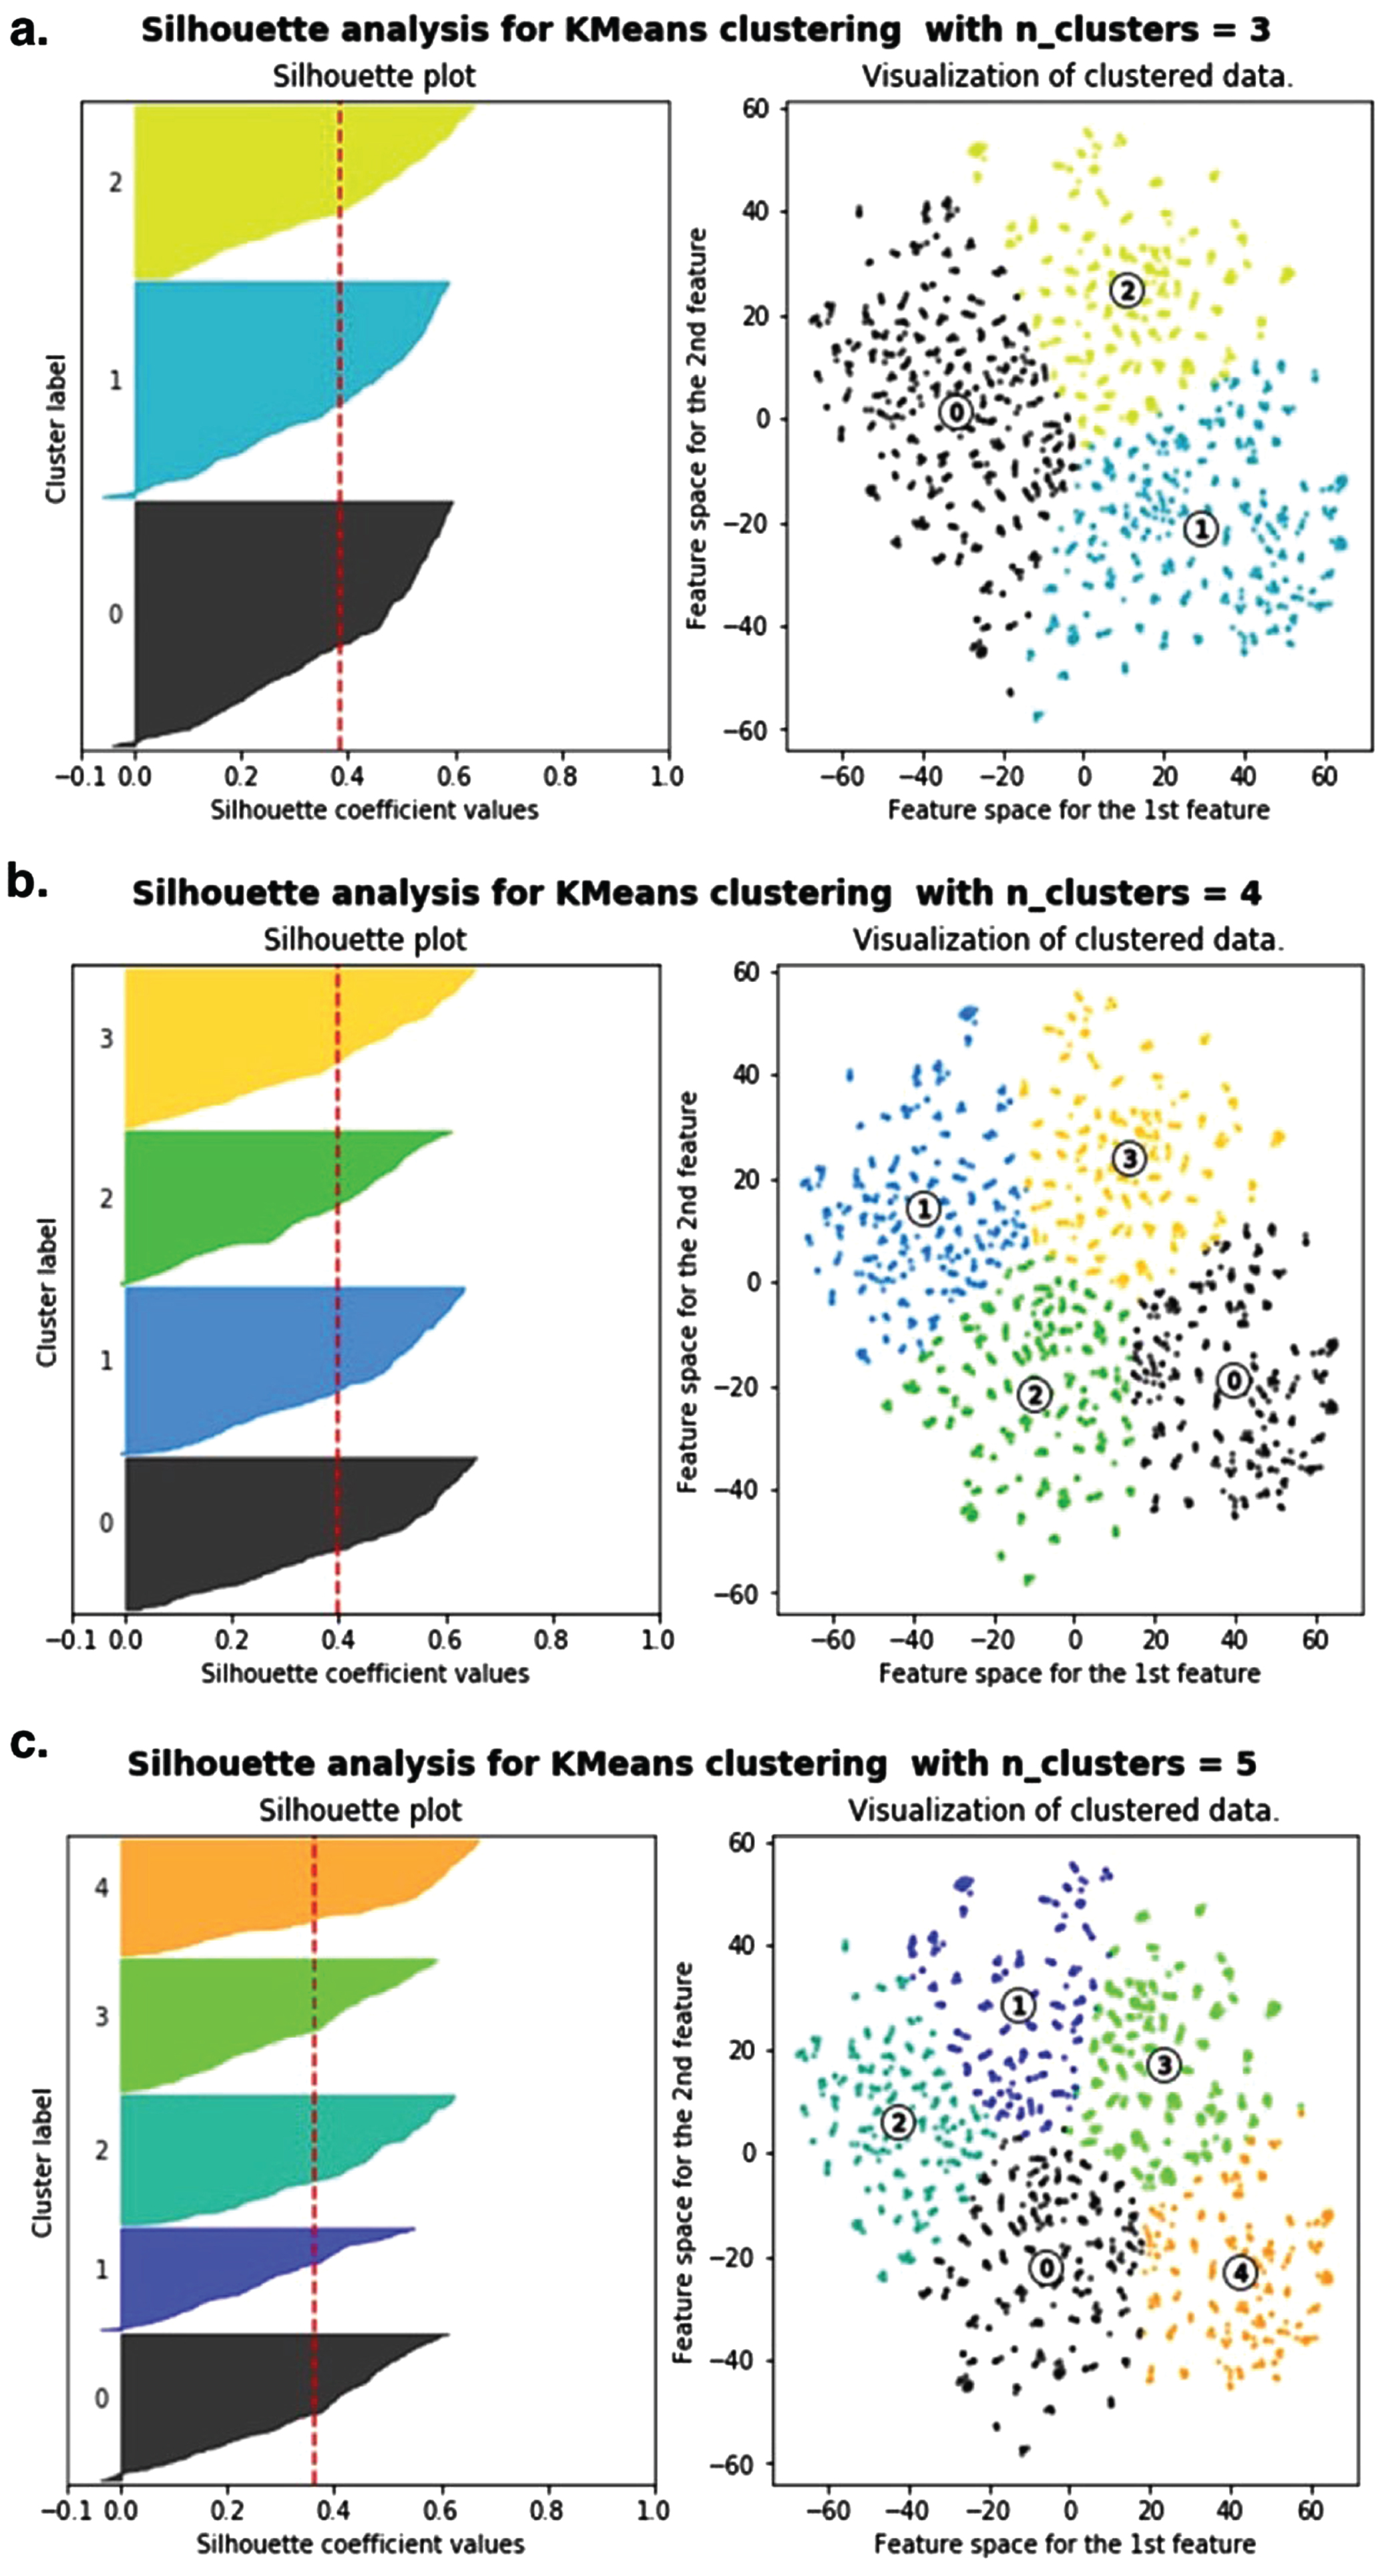
Input features for unsupervised learning included both continuous and categorical data. Subsequently, PCA was performed followed by clustering with the k-means algorithm (Fig. 4). The different clustering patterns for k = 3, k = 4, or k = 5 clusters is shown in Fig. 4a-c, respectively. The corresponding silhouette plots (left side of each panel in Fig. 4) measured how close each point within a cluster was to the points in the neighboring clusters. Ultimately, Silhouette analysis and visual inspection confirmed that k = 4 was optimal, resulting in four clusters labeled in Fig. 4b as cluster 0, cluster 1, cluster 2, and cluster 3.
Fig. 4
Unsupervised clustering of transgenic AD mouse data to determine optimal amyloid-β40 and amyloid-β42 reduction thresholds using PCA followed by k-means clustering. Silhouette analysis (left) confirmed 4 clusters as the optimal number of clusters. The clustered data is visualized by plotting the second PCA feature by the first PCA feature.
Unsupervised learning identified patterns from unlabeled data. That is, clusters were not predetermined based on original study experimental labels like “wild type”, “untreated transgenic control”, or “BACE inhibitor treated transgenic control”. Rather, the clustering algorithm examined data-driven patterns that best explained the separability of data points based on all included explanatory features.
The continuous feature patterns of untreated transgenic control mice and wild type mice were relatively easy to deduce via manual visual inspection (see Table 2). Briefly, all untreated transgenic mice had relatively high Aβ levels and increased MWM escape latency. Conversely, all wild type mice had relatively low Aβ levels and decreased MWM escape latency. Thus, it was not unexpected that the unsupervised clustering algorithm assigned all untreated transgenic mice to one cluster (labeled Cluster 0 in Fig. 4b) and all wild type mice were assigned to another cluster (labeled Cluster 2 in Fig. 4b). What was not obvious prior to unsupervised clustering was how many separable clusters were needed to optimally explain the features of the BACE inhibitor treated transgenic AD mice.
Table 2
The cluster mean and standard deviation of key continuous features. The four clusters were determined by k-means clustering using both continuous and categorical features. Cluster 0 was primarily untreated transgenic control mice; cluster 1 was primarily BACE inhibitor treated transgenic mice characterized as having a “medium” reduction in Aβ relative to control; cluster 2 was primarily wild type mice; and cluster 3 was primarily BACE inhibitor treated transgenic mice characterized as having a “high” reduction in Aβ relative to control
| Feature | Cluster 0 | Cluster 1 | Cluster 2 | Cluster 3 |
| Abeta40_percent_of_control | 100% | 78% ±13% | 27% ±15% | 51% ±15% |
| Abeta42_percent of control | 100% | 76% ±13% | 10% ±14% | 50% ±14% |
| Overall_Abeta_percent_of_control | 100% | 75% ±13% | 19% ±14% | 50% ±14% |
| Ratio_42_to_40_ratio | 1.0 | 1.09±0.3 | 2.3±1.8 | 1.2±0.9 |
| Escape_Latency | 77±14 | 58±15 | 51±16 | 56±14 |
| BACE_level_percent_of_control | 100% | 82% ±17 | 56% ±23 | 61% ±24 |
Ultimately, two of the four clusters explained the features of the AD mice treated with substances to lower BACE (labeled as cluster 1 and cluster 3 in Fig. 4b). The assignment of treated transgenic AD mouse data points to either cluster 1 or cluster 3 was predominantly based on differences in Aβ reduction. The mean overall level of Aβ reduction (e.g., Overall_Abeta_percent_of_control) best explained the variance and separability of the treated transgenic mice data assigned to either clusters 1 or 3. The mean Overall_Abeta_percent_of_control levels of cluster 1 was 75%, which corresponded to a mean 25% reduction in Aβ level compared to untreated transgenic control mice. The mean Overall_Abeta_percent_of_control of cluster 3 was 50%, which corresponded to a mean 50% reduction in Aβ level compared to untreated transgenic control mice. The resultant mean Aβ reduction seen in cluster 1 was henceforth named “medium Aβ reduction” and the Aβ reduction seen in cluster 3 was henceforth named “high Aβ reduction”, respectively.
Follow-up t-tests with Bonferroni correction were performed to examine the presence of significant differences in overall Aβ between clusters. Indeed, there were significantly different levels of Overall_Abeta_percent_of_control between all clusters (p < 0.05). Collectively, the k-means clustering and statistical results indicate that the medium Aβ reduction threshold determined by the mean of Cluster 1 and the high Aβ reduction threshold determined by mean of Cluster 3 were both separable and significantly different (p < 0.05).
The separate Aβ40 and Aβ42 levels as a percent of untreated transgenic control were also analyzed for each cluster. The cluster mean Abeta_40_percent_of_control was 100% for cluster 0; 78% for cluster 1; 27% for cluster 2; and 51% for cluster 3. The cluster mean Abeta42_percent_of_control was 100% for cluster 0; 76% for cluster 1; 10% for cluster 2; and 50% for cluster 3. T-tests with Bonferroni correction found significantly different levels of Aβ40 or Aβ42 between all clusters (p < 0.05).
Notably, the absolute doses and types of BACE inhibiting or reducing substances varied widely among the included studies. As such, there were no pre-defined experimental labels for the quantitative dose of BACE inhibitor administered. However, this did not prevent the assessment of the association between BACE level and Aβ level. The continuous BACE levels as a percentage of matched untreated transgenic control groups were assessed for all data points assigned to each cluster. The mean and standard deviation of BACE_percent_of_control in each cluster was as follows: cluster 0 was 100% of untreated transgenic control; cluster 1 was 82% ±17% of untreated transgenic control; cluster 2 was 61% ±24% of untreated transgenic control; and cluster 3 was 56% ±23% of untreated transgenic control. The BACE means were significantly different between all clusters (p < 0.05). Nonetheless, the corresponding cluster standard deviations indicate that the levels of BACE inhibitor therapy required to get either a medium or high reduction of Aβ vary substantially.
The ratio of Aβ42 to Aβ40 has been considered an important biomarker for predicting the diagnosis and long-term outcome in clinical AD [46]. Interestingly, there was not a significant difference in the ratio of Aβ42 to Aβ40 (e.g., ratio_42_40_ratio) between cluster 1 compared to cluster 3 (p > 0.05). The ratio_42_40_ratio = 1.09±0.3 in cluster 1, which was primarily treated mice with a medium Aβ reduction. The ratio_42_40_ratio = 1.2±0.9 in cluster 3, which was primarily treated mice with a high Aβ reduction. The lack of significance appears to largely be driven by the large standard deviations in cluster 1 and 3. However, there was a significant difference in ratio_42_40_ratio between wild type (cluster 2) and the other three clusters (p < 0.05).
K-means clustering resulted in the identification of two thresholds of Aβ reduction in treated transgenic mice: a medium reduction threshold corresponding to 25% Aβ reduction (e.g., cluster 1) and a high reduction threshold corresponding to a 50% Aβ reduction (e.g., cluster 3). Next, statistical analysis was performed to determine if there were significant differences between clusters. T-tests with Bonferroni correction identified significant differences (p < 0.05) in MWM escape latency between medium and high reduction Aβ40 and Aβ42. Finally, Chi-square analysis was performed to test the independence of Aβ reduction with MWM latency reduction. The significant results (p < 0.05) indicated there was indeed a significant association between Aβ being reduced and MWM latency being reduced (Fig. 5). A 25% reduction in Aβ using BACE inhibitors resulted in a significant 28% improvement in MWM escape latency compared to untreated transgenic control mice (p < 0.05). Likewise, a 50% reduction in Aβ using BACE inhibitors resulted in a significant 32% improvement in MWM escape latency compared to untreated transgenic control mice (p < 0.05).
Fig. 5
Assessment of Aβ reduction thresholds and association with MWM escape latency. Normalized MWM escape latencies are shown in seconds. Cluster 0 corresponded to untreated transgenic AD mice. Cluster 1 (light blue) corresponded to treated transgenic AD mice that had a mean 25% overall Aβ reduction compared to control. Cluster 3 (purple) corresponded to treated transgenic AD mice that had a mean 50% Aβ reduction compared to untreated transgenic control. Cluster 2 (navy) corresponded to wild type mice, which had on average 19% of the overall Aβ levels compared to control.
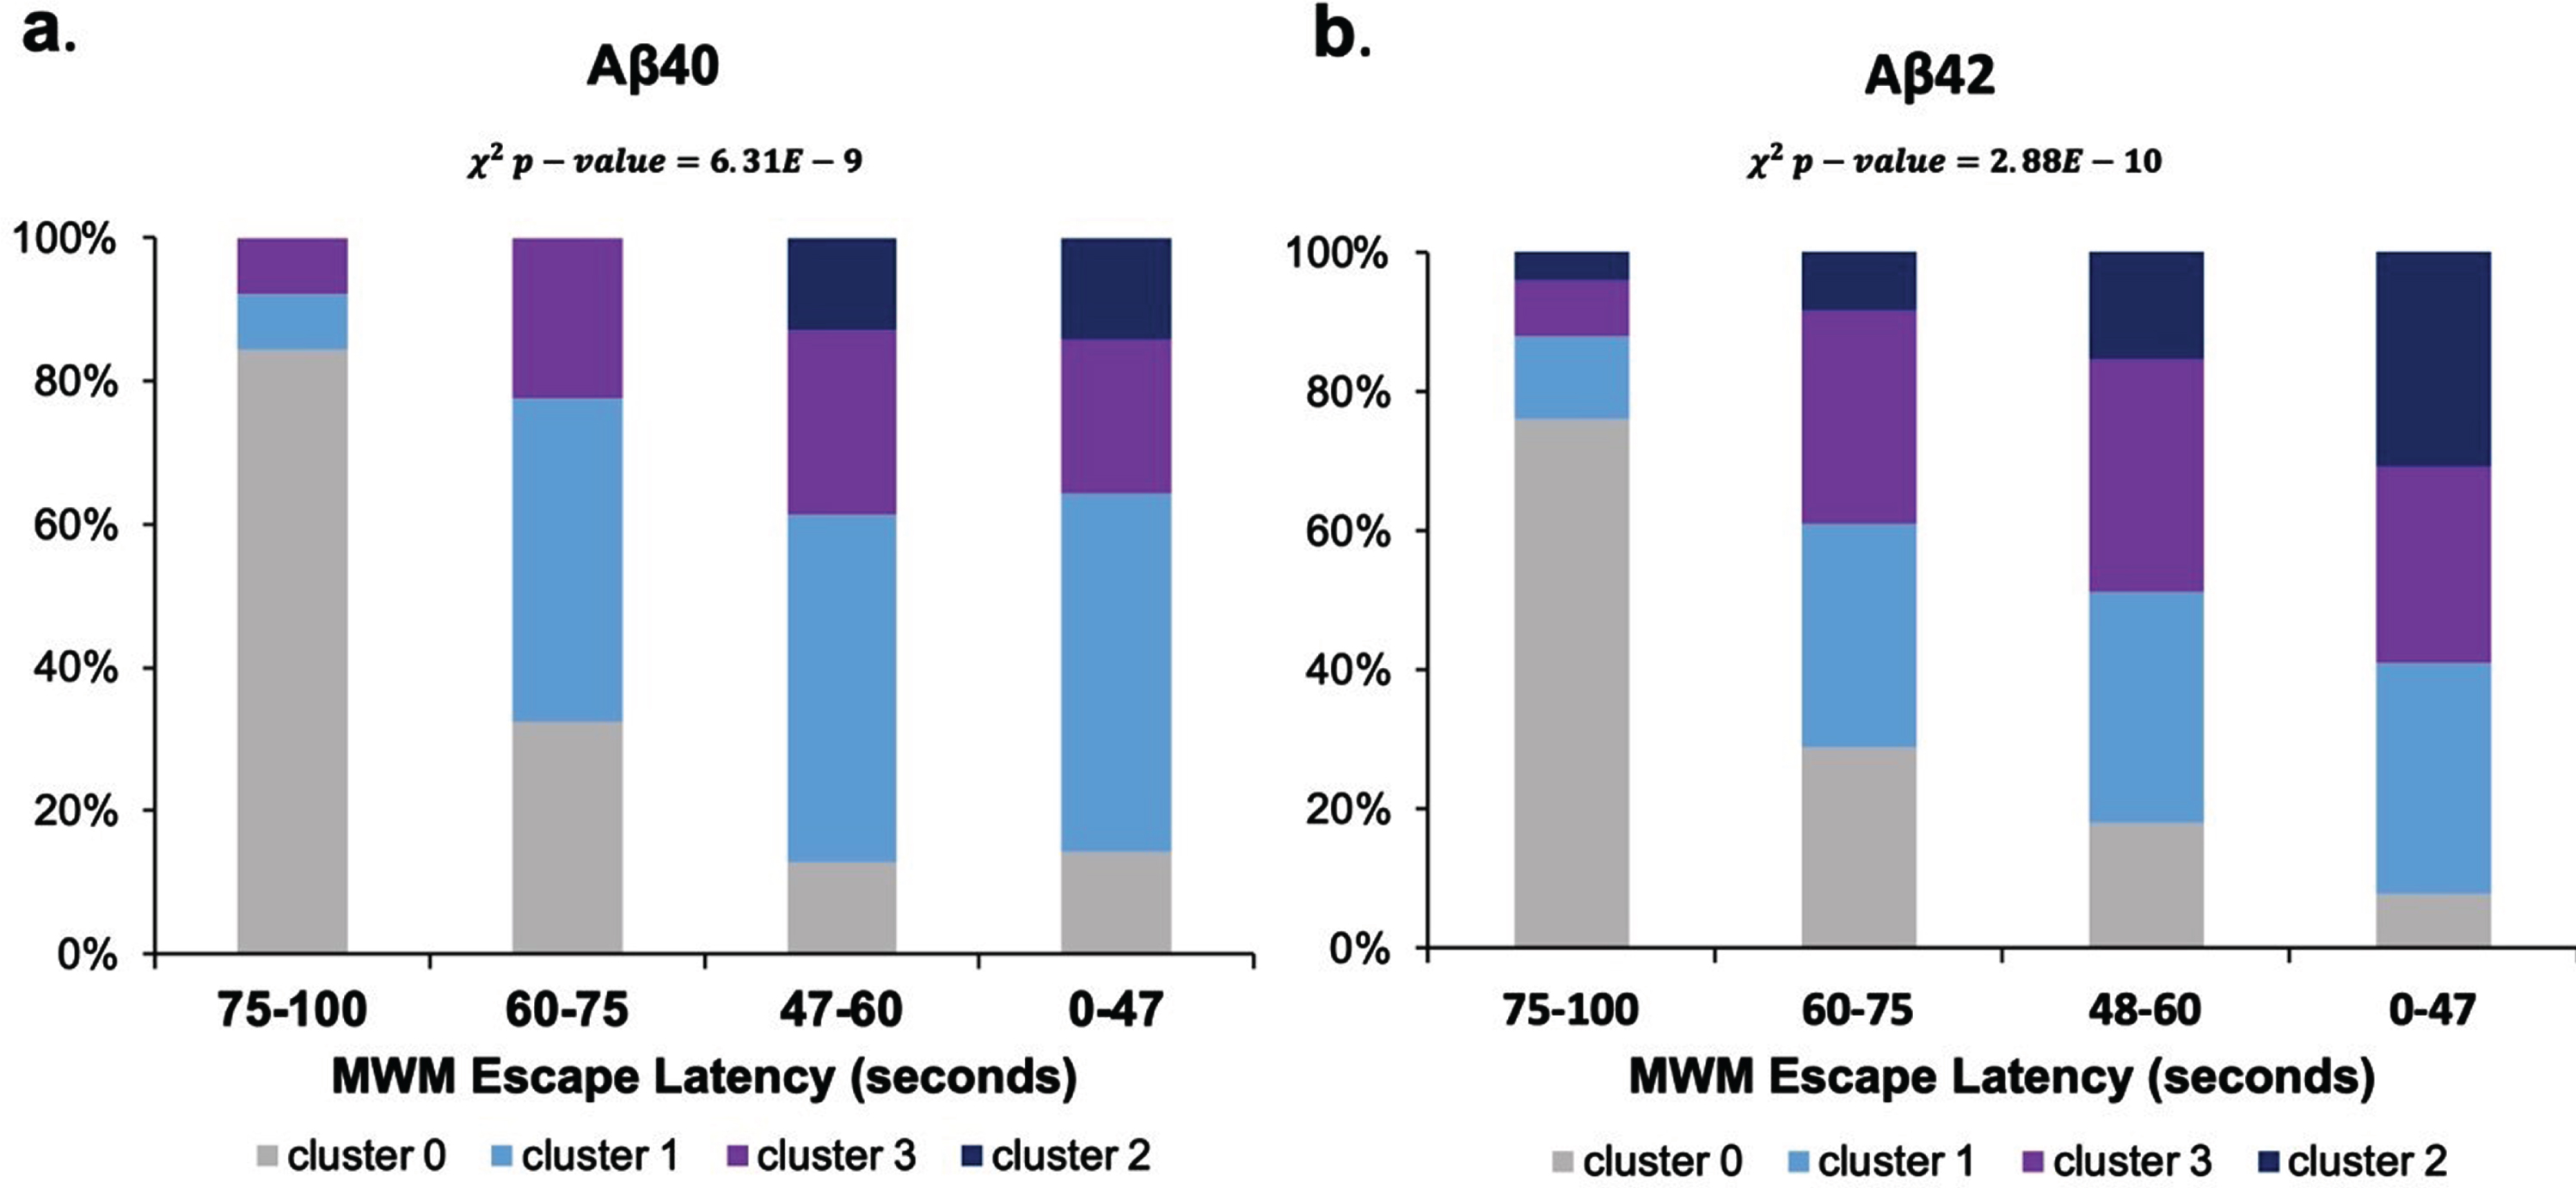
Table 3 illustrates the categorical feature composition for each of the four clusters. Categorical features were primarily analyzed by what percent of data points with the relevant feature label were present in a given cluster. Categorical features primarily included the mouse genotypes (APP/PS1, wild type, Tg2575, 3xTg-Ad, LPS, SAMR1, SAMP8); the treatment label, including control or treated [with a BACE reducing substance]; whether the Aβ was soluble or insoluble; and whether the data point had a significant level of BACE reduction [compared to the control group in its corresponding original study]. The treated transgenic mice were spread across clusters 1 and 3, which indicated that mouse genotype alone was not driving cluster separability. The only treated mice assigned to cluster 2 were the wild type mice treated with a BACE inhibiting substance. All treated transgenic AD mice were assigned to either cluster 1 or cluster 3.
Table 3
Categorical features of data points assigned to each of the four clusters. The four clusters were determined by k-means clustering using both continuous and categorical features. Cluster 0 was primarily untreated transgenic control mice; cluster 1 was BACE inhibitor treated transgenic mice with a medium reduction in Aβ relative to control; cluster 2 was primarily wild type mice; and cluster 3 was primarily BACE inhibitor treated transgenic mice with a high reduction in Aβ relative to control
| Feature | Cluster 0 | Cluster 1 | Cluster 2 | Cluster 3 |
| APP/PS1 | 37.9% | 17.2% | 0% | 44.8% |
| Wild Type | 0.0% | 0.0% | 100.0% | 0.0% |
| Tg2576 | 50.0% | 27.8% | 0.0% | 22.2% |
| 3xTg-AD | 40.0% | 10.0% | 33.3% | 50.0% |
| LPS | 33.3% | 0.0% | 0.0% | 66.7% |
| SAMR1 | 50% | 50% | 0% | 0% |
| SAMP8 | 50% | 50% | 0% | 0% |
| Control | 100.0% | 0.0% | 0.0% | 0.0% |
| Treated | 0.0% | 25.0% | 23.1% | 51.9% |
| Insoluble Aβ | 33.4% | 15.6% | 18.8% | 31.3% |
| Soluble Aβ | 37.0% | 18.5% | 14.8% | 29.6% |
| Significant Aβ42 | 0% | 0% | 23% | 77% |
| Significant BACE | 0.0% | 12.8% | 28.2% | 59.0% |
Finally, supervised machine learning was performed to assess how well explanatory features predict MWM escape latency. As traditional in machine learning, a set of models was constructed to determine which model performed best for the application. Models used the continuous and categorical features of the dataset to predict MWM escape latency (Fig. 5). The polynomial ridge regression model performed the best and had a training R2 of 0.95 and a test set R2 of 0.80. Given the relatively small sample size, it was expected that there would be a decrease in R2 in the independent test set compared to the training set. The learning curves (i.e., model accuracy versus training sample size) for the supervised model(s) did not illustrate overt overfitting or underfitting. Across all ML models, the two most important features for predicting MWM escape latency consistently comprised Abeta42_percent_of_control and Abeta40_percent_of_control. Moderately important features included the BACE_significance and ratio_42_to_40_ratio. Categorical mouse type was not a feature of consensus high importance across models.
Table 4
Supervised machine learning regression models assessed how well the explanatory continuous and categorical features predicted MWM escape latency. The most important explanatory feature was Aβ level
| Supervised Learning Models | Training R2 | Testing R2 |
| Linear regression | 0.81 | 0.65 |
| Ridge Regression | 0.79 | 0.74 |
| Polynomial ridge regression | 0.95 | 0.80 |
| Decision Tree | 0.96 | 0.70 |
| Tuned Decision Tree | 0.92 | 0.76 |
DISCUSSION
Prior studies that examined the impact of amyloid-reducing BACE inhibitors or BACE reducing substances in transgenic AD mice had a wide distribution of results. The current study provided new quantitative insight into the average amount of Aβ reduction via reduction of BACE necessary to obtain a meaningful improvement in transgenic AD mouse cognition. Unsupervised learning identified 4 clusters that best explained MWM escape latency: cluster 0, Aβ levels in untreated transgenic AD control mice (100% Abeta_percent_of_control); cluster 1, medium Aβ reduction in treated transgenic AD mice (25% Overall_Abeta_percent_of_control); cluster 3, high Aβ reduction in treated transgenic AD mice treated; cluster 2, Aβ levels in wild type mice treated with BACE inhibitors (19% Overall_Abeta_percent_of_control). Interestingly, similar clustering algorithms had also previously identified 4 clusters in clinical AD patients [23]. K-means clustering showed a 25% mean decrease in Aβ led to a 28% mean decrease in MWM escape latency in transgenic AD mice treated with BACE inhibitors. Further, a 50% decrease in Aβ led to a 32% decrease in MWM escape latency. For reference, wild type mice had a mean escape latency 41% lower than AD mice. There was a significant difference in mean MWM escape latency between the medium and high Aβ reduction groups. Statistical analysis revealed there was a significant association between Aβ being reduced and MWM latency being reduced. This finding was in line with previous research, which has shown that BACE proteases are central to the formation of Aβ and, hence, the development of AD [8, 47, 48].
Multiple pre-clinical and clinical trials have measured the effectiveness of BACE inhibitors and other amyloid-reducing therapies for decreasing the rate of cognitive decline due to AD [49]. Mouse BACE inhibitor trials have generally shown good safety profiles with few adverse effects. However, human BACE inhibitor trials have raised concerns about potential side effects, particularly liver toxicity [49]. During previous clinical trials, BACE1 inhibitors were able to achieve up to 80–90% Aβ reductions in cerebrospinal fluid; yet, these therapies failed to significantly demonstrate slowing of the cognitive decline [50]. More than seventeen different BACE1 inhibitors have failed in double-blind, placebo-controlled clinical trials in patients with AD [51]. The reasoning behind these results is unclear. One hypothesis is that the functional AD pathology is too advanced by the time BACE inhibitor therapy has begun.
One promising finding shown in this study is that a supplemental combination of the nutritional molecules, Vitamin D and reservatol [27], fell into cluster 1, which was the medium Aβ reduction cluster. Additionally, the cognitive stimulation treated Tg2576 mice fell into cluster 3, which was the high β reduction cluster. Thus, non-traditional means of reducing BACE and Aβ via diet supplementation and behavior modification could be potential considerations for asymptomatic patients who have been identified as “at risk” for AD based on family history or their own biomarker profiles.
One interesting finding from the present study was that the ratio of Aβ42 to Aβ40 was not found to be as important of a feature as the absolute reduction of Aβ42 compared to control (e.g., Abeta42_percent_of _control) in predicting treatment-related improvements in MWM escape latency. Researchers have contended that the ratio of Aβ42 to Aβ40 is superior to using the Aβ42 level when making a clinical diagnosis of AD [52]. In particular, the ratio of Aβ42 to Aβ40 was found to be more specific for measuring cognitive decline due to AD compare to other neurological disorders. Particularly, pooled evidence found that mild cognitive impairment patients with lower ratios of Aβ42 to Aβ40 were more likely to convert to AD [46]. Notably, our prior work examining the pooled Tg2576 transgenic AD mouse data found that there was only a weak qualitative trend with MWM escape latency [18]. It is possible that the present study’s findings were influenced by the mixed population of transgenic mice. Prior reports have concluded that some transgenic mice have pathology primarily driven by a change in Aβ42 to Aβ40 ratio while others do not [7]. In short, the functional impact of the Aβ42 to Aβ40 ratio in mice compared to humans remains inconclusive.
Future longitudinal assessment will be necessary to determine the long-term benefits and safety profile of BACE inhibitor, amyloid-reducing therapies, or other non-pharmacologic therapies to reduce Aβ. Ideally, patients at high risk of acquiring dementia should be identified as early as possible. Early identification can be made possible with cerebrospinal fluid, genetic, and/or blood-based biomarkers combined with machine learning-based clinical recommendation systems, which use personalized data to calculate a specific dementia risk, dementia onset date, and confidence interval on the prediction(s) [53, 54]. With such upfront quantitative forecasting available in the future, a physician could best inform at-risk asymptomatic patients of the pros and cons of prophylactic therapies aimed at preventing symptomatic AD. Note that, at the time of this writing, lecanemab is only FDA-approved in the US for symptomatic dementia patients rather than at-risk asymptomatic patients.
Limitations and future directions
The present study had a few limitations that were primarily tied to the inherent limitations of the underlying dataset. The learning curves (i.e., model accuracy versus training sample size) for the supervised model(s) did not illustrate overt overfitting or underfitting. Nonetheless, additional sample sizes would help to further confirm results. Additionally, the sex and age of the mice was not included due to too few studies including the variable. Our prior work examining the aggregate effect of sex as a feature in experimental AD mouse found that it was mostly insignificant except in APOE transgenic models [20]. However, APOE transgenic mice were not included in the present work. Due to its frequent usage in the literature, the MWM escape latency was used as the primary assessment of mouse cognitive function in this pooled analysis. The addition of other cognitive tests, such as the novel object recognition, Y-maze, Barnes maze, or other tests was considered but not possible due to sample size limitations with respect to the other required study inclusion criteria. Another possible limitation is the fact that not all included studies sampled Aβ from the same brain region, and some simply did not state from which brain the Aβ was sampled. Nonetheless, the statistical and machine learning models found no overt or study-specific biases that would indicate brain region or another unincluded feature was substantively impacting the aggregate results. Notably, PCA determined that > 90% of the variance was explained by the continuous and categorical features highlighted in the study.
Key future directions include the addition greater sample size, more mouse model types and more detailed features like mouse sex, age, brain region, and inclusion of additional cognitive tests beyond MWM escape latency. However, the most important work moving forward is the reproducible conversion of amyloid reduction thresholds that are applicable to mouse transgenic AD models to amyloid reduction thresholds necessary for safe and effective anti-amyloid human therapies.
Conclusions
The key research question posed by the present work was: What level of Aβ reduction is necessary to meaningfully improve cognitive function? Experimental data curated from 22 original studies was used to address this question using a combination of machine learning and statistical analysis. A “medium” or 25% reduction of Aβ was necessary to achieve a 28% improvement in transgenic AD mouse cognition as measured via MWM escape latency, and a “high” or 50% reduction resulted in a 32% improvement. Comparatively, wild type mice had a mean 41% MWM latency improvement over untreated transgenic control. These results suggest that a 25% threshold in overall Aβ reduction was necessary for reproducible, meaningful, and significant improvements in transgenic mouse cognition.
AUTHOR CONTRIBUTIONS
Anita Singh (Data curation; Formal analysis; Investigation; Methodology; Validation; Visualization; Writing – original draft); Matthew Maker (Conceptualization; Data curation; Formal analysis; Investigation; Methodology; Validation; Visualization; Writing – original draft); Jayant Prakash (Conceptualization; Formal analysis; Methodology; Software; Visualization; Writing – original draft); Raghav Tandon (Formal analysis; Methodology; Software; Validation; Visualization; Writing – review & editing); Cassie S Mitchell, Ph.D. (Conceptualization; Data curation; Formal analysis; Funding acquisition; Investigation; Methodology; Project administration; Resources; Supervision; Validation; Visualization; Writing – original draft; Writing – review & editing).
ACKNOWLEDGMENTS
The authors gratefully acknowledge Maya Rajaram and Taylor May for their assistance in developing a prototype framework for data curation.
FUNDING
This research was funded by the National Science Foundation CAREER grant 1944247 to C.M, the National Institute of Health grant U19-AG056169 and R01-AG070937 sub-awards to C.M., and by the Chan Zuckerberg Initiative grant 253558 to C.M.
CONFLICT OF INTEREST
The authors have no conflict of interest to report.
DATA AVAILABILITY
This study utilized data curated from previously published data sources, which are available in PubMed. Citations to access the original data sources is provided in Table 1.
REFERENCES
[1] | Chertkow H , Feldman HH , Jacova C , Massoud F ((2013) ) Definitions of dementia and predementia states in Alzheimer’s disease and vascular cognitive impairment: Consensus from the Canadian conference on diagnosis of dementia. Alzheimers Res Ther 5: , 1–8. |
[2] | Lim H-S , Kim YJ , Sohn E , Yoon J , Kim B-Y , Jeong S-J ((2018) ) Bojungikgi-Tang, a traditional herbal formula, exertsneuroprotective effects and ameliorates memory impairments inAlzheimer’s disease-like experimental models. Nutrients 10: , 1952. |
[3] | Reitz C ((2012) ) Alzheimer’s disease and the amyloid cascade hypothesis: A critical review. Int J Alzheimers Dis 2012: , 369808. |
[4] | Karran E , Mercken M , Strooper BD ((2011) ) The amyloid cascadehypothesis for Alzheimer’s disease: An appraisal for the development of therapeutics. Nat Rev Drug Discov 10: , 698–712. |
[5] | Gu L , Guo Z ((2013) ) Alzheimer’s Abeta42 and Abeta40 peptides form interlaced amyloid fibrils. J Neurochem 126: , 305–311. |
[6] | Murphy MP , LeVine H 3rd ((2010) ) Alzheimer’s disease and the amyloid-beta peptide. J Alzheimers Dis 19: , 311–323. |
[7] | Xu G , Fromholt SE , Chakrabarty P , Zhu F , Liu X , Pace MC , Koh J , Golde TE , Levites Y , Lewis J , Borchelt DR ((2020) ) Diversity in Abeta deposit morphology and secondary proteome insolubility across models of Alzheimer-type amyloidosis. Acta Neuropathol Commun 8: , 43. |
[8] | Vassar R ((2002) ) β-secretase (BACE) as a drug target forAlzheimer’s disease. Adv Drug Deliv Rev 54: , 1589–1602. |
[9] | Hardy J , Allsop D ((1991) ) Amyloid deposition as the central event inthe aetiology of Alzheimer’s disease. Trends Pharmacol Sci 12: , 383–388. |
[10] | Hampel H , Hardy J , Blennow K , Chen C , Perry G , Kim SH , Villemagne VL , Aisen P , Vendruscolo M , Iwatsubo T , Masters CL , Cho M , Lannfelt L , Cummings JL , Vergallo A ((2021) ) The amyloid-beta pathway in Alzheimer’s disease. Mol Psychiatry 26: , 5481–5503. |
[11] | McLean CA , Cherny RA , Fraser FW , Fuller SJ , Smith MJ , Beyreuther K , Bush AI , Masters CL ((1999) ) Soluble pool of Abeta amyloid as a determinant of severity of neurodegeneration in Alzheimer’s disease. Ann Neurol 46: , 860–866. |
[12] | Ackley SF , Zimmerman SC , Brenowitz WD , Tchetgen Tchetgen EJ , Gold AL , Manly JJ , Mayeda ER , Filshtein TJ , Power MC , Elahi FM , Brickman AM , Glymour MM ((2021) ) Effect of reductions in amyloid levels on cognitive change in randomized trials: Instrumental variable meta-analysis. BMJ 372: , n156. |
[13] | Cummings J ((2023) ) Anti-amyloid monoclonal antibodies are transformative treatments that redefine Alzheimer’s disease therapeutics. Drugs 83: , 569–576. |
[14] | van Dyck CH , Swanson CJ , Aisen P , Bateman RJ , Chen C , Gee M , Kanekiyo M , Li D , Reyderman L , Cohen S , Froelich L , Katayama S , Sabbagh M , Vellas B , Watson D , Dhadda S , Irizarry M , Kramer LD , Iwatsubo T ((2022) ) Lecanemab in early Alzheimer’s disease. N Engl J Med 388: , 9–21. |
[15] | Sanchez-Varo R , Mejias-Ortega M , Fernandez-Valenzuela JJ , Nunez-Diaz C , Caceres-Palomo L , Vegas-Gomez L , Sanchez-Mejias E , Trujillo-Estrada L , Garcia-Leon JA , Moreno-Gonzalez I , Vizuete M , Vitorica J , Baglietto-Vargas D , Gutierrez A ((2022) ) Transgenic mouse models of Alzheimer’s disease: An integrative analysis. Int J Mol Sci 23: , 5404. |
[16] | Vorhees CV , Williams MT ((2006) ) Morris water maze: Procedures for assessing spatial and related forms of learning and memory. Nat Protoc 1: , 848–858. |
[17] | Portelius E , Price E , Brinkmalm G , Stiteler M , Olsson M , Persson R , Westman-Brinkmalm A , Zetterberg H , Simon AJ , Blennow K ((2011) ) Anovel pathway for amyloid precursor protein processing. Neurobiol Aging 32: , 1090–1098. |
[18] | Foley AM , Ammar ZM , Lee RH , Mitchell CS ((2015) ) Systematic review of the relationship between amyloid-beta levels and measures of transgenic mouse cognitive deficit in Alzheimer’s disease. J Alzheimers Dis 44: , 787–795. |
[19] | Huber CM , Yee C , May T , Dhanala A , Mitchell CS ((2018) ) Cognitive decline in preclinical Alzheimer’s disease: Amyloid-beta versus tauopathy. J Alzheimers Dis 61: , 265–281. |
[20] | Watson Y , Nelson B , Kluesner JH , Tanzy C , Ramesh S , Patel Z , Kluesner KH , Singh A , Murthy V , Mitchell CS ((2021) ) Aggregate trends of apolipoprotein E on cognition in transgenic Alzheimer’s disease mice. J Alzheimers Dis 83: , 435–450. |
[21] | Mitchell CS , Cates A , Kim RB , Hollinger SK ((2015) ) Undergraduate biocuration: Developing tomorrow’s researchers while mining today’s data. J Undergrad Neurosci Educ 14: , A56–65. |
[22] | Ding C , He X (2004) K-means clustering via principal component analysis. In Proceedings of the Twenty-First International Conference on Machine Learning Association for Computing Machinery, Banff, Alberta, Canada, p. 29. |
[23] | Prakash J , Wang V , Quinn RE 3rd , Mitchell CS ((2021) ) Unsupervised machine learning to identify separable clinical Alzheimer’s disease sub-populations. Brain Sci 11: , 977. |
[24] | Zhu Z , Li C , Wang X , Yang Z , Chen J , Hu L , Jiang H , Shen X ((2010) ) 2,2’,4’-trihydroxychalcone from Glycyrrhiza glabra as a new specific BACE1 inhibitor efficiently ameliorates memory impairment in mice. J Neurochem 114: , 374–385. |
[25] | Chang WP , Huang X , Downs D , Cirrito JR , Koelsch G , Holtzman DM , Ghosh AK , Tang J ((2011) ) Beta-secretase inhibitor GRL-8234 rescuesage-related cognitive decline in APP transgenic mice. FASEB J 25: , 775–784. |
[26] | Lee YJ , Choi DY , Choi IS , Kim KH , Kim YH , Kim HM , Lee K , Cho WG , Jung JK , Han SB , Han JY , Nam SY , Yun YW , Jeong JH , Oh KW , Hong JT ((2012) ) Inhibitory effect of 4-O-methylhonokiol onlipopolysaccharide-induced neuroinflammation, amyloidogenesis andmemory impairment via inhibition of nuclear factor-kappaB in vitro and in vivo models. J Neuroinflammation 9: , 35. |
[27] | Cheng J , Rui Y , Qin L , Xu J , Han S , Yuan L , Yin X , Wan Z ((2017) ) Vitamin D combined with resveratrol prevents cognitive decline in SAMP8 mice. Curr Alzheimer Res 14: , 820–833. |
[28] | Gerenu G , Dobarro M , Ramirez MJ , Gil-Bea FJ ((2013) ) Early cognitive stimulation compensates for memory and pathological changes inTg2576 mice. Biochim Biophys Acta 1832: , 837–847. |
[29] | Green KN , Khashwji H , Estrada T , Laferla FM ((2011) ) ST101 induces anovel 17 kDa APP cleavage that precludes Aβ generation in vivo. Ann Neurol 69: , 831–844. |
[30] | Kim HJ , Joe Y , Chen Y , Park GH , Kim UH , Chung HT ((2019) ) Carbonmonoxide attenuates amyloidogenesis via down-regulation ofNF-κB-mediated BACE1 gene expression. Aging Cell 18: , e12864. |
[31] | Chen YJ , Zheng HY , Huang XX , Han SX , Zhang DS , Ni JZ , He XY ((2016) ) Neuroprotective effects of icariin on brain metabolism, mitochondrial functions, and cognition in triple-transgenic Alzheimer’s disease mice. CNS Neurosci Ther 22: , 63–73. |
[32] | Huang M , Jiang X , Liang Y , Liu Q , Chen S , Guo Y ((2017) ) Berberine improves cognitive impairment by promoting autophagic clearance and inhibiting production of β-amyloid in APP/tau/PS1 mouse model of Alzheimer’s disease. Exp Gerontol 91: , 25–33. |
[33] | Wu L , Feng X , Li T , Sun B , Khan MZ , He L ((2017) ) Risperidone ameliorated Aβ(1-42)-induced cognitive and hippocampal synaptic impairments in mice. Behav Brain Res 322: , 145–156. |
[34] | Yang SG , Wang SW , Zhao M , Zhang R , Zhou WW , Li YN , Su YJ , Zhang H , Yu XL , Liu RT ((2012) ) A peptide binding to the β-site of APP improves spatial memory and attenuates Aβ burden in Alzheimer’s disease transgenic mice. PLoS One 7: , e48540. |
[35] | Yang H , Yang H , Xie Z , Wang P , Bi J ((2015) ) Self-assembling nanofibers alter the processing of amyloid precursor protein in a transgenic mouse model of Alzheimer’s disease. Neurol Res 37: , 84–91. |
[36] | Gu XH , Xu LJ , Liu ZQ , Wei B , Yang YJ , Xu GG , Yin XP , Wang W ((2016) ) The flavonoid baicalein rescues synaptic plasticity and memory deficits in a mouse model of Alzheimer’s disease. Behav Brain Res 311: , 309–321. |
[37] | He XL , Yan N , Chen XS , Qi YW , Yan Y , Cai Z ((2016) ) Hydrogen sulfide down-regulates BACE1 and PS1 via activating PI3K/Akt pathway in the brain of APP/PS1 transgenic mouse. Pharmacol Rep 68: , 975–982. |
[38] | Wang X , Song R , Lu W , Liu Z , Wang L , Zhu X , Liu Y , Sun Z , Li J , Li X ((2017) ) YXQN reduces Alzheimer’s disease-like pathology and cognitive decline in APPswePS1dE9 transgenic mice. Front Aging Neurosci 9: , 157. |
[39] | Liu QS , Jiang HL , Wang Y , Wang LL , Zhang JX , He CH , Shao S , Zhang TT , Xing JG , Liu R ((2018) ) Total flavonoid extract from Dracoephalum moldavica L. attenuates β-amyloid-induced toxicity through anti-amyloidogenesic and neurotrophic pathways. Life Sci 193: , 214–225. |
[40] | Du Y , Zhao Y , Li C , Zheng Q , Tian J , Li Z , Huang TY , Zhang W , Xu H ((2018) ) Inhibition of PKCδ reduces amyloid-β levels and reverses Alzheimer disease phenotypes. J Exp Med 215: , 1665–1677. |
[41] | Liu Z , Chen Y , Qiao Q , Sun Y , Liu Q , Ren B , Liu X ((2017) ) Sesamol supplementation prevents systemic inflammation-induced memory impairment and amyloidogenesis via inhibition of nuclear factor kappaB. Mol Nutr Food Res 61: , 1600734. |
[42] | Lee YJ , Choi DY , Han SB , Kim YH , Kim KH , Hwang BY , Kang JK , Lee BJ , Oh KW , Hong JT ((2012) ) Inhibitory effect of ethanol extract of Magnolia officinalis on memory impairment and amyloidogenesis in atransgenic mouse model of Alzheimer’s disease via regulating β-secretase activity. Phytother Res 26: , 1884–1892. |
[43] | Jin P , Choi DY , Hong JT ((2012) ) Inhibition of extracellular signal-regulated kinase activity improves cognitive function inTg2576 mice. Clin Exp Pharmacol Physiol 39: , 852–857. |
[44] | Jin P , Kim JA , Choi DY , Lee YJ , Jung HS , Hong JT ((2013) ) Anti-inflammatory and anti-amyloidogenic effects of a small molecule, 2,4-bis(p-hydroxyphenyl)-2-butenal in Tg2576 Alzheimer’s disease mice model. J Neuroinflammation 10: , 2. |
[45] | Chun YS , Zhang L , Li H , Park Y , Chung S , Yang HO ((2018) ) 7-Deoxy-trans-dihydronarciclasine reduces beta-amyloid and ameliorates memory impairment in a transgenic model of Alzheimer’s disease. Mol Neurobiol 55: , 8953–8964. |
[46] | Hansson O , Zetterberg H , Buchhave P , Andreasson U , Londos E , Minthon L , Blennow K ((2007) ) Prediction of Alzheimer’s disease using the CSFAbeta42/Abeta40 ratio in patients with mild cognitive impairment. Dement Geriatr Cogn Disord 23: , 316–320. |
[47] | Liu L , Li Y , Li S , Hu N , He Y , Pong R , Lin D , Lu L , Law M ((2012) ) Comparison of next-generation sequencing systems. J Biomed Biotechnol 2012: , 251364. |
[48] | Yan G , Viraraghavan T , Chen M ((2001) ) A new model for heavy metal removal in a biosorption column. Adsorp Sci Technol 19: , 25–43. |
[49] | May PC , Willis BA , Lowe SL , Dean RA , Monk SA , Cocke PJ , Audia JE , Boggs LN , Borders AR , Brier RA ((2015) ) The potent BACE1 inhibitor LY2886721 elicits robust central Aβ pharmacodynamic responses in mice, dogs, and humans. J Neurosci 35: , 1199–1210. |
[50] | Imbimbo BP , Watling M ((2019) ) Investigational BACE inhibitors for the treatment of Alzheimer’s disease. Expert Opin Invest Drugs 28: , 967–975. |
[51] | Panza F , Lozupone M , Solfrizzi V , Sardone R , Piccininni C , Dibello V , Stallone R , Giannelli G , Bellomo A , Greco A ((2018) ) BACE inhibitors in clinical development for the treatment of Alzheimer’s disease. Expert Rev Neurotherap 18: , 847–857. |
[52] | Hansson O , Lehmann S , Otto M , Zetterberg H , Lewczuk P ((2019) ) Advantages and disadvantages of the use of the CSF Amyloid beta (Abeta) 42/40 ratio in the diagnosis of Alzheimer’s disease. Alzheimers Res Ther 11: , 34. |
[53] | Tandon R , Levey AI , Lah JJ , Seyfried NT , Mitchell CS ((2023) ) Machine learning selection of most predictive brain proteins suggests role of sugar metabolism in Alzheimer’s disease. J Alzheimers Dis 92: , 411–424. |
[54] | Lah J , Tandon R , Zhao L , Watson C , Elmor M , Heilman C , Sanders K , Hales C , Yang H , Loring D , Goldstein F , Hanfelt J , Duong D , Johnson ECB , Wingo A , Wingo T , Roberts B , Seyfried N , Levey A , Mitchell C (2023) Predictors of cognitive decline in healthy middle-aged individuals with asymptomatic Alzheimer’s disease. Res Sq, https://doi.org/10.21203/rs.3.rs-2577025/v1 [Preprint]. Posted February 28, 2023. |


