
Transcriptomic Analysis of Alzheimer’s Disease Pathways in a Pakistani Population1
Abstract
Background:
Alzheimer’s disease (AD) is a multifactorial neurodegenerative disorder that is most prevalent in elderly individuals, especially in developed countries, and its prevalence is now increasing in developing countries like Pakistan.
Objective:
Our goal was to characterize key genes and their levels of expression and related molecular transcriptome networks associated with AD pathogenesis in a pilot case-control study in a Pakistani population.
Methods:
To obtain the spectrum of molecular networks associated with pathogenesis in AD patients in Pakistan (comparing cases and controls), we used high-throughput qRT-PCR (TaqMan Low-Density Array; n = 33 subjects) coupled with Affymetrix Arrays (n = 8) and Ingenuity Pathway Analysis (IPA) to identify signature genes associated with Amyloid processing and disease pathways.
Results:
We confirmed 16 differentially expressed AD-related genes, including maximum fold changes observed in CAPNS2 and CAPN1. The global gene expression study observed that 61% and 39% of genes were significantly (p-value 0.05) up- and downregulated, respectively, in AD patients compared to healthy controls. The key pathways include, e.g., Amyloid Processing, Neuroinflammation Signaling, and ErbB4 Signaling. The top-scoring networks in Diseases and Disorders Development were Neurological Disease, Organismal Injury and Abnormalities, and Psychological Disorders.
Conclusions:
Our pilot study offers a non-invasive and efficient way of investigating gene expression patterns by combining TLDA and global gene expression method in AD patients by utilizing whole blood. This provides valuable insights into the expression status of genes related to Amyloid Processing, which could play potential role in future studies to identify sensitive, early biomarkers of AD in general.
INTRODUCTION
Alzheimer’s disease (AD) is the most common cause of dementia, and it is defined by cognitive decline coupled with extracellular deposit of amyloid-β (Aβ) protein in the form of plaques and intracellular hyperphosphorylation of the tau protein in the form of tangles [1]. The pathogenesis of AD begins with impaired synaptic function, which may result from extracellular deposition of the Aβ in the form of senile plaques, the appearance of intracellular neurofibrillary tangles, and cholinergic deficit. Studies also showed that the extensive neuronal loss, synaptic changes in the cerebral cortex and hippocampus, and other areas of the brain essential for cognitive and memory functions, may also be involved in AD progression [2].
Recent epidemiological data suggest that the prevalence of AD is higher in developed countries such as Western Europe and the United States compared to Asia and Africa, [3]. However, there are substantial numbers of affected individuals in South and East Asian regions, particularly in China, Japan, India, and Pakistan [4]. Pakistan is the sixth most populated country in the world and has 150-200 thousand people living with dementia [5]. The cause of continued rise of AD in the Pakistani population remains unknown. However, researchers observed a 2% to 6% rise in dementia cases among people over 65 years of age, as life expectancy increases in this country [6]. Reported studies suggest that environmental and lifestyle factors contribute to the risk of developing AD, especially in those who have specific genetic alterations [7].
Diagnosis of AD often occurs when severe neurodegeneration has already progressed, associated with cognitive decline [8]. Several potential biomarkers are being evaluated for their ability to detect at the early stages of AD, such as Aβ and tau protein levels in cerebrospinal fluid (CSF), and brain changes (progressive cerebral atrophy) detectable by imaging [9]. Recent evidence suggests that Aβ and tau levels in CSF may also change at various stages of the disease progression [8]. Insights into disease mechanisms can further be expanded due to the current development of molecular diagnostics and transcriptomic analysis [10, 11].
The use of invasive methods like obtaining CSF requires skilled expertise and carries significant medical risks [8, 9]. In contrast, whole blood is an incredibly useful tissue sample that requires minimal risk during collection (minimally invasive) and can be accurately profiled due to its richness in gene expression information. [12, 13]. In our previous study, we successfully identified signature genes associated with Type 2 diabetes and related comorbidities in an US African American (AA) population by analyzing peripheral blood samples [12–16]. The present study aims to investigate the expression levels of genes involved in Amyloid Processing using peripheral blood tissue samples from Pakistani patients with AD. To achieve our goal, we employed a rapid and direct approach using the TaqMan Low-Density Array (TLDA) method, which utilizes a preselected set of ninety-six (96) genes, to analyze gene expression from whole blood samples. This approach will allow us to investigate the expression levels of genes specifically associated with Amyloid Processing. Additionally, we aimed to explore global gene expression patterns in a pilot group, which will provide an understanding of the associated gene networks and their underlying pathogenetic pathways that may be involved in this understudied population.
METHODS
Selection of participants
Participants were selected from a convenience sample of 132 AD patients enrolled in the Pakistan from January 2016 to February 2018 from outpatient departments of regional hospitals in different cities of Pakistan (Supplementary Table 1), as previously reported [14]. Clinical diagnosis of AD was performed by experienced neurologists using standard methodologies including neurological examinations, magnetic resonance imaging (MRI), or computed tomography (CT) at various institutions. Detailed medical interviews also undertaken with the consent of participant’s family member, friends, or caregivers regarding the changes in the patient’s thinking skills as per AD Diagnostic Guidelines of National Institute of Aging and National Institute on Aging-Alzheimer’s Association workgroups on diagnostic guidelines for AD [17, 18]. The Mini-Mental State Examination (MMSE) test was further administered for each subject and scores are recorded, confirming the diagnosis of AD and the stage of the disease (MMSE Score range: 19–24 = early stage; 10–20 = moderate stage; <9 severe cognitive impairment in AD) [19]. In this study, only the participants with severe cognitive impairment (MMSE < 9) were selected among our patient’s pool (AD, n = 19, average age 76.52±10.7 years). The control group participants (n = 22, average age 70.02±6.5 years) were free from any major reported illness and had not undergone any major surgical procedures during the last 5 years. The cases and controls were well balanced with respect to gender, body mass index and HbA1c levels (Table 1).
Table 1
Characteristics of study participants
| Characteristics | AD participants (n = 19) | Healthy control (n = 22) | p |
| Age (y) | 76.52±10.72 | 70.02±6.56 | 0.02 |
| Gender (M/F) | 8/11 | 9/13 | – |
| BMI (kg/m2) | 21.42±2.15 | 22.03±2.02 | 0.10 |
| HbA1c (mmol/mol) | 5.29±0.52 | 4.94±0.56 | 0.08 |
| Mini-Mental State Examination score | 8.71±0.57 | – | – |
| Family History of AD (%) | 47 | None | – |
| Hypertension (%) | 79 | 22 | <0.001 |
| Cardiovascular disease (%) | 42 | 18 | 0.093 |
| *Smoker (%) | 26 | 18 | 0.53 |
*Among the participants in our smoker group, smoking habit was on average 7±10 years, with a daily consumption varying between 1 and 10 cigarettes per day.
The study was undertaken with prior approval of Howard University Institutional Review Board (IRB-17-MED-43), and informed consent was obtained from volunteers as per the approval of the Institutional Review Board (IRB) of Atta-ur-Rahman School of Applied Biosciences (ASAB), National University of Sciences and Technology (NUST) (28/IRB; dated 20 April 2016).
Informed consent was obtained from all individual participants included in the study.
Blood collection and cDNA synthesis
Whole blood was collected in PAXgene® Blood RNA Tubes (BD, Cat. #762165) from the outpatient department of the hospitals by experienced phlebotomists. RNA was extracted from the PAXgene tubes using the PAXgene Blood RNA Kit IVD (Qiagen, Cat. #762164 of PreAnalytiX GmbH, Germany) according to the manufacturer’s instructions. Contaminating DNA was removed with the Invitrogen DNA-free kit (ThermoFisher, CA, Cat #AM 1906). RNA content was determined spectrophotometrically with nanodrop at 230, 260, and 280λ. RNA quality was also verified by Agilent bioanalyzer analysis using an RNA 6000 nanochip prior to microarray chip hybridization as a part of quality control measures. After that, total RNA was reverse-transcribed to cDNA by using High-Capacity cDNA Reverse Transcription Kits (Part # 4387406; Applied Biosystems, CA, USA) according to manufacturer’s instruction and stored (at -20°C) for further process [15].
High-throughput TaqMan® low-density array (TLDA)
In the TLDA array study, a total of 33 participants were included of which fifteen (15) were in the AD group and eighteen (18) individuals were in the control group. We carefully considered age, gender, BMI, HbA1c, and MMSE score in each group (Supplementary Table 3). To investigate gene expression profiles related to the amyloid hypothesis in AD, we conducted a TLDA card-based profiler array analysis using the TaqMan® Array (FAST Plate) from Applied Biosystems (Catalog # 4418715, Santa Clara, CA, USA) on the ABI 7900HT-Fast Real-time PCR system for quantification. These cards are designed with preselected ninety-six (96) genes, including a reference gene (GAPDH (Hs99999905_m1) and a manufacturer control (18 s rRNA (Hs99999901_s1), specifically related to the amyloid-β protein precursor (AβPP) processing, Aβ aggregation, tau hyperphosphorylation, excitotoxicity, inflammation, oxidation microglial activation and cholesterol biosynthesis (Supplementary Table 2). The selection of genes was based on information obtained from publicly available databases and relevant literature [20–27]. The TLDA data were analyzed and compared to the control using SDS Ver. 2.4 software (ABI, CA). To visualize and further expression analysis, the data were exported in plate-centric format to RQ Manager (ABI, V 2.4) which allowed us to look at the differential gene expression status of each gene in the study participants compared to control subjects. We applied t-tests to assess the statistical significance of differential expressions in between control and patient group samples.
In the protocol, rigorous quality control was maintained by incorporating 18 S rRNA as an internal control with a constant expression level across the samples. To meet the manufacturer’s recommendation, the mean standard deviation (SD) of 18 S rRNA ΔCT was kept below 1 value (18 S rRNA Average ΔCT –11.88±0.60 (SD < 1), ensuring a reliable measure of individual TLDA card and gene expression level. In order to ensure consistency in batch variation, we adhered to the methodology outlined in the study conducted by Lappan et al. (2022) [28]. Our study involved the utilization of the same sets of TLDA cards, all of which originated from the same production batch (TaqMan Array 96-Well Plate, Batch No. 2106012).
Global gene expression array
In the global differential gene expression pilot study, AD participants (n = 4) and healthy controls (n = 4) were selected with equal numbers of males and females in each group (Supplementary Table 3). The oligonucleotide microarray experiments were conducted by EpigenDx (Boston, MA) using the Affymetrix U133 Plus 2.0 Array platform, which has comprehensive coverage of the whole transcribed human genome on a single array. Differentially expressed gene sets were analyzed with microarray results using a one-way ANOVA model by Partek Genomic Suites (GS- V.4.1; Partek Inc., St. Louis, MO, USA). The probe summarization and probe set normalization were done using the GC-RMA algorithm, which included GC-RMA background correction, quantile normalization, log2 transformation and median polish probe set summarization [29]. The study outcomes maintained the false positive percentage < 5% and 0.05 significant level. To ensure quality control in the global gene expression array, multiple measures were implemented. These include > 4-fold cRNA amplification from total RNA/cDNA, scaling factors kept below 2 to achieve whole-chip normalization of 800, and visual inspection of hybridization patterns to identify any chip defects.
To assess the uniformity of assay performance with the array cards, multiple manufacturing lots were tested by the manufacturer [30]. Sensitivity measurements based on the spikes and reproducibility measurements based on the non-spike, non-control (∼54,000) probe sets were obtained for the nine lots. The data showed relatively uniform results among the different lots. Spike detection (96 to 100%) and change calls (96 to 100%), as well as false change rates (0.16 to 0.26%), produced highly consistent results between different lots.
Identification of cellular processes and pathways by IPA
From the differential gene expression data sets described above, the identification of cellular processes and pathways by IPA was performed to identify the key genes, biological functions, and network analysis. Briefly, the data sets comprising gene identifiers and corresponding expression values (fold change along with p values) from the microarray experiment was imported to the IPA. Differentially expressed gene identifiers were then mapped to related changes in biofunctions (cut of value p < 0.05 and the±2-fold changes). Networks were algorithmically generated based on their connectivity. A score (p-score=–log10 (p-value)) according to the fit of the set of supplied genes and a list of biological functions stored in the Ingenuity Knowledge Base was generated [32]. Networks were “marked” on the most prevalent functional group(s) present. Canonical Pathway (CP) analysis identified function-specific genes significantly present within the networks. In the CP analysis, the percentage of overlap was calculated as a statistical measure to evaluate the enrichment of network-regulated genes in each dataset. This measure quantifies the likelihood of observing the resulting overlap between the network-regulated genes (IPA Knowledge Base) and the genes present in the dataset (observed result).
Statistical analysis
Statistical analysis was performed using the chi-square test and t-test for comparisons between the AD versus control group, to observe any significant differences in clinical parameters and comorbidities. T-tests were applied to assess the significance of differential expressions between control and patient group samples. Reported data were represented as means±SEM and figures were produced using Excel and GraphPad Prism (version 8) software. Differentially expressed gene sets were analyzed with microarray results using a one-way ANOVA model by Partek Genomic Suites (GS-V.4.1; Partek Inc., St. Louis, MO, USA). We corrected the global expression data set outcome by applying the false discovery percentage (FDR) at alpha < 5%; p-value of < 0.05 was considered significant [33–35]. Pearson correlation coefficient calculation was calculated using the RMA-normalized gene expression data in the target data matrix. In the IPA analysis, Fisher’s exact test was applied to measure p-value to understand the likelihood that the association between a set of molecules in our dataset and a related disease or function is due to random association. The smaller the p-value (which means a larger –log of that value), the less likely that the association is random and the more significant the association. In general, p-value s≤0.05 (–log = 1.3) indicate a statistically significant, non-random association.
RESULTS
Gene expression analysis by TLDA
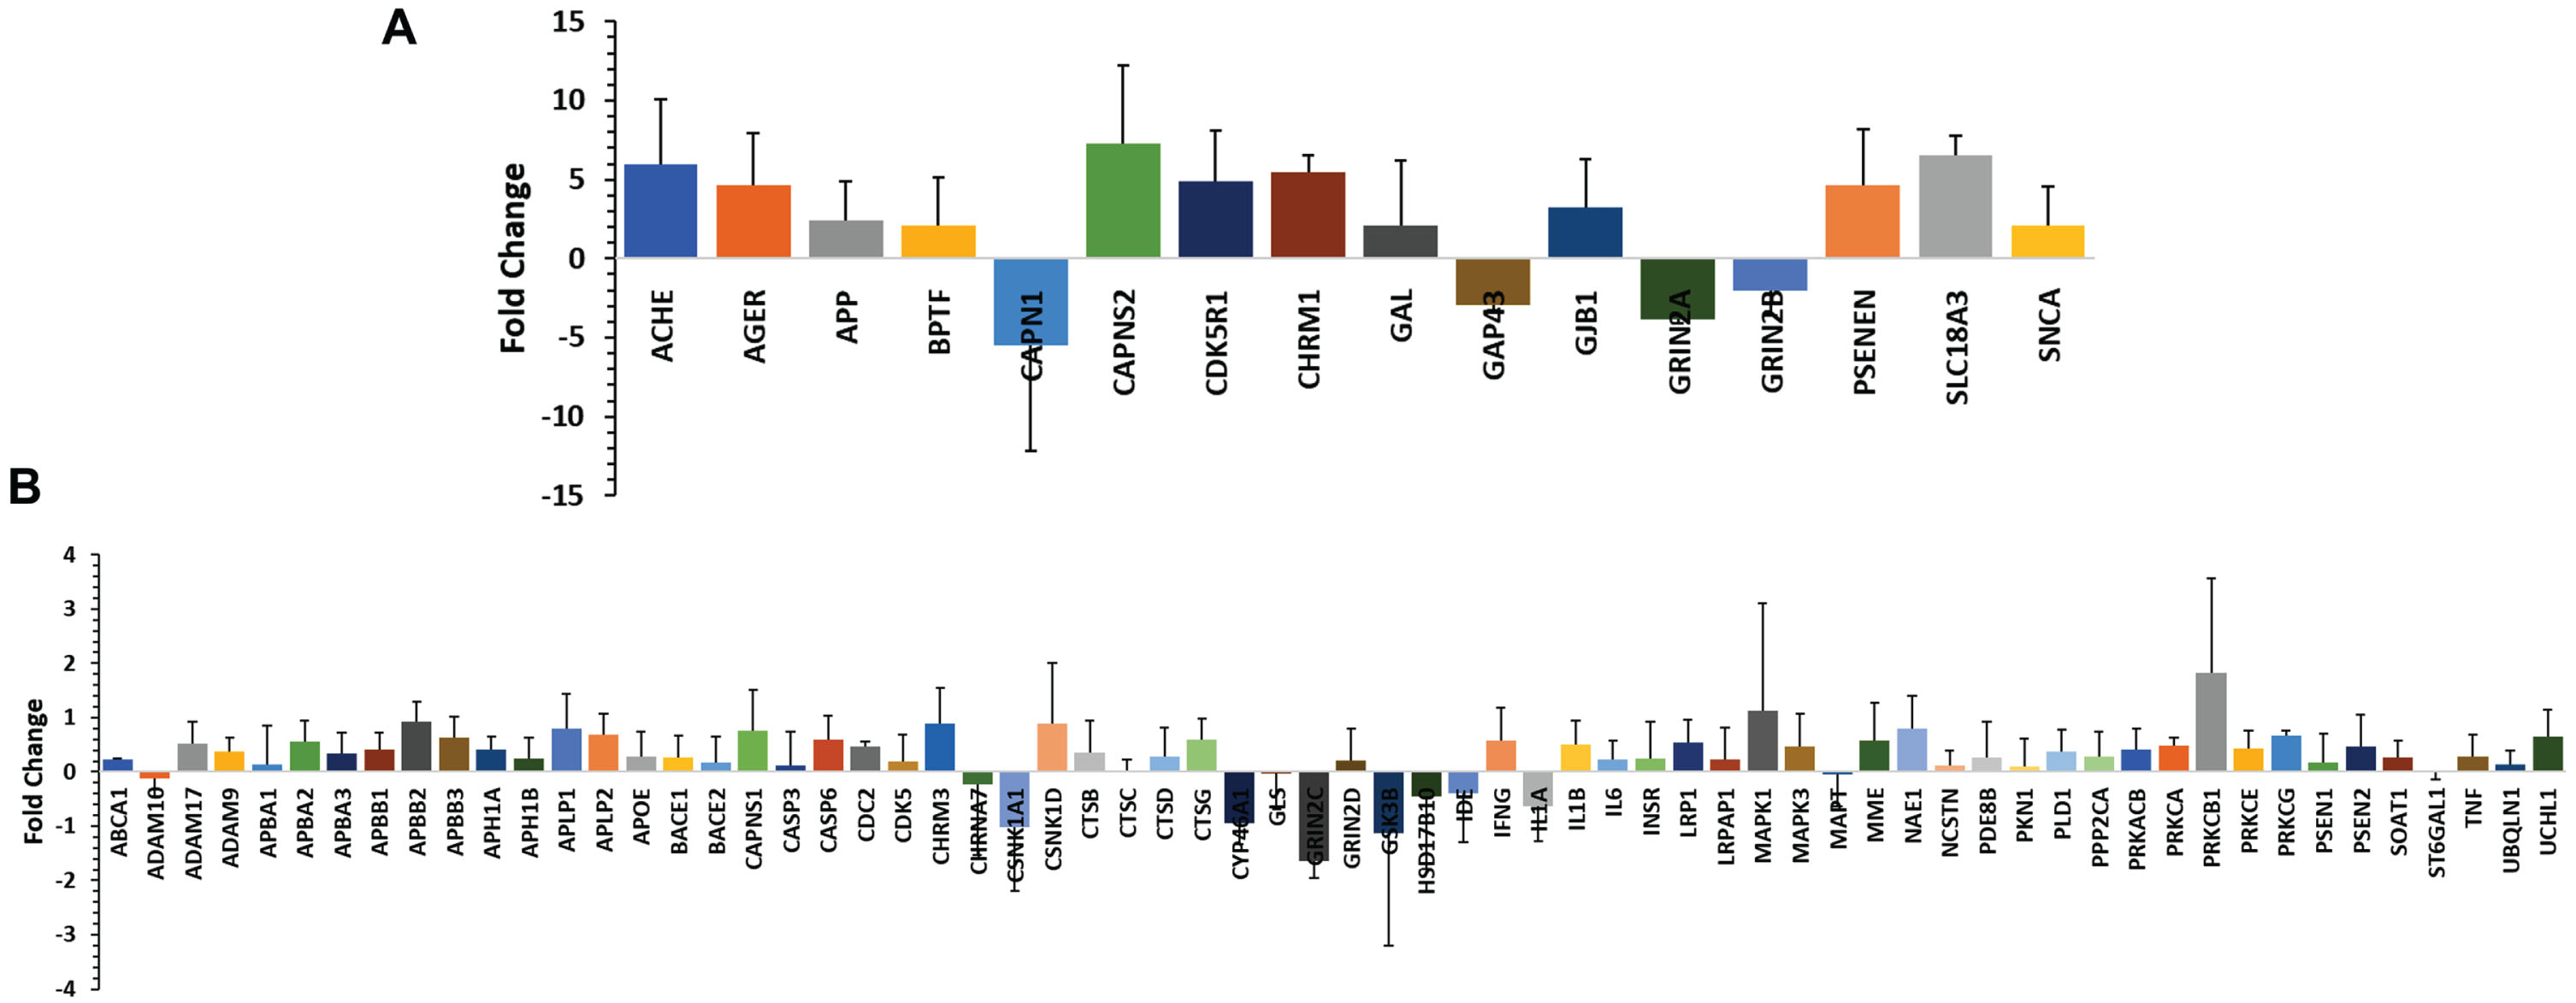
In the TLDA array study, 33 participants were included (15 from the AD group, 18 from the control group). TaqMan® Array analysis was conducted using a TLDA card-based profiler array with preselected 96 genes related to amyloid hypothesis in AD. It is known that the aberrant accumulation of aggregated Aβ peptides as plaques, a hallmark of AD [2]. Therefore, we primarily targeted genes involved in amyloid processing. These genes were selected based on information obtained from publicly available databases and relevant literature [21–27]. Among the set of 96 genes analyzed, we observed amplification in 82 genes. Out of these, sixty-five (65) genes showed upregulation, indicating higher expression levels, while 17 genes exhibited downregulation, indicating lower expression levels in AD patients compared to the control group (Fig. 1A, B). Sixteen (16) genes (Supplementary Table 5) were significantly up- or downregulated (p value < 0.05). The upregulated genes were ACHE, AGER, APP, BPTF, CAPNS2, CD5R1, CHRM1, GAL, GJB1, PSENEN, SLC18A3, and SNCA. The downregulated genes were CAPN1, GAP43, GRIN2A, and GRIN2B.
Fig. 1
A) Quantitative real-time PCR (qRT-PCR) validation of the selected 16 genes which were significantly up or down regulated (±10-fold change). B) Quantitative real-time PCR (qRT-PCR) validation of 66 genes which were up- or downregulated below±10-fold change. The study was performed using TaqMan low-density array (TLDA) in ABI platform (7900HT Fast Real-Time PCR System) and analyzed (ΔΔCt) by SDS RQ Manager Version 1.2.1. The relative quantification (RQ) of the genes showing up-/downregulation among the AD subjects in a small population (n = 15). The RQ is calculated in contrast to healthy control samples (n = 18).
Gene network and canonical pathways based on TLDA
The top canonical pathways (based on the overlap percentage and p-value <0.05) were Amyloid Processing, nNOS Signaling in Neurons, ErbB4 Signaling, Neuroinflammation Signaling Pathway, Reelin Signaling in Neurons (overlap percentages were 42.9, 22.7, 19.2, 9.7, and 9.4 respectively). Top Disease and Disorders (with maximum number of molecules involved therein and p-value <0.05), were Organismal Injury and Abnormalities, Organismal Injury and Abnormalities, Neurological Disease, Psychological Disorders, and Metabolic Disease. The top Molecular and Cellular Functions were Cell Morphology, Cell Death and Survival, Cellular Compromise, Small Molecule Biochemistry, and Lipid Metabolism. The top Physiological System Development and Functions were Nervous System Development and Function, Tissue Development, Organismal Development, and Tissue Morphology (Supplementary Table 4).
Global gene expression
To further examine additional potential gene expression pattern differences associated with AD, we performed a pilot global gene expression analysis on 4 AD subjects and 4 control subjects using an Affymetrix gene chip. Out of a total of 53,618 transcripts on the gene chip, 31,136 genes were differentially expressed in the AD subjects. Of these 31,136 genes, the differential expression of 1,657 genes were significantly expressed when we compared between the cases and control (p-value <0.05). The results showed that 61% (1,017 genes) were downregulated, and 39% (640 genes) were upregulated, with fold changes ranging between+14 (upregulation) to -189 (downregulation) (Supplementary Figure 4). These significantly expressed genes were analyzed by IPA analysis to divulge their gene networks and disease pathways.
Top biofunctions and associated diseases and disorders
IPA analysis was used to investigate the functional roles and molecular mechanisms of the differentially expressed genes (Table 2). The top canonical pathways (based on≥2.0-fold change and a p-value <0.05) were Amyloid Processing, Neuroinflammation Signaling Pathway, ErbB4 Signaling, nNOS Signaling in Neurons, and Molecular Mechanisms of Cancer. Top Diseases and Disorders, based on≥2.0-fold change and a p-value <0.05, were Neurological Disease, Organismal Injury and Abnormalities, Psychological Disorders, Metabolic Disease and Skeletal and Muscular Disorders. The top Molecular and Cellular Functions were Cell Death and Survival, Cellular Compromise, Cell Morphology, Cellular Development, and Cellular Growth and Proliferation. The top five Physiological System Development and Functions were Tissue Morphology, Nervous System Development and Function, Tissue Development, Organismal Development and Organ Development (Supplementary Figure 1). An overall downregulation trend in gene expression was identified according to different disease pathways, wherein G-Protein Coupled Receptors Signaling showed the highest number of genes involved (n = 259), and Airway Pathology in Chronic Pulmonary Obstructive Disease contained the lowest number of genes involved (n = 6) (Supplementary Figures 2 and 3).
Table 2
Top Canonical Pathways (Global gene expression) from IPA Results with their p-value in the AD population
| Top canonical pathways | p* | Overlap (%) * |
| Amyloid Processing | 1.02E-34 | 44.7 |
| nNOS Signaling in Neurons | 1.42E-13 | 23.3 |
| ErbB4 Signaling | 8.55E-16 | 18.1 |
| Neuroinflammation Signaling Pathway | 5. 20E-27 | 10.7 |
| Molecular Mechanisms of Cancer | 8.96E-13 | 5.4 |
| Top Diseases and Bio functions | ||
| Diseases and Disorders | ||
| p Range | #Molecules | |
| Neurological Disease | 3.90E-02 – 2.08E-27 | 37 |
| Psychological Disorders | 3.90E-02 – 2.08E-27 | 33 |
| Organismal Injury and Abnormalities | 3.90E-02 – 2.08E-27 | 32 |
| Metabolic Disease | 1.97E-02 – 8.85E-25 | 25 |
| Skeletal and Muscular Disorders | 3.90E-02 – 1.13E-08 | 15 |
| Molecular and Cellular Functions | ||
| p Range | #Molecules | |
| Cell Death and Survival | 4.54E-02 – 5.84E-11 | 18 |
| Cell Morphology | 2.35E-02 – 3.17E-08 | 15 |
| Cellular Growth and Proliferation | 3.90E-02 – 3.49E-08 | 15 |
| Cellular Development | 3.90E-02 – 3.49E-08 | 14 |
| Cellular Compromise | 2.62E-02 – 1.37E-08 | 6 |
| Physiological System Development and Function | ||
| p | #Molecules | |
| Nervous System Development and Function | 3.90E-02 – 3.17E-08 | 23 |
| Tissue Development | 3.90E-02 – 3.49E-08 | 13 |
| Organismal Development | 1.32E-02 – 1.79E-07 | 11 |
| Tissue Morphology | 3.26E-02 – 1.37E-08 | 7 |
| Organ Development | 1.32E-02 – 9.55E-06 | 6 |
*The data was generated using Ingenuity Pathway Analysis (IPA) from QIAGEN, USA, January 2023 Release, and incorporated the relative gene expression levels measured in the patients’ group. The percentage of overlap was calculated as a statistical measure to evaluate the enrichment of network-regulated genes in input dataset. This measure quantifies the likelihood of observing the resulting overlap between the network-regulated genes (Ingenuity Knowledge Base) and the genes present in the dataset (observed result). The p-value was measured to understand the likelihood that the association between a set of molecules in our dataset and a related disease or function is due to random association. The smaller the p-value (which means a larger log of that value), the less likely that the association is random and the more significant the association. In general, p-value s≤0.05 (log = 1.3) indicate a statistically significant, non-random association. The p-value was calculated using a right-tailed Fisher’s Exact Test. Molecules: Number of significant molecules that are associated with each function. The percentage of overlap was calculated as a statistical measure to evaluate the enrichment of network-regulated genes in a given dataset. This measure quantifies the likelihood of observing the resulting overlap between the network-regulated genes (Ingenuity Knowledge Base) and the genes present in the dataset (observed result).
Amyloidosis and amyloid processing pathways
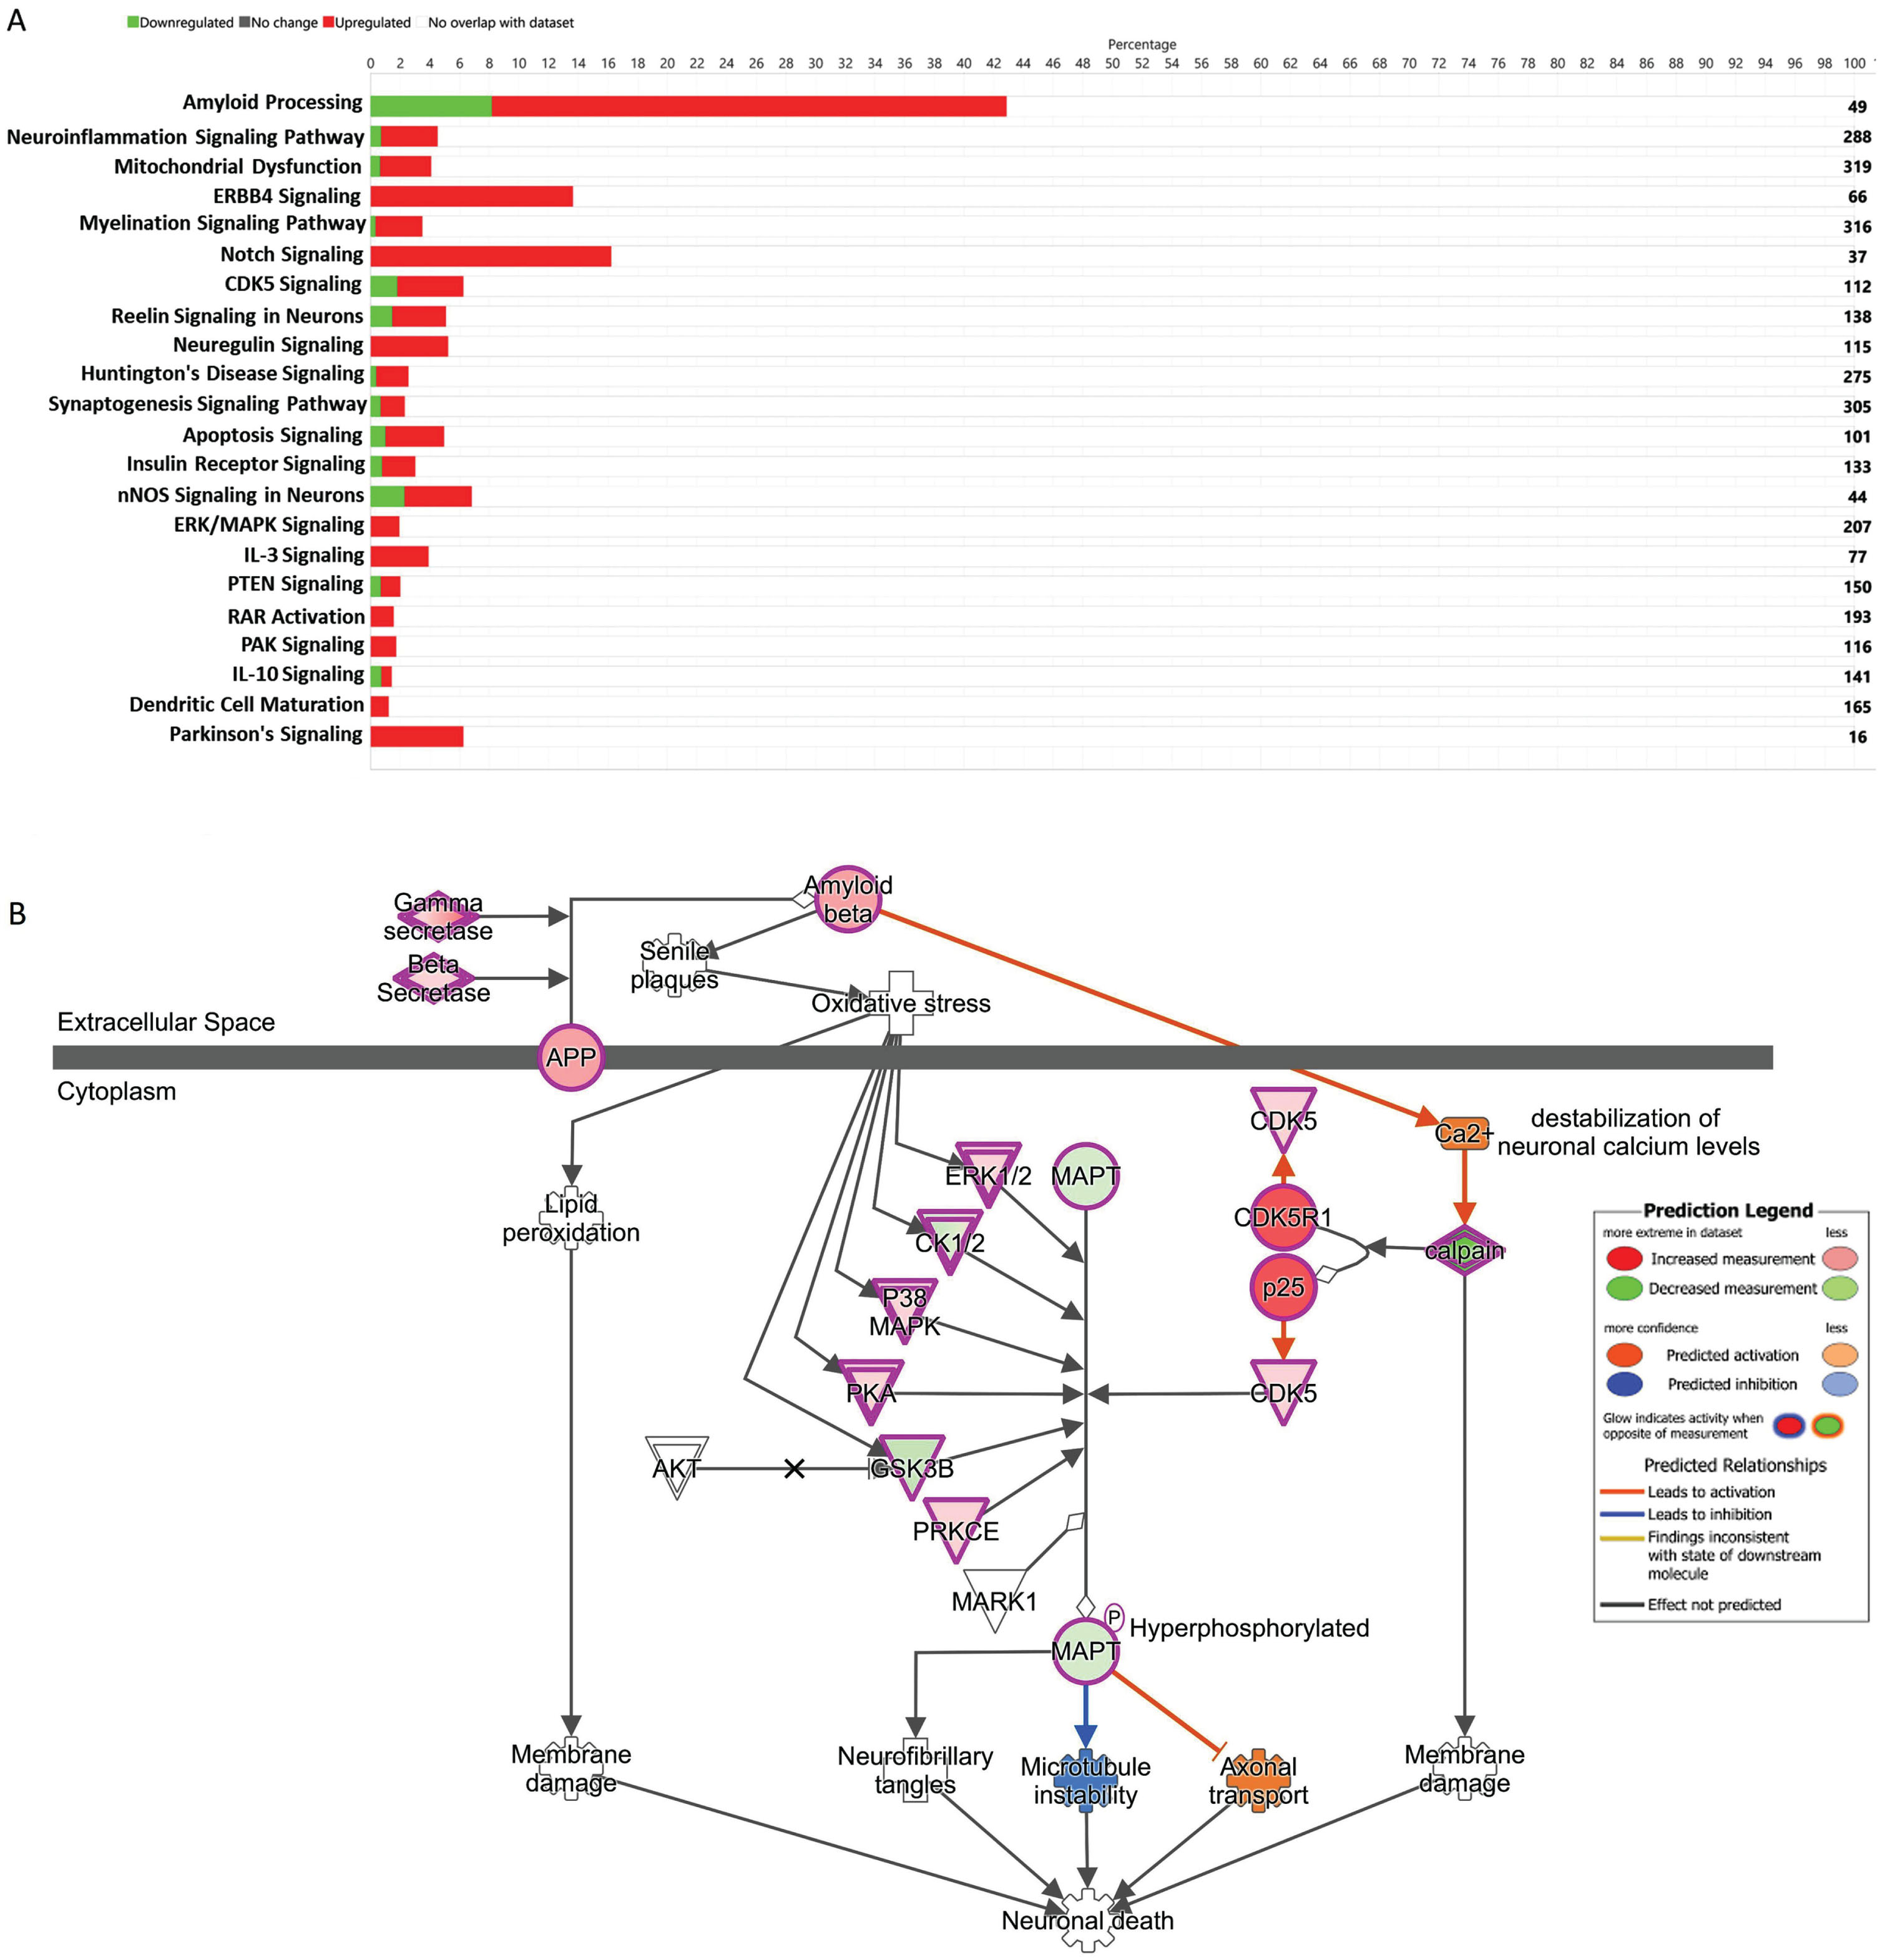
The global gene expression data reveals the genes involved in amyloidosis processes were upregulated. We found that Amyloid Processing had the highest percentage (43%) of similar set of up and downregulated genes, which overlapped with the existing data set reported in the IPA (Fig. 2A). We also observed significant upregulation of ERK1/2, CK1/2, P38MAPK, PKA, PRKCE, CDK5, and CDK5R1, and downregulation of MAPT, and GSK3B involved with the Amyloid Processing Pathway (Fig. 2B).
Fig. 2
A) The stacked bar chart represents a summary of total upregulated (red) and downregulated (green) genes representing 22 important signaling and disease pathways in AD subjects compared to controls. The output core analysis, reflecting the differential gene expressions obtained from the microarrays (gene sets with≥2-fold change, t-test, p < 0.05). B) Ingenuity Pathway Analysis (IPA)-derived Amyloid Processing network of differentially expressed genes derived from microarray analysis. IPA analysis identified a group of genes expression status and their potential interactive links in the context of Amyloid Processing, Neuronal Death. We noted activation of Gamma Secretase, Beta Secretase, upregulation of ERK1/2 CK1/2 P38MAPK, PKA, PRKCE, CDK5, and CDK5R1 and downregulation of MAPT, and GSK3B.
Other canonical pathways (CP) and gene ontology (GO) enrichment of biological processes
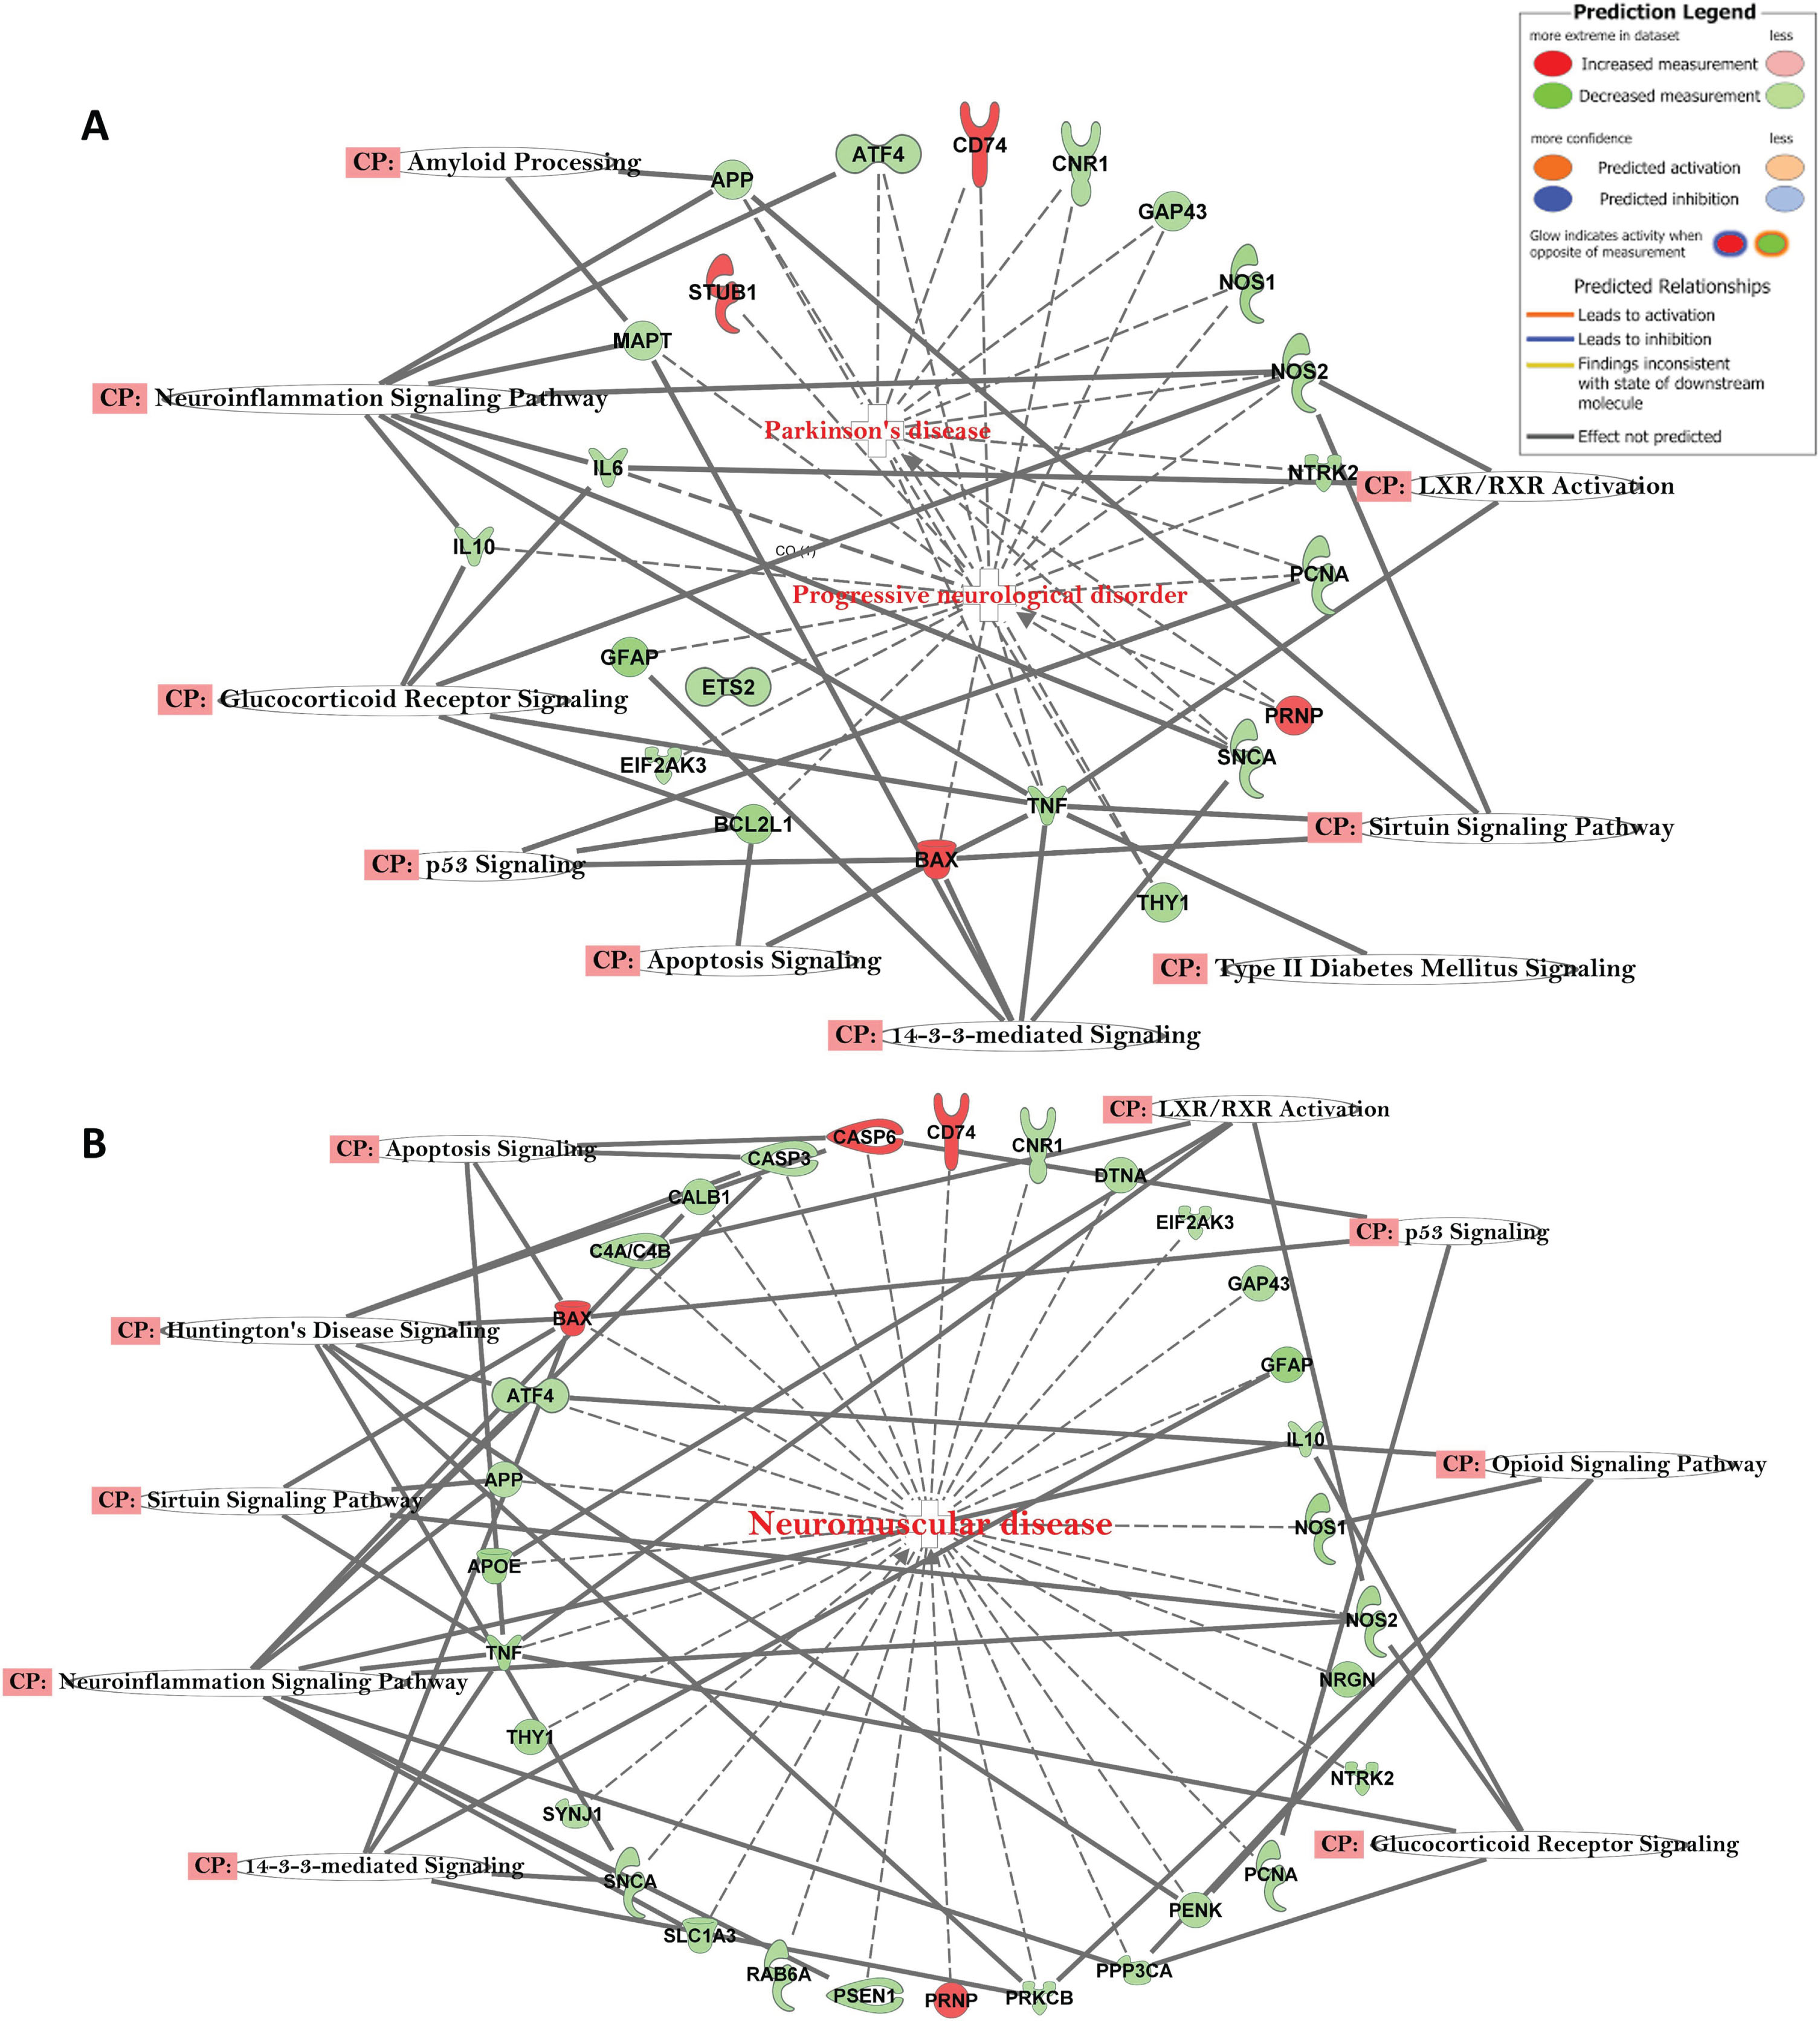
The top canonical pathways with AD-related Gene Networks were: 14-3-3-Mediated Signaling, Amyloid Processing, Neuro-Inflammation Signaling Pathway, Mitochondrial Dysfunction, Parkinson’s Signaling, Apoptosis Signaling, Sirtuin Signaling Pathway, and Glucocorticoid Receptor Signaling (Fig. 3). The genes APP, APOE, CASP3, MAPT, PSEN1, GSK3B, and TNF were all downregulated, while LRP1, PSNEN, LAMA1, and FGF2 were upregulated (Fig. 3). The genes, e.g., APP, ATF4, CD74, CNR1, GAP43, NOS1, NOS2, NTRK2, PCNA, PRNP, SNCA, TNF, BAX, THY1, EIFA2K3, GFAP, and IL10 were in common with those observed in other progressive neurological disorders, such as Parkinson’s disease (Fig. 4A) and other neuromuscular diseases (Fig. 4B).
Fig. 3
Network of differentially expressed genes in the important signaling pathways in the AD participants, relative to healthy control subjects. Connections between differentially expressed genes were processed for those with≥2-fold change, t-test, p < 0.05. Geometric figures in red denote upregulated genes, and those that are green indicate downregulation. Canonical pathways for signaling that are highly represented are shown within the box. Genes in uncolored notes were integrated into computational generated networks based on evidence stored in the IPA knowledge base.
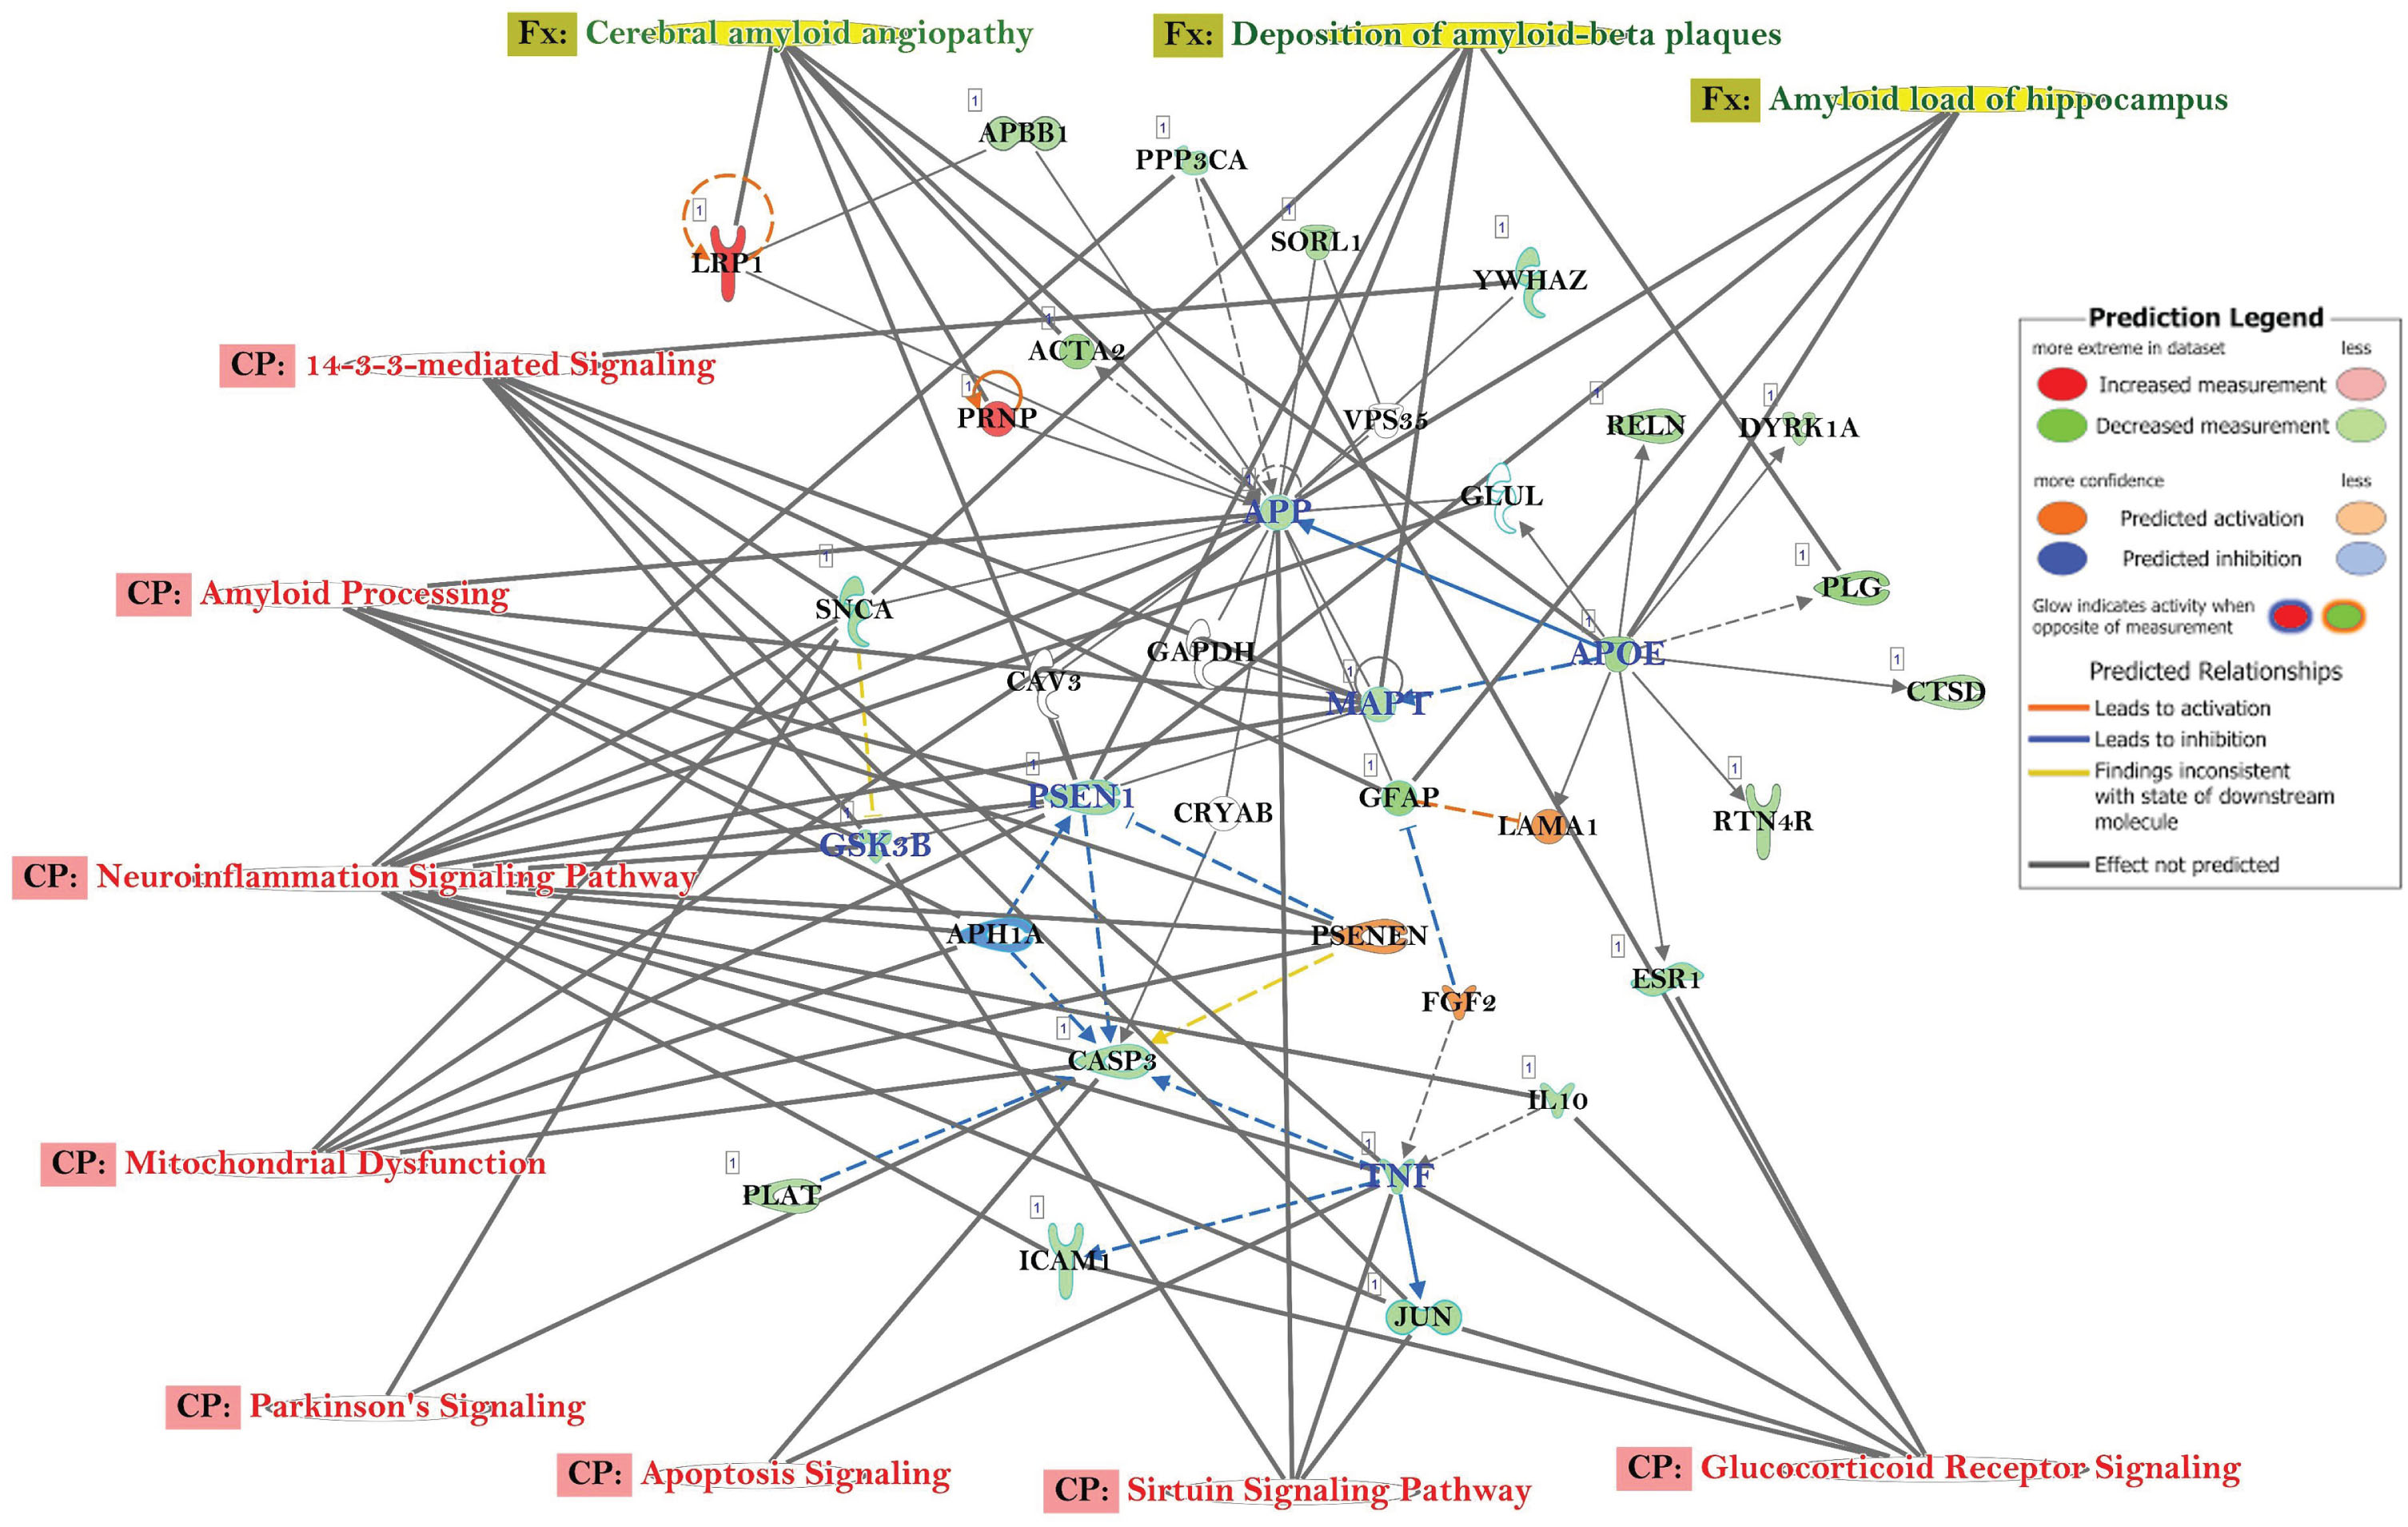
Fig. 4
A) Network of differentially expressed genes in the important signaling pathways of progressive neurological disorders and linked with Parkinson’s disease in AD subjects. B) Network of differentially expressed genes in the important signaling pathways of progressive neurological disorders linked with neuromuscular disease in AD subjects.
DISCUSSION
Pakistan faces a significant burden of dementia, with an estimated 150-200 thousand affected individuals [5]. The rise in AD cases among the aging population globally necessitates a quick, dependable, and minimally invasive diagnostic method. Biomarkers such as Aβ and tau levels in CSF and brain imaging (MRI/CT scan) are currently being practiced for early detection [8, 9]. Usage of whole blood samples can augment those approaches as a non-invasive liquid biomarker, a low-risk alternative for genetic assessment compared to invasive procedures. Many studies based on GWAS, NGS, and transcriptomic expression studies on brain tissue samples have provided potential biomarker genes to predict the risk of developing AD. Those genes included CLU, SORL1, ABCA7, PLD3, PICALM, NME8, TREM2, AKAP9, and ADAM10 [36]. In contrast, our study aimed to investigate the altered expression of genes involved in Amyloid Processing by utilizing peripheral blood tissue samples from Pakistani patients with severe AD. We evaluated the global gene expression patterns by analyzing differentially expressed genes and their associated canonical pathways to understand biological mechanisms underlying AD in Pakistani population. Notably, the study is first ever reported from a Pakistani population.
Despite the increasing prevalence of AD in the region, knowledge of biological pathways potentially regulating its pathophysiology is lacking. Previous studies suggested multifactor associations such as hypertension, poor hygienic conditions, poverty, illiteracy, high prevalence of diabetes mellitus, and cardiovascular diseases in Pakistan [37]. Recent studies suggest dyslipidemia could also be related to AD risk as a component of metabolic syndrome [38]. The prevalence of dyslipidemia in this population is another probable factor because the majority eats food containing highly saturated fats [39]. Smoking is associated with an increased risk of dementia as it contributes to various vascular problems, such as strokes or smaller bleeds in the brain, which are also known risk factors for dementia [40]. A recent study observed a significant interaction between APOE genotype and smoking status (p = 0.002) in a European cohort [40]. Although we noticed that most of the AD participants were nonsmokers, whereas cardiovascular disease and hypertension were more predominant in the population. Cardiovascular risk factors have long been recognized as closely related to the development of AD [41]. Simultaneously, there is documented evidence that concurrent cerebrovascular disease is more frequently observed in AD compared to other neurodegenerative diseases [41]. We also observed an increased number of participants with cardiovascular disease compared to the control group. Many studies have reported that midlife hypertension is linked to an elevated risk of cognitive decline and dementia, including AD [42, 43]. Hypertension causes cerebrovascular disease that may increase the possibility for individuals with AD encephalopathy to express dementia syndrome [44]. Moreover, hypertension induces changes in the vessel walls of the brain, resulting in hypoperfusion, ischemia, and hypoxia, which could initiate the pathological process of AD [44]. Recent studies indicate that hypertension may further enhance the progression of AD through an amyloid-dependent pathway, modulating the effects of apolipoprotein E ɛ4 (APOE4) in AD patients [43]. Furthermore, we noted a significant presence of hypertension among participants in the AD group compared to the control group (p < 0.001).
In our TLDA study, among the amyloid processing gene set we identified 16 genes (ACHE, AGER, APP, BPTF, CAPNS2, CD5R1, CHRM1, GAL, GJB1, PSENEN, SLC18A3, SNCA, CAPN1, GAP43, GRIN2A, and GRIN2B) that showed significant up- or downregulation compared to the control group. Notably, CAPNS2 exhibited maximum upregulation while CAPN1 showed a maximum downregulation. These genes belong to the Calpains gene family, which consists of calcium-dependent proteases involved in various physiological and pathological processes in AD [45]. Previous studies examining brain tissue samples have observed consistent elevation of calpain activity in most AD cases when compared to controls [32]. This suggests that calpain, a calcium-dependent protease, may play a significant role in the development and progression of AD in our studied subjects. Additionally, the upregulation of CAPNS2 has been found to precede tau phosphorylation and the loss of synaptic proteins in the AD brain that corroborated our blood-based transcriptomic expression which yielded similar findings in the majority of our severe AD patients [46].
In the global gene expression study, we observed that more than 1,600 genes were differentially regulated in AD patients compared to controls, and several genes, e.g., APP, APOE, CASP3, MAPT, LRP1, PSEN1, GSK3B, and TNF, which were statistically significant in their expression levels. A previous study executed brain tissue reported that autosomal dominant transmission of the disease in some AD cases and mutations in the specific genes encoding PSEN1, PSEN2, and APP have been associated with early-onset familial cases [47]. The formation of amyloid is decreased by AβPP in AD with the help of insulin and insulin-like growth factor (IGF-1) [48]. The expression of APP was downregulated in our study, and the gene networks involve Amyloid Processing, APOE regulation, Neuroinflammation Signaling, Mitochondrial Dysfunction, and the Sirtuin Signaling Pathway, which corroborated findings from previous studies [32].
The presence of the APOE4 allele, which is carried by half of all AD patients, is one of the most significant genetic risk factors for the disease [46]. APOE4 influences lipid metabolism by acting as a ligand for receptors. Genetic studies suggest APOE4 allele polymorphism is an important risk factor for AD prevalence in the Pakistani population [46]. Individuals who are APOE4 allele positive (or elevated APOE mRNA level) have a high risk of developing AD [47, 49]. Our results are in accord with those studies and suggest that the APOE gene promotes and regulates Aβ-induced neuroinflammatory response in the neurons of AD patients [48]. Involvement of PSEN1 in the Aβ production that cleaves APP into Aβ fragments, thus helping in AβPP processing. Consistent with our own results on the downregulation of this gene, the inactivation of PSEN1 has been reported to be associated with AD progression [50].
In addition to genes in the amyloid pathways, several other canonical pathways and genes of interest were prominent in our results. One of these is the microtubule-associated protein tau (MAPT) gene, which has been linked to the increased risk of developing AD [51]. The neurofibrillary tangle formation in AD contains paired helical filaments (PHFs), and these PHFs are made of the hyperphosphorylated form of the MAPT gene [52]. In our study, MAPT gene downregulation was related to the amyloid processing and neuroinflammatory signaling pathways, in accord with the studies [51, 52]. Recently, GWAS studies have also confirmed the role of MAPT and its association with the increased risk of AD [53].
In the pathway analysis, the Amyloid Processing pathway emerged as one of the most prominent pathways with a high degree of overlap observed in both gene expression studies (profiler genes and global genes). This outcome was anticipated since Aβ is widely recognized as a critical pathological factor in the progression of AD. The accumulation and aggregation of Aβ are known to trigger the advancement of AD, which can be attributed to either Aβ overproduction or impaired clearance [54]. Nitric oxide (NO) signaling plays a role in memory development via neuronal NO synthase (nNOS) and contributes to neuroinflammation through inducible NO synthase (iNOS), which regulates inflammatory processes in the central nervous system [55]. NO-mediated neuroinflammation is a fundamental characteristic of AD, as inflammatory signaling induces the release of immune mediators that impact neuronal functions and contribute to neural cell death. Moreover, the activation of nNOS Signaling leads to the synthesis of nitric oxide (NO), resulting in oxidative and nitrosative stress in neural cells [56, 57]. Reported studies suggest that increased bioavailability of NO is a potential risk factor for AD progression [56, 57]. This finding aligns with our pathway analysis, suggesting the activation of Neuroinflammation Signaling Pathway and nNOS Signaling in Neurons as a shared pathway. In the ErbB4 Signaling pathway, ErbB4 immunoreactivity is colocalized with the Bax-mediated apoptotic signaling in hippocampal pyramidal neurons in AD brains [58]. Those findings also indicated that the upregulation of ErbB4 immunoreactivity in apoptotic neurons may play a role in the progression of AD pathology because of its role in cognition, learning and memory formation through the modulation of synaptic plasticity and neuronal survival [58, 59]. Furthermore, we also identified the ErbB4 Signaling in Neurons as a common pathway in both the global gene expression and TLDA results.
The research approach presented in this pilot investigation provides potentially valuable insights into the expression status of genes associated with Amyloid Processing, offering a better understanding of potential mechanisms underlying AD in this specific population. By utilizing whole blood samples and employing the TLDA method, our study successfully identified the activation or inactivation of amyloid processing genes and their relationship to the pathogenesis of AD. Recent transcriptomic studies based on peripheral blood in a Korean population revealed that COPS4, PSMA6, GTF2B, GTF2F2, and SSB were dysregulated in AD patients [60]. Another study reported that potential peripheral blood transcriptomic biomarkers for AD, including DUSP1, FOS, SLC7A2, RGS1, GFAP, CCL2, ANGPTL4, and SSPN expression, matched hippocampus tissue sample expression in the same patients, suggesting the utility of blood as an appropriate tissue for exploring potential biomarkers of the disease [61]. The use of whole blood as a sample source allows for a non-invasive and efficient means of investigating gene expression patterns. This approach holds promise for future research and potential applications in clinical settings.
Strengths and limitations of the study
This study has some notable strengths as well as some limitations. The study primarily focused on complex and diverse mechanisms that were associated with AD-related pathophysiology. This global gene expression and IPA information contributed to detailed information about differential gene expression and signaling pathways associated with AD. On the other hand, our limited sample size in this pilot study restricted us from exploring potential links between AD-related gene expression and environmental and sociodemographic factors.
Conclusions
Our pilot study characterized differentially expressed genes and their associated canonical pathways in relation to potential drivers of AD in a Pakistani population, utilizing blood as a less invasive sample source. The results highlighted the interplay of genes in the relevant biologically pathways in amyloid processing and neuroinflammation signaling, among pathophysiological mechanisms, which may help us to focus the development of early biomarkers of AD in the future. Multi-ethnic, large-scale population validation studies are warranted to support and expand these early findings.
AUTHOR CONTRIBUTIONS
Tanmoy Mondal (Conceptualization; Formal analysis; Methodology; Software; Writing – original draft; Writing – review & editing); Zarish Noreen (Conceptualization; Data curation; Methodology); Christopher A. Loffredo (Writing – review & editing); Jheannelle Johnson (Formal analysis; Methodology); Attya Bhatti (Conceptualization; Data curation; Formal analysis; Writing – review & editing); Gail Nunlee-Bland (Supervision; Visualization; Writing – review & editing); Ruth Quartey (Data curation; Supervision; Visualization); Charles D. Howell (Supervision; Visualization); Gemeyel Moses (Formal analysis; Investigation; Methodology); Thomas Nnanabu (Data curation; Formal analysis; Methodology); Sharleine T. Cotin (Data curation; Methodology); Marika Clark (Data curation; Methodology); Vijay Chandra (Supervision; Visualization); Siddhartha S. Jana (Supervision; Writing – review & editing); Bernard Kwabi-Addo (Supervision; Writing – review & editing); Brent E. Korba (Supervision; Visualization; Writing – review & editing); Sharoon Shahzad (Data curation; Methodology); Muhammad Farrukh Bhatti (Data curation; Methodology); Somiranjan Ghosh (Conceptualization; Writing – original draft; Writing – review & editing).
ACKNOWLEDGMENTS
The authors would like to extend their sincere thanks to all the respondents who voluntarily participated in the study and provided valuable responses during the recruitment process. Our sincere thanks go Dr. Sumit Sarkar, PhD of National Center for Toxicological Research of FDA/HHS, Jefferson, Arizona for his critical reviewing and editing the manuscript. The contents of this report are solely the responsibility of the authors.
FUNDING
This work was supported by a U54 MD00759731-5859 grant (PI: Southerland; Project Lead: Ghosh) from the National Institute of Minority Health and Disparity (NIMHD/NIH). This work also received support from Higher Education Commission (HEC), Pakistan (1-8/HEC/HRD/2017/6867) to Zarish Noreen. Supporting funding also received from ASAB (NUST) (Grant # 20-2321/R&D/HEC/14, PI: Bhatti. We are also indebted to Dr. Peter John of National University of Sciences and Technology (NUST), Islamabad, Pakistan for the Grant support (Grant # 5965/Federal/NRPU/R&D/2016, PI: John).
CONFLICT OF INTEREST
The authors have no conflict of interest to report.
DATA AVAILABILITY
Data are stored and may be available upon reasonable request complying with the current data sharing policy of NIH, available at https://grants.nih.gov/grants/guide/notice-files/NOT-OD-03-032.html. The data sets used in this study include personal information. Thus, datasets are available from the corresponding author, Dr. Somiranjan Ghosh, on reasonable requests.
SUPPLEMENTARY MATERIAL
[1] The supplementary material is available in the electronic version of this article: https://dx.doi.org/10.3233/ADR-230146.
REFERENCES
[1] | Marmolejo-Garza A , Medeiros-Furquim T , Rao R , Eggen BJL , Boddeke E , Dolga AM ((2022) ) Transcriptomic and epigenomic landscapes of Alzheimer’s disease evidence mitochondrial-related pathways. Biochim Biophys Acta Mol Cell Res 1869: , 119326. |
[2] | Zhang X , Fu Z , Meng L , He M , Zhang Z ((2018) ) The early events that initiate β-amyloid aggregation in Alzheimer’s disease. Front Aging Neurosci 10: , 359. |
[3] | Javaid SF , Giebel C , Khan MA , Hashim MJ ((2021) ) Epidemiology of Alzheimer’s disease and other dementias: Rising global burden and forecasted trends. F1000Res 10: , 425. |
[4] | Marciani DJ ((2017) ) Facing Alzheimer’s disease in developing countries. Rev Neuropsiquiatr 80: , 105–110. |
[5] | Adamson MM , Shakil S , Sultana T , Hasan MA , Mubarak F , Enam SA , Parvaz MA , Razi A ((2020) ) Brain injury and dementia in Pakistan: Current perspectives. Front Neurol 11: , 299. |
[6] | Ahmad A , Owais K , Siddiqui M , Mamun K , Rao F ((2013) ) Dementia in Pakistan: National guidelines for clinicians. Pak J Neurol Sci 8: , 17–27. |
[7] | Santini ZI , Koyanagi A , Tyrovolas S , Haro JM , Fiori KL , Uwakwa R , Thiyagarajan JA , Webber M , Prince M , Prina AM ((2015) ) Social network typologies and mortality risk among older people in China, India, and Latin America: A 10/66 Dementia research group population-based cohort study. Soc Sci Med 147: , 134–143. |
[8] | Hugo J , Ganguli M ((2014) ) Dementia and cognitive impairment: Epidemiology, diagnosis, and treatment. Clin Geriatr Med 30: , 421–442. |
[9] | Ausó E , Gómez-Vicente V , Esquiva G ((2020) ) Biomarkers for Alzheimer’s disease early diagnosis. J Pers Med 10: , 114. |
[10] | Ghosh S , Dutta S , Thorne G , Boston A , Barfield A , Banerjee N , Walker R , Banerjee HN ((2017) ) Core canonical pathways involved in developing human glioblastoma multiforme (GBM). Int J Sci Res Sci Eng Technol 3: , 458–465. |
[11] | Noreen Z , Loffredo CA , Bhatti A , Simhadri JJ , Nunlee-Bland G , Nnanabu T , John P , Khan JS , Ghosh S ((2020) ) Transcriptional profiling and biological pathway(s) analysis of type 2 diabetes mellitus in a Pakistani population. Int J Environ Res Public Health 17: , 5866. |
[12] | Mondal T , Loffredo CA , Trnovec T , Palkovicova Murinova L , Noreen Z , Nnanabu T , Conka K , Drobna B , Ghosh S ((2022) ) Gene expression signatures in PCB-exposed Slovak children in relation to their environmental exposures and socio-physical characteristics. Environ Sci Pollut Res Int 29: , 60531–60541. |
[13] | Mondal T , Loffredo CA , Simhadri J , Nunlee-Bland G , Korba B , Johnson J , Cotin S , Moses G , Quartey R , Howell CD , Noreen Z , Arif M , Ghosh S ((2023) ) Insights on the pathogenesis of type 2 diabetes as revealed by signature genomic classifiers in an African American population in the Washington, DC area. Diabetes Metab Res Rev 39: , e3589. |
[14] | Noreen Z , DeJesus J , Bhatti A , Loffredo CA , John P , Khan JS , Nunlee-Bland G , Ghosh S ((2018) ) Epidemiological investigation of type 2 diabetes and Alzheimer’s disease in a Pakistani population. Int J Environ Res Public Health 15: , 1582. |
[15] | Ghosh S , Loffredo CA , Mitra PS , rnovec T , Palkovicova Murinova L , Sovcikova E , Hoffman EP , Makambi KH , Dutta SK ((2018) ) PCB exposure and potential future cancer incidence in Slovak children: An assessment from molecular finger printing by Ingenuity Pathway Analysis (IPA®) derived from experimental and epidemiological investigations. Environ Sci Pollut Res Int 25: , 16493–16507. |
[16] | Noreen Z , Mondal T , Loffredo CA , Nunlee-Blnad G , Simhadri JJ , Johnson J , Cotin ST , Korba BE , Quartey R , Howell CD , Arif M , Bhatti A , Chandra V , Jana SS , Shahzad S , Ghosh S ((2023) ) Similarities in pathobiology of Alzheimer’s disease and type 2 diabetes mellitus: A proof of concept by a case study. Alzheimers Dement 19: (Suppl 1), e062039. |
[17] | Alzheimer’s Disease Diagnostic Guidelines, Available online: https://www.nia.nih.gov/health/alzheimers-disease-diagnostic-guidelines, accessed on 26 September 2022). |
[18] | Albert MS , DeKosky ST , Dickson D , Dubois B , Feldman HH , Fox NC , Gamst A , Holtzman DM , Jagust WJ , Petersen RC , Snyder PJ , Carrillo MC , Thies B , Phelps CH ((2011) ) The diagnosis of mild cognitive impairment due to Alzheimer’s disease: Recommendations from the National Institute on Aging-Alzheimer’s Association workgroups on diagnostic guidelines for Alzheimer’s disease. Alzheimers Dement 7: , 270–279. |
[19] | Larner AJ ((2018) ) Mini-Mental State Examination: Diagnostic test accuracy study in primary care referrals. Neurodegener Dis Manag 8: , 301–305. |
[20] | Cumming RC , Schubert D ((2005) ) Amyloid-beta induces disulfide bonding and aggregation of GAPDH in Alzheimer’s disease. FASEB J 19: , 2060–2062. |
[21] | Nakagawa K , Kitazume S , Oka R , Maruyama K , Saido TC , Sato Y , Endo T , Hashimoto Y ((2006) ) Sialylation enhances the secretion of neurotoxic amyloid-beta peptides. J Neurochem 96: , 924–933. |
[22] | Donahue JE , Flaherty SL , Johanson CE , Duncan JA 3rd , Silverberg GD , Miller MC , Tavares R , Yang W , Wu Q , Sabo E , Hovanesian V , Stopa EG ((2006) ) RAGE, LRP-1, and amyloid-beta protein in Alzheimer’s disease. Acta Neuropathol 112: , 405–415. |
[23] | Mrak RE , Griffin WS ((2005) ) Potential inflammatory biomarkers in Alzheimer’s disease. J Alzheimers Dis 8: , 369–375. |
[24] | Cai D , Zhong M , Wang R , Netzer WJ , Shields D , Zheng H , Sisodia SS , Foster DA , Gorelick FS , Xu H , Greengard P ((2006) ) Phospholipase D1 corrects impaired beta APP trafficking and neurite outgrowth in familial Alzheimer’s disease-linked presenilin-1 mutant neurons. Proc Natl Acad Sci U S A 103: , 1936–1940. |
[25] | Gan L , Ye S , Chu A , Anton K , Yi S , Vincent VA , von Schack D , Chin D , Murray J , Lohr S , Patthy L , Gonzalez-Zulueta M , Nikolich K , Urfer R ((2004) ) Identification of cathepsin B as a mediator of neuronal death induced by Abeta-activated microglial cells using a functional genomics approach. J Biol Chem 279: , 5565–5572. Erratum in J Biol Chem 2004 May 28;279(22):23845. |
[26] | Lee MS , Kwon YT , Li M , Peng J , Friedlander RM , Tsai LH ((2000) ) Neurotoxicity induces cleavage of p35 to p25 by calpain. Nature 405: , 360–364. |
[27] | Harris-White ME , Frautschy SA ((2005) ) Low density lipoprotein receptor-related proteins (LRPs), Alzheimer’s and cognition. Curr Drug Targets CNS Neurol Disord 4: , 469–480. |
[28] | Lappan R , Jirapanjawat T , Williamson DA , Lange S , Chown SL , Greening C ((2022) ) Simultaneous detection of multiple pathogens with the TaqMan Array Card. MethodsX 9: , 101707. |
[29] | Wu Z , Irizarry RA ((2004) ) Preprocessing of oligonucleotide array data. Nat Biotechnol 22: , 656–658. |
[30] | https://www.affymetrix.com/support/technical/technotes/hgu133_p2_technote.pdf last accessed 4/25/2023, date of last visit September 9, 2023. |
[31] | Ingenuity Pathway Analysis, QIAGEN Digital Insights. Bioinformatics Software and Services, QIAGEN Digital Insights. https://digitalinsights.qiagen.com/products-overview/discovery-insights-portfolio/analysis-and-visualization/qiagen-ipa/, Accessed on 26 April 2023. |
[32] | Gopurappilly R , Bhonde R ((2015) ) Transcriptional profiling and functional network analyses of islet-like clusters (ILCs) generated from pancreatic stem cells in vitro. Genomics 105: , 211–219. |
[33] | Mitra PS , Ghosh S , Zang S , Sonneborn D , Hertz-Picciotto I , Trnovec T , Palkovicova L , Sovcikova E , Ghimbovschi S , Hoffman EP , Dutta SK ((2012) ) Analysis of the toxicogenomic effects of exposure to persistent organic pollutants (POPs) in Slovakian girls: Correlations between gene expression and disease risk. Environ Int 39: , 188–199. |
[34] | Ge Y , Sealfon SC , Speed TP ((2009) ) Multiple testing and its applications to microarrays. Stat Methods Med Res 18: , 543–63. |
[35] | Cheng C , Pounds S ((2007) ) False discovery rate paradigms for statistical analyses of microarray gene expression data. Bioinformation 1: , 436–46. |
[36] | Giau V , Bagyinszky E , Yang YS , Youn YC , An SSA , Kim S ((2019) ) Genetic analyses of early-onset Alzheimer’s disease using next generation sequencing. Sci Rep 9: , 8368. |
[37] | Landlinger C , Oberleitner L , Gruber P , Noiges B , Yatsyk K , Santic R , Mandler M , Staffler G ((2015) ) Active immunization against complement factor C5a: A new therapeutic approach for Alzheimer’s disease. J Neuroinflammation 12: , 150. |
[38] | Wingo TS , Cutler DJ , Wingo AP , Le NA , Rabinovici GD , Miller BL , Lah JJ , Levey AI ((2019) ) Association of early-onset Alzheimer disease with elevated low-density lipoprotein cholesterol levels and rare genetic coding variants of APOB. JAMA Neurol 76: , 809–817. |
[39] | Basit A , Sabir S , Riaz M , Fawwad A , NDSP members ((2020) ) NDSP 05: Prevalence and pattern of dyslipidemia in urban and rural areas of Pakistan; a sub analysis from second National Diabetes Survey of Pakistan (NDSP) 2016-2017. J Diabetes Metab Disord 19: , 1215–1225. |
[40] | Zhang N , Ranson JM , Zheng ZJ , Hannon E , Zhou Z , Kong X , Llewellyn DJ , King DA , Huang J ((2021) ) Interaction between genetic predisposition, smoking, and dementia risk: A population-based cohort study. Sci Rep 11: , 12953. |
[41] | Toledo JB , Arnold SE , Raible K , Brettschneider J , Xie SX , Grossman M , Brettschneider J , Xie SX , Grossman M , Monsell SE , Kukull WA , Trojanowski JQ ((2013) ) Contribution of cerebrovascular disease in autopsy confirmed neurodegenerative disease cases in the National Alzheimer’s Coordinating Centre. Brain 136: , 2697–2706. |
[42] | Lennon MJ , Makkar SR , Crawford JD , Sachdev PS ((2019) ) Midlife hypertension and Alzheimer’s disease: A systematic review and meta-analysis. J Alzheimers Dis 71: , 307–316. |
[43] | Jeon SY , Byun MS , Yi D , Lee JH , Choe YM , Ko K , Sohn BK , Choi HJ , Lee JY , Lee DY ; KBASE Research Group ((2019) ) Influence of hypertension on brain amyloid deposition and Alzheimer’s disease signature neurodegeneration. Neurobiol Aging 75: , 62–70. |
[44] | Skoog I , Gustafson D ((2006) ) Update on hypertension and Alzheimer’s disease. Neurol Res 28: , 605–611. |
[45] | Sorimachi H , Hata S , Ono Y ((2011) ) Calpain chronicle–an enzyme family under multidisciplinary characterization. Proc Jpn Acad Ser B Phys Biol Sci 87: , 287–327. |
[46] | Kurbatskaya K , Phillips EC , Croft CL , Dentoni G , Hughes MM , Wade MA , Al-Sarraj S , Troakes C , O’Neill MJ , Perez-Nievas BG , Hanger DP , Noble W ((2016) ) Upregulation of calpain activity precedes tau phosphorylation and loss of synaptic proteins in Alzheimer’s disease brain. Acta Neuropathol Commun 4: , 34. |
[47] | Reddy PH , Tripathi R , Troung Q , Tirumala K , Reddy TP , Anekonda V , Shirendeb UP , Calkins MJ , Reddy AP , Mao P , Manczak M ((2012) ) Abnormal mitochondrial dynamics and synaptic degeneration as early events in Alzheimer’s disease: Implications to mitochondria-targeted antioxidant therapeutics. Biochim Biophys Acta 1822: , 639–649. |
[48] | Bates KA , Verdile G , Li QX , Ames D , Hudson P , Masters CL , Martins RN ((2009) ) Clearance mechanisms of Alzheimer’s amyloid-beta peptide: Implications for therapeutic design and diagnostic tests. Mol Psychiatry 14: , 469–486. Erratum in Mol Psychiatry. 2009 Dec;14(12):1144. |
[49] | Ge M , Zhang J , Chen S , Huang Y , Chen W , He L , Zhang Y ((2022) ) Role of calcium homeostasis in Alzheimer’s disease. Neuropsychiatr Dis Treat 18: , 487–498. |
[50] | Cruts M , Theuns J , Van Broeckhoven C ((2012) ) Locus-specific mutation databases for neurodegenerative brain diseases. Hum Mutat 33: , 1340–1344. |
[51] | Guo T , Zhang D , Zeng Y , Huang TY , Xu H , Zhao Y ((2020) ) Molecular and cellular mechanisms underlying the pathogenesis of Alzheimer’s disease. Mol Neurodegener 15: , 40. |
[52] | Deming Y , Li Z , Kapoor M , Harari O , Del-Aguila JL , Black K , Carrell D , Cai Y , Fernandez MV , Budde J , Ma S , Saef B , Howells B , Huang KL , Bertelsen S , Fagan AM , Holtzman DM , Morris JC , Kim S , Saykin AJ , De Jager PL , Albert M , Moghekar A , O’Brien R , Riemenschneider M , Petersen RC , Blennow K , Zetterberg H , Minthon L , Van Deerlin VM , Lee VM , Shaw LM , Trojanowski JQ , Schellenberg G , Haines JL , Mayeux R , Pericak-Vance MA , Farrer LA , Peskind ER , Li G , Di Narzo AF ; Alzheimer’s Disease Neuroimaging Initiative (ADNI); Alzheimer Disease Genetic Consortium (ADGC); Kauwe JS, Goate AM , Cruchaga C ((2017) ) Genome-wide association study identifies four novel loci associated with Alzheimer’s endophenotypes and disease modifiers. Acta Neuropathol 133: , 839–856. |
[53] | Caillet-Boudin ML , Buée L , Sergeant N , Lefebvre B ((2015) ) Regulation of human MAPT gene expression. Mol Neurodegener 10: , 28. |
[54] | Sun X , Chen WD , Wang YD ((2015) ) β-Amyloid: The key peptide in the pathogenesis of Alzheimer’s disease. Front Pharmacol 6: , 221. |
[55] | Maher A , El-Sayed NS , Breitinger HG , Gad MZ ((2014) ) Overexpression of NMDAR2B in an inflammatory model of Alzheimer’s disease: Modulation by NOS inhibitors. Brain Res Bull 109: , 109–16. |
[56] | Thakur S , Dhapola R , Sarma P , Medhi B , Reddy DH ((2023) ) Neuroinflammation in Alzheimer’s disease: Current progress in molecular signaling and therapeutics. Inflammation 46: , 1–17. |
[57] | Asiimwe N , Yeo SG , Kim MS , Jung J , Jeong NY ((2016) ) Nitric oxide: Exploring the contextual link with Alzheimer’s disease. Oxid Med Cell Longev 2016: , 7205747. |
[58] | Ou GY , Lin WW , Zhao WJ ((2021) ) Neuregulins in neurodegenerative diseases. Front Aging Neurosci 13: , 662474. |
[59] | Woo RS , Lee JH , Yu HN , Song DY , Baik TK ((2011) ) Expression of ErbB4 in the neurons of Alzheimer’s disease brain and APP/PS1 mice, a model of Alzheimer’s disease. Anat Cell Biol 44: , 116–127. |
[60] | Lee T , Lee H ((2021) ) Shared blood transcriptomic signatures between Alzheimer’s disease and diabetes mellitus. Biomedicines 9: , 34. |
[61] | Leandro GS , Evangelista AF , Lobo RR , Xavier DJ , Moriguti JC , Sakamoto-Hojo ET ((2018) ) . Changes in expression profiles revealed by transcriptomic analysis in peripheral blood mononuclear cells of Alzheimer’s disease patients. J Alzheimers Dis 66: , 1483–1495. |


