
MitoH3: Mitochondrial Haplogroup and Homoplasmic/Heteroplasmic Variant Calling Pipeline for Alzheimer’s Disease Sequencing Project
Abstract
Background:
Mitochondrial DNA (mtDNA) is a double-stranded circular DNA and has multiple copies in each cell. Excess heteroplasmy, the coexistence of distinct variants in copies of mtDNA within a cell, may lead to mitochondrial impairments. Accurate determination of heteroplasmy in whole-genome sequencing (WGS) data has posed a significant challenge because mitochondria carrying heteroplasmic variants cannot be distinguished during library preparation. Moreover, sequencing errors, contamination, and nuclear mtDNA segments can reduce the accuracy of heteroplasmic variant calling.
Objective:
To efficiently and accurately call mtDNA homoplasmic and heteroplasmic variants from the large-scale WGS data generated from the Alzheimer’s Disease Sequencing Project (ADSP), and test their association with Alzheimer’s disease (AD).
Methods:
In this study, we present MitoH3—a comprehensive computational pipeline for calling mtDNA homoplasmic and heteroplasmic variants and inferring haplogroups in the ADSP WGS data. We first applied MitoH3 to 45 technical replicates from 6 subjects to define a threshold for detecting heteroplasmic variants. Then using the threshold of 5% ≤variant allele fraction≤95%, we further applied MitoH3 to call heteroplasmic variants from a total of 16,113 DNA samples with 6,742 samples from cognitively normal controls and 6,183 from AD cases.
Results:
This pipeline is available through the Singularity container engine. For 4,311 heteroplasmic variants identified from 16,113 samples, no significant variant count difference was observed between AD cases and controls.
Conclusions:
Our streamlined pipeline, MitoH3, enables computationally efficient and accurate analysis of a large number of samples.
INTRODUCTION
Mitochondria are intracellular organelles and have multiple functions beyond oxidative phosphorylation which generate energy for cells. They also play important roles in multiple cell metabolism, signaling, etc. Mitochondrial (MT) biology contributes to complex cellular and organismal processes [1]. Mitochondrial impairments increase with age and are correlated with several age-related diseases including Alzheimer’s disease (AD) [2]. Mitochondrial DNA (mtDNA) is a double-stranded circular DNA with 16,569 bases. Mitochondrial genes primarily encode proteins required for oxidative phosphorylation. Hundreds of mtDNA mutations have been associated with clinical phenotypes, including multiple neurodegenerative diseases [3]. Unlike nuclear DNA which typically has two copies, mtDNA can have multiple copies in each cell. The number of copies of mtDNA within each cell ranges from a few hundred in blood cells to several thousand in neurons or muscle cells, thus the mtDNA variants have different status, homoplasmy or heteroplasmy. Besides the copy number difference, mtDNA’s mutation rate is higher than nuclear DNA due to a relative lack of DNA-protective histones and efficient DNA repair mechanisms [4], it is also reported that AD brains had an average 63% increase in heteroplasmic/somatic mtDNA control-region mutations [5].
Furthermore, mtDNA’s circular morphology has introduced an artificial breakpoint on the MT reference sequence. Reads that should align around the breakpoint may be discarded when aligned to the linear reference sequence, which may cause variant detection failure, especially in the control region. In addition, nuclear mtDNA segments (NuMTs) can introduce variant calling errors due to the sequence similarity to mtDNA. Accurate identification of NuMT reads and heteroplasmic variants is still challenging in mtDNA studies. Sample contamination is a major issue in both nuclear DNA and mtDNA studies, and external or cross-contamination may also introduce false heteroplasmic calls [6, 7]. VerifyBamID [8] is commonly used to detect contamination levels in nuclear DNA, while haplocheck [9] identifies contamination based on the coexistence of mitochondrial haplogroup incompatibility, using the mitochondrial phylogeny and the concept of haplogroups.
Accurate calling of mtDNA variants is essential for the analysis of their association with disease and a separate variant calling workflow from nuclear DNA is necessary. There are multiple tools designed for mtDNA variants calling. MToolBox [10] realigns reads that have been mapped to mtDNA onto the nuclear genome to discard NuMTs. mtDNA-Server is a web-based server using Mutserve for variant calling, and it performs a contamination check based on a phylogenic tree of mtDNA variation [11]. MitoHPC performs the second iteration of variant identification using a sample’s unique mtDNA sequence as the reference [12] and it also claims that GATK Mutect2 outperforms Mutserve. We recently developed a pipeline for calling mtDNA homoplasmic single nucleotide variants (SNVs) and MT haplogroups in whole-exome sequencing (WES) data obtained from nearly 11,000 subjects in the Alzheimer’s Disease Sequencing Project (ADSP) Discovery Phase cohort with a degree of accuracy comparable to genotypes called from whole genome sequence (WGS) data [13]. However, it is challenging to identify mtDNA heteroplasmic variants and to estimate MT copy numbers from WES data. Indeed, because WGS data are rapidly emerging from large studies including the ADSP, there is an urgent need to streamline the computational pipeline for the accurate and efficient calling of mtDNA SNVs.
Here, we present a pipeline for calling mtDNA homoplasmic and heteroplasmic variants, and MT haplogroups from WGS data obtained from approximately 17,000 participants of the ADSP extension and FUS1.0 cohort (Release 3 dataset, https://adsp.niagads.org/data/data-summary/). This pipeline, named MitoH3 (Mitochondria DNA Haplogroup, Homoplasmic and Heteroplasmic variants calling pipeline) can be applied to WGS data obtained from as many as several hundred thousand subjects. The pipeline integrates the GATK Best Practices Mitochondrial Analysis pipeline [14] and haplocheck [9] which are used for mtDNA variant calling, quality control, and contamination level estimation.
METHODS
Pipeline development
The MitoH3 pipeline has two main steps. First, it generates an individual-level VCF file that includes variants flagged with filters that they failed to pass. Next, it retrieves variants that pass all the filters and uses them to infer haplogroup and call heteroplasmic and homoplasmic variants. Details of each step are described below.
Variant calling
The pipeline code was written in WDL, a user-friendly scripting language maintained by the OpenWDL community and executed by Cromwell which is an open-source workflow execution engine that supports WDL and accepts as input a CRAM formatted file that contains information of WGS sequence alignment against the human reference genome. There are multiple processing steps including several implemented in the GATK mitochondria pipeline. First, mtDNA paired-end reads (chrM) were retrieved, and then reads with an unmapped mate or mapped to other contigs were excluded. The remaining chrM reads were mapped to two mtDNA reference sequences, namely the human-revised Cambridge Reference Sequence (rCRS) and a version of the rCRS that is shifted by 8,000 base pairs called shifted-rCRS. The use of the shifted-rCRS enhances the quality of variant calling in the control/D-loop region that contains the artificial break of the circular genome. Next, GATK Mutect2 was implemented to detect variants from both realigned mtDNA reads. Variants called from shifted-rCRS were assigned their original coordinates and merged with variants called from rCRS. Finally, multiple GATK [15] filtering protocols were used to flag problematic variants including FilterMutectCalls for strand bias and base quality, NuMTFilterTool for possible nuclear mtDNA segments variants based on median autosomal coverage, MTLowHeteroplasmyFilterTool for low heteroplasmy if the total low heteroplasmy exceeds the default threshold of 3, and VariantFiltration for excluding sites that likely contain unwanted artifacts. The resultant VCF file contained depths for the reference and alternative alleles which is essential information for homoplasmic and heteroplasmic variant calling. Variants that passed all filters were retained for subsequent analysis.
Haplogroup inference and heteroplasmic and homoplasmic variant calling
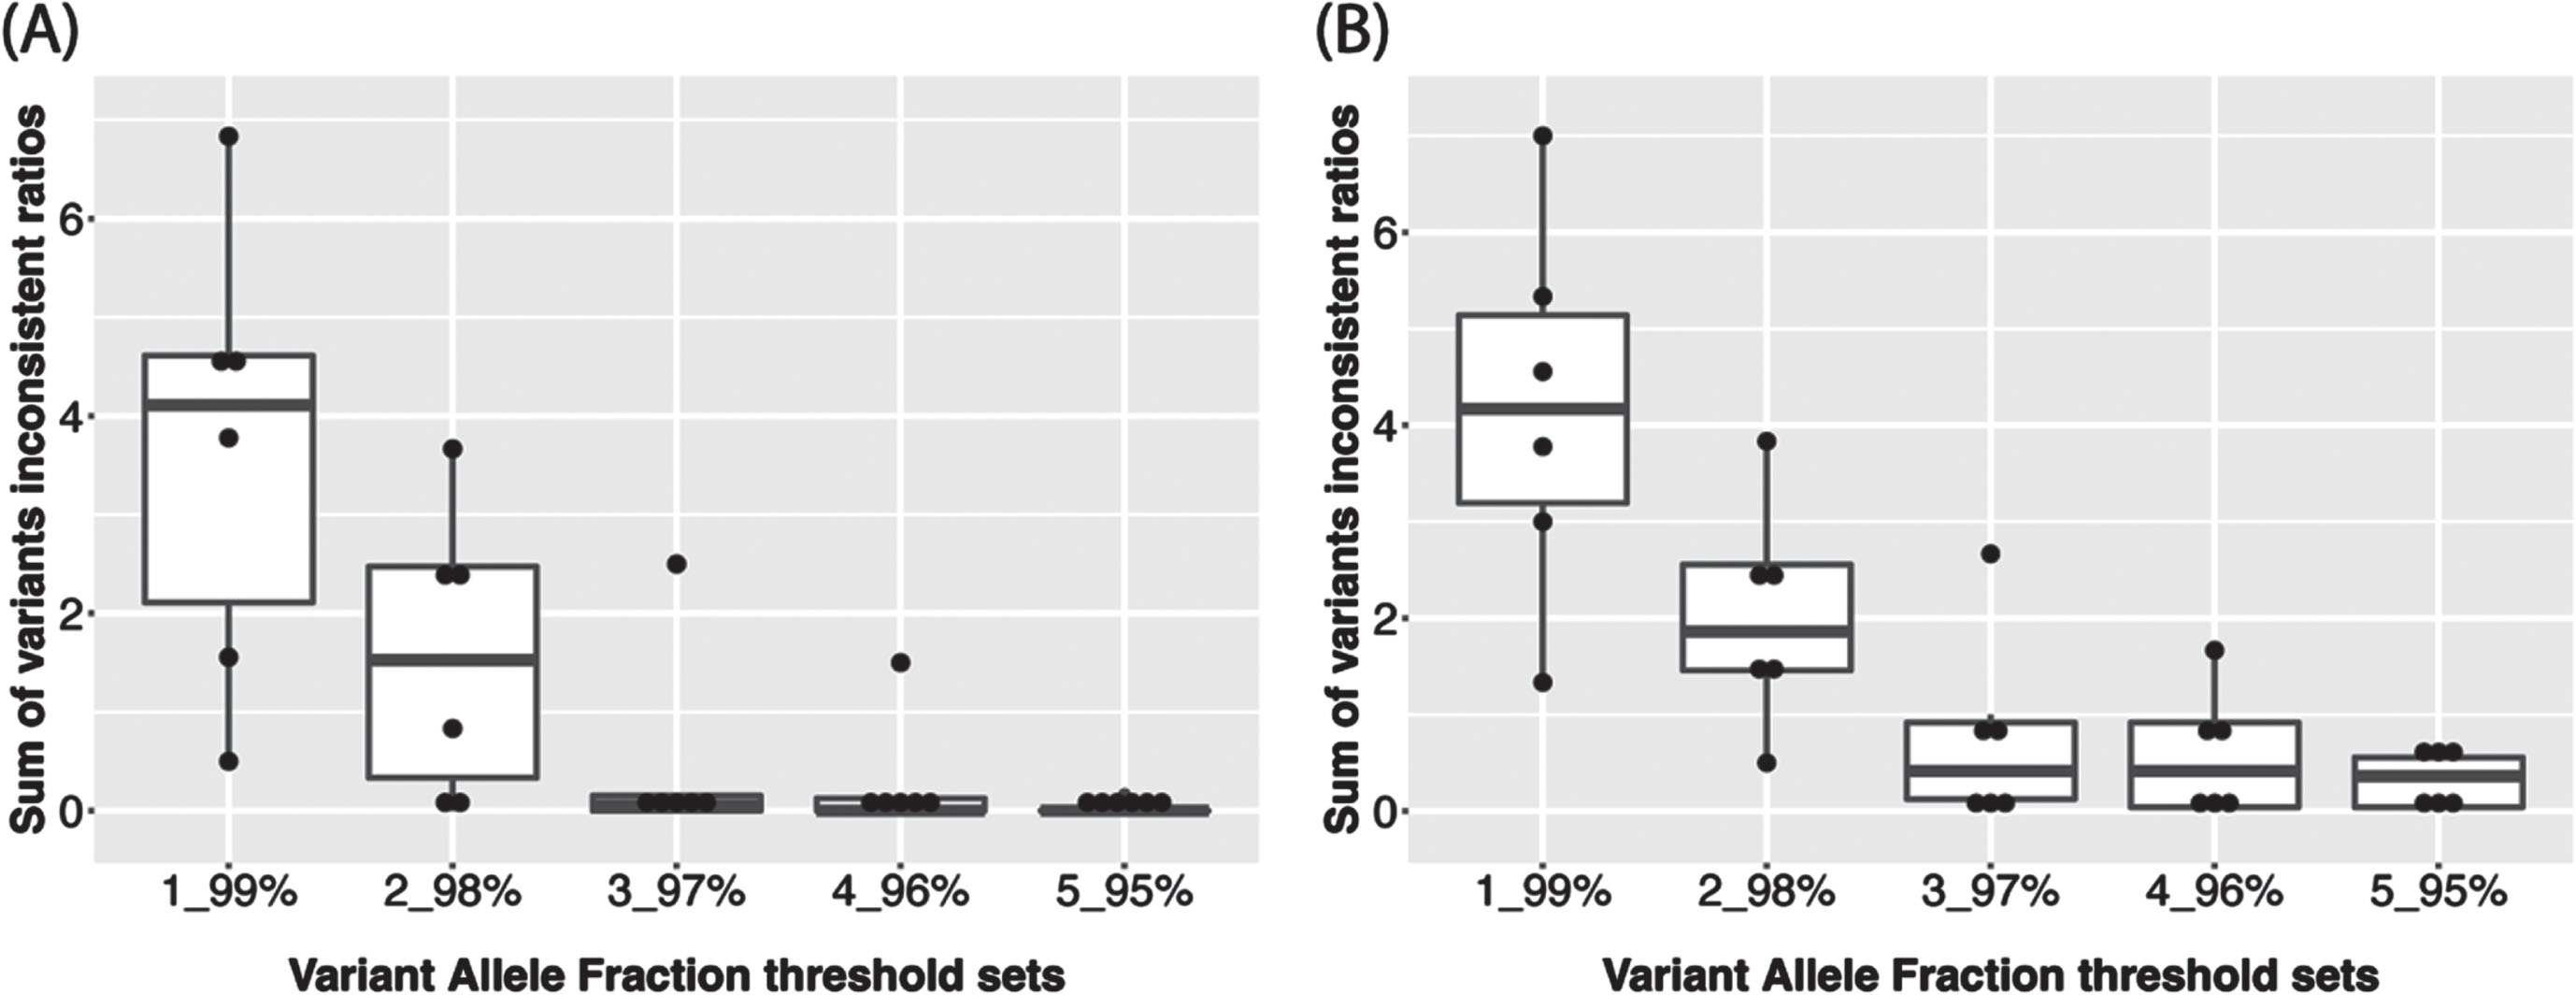
The haplocheck tool was employed to infer haplogroup and estimate the contamination status for each sample using all variants. Next, we separated the variants into homoplasmic and heteroplasmic groups. The variant allele fraction (VAF) was calculated as the proportion of alternate reads to total reads for one site [14] and was used to group the variants into homoplasmic or heteroplasmic. For example, we can define a site to be homoplasmic for the rCRS reference allele if its VAF < 3% and a site to be homoplasmic for alternative allele if its VAF > 97%. A site is defined as heteroplasmic if its VAF is between 3% and 97%, which is referred as “3_97% ” for simplicity. We tested a series of thresholds from “1_99% ” to “5_95% ” to find an optimal VAF cutoff. To make the results comparable, under each VAF cutoff and within each set of technical replicates of same subject, we calculated the ratio of the number of replicates who has the variant to total number of replicates for each variant, if the ratio is larger than 0.5, it will be replaced by 1-ratio. This ratio is regarded as the inconsistent ratio for the variant of one subject. After calculating the sum of inconsistent ratio for each subject, we found that a VAF threshold of “5_95% ” had the lowest overall inconsistent ratio (Fig. 1 and Supplementary Table 1) and therefore was used for calling homoplasmic and heteroplasmic variants across all subjects in the ADSP 17k WGS data. Therefore, variants with VAF > 95% will be homoplasmic for the alternative allele while 5% ≤VAF≤95% will be denoted as heteroplasmic. Of note, “5_95% ” is the same VAF threshold applied in a recent analysis of the TOPMed WGS data [16]. Individual-level VCFs were merged to create a project-level VCF file for homoplasmic and heteroplasmic variants, respectively.
Fig. 1
Sum of inconsistent ratios of (A) Homoplasmic calls and (B) Heteroplasmic calls among technical replicates of each subject (n = 6) according to 5 different VAF thresholds.
Datasets
WGS data were obtained from the ADSP which is an NIH-funded initiative to identify novel genes and rare genetic factors associated with AD risk in a large sample of AD cases and cognitively normal controls from multiple ancestry populations. Details of subject ascertainment and classification, library preparation, and sequencing protocols were described previously [17]. We applied the MitoH3 pipeline to WGS data included in the ADSP Release 3 dataset that was generated from 16,930 individuals. After excluding 239 samples that lacked phenotypic information, 168 samples showing apparent contamination based on haplocheck results, 88 samples having low average coverage or a high ratio of singletons (e.g., borderline samples), 277 duplicate samples detected by IBD analysis using the GENESIS [18], and 45 technical replicate samples included as part of the original ADSP design, 16,113 subjects remained for further analysis. This sample included 2,954 largely African American Descent (AA), 3,345 genetically admixed Caribbean Hispanics (CH), and 9,814 individuals of largely European ancestry (EA) whose ancestry group assignments were determined by principal component (PC) analysis using Gaussian Mixture Models from scikit-learn [19]. Among the 16,113 DNA samples, 12,226 were extracted from blood and 2,314 from brain, few from cell line, saliva or with unknown information. There are 6,742 samples from cognitively normal controls and 6,183 from AD cases, and the remaining 3,188 samples had an unknown disease status.
RESULTS
Determination of an optimal VAF threshold for calling homoplasmic and heteroplasmic variants
The determination of plasmy status for a particular MT variant requires a choice of VAF threshold. Because there is no established VAF threshold in the literature, we leveraged technical replicate WGS data from ADSP samples in the ADSP WGS data to discern an optimal VAF threshold. There are 45 technical replicates from six unique subjects among the ADSP samples. Three of these subjects (1–3) have nine technical replicates and the other three subjects (4–6) have six technical replicates (Table 1). The VAF threshold does not affect haplogroup inference since all the variants were evaluated by haplocheck. Haplogroup calling for the technical replicates was perfectly consistent (Table 2). However, the consistency of plasmy progressively improved with percentage increases in the VAF threshold (Fig. 1 and Supplementary Table 1). MitoH3 called the same number of homoplasmic variants in replicates for all subjects except for Subject 4 which had one technical replicate with 37 homoplasmic variants and five technical replicates with 38 homoplasmic variants (Table 3). As shown in Table 4, the same number of heteroplasmic variants were called for all technical replicates for subjects #3 and #6 (i.e., concordance rate = 100%). Heteroplasmic variant concordance rates were lower for the other subjects ranging from 44.4% to 83.3%. Based on the results from the 45 technical replicates, we chose a VAF threshold of 5_95% for classifying variant genotypes as homoplasmic or heteroplasmic in the remaining sample of 16,113 subjects.
Table 1
Characteristics of the 6 sets of technical replicates of 45 samples
| Subject | 1 | 2 | 3 | 4 | 5 | 6 | |
| Sex | Female | Female | Female | Female | Female | Female | |
| Age | 89 | 63 | 70 | 83 | 53 | 70 | |
| Mother | NA | Subject1 | Subject1 | NA | NA | NA | |
| Ethnicity | CH | CH | CH | CH | EA | AA | |
| # of technical replicates | 9 | 9 | 9 | 6 | 6 | 6 | |
| Sample source | Blood | Blood | Blood | Blood | Blood | Brain | |
| Sequencing | Illumina HiSeq 2000 | 3 | 3 | 3 | 0 | 0 | 0 |
| platform | Illumina HiSeqX | 6 | 6 | 6 | 6 | 6 | 6 |
| Sequencing Center | Baylor | 3 | 3 | 3 | 2 | 2 | 2 |
| Broad | 3 | 3 | 3 | 2 | 2 | 2 | |
| WashU | 3 | 3 | 3 | 2 | 2 | 2 | |
| Read length | 101 bp | 3 | 3 | 3 | 0 | 0 | 0 |
| 150 bp | 6 | 6 | 6 | 6 | 6 | 6 | |
| PCR | Free | 6 | 6 | 6 | 6 | 6 | 6 |
| Amplified | 3 | 3 | 3 | 0 | 0 | 0 |
CH, genetically admixed Caribbean Hispanic; EA, largely European ancestry; AA, largely African American Descent; WashU, University of Washing; PCR, polymerase chain reaction.
Table 2
Summary of mitochondrial haplogroup for 6 subjects with 45 technical replicates
| Mitochondrial Haplogroup | ||||
| I1a1e | L0a1a2 | L3b1a | L3b2 | |
| Subject 1 | 0 | 0 | 9 | 0 |
| Subject 2 | 0 | 0 | 9 | 0 |
| Subject 3 | 0 | 0 | 9 | 0 |
| Subject 4 | 0 | 0 | 0 | 6 |
| Subject 5 | 6 | 0 | 0 | 0 |
| Subject 6 | 0 | 6 | 0 | 0 |
Subject 1 is the mother of subject 2 and subject 3 who share the same haplogroup
Table 3
Summary of mitochondrial homoplasmic variants for 6 subjects with 45 technical replicates at the non-reference variant allele fraction (VAF) threshold > 95%
| Number of homoplasmic variants | ||||
| 37 | 38 | 42 | 80 | |
| Subject 1 | 9 | 0 | 0 | 0 |
| Subject 2 | 9 | 0 | 0 | 0 |
| Subject 3 | 9 | 0 | 0 | 0 |
| Subject 4 | 1 | 5 | 0 | 0 |
| Subject 5 | 0 | 0 | 6 | 0 |
| Subject 6 | 0 | 0 | 0 | 6 |
Table 4
Comparison of mitochondrial heteroplasmic variants for 6 subjects with 45 technical replicates at the 5% ≤VAF≤95%
| Number of heteroplasmic variants | Concordant | ||||||
| 0 | 1 | 2 | 3 | 4 | 5 | (Percent) | |
| Subject 1 | 1 | 4 | 4 | 0 | 0 | 0 | 44.4% (4/9) |
| Subject 2 | 0 | 6 | 3 | 0 | 0 | 0 | 66.7% (6/9) |
| Subject 3 | 9 | 0 | 0 | 0 | 0 | 0 | 100.0% (9/9) |
| Subject 4 | 0 | 5 | 1 | 0 | 0 | 0 | 83.3% (5/6) |
| Subject 5 | 0 | 0 | 0 | 3 | 2 | 1 | 50.0% (3/6) |
| Subject 6 | 0 | 6 | 0 | 0 | 0 | 0 | 100.0% (6/6) |
VAF, variant allele fraction.
Application of the pipeline using a 5_95% VAF threshold
Haplogroups
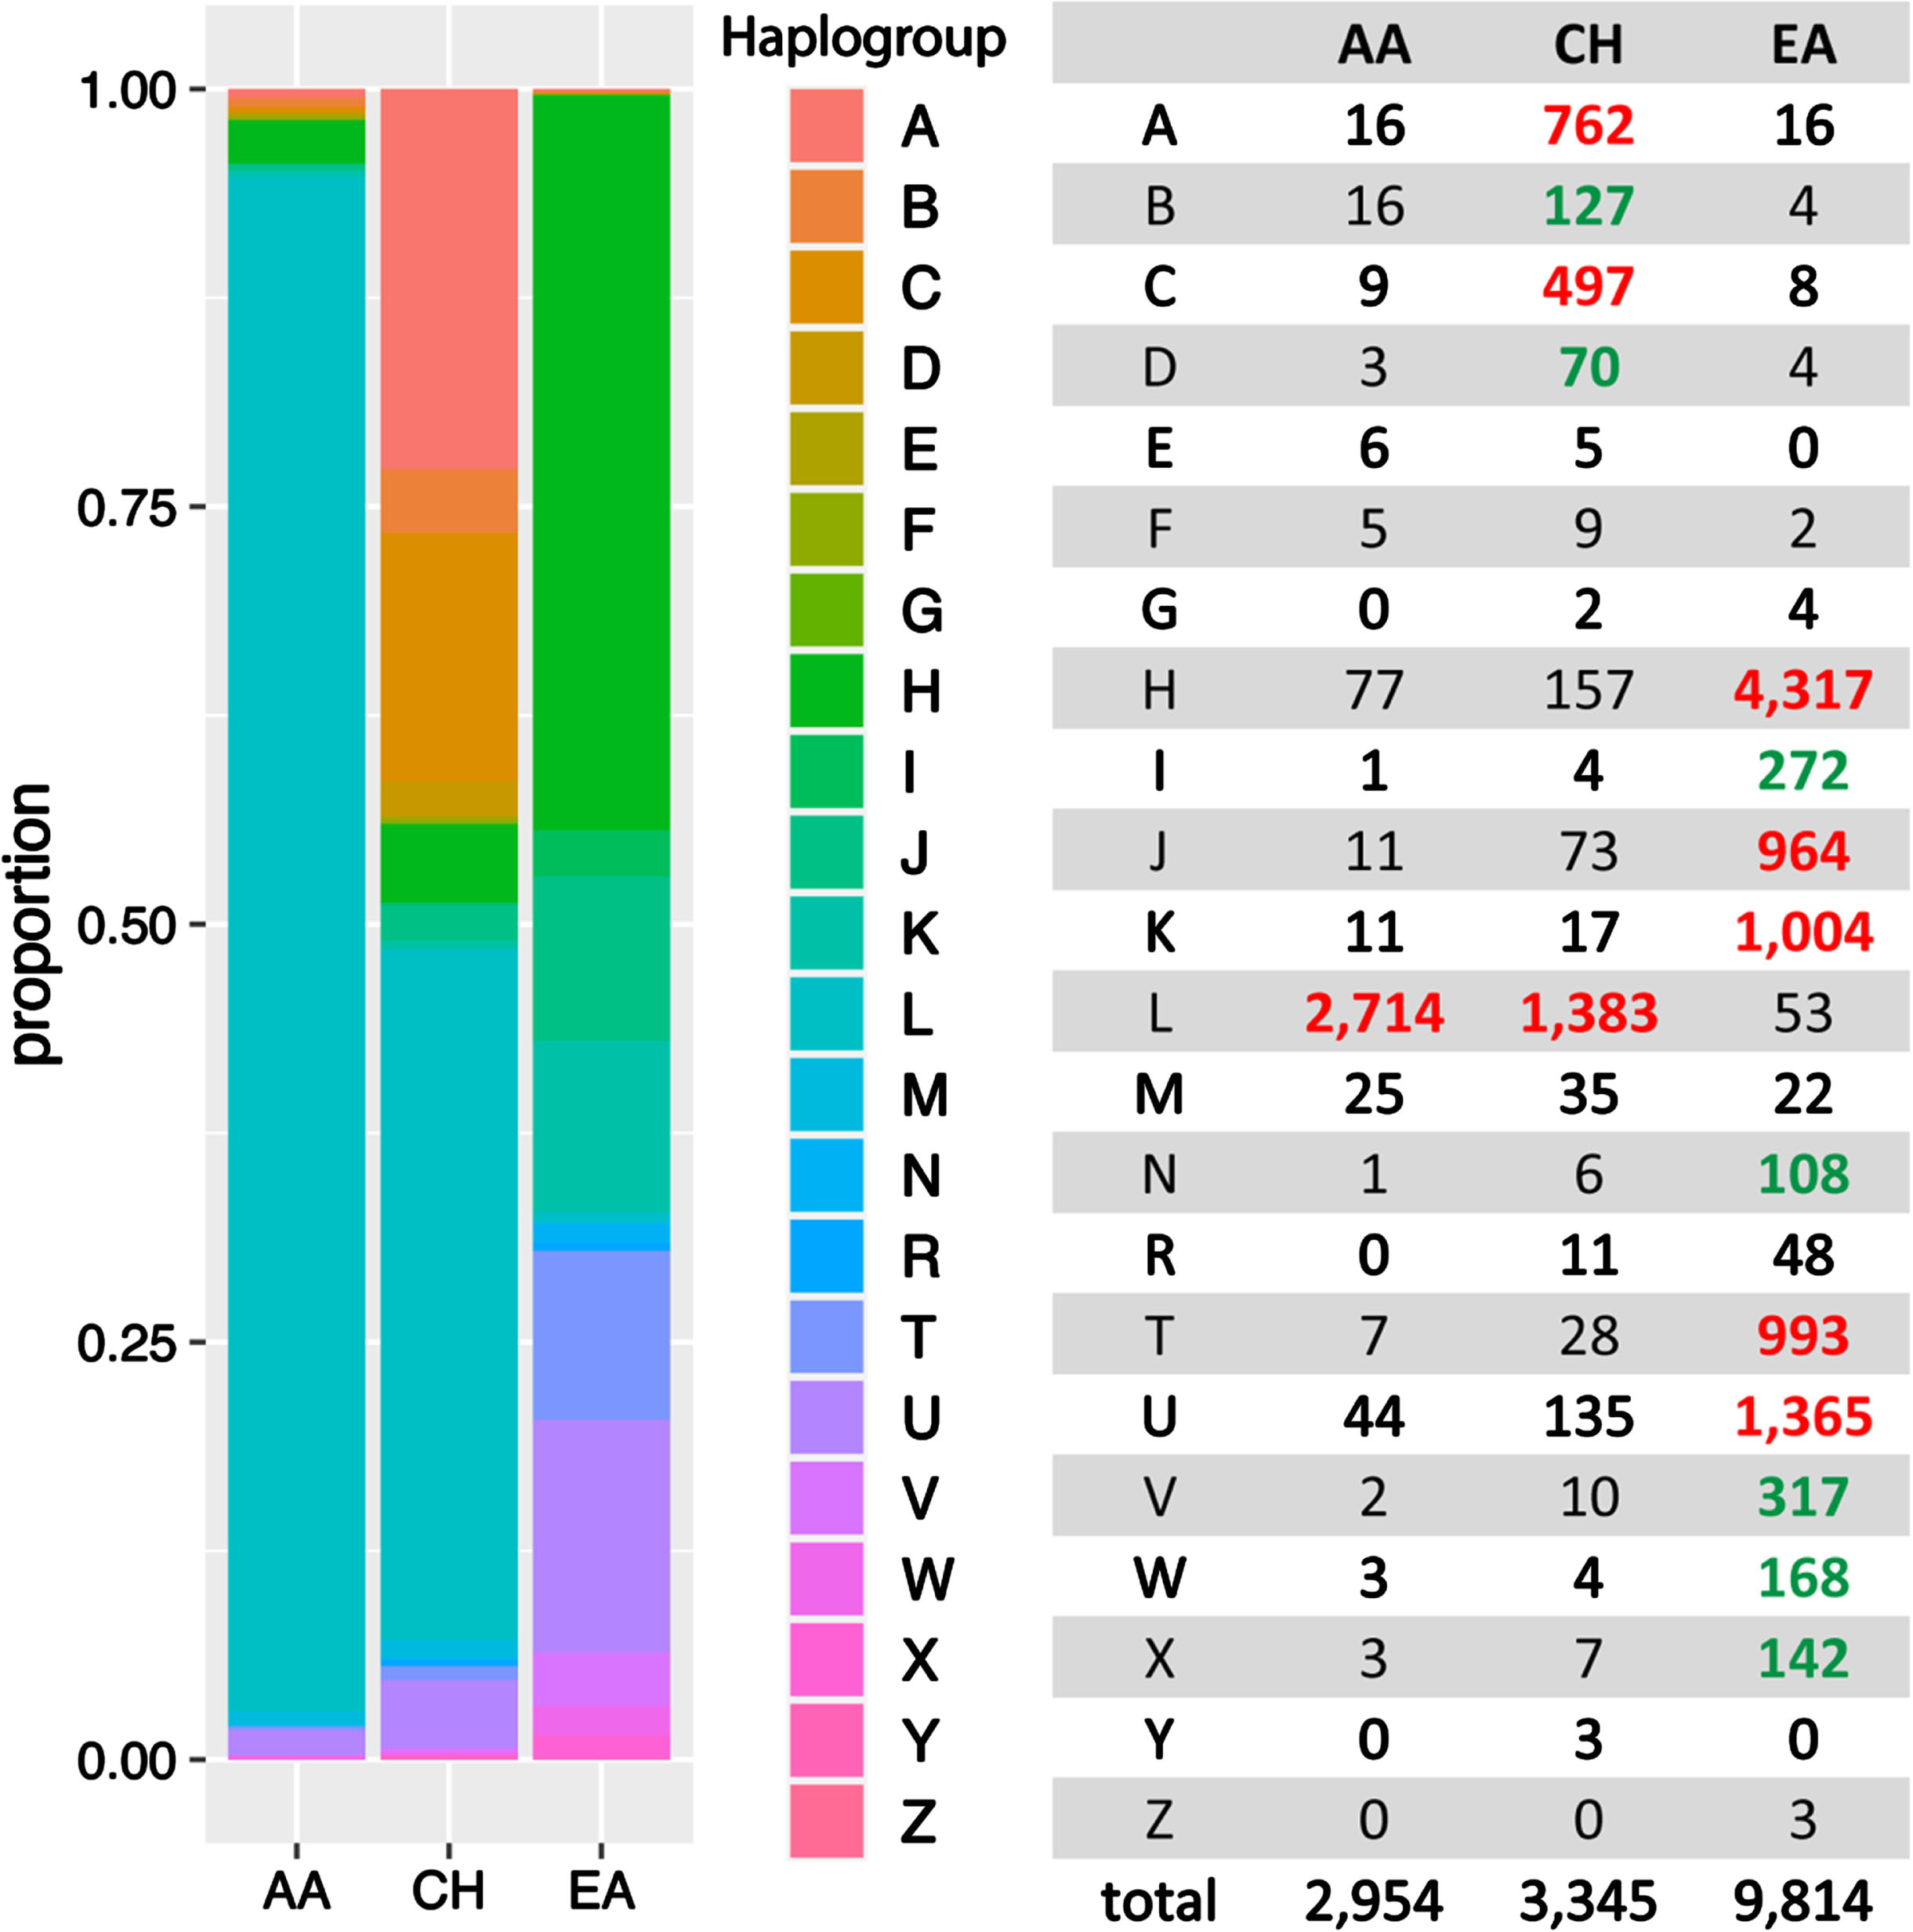
Twenty-two known human mitochondrial haplogroups were assigned to each of the 16,113 subjects who were grouped by ancestry (AA, EA, and CH) as determined by PC analysis of nuclear genome variants. As shown in Fig. 2, each group is uniquely characterized by the haplogroup distribution, which is consistent with findings from a previous study [20]. For example, haplogroups A, B, C, and D are much more abundant in the CH group. Haplogroups H, J, K, T and U are more frequent in the EA group, whereas Haplogroup L was observed primarily in the AA (91.9%) and CH (41.3%) groups.
Fig. 2
MT haplogroup distribution in African American (AA), Caribbean Hispanic (CH), and European ancestry (EA) cohorts. Bolded numbers indicate that the haplogroup is more predominant in the particular ancestry group compared to other groups. Red-highlighted numbers signify that the haplogroup constitutes more than 5% within the ancestry, while green-highlighted numbers indicate that the haplogroup comprises less than 5%, yet the frequency is 5-fold greater than in other ancestral groups at least.
Distribution of homoplasmic and heteroplasmic calls and variants
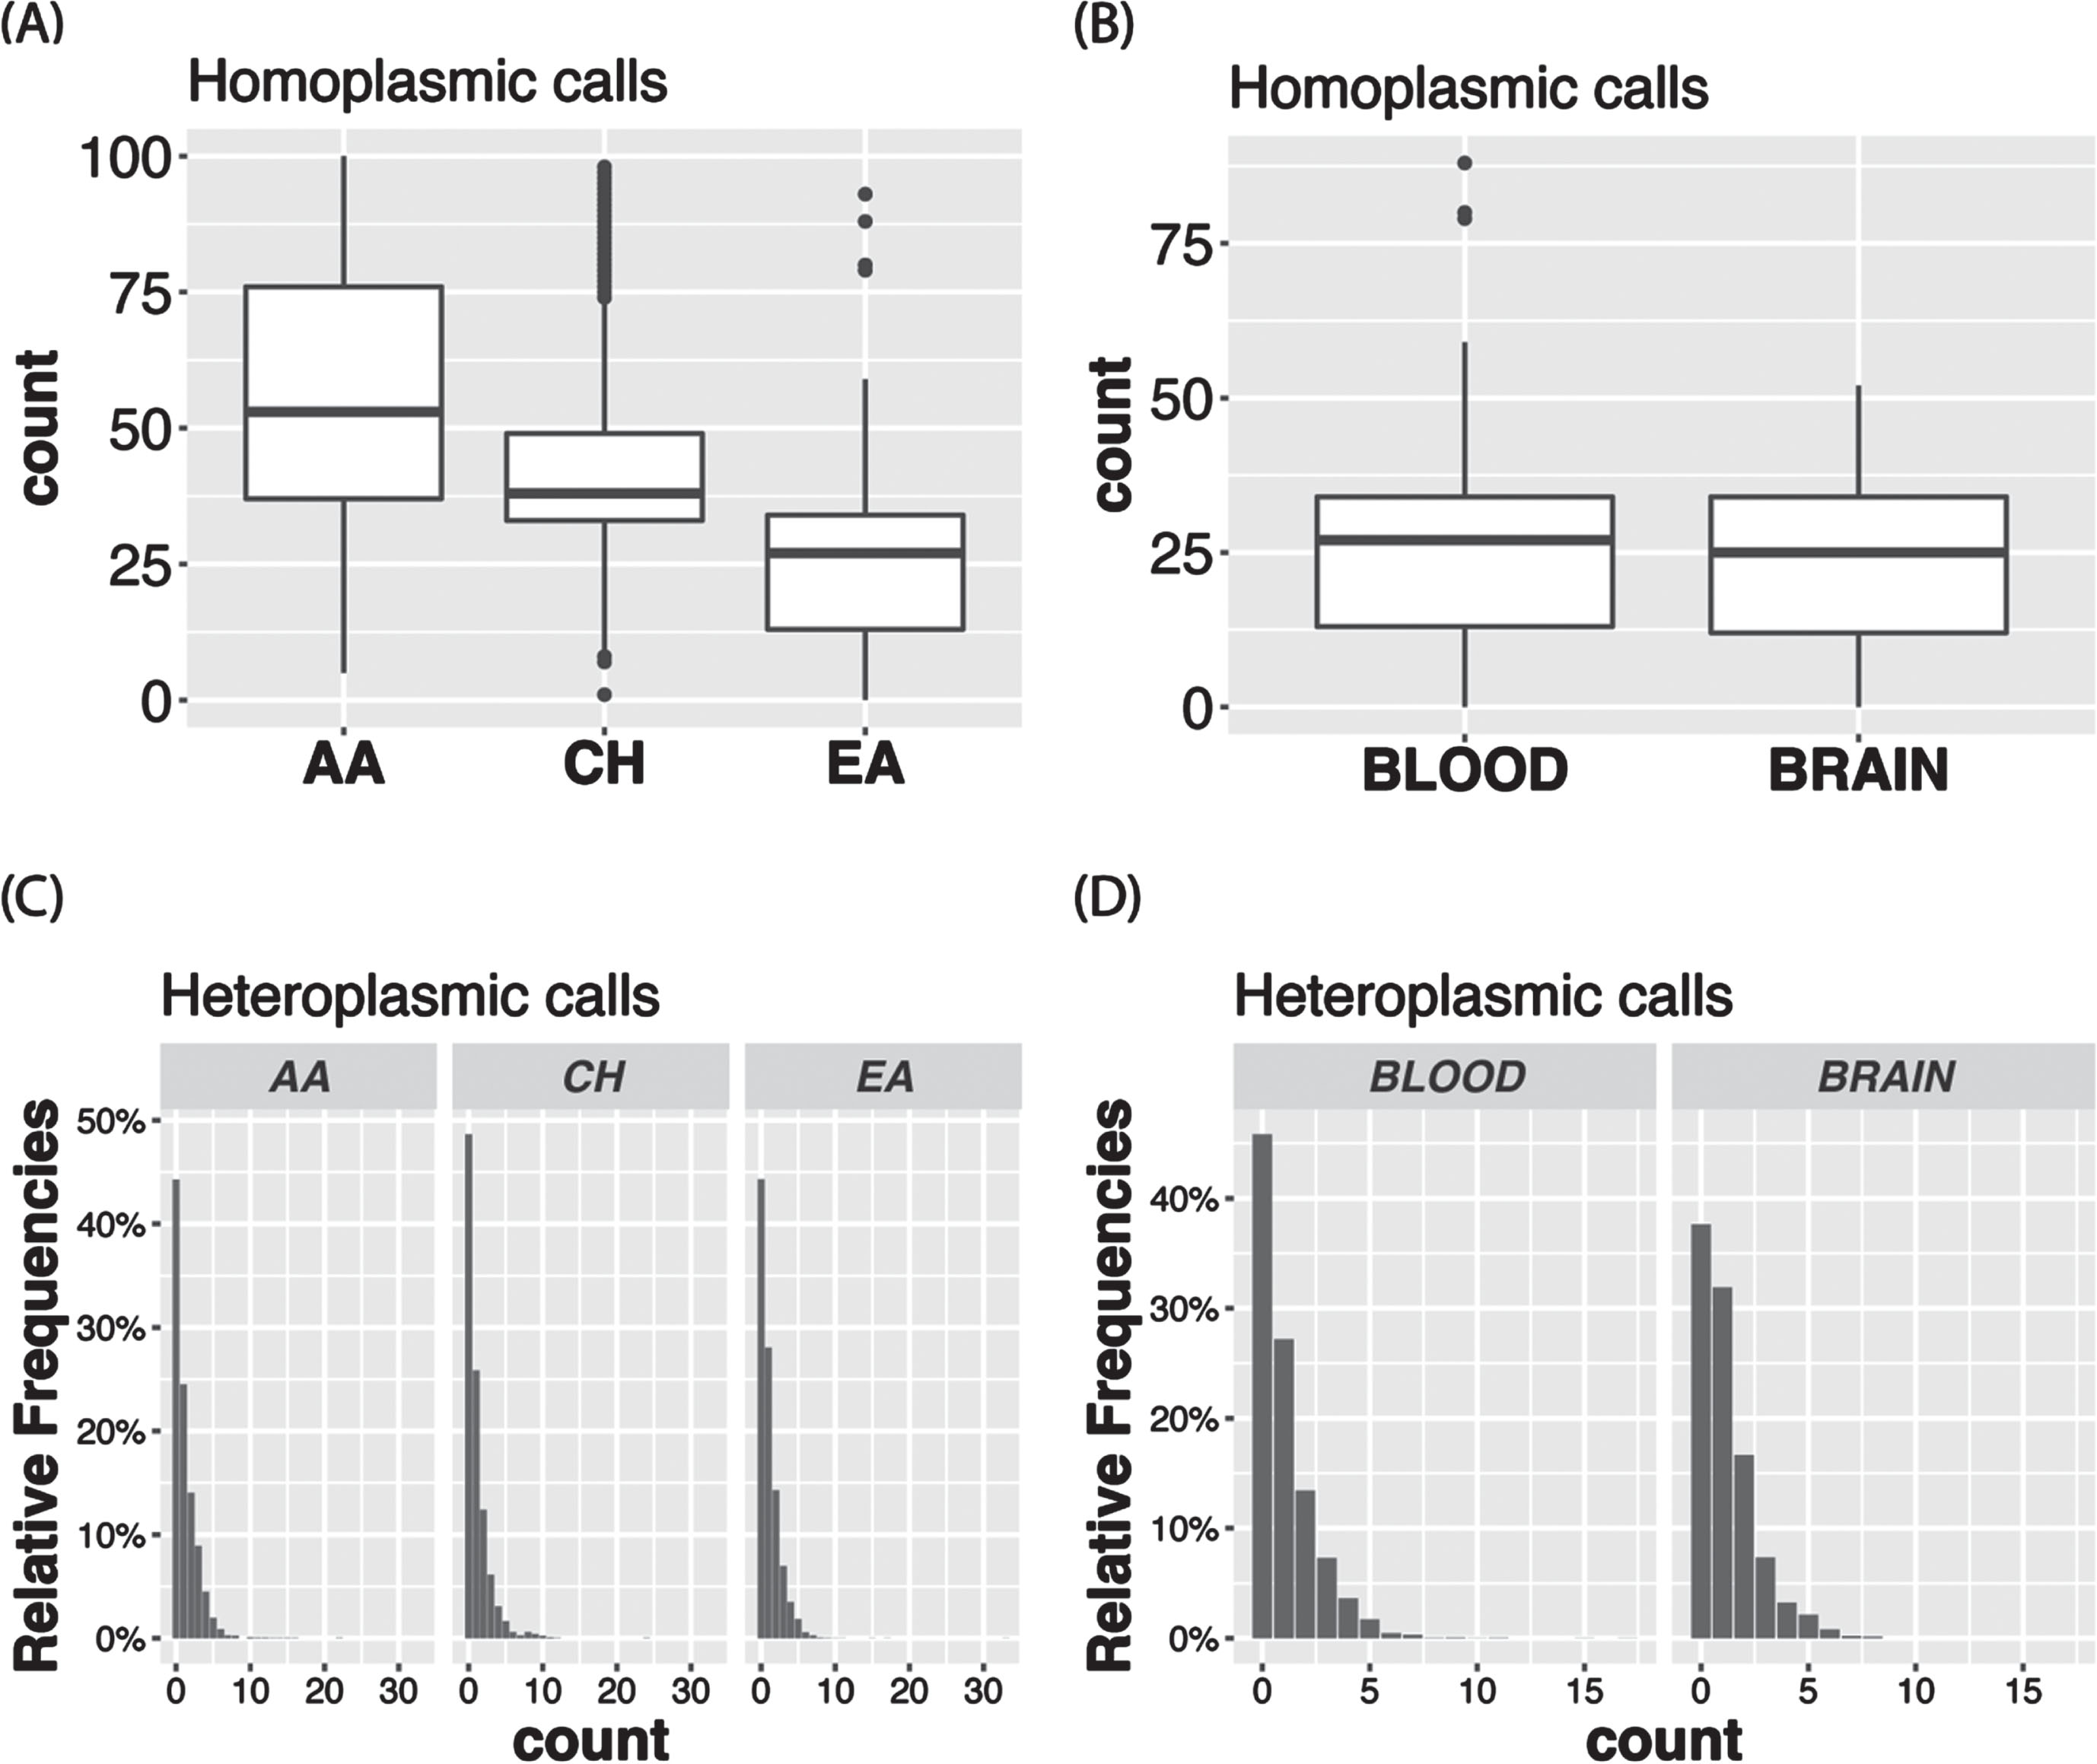
The VAF distribution of all the calls in the total sample (Fig. 3A) as well as in each ancestry group (Supplementary Figure 1A) is bimodal with a higher proportion of homoplasmic calls in the tails of the distribution. In the total sample, 96.8% of the calls were homoplasmic (Fig. 3B), but the proportion is slightly higher in AAs than in the other ancestry groups (Supplementary Figure 1B). Although in the total sample the proportions of unique variants that were observed only as heteroplasmic or both homoplasmic and heteroplasmic were roughly equal (24.2% vs. 27.8%) and about one-half of the 8,286 unique variants were only called as homoplastic (48.0%) (Fig. 4A), the proportion of variants that were homoplasmic only was highest in the AA group (68.6% each) and lowest in the EA group (53.0%), noting that the number of unique variants observed in each ancestry group is proportional to the sample size (Supplementary Figure 2A). Most unique variants are rare (MAF < 1%, Fig. 4B). Not surprisingly, the proportion of uniquely homoplasmic or heteroplasmic variants decreases as a function of the VAF in the total sample (Fig. 4C) and within the EA and CH groups (Supplementary Figure 2C). The mean number of homoplasmic variants among individuals significantly differed by ancestry group (AA = 54.9±21.0, CH = 44.1±18.8, EA = 23.5±11.2; p < 2×10- 16) (Fig. 5A) and was slightly greater in EA samples derived from blood (23.7±11.3) compared to brain (23.0±11.0) (Fig. 5B). The mean of number of heteroplasmic calls in AA individuals (1.21) was significantly greater than in CH individuals (1.08) and EA (1.08) individuals (ANOVA test p = 5.61×10- 5, Fig. 5C). The difference between blood and brain in EA samples is also significant (t test p-value = 0.0003, mean of blood sample = 1.06, mean of brain sample = 1.18, Fig. 5D). However, no significant difference of homoplasmic or heteroplasmic variant count was found in AD cases and controls within each ethnic group or within the sample source.
Fig. 3
Among individuals in the total sample, (A) variant allele fraction (VAF) distribution of mtDNA variant calls and (B) proportion of heteroplasmic calls and homoplasmic calls.
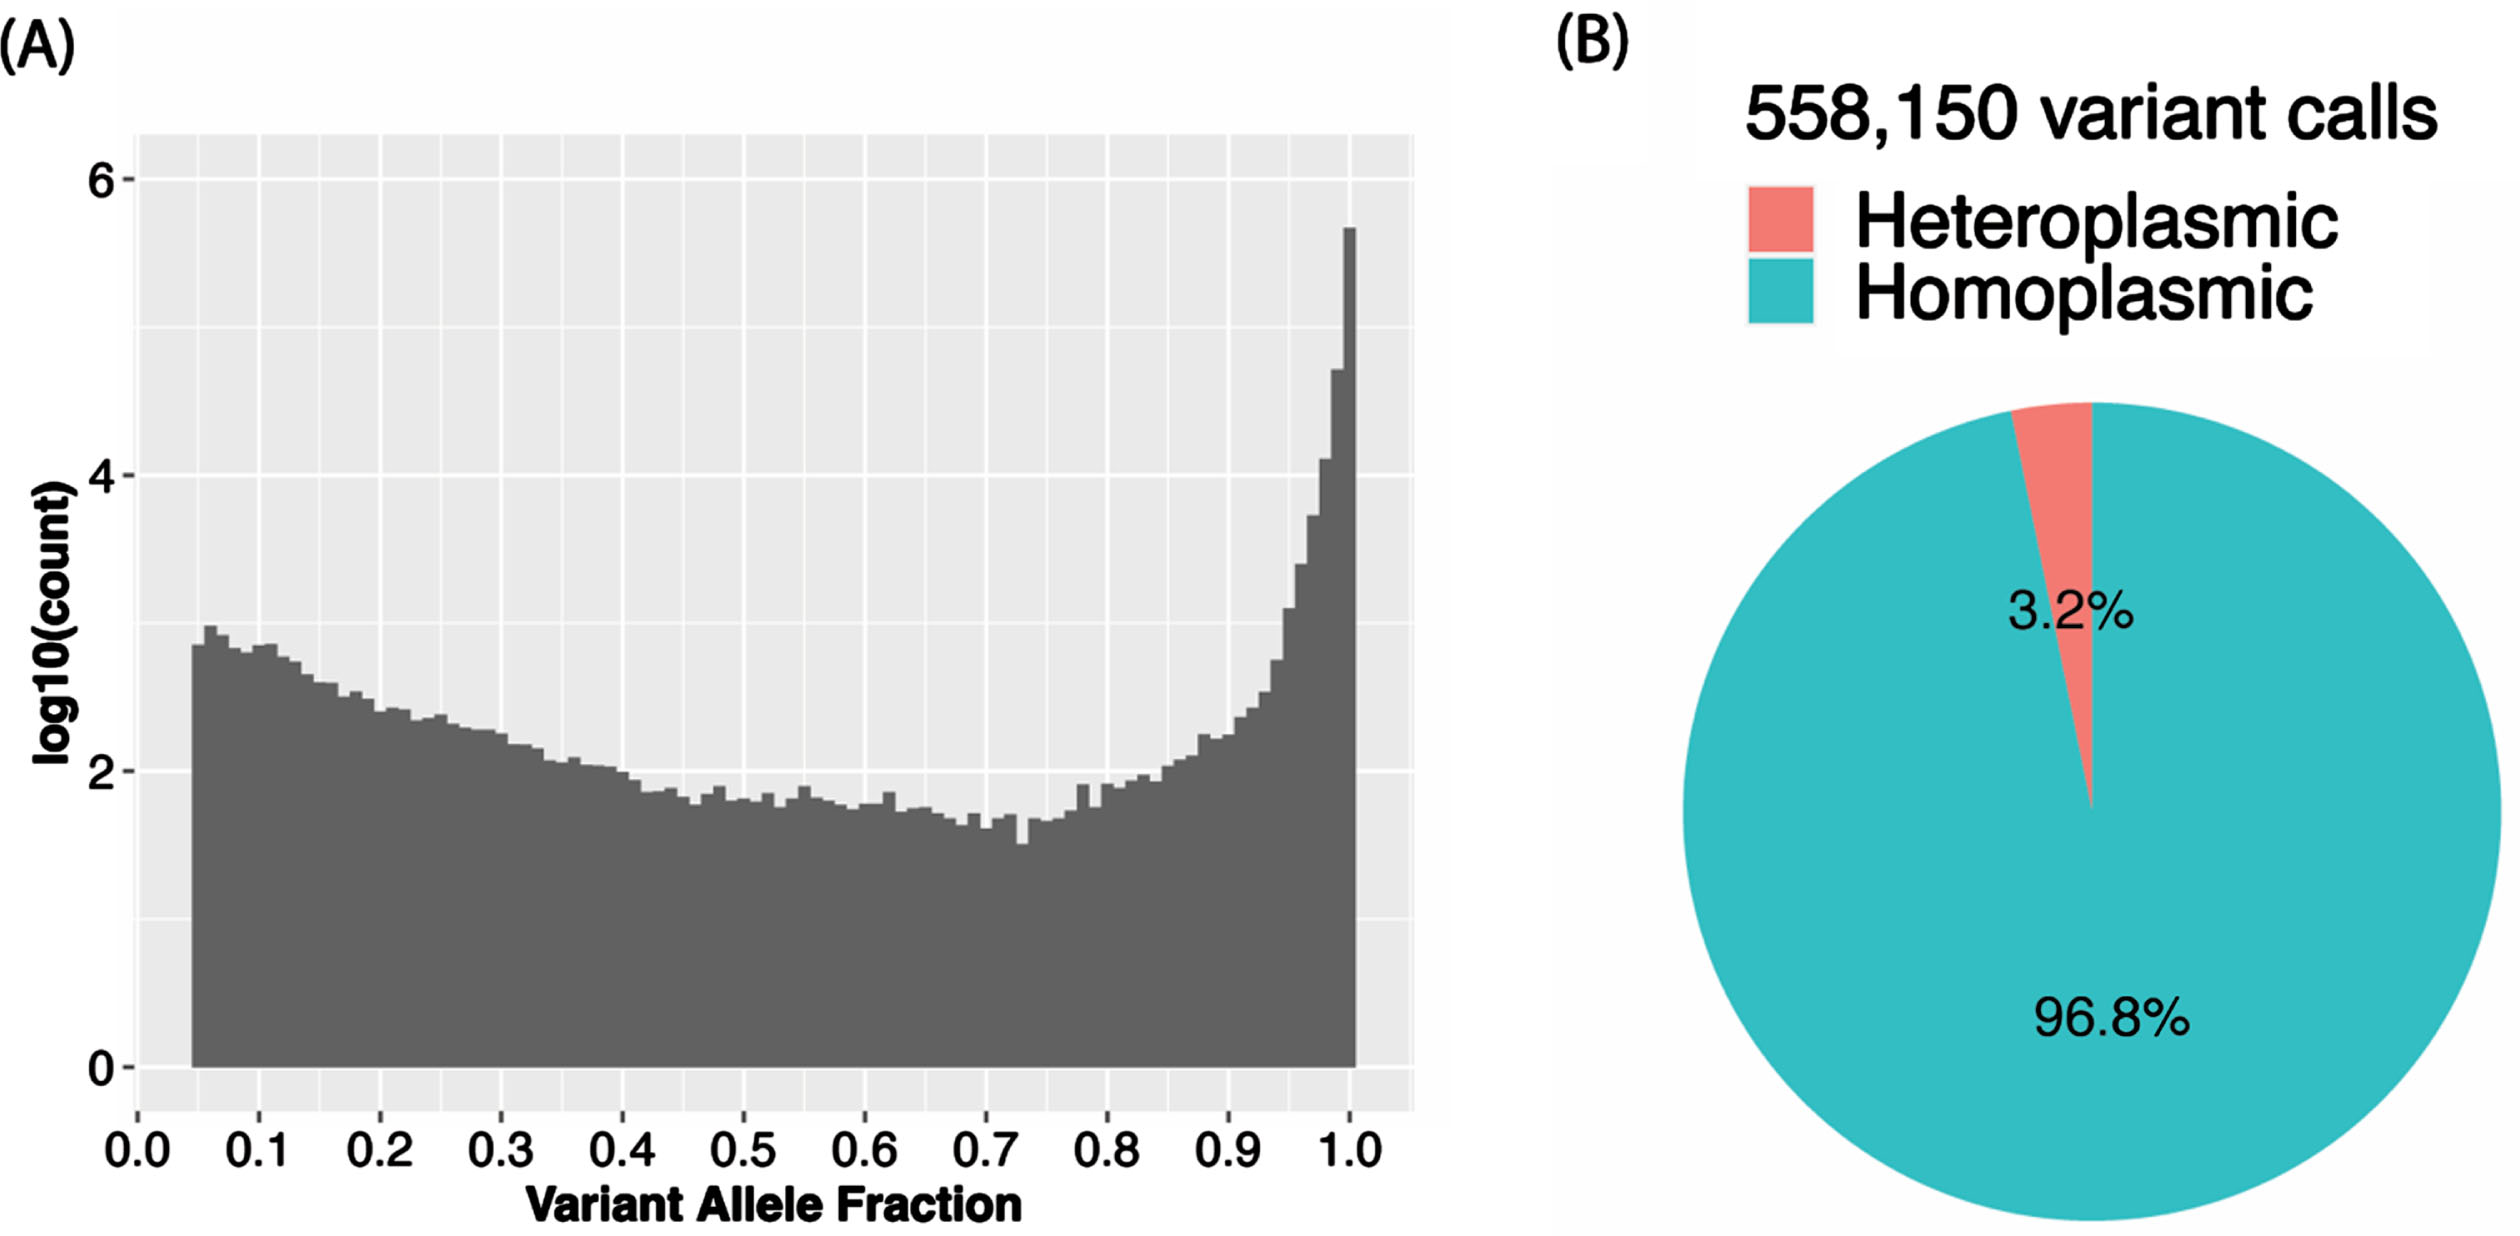
Fig. 4
MT variant distributions in the total sample. A) Proportion of variants by plasmy status. B) Number of variants detected according to allele frequency strata. C) Proportion of variants by plasmy status in each frequency strata.
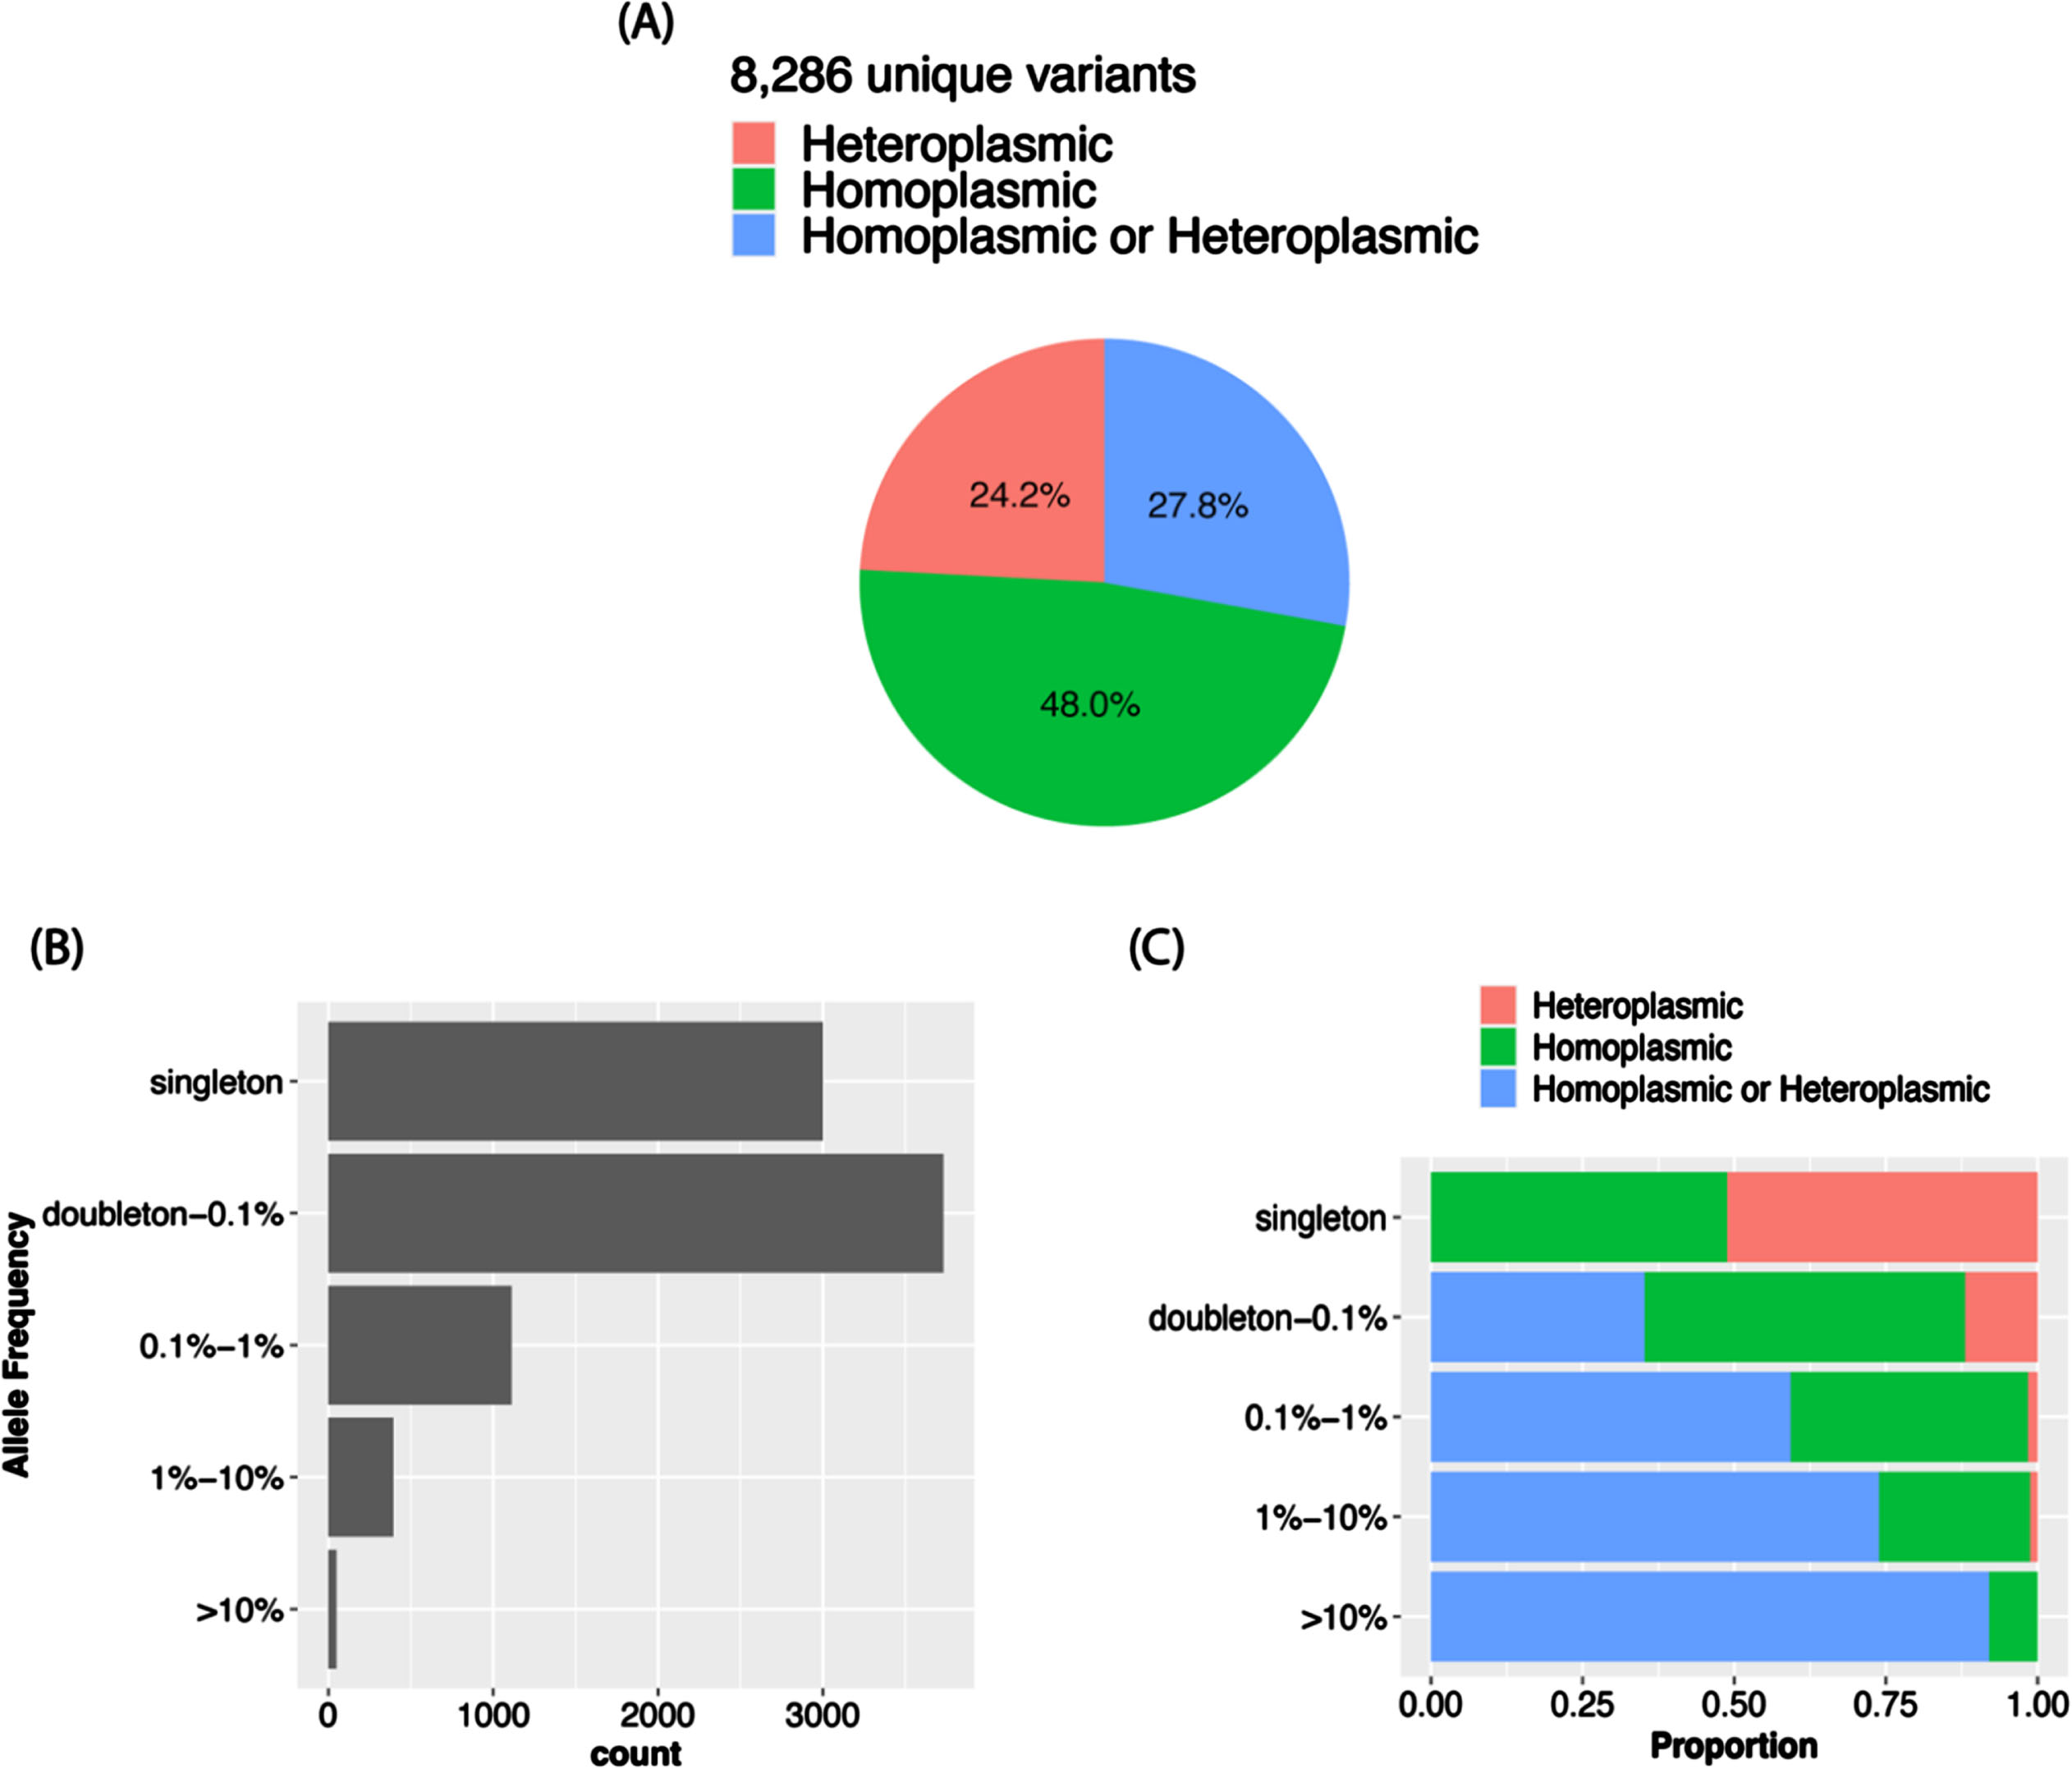
Fig. 5
Boxplots showing the mean number of homoplasmic calls according to (A) ancestry group and (B) tissue type among European ancestry individuals. Bar plots show the proportion of heteroplasmic calls according to (C) ancestry group and (D) tissue type among European ancestry individuals.
DISCUSSION
We integrated multiple tools into a comprehensive and flexible pipeline for calling mtDNA haplogroup and homoplasmic/heteroplasmic variants in whole genome sequence data. The pipeline can be implemented easily, has multiple quality control features and the ability to estimate contamination levels, and enables computationally efficient and accurate analysis of a large number of samples. The software and scripts for using this pipeline are publicly available and packaged as one singularity image (https://github.com/MarchOnion/MitoH3).
Some of our findings are consistent with other studies. For example, we found that haplogroup L is primarily found in AAs and haplogroups H, I, J, and K are more frequent in individuals of European ancestry, patterns which are similar to those observed in data from the 1000 Genomes Project [20]. In addition, we leveraged ADSP WGS technical replicates to determine the optimal VAF threshold for separating homoplasmic and heteroplasmic call sets. Applying this information to the entire WGS sample of 16,113 individuals revealed that 96.8% of calls were homoplasmic, an estimate that is consistent with a recent study using the information in the Genome Aggregation Database [14]. We also found that EAs have a slightly smaller proportion of homoplasmic calls compared to the other ancestry groups included in our study, a difference which could be due to the relatively small sample size for non-EAs. The number of homoplasmic sites observed in blood and brain samples was similar in the EA group although a large difference in sample size for blood versus brain, which might be due to the complexity of brain tissues or the high heterogeneity of brain regions.
Furthermore, we found there is no significant difference in homoplasmic or heteroplasmic variant counts between AD cases and controls within ethnic groups and sample sources (i.e., blood and brain). This finding is supported by a recent study indicating that mtDNA heteroplasmy levels do not show an association with AD pathologies or cognitive function; rather, they are more strongly correlated with age. Klein et al. also suggests that single nucleotide polymorphisms (SNPs) or small insertions and deletions (indels) may not play a significant role in late-onset neurodegenerative diseases [21]. There are also multiple studies aimed at exploring the mechanism underlying the association between mitochondrial impairments and the pathogenesis of AD [22]. While no primary MT mutations were found to be associated with AD, many studies indicate that MT haplogroups play a role in AD [23]. However, the same AD-associated MT haplogroups cannot be replicated in an independent Caucasian population study, which could be explained by the geographic difference in the sub-haplogroup structure of mtDNA [24]. The technical differences including sampling, sequencing methods, and library preparation may also contribute to the inconsistent results across studies. Integrating mtDNA copy number, structure variants, and haplogroups along with homoplasmic and heteroplasmic levels to investigate the mechanism between mtDNA with AD would be a potential enhancement to the MitoH3 pipeline.
There are several notable limitations to our study. First, it is challenging to estimate the tissue-specific difference of homoplasmic and heteroplasmic calls across different ancestry groups due to the smaller sample sizes for the AA and CH groups, as well as the small number of samples from brain compared to blood. Brain samples were unavailable for the non-EA groups. Second, we suggested mitochondrial heteroplasmic variants be defined at the 5% ≤VAF≤95% based on 45 technical replicates from 6 subjects. This threshold could be adjusted for different ancestry groups to achieve ancestry-specific optimal results.
In summary, the pipeline described here can efficiently provide comprehensive and accurate information about mtDNA variants, plasmy and haplogroups derived from whole genome sequence data. Further studies in larger and more diverse samples are needed to validate our findings and suggest future modifications to the mitoH3 pipeline.
AUTHOR CONTRIBUTIONS
Congcong Zhu (Data curation; Formal analysis; Methodology; Project administration; Software; Visualization; Writing – original draft; Writing – review & editing); Tong Tong (Methodology; Writing – review & editing); John J. Farrell (Supervision); Eden R. Martin (Funding acquisition); William S. Bush (Funding acquisition); Margaret A. Pericak-Vance (Funding acquisition); Li-San Wang (Funding acquisition); Gerard D. Schellenberg (Funding acquisition); Jonathan L. Haines (Funding acquisition); Kathryn L. Lunetta (Methodology; Supervision); Lindsay A. Farrer (Funding acquisition; Supervision; Writing – review & editing); Xiaoling Zhang (Conceptualization; Funding acquisition; Investigation; Methodology; Supervision; Writing – original draft; Writing – review & editing).
ACKNOWLEDGMENTS
The Alzheimer’s Disease Sequencing Project (ADSP) is comprised of two Alzheimer’s Disease (AD) genetics consortia and three National Human Genome Research Institute (NHGRI) funded Large Scale Sequencing and Analysis Centers (LSAC). The two AD genetics consortia are the Alzheimer’s Disease Genetics Consortium (ADGC) funded by NIA (U01 AG032984), and the Cohorts for Heart and Aging Research in Genomic Epidemiology (CHARGE) funded by NIA (R01 AG033193), the National Heart, Lung, and Blood Institute (NHLBI), other National Institute of Health (NIH) institutes and other foreign governmental and non-governmental organizations. The Discovery Phase analysis of sequence data is supported through UF1AG047133 (to Drs. Schellenberg, Farrer, Pericak-Vance, Mayeux, and Haines); U01AG049505 to Dr. Seshadri; U01AG049506 to Dr. Boerwinkle; U01AG049507 to Dr. Wijsman; and U01AG049508 to Dr. Goate and the Discovery Extension Phase analysis is supported through U01AG052411 to Dr. Goate, U01AG052410 to Dr. Pericak-Vance and U01 AG052409 to Drs. Seshadri and Fornage.
Sequencing for the Follow Up Study (FUS) is supported through U01AG057659 (to Drs. PericakVance, Mayeux, and Vardarajan) and U01AG062943 (to Drs. Pericak-Vance and Mayeux). Data generation and harmonization in the Follow-up Phase is supported by U54AG052427 (to Drs. Schellenberg and Wang). The FUS Phase analysis of sequence data is supported through U01AG058589 (to Drs. Destefano, Boerwinkle, De Jager, Fornage, Seshadri, and Wijsman), U01AG058654 (to Drs. Haines, Bush, Farrer, Martin, and Pericak-Vance), U01AG058635 (to Dr. Goate), RF1AG058066 (to Drs. Haines, Pericak-Vance, and Scott), RF1AG057519 (to Drs. Farrer and Jun), R01AG048927 (to Dr. Farrer), and RF1AG054074 (to Drs. Pericak-Vance and Beecham).
The ADGC cohorts include: Adult Changes in Thought (ACT) (U01 AG006781, U19 AG066567), the Alzheimer’s Disease Research Centers (ADRC) (P30 AG062429, P30 AG066468, P30 AG062421, P30 AG066509, P30 AG066514, P30 AG066530, P30 AG066507, P30 AG066444, P30 AG066518, P30 AG066512, P30 AG066462, P30 AG072979, P30 AG072972, P30 AG072976, P30 AG072975, P30 AG072978, P30 AG072977, P30 AG066519, P30 AG062677, P30 AG079280, P30 AG062422, P30 AG066511, P30 AG072946, P30 AG062715, P30 AG072973, P30 AG066506, P30 AG066508, P30 AG066515, P30 AG072947, P30 AG072931, P30 AG066546, P20 AG068024, P20 AG068053, P20 AG068077, P20 AG068082, P30 AG072958, P30 AG072959), the Chicago Health and Aging Project (CHAP) (R01 AG11101, RC4 AG039085, K23 AG030944), Indiana Memory and Aging Study (IMAS) (R01 AG019771), Indianapolis Ibadan (R01 AG009956, P30 AG010133), the Memory and Aging Project (MAP) (R01 AG17917), Mayo Clinic (MAYO) (R01 AG032990, U01 AG046139, R01 NS080820, RF1 AG051504, P50 AG016574), Mayo Parkinson’s Disease controls (NS039764, NS071674, 5RC2HG005605), University of Miami (R01 AG027944, R01 AG028786, R01 AG019085, IIRG09133827, A2011048), the Multi-Institutional Research in Alzheimer’s Genetic Epidemiology Study (MIRAGE) (R01 AG09029, R01 AG025259), the National Centralized Repository for Alzheimer’s Disease and Related Dementias (NCRAD) (U24 AG021886), the National Institute on Aging Late Onset Alzheimer’s Disease Family Study (NIA- LOAD) (U24 AG056270), the Religious Orders Study (ROS) (P30 AG10161, R01 AG15819), the Texas Alzheimer’s Research and Care Consortium (TARCC) (funded by the Darrell K Royal Texas Alzheimer’s Initiative), Vanderbilt University/Case Western Reserve University (VAN/CWRU) (R01 AG019757, R01 AG021547, R01 AG027944, R01 AG028786, P01 NS026630, and Alzheimer’s Association), the Washington Heights-Inwood Columbia Aging Project (WHICAP) (RF1 AG054023), the University of Washington Families (VA Research Merit Grant, NIA: P50AG005136, R01AG041797, NINDS: R01NS069719), the Columbia University Hispanic Estudio Familiar de Influencia Genetica de Alzheimer (EFIGA) (RF1 AG015473), the University of Toronto (UT) (funded by Wellcome Trust, Medical Research Council, Canadian Institutes of Health Research), and Genetic Differences (GD) (R01 AG007584). The CHARGE cohorts are supported in part by National Heart, Lung, and Blood Institute (NHLBI) infrastructure grant HL105756 (Psaty), RC2HL102419 (Boerwinkle) and the neurology working group is supported by the National Institute on Aging (NIA) R01 grant AG033193.
The CHARGE cohorts participating in the ADSP include the following: Austrian Stroke Prevention Study (ASPS), ASPS-Family study, and the Prospective Dementia Registry-Austria (ASPS/PRODEM-Aus), the Atherosclerosis Risk in Communities (ARIC) Study, the Cardiovascular Health Study (CHS), the Erasmus Rucphen Family Study (ERF), the Framingham Heart Study (FHS), and the Rotterdam Study (RS). ASPS is funded by the Austrian Science Fond (FWF) grant number P20545-P05 and P13180 and the Medical University of Graz. The ASPS-Fam is funded by the Austrian Science Fund (FWF) project I904), the EU Joint Programme – Neurodegenerative Disease Research (JPND) in frame of the BRIDGET project (Austria, Ministry of Science) and the Medical University of Graz and the Steiermärkische Krankenanstalten Gesellschaft. PRODEM-Austria is supported by the Austrian Research Promotion agency (FFG) (Project No. 827462) and by the Austrian National Bank (Anniversary Fund, project 15435. ARIC research is carried out as a collaborative study supported by NHLBI contracts (HHSN268201100005C, HHSN268201100006C, HHSN268201100007C, HHSN268201100008C, HHSN268201100009C, HHSN268201100010C, HHSN268201100011C, and HHSN268201100012C). Neurocognitive data in ARIC is collected by U01 2U01HL096812, 2U01HL096814, 2U01HL096899, 2U01HL096902, 2U01HL096917 from the NIH (NHLBI, NINDS, NIA and NIDCD), and with previous brain MRI examinations funded by R01-HL70825 from the NHLBI. CHS research was supported by contracts HHSN268201200036C, HHSN268200800007C, N01HC55222, N01HC85079, N01HC85080, N01HC85081, N01HC85082, N01HC85083, N01HC85086, and grants U01HL080295 and U01HL130114 from the NHLBI with additional contribution from the National Institute of Neurological Disorders and Stroke (NINDS). Additional support was provided by R01AG023629, R01AG15928, and R01AG20098 from the NIA. FHS research is supported by NHLBI contracts N01-HC-25195 and HHSN268201500001I. This study was also supported by additional grants from the NIA (R01 s AG054076, AG049607 and AG033040 and NINDS (R01 NS017950). The ERF study as a part of EUROSPAN (European Special Populations Research Network) was supported by European Commission FP6 STRP grant number 018947 (LSHG-CT-2006-01947) and also received funding from the European Community’s Seventh Framework Programme (FP7/2007-2013)/grant agreement HEALTH-F4- 2007-201413 by the European Commission under the programme “Quality of Life and Management of the Living Resources” of 5th Framework Programme (no. QLG2-CT-2002- 01254). High-throughput analysis of the ERF data was supported by a joint grant from the Netherlands Organization for Scientific Research and the Russian Foundation for Basic Research (NWO-RFBR 047.017.043). The Rotterdam Study is funded by Erasmus Medical Center and Erasmus University, Rotterdam, the Netherlands Organization for Health Research and Development (ZonMw), the Research Institute for Diseases in the Elderly (RIDE), the Ministry of Education, Culture and Science, the Ministry for Health, Welfare and Sports, the European Commission (DG XII), and the municipality of Rotterdam. Genetic data sets are also supported by the Netherlands Organization of Scientific Research NWO Investments (175.010.2005.011, 911-03-012), the Genetic Laboratory of the Department of Internal Medicine, Erasmus MC, the Research Institute for Diseases in the Elderly (014-93-015; RIDE2), and the Netherlands Genomics Initiative (NGI)/Netherlands Organization for Scientific Research (NWO) Netherlands Consortium for Healthy Aging (NCHA), project 050-060-810. All studies are grateful to their participants, faculty and staff. The content of these manuscripts is solely the responsibility of the authors and does not necessarily represent the official views of the National Institutes of Health or the U.S. Department of Health and Human Services.
The FUS cohorts include: the Alzheimer’s Disease Research Centers (ADRC) (P30 AG062429, P30 AG066468, P30 AG062421, P30 AG066509, P30 AG066514, P30 AG066530, P30 AG066507, P30 AG066444, P30 AG066518, P30 AG066512, P30 AG066462, P30 AG072979, P30 AG072972, P30 AG072976, P30 AG072975, P30 AG072978, P30 AG072977, P30 AG066519, P30 AG062677, P30 AG079280, P30 AG062422, P30 AG066511, P30 AG072946, P30 AG062715, P30 AG072973, P30 AG066506, P30 AG066508, P30 AG066515, P30 AG072947, P30 AG072931, P30 AG066546, P20 AG068024, P20 AG068053, P20 AG068077, P20 AG068082, P30 AG072958, P30 AG072959), Alzheimer’s Disease Neuroimaging Initiative (ADNI) (U19AG024904), Amish Protective Variant Study (RF1AG058066), Cache County Study (R01AG11380, R01AG031272, R01AG21136, RF1AG054052), Case Western Reserve University Brain Bank (CWRUBB) (P50AG008012), Case Western Reserve University Rapid Decline (CWRURD) (RF1AG058267, NU38CK000480), CubanAmerican Alzheimer’s Disease Initiative (CuAADI) (3U01AG052410), Estudio Familiar de Influencia Genetica en Alzheimer (EFIGA) (5R37AG015473, RF1AG015473, R56AG051876), Genetic and Environmental Risk Factors for Alzheimer Disease Among African Americans Study (GenerAAtions) (2R01AG09029, R01AG025259, 2R01AG048927), Gwangju Alzheimer and Related Dementias Study (GARD) (U01AG062602), Hillblom Aging Network (2014-A-004-NET, R01AG032289, R01AG048234), Hussman Institute for Human Genomics Brain Bank (HIHGBB) (R01AG027944, Alzheimer’s Association “Identification of Rare Variants in Alzheimer Disease”), Ibadan Study of Aging (IBADAN) (5R01AG009956), Longevity Genes Project (LGP) and LonGenity (R01AG042188, R01AG044829, R01AG046949, R01AG057909, R01AG061155, P30AG038072), Mexican Health and Aging Study (MHAS) (R01AG018016), Multi-Institutional Research in Alzheimer’s Genetic Epidemiology (MIRAGE) (2R01AG09029, R01AG025259, 2R01AG048927), Northern Manhattan Study (NOMAS) (R01NS29993), Peru Alzheimer’s Disease Initiative (PeADI) (RF1AG054074), Puerto Rican 1066 (PR1066) (Wellcome Trust (GR066133/GR080002), European Research Council (340755)), Puerto Rican Alzheimer Disease Initiative (PRADI) (RF1AG054074), Reasons for Geographic and Racial Differences in Stroke (REGARDS) (U01NS041588), Research in African American Alzheimer Disease Initiative (REAAADI) (U01AG052410), the Religious Orders Study (ROS) (P30 AG10161, P30 AG72975, R01 AG15819, R01 AG42210), the RUSH Memory and Aging Project (MAP) (R01 AG017917, R01 AG42210Stanford Extreme Phenotypes in AD (R01AG060747), University of Miami Brain Endowment Bank (MBB), University of Miami/Case Western/North Carolina A&T African American (UM/CASE/NCAT) (U01AG052410, R01AG028786), and Wisconsin Registry for Alzheimer’s Prevention (WRAP) (R01AG027161 and R01AG054047).
The four LSACs are: the Human Genome Sequencing Center at the Baylor College of Medicine (U54 HG003273), the Broad Institute Genome Center (U54HG003067), The American Genome Center at the Uniformed Services University of the Health Sciences (U01AG057659), and the Washington University Genome Institute (U54HG003079). Genotyping and sequencing for the ADSP FUS is also conducted at John P. Hussman Institute for Human Genomics (HIHG) Center for Genome Technology (CGT).
Biological samples and associated phenotypic data used in primary data analyses were stored at Study Investigators institutions, and at the National Centralized Repository for Alzheimer’s Disease and Related Dementias (NCRAD, U24AG021886) at Indiana University funded by NIA. Associated Phenotypic Data used in primary and secondary data analyses were provided by Study Investigators, the NIA funded Alzheimer’s Disease Centers (ADCs), and the National Alzheimer’s Coordinating Center (NACC, U24AG072122) and the National Institute on Aging Genetics of Alzheimer’s Disease Data Storage Site (NIAGADS, U24AG041689) at the University of Pennsylvania, funded by NIA. Harmonized phenotypes were provided by the ADSP Phenotype Harmonization Consortium (ADSP-PHC), funded by NIA (U24 AG074855, U01 AG068057 and R01 AG059716) and Ultrascale Machine Learning to Empower Discovery in Alzheimer’s Disease Biobanks (AI4AD, U01 AG068057). This research was supported in part by the Intramural Research Program of the National Institutes of health, National Library of Medicine. Contributors to the Genetic Analysis Data included Study Investigators on projects that were individually funded by NIA, and other NIH institutes, and by private U.S. organizations, or foreign governmental or nongovernmental organizations.
FUNDING
The authors have no funding to report.
CONFLICT OF INTEREST
The authors have no conflict of interest to report.
DATA AVAILABILITY
NIAGAD: Data for this study were prepared, archived, and distributed by the National Institute on Aging Alzheimer’s Disease Data Storage Site (NIAGADS) at the University of Pennsylvania (U24-AG041689), funded by the National Institute on Aging (Accession number: NG00067).
GitHub repository/Code availability: https://github.com/MarchOnion/MitoH3
SUPPLEMENTARY MATERIAL
[1] The supplementary material is available in the electronic version of this article: https://dx.doi.org/10.3233/ADR-230120.
REFERENCES
[1] | Monzel AS , Enríquez JA , Picard M ((2023) ) Multifaceted mitochondria: Moving mitochondrial science beyond function and dysfunction. Nat Metab 5: , 546–562. |
[2] | Swerdlow RH , Burns JM , Khan SM ((2014) ) The Alzheimer’s disease mitochondrial cascade hypothesis: Progress and perspectives. Biochim Biophys Acta Mol Basis Dis 1842: , 1219–1231. |
[3] | Stewart JB , Chinnery PF ((2015) ) The dynamics of mitochondrial DNA heteroplasmy: Implications for human health and disease. Nat Rev Genet 16: , 530–542. |
[4] | Yana MH , Wang X , Zhu X ((2013) ) Mitochondrial defects and oxidative stress in Alzheimer disease and Parkinson disease. Free Radic Biol Med 62: , 90–101. |
[5] | Coskun PE , Beal MF , Wallace DC ((2004) ) Alzheimer’s brains harbor somatic mtDNA control-region mutations that suppress mitochondrial transcription and replication. Proc Natl Acad Sci U S A 101: , 10726–10731. |
[6] | Just RS , Irwin JA , Parson W ((2015) ) Mitochondrial DNA heteroplasmy in the emerging field of massively parallel sequencing. Forensic Sci Int Genet 18: , 131–139. |
[7] | Yao YG , Bandelt HJ , Young NS ((2007) ) External contamination in single cell mtDNA analysis. PLoS One 2: , e681. |
[8] | Jun G , Flickinger M , Hetrick KN , Romm JM , Doheny KF , Abecasis GR , Boehnke M , Kang HM ((2012) ) Detecting and estimating contamination of human DNA samples in sequencing and array-based genotype data. Am J Hum Genet 91: , 839–848. |
[9] | Weissensteiner H , Forer L , Fendt L , Kheirkhah A , Salas A , Kronenberg F , Schoenherr S ((2021) ) Contamination detection in sequencing studies using the mitochondrial phylogeny. Genome Res 31: , 309–316. |
[10] | Calabrese C , Simone D , Diroma MA , Santorsola M , Gutta C , Gasparre G , Picardi E , Pesole G , Attimonelli M ((2014) ) MToolBox: A highly automated pipeline for heteroplasmy annotation and prioritization analysis of human mitochondrial variants in high-throughput sequencing. Bioinformatics 30: , 3115–3117. |
[11] | Weissensteiner H , Forer L , Fuchsberger C , Schöpf B , Kloss-Brandstätter A , Specht G , Kronenberg F , Schönherr S ((2016) ) mtDNA-Server: Next-generation sequencing data analysis of human mitochondrial DNA in the cloud. Nucleic Acids Res 44: , W64–W69. |
[12] | Battle SL , Puiu D , Verlouw J , Broer L , Boerwinkle E , Taylor KD , Rotter JI , Rich SS , Grove ML , Pankratz N , Fetterman JL , Liu C , Arking DE ((2022) ) A bioinformatics pipeline for estimating mitochondrial DNA copy number and heteroplasmy levels from whole genome sequencing data. NAR Genom Bioinform 4: , lqac034. |
[13] | Zhang X , Farrell JJ , Tong T , Hu J , Zhu C , Wang LS , Mayeux R , Haines JL , Pericak-Vance MA , Schellenberg GD , Lunetta KL , Farrer LA ((2022) ) Association of mitochondrial variants and haplogroups identified by whole exome sequencing with Alzheimer’s disease. Alzheimers Dement 18: , 294–306. |
[14] | Laricchia KM , Lake NJ , Watts NA , Shand M , Haessly A , Gauthier L , Benjamin D , Banks E , Soto J , Garimella K , Emery J , Rehm HL , MacArthur DG , Tiao G , Lek M , Mootha VK , Calvo SE ((2022) ) Mitochondrial DNA variation across 56,434 individuals in gnomAD. Genome Res 32: , 569–582. |
[15] | McKenna A , Hanna M , Banks E , Sivachenko A , Cibulskis K , Kernytsky A , Garimella K , Altshuler D , Gabriel S , Daly M , DePristo MA ((2010) ) The Genome Analysis Toolkit: A MapReduce framework for analyzing next-generation DNA sequencing data. Genome Res 20: , 1297–1303. |
[16] | Liu C , Fetterman JL , Liu P , Luo Y , Larson MG , Vasan RS , Zhu J , Levy D ((2018) ) Deep sequencing of the mitochondrial genome reveals common heteroplasmic sites in NADH dehydrogenase genes. Hum Genet 137: , 203–213. |
[17] | Beecham GW , Bis JC , Martin ER , Choi SH , DeStefano AL , Van Duijn CM , Fornage M , Gabriel SB , Koboldt DC , Larson DE , Naj AC , Psaty BM , Salerno W , Bush WS , Foroud TM , Wijsman E , Farrer LA , Goate A , Haines JL , Pericak-Vance MA , Boerwinkle E , Mayeux R , Seshadri S , Schellenberg G ((2017) ) Clinical/Scientific Notes: The Alzheimer’s disease sequencing project: Study design and sample selection. Neurol Genet 3: , e194. |
[18] | Gogarten SM , Sofer T , Chen H , Yu C , Brody JA , Thornton TA , Rice KM , Conomos MP ((2019) ) Genetic association testing using the GENESIS R/Bioconductor package. Bioinformatics 35: , 5346–5348. |
[19] | Pedregosa F , Michel V , Grisel O , Blondel M , Prettenhofer P , Weiss R , Vanderplas J , Cournapeau D , Varoquaux G , Gramfort A , Thirion B , Dubourg V , Passos A , Brucher M , Perrot M , Duchesnay É ((2011) ) Scikit-learn: Machine Learning in Python. J Mach Learn Res 12: , 2825–2830. |
[20] | Rishishwar L , Jordan IK ((2017) ) Implications of human evolution and admixture for mitochondrial replacement therapy. BMC Genomics 18: , 140. |
[21] | Klein HU , Trumpff C , Yang HS , Lee AJ , Picard M , Bennett DA , De Jager PL ((2021) ) Characterization of mitochondrial DNA quantity and quality in the human aged and Alzheimer’s disease brain. Mol Neurodegener 16: , 75. |
[22] | Wang W , Zhao F , Ma X , Perry G , Zhu X ((2020) ) Mitochondria dysfunction in the pathogenesis of Alzheimer’s disease: Recent advances. Mol Neurodegener 15: , 30. |
[23] | Lakatos A , Derbeneva O , Younes D , Keator D , Bakken T , Lvova M , Brandon M , Guffanti G , Reglodi D , Saykin A , Weiner M , Macciardi F , Schork N , Wallace DC , Potkin SG ((2010) ) Association between mitochondrial DNA variations and Alzheimer’s disease in the ADNI cohort. Neurobiol Aging 31: , 1355–1363. |
[24] | Van Der Walt JM , Dementieva YA , Martin ER , Scott WK , Nicodemus KK , Kroner CC , Welsh-Bohmer KA , Saunders AM , Roses AD , Small GW , Schmechel DE , Murali Doraiswamy P , Gilbert JR , Haines JL , Vance JM , Pericak-Vance MA ((2004) ) Analysis of European mitochondrial haplogroups with Alzheimer disease risk. Neurosci Lett 365: , 28–32. |


