
An IoT based rail track condition monitoring and derailment prevention system
Abstract
This paper proposes a new method for monitoring the irregularities in railway tracks by updating the status of the tracks in the cloud. The IoT based Railway Track Monitoring System (IoT-RMS) is proposed for monitoring the health of the railway track. The system identifies any abnormality in the tracks at an early stage. These abnormalities are rectified before they develop for smoother transportation. The micro electro mechanical system (MEMS) accelerometers are placed in the axle box for measuring the signal. It becomes hard to identify the exact location of abnormalities when the global positioning system (GPS) falters due to signalling issues. In this paper, a new hybrid method is proposed for locating irregularities on a track; even in the absence of a GPS signal. Pre-processing of the GPS signal is carried out effectively because the sensors used in IoT-RMS are capable of functioning in a high noise environment. The IoT-RMS updates the location of the abnormality in the cloud and shares it with other trains that will be passing through that location. As a result, the drivers of trains respond accordingly and avoid derailment. An experimental setup has been developed for a study of the performances for four different abnormal cases, and the result shows the effectiveness of the proposed system.
1Introduction
Rail transport plays a vital role in our day-to-day life. In the last ten years, there has been a remarkable growth in the infrastructure of the railway system, especially in developing countries. One challenge that arises is the ability to sufficiently power monitoring equipment in remote location (Hodge et al. 2015). A solution to the issue could be to use batteries or a renewable source of energy. However, these sources of energy require constant maintenance which can be hindered in remote locations (Lee et al. 2014). Tsunashima et al. (2014) describe an in-service vehicle with sensors, and in the irregularities in the tracks are detected and relayed using a global positioning system.
Trains generate significant amounts of force which causes the tracks to degrade over time (Bogacz et al. 2007). In order to meet the safety standards created by the Federal Railroad Administration (FRA), continuous monitoring is necessary. Wavelet transform-based track monitoring system has proposed by Lei et al. (2018). It identifies the abnormalities of the track and inform to the control room. Molodova et al. (2014) have suggested a method to locate any surface problem on the tracks. The track irregularities are detected using these signals. An optimal track monitoring system based on accelerometer signals has been discussed by Chellaswamy et al. (2017a).
The signal is analyzed using the principal component analysis (PCA) which attracts our attention to the railway track signal analysis and fault detection. The PCA method is a standard multivariate technique; capable of diminishing data dimensionality. Due to its simple structure, it can quickly analyze and retain essential information (Gigin et al. 2018). PCA with gray relational analysis based multi-objective optimization was introduced by Gaurav et al. (2020) for analyzing the vibrations from drilling. Fault detection based on the PCA method was proposed by Guannan and Yunpeng (2019). The ensemble empirical mode decomposition is essential for extracting information from the noise. The PCA method is required to detect faults by establishing the Q-statistic with a threshold. Xianping and Feng (2019) suggested a new PCA method for managing the unstructured data with a reduced number of variables. This method is significantly more efficient than the conventional methods of big data analysis.
Zhai et al. (2015) developed a test unit to locate abnormalities on tracks with high-speed trains. A fiber optic monitoring system was recommended for its high sensitivity and dynamic range by Naderi and Mirabadi (2006). Konop and Konowrocki (2013) used the wheel-rail dynamics of the tracks for determining their health. Lee et al. (2012) used a three-filter band pass, a compensation filter, and a Kalman filter for the estimation of track irregularities on high-speed railway tracks. Chellaswamy et al. (2013), Chellaswamy et al. (2020) estimated the track abnormalities using a fuzzy logic-based monitoring system for improving the ride quality of rail transportation.
Chellaswamy et al. (2017b) have proposed the IoT based rail track monitoring system. When the vibrations exceed a set threshold value, the controller identifies the coordinates and updates the cloud. A video surveillance system may be necessary for monitoring locations with heavy fog (Chen et al. 2016). The disadvantages of this method have been discussed by Jian et al. (2015) and Huang et al. (2019). Continuous video streaming requires broadband connectivity, if not present, then it will be hard to achieve accuracy and quality in the recognition of abnormalities. Several pieces of technology require cloud-based technology such as industrial, medical, agricultural, and even home appliances (Feng et al. 2016, Mainetti et al. 2016, Kidd 2012, & Amy et al. 2017). Humanoid robots use IoT-based real-time networking. Han-pang et al. (2017) have compared this technology with the existing network parameters such as efficiency, flow control, and priority.
Big data can process datasets of larger sizes efficiently unlike older software (Bevilacqua et al. 2017). New sets of techniques and technologies are used by big data to reveal insights from massive, diverse, and complex data sets. With a large volume of sensor, user, and operation data accumulation in the railway industry, the big data has become the main drive (Uckelmann & Harrison, 2010). The computer-based algorithm controls the physical entities of the modern railway system while trains are interconnected and act as communication hubs. They collect information from the onboard devices and exchange the information with other trains and railway control centers. The real-time status is shared and instructions are received from the control centers. To improve safety and performance, a modern railway system should implement IoT and big data.
In this paper, the IoT-based railway track condition monitoring system is introduced for establishing continuous monitoring of the railway tracks. The PCA method was chosen for its simple software redundancy technique and false alarm reducing methods. If any abnormality is detected in the track, the corresponding coordinates are captured from the GPS by the controller. The location of the abnormality (LOA) is captured when the acceleration signal exceeds the set threshold value. When the train passes through any remote or hilly areas, the signal either becomes weak or it will transpire. Henceforth, it becomes very difficult to find the faulty location. So hybrid sensing method using proximity sensors are combined with the GPS for the estimation of the exact LoA. The LoA is updated in the cloud server and the information is provided to other trains which pass through the fault location. It also provides information to other trains to enable the drivers to reduce their speed to avoid derailment. The message is also sent to the maintenance department so they can take necessary action. The novelties of the proposed IoT-RMS are as follows:
• Principal component analysis-based preprocessing and fault detection method are used.
• A hybrid sensing method is introduced for estimating the exact location of abnormality even when the GPS signal is absent.
• The information is updated in a cloud server and shared with other trains that may pass through the same location.
2Proposed IoT-RMS
This section discusses the IoT-RMS that helps to avoid train derailment. Different types of sensors such as speed and acceleration sensors are used locate anomalies. The sensors are mounted in the passenger or goods railcars and integrated with the IoT cloud for storage and processing. Accelerometers have been installed in the vertical and lateral direction of the axle-box. When any abnormality is detected, the controller sends details of the abnormality with location information to OpenGTS (open source GPS tracking system) server. MongoDB, a distributed database, is used to store and track information about abnormalities collected from trains (Divya & Ziliang 2017, Anand & Mallikarjuna 2017). Alert message can be shared to the driver of the train that is going to pass through the abnormality’s location. This allows the driver to prepare and react accordingly before passing through the location to avoid derailment. Four different abnormalities, namely, cracks, rusted deformations on rail tops, loose bolts, and missing bolt, are considered and are shown in Fig. 1. GPS-DSM132, a tracker device, was used for tracking the location of irregularities. It measures and records geo-location coordinates such as latitude, longitude, as well as velocity. This device ensures accuracy while also being compact in size and is easy to handle. Hence, it is widely used in applications like mobile objects and vehicle tracking.
Fig. 1
Examples of track abnormalities (a) deformation with crack, (b) rusty deformation on rail top, (c) loose bolts, and (d) missing bolt.

A 4G network is used for the transfer of abnormality location coordinates from a rail vehicle to an OpenGTS server. ATM buses in Messina use this system for location tracking (The OpenGTS project,
Abnormalities on the track are detected using accelerometer signals. The received signals are preprocessed by Principal Component Analysis Method (PCAM). In this study, the statistics-based correlation method is used for fault identification due to its simple structure, speed, and faster estimation time. The correlation analysis has been performed between the measured signal and the track geometry measurement signal (Lee et al. 2012) (for more details refer to section 2.3). Table 1 shows the various parameters of the accelerometer. Accelerometers are suitable for track monitoring systems because they have decent scalability, stability, are relatively light, and significantly cheaper. Hence, this paper proposes an accelerometer based measurement and tracking system for increasing the safety of the passengers.
Table 1
Technical specifications of ADXL345 accelerometer
| Parameters | Values |
| Type | ADXL345 |
| Image |  |
| Manufacturer | Analog Devices |
| Axis | 3 |
| Voltage (V) | 1.8 – 3.6 |
| Current (μA) | 350 |
| Interface | SPI, I2C |
| Precision | 3 g |
| Temperature ( C) | 85 |
| Price ($) | 3 |
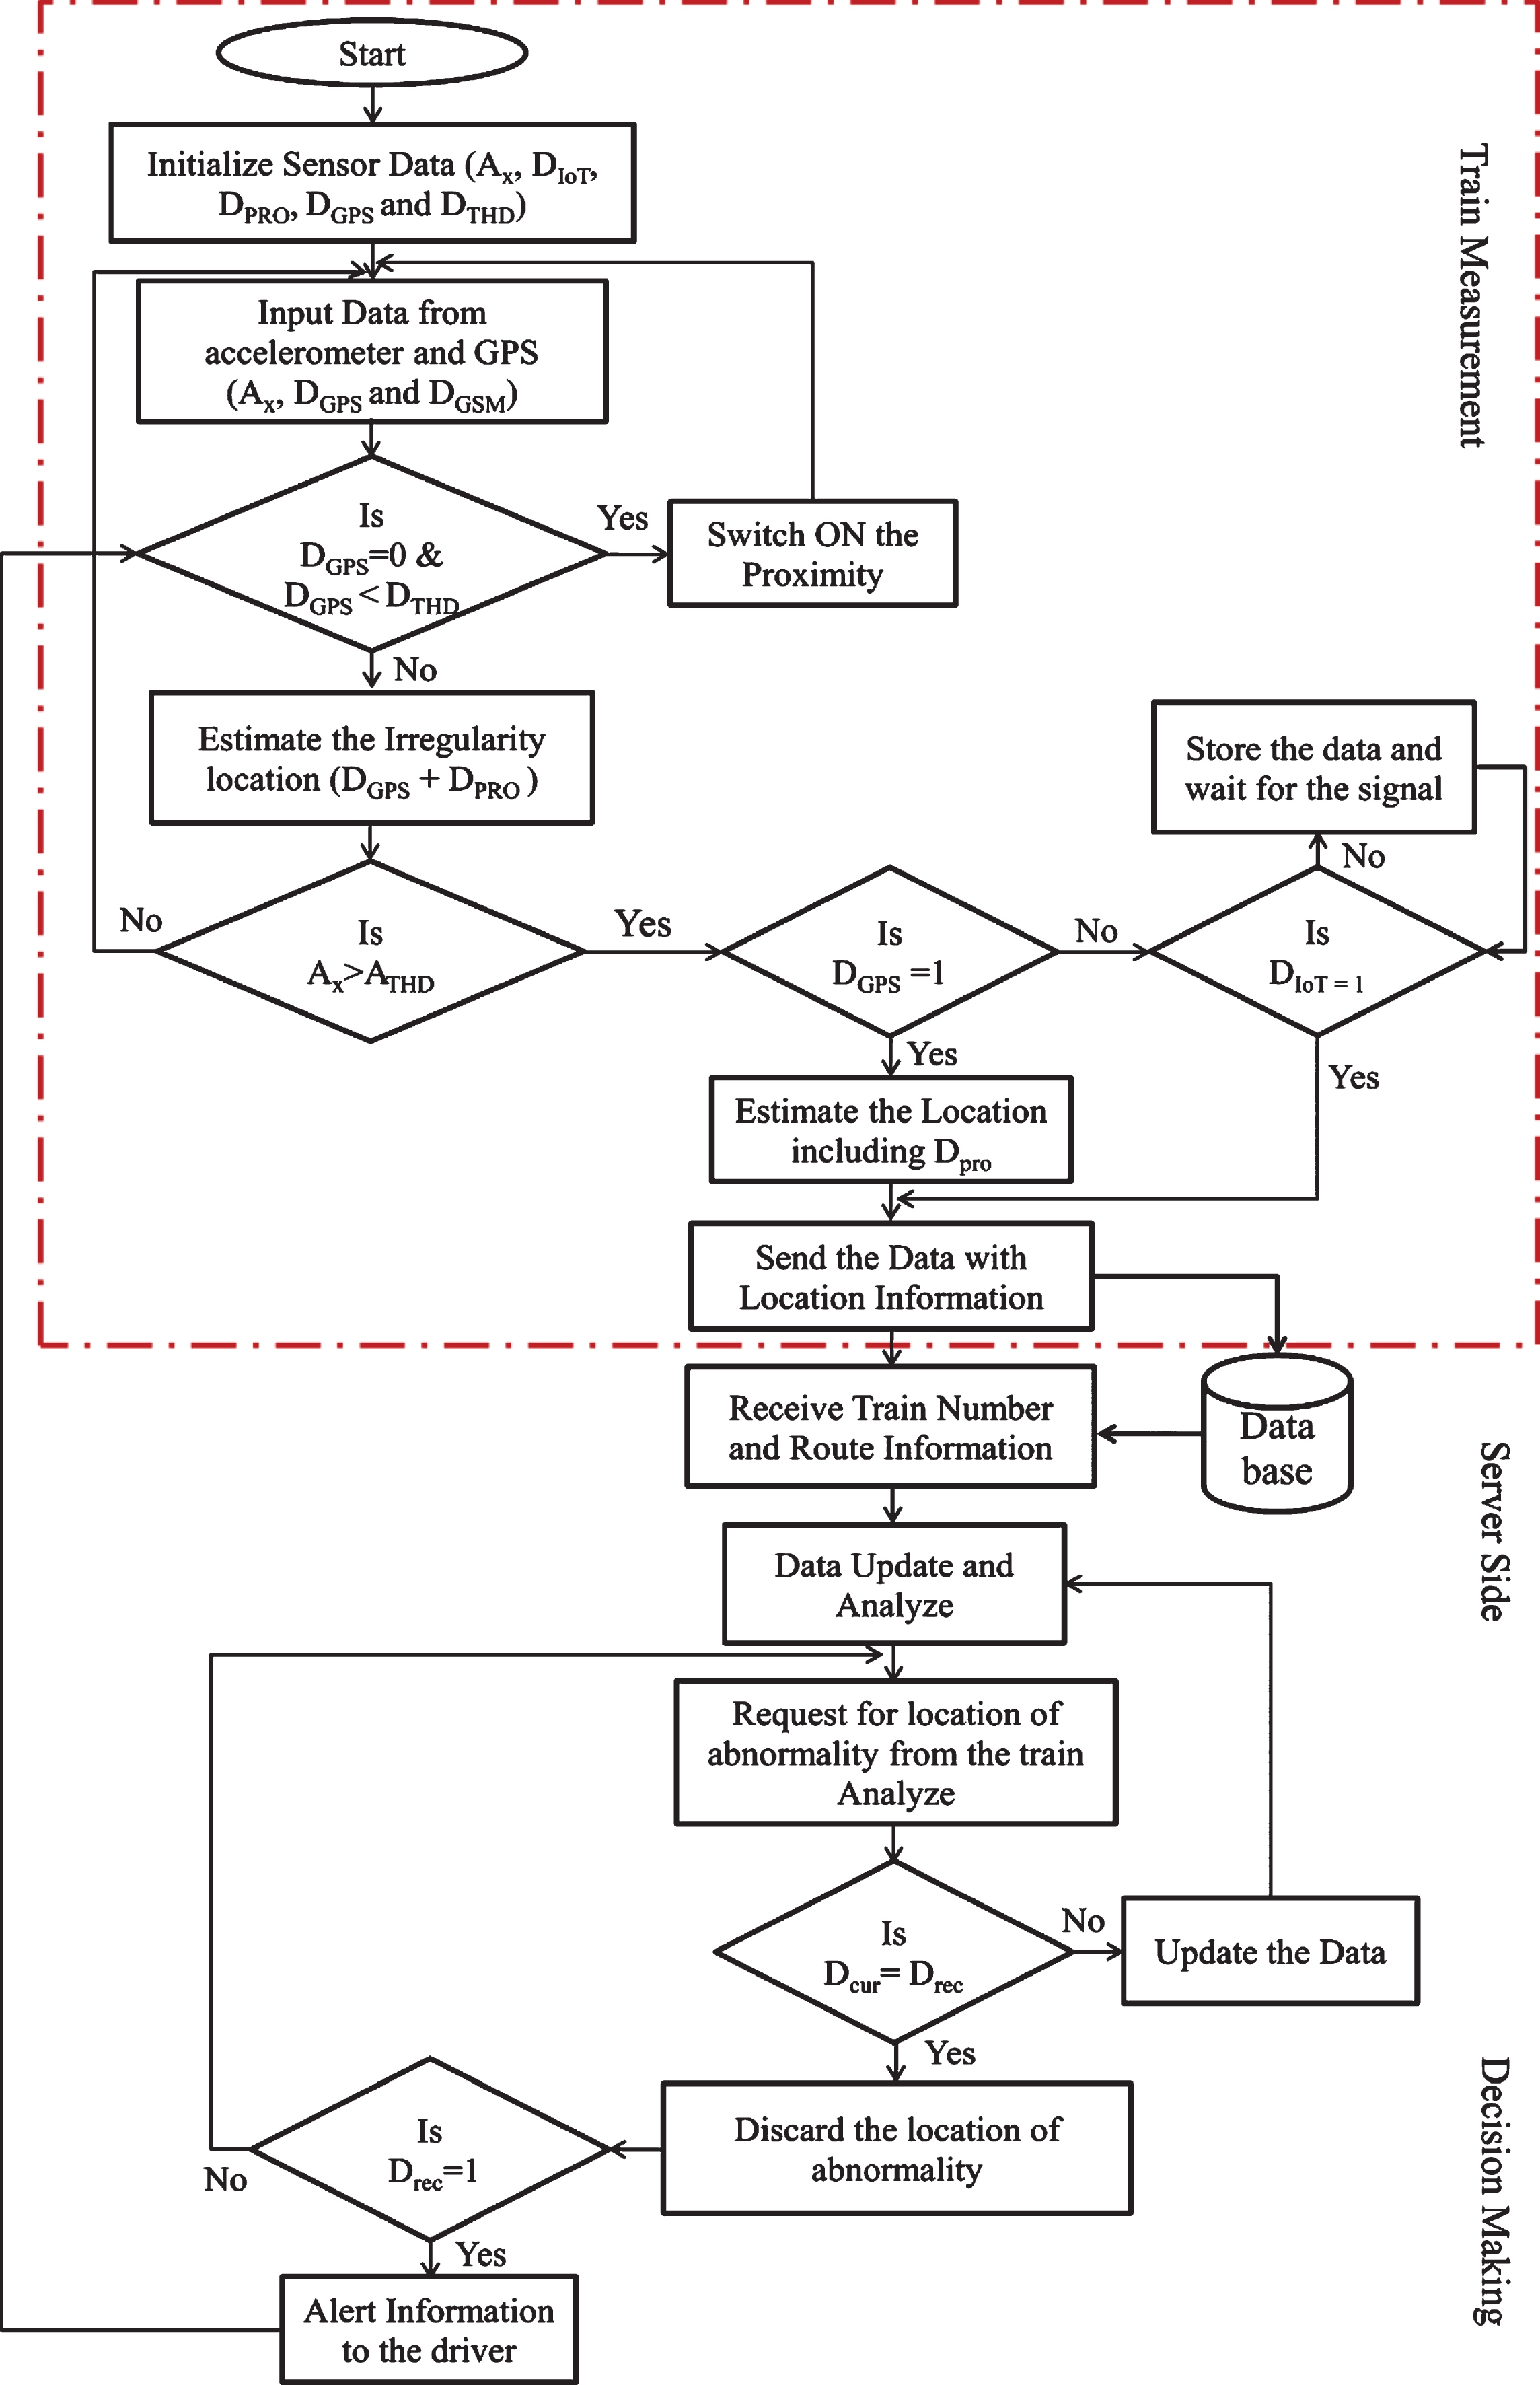
The workflow of IoT-RMS is shown in Fig. 2. This algorithm checks the status of the track continuously and updates it in the cloud. GPS finds the location of the abnormality and the controller transfers this information to the driver before the train crosses this location. Track measurements are sent to a cloud server and decision are made involving this workflow. The accelerometer signals (Ax), the GPS data (DGPS), the IoT-ESP8266 (DIoT), and the GSM (DGSM) data are present in the track measurement section. The controller turns on the proximity sensor when the GPS signal is less than the set threshold value (ATHD) or is completely absent. When proximity sensors start to measure the abnormalities during the absence of the GPS signal (DPRO) (refer section 4 for more information) and the total abnormal distance is obtained as DPRO +DGPS. The controller updates the abnormality location information to the cloud. The information will be updated by the first two trains who detect the irregularity. If the first two trains update the cloud server with same location information, then the server ultimately decides there is an abnormality present. It will then share the current abnormality information (Dcur) to all the trains that will pass through the location. If any train detects an abnormality (Drec), it will check both the Dcur and Drec. If both are equal it will discard the process of updating the abnormality in the database.
Fig. 2
Workflow of the proposed IoT based track monitoring system.
2.1PCAM
The PCAM retains most information of the original data while transforming a set of correlated variables onto a set of uncorrelated variables. The abnormalities are detected and isolated from the uncorrelated variables method (Li et al. 2012). The data matrix (A) consists of m variables and n samples decomposed as a sum of the residual matrix (G) along with an estimation matrix (
(1)
In the equation above, t and P respectively denote the scores and loading matrices of A. Both the vectors ti and Pi are orthonormal. Now, ti can be expressed as:
(2)
The new observation An is equal to the 1×M vector and the corresponding score ti is equal to a 1×A vector. PCAM has the capability to handle a data set with larger dimension. For instance, it is currently used to analyze genomic data which has significantly more variables (Milting et al., 2013).
Statistics such as Q and T2 are used to detect the faults of PCAM. The Q and T2 measure the corresponding variation in G and
(3)
(4)
Here, tk, σk, and βk denote the score of the observation in the k-th component, the mean, and the standard deviation of the scores of that component in the calibration data respectively. en represents the residual value corresponding to the n-th variable. The analysis is done in two steps: 1) Initially, the received data is inspected for special causes of vibration, which are iteratively solved. Once the collected data is free of special causes of variation, it is used to model the normal operation condition of the calibration of the IoT-RMS. Next, the IoT-RMS monitors new data. 2) In the second step, the monitored data and calibration data are distinguished. The scores are linear combinations of the original variables and normally distributed. As a result, the T2-statistic is multiplied by a constant while also following a beta distribution (Tracy et al., 1992). This is given by:
(5)
where P and B, denotes respectively, the number of observations and beta distributions. Hence, the upper limit (UL) for the T2-statistic at significance level γ is given by
(6)
where
(7)
UL for theT2 statistic at significance level γ is given by
(8)
Several procedures can be used for setting the UL for Q-statistics. Here, assume that the residuals follow a multi-normal distribution and the significance level γ is given by:
(9)
where
2.2Preprocessing of signal
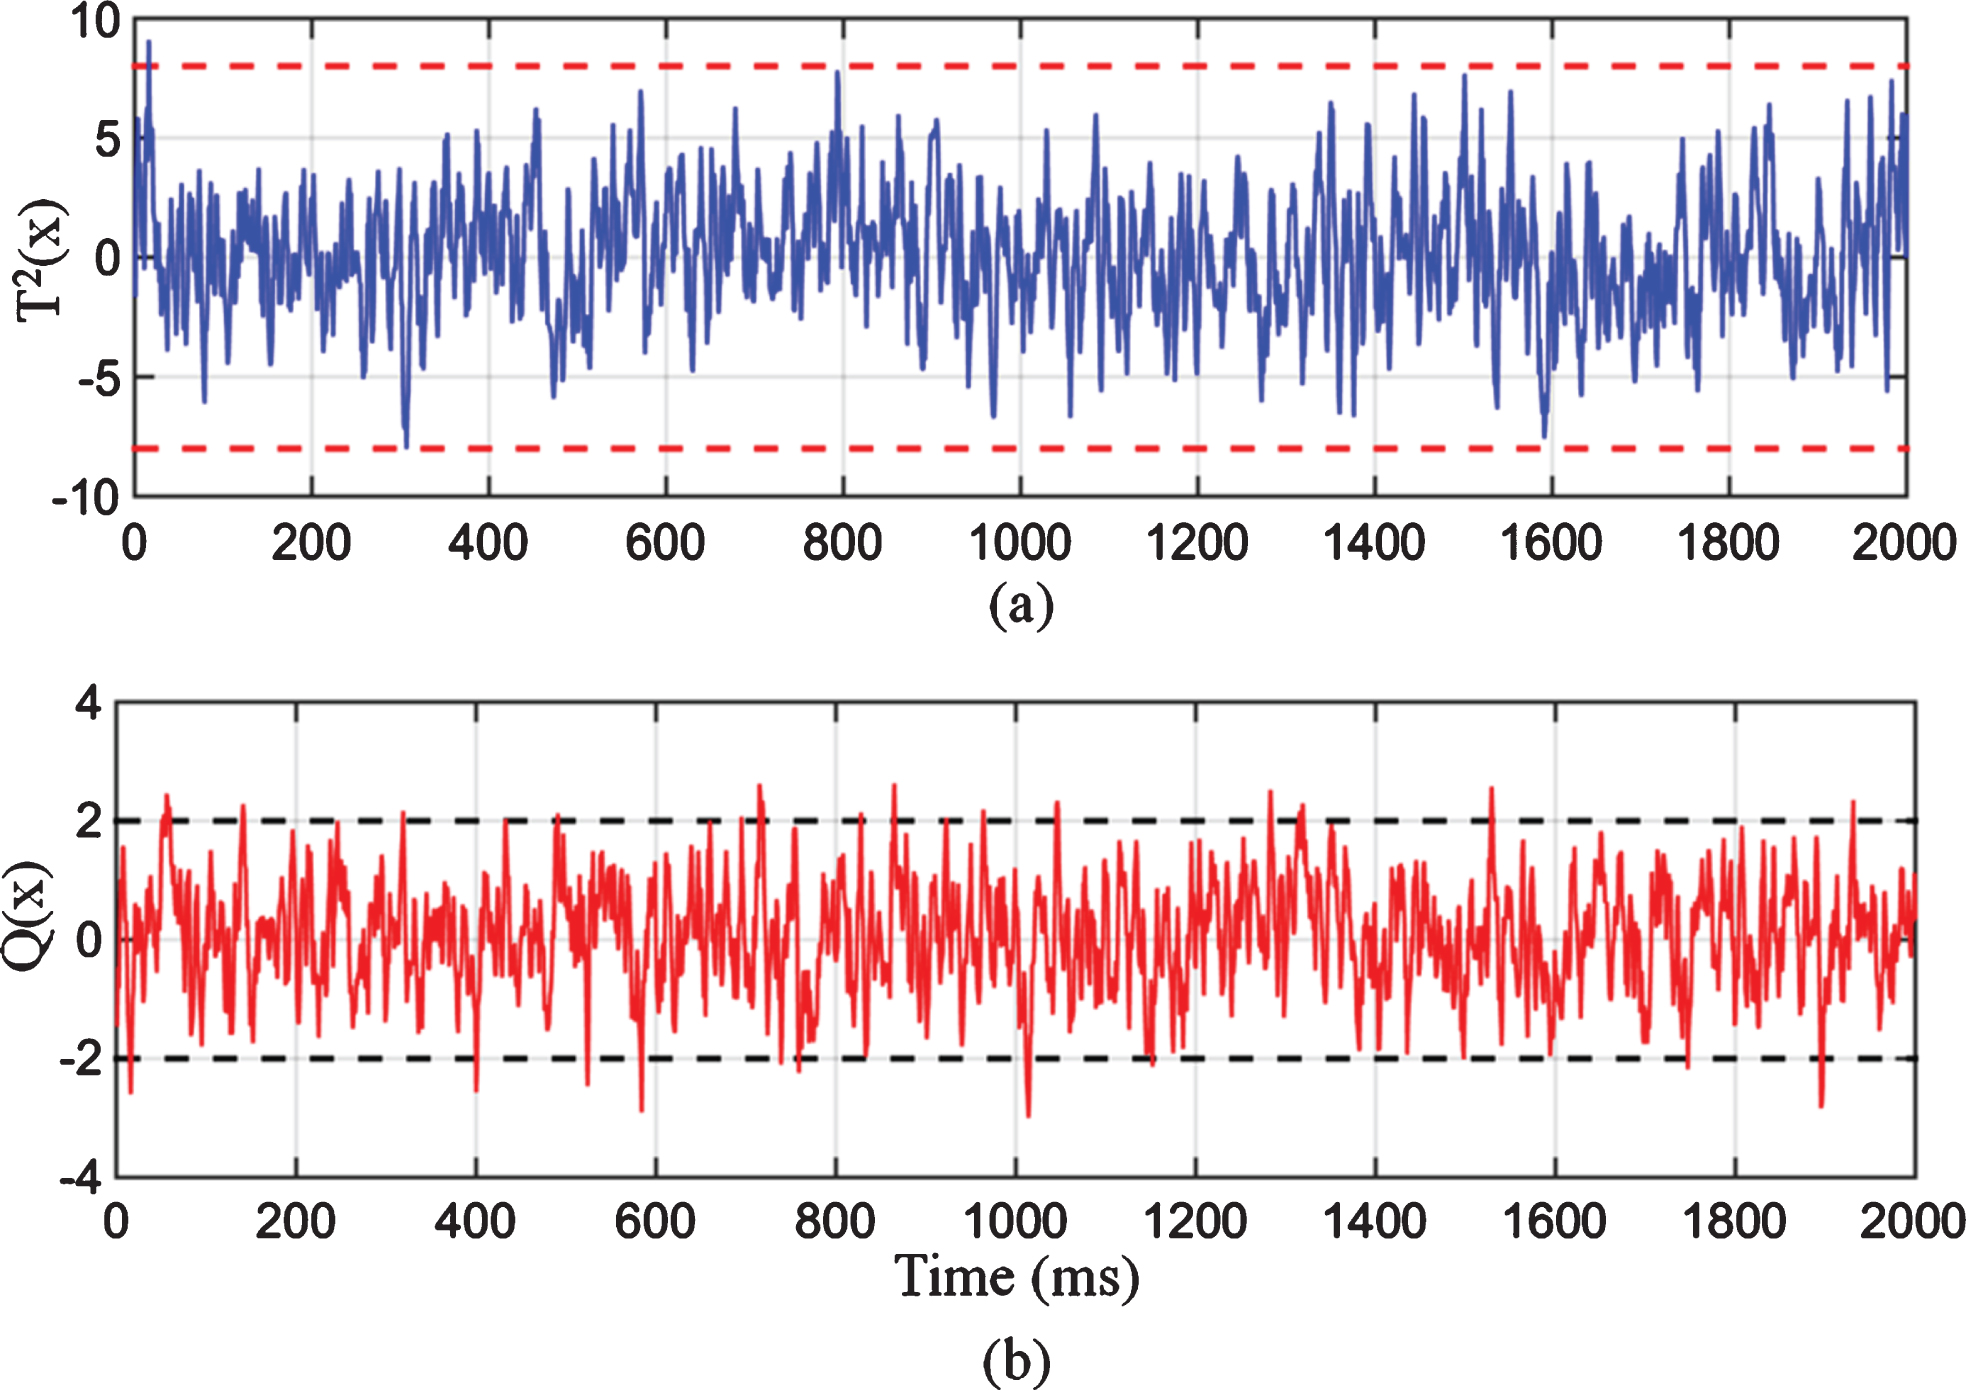
The sensors used in IoT-RMS works under high noise and humid environments. So, noise-like fluctuations are predictable during real-time signal measurement (Yabin et al., 2017). The abnormal fluctuations in the received IoT-RMS consist of singular points and random fluctuations. The monitoring result of the measured signal of the railway track is shown in Fig. 3. The results of both the T2and Q statistics are not enough to consistently alarms. As a result, the preprocessing of data is needed for IoT-RMS signal measurements. In this study, the statistics-based correlation method is used due to its simple structure and efficiency (Chunli et al., 2012). The random error from the sensors have three standard deviations (Walpole, 2012). The singular point elimination can be expressed as:
(10)
Fig. 3
Measured signal of the railway track (a) T2 statistics (b) Q statistics.
Where ki, σ, and
(11)
where αm, ψ(k) and nβαm, denotes respectively, the scale parameter, the mother wavelet, and the shift parameters. Commonly, dyadic grid values such as α and β have chosen 2 and 1. The dyadic grid wavelet function can be written as:
(12)
Fig. 4
Singular points elimination (a) deformation with crack (b) missing bolt.
The information represented by these discrete dyadic wavelets do not repeat and therefore allow complete reconstruction. The DWT for any signal y(k) can be written as:
(13)
where Dm,n is known as the detail coefficient. The detail coefficient acts as a general thresholder at each level of decomposition is generally using a universal value in order to remove the noise (Kopsinis & McLaughlin, 2009).
The hard and soft threshold values for D can be calculated as:
(14)
and
(15)
where the threshold value is represented by
(16)
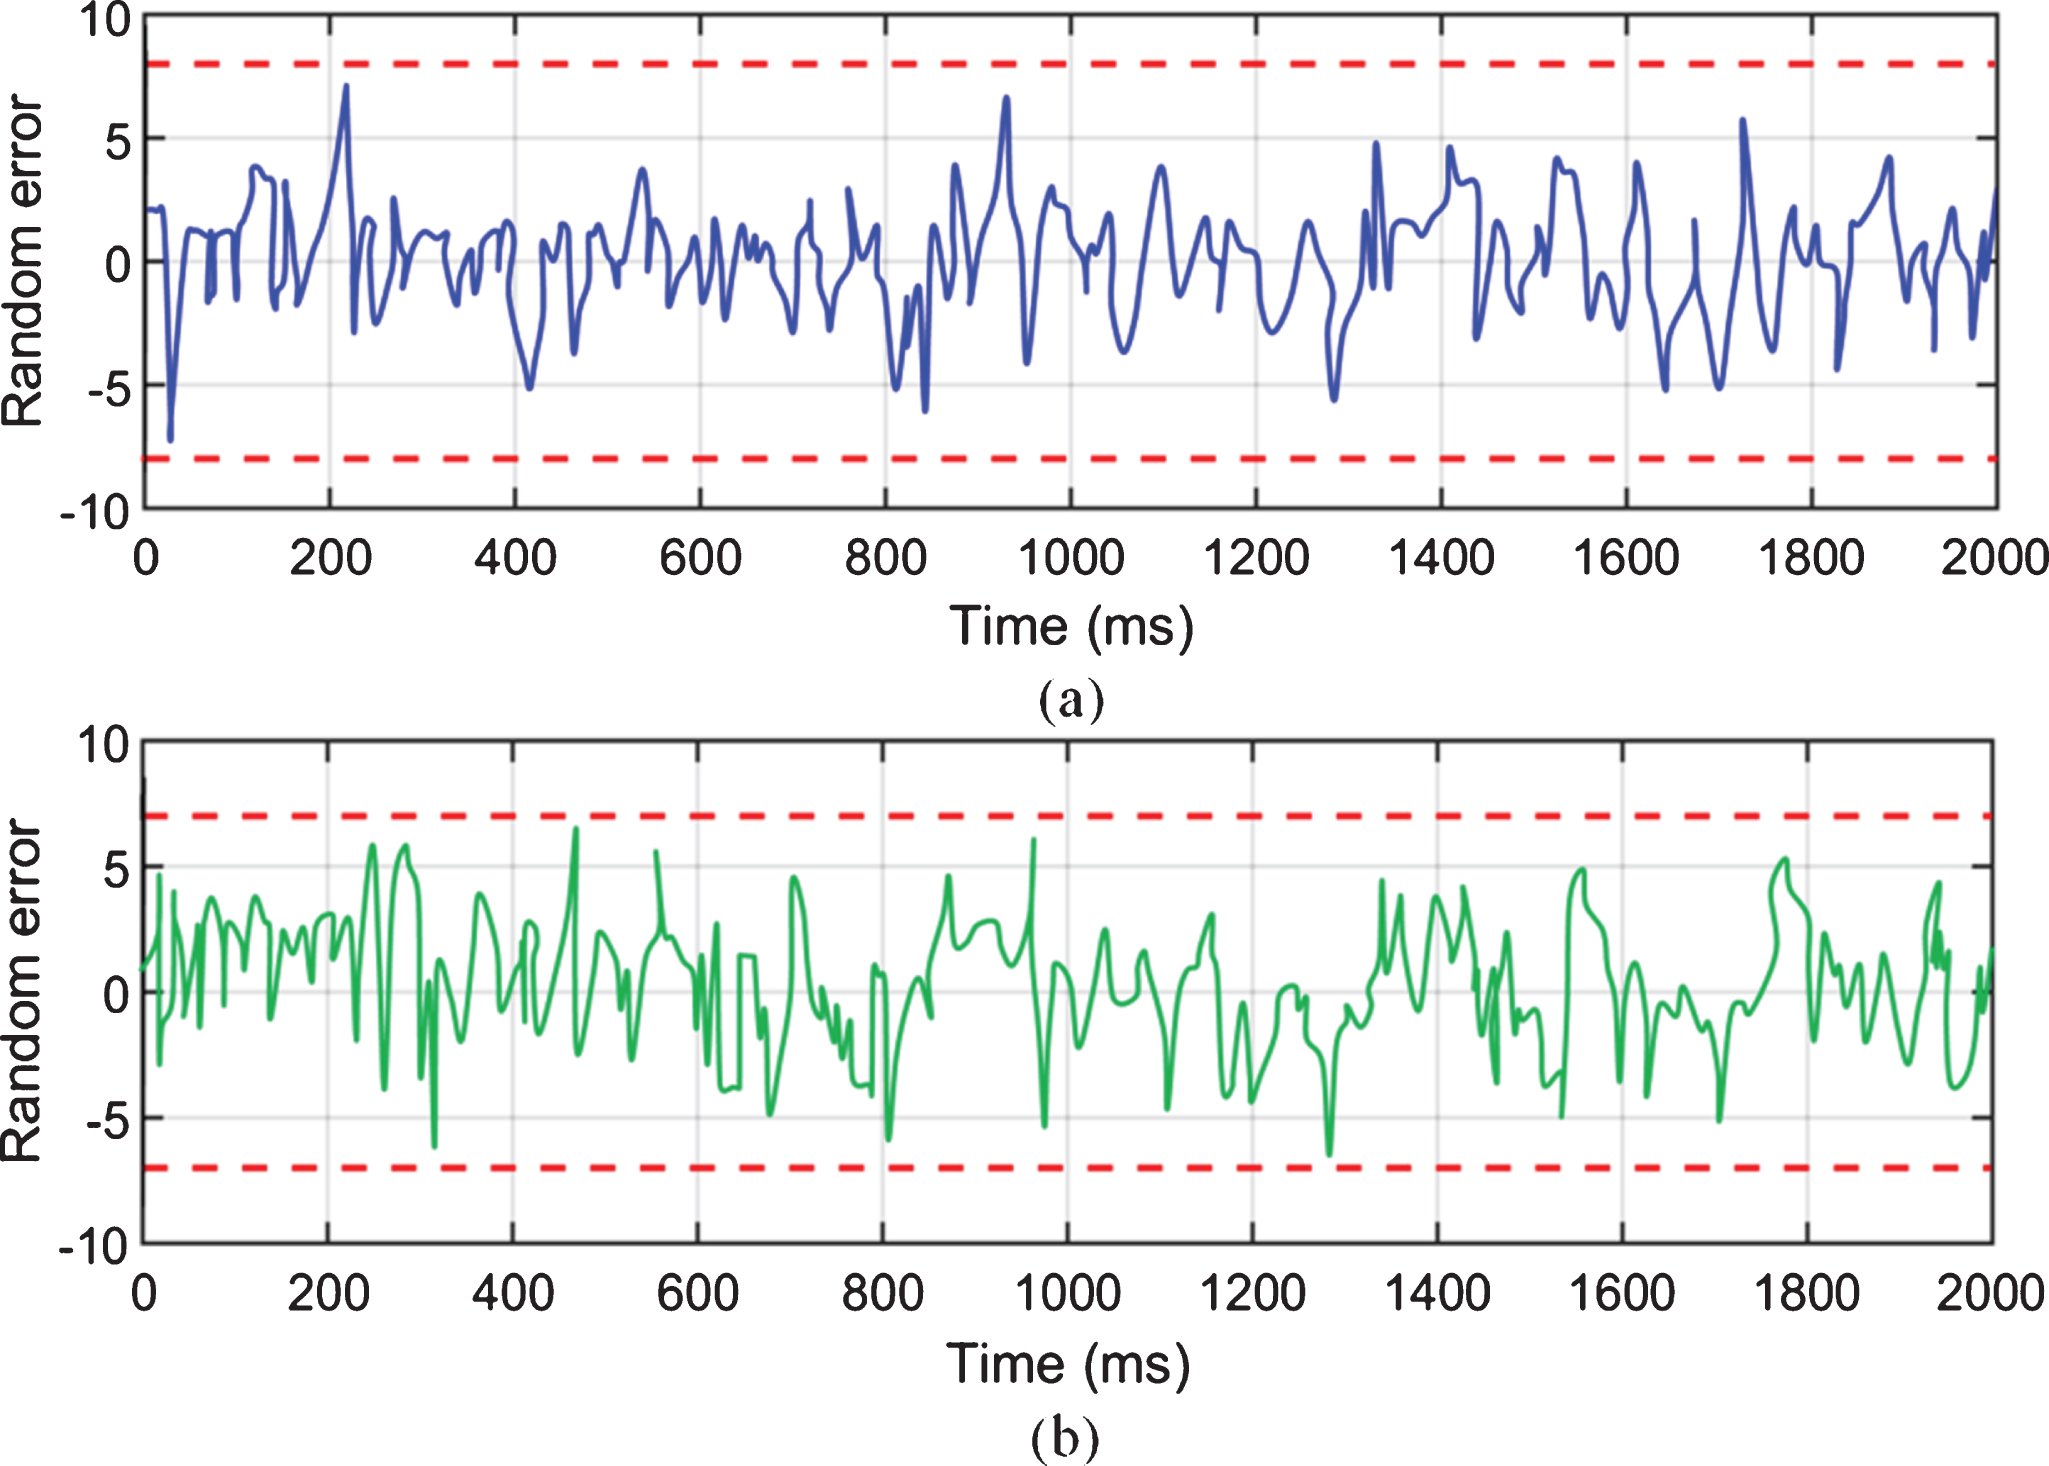
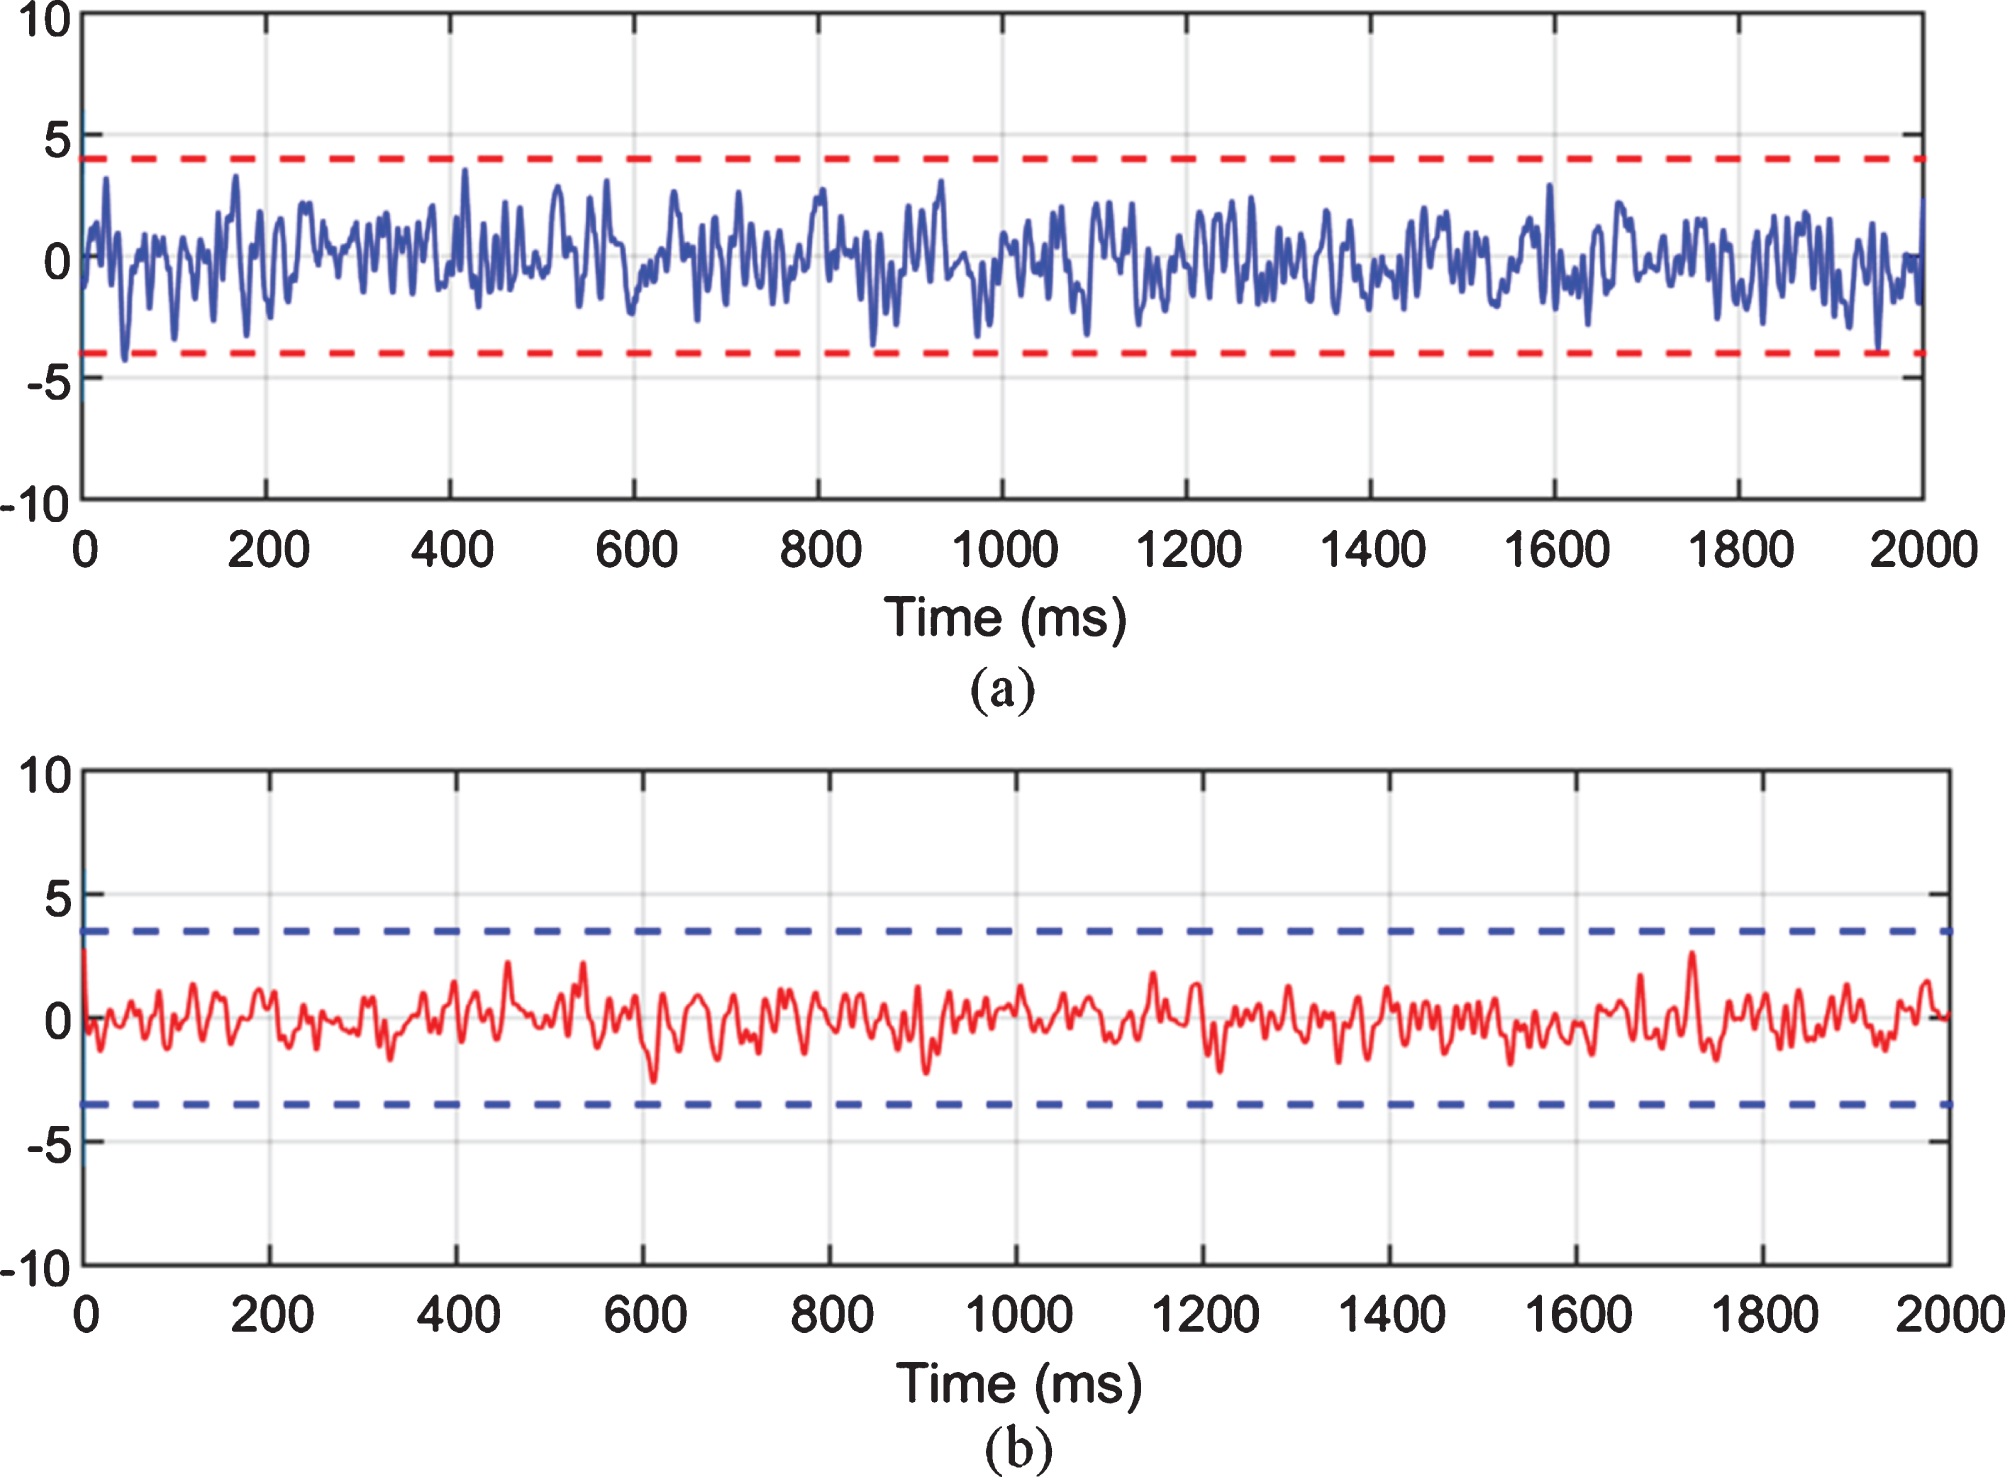
To study the effectiveness of the random fluctuations Fig. 2 is used again. The results of random fluctuation reduction from the measured signal is shown in Fig. 5. It is evident from Fig. 5 that the random fluctuation is greatly reduced. This greatly reduces Q and T2 false alarms. It can be concluded that the preprocessing is necessary for the IoT-RMS signal measurement.
Fig. 5
Reduction of random fluctuation (a) T2 statistics (b) Q statistics.
2.3Parameter selection and fault detection
After preprocessing the data of IoT-RMS, the next step is to develop a model with preprocessed data. In this study, the correlation analysis has been performed between the measured signal (m) and the track geometry measurement signal (n). Correlation refers to the relation between the coefficient of two signals (m, n) and it can be expressed as:
(17)
where
After preprocessing and selecting the parameter of the received signal of IoT-RMS, the accuracy and stability of the detection stage is improved by introducing another confidence limit. This method reduces the false alarm of T2 and Q statistics. The second confidence limit can be expressed as:
(18)
where y is the basic observation window length, x is the maximum allowable value, β is the false alarm probability, and α is the experience value determined from the model. If the false alarm signaled by the T2 and Q statistics exceed the maximum value x, then x will become the faulty true state. The track abnormality can be detected when the T2 and Q statistics exceeds the second confidence.
2.4Performance indicators
There are four different test indexes, the Mean Square Error (MSE), the Relative Error (RE), Signal to Noise Ratio (SNR), and Correlation Coefficient (CC).These are used in this evaluation between original and denoised measurements. A statistical analysis was carried out for evaluating the results of the proposed IoT-RMS. The performance of the proposed PCAM-DWT was compared with two other related methods namely, the conventional measurement (CM) and the sliding window average (SWA) method. The test was performed with the measured data and the data was recorded identify if the tracks were in a healthy condition. The MSE can be expressed as:
(19)
where Pmes and Pd represent the original and denoised data. Obviously, a smaller MSE means a smaller error. RE can be expressed as:
(20)
A traditional method to measure the noise level in the measurements is defined as:
(21)
The CC between original and denoised measurement can be expressed as:
(22)
From the definition, it can be seen that a higher CC implies a stronger relationship between original and denoised measurements.
The performance indicators for PCAM-DWT for the proposed IoT-RMS is compared with the SWA and CM methods. In the SWA method, the window length is 12. This was selected based on several experiments conducted by Pei and Guo (2001). The test values of the performance indicators for the four different cases of IoT-RMS are shown in Table 2. Table 2 shows the variations of MSE from 0.304 to 0.701; the lowest value for PCAM-DWT for all the four cases and the largest value for CM. The relative error of the proposed method was the lowest followed by SWA and CM. This indicates that the proposed PCAM-DWT provides higher SNR and CC compared to other methods. Based on the definition of the performance indicators, the proposed PCAM-DWT provides a better denoising effect and it is suitable for IoT-RMS.
Table 2
Test results of different performance indicators for the four test cases
| Abnormalities | Methods | |||||
| CM | SWA | PCA-DWT | CM | SWA | PCA-DWT | |
| MSE | RE | |||||
| Deformation with crack | 0.638 | 0.431 | 0.372 | 3.025 | 2.849 | 2.683 |
| Rusty deformation on rail top | 0.701 | 0.528 | 0.34 | 2.973 | 2.628 | 2.392 |
| Loose bolts | 0.679 | 0.420 | 0.351 | 2.893 | 2.710 | 2.471 |
| Missing bolt | 0.592 | 0.398 | 0.304 | 3.172 | 2.921 | 2.729 |
| SNR (dB) | CC | |||||
| Deformation with crack | 62.7 | 65.2 | 74.5 | 0.893 | 0.953 | 0.982 |
| Rusty deformation on rail top | 67.4 | 68.9 | 80.2 | 0.875 | 0.937 | 0.975 |
| Loose bolts | 65.8 | 71.8 | 76.4 | 0.892 | 0.952 | 0.986 |
| Missing bolt | 67.1 | 67.4 | 84.8 | 0.873 | 0.963 | 0.974 |
3Cloud architecture
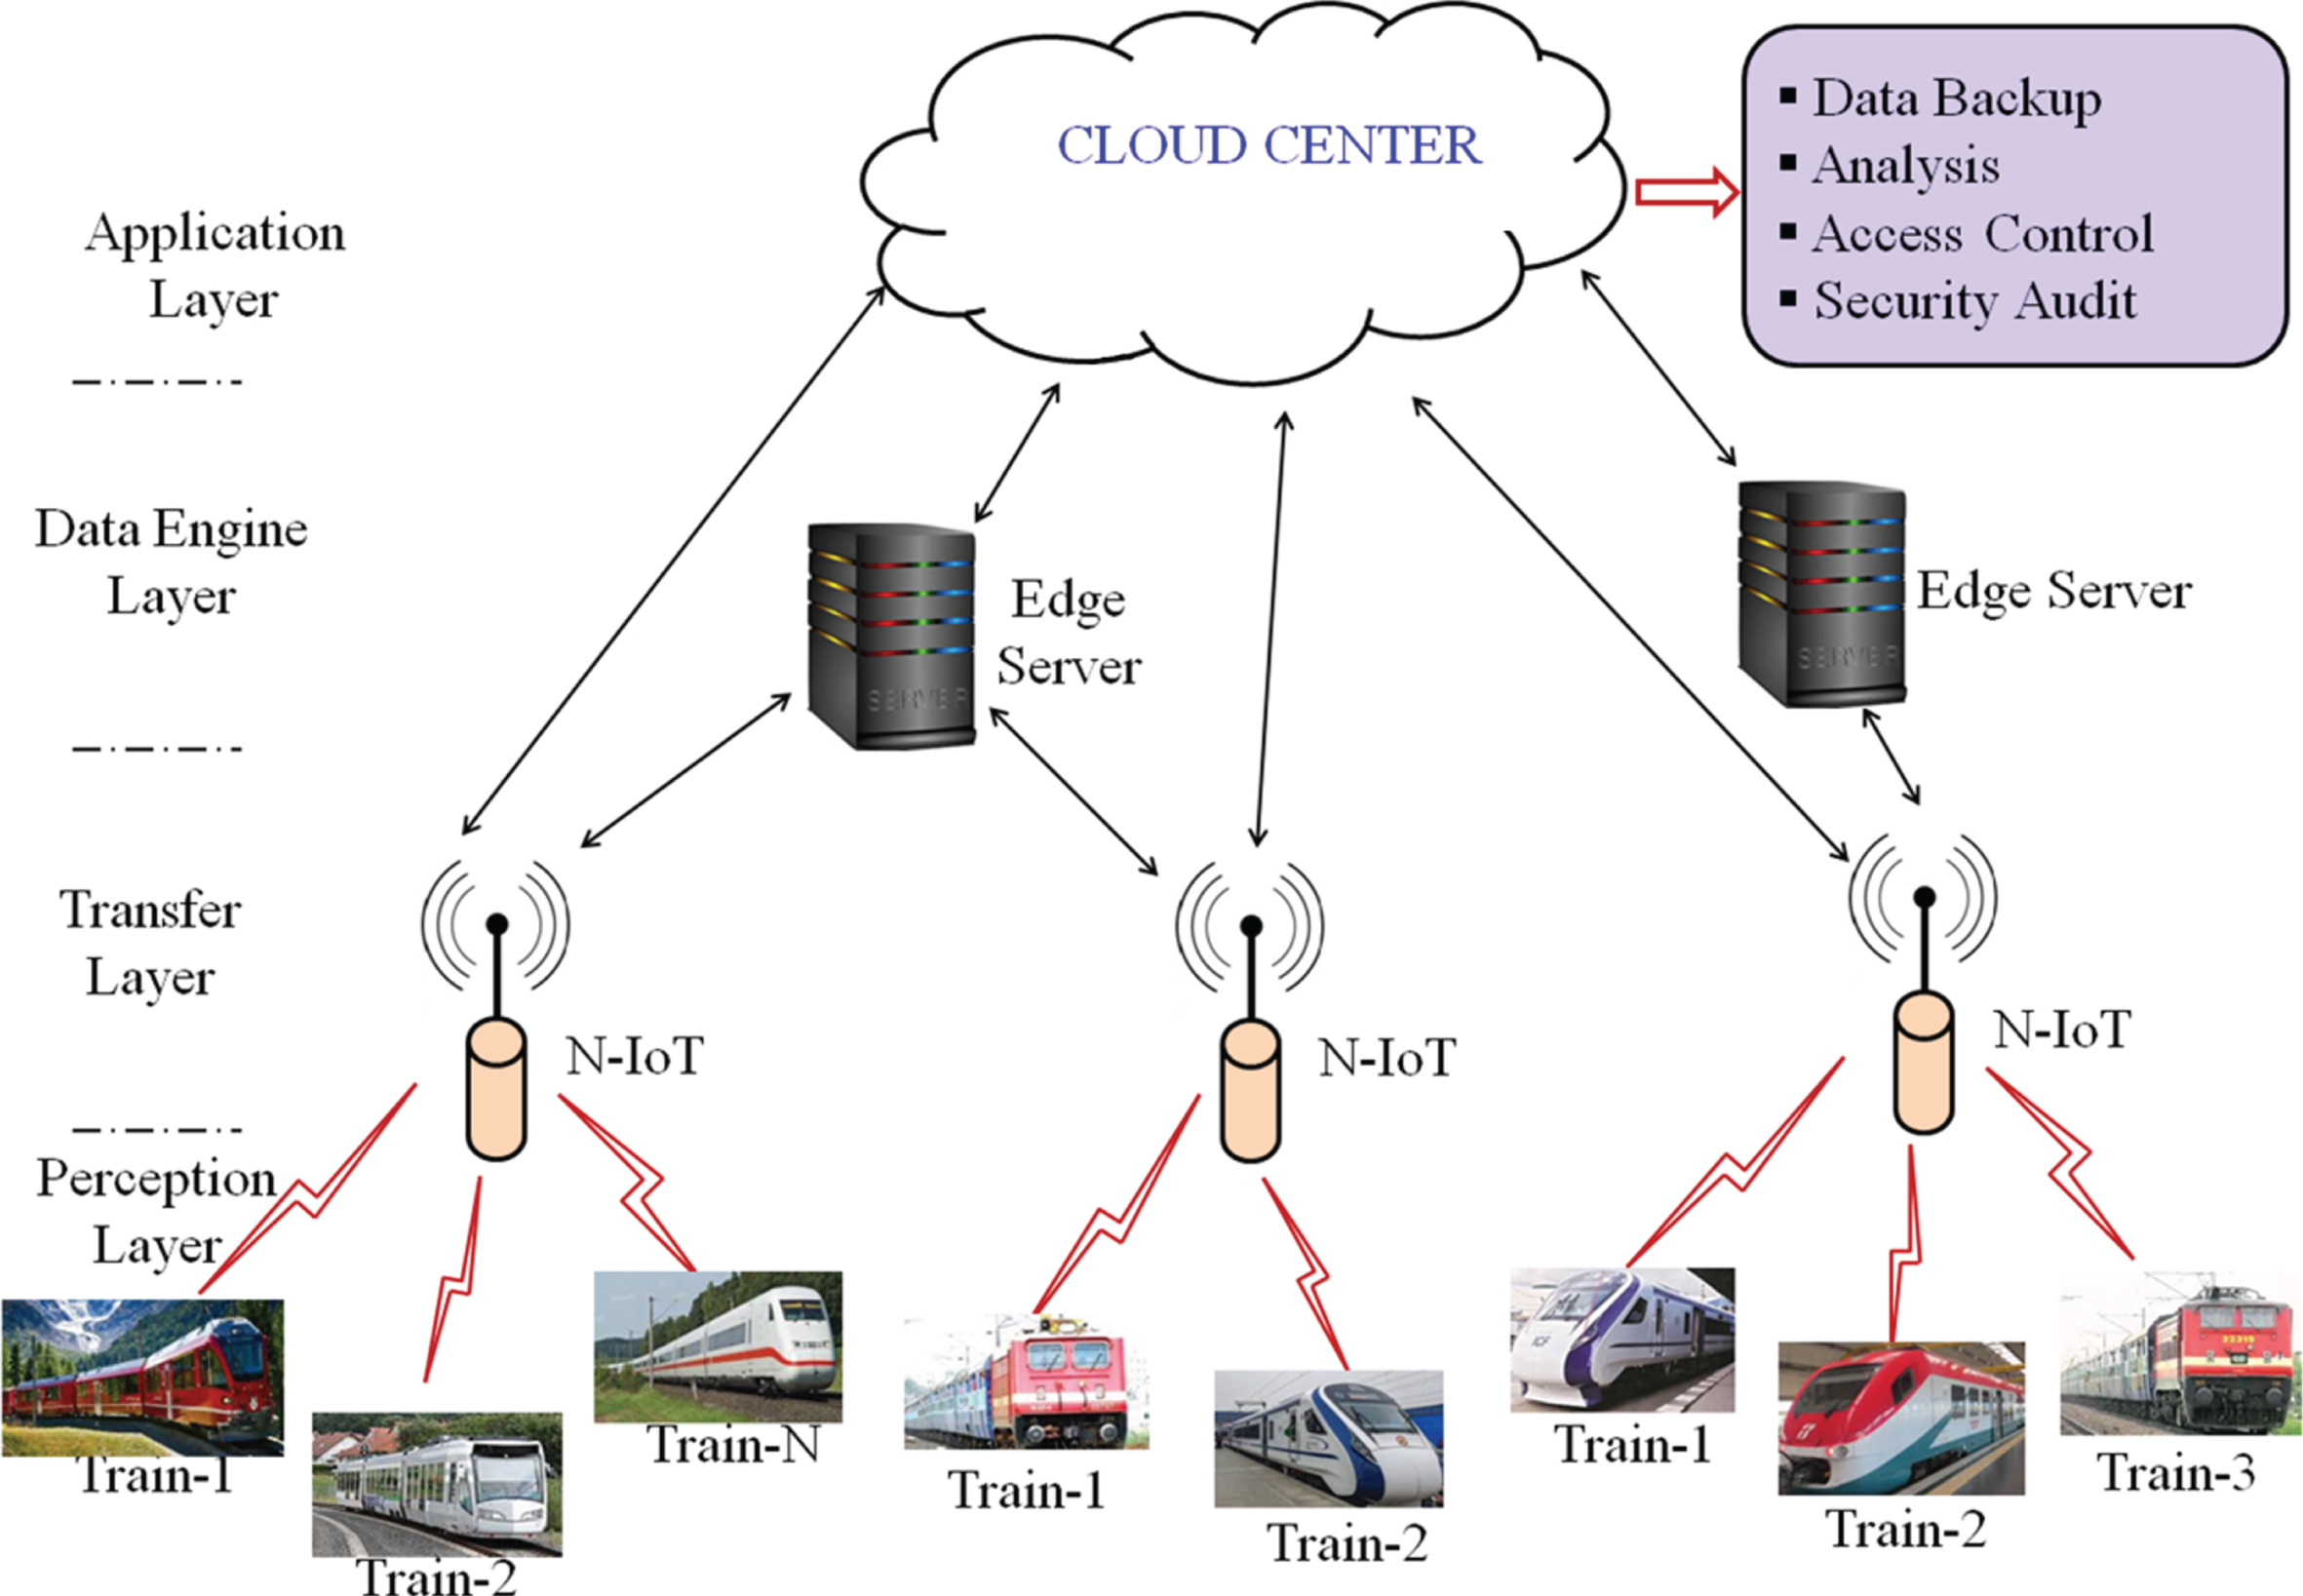
IoT based railway track monitoring systems present in the trains are connected to the cloud server. The controller of the track monitoring system performs various operations, namely, abnormal location identification, updating of the cloud server, and duplication monitoring. The event hub is placed to receive the data from different tracks. It can capture thousands of events and handle multiple applications (Xiaowei et al., 2017). A SQL warehouse stores the data as big data analyzes it for load forecasting, visual data, and control, etc. If further action in required, results are shared with the central control office. The generic architecture of the IoT-RMS is shown in Fig. 6. The architecture has four layers: a perception/action layer, a transfer layer, a data engine layer, and an application layer. These are discussed in the following sections.
Fig. 6
Proposed architecture for smart track monitoring system.
3.1Perception and action layer
Apart from on-board railway track monitoring via sensors, the network also receives information from different sensors such as sensors mounted in infrastructure, environmental sensors, and the detectors that gather information from the rail passengers. Other key parameters, namely, bogie conditions, bearing temperature, power supply voltage, and the amount of air braking are obtained from the different sensors mounted in a modern train. These parameters help identify the exact condition of the train. In this study, the condition of the railway tracks is measured through an accelerometer and analyzed by the controller present in each train. The controller sends the abnormality information with the location coordinates to the transport layer for further operation. Various trains are linked wirelessly to a local node. The node can identify the trains through its ID number.
3.2Transfer layer
On receipt of the data from the perception layer, it is first pre-processed for meeting the requirements of the upper layers. For example, information relating to the status of the train is transferred to the data server. Train-ground wireless networks such as GSM-R network, long-term evolution for railways (LTE-R) networks, or 4G/5G networks are used for sending information relating to the track condition, air brake pressure, and bearing temperature to the core network (Huansheng et al., 2020). Then, the representative node transmits the compressed data to the core networks. This reduces the amount of data exchanged between the sensors and the networks. Thus, it is a heterogeneous architecture considering the existence of various data sensing and transfer networks. The key status would need to be updated to the control center so the necessary steps can be taken within a short span of time. This means that data transfer must be highly efficient. It is essential that the data transmission link is robust. The link must withstand extreme network situations like fast fading, shadowing, and high Doppler frequency shifts. Additionally, the network must be elastic in order to enable the accommodation of a larger number of sensors and monitors. In general, the network should be robust, elastic, and stable in order to adapt to various situations.
3.3Data engine layer
Data from the different sources should be processed before it is used by the applications. Smart railway data has the following characteristics. 1) Data may be a number, text, audio, video, and image. It can be structured, semi-structured or unstructured data. 2) Huge data in the range of a few dozen terabytes to petabytes are available. For example, 10 million status records are produced by Beijing-Shanghai high-speed trains every day. 3) Data may be from different places which include headquarters, local offices, and divisions.
Intelligent data processing such as distributed storage, noise filtering, data fusion, information indexing, data mining, visualization, etc is performed by the data engine layer (Sunitha et al., 2019). The collected data should be stored in the network for easy access. In the smart railways, sources of the data are distributed and have decentralized control. The data source can generate and collect information in the absence of any centralized control. Google has proposed MapReduce to provide a parallel processing model. This will allow a large amount of data to be processed by its associated implementation. Multiple layer architecture is used for overcoming the issues relating to big data. Multiple servers store the data so that the parallel execution increases the processing speed using the Map Reduce and Hadoop frameworks. These types of multiple layer architectures are necessary for any smart railway.
3.4Application layer
Customer service and inspection of infrastructure smart railways use advanced technologies such as sensors, communications, intelligent controls, and computing for the performance of various functions like train control and dispatch. Applications of smart railways are train-related, infrastructure-related, and passenger and freight-related.
4Signal coverage problems
When a train goes through tunnels, mountains, and thick forest areas, the signal grows weak and the controller cannot easily identify them. Consequently, it becomes challenging to determine the correct location of vibrations. Therefore, there is a need to consider this problem while calculating the location of vibrations.
4.1GPS coverage problem
GPS module DSM132 has more accuracy and less tolerance (up to 10 cm). This allows it to be used in this study. When a train passes through forests and hilly regions, the GPS signal is reduced. This makes it difficult to find the exact location of irregularity (Schlain et al., 2015 & Mohsen et al. 2016). Thus, a new method for determining the location is introduced in this study. Even when the GPS signal is low, proximity sensors are interfaced with the controller to determine the location of abnormalities (LOA). The proposed system immediately activates the proximity when the GPS signal is low.
A GPS signal is essential for the calculation of the LOA. GPS signal coverage area and estimation of LOA are shown in Fig. 7. The proximity sensor which is mounted in a wheel disc produces one pulse per rotation. The controller counts these pulses and determines the distance of the uncovered region by the GPS. Distance (X1) is estimated as
(23)
where n is the number of pulses produced by the proximity sensor and k is the circumference of the disc. LOA is estimated as
(24)
Fig. 7
GPS coverage problem and estimation of LOA.
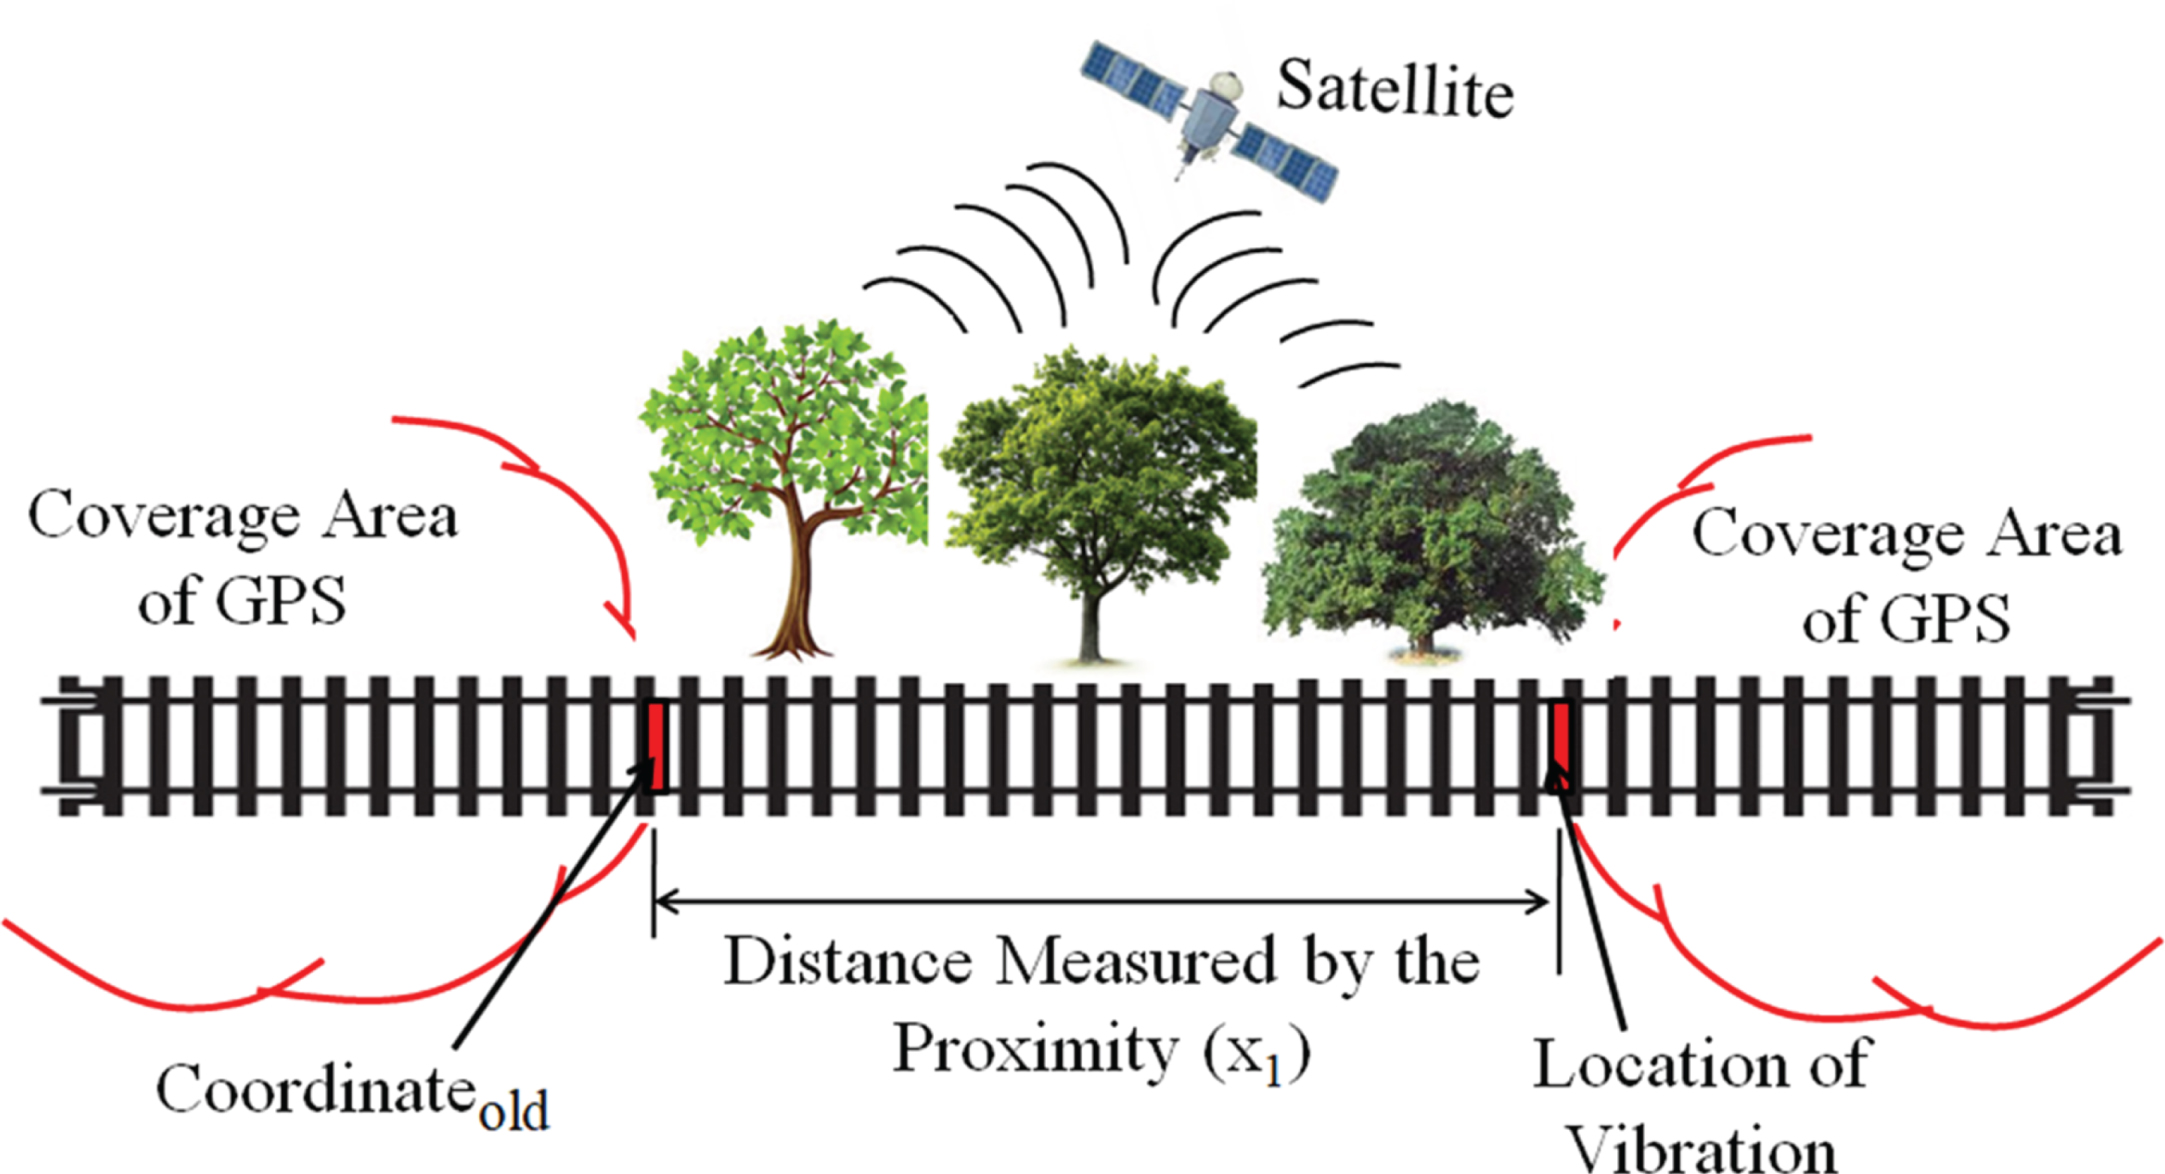
where Coordinateold denotes the location where the GPS signal goes absent and X1 is the distance from Coordinateold to the abnormality location. For example, if D = 6 km then the abnormality location is determined by adding 6 km to the previously stored coordinates. Table 3 shows the different signal status and the corresponding operations done by the controller. In the first case, when the GPS signal is absent, IoT-RMS immediately turns on the proximity sensor to determine the location of abnormality based on (15). In the second case, the controller sends the abnormality location without any problem when the GPS and communication signals are present. In the third case, the controller stores the LOA when the GPS is present and the communication signal is absent. Data is then sent to the cloud when the signal is available. In the final case, both GPS and communication signal are absent and it automatically switches the proximity on, stores the location of the abnormality, and sends it to the cloud when the communication signal is available. The route of the train is defined at the starting time so that no confusion will come in the direction of LOA from Coordinateold.
Table 3
Status of GPS, GSM, proximity sensor, and the controller operation
| DGPS Signal | Communication Signal | Controller Operation | Condition of Proximity |
| Not Present | Present | Estimate the location of vibration based on (2) and send to the cloud. | ON |
| Present | Present | Send GPS coordinates if vibration present | OFF |
| Present | Not Present | Store GPS coordinates if vibration present | OFF |
| Not Present | Not Present | Store the location of vibration and switch on the proximity and store the location if abnormality is detected. | ON |
5Simulation and experimental results
5.1Experimental setup
In this section, the prototype of the proposed system is analyzed and presented with different experiments that are performed by sending the alert notice to other trains that pass through the location. This helps the driver plan ahead and avoid derailment. Four different experiments were conducted to look at the effects of visible damage (missing bolt), invisible damage (loose bolts and battered rail surface), rusty deformation on rail top, and deformations with. The proposed method was also performed at three different speeds; 20 km, 45 km, and 80 km. A huge amount of data, approximately 78 GB, was stored on 27 January 2018. Four different places around Chennai were selected for two-way travel in the same route and the location of the abnormalities were noted. The field tests for manipulated variables were performed near the industrial city of Tamilnadu. To start, the tests were performed under normal conditions as a control. Four routes; Chennai Beach to Chennai Central (A), Chennai Central to Egmore (B), Pallavaram to Trisulam (C), and Tambaram to Chengalpat (D) were chosen for the study. At these locations, the abnormality detection system was tested for its efficiency and accuracy.
5.2Performance of Proposed PCAM-DWT
To verify the detection capability of PCAM-DWT used in the proposed IoT-RMS with two scenarios (deformation with crack and missing bolt) are considered. Here signals with a duration of 2000 milliseconds were taken near the abnormalities for ease of understanding. In the first scenario, artificial drifts were imposed on the accelerometer signal received from the deformation with a crack at the 7500th sample point and missing bolt for the 2700th sample point. In the simulation, the drift grows to 0.15% for the deformation with crack and 0.156% for missing bolt measurements. For both the cases, the small drift alters the measurement that is unnoticeable in the time profile as shown in Fig. 8. Figure 8 indicates that the T2 statistic has not exceeded the limit during the test. On the other hand, the Q statistics have negligible variation.
Fig. 8
T2 and Q statistics with 0.15 % drift (a) deformation with crack (b) missing bolt.
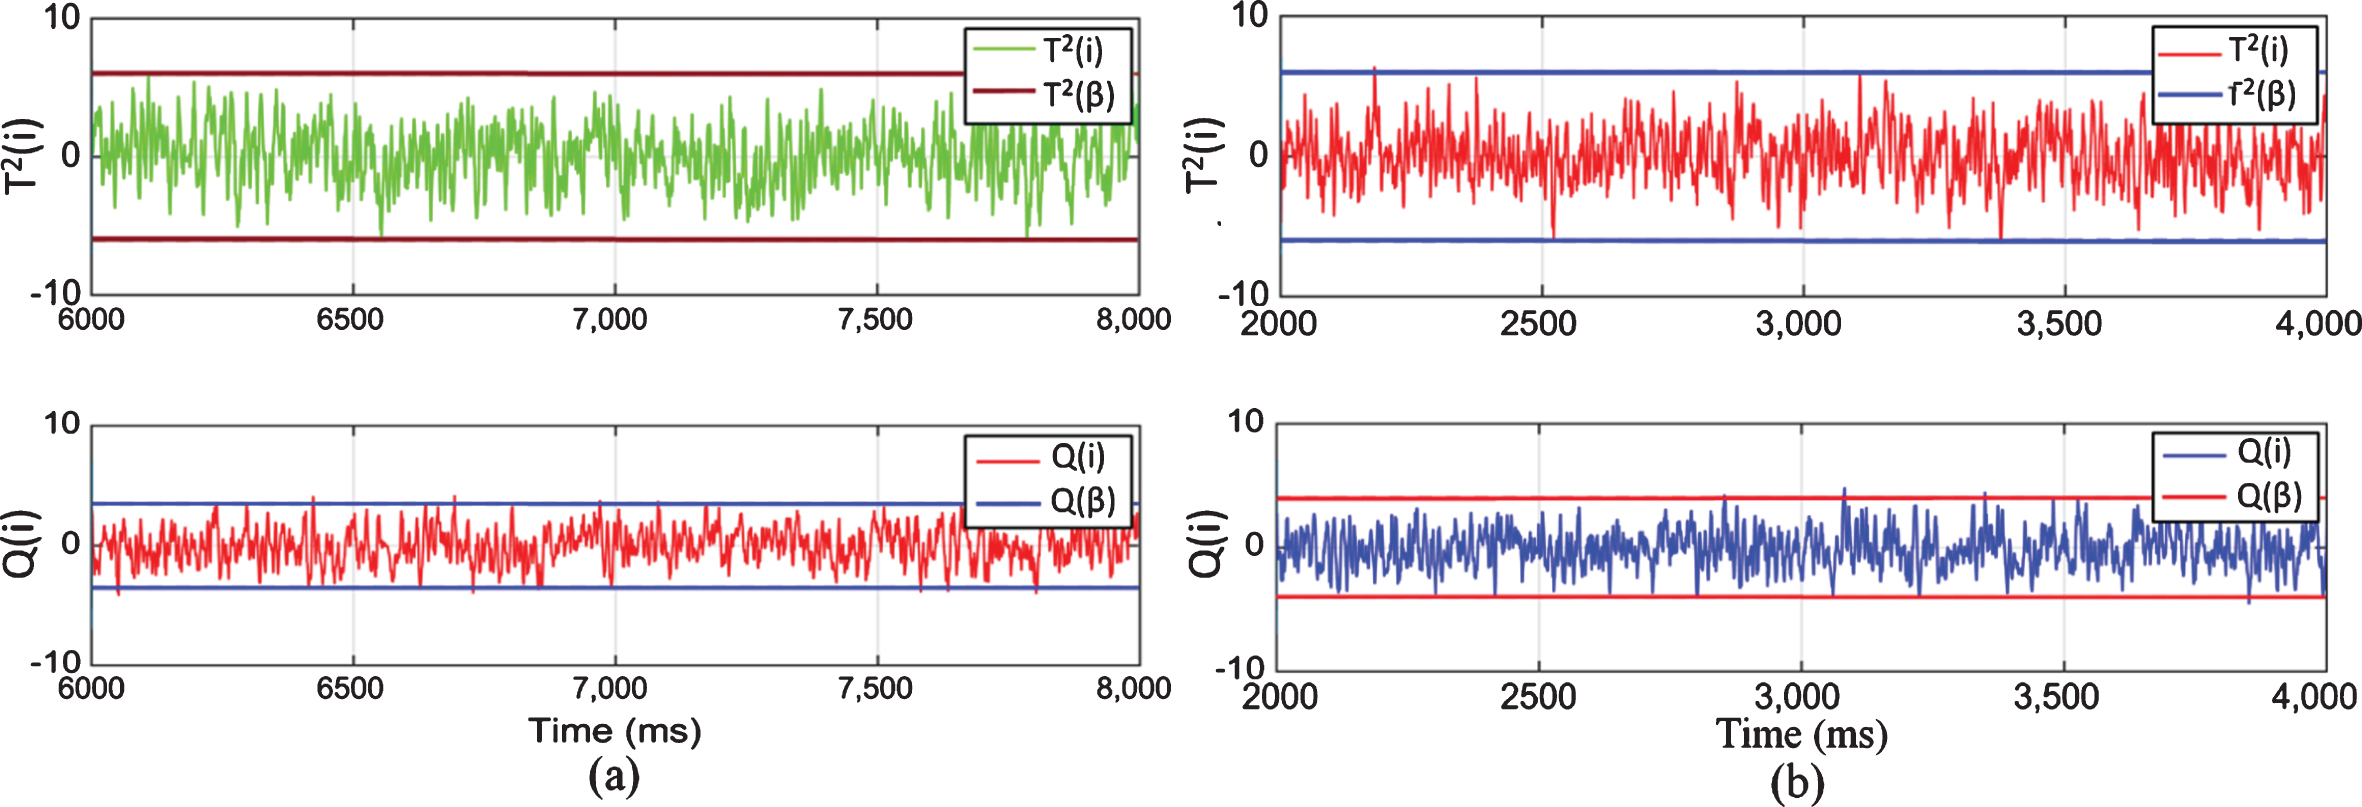
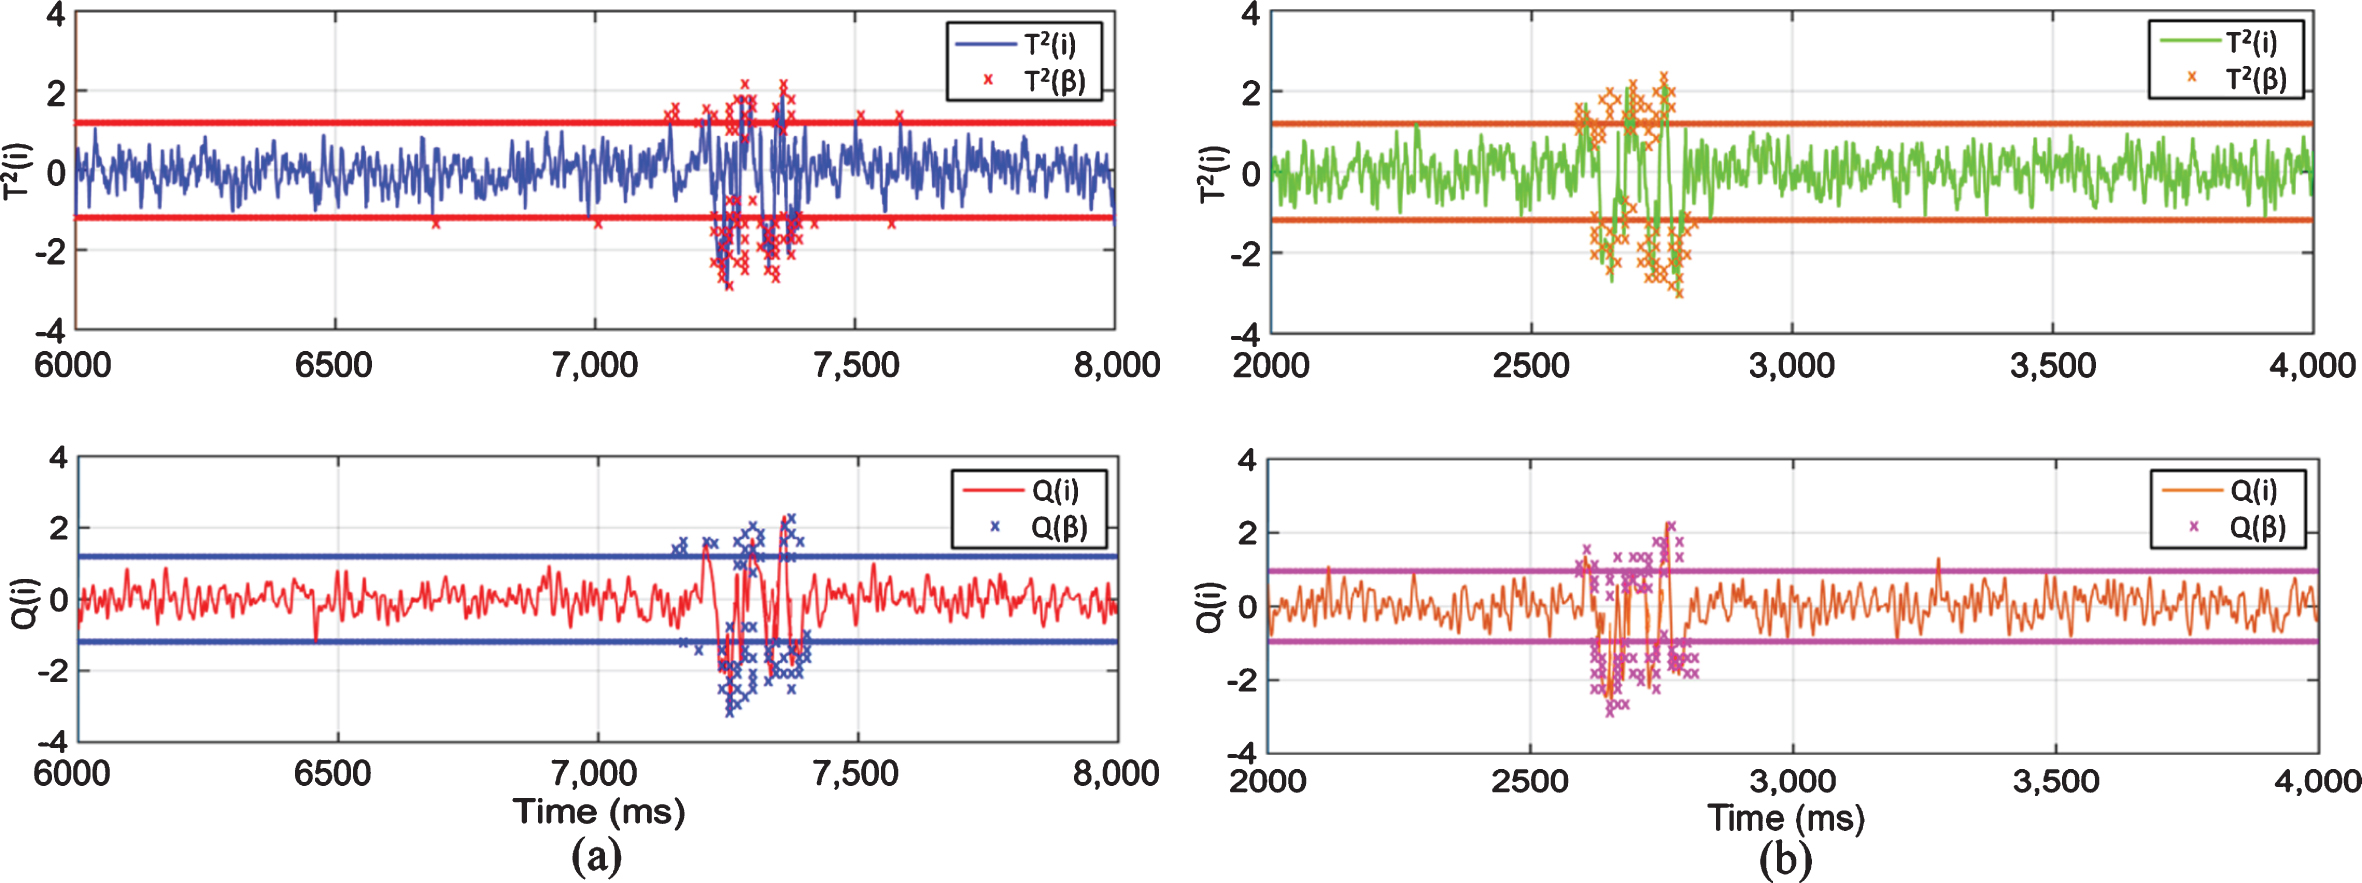
In the second scenario, drift grows to 1.25 % for the deformation with a crack at the 7500th sample point and missing bolt for the 2700th sample point. The measurement can be seen in the time profile and is shown in Fig. 9. Figure 9 indicates that both the T2 and Q statistics have exceeded the limit during the test at the corresponding sample point. The T2 statistics exceed 2.24 % in the deformation with crack and 3.73% for missing bolt cases. The Q statistics exceed 4.36 % in the deformation with crack and 4.49% for missing bolt cases. It is evident that T2 and Q statistics for both the deformation with crack and missing bolt cases exceeds only in the abnormal points and not exceeded due to large variation in the amplitude.
Fig. 9
T2 and Q statistics with 1.25 % drift (a) deformation with crack (b) missing bolt.
5.3Performance of IoT-RMS
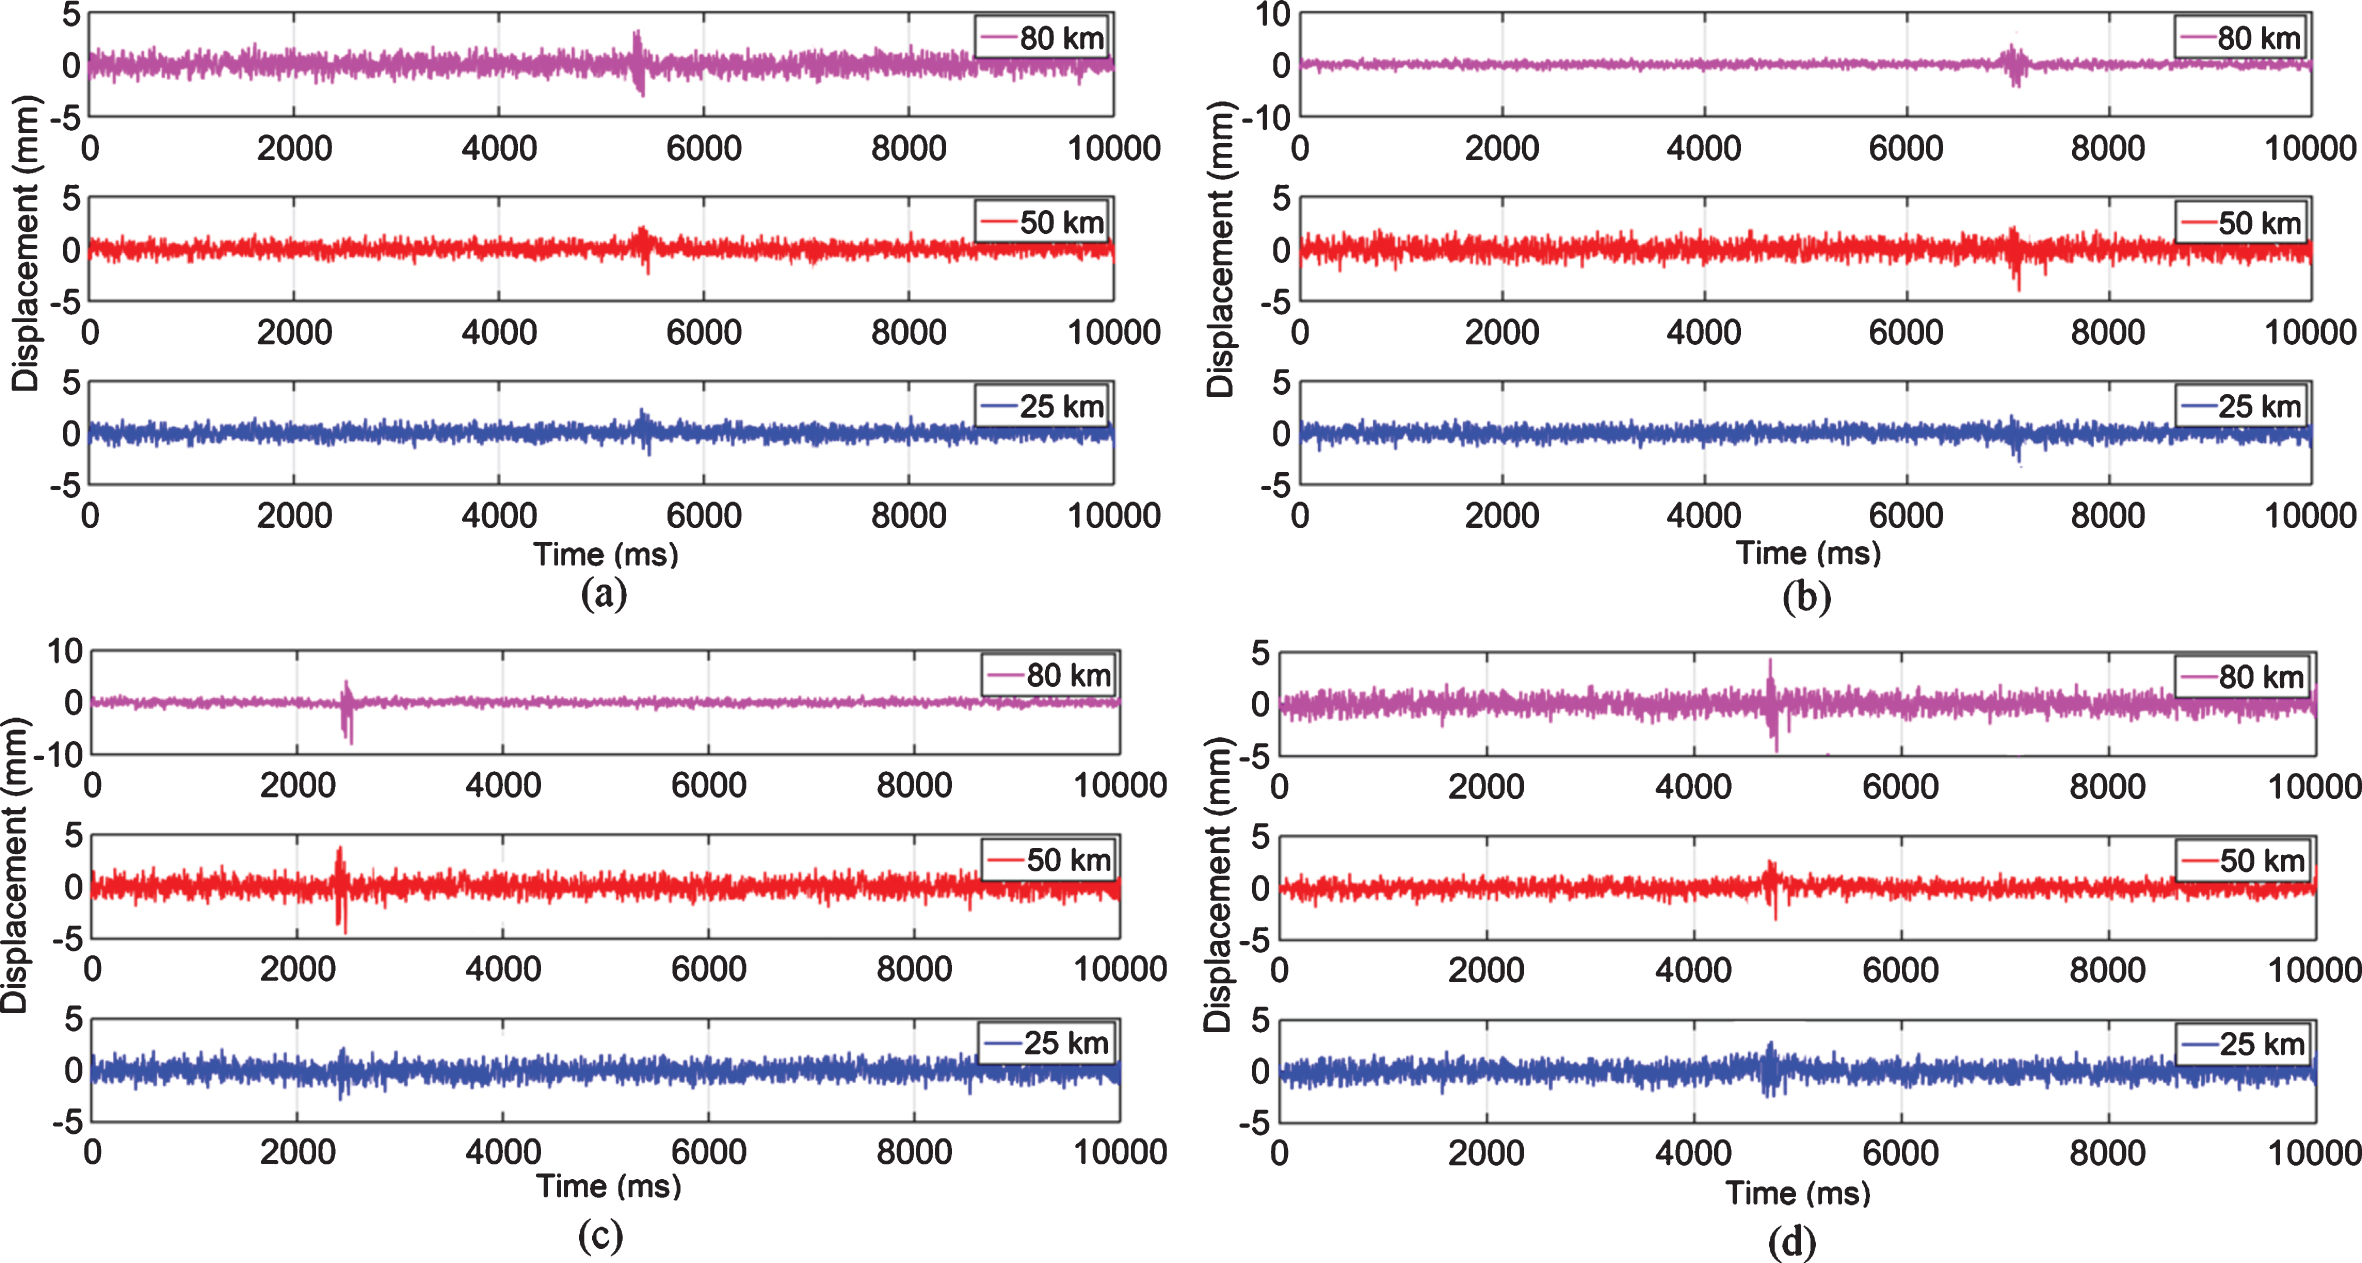
Acceleration of the train is measured by the MEMS accelerometers. The measured acceleration is applied to PCAM-DWT and correlation analysis was performed. The correlation analysis has been performed between the measured signal and the track geometry measurement signal (for more details refer to section 2.3). The track abnormality can be detected when the T2 and Q statistics exceeds the second confidence. Figure 10 shows the abnormality measured by the axle box accelerometer during the departure of the train for four different locations (locations: A, B, C, and D) under various speeds. Figure 10 (a) and (b) show the accelerometer signal for visible and invisible damage for three different speeds. The figure shows the signal level of invisible damage as less than the visible damage and the abnormalities present at 7 km and 6.2 km respectively from the start of the track for all the speed. Figure 10 (c) shows the abnormality for deformation with a crack for three different speeds. It shows abnormality at 3.8 km from the start of the track for all the speeds. Figure 10 (d) shows the abnormality for rusty deformation on the track top and the irregularity seen in 5.3 km for all the speed scenarios.
Fig. 10
Abnormality in axle box mounted accelerometer during departure (a) invisible damage (loose bolts and battered rail surface) (b) visible damage (missing bolt) (c) deformation with crack (d) rusty deformation on rail top.

Figure 11 shows the abnormality measured by the axle box accelerometer during the arrival of the train for four different locations (locations: A, B, C, and D) under three different speed scenarios. Comparing Fig. 10 and 11 the accelerometer signal received from both the departure and arrival of the same route indicates that the presence of abnormality. Figure 10 and 11 show the accuracy of the proposed method.
Fig. 11
Abnormality in axle box mounted accelerometer during arrival (a) invisible damage (loose bolts and battered rail surface) (b) visible damage (missing bolt) (c) deformation with crack (d) rusty deformation on rail top.
5.4Experimental results
The prototype of the proposed system developed uses the ARM processor (LPC2148) and has been deployed on the super-fast train (26142). The acceleration signal was recorded for different test cases under running conditions. Figure 12 shows the experimental setup and the coordinates for the location of the abnormality. Figure 13 shows the different locations of abnormalities such as the missing bolt at location A, loose bolts at location B, deformation with a crack at location C, and severe plastic deformation on rail top at location D.
Fig. 12
Experimental Setup of the proposed IoT-RMS.
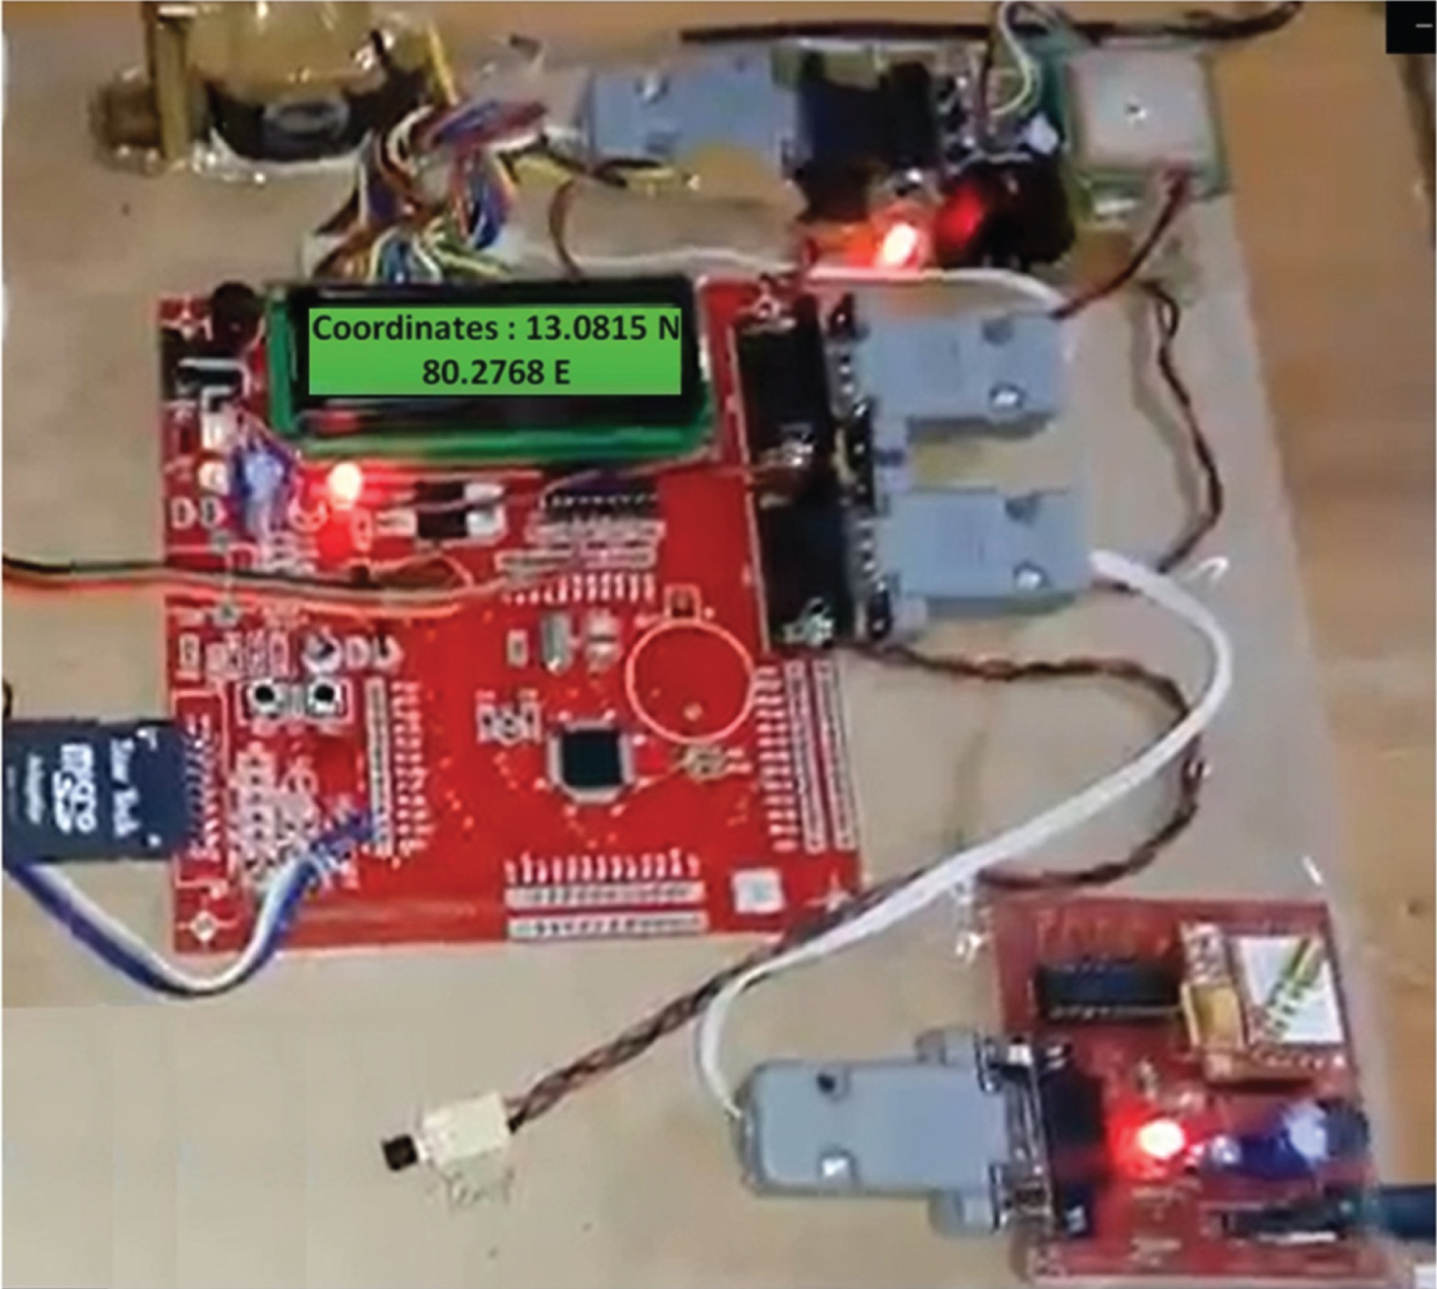
Fig. 13
Experimental results for different location of abnormalities with coordinates: (a) visible damage (missing bolt) (b) Invisible damage (loose bolts and battered rail surface) (c) deformation with crack (d) rusty deformation on rail top.

Accelerometer data were recorded and analyzed for the four abnormality cases. The test was done on 27 January 2018 and the values for a particular test track were collected. The controller finds the abnormal condition when the signal exceeds the second confidence level and records the location using GPS. Figure 13 shows the experimental results in a zoomed view for various track irregularities. Figure 13 (a) shows the presence of the irregularity in the coordinate 13.0815° N & 80.2768° E. When these coordinates were compared with the predefined values, they found to be almost the same with only 1 m variation from the fault location. Recorded invisible damage coordinates are shown in Fig. 13 (b). This shows abnormality present in the coordinate 13.0739 N & 80.2618 E. The coordinates of deformation with crack and rusty deformation on rail top are shown in Fig. 13 (c) and (d). It shows the presence of the abnormality in 12.9679 N & 80.1484 E, 12.9336° N & 80.1020° E. These values exactly match with the predefined values.
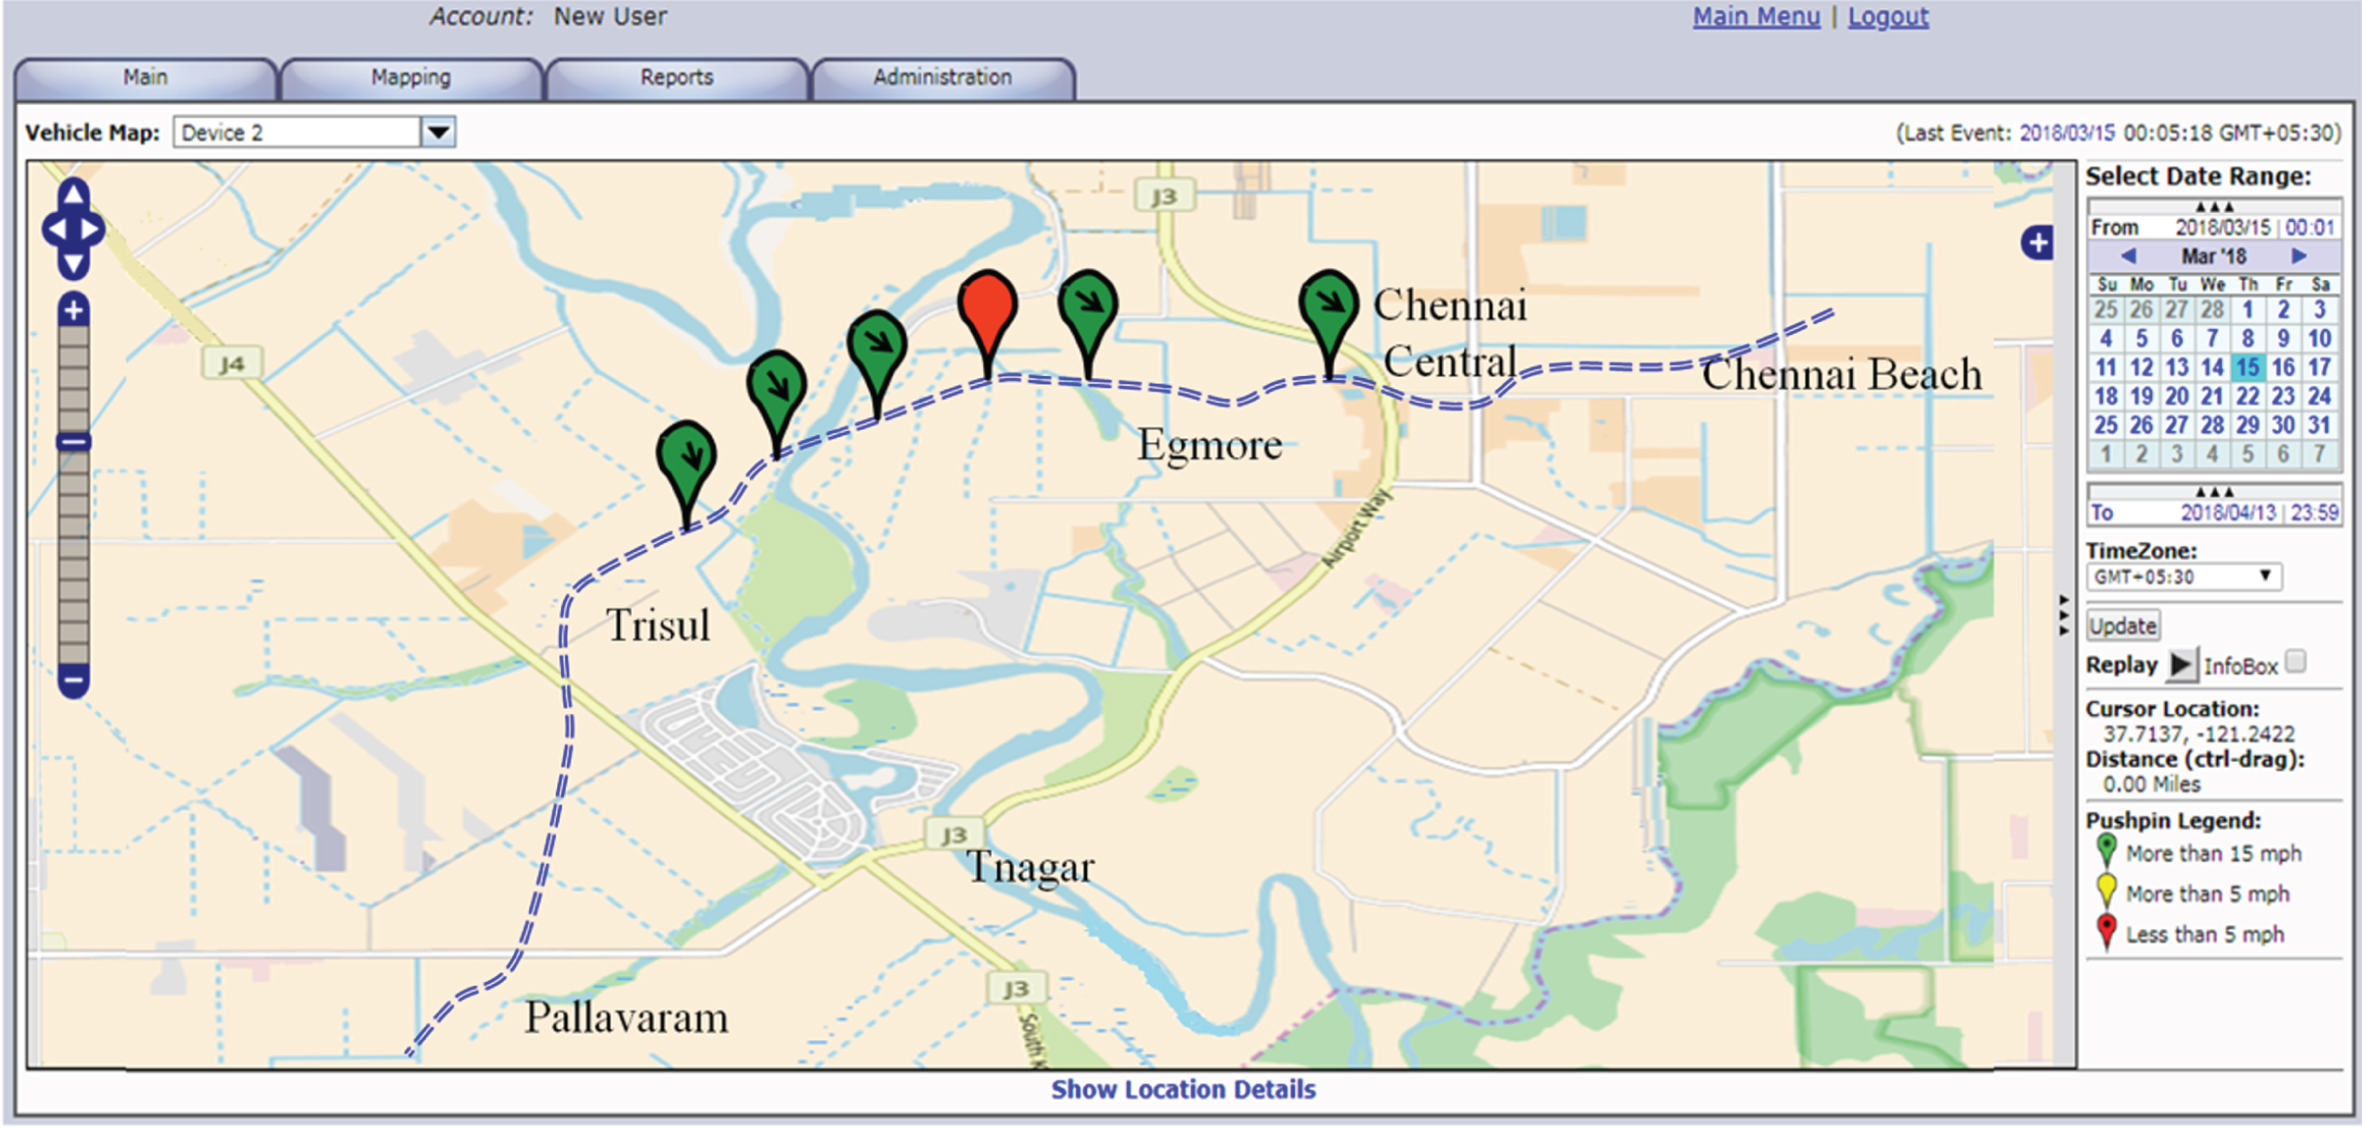
Web-based tracking for vehicles is provided by the open-source OpenGTS under Apache Software License. This technology can be used in general-purpose vehicles, private transport vehicles, and different kinds of the satellite tracking system. OpenStreetMap helps visualization of the location of track abnormality. Figure 14 shows the real-time track abnormality. MongoDB database is used for the storage of the data and monitors the abnormal location. Data analysis and manipulations can be performed on these unstructured data.
Fig. 14
Visualization of OpenStreetMap for real-time track abnormality monitoring.
5.5Performance comparison
The performance of the network was studied by considering the constant latency of the network at which the data is sent from the vehicle to infrastructure and alert message from the infrastructure to the vehicle. The focus of the analysis is on inquiry and data processing and data insertion and parsing. Two types of server are used in the proposed system, one for the storage of the data and the other for data collection and manipulation. OpenGTS software was installed in the i7-6700 CPU with 64 GB RAM and used for collecting and manipulating the data from the track. The data storage server was installed with MongoDB and it configured under single server mode.
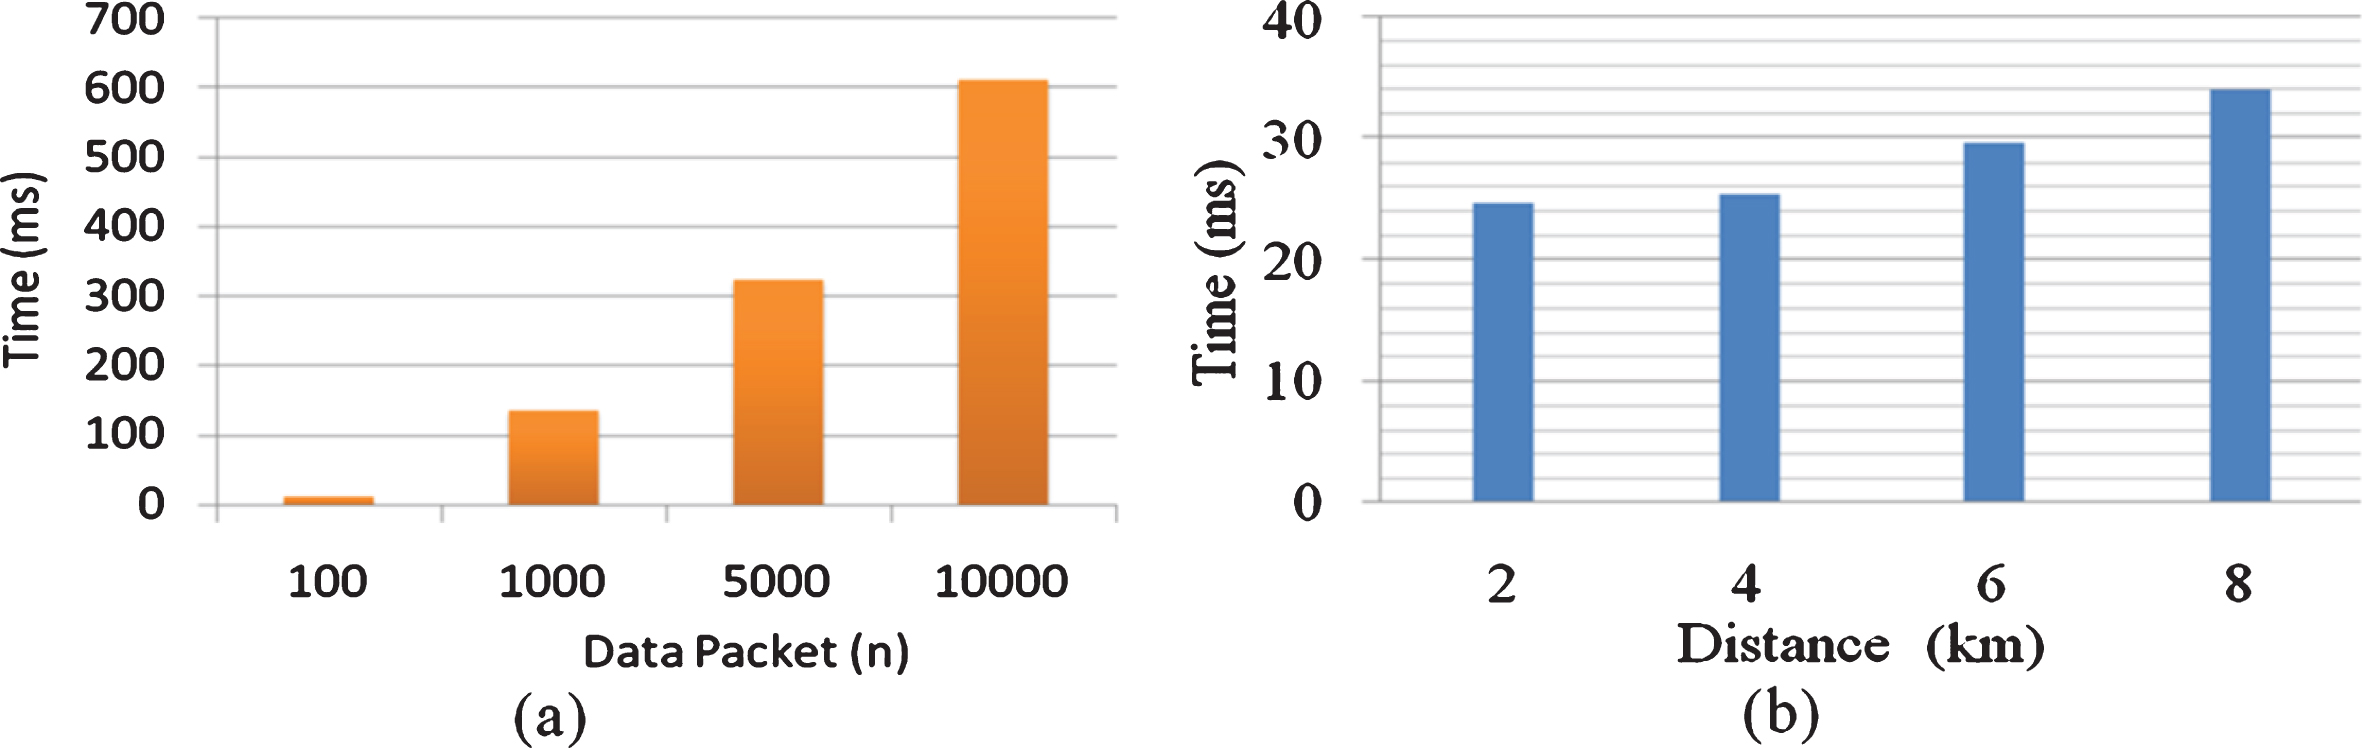
Scalability analysis was performed 40 times for both the scenarios for ensuring reliability in the results. Figure 15(a) shows the performance of parsing row data to GeoJSON and included in MongoDB. The chart was plotted using the number of the data, size and the corresponding response time. There was a linear increase in response time with an increase in the data size. The chart shows that the size of the data is proportional to the response time.
The response time of the MongoDB was assessed considering 10000 documents. Figure 15(b) shows the response time in which the distance varied from 1 km to 8 km. Slight variations in response time around 25 meters were seen with an increase in the distance.
Fig. 15
Performance comparison (a) Parsing row data in MongoDB (b) Processing time.
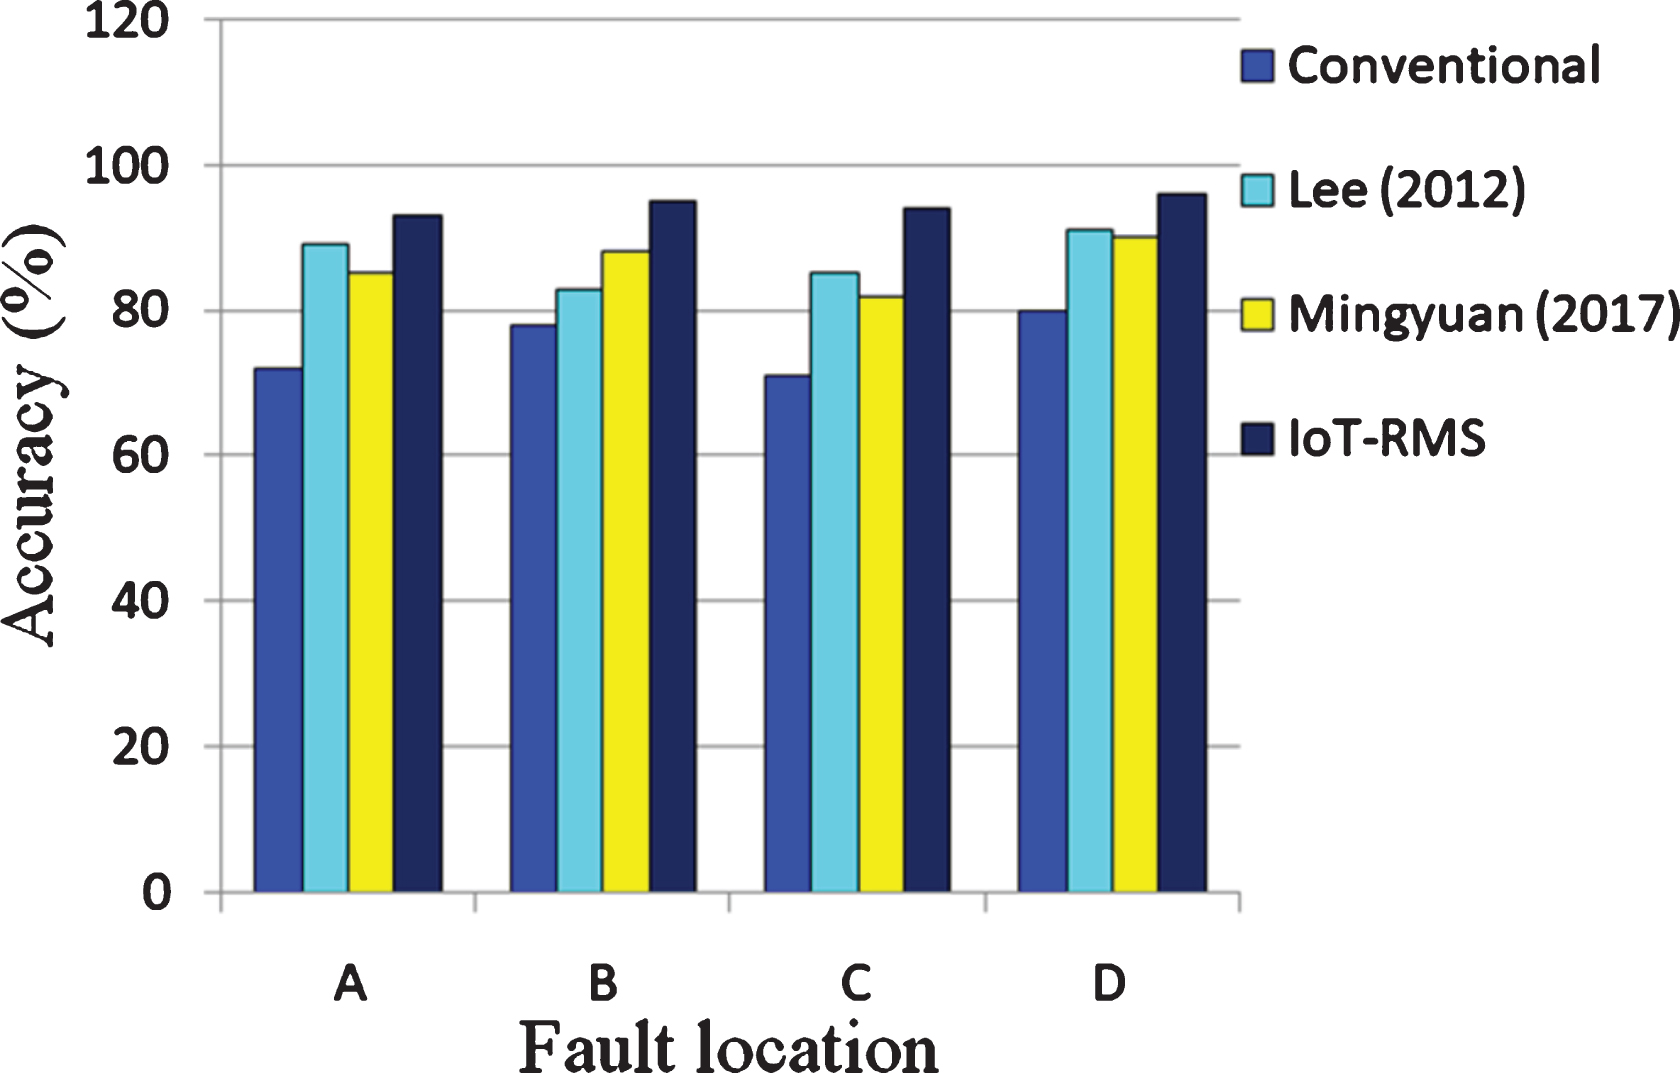
The accuracy of the proposed IoT-RMS had been studied by conducting different experiments for both the departure and arrival of the train. The experiment results for the departure of the train are shown in Fig. 16. Comparing the proposed IoT-RMS with other methods, 19.59% higher than the conventional method, 11.34% and 8.25% higher than the methods used by Mingyun (2017) respectively for the abnormality detected at location A. In the same way, the comparison is made with the abnormality location at B, the proposed IoT-RMS is 18.48 % than the conventional method, 3.26%, and 5.44% compared to Lee et al. (2012) and Mingyun et al. (2017) respectively. Similarly, the proposed method is compared with the abnormality locations at C and D, the proposed method is higher than all the other methods. The results show that the proposed method identifies the abnormalities in the exact location, whereas the conventional method provides the least accuracy compared to the proposed IoT-RMS followed by Lee et al. (2012) and Mingyun et al. (2017). Figure 17 shows the results of the arrival of the train. The results show that the accuracy of detecting the abnormality is exact and better than other methods namely, the conventional method, by Lee et al. (2012) and Mingyunet et al. (2017).
Fig. 16
Comparison of accuracy in fault detection during departure of train.
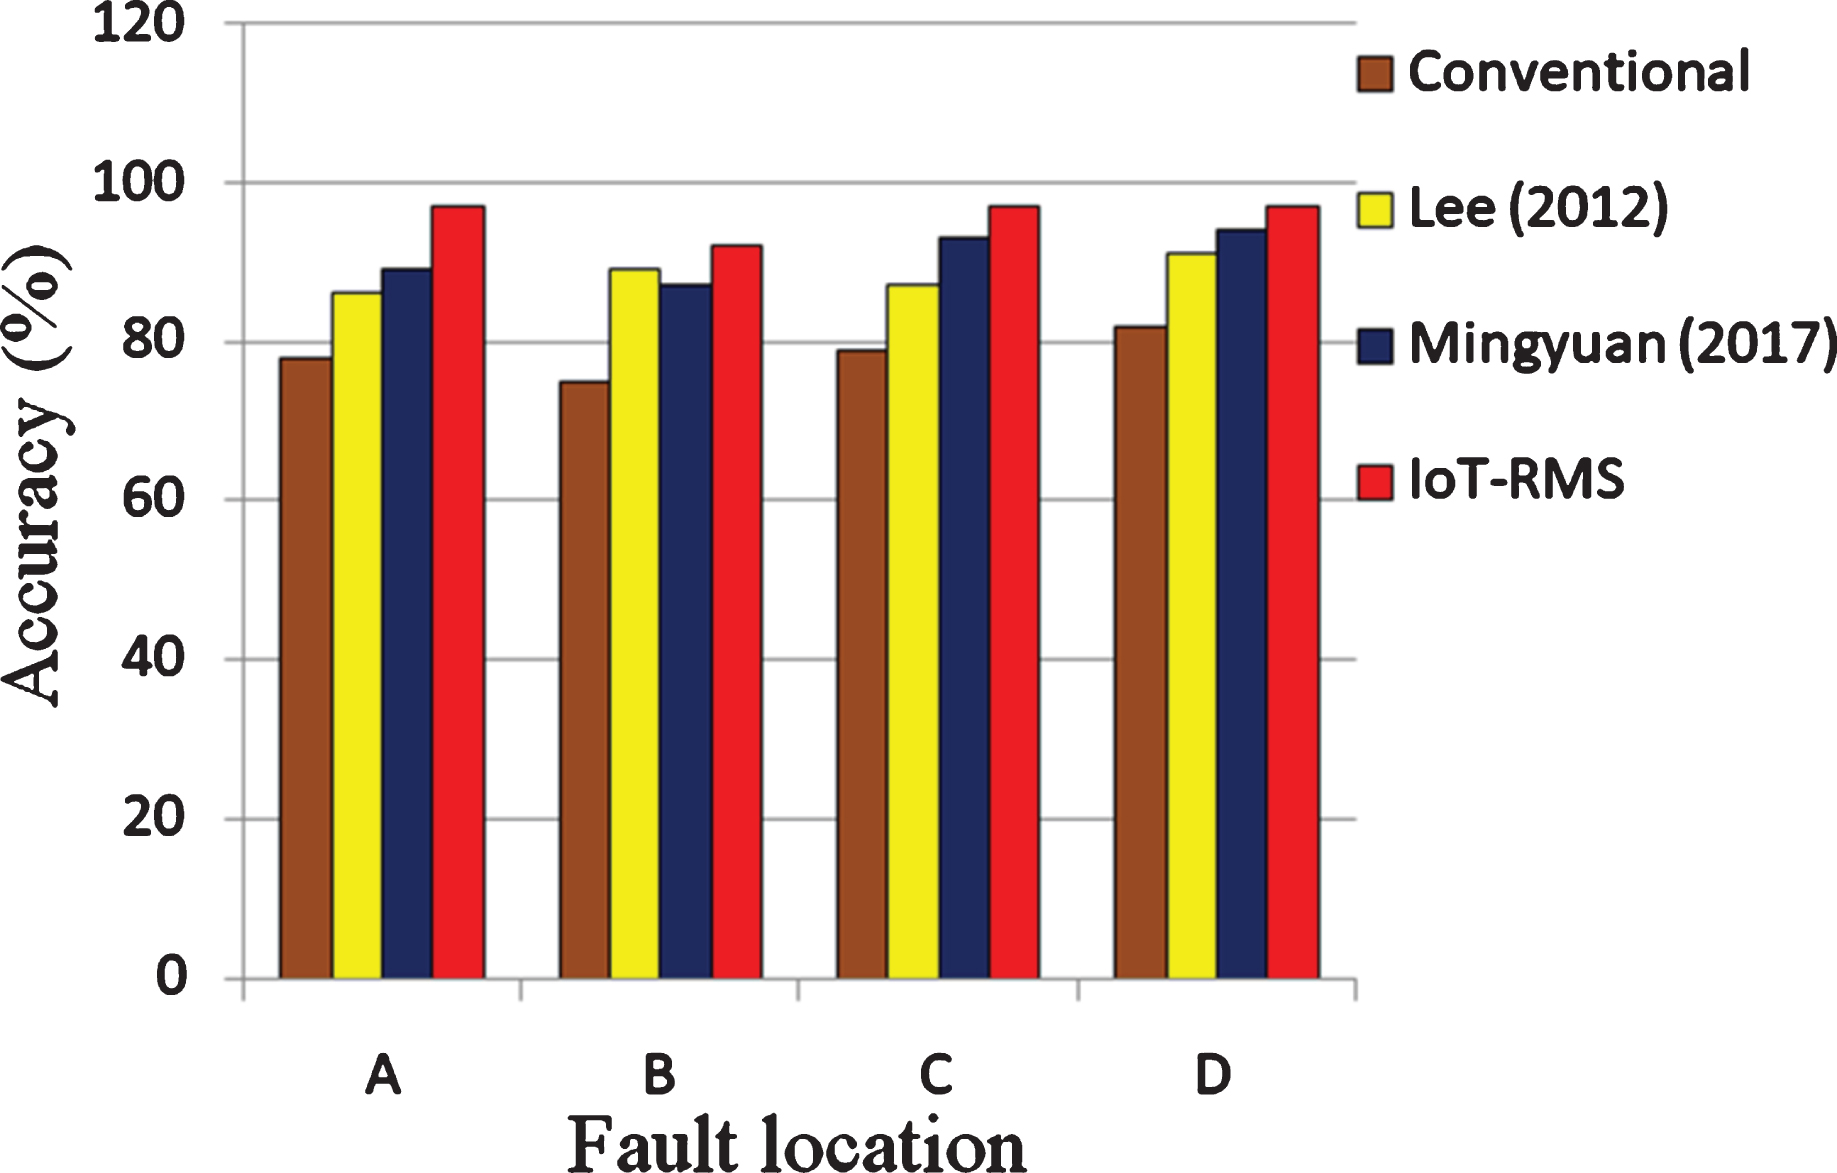
Fig. 17
Comparison of accuracy in fault detection during arrival of train.
Meanwhile, to study the accuracy of the proposed IoT-RMS the abnormalities are created purposely in four different locations (13.0815° N & 80.2768° E; 13.0739 N & 80.2618 E; 12.9679 N & 80.1484 E; 12.9336° N & 80.1020° E) and the performances were analyzed. The accuracy of the proposed IoT-RMS detecting the abnormality for different speed scenarios are listed in Table 4. The controller estimates the coordinates for different abnormalities exactly at 25 km speed. The GPS is switched off purposely in the rusty deformation on the top case and the accuracy of the system is verified. In this case, the controller switches on the proximity and exactly calculates the distance (Coordinateold+4.75 km) of abnormality. The location of abnormality can be identified by taking 4.75 km from the Coordinateold. The abnormality location is also exactly calculated in the 50 km speed. There is a little variation in the abnormality location for visible and deformation with crack fault case; a deviation of 0.94 m is present from the fault set coordinates.
Table 4
Fault detection and the corresponding GPS coordinates different speeds
| Type of abnormality | Fault set coordinates | Fault identified coordinates | Distance estimated by proximity (km) | Accuracy (%) | ||
| Latitude | Longitude | Latitude | Longitude | |||
| Speed 25 km | ||||||
| Visible damage | 13.0815° N | 80.2768° E | 13.0815° N | 80.2768° E | No | 100 |
| Invisible damage | 13.0739 N | 80.2618 E | 13.0739 N | 80.2618 E | No | 100 |
| Deformation with crack | 12.9679 N | 80.1484 E | 12.9679 N | 80.1484 E | No | 100 |
| Rusty deformation on the top | 12.9336° N | 80.1020° E | 12.9336° N | 80.1020° E | 4.75 | 100 |
| Speed 50 km | ||||||
| Visible Fault | 13.0815° N | 80.2768° E | 13.0815° N | 80.2768° E | No | 100 |
| Invisible Fault | 13.0739 N | 80.2618 E | 13.0739 N | 80.2618 E | No | 100 |
| Deformation with crack | 12.9679 N | 80.1484 E | 12.9679 N | 80.1483 E | 3.52 | 99.52 |
| Rusty deformation on the top | 12.9336° N | 80.1020° E | 12.9336° N | 80.1020° E | No | 100 |
| Speed 80 km | ||||||
| Visible Fault | 13.0815° N | 80.2768° E | 13.0813° N | 80.2767° E | 4.27 | 99.14 |
| Invisible Fault | 13.0739 N | 80.2618 E | 13.0739 N | 80.2618 E | No | 100 |
| Deformation with crack | 12.9679 N | 80.1484 E | 12.9677 N | 80.1483 E | No | 99.25 |
| Rusty deformation on the top | 12.9336° N | 80.1020° E | 12.9336° N | 80.1020° E | No | 100 |
The performance of the proposed IoT-RMS is compared with three different existing methods, namely, Lei et al. (2018), Chellaswamy et al. (2017b), Mingyuan et al. (2017), and the proposed method is shown in Table 5. The proposed method has an automatic system that monitors and manages when a GPS signal is not available or less than the set threshold. Additionally, Table 5 indicates that the proposed system provides prior information to the driver with more accuracy than other systems.
Table 5
Performance comparison of the proposed IoT-RMS with existing methods
| Methods | Fault detection method | Method for GPS signaling problem | Global Information sharing | Accuracy (%) | Cost (Euro) |
| Lei et al. (2018) | Time-frequency model | Not available | Not available | 92 | 18,000 |
| Chellaswamy et al. (2017b) | Accelerometer with IoT | Not available | Available | 94 | 27,000 |
| Mingyuan et al. (2017) | ZigBee with wireless sensor network | Not available | Not available | 97 | 55,000 |
| Proposed IoT-RMS | Accelerometer with IoT | Available | Available | 99 | 42,000 |
6Conclusion
Rail track monitoring is essential for detecting vibrations in the track, identifying the location information, and ultimately avoiding derailment. This paper has proposed an IoT based condition monitoring system for detecting any abnormalities in the rail track and updating it in the cloud. Accordingly, this information has sent to alert the drivers of the trains that pass through the abnormal location, so that they can reduce the speed in the specified location, thereby avoid derailment. Signals from the MEMS accelerometers mounted in the axle box of the train have pre-processed because the sensors used in IoT-RMS works in a high noise environment. They have tested for three different speeds for four abnormality cases. It is clear from the results that the IoT-RMS provides the exact location of irregularity, and it could also be passed to other vehicles through the cloud. Performances of the network like query time and processing speed are studied. A prototype has been developed, and the accuracy of the system has been shown through different tests conducted. This system tracks the abnormality at the beginning itself and thus avoids the chances of derailment. The proposed IoT-RMS exactly identifies the abnormality and captures the corresponding location. The accuracy of the proposed system is higher when compared to earlier versions. Due to these factors, the proposed system can easily be integrated to the railway network.
The limitation of our study is that four cases of abnormalities have been considered. In the near future, it will be enhanced by introducing more scenarios. Moreover, optimization algorithms can be included in the signal analysis. This system can be extended for avoiding frontal collision by updating and sharing the branching information of running trains.
References
1 | Amy, J. C. T. , Charles, V. T. , Chin-Yuan, F. , Abby P. T. H. , Xuan-Kai, L. , & Ian J. Y. L. ((2017) ). IOT Patent roadmap for smart logistic service provision in the context of industry 4.0. Journal of the Chinese Institute of Engineers, 40: (7), 593–602. https://doi.org/10.1080/02533839.2017.1362325 |
2 | Anand, V. , & Mallikarjuna, R. C. ((2016) ). MongoDB and Oracle NoSQL: A technical critique for design decisions. International Conference on Emerging Trends in Engineering, Technology and Science, 1–4. https://doi.org/10.1109/ICETETS.2016.7602984 |
3 | Bevilacqua, M. , Ciarapica, F. E. , Diamantini, C. , & Potena, D. ((2017) ). Big Data Analytics Methodologies Applied at Energy Management in Industrial Sector: A Case Study. International Journal of RF Technologies, 8: (3), 105–122. https://doi.org/10.3233/RFT-171671. |
4 | Bogacz, R. , Czyczula, W. , & Konowrocki, R. ((2007) ). Influence of sleepers shape and configuration on track–train dynamics. Shock and Vibration, 1–7. http://dx.doi.org/10.1155/2014/393867 |
5 | Chellaswamy, C. , Vanathi, A. , Duraichami, S. , & Glaretsubin, P. ((2017) a) Optimized Vehicle acceleration measurement for Rail Track Condition Monitoring. IEEE International Conference on Computing and Communication Technologies, 155–160. https://doi.org/10.1109/ICCCT2.2017.7972265 |
6 | Chellaswamy, C. , Balaji, L. , Vanathi, A. , & Saravanan, L. ((2017) b) IoT based rail track healthmonitoring and information system. IEEE International Conference on Microelectronic Devices, Circuits, and Systems, 1–6. https://doi.org/10.1109/ICMDCS.2017.8211548 |
7 | Chellaswamy, C. , Akila, V. , Dinesh Babu, A. , & Arasan, N. K. ((2013) ). Fuzzy logic based railway track condition monitoring system. IEEE International Conference on Communication and Nanotechnology (ICE-CCN), 250–255. https://doi.org/10.1109/ICE-CCN.2013.6528503 |
8 | Chellaswamy, C. , Krishnasamy, M. , Balaji, L. , Dhanalakshmi, A. , & Ramesh, R. ((2020) ). Optimized rail track health monitoring system based on dynamic differential evolution algorithm. Measurement, vol. 152, Article ID.107332. https://doi.org/10.1016/j.measurement.2019.107332 |
9 | Chen, X. ((2013) ). Research on data preprocess method for thermal parameters. [Master, thesis], North China Electric Power University. |
10 | Chen, N. , Chen, Y. , You, Y. , Ling, H. , Liang, P. , & Zimmermann, R. ((2016) ). Dynamic urban surveillance video stream processing using fog computing. In Proc IEEE Int Conf Multimedia Big Data, 105–112. https://doi.org/10.1109/BigMM.2016.53 |
11 | Chunli, W. , Chunlei, Z. , & pengtu, Z. ((2012) ). Denoising algorithm based on wavelet adaptive threshold. Physics Procedia, 24: , 678–685. |
12 | Divya, M. , & Ziliang, Z. ((2017) ). Energy efficiency analysis of query optimizations on MongoDB and Cassandra. Eighth International Green and Sustainable Computing Conference, 1–6. https://doi.org/10.1109/IGCC.2017.8323581 |
13 | Feng, Z. , Min, L. , Zhuo, Z. , & Weiming S. ((2016) ). An IoT Based Online Monitoring System for Continuous Steel Casting. IEEE Internet of Things Journal, 3: , 1355–1363. https://doi.org/10.1109/JIOT.2016.2600630 |
14 | Gaurav, K. P. , & Sanjeev, K. S. Y. ((2020) ). Multi-objective optimization of vibration assisted electrical discharge drilling process using PCA based GRA method. Materials Today: Proceedings. https://doi.org/10.1016/j.matpr.2020.02.561 |
15 | Gigin, G. , In-Mook, C. , & Sung-Mok, K. ((2018) ). PCA exchange method for compensation of error sources in pressure balance calibration. Measurement, 124: , 179–183. https://doi.org/10.1016/j.measurement.2018.04.021 |
16 | Guannan, L. , & Yunpeng, H. ((2019) ). An enhanced PCA-based chiller sensor fault detection method using ensemble empirical mode decomposition based denoising. Energy and Buildings, 18315: , 311–324. https://doi.org/10.1016/j.enbuild.2018.10.013 |
17 | Han-Pang, H. , Jiu-Lou, Y. , Tzu-How, H. , & Ming-Bao, H. ((2017) ). IoT-Based networking for humanoid robot. Journal of the Chinese Institute of Engineers, 40: (7), 603–613. https://doi.org/10.1080/02533839.2017.1372224 |
18 | Hodge, V.J. , O’Keefe, S. , Weeks, M. , & Moulds, A. ((2015) ). Wireless sensor networks for condition monitoring in the railway industry: A survey. IEEE Trans Intell Transp Syst, 6: , 1088–1106. https://doi.org/10.1109/TITS.2014.2366512 |
19 | Huang, Y. , Huang, S. , Zhang, Y. , Sheng, S. , Yang, X. , & Liu, R. ((2019) ). A Process Innovation Mode of Semiconductor Integrated Circuit Products Based on the Integration of Internet of Things and Sensing Big Data. International Journal of RF Technologies, 10: , 89–104. https://doi.org/10.3233/RFT-180105 |
20 | Ning, H. , Li, Yunfei. , Shi, F. , & Laurence T. Y. ((2020) ). Heterogeneous edge computing open platforms and tools for internet of things. Future Generation Computer Systems, 106: , 67–76. https://doi.org/10.1016/j.future.2019.12.036 |
21 | Jian, Y. , Xin, W. , Xue, Z. , & You, D.Z. ((2015) ). Cloud computing and visual attention based object detection for power substation surveillance robots. In Proc IEEE Can Conf Elect Comput Eng. (CCECE), 337–342. https://doi.org/10.1109/CCECE.2015.7129299 |
22 | Jiang, L. ((2011) ). Sensor fault detection and isolation using system dynamic identification techniques. The University of Michigan [Ph.D.thesis], 2011. |
23 | Kidd, P. T. ((2012) ). The Role of the Internet of Things in Enabling Sustainable Agriculture in Europe. International Journal of RF Technologies, 3: (1), 67–83. https://doi.org/10.3233/RFT-2011-017 |
24 | Konop, J. , & Konowrocki, R. ((2013) ). On evaluation of the wheelsets-track interaction quality in railway engineering. Machine Dynamics Research, 37: , 61–70. |
25 | Kopsinis Y. , & McLaughlin S. ((2009) ). Development of EMD-based denoising methods inspired by wavelet thresholding. IEEE Trans Signal Process, 57: , 1351–62. |
26 | Lee, J. S. , Choi, S. , Kim, S. S. , Park, S. , & Kim, Y. G. ((2012) ). A mixed filtering approach for track condition monitoring using accelerometers on the axle box and bogie. IEEE Transactions on Instrumentation and Measurement, 61: , 749–758. https://doi.org/10.1109/TIM.2011.2170377 |
27 | Lee, K. W. , Correia, A. J. , Lee, K. H. , Neilan, B. D. J. , & Gregor S. ((2014) ). Solar energy harvesting from roadways. In Proc. 93rd Annu. Meeting Transp. Res. Board, Washington. DC, USA 4380-1-4380-18. https://trid.trb.org/view/1289344 |
28 | Lei, X. , Wanming, Z. , & Zhaowei, C. ((2018) ). On use of characteristic wavelengths of track irregularities to predict track portions with deteriorated wheel/rail forces. Mechanical Systems and Signal Processing, 1041: , 264–278. https://doi.org/10.1016/j.ymssp.2017.10.038 |
29 | Li, F. ((2011) ). Dynamic modeling, sensor placement design, and fault diagnosis of nuclear desalination systems. The University of Tennessee [Ph.D. thesis]. |
30 | Li, F. , Upadhyaya, B. R. , & Perillo, S. R. P. ((2012) ). Fault diagnosis of helical coil steam generator systems of an integral pressurized water reactor using optimal sensor selection. IEEE Transactions on Nuclear Science, 59: (2), 403–410. |
31 | Mainetti, L. , Marasovic, I. , Patrono, L. , Solic, P. , Stefanizzi, M. L. , & Vergallo, R. ((2016) ). A Novel IoT-aware Smart Parking System Based on the Integration of RFID and WSN Technologies. International Journal of RF Technologies, 7: (4), 175–199. https://doi.org/10.3233/RFT-161523 |
32 | Messai, A. , Mellit, A. , Abdellani, I. , & Massi, P. A. ((2015) ). On-line fault detection of a fuel rod temperature measurement sensor in a nuclear reactor core using ANNs. Prog Nucl Energy, 79: , 8–21. |
33 | Milting H. , Kassner, A. , Oezpeker C. , Morhuis M. , Bohms B. , Boergermann J. , et al. ((2013) ). Genomics of myocardial recovery in patients with mechanical circulatory support. J Heart Lung Transplant, 32: (4 Suppl), 229. https://doi:10.1016/j.healun.2013.01.582. |
34 | Mingyuan, G. , Ping, W. , Yifeng, W. , & Lingkan, Y. ((2017) ). Self-Powered ZigBee Wireless Sensor Nodes for Railway Condition Monitoring. IEEE Transactions on Intelligent Transportation Systems, 99: , 1–10. https://doi.org/10.1109/TITS.2017.2709346 |
35 | Mohsen, R. , Denis, G. , & Dominique, G. ((2016) ). A Novel Approach for Improved Vehicular Positioning Using Cooperative Map Matching and Dynamic Base Station DGPS Concept. IEEE Transactions on Intelligent Transportation Systems, 17: , 230–239. https://doi.org/10.1109/TITS.2015.2465141 |
36 | Molodova, M. , Li, Z. , Núñez, A. , & Dollevoet, R. ((2014) ). Automatic detection of squats in railway infrastructure. IEEE Transactions on Intelligent Transportation Systems, 15, 1980–1990. https://doi.org/10.1109/TITS.2014.2307955 |
37 | Naderi, H. , & Mirabadi, A,. ((2006) ). Railway track condition monitoring using FBG and FPI fiber optic sensors. International Conference on Railway Condition Monitoring, 198–203. |
38 | Pei, Y. X. , & Guo, M. ((2001) ). The fundamental principle and application of sliding average method. Gun Launch & Control Journal, 1, 21–24. |
39 | Schlain, L. , González, G. , Gregorio, F. , & Cousseau, J. ((2015) ). Adaptive cyclostationary filtering for DGPS interference cancellation. Workshop on Information Processing and Control, 1–6. https://doi.org/10.1109/RPIC.2015.7497088 |
40 | Sunitha, S. , Naveen Naik, S. , & Danda B. Rawat. ((2019) ). Recent advances in mobile edge computing and content caching. Digital Communications and Networks, In press, corrected proof. https://doi.org/10.1016/j.dcan.2019.08.004 |
41 | Tracy, N. D. , Young, J. C. , & Mason, R. L. ((1992) ). Multivariate control charts for individual observations. J Qual Technol, 24: (2), 88–95. |
42 | Tsunashima, H. , Mori, H. , Yanagisawa, K. , Ogino, M. , & Asano, A. ((2014) ). Condition Monitoring of Railway Tracks Using Compact Size On-board Monitoring Device. 6th IET Conference on Railway Condition Monitoring, 1–5. https://doi.org/10.1049/cp.2014.0996 |
43 | Uckelmann, D. , & Harrison, M. ((2010) ). Integrated Billing Mechanisms in the Internet of Things to Support Information Sharing and Enable New Business Opportunities. International Journal of RF Technologies, 2: (2), 73–90. https://doi.org/10.3233/RFT-2010-006 |
44 | Walpole, E. R. ((2012) ). Probability and Statistics for Engineers and Scientists. Prentice Hall, 9th edition. |
45 | Xiaowei, Y. , Xiaoxiao, W. , Yuan, W. , Liping, Q. , Weidang, L. , & Haibo, Z. ((2017) ). Small-cell assisted secure traffic offloading for narrow-band internet of thing (NB-IoT) systems. IEEE Internet of Things Journal. https://doi.org/10.1109/JIOT.2017.2779820 |
46 | Xianping D. , & Feng Z. ((2019) ). A novel principal components analysis PCA method for energy absorbing structural design enhanced by data mining. Advances in Engineering Software, 127: , 17–27. https://doi.org/10.1016/j.advengsoft.2018.10.005 |
47 | Yabin, G. , Guannan, L. , Huanxin, C. , Yunpeng, H. , Haorong, L.i. , Lu, X. , & Wenju, H. ((2017) ). An enhanced PCA method with Savitzky-Golay method for VRF system sensor fault detection and diagnosis. Energy and Buildings, 1421: , 167–178. https://doi.org/10.1016/j.enbuild.2017.03.026 |
48 | Zhai, W. , Liu, P. , Lin, J. , & Wang, K. ((2015) ). Experimental investigation on vibration behaviour of a CRH train at speed of 350 km/h. International Journal of Rail Transportation, 3: , 1–16. https://doi.org/10.1080/23248378.2014.992819 |


