
Graph analysis and clustering of proteins linked with COVID-19
Abstract
A remarkable number of scientific initiatives are in practice to encounter the new coronavirus epidemic (COVID-19). One of the biggest challenges faced by the COVID-19 researchers in the therapeutic field is the knowledge about the biological functions in disease-human interacting proteins. The detection of COVID-19 protein complexes, a group of proteins that possess the same biological functions, helps in better understanding of the biological processes in our body. The main contribution of this work is to cluster proteins that perform the same biological functions to increase the knowledge about the COVID-19 disease-human interacting proteins. The authors investigated proteins linked with COVID-19 disease by creating a disease-human protein-protein interaction graph. Topological means of graph analysis and graph clustering have been employed to group proteins that possess the same biological functions. These clusters will be the protein complexes that work together to carry out a specific biological function in a human cell. Moreover, through the cluster analysis, we can uncover previously unknown COVID-19 disease-human protein links that are beneficial for promising knowledge discovery. Also, the authors evaluated how the Markov Cluster algorithm, a graph-based algorithm finds interesting patterns of similar features from COVID-19 disease-human protein-protein interaction graph. The Markov Cluster algorithm results in six statistically significant protein clusters, including cluster (A): keratinization (3.50E-71), (B): regulation of cellular process (6.62E-05), (C): regulation of cell cycle (1.31E-27), (D): mitotic cell cycle (1.66E-06), (E): regulation of phosphoprotein phosphatase activity (1.15E-09), and (G): G2/M transition of mitotic cell cycle (3.03E-07).
1.Introduction
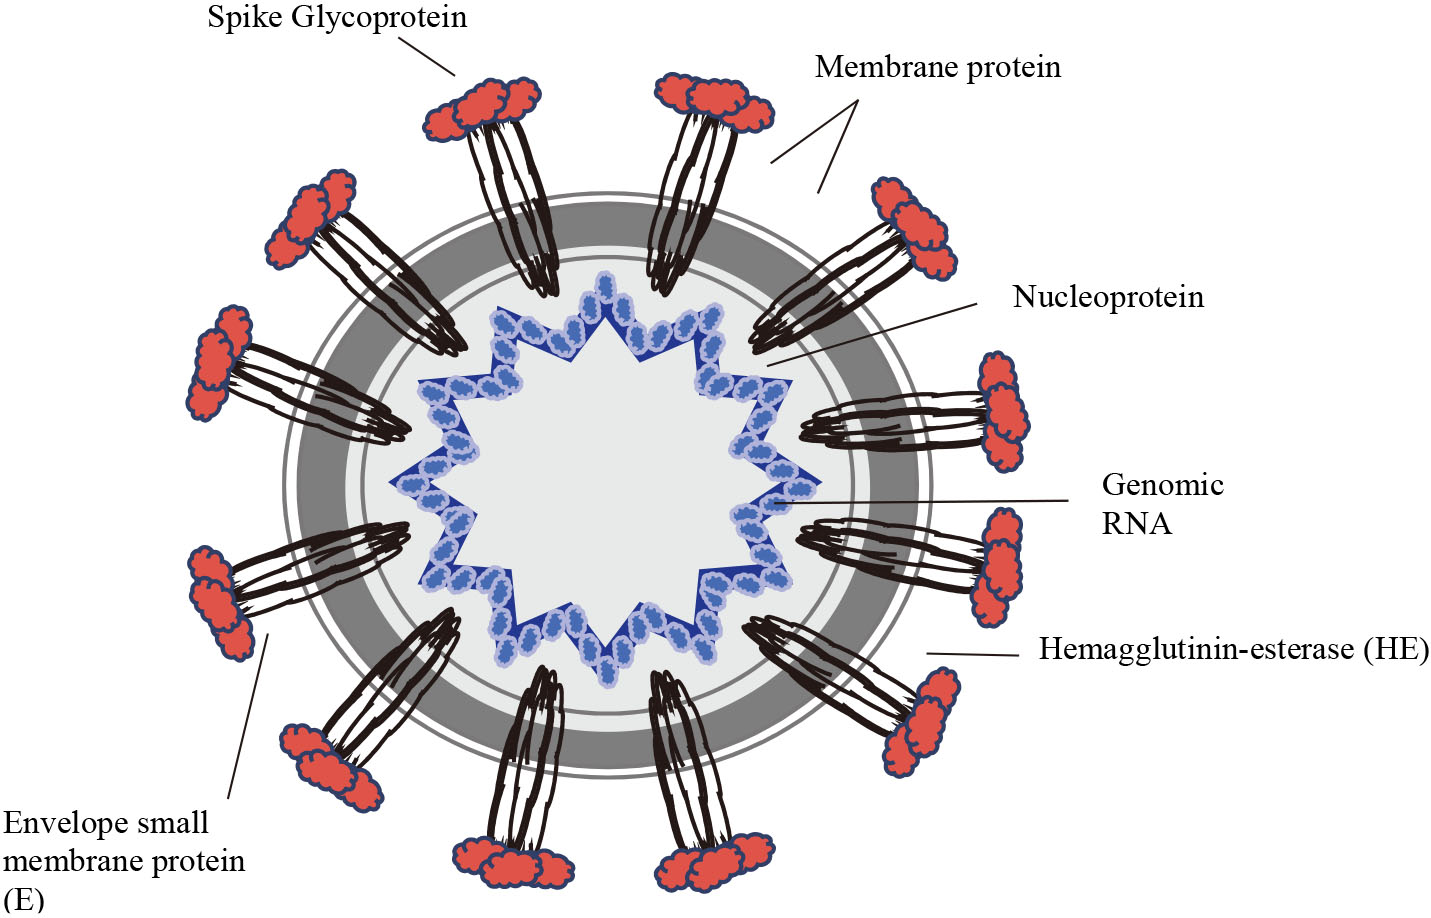
Figure 1.
The Virion structure.
The current pandemic of COVID-19, a respiratory disease emerged in late 2019 has led to 1,051,635 confirmed cases and 56,985 fatalities in 208 countries with cases as of 4
Protein-Protein Interactions (PPIs) present many challenges for the identification of drug-like molecules [11]. Both traditional as well as some innovative strategies like graph-based methods provided valuable tools for the discovery of PPI modulators and its potential of targeting PPIs for therapeutic intervention. We cannot understand the biological processes happening inside our body without extensive analysis of COVID-19 disease-human protein interactions [12]. The main objective of this work is to find protein clusters linked with COVID-19 disease-human interactions. Clustering proteins with the same biological functions help biomedical researchers to explore knowledge about the natural process happens in our body due to this disease. We propose the analysis of the structural and non-structural proteins as the seeds to construct a protein-protein interaction (PPI) network associated with COVID-19 [9]. In a PPI network, vertices or nodes represent proteins, and edges represent interactions. Graph cluster analysis with a blend of topological properties of the PPI network provides an appropriate biological knowledge for a promising tool to understand the biological function of the protein groups.
Further sections of this paper are in the following order: in Section 2, the authors did a literature study on the creation and investigation of PPI networks, Section 3 discusses how a PPI data can be modelled as a graph and the modelling algorithm which we have used to create the COVID-19 – human PPI data, Section 4 explains the graph clustering algorithm, Markov Cluster (MCL), Section 5 discloses the cluster validity measures, Section 6 describes the methodology of our analysis, Section 7 canvas the results and discussion, Section 8 covers possibilities, limitations, and future study, and finally, we conclude our study in Section 9.
Table 1
Summary of graph clustering methods
| Reference | Objective | Clustering method | Clustering algorithm | Application |
|---|---|---|---|---|
| [18] | Protein complex detection | Stochastic search method | HGCA | Biological networks |
| [20] | Community detection | Stochastic search method | Louvain cluster | Biological networks |
| [19] | Protein complex detection | Local neighbourhood density search | MCODE | Biological networks |
| Protein complex detection | Flow-based simulation | MCL | Biological networks | |
| [21] | Protein clusters | Flow-based simulation | FOA-MCL | Biological networks |
| [22] | Operon prediction | Flow-based simulation | MCL | Biological networks |
| [23] | Find essential proteins | Flow-based simulation | RWEP | Biological networks |
2.Literature study
The literature study helps to accomplish a theoretical base for the research problem by seeking the past events of the particular subject. In this literature section, we cut across the knowledge about graph clustering and topological analysis of PPI networks. Topological means of PPI network analysis provide a platform for exploring complex diseases [13, 14, 15]. Network-based computational models to analyse COVID-19 disease – human protein interaction network – has already been applied by researchers in drug and therapeutics [16]. Studies used significant gene bio-signatures as the seeds to build the PPI network and analyse disease dynamics through topological analysis of the PPI network [17]. Several models for protein complex detection from PPI network has been applied in graph-based clustering techniques [18, 19].
Graph clustering using community detection algorithms follows a stochastic search method based on the seed vertex or edges [18, 20]. A heuristic graph clustering algorithm (HGCA) based on different topological properties has been proposed for protein complex detection [18]. The algorithm used a weighted degree for edges and vertices. A cluster description model is then constructed based on the candidate vertex and the cluster. Based on this description model, the HGCA starts with the seed vertex and produces communities in a greedy manner. A study with six community detection algorithms was used to analyse two biological networks and evaluated the resultant communities [20]. Among the six algorithms, Louvain cluster algorithm is found to be the fastest with an agglomerative approach to maximise the modularity. Density-based local neighbourhood search method and flow simulation method are widely used in protein complex detection and analysing PPI networks [19, 21, 22, 23, 24]. A demonstration of how MCL and Molecular Complex Detection algorithm (MCODE) has been done to identify patterns from PPI data related to Alzheimer’s disease [19]. A combination of MCL algorithm with Fruit Fly Optimization Algorithm (FOA), FOA-MCL has been used to find clusters formed by PPI network data of human immunodeficiency virus (HIV) [21]. An operon prediction model based on Markov clustering algorithm used some generic attribute information of genomes for graph [22]. The results show that the operon model has a better capability of operon prediction than classical operon prediction methods. The Random Walk Essential Proteins (RWEP) is a method that endorses random walks with restart that incorporate the topological and biological properties [23]. It has been applied to rule out protein essentiality in PPI networks.
Stochastic search clustering method is extensively used in PPI networks where the objects are considered as vertices. This method is time-consuming and, therefore, suitable for small networks. The flow-based method works on the principle of random walks and has a tendency to stay within clusters rather than between clusters. This method will not produce overlapping clusters. However, the process is time-consuming. Local neighbourhood density search method performs graph clustering by recognising seed proteins as individual clusters and then proceed greedily to add vertices.
Table 1 shows a summary of the reviewed graph clustering methods. Graph clustering and analysis using the clustering co-efficient as the validity measure provides a valuable tool for the partitioning of the PPI network [19, 25, 26]. However, the MCL algorithm is mainly designed for graphs and can be applied to biological applications [19, 27]. Novel algorithms for analysing PPI networks by combining MCL and optimisation techniques have also been developed [21].
3.Protein-protein interaction graph
A PPI network is a collection of protein interactions, often deposited in online databases [28, 29, 30]. Since proteins interact with each other and also carries information signals from one protein to another, understanding critical biological processes in the human body will be difficult without an extensive analysis of PPI [30]. Analysing PPI networks helps to mine data that assure one to create biological systems with new properties, and protein complexes for therapeutic purposes [16, 18, 31, 32, 33, 34].
Concerning topology, the PPI networks follow a small-world property and are scale-free networks [35, 36]. In small-world networks, it is possible to reach from a protein to any other protein in only a small number of steps. In scale-free networks, most proteins have a reduced number of interactions. Among the biological graph drawing algorithms, the force-directed layout model is very much flexible [37]. The algorithm can be used to calculate undirected graphs by using the information contained within the structure of the graph. There are several force-driven algorithms. Since the fundamental and aesthetic goal of optimisation of PPI graph drawing algorithms is the minimisation of crossings between edges, reducing the distance between edges and incorporating the properties such as small-world effect, scale-free network, the force-directed model is suitable for drawing a PPI graph [38, 39].
Generally, a PPI network can be created as an undirected, unweighted graph
Let
The Kamada-Kawai [41] suggested that the number of edge crossings for a PPI graph is not a benchmark for a layout algorithm. This layout algorithm measures the total balance of the PPI graph as the square summation of the differences between the ideal distance and the actual distance for the entire vertices. The calculation is delineated in Eq. (1).
(1)
For some pair of vertices,
3.1Pseudocode for the Kamada-Kawai algorithm
Let
The location of a particle in a plane is disclosed by
(2)
(3)
(4)
In a graph, the least level of organisation is vertices and degree of vertices. Vertices are connected by edges to form motifs, sub-graphs of three or more vertices. Motifs are linked to form communities or complexes. A sub-graph is a graph formed from the disjoint union of complete graphs. Graph topology statistics include scale-free properties to fit power-law feature: average degree, degree distribution, small world properties that can be measured by clustering coefficient, average path length.
4.Graph clustering
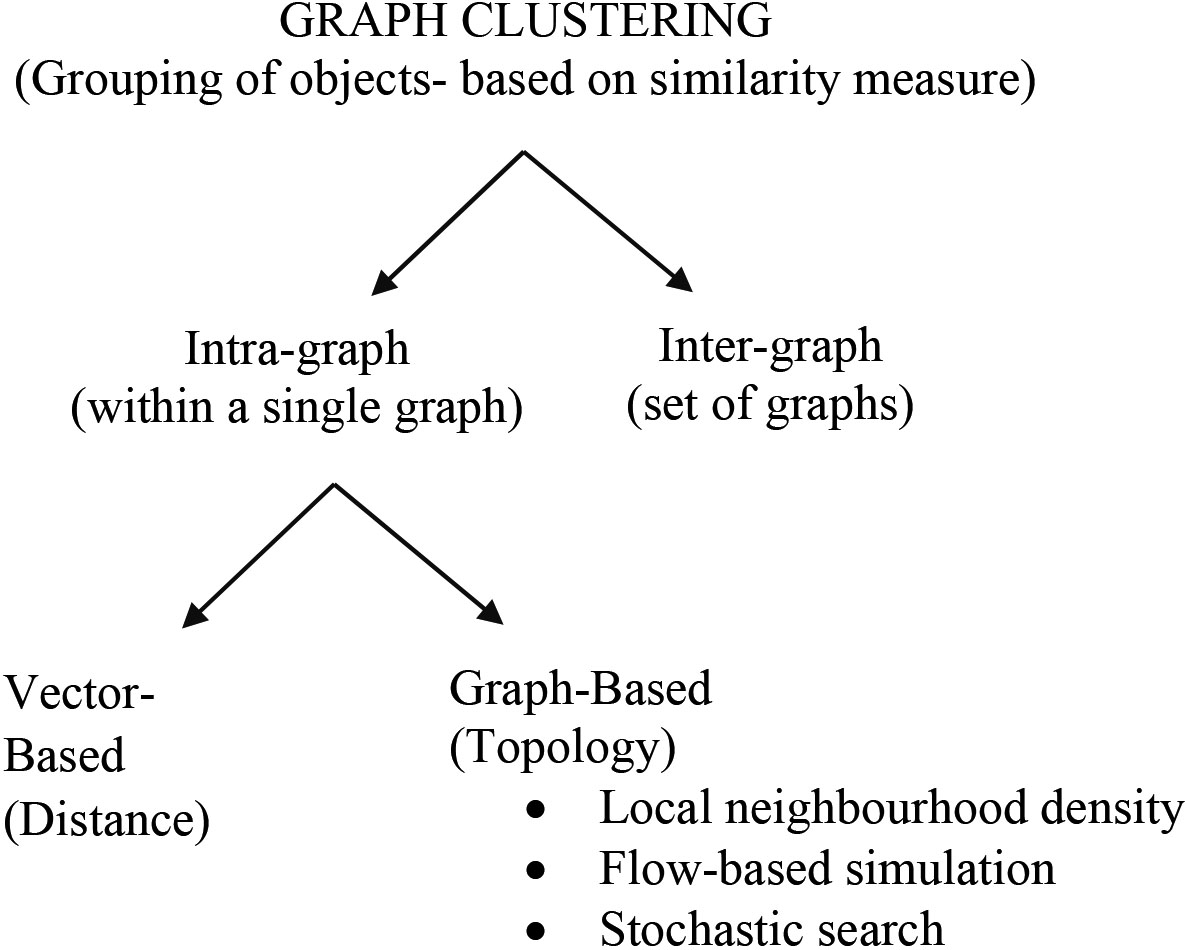
Graph clustering is an augmenting area with a perspective to discover contemporary facts from complex data that can be pictured as a graph. The field of clustering has grown, and the number of clustering algorithms reported in biological applications is also high [19, 21, 42, 43, 44]. Graph clustering has two perspectives: intra-graph clustering and inter-graph clustering. Intra-graph clustering is the process of grouping objects within a single graph and inter-graph clustering method clusters between graphs. The intra-graph clustering method focus on both vector-based and graph-based. Vector-based clustering is of purely distance-based and graph-based clustering is established on the topological characteristics of the graph.
Graph-based clustering techniques for biological application explicitly uses theoretical graph terms to cluster the data that is represented as a graph. Local neighbourhood density search, flow-based simulation, and stochastic search are some of the graph-based clustering methods.
Figure 2 shows the perspective of graph clustering. Flow simulation method based on a random walk [45], or biological knowledge can be applied to PPI networks to uncover protein clusters. The MCL [27] is a flow simulation method based on a random walk. Moreover, the MCL is one of the most successful approach to cluster proteins in PPI networks [22, 46].
Figure 2.
Perspective of graph clustering.
5.Measures for cluster validation
Clustering is an unsupervised learning technique and gives distinct clustering results on the same data with distinct parameters. Clustering coefficient is one of the metrics available for some indication of the quality of the clusters [19, 25, 26, 47, 48, 49]. The clustering coefficient lies between 0.0 and 1.0. If the clustering coefficient tends to 1, the neighbourhood is fully connected, and graph possesses a maximal structure [50].
The dimension that represents the trend of a graph to be segregated into clusters is known as the clustering coefficient. A cluster is a subspace of vertices connected by edges.
Let
(5)
The clustering coefficient of
(6)
For a biological network, clusters need to be validated using the domain knowledge to ensure the natural function of the objects. The most efficient way of biological validation is to test the gene ontology for the enrichment of classified clusters, and to check if proteins are functionally homogeneous.
Gene Ontology [51] is a database that consists of three categories of associations, namely, molecular function, cellular component, and biological process. The functions of proteins are labelled with a GO-term. A
(7)
Figure 3.
The working process of the proposed model.
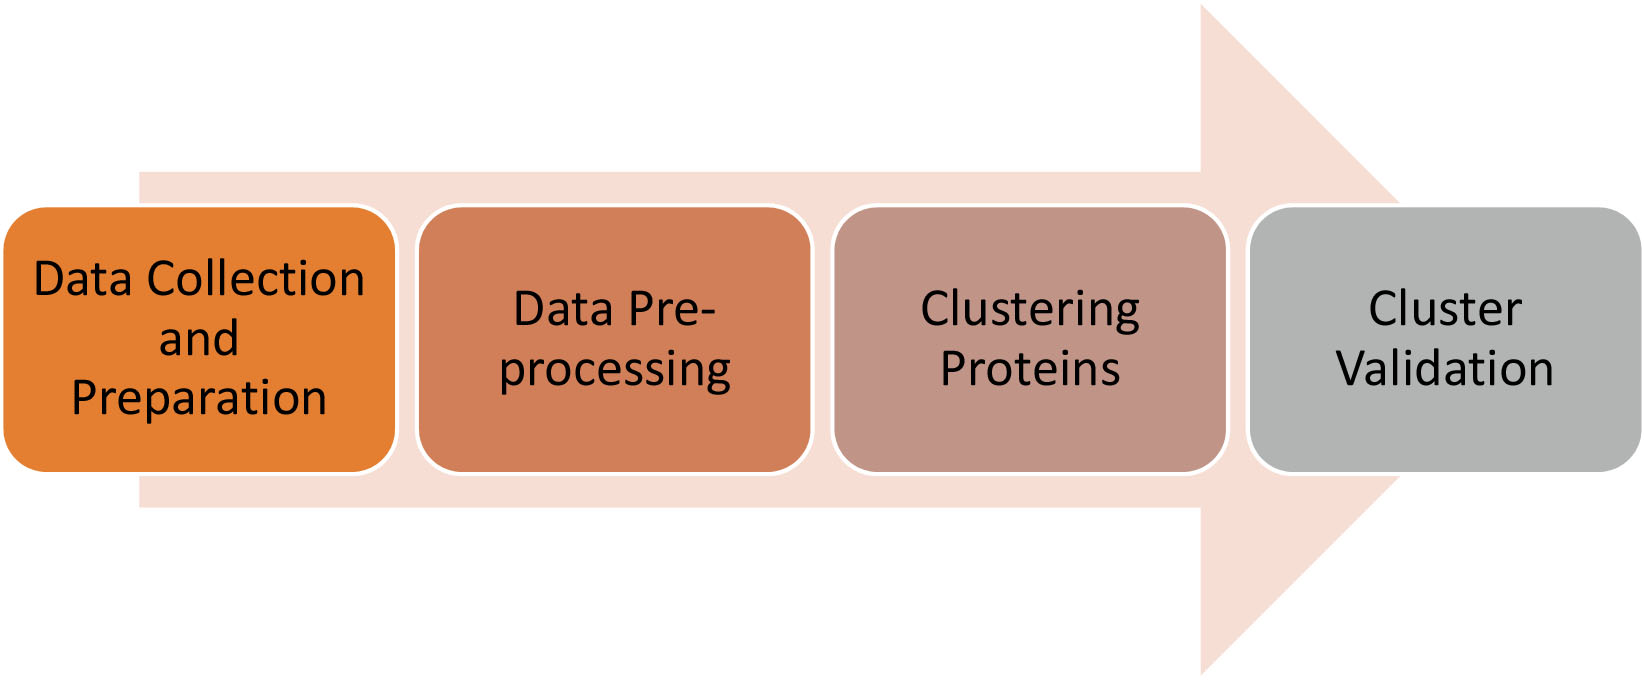
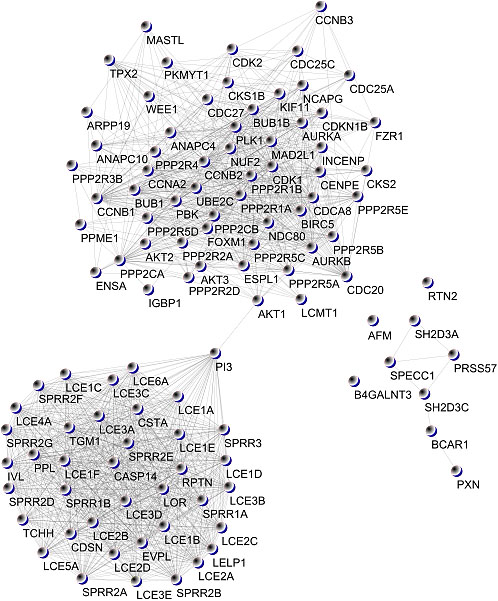
Figure 4.
COVID-19 disease – human PPI graph.
The proteins in the whole network and its linked GO-term are captured as the population (
6.Methods
The proposed model for finding proteins with related biological processes from a PPI network linked with COVID-19 disease consists of four phases. Figure 3 shows the working process for the proposed model.
6.1Data collection and preparation
The STRING is a database of predicted biomolecule interactions [52]. We used the database STRING to collect the PPI data. Also, the authors employed ‘Cytoscape’ automation to query the STRING database to retrieve network of proteins associated with COVID-19 disease [53].
Figure 5.
The adjacency matrix for created PPI graph.
The implicated COVID-19 disease proteins (“Nsp1”, “Nsp2”, “Nsp3”, “Nsp4”, “Nsp5”, “Nsp6”, “Nsp7”, “Nsp8”, “Nsp9”, “Nsp10”, “Nsp11”, “Nsp12”, “Nsp13”, “Nsp14”, “Nsp15”, “Nsp16”, “S”, “Orf3a”, “Orf3b”, “E”, “M”, “Orf6”, “Orf7a”, “Orf7b”, “Orf8”, “N”, “Orf9b”, “Orf9c”, “Orf10”) are given from ‘R’ tool using the package ‘RCy3’ [9, 54]. The RCy3 is an R package to link R language with Cytoscape. We restricted the query with the confidence score between 0.9 and 1.0 to get enough positive protein-protein interactions. The restricted disease protein query returned 57 proteins and 786 predicted interactions. The obtained COVID-19 disease network was then expanded with human host proteins. The authors kept the limit of host human protein interactors as 50. Here, we kept the confidence score as same as the disease protein-protein interaction network. The resultant final network contained 107 proteins and 1446 interactions.
Network visualisation of extensive protein-protein interaction data in a single frame is challenging. First, these networks tend to be large, typically consisting of hundreds of proteins with thousands of interactions between them. Cytoscape presents different layout algorithms. The authors created a force-directed spring embedded layout which uses the Kamada-Kawai algorithm to visualise the graph. The Cytoscape user interface allows us to drag nodes to override the automatic layout interactively. Figure 4 shows the constructed PPI graph.
6.2Data pre-processing
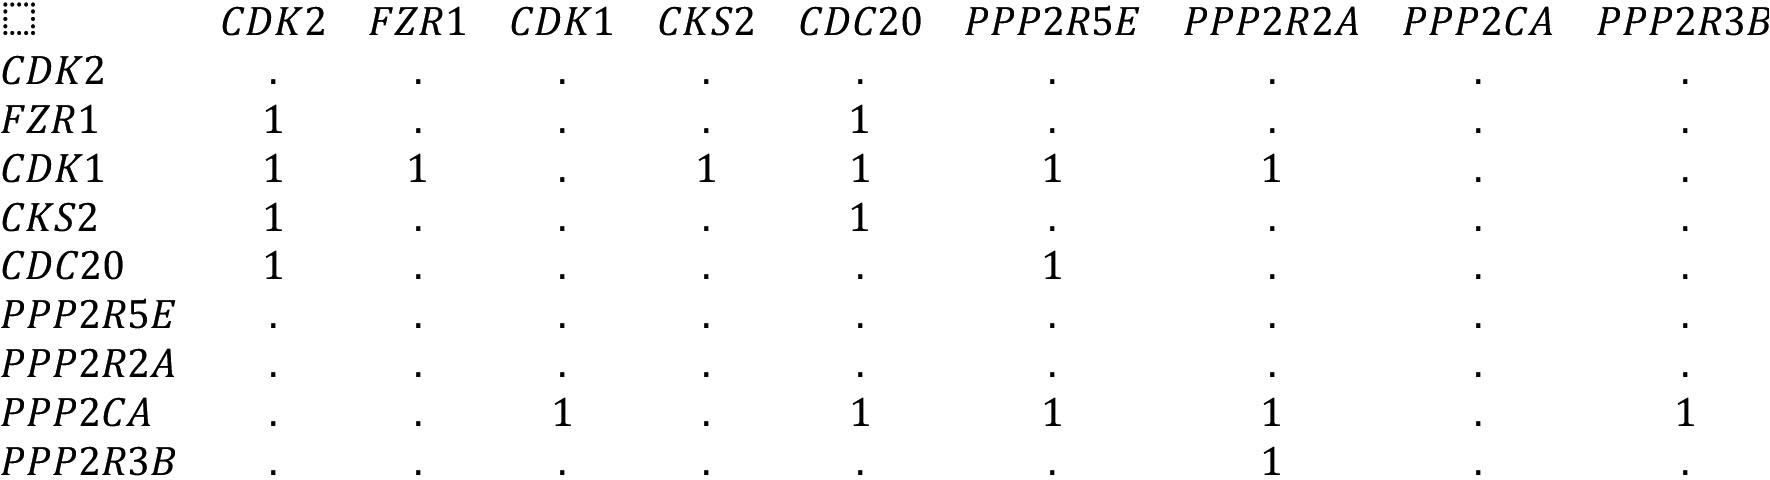
In order to obtain fine clusters, the algorithm specifies some pre-processing steps. We analysed whether there are multiple edges and also removed three isolated proteins. Consequently, it was found that the resultant network to be clustered consists of 104 proteins and 1446 edges. The graph data needs to be hoarded in the framework of the adjacency matrix to create an association or transition probability matrix for the MCL algorithm. This matrix will be the current probability matrix for the calculation of the Markov matrix. Figure 5 shows the part of adjacency matrix representation for the created PPI graph.
6.3Clustering proteins
The MCL algorithm is established with random walks using Markov chain [19, 27]. The Markov chain is explained as, for a graph
Write
(8)
Every column
Step1: Input: Adjacency matrix of the graph
Step 2: add self-loops
Step3: normalise the matrix to create Markov matrix
Step 4: repeat steps 5 and 6 continuously to attain a convergence state
Step 5: expansion by the e
Figure 6.
The workflow of clustering proteins.
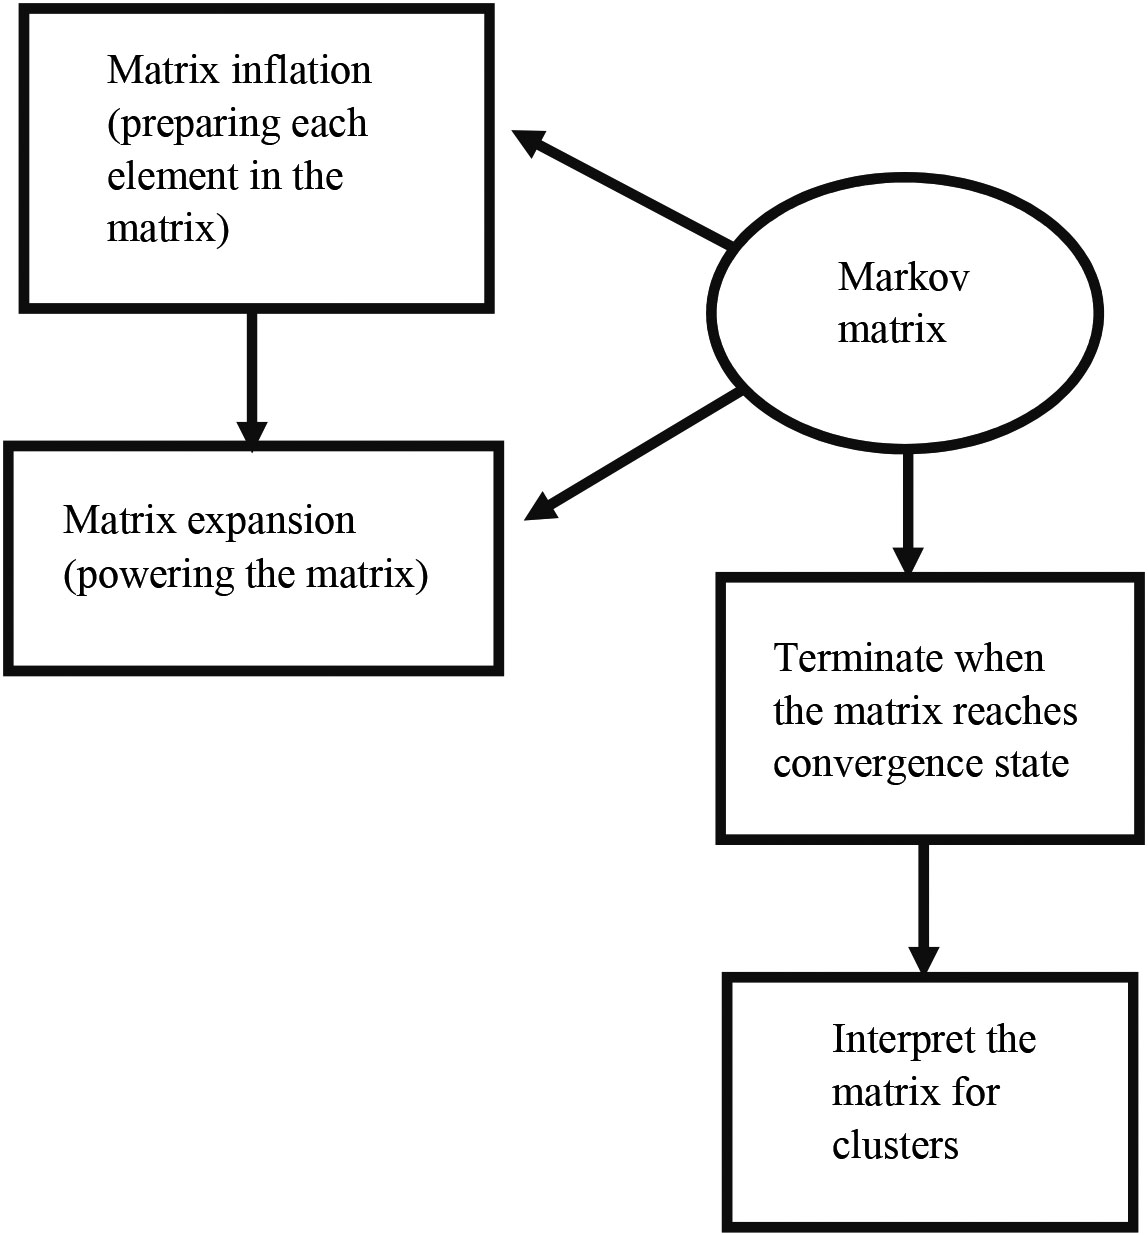
Figure 7.
Subgraphs of COVID-19 disease – human PPI graph.
Markov Cluster algorithm has been applied to the created COVID-19 disease – human PPI network. The workflow of clustering proteins is shown in the Fig. 6. During the clustering process, the expansion and inflation operations are performed repeatedly until a convergence state occurs. The expansion has been done by powering the matrix. The inflation has been done to prepare each element in the matrix. The overlapped cluster occurs when both clusters are graphically symmetric. It is not happening in this case.
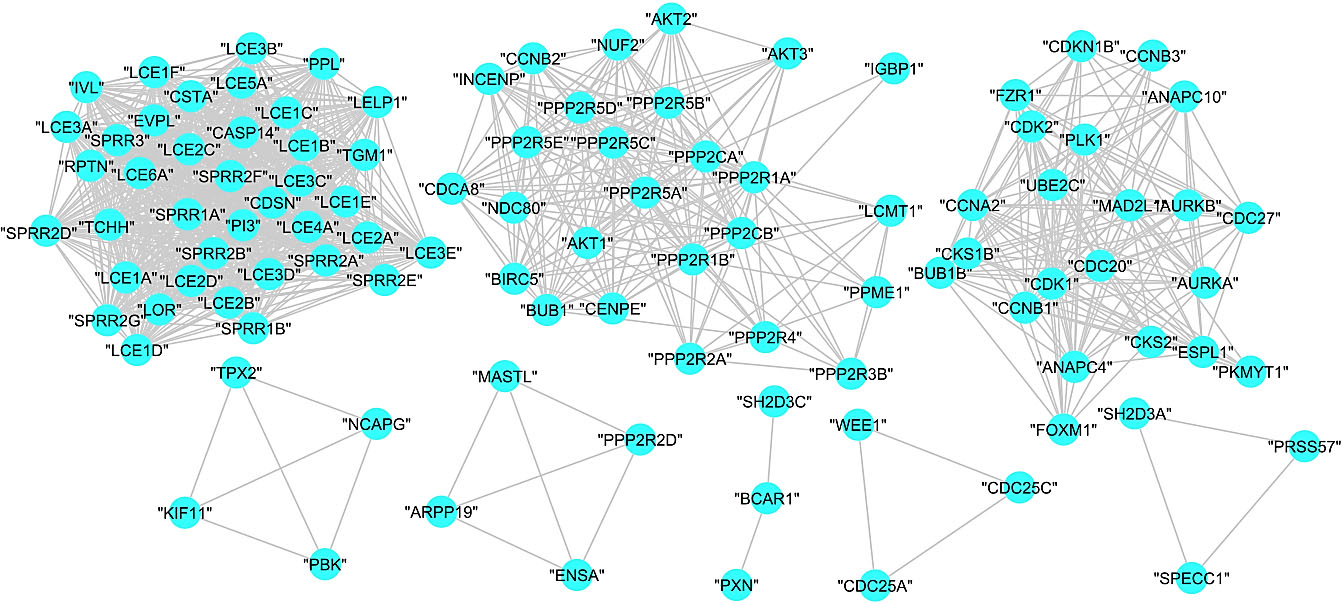
The MCL returned eight clusters with an inflation parameter 1.8. Figure 7shows the obtained subgraphs for the clustered proteins.
6.4Cluster validation
Topological validation of the clusters has been done by scrutinising clustering coefficient. It is also termed as transitivity of the clusters. The value of the clustering coefficient deceit in intervals is 0 and1. A graph or sub-graph possesses a superlative structure if its clustering coefficient is closest to 1. The connectivity of the graph is less when its clustering coefficient is 0. The clustering coefficient or transitivity of MCL is 0.82560015, which is close to 1. The clustering coefficients of resulting eight clusters are 1,0.8083624, 0.7964387, 1, 1, 0, 1, 1. This means that the proteins within the clusters are densely connected and have a functional relationship. The clusters with clustering coefficient
7.Results and discussion
The COVID-19 disease – host human protein-protein interaction network with confidence level
Table 2
Topology of COVID-19 – human PPI and protein clusters
| Topology | Number of proteins |
|---|---|
| Number of proteins | 107 |
| Number of interactions | 1446 |
| Connected components | 5 |
| Isolated proteins | 3 |
| Average path length | 2.591233 |
| Network diameter | 5 |
| Density | 0.2549815 |
| Cluster coefficient/transitivity | 0.8683563 |
| Average node degree | 27.02804 |
| Avg. betweenness | 70.90654 |
The structure and magnitude of the created PPI network are turning out to be 107 vertices and 1446 edges. The built PPI network should be further analysed to ensure that the network possesses scale-free property and small-world property. We analysed scale-free property of the constructed COVID-19 disease – human PPI network by power-law fit.
The degree distribution of biological networks approximates a power law:
Figure 8.
Degree distribution of the PPI graph.
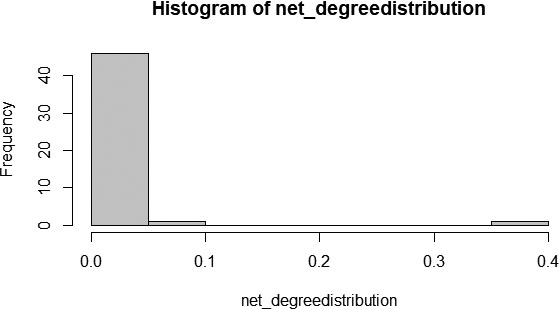
The proportion of variability in the degree distribution is computed on logarithmic value to fit the curve linearly and computed the R-square value. A negative exponential plot for the degree distribution of a network implies that the network follows power-law fit to predict the network’s scale-free property. Accordingly, Fig. 9 shows that the constructed PPI network’s degree distribution graphically fitted perfectly to a negative exponential plot. Besides, the R-squared value or coefficient of determination is reported as 0.906.
Figure 9.
Power law fit of the PPI graph.
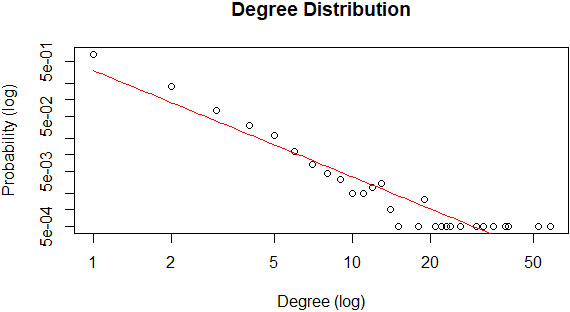
In addition to graphical evaluation, we can adapt statistical evaluation also. The Kolmogorov-Smirnov test is carried mainly to evaluate scale-free networks that can be endorsed. According to this test, the power-law fit,
Small-world properties of a network can be analysed with two topological properties: the average clustering coefficient or transitivity and the average path length, and its associated
Figure 10.
Transitivity and average path length of the PPI network.
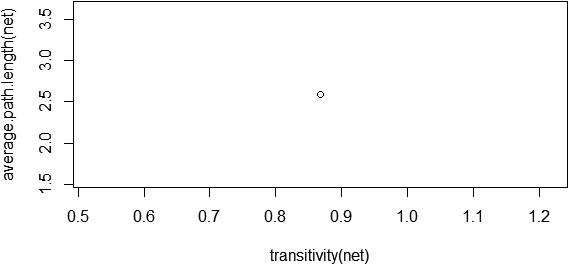
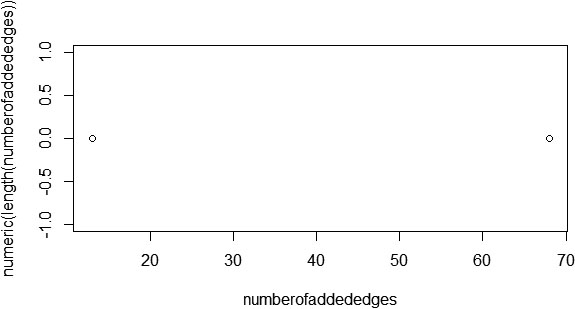
The clustering coefficient and average path length of the network alone does not imply that the constructed PPI network possesses small-world property. We need to calculate the
Table 3
Results of MCL algorithm over PPI network
| Cluster | Number of proteins | Clustering coefficient | Protein name |
|---|---|---|---|
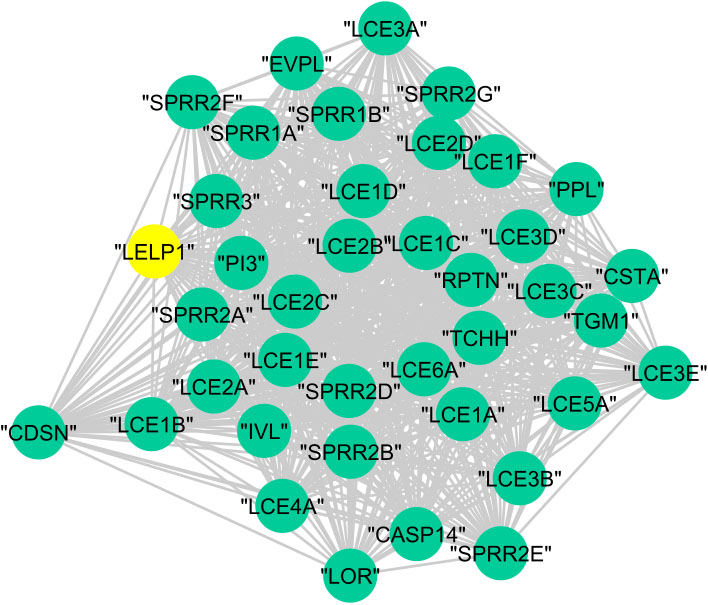
| A | 39 | 1 | “LCE1E” “PPL” “LCE1B” “LCE4A” “IVL” “LCE2D” “LCE1F” “LCE2B” “SPRR1A” “LCE2C” “LCE3B” “LCE1A” “SPRR2A” “SPRR2D” “LOR” “LCE3E” “LCE3D” “LCE6A” “LCE1C” “LCE2A” “TCHH” “SPRR2B” “SPRR2E” “SPRR2F” “SPRR3” “CASP14” “CDSN” “LCE3A” “CSTA” “SPRR2G” “LCE3C” “SPRR1B” “LELP1” “RPTN” “EVPL” “LCE5A” “PI3” “LCE1D” “TGM1” |
| B | 26 | 0.8083624 | “PPP2R5E” “PPP2R2A” “PPP2CA” “PPP2R3B” “BUB1” “CDCA8” “CCNB2” “PPP2R5C” “NUF2” “PPP2R4” “PPP2R1A” “CENPE” “INCENP” “AKT1” “PPP2R1B” “BIRC5” “PPP2R5D” “PPME1” “IGBP1” “NDC80” “LCMT1” “PPP2R5A” “PPP2CB” “AKT3” “AKT2” “PPP2R5B” |
| C | 22 | 0.7964387 | “CDK2” “FZR1” “CDK1” “CKS2” “CDC20” “ANAPC10” “CKS1B” “ANAPC4” “AURKB” “ESPL1” “CCNA2” “MAD2L1” “BUB1B” “PLK1” “CDC27” “UBE2C” “CCNB1” “PKMYT1” “FOXM1” “CCNB3” “CDKN1B” “AURKA” |
| D | 4 | 1 | “TPX2” “PBK” “KIF11” “NCAPG” |
| E | 4 | 1 | “MASTL” “PPP2R2D” “ARPP19” “ENSA” |
| F | 3 | 0 | “BCAR1” “SH2D3C” “PXN” |
| G | 3 | 1 | “CDC25C” “CDC25A” “WEE1” |
| H | 3 | 1 | “PRSS57” “SPECC1” “SH2D3A” |
Figure 11 shows that
Figure 11.
Graphical representation of a random small-world network.
A graph-based clustering technique using the MCL algorithm has been applied to the constructed COVID-19 disease – human PPI network. The MCL algorithm returned eight clusters without overlap. Among them, only seven clusters satisfied graph cluster validity through clustering coefficient between 0 and 1. Table 3 shows the results of MCL clusters.
Biological validation of the resultant clusters has been done using hypergeometric
Figure 12.
The graphical representation of protein cluster (A).
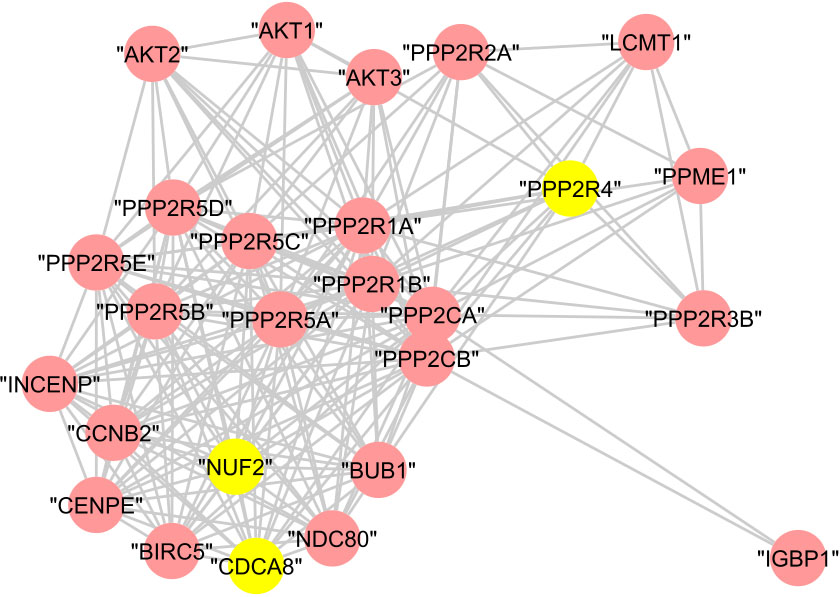
In cluster (B), 23 proteins are annotated to the regulation of cellular process with
Figure 13.
The graphical representation of protein cluster (B).
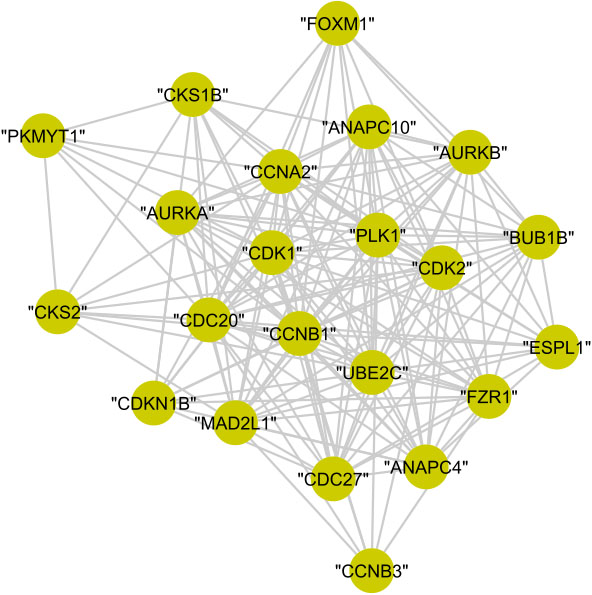
In cluster (C), the 22 proteins are annotated to the regulation of cell cycle with
Figure 14.
The graphical representation of protein cluster (C).
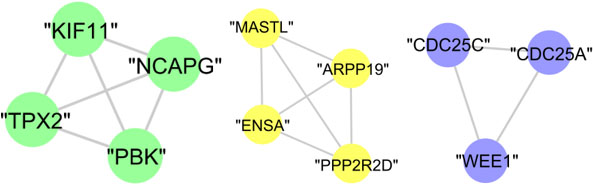
The whole proteins of cluster (D), cluster (E), and cluster (G) are annotated to mitotic cell cycle with
The graphical representation of biologically investigated protein cluster (D), cluster (E), and cluster (G) is shown in Fig. 15. Meanwhile, cluster (F) and cluster (H) has no statistically significant results.
Figure 15.
The graphical representation of protein clusters (D), (E), and (G).
The authors created a COVID-19 disease – human PPI network and analysed the topological characteristics applying the MCL clustering to find protein clusters. Then the resultant clusters were analysed topologically and biologically. We relied on the evaluation measure and the clustering coefficient to validate the clusters topologically.
The clustering coefficient of the identified six protein clusters was either 1 or closest to 1. Hence, the sub-graphs possesses a maximal structure. The gene ontology term of proteins in each cluster is associated with a list of genes and results in a fine
Figure 16.
Statistics of proteins annotated to the gene ontology term.
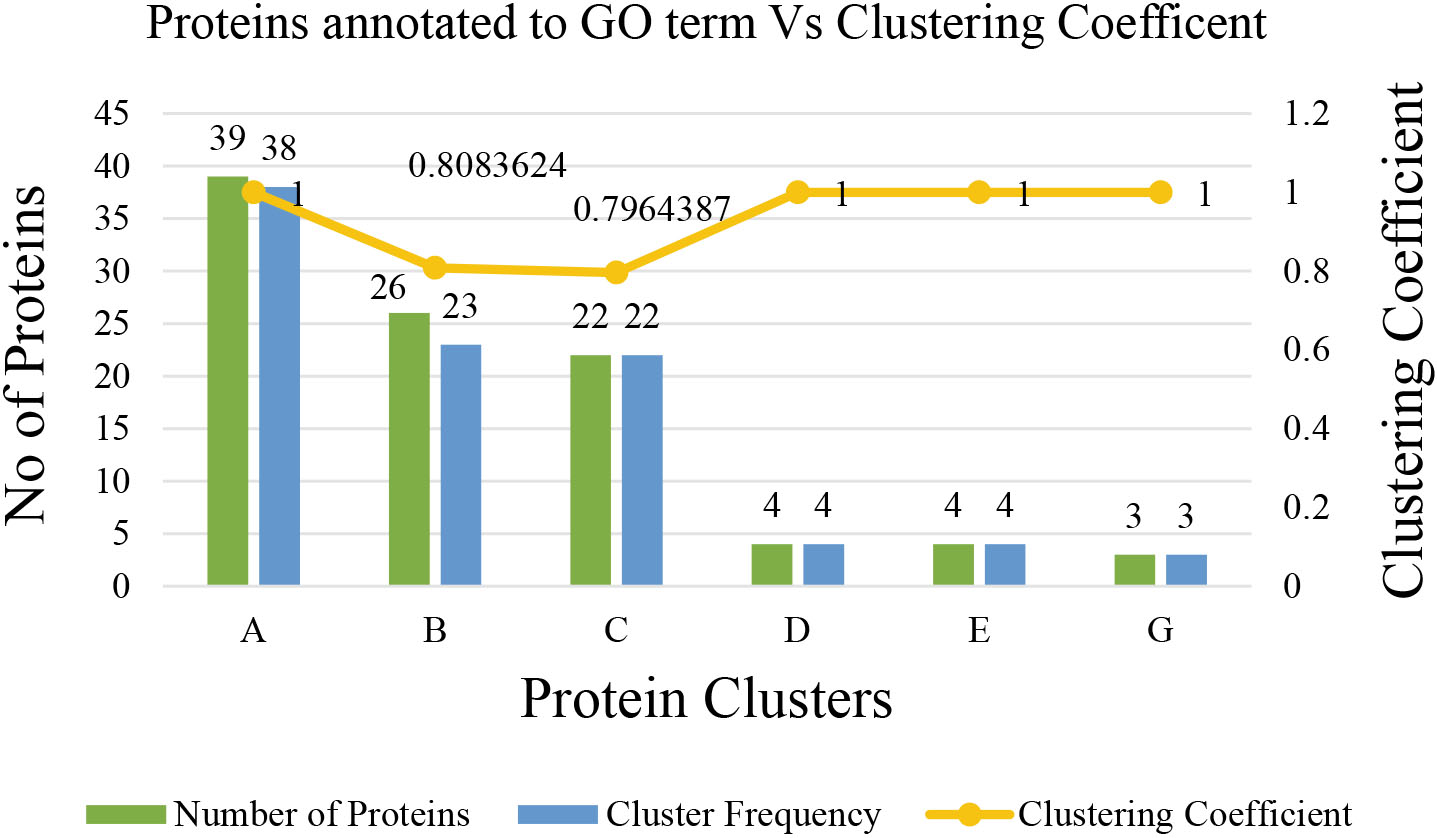
The topological analysis of the constructed COVID-19 disease – human PPI network provides evidence of the small world and scale-free properties of biological networks. Flow simulation-based graph clustering algorithm, MCL has been applied to the PPI network for further investigation and returned eight clusters. The clustering coefficient of MCL is equivalent to 0.8256, which implies that the clusters possess a maximal structure. The best feasible biological process associated with cluster (A) is keratinisation involving 38 proteins with
8.Possibilities, limitations, and future study
The identified protein complexes spectacle knowledge about the biological functions in the disease – human interacting proteins. This gives an advantage to the COVID-19 researchers for therapeutic purposes. Also, the computational method using topological analysis would be a piece of valuable information for the researchers in other fields too. The authors have generated a medium-size PPI network. In this method, the clusters generated depend on two input parameters: expansion and inflation. These varying parameter values generate clusters with different size and structure. For an extensive PPI network, fine-tuning to generate clusters with good structure is a time-consuming process. This model can be enhanced by applying an automatic fine-tuning of the input parameter values according to the data set.
9.Conclusion
PPI network is a core aspect of the knowledge of biological organisms. Moreover, distinct physiological movements inside the human body are responsible for these interactions. The computational method using topological characters of the network helps in analysing the interactions between COVID-19 disease proteins and human proteins. In this paper, a computational analysis of the topological characteristics of the PPI network and graph clustering has been done. The clustering coefficient of the resultant clusters provides us with the information that the protein clusters possess a maximal structure. The presented model revealed that COVID-19 disease – human PPI contains groups of densely connected proteins involved in the same biological processes. Furthermore, these dense sub-graphs have a maximal structure with high clustering coefficients. The model finds valuable information about the biological process of the protein groups, which would be helpful for therapeutic researchers to understand the dynamics of COVID-19 disease. Consequently, it is expected that this study will provide a relevant contribution to the researchers in the field of biomedicine. In this model, the size and structure of resultant clusters depend on the varying tuning parameters, expansion, and inflation. For larger network, this is a time-consuming process. Our future work focuses on designing a more effective model by applying an optimisation algorithm to tune the parameters automatically in order to get the clusters from a large PPI network. Moreover, we will focus on incorporating additional biological information and different algorithms to discover protein complexes.
Conflict of interest
The authors have declared no conflict of interest.
Compliance with ethics requirements
The article does not contain any studies with human or animal subjects.
References
[1] | World Health Organization. Novel-coronavirus. (2019) [cited 2020 April 4]. Available from: www.who.int/emergencies/diseases/. |
[2] | Yang P, Wang X. COVID-19: a new challenge for human beings. Cell Mol Immunol. (2020) . doi: 10.1038/s41423-020-0407-x. |
[3] | Cascella M, Rajnik M, Cuomo A, Dulebohn SC, Di Napoli R. Features, Evaluation and Treatment Coronavirus (COVID-19). In: StatPearls [Internet]. Treasure Island (FL): StatPearls Publishing. (2020) Jan-. Available from: https://www.ncbi.nlm.nih.gov/books/NBK554776/. |
[4] | Verity R, Okell LC, Dorigatti I, Winskill P, Whittaker C, Imai N, et al. Estimates of the severity of COVID-19 disease. medRxiv 2020.03.09.20033357. doi: 10.1101/2020.03.09.200. |
[5] | http://www.ecie.com.ar/images/paginas/COVID-19/4MMWR-Severe_Outcomes_Among_Patients_with_Coronavirus_Disease_2019_COVID-19-United_States_February_12-March_16_2020.pdf. |
[6] | Baud D, Qi X, Nielsen-Saines K, Musso D, Pomar L, Favre G. Real estimates of mortality following COVID-19 infection. The Lancet Infectious Diseases. 12 March (2020) . doi: 10.1016/S1473-3099(20)30195-X. |
[7] | Seng JJB, Yeam CT, Huang WC, Tan NC, Low LL. Pandemic related Health literacy – A Systematic Review of literature in COVID-19, SARS and MERS pandemics. medRxiv2020.05.07.20094227; doi: 10.1101/2020.05.07.20094227. |
[8] | Steffen R, Lars C, Sören M. COVID-19. Scenarios of a Superfluous Crisis. SSRN: https://ssrn.com/abstract=3564920 or doi: 10.2139/ssrn.3564920. March 2020. |
[9] | Gordon DE, Jang GM, Bouhaddou M, et al. A SARS-CoV-2 protein interaction map reveals targets for drug repurposing. Nature. (2020) ; 583: : 459–468. doi: 10.1038/s41586-020-2286-9. |
[10] | https://www.britannica.com/science/coronavirus-virus-group, [cited 2020 April 4]. |
[11] | Zinzalla G, Thurston DE. Targeting protein-protein interactions for therapeutic intervention: A challenge for the future. Future Med Chem. April (2009) ; 1: (1). doi: 10.4155/fmc.09.12. PMID: 21426071. |
[12] | Klapa MI, Tsafou K, Theodoridis E, Tsakalidis A, Moschonas NK. Reconstruction of the experimentally supported human protein interactome: What can we learn. BMC Syst. Biol. October (2013) ; 7: (96). doi: 10.1186/1752-0509-7-96. |
[13] | Md. R. Islam, Md. L. Ahmed, Paul BK. Topology Analysis of Protein-protein Interaction Network and Identification of Gene Ontology for Obstructive Sleep Apnea and Associated Diseases Using Bioinformatics Tools. 2019 IEEE International Conference on Biomedical Engineering, Computer and Information Technology for Health (BECITHCON) 28–30 November (2019) , Dhaka, Bangladesh. |
[14] | Liu X, Hong Z, Liu J, Lin Y, Rodríguez-Patón A, Zou Q, Zeng X. Computational methods for identifying the critical nodes in biological networks. Briefings in Bioinformatics. March (2020) ; 21: (2): 486–497. doi: 10.1093/bib/bbz011. |
[15] | Zhu F, Li F, Ling X, Liu Q, Shen B. Disease associated protein-protein interaction network reconstruction based on comprehensive influence analysis. bioRxiv. (2019) . doi: 10.1101/2019.12.18.880997. |
[16] | Zhou Y, Hou Y, Shen J, et al. Network-based drug repurposing for novel coronavirus 2019-nCoV/SARS-CoV-2. Cell Discoy. (2020) ; 6: (14). doi: 10.1038/s41421-020-0153-3. |
[17] | Chen S, Liao D, Chen C, et al. Construction and analysis of protein-protein interaction network of heroin use disorder. Sci Rep. (2019) ; 9: (4980). doi: 10.1038/s41598-019-41552-z. |
[18] | Wang J, Liang J, Zheng W, Zhao X, Mu J. Protein complex detection algorithm based on multiple topological characteristics in PPI networks. Information Sciences. (2019) ; 489: : 78–92. ISSN 0020-0255. doi: 10.1016/j.ins.2019.03.015. |
[19] | Rujirapipat S, McGarry K, Nelson D. Bioinformatic Analysis Using Complex Networks and Clustering Proteins Linked with Alzheimer’s Disease. In: Angelov P, Gegov A, Jayne C, Shen Q. (eds) Advances in Computational Intelligence Systems. Advances in Intelligent Systems and Computing, Springer, Cham, Vol. 513, (2017) . |
[20] | Rahiminejad S, Maurya MR, Subramaniam S. Topological and functional comparison ofcommunity detection algorithms inbiological networks. BMC Bioinformatics. (2019) ; 20: (212). doi: 10.1186/s12859-019-2746-0. |
[21] | Bustamam A, Mujtahidah I, Lestari D. Applications of fruit fly optimisation algorithm for analysing protein-protein interaction through Markov clustering on HIV virus. AIP Conference Proceedings 2023, 020231. (2018) . doi: 10.1063/1.5064228 Published Online: 23 October 2018 |
[22] | Zhang Z, Liang Y. Operon prediction model based on markov clustering algorithm. INT. J. BIOAUTOMATION. (2019) ; 23: (1): 105–116. doi: 10.7546/ijba.2019.23.1.105-116. |
[23] | Lei X, Yang X, Fujita H. Random walk based method to identify essential proteins by integrating network topology and biological characteristics. Knowledge-Based Systems. (2019) ; 167: : 53–67. ISSN 0950-7051. doi: 10.1016/j.knosys.2019.01.012. |
[24] | Nies HW, Zakaria Z, Mohamad MS, Chan WH, Zaki N, Sinnott RO, Napis S, Chamoso P, Omatu S, Corchado JM. A review of computational methods for clustering genes with similar biological functions. Processes. (2019) ; 7: : 550. |
[25] | Nascimento M, Carvalho A. A graph clustering algorithm based on a clustering coefficient for weighted graphs. Journal of the Brazilian Computer Society. (2011) ; 17: : 19–29. doi: 10.1007/s13173-010-0027-x. |
[26] | Yin H, Benson AR, Leskovec J. The Local Closure Coefficient: A New Perspective on Network Clustering. In Proceedings of the Twelfth ACM International Conference on Web Search and Data Mining (WSDM ’19). Association for Computing Machinery, New York, NY, USA. (2019) ; pp. 303–311. doi: 10.1145/3289600.3290991. |
[27] | Dongen VS. “Graph clustering by flow simulation,” PhD thesis: University of Utrecht. (2000) . |
[28] | Pastrello C, Kotlyar M, Jurisica I. Informed Use of Protein-Protein Interaction Data: A Focus on the Integrated Interactions Database (IID). In: Canzar S, Ringeling F. (eds) Protein-Protein Interaction Networks, Methods in Molecular Biology. Humana, New York, NY. Vol. 2074, (2020) . |
[29] | Bajpai AK, Davuluri S, Tiwary K, Narayanan S, Oguru S, Basavaraju K, Dayalan D, Thirumurugan K, Acharya KK. How helpful are the protein-protein interaction databases and which ones. bioRxiv 566372. doi: doi: 10.1101/566372. |
[30] | Szklarczyk D, Gable AL, Lyon D, Junge A, Wyder S, Huerta-Cepas J, Simonovic M, Doncheva NT, Morris JH, Bork P, Jensen LJ, von Mering C. STRING v11: Protein-protein association networks with increased coverage, supporting functional discovery in genome-wide experimental datasets. Nucleic Acids Research. 08 January (2019) ; 47: (D1): D607–D613. doi: 10.1093/nar/gky1131. |
[31] | Zahiri J, Emamjomeh A, Bagheri S, Ivazeh A, Mahdevar G, Tehrani HS, Mirzaie M, Fakheri BA, Mohammad-Noori M. Protein complex prediction: A survey. Genomics. January (2020) ; 112: (1): 174–183. |
[32] | Fang J, Cai C, Chai Y, Zhou J, Huang Y, Gao L, Wang Q, Cheng F. Quantitative and systems pharmacology 4. Network-based analysis of drug pleiotropy on coronary artery disease. European Journal of Medicinal Chemistry. 1 January (2019) ; 161: : 192–204. |
[33] | Jones KA, Kentala K, Beck MW, An W, Lippert AR, Lewis JC, Dickinson BC. Development of a split esterase for protein-protein interaction-dependent small-molecule activation. ACS Cent. Sci. September 24, (2019) ; 5: (11): 1768–1776. doi: 10.1021/acscentsci.9b00567. |
[34] | George G, Parambath SV, Lokappa SB, Varkey J. Construction of Parkinson’s disease marker-based weighted protein-protein interaction network for prioritisation of co-expressed genes. Gene. 20 May (2019) ; 697: : 67–77. |
[35] | Marziyeh K, Sadegh S. Identification of the effects of the existing network properties on the performance of current community detection methods. Journal of King Saud University – Computer and Information Sciences. (2020) . doi: 10.1016/j.jksuci.2020.04.007. |
[36] | |
[37] | Mikaela K, Evangelos K, David P-E, Georgios PA. A guide to conquer the biological network era using graph theory. Frontiers in Bioengineering and Biotechnology. (2020) ; 8: : 34. https://www.frontiersin.org/article/10.3389/fbioe.2020.00034, DOI=10.3389/fbioe.2020.00034, ISSN=2296-4185. |
[38] | Dubey P, Shingare A, Inamdar V. A force directed layout algorithm for biological networks. International Journal of Computer Applications (0975–8887). June (2015) ; 120: (No. 21). |
[39] | Fereydoun H, et al. Not all scale-free networks are born equal: The role of the seed graph in PPI network evolution. PLoS Computational Biology. (2007) ; 3: (7): e118. doi: 10.1371/journal.pcbi.0030118. |
[40] | Thareja R. Data Structures Using C. Second Edition, Oxford University Press, New Delhi. Chapter. 13, (2014) , 393–414. |
[41] | Kamada K, Kawai S. An algorithm for drawing general undirected graphs. Information Processing Letters. April (1989) ; 31: (1): 7–15. |
[42] | Kusuma WA, et al. Clustering of protein-protein interactions (PPI) and gene ontology molecular function using Markov clustering and fuzzy K partite algorithm. 2019 IOP Conf. Ser.: Earth Environ. Sci. 299 012034. |
[43] | Falih I, Grozavu N, Kanawati R, Bennani Y. ANCA: Attributed Network Clustering Algorithm. In: Cherifi C, Cherifi H, Karsai M, Musolesi M. (eds) Complex Networks & Their Applications VI. COMPLEX NETWORKS 2017. Studies in Computational Intelligence. Springer, Cham. Vol. 689, 2018. |
[44] | Celms E, et al. Application of Graph Clustering and Visualisation Methods to Analysis of Biomolecular Data. In: Lupeikiene A, Vasilecas O, Dzemyda G. (eds) Databases and Information Systems. DB&IS 2018. Communications in Computer and Information Science. Springer, Cham. Vol. 838, (2018) . |
[45] | Brémaud P. Random Walks on Graphs. In: Discrete Probability Models and Methods. Probability Theory and Stochastic Modelling, vol 78. Springer, Cham. Vol. 78, (2017) . |
[46] | Azad A, Pavlopoulos GA, Ouzounis CA, Kyrpides NC, Buluç A. HipMCL: A high-performance parallel implementation of the Markov clustering algorithm for large-scale networks. Nucleic Acids Research. 6 April (2018) ; 46: (6): e33. doi: 10.1093/nar/gkx1313. |
[47] | Hand J, Knowles J, Kell DB. Computational cluster validation in post-genomic data analysis. Bioinformatics. 21: (15): 3201–3212. doi: 10.1093/bioinformatics/bti517. |
[48] | Zaki N, Efimov D, Berengueres J. Protein complex detection using interaction reliability assessment and weighted clustering coefficient. BMC Bioinformatics. (2013) ; 14: : 163. doi: 10.1186/1471-2105-14-163. |
[49] | Jaya T, et al. Review on graph clustering and subgraph similarity based analysis of neurological disorders. International Journal of Molecular Sciences. 1 Jun. (2016) ; 17: (6): 862. doi: 10.3390/ijms17060862. |
[50] | Zhang X, Dai D, Ou-Yang L, et al. Detecting overlapping protein complexes based on a generative model with functional and topological properties. BMC Bioinformatics. (2014) ; 15: : 186. doi: 10.1186/1471-2105-15-186. |
[51] | http://geneontology.org/, [cited 2020 May 15]. |
[52] | https://version-11-0.string-db.org/, [cited 2020 May 15]. |
[53] | https://cytoscape.org/, [cited 2020 May 15]. |
[54] | http://bioconductor.org/packages/release/bioc/html/RCy3.html, [cited 2020 May 15]. |


