
Optimizing Electrostatic Similarity for Virtual Screening: A New Methodology
Abstract
Ligand Based Virtual Screening methods are widely used in drug discovery as filters for subsequent in-vitro and in-vivo characterization. Since the databases processed are enormously large, this pre-selection process requires the use of fast and precise methodologies. In this work, the similarity between compounds is measured in terms of electrostatic potential. To do so, we propose a new and alternative methodology, called LBVS-Electrostatic. Accordingly to the obtained results, we are able to conclude that many of the compounds proposed with our novel approach could not be discovered with the classical one.
1Introduction
The constant increase in the size of the databases used in Drug Discovery requires efficient techniques and methods that can be used to select the compounds most similarly to a query molecule and at the lowest possible cost. One of these techniques is Virtual Screening (VS). VS is an in-silico technique that allows large libraries with millions of compounds to be processed in order to find new compounds related to a pharmacological query based on one or more features (Hamza et al., 2012; Boström et al., 2013; Kumar and Zhang, 2016; Wang et al., 2009). This represents a great advantage over experimental methods such as High-Throughput Screening (HTS) in terms of efficiency, budget, time and development cost (Kar and Roy, 2013). The resulting compounds from VS are subsequently acquired and empirically tested in the laboratory. In addition, VS techniques are often used as a pre-filter for HTS (López-Ramos et al., 2009). All these advantages have increased the popularity of these techniques, which have experienced great advances over the last two decades. The interested reader is referred to previous works (Lešnik et al., 2015; Kalászi et al., 2014; Liu et al., 2011; Dou et al., 2018; Schmidt et al., 2018) for a description of different methods and tools currently used on VS.
However, there is still room for improvement regarding the accuracy of VS predictions so as not to discard promising compounds, or to reduce the time and error of calculations that compute the different features of the studied compounds (Böhm and Stahl, 2003). VS applied to the electrostatic similarity of compounds is a clear example of this. Contrary to what happens when VS is applied to select the most similar compounds in shape or pharmacophore properties, where the tools base their predictions on scoring functions that measure these particular features (Lešnik et al., 2015; Puertas-Martín et al., 2019; Yan et al., 2013), the predictions in this field are not exclusively based on this descriptor, but on both the similarity of the three dimensional shape and electrostatic similarity (Tresadern et al., 2009; Chu and Gochin, 2013; Kim et al., 2015; Kossmann et al., 2016; Woodring et al., 2017; Maccari et al., 2011; Kim et al., 2016; López-Ramos and Perruccio, 2010; Hevener et al., 2012; Kaoud et al., 2012; Tiikkainen et al., 2009; Massarotti et al., 2014; Oyarzabal et al., 2009).
Broadly speaking, all the previous works follow the same methodology, called LBVS-Shape throughout this paper, although they may differ in the selection procedure used to determine the compounds proposed as best predictions. Essentially, they initially optimize the compounds in the database against the query in terms of shape by using ROCS (OpenEye Scientific Software, 2019a). After that they select a number N of compounds with the highest shape similarity values and then finally evaluate them in terms of electrostatic similarity.
The value of N is not fixed, as it depends on the particular study. Usually, N is less than
Additionally, we also believe that using a more realistic description of compound bioactivity during the optimization procedure may help to obtain better predictions. As such, we propose a new approach as part of this work, named LBVS-Electrostatic, which involves the direct optimization of the electrostatic similarity. To do so, a new version of the algorithm OptiPharm, called OptiPharm_ES, has been implemented. OptiPharm (Puertas-Martín et al., 2019) was initially designed to optimize the shape similarity between two given molecules, but now it has been adapted to maximize the electrostatic similarity. As results will show, the new LBVS-Electrostatic methodology is able to obtain better solutions than the ones obtained with the classical LBVS-Shape approach.
The rest of the paper is organized as follows. Section 2 gives a brief description about the mathematical formulation of the scoring functions. Sections 3 and 4 describe the two methods used for virtual screening based on electrostatic similarity, both the literature approach and the novel proposal. The former is currently the method most frequently used in the literature. In short, it computes a sublist of molecules with the highest three-dimensional shape similarity. Usually, such a sublist is only composed of less than
2Scoring Functions to Measure Similarity Between Compounds
This section is devoted to defining the mathematical functions used to guide the searching processes. The figures in which the values of these objective functions are graphically represented have been created with VIDA v4.4.0 (OpenEye Scientific Software, 2019b) using the default configuration.
2.1Shape Similarity
The shape similarity of two compounds is calculated as follows:
(1)
(2)
Notice that the accuracy obtained from (1) depends on the number of atoms in the two compared molecules, i.e. the higher this number, the longer the value of
(3)
2.2Electrostatic Similarity
The electrostatic similarities are obtained by numerical solution of the Poisson equation (Böttcher et al., 1974), viz:
(4)
(5)
Again the accuracy obtained by (5) depends on the number of atoms in the compared molecules. As such, similarly to what was done previously, the Tanimoto Similarity (Jaccard, 1901) value has been computed as follows:
(6)
3The Previous Approach: The LBVS Method Guided by Molecular Shape (LBVS-Shape)
This method bases its predictions on a previous pre-filtering process consisting of identifying the N candidate compounds from the database with the highest shape similarity. After that, for each selected compound, the electrostatic similarity is calculated at the optimum superimposition obtained in the previous stage. Finally, the molecule with the highest electrostatic similarity value is selected as the one for the solution.
In this work, we have used the tool ROCS (OpenEye Scientific Software, 2019a) to optimize the shape similarity between two molecules. ROCS is a parametrized piece of software used to maximize volume overlapping similarity and utilizes the previously described (3) to represent molecules by means of Gaussian functions (Grant and Pickup, 1995; Grant et al., 1996). Electrostatic similarity has been calculated using the ZAP Toolkit (see (6)). This software has been downloaded without modification from the original website (OpenEye Scientific Software, 2019c). It is worth mentioning that ROCS and ZAP are, by far, the most widely used tools in the literature for VS based on shape and electrostatic similarity (Ellingson et al., 2010; Thomas et al., 2013; Hawkins and Stahl, 2018; Connelly et al., 2015; Gowthaman et al., 2015). For this reason they have been selected as part of this study; i.e. a fair and complete study must be carried out by making a comparison with the state-of-the-art methods.
4The New Approach: A LBVS Method Guided by Electrostatic Similarity (LBVS-Electrostatic)
Our main aim when using this approach is to obtain the compound(s) with the highest electrostatic similarity values. Thus, an optimization problem must be defined with this aim in mind. Broadly speaking, any tool, method or algorithm used will be better guided towards the optima if the objective function is a numerical model representing the real objective. Until now, most methods focus on prioritizing the search of compounds with the same global shape, while they place electrostatic similarities at much lower priority. Consequently, they solve a shape similarity optimization problem instead of focusing on the electrostatic similarity, which may be more useful from the drug discovery point of view.
The new approach being presented here is based on the idea that the scoring function used to guide the optimization method must be mainly based on electrostatic similarity, since it is very likely that compounds with very high electrostatic similarity will share very similar chemical properties. The same can not be said while just focusing on shape similarity. In the latter, the search may converge to a sub-optimal solution (Ivorra et al., 2018; Fernández et al., 2017, 2019). OptiPharm (Puertas-Martín et al., 2019), a recent algorithm proposed for working on LBVS problems, is used to prove our hypothesis. The interested reader is referred to as Puertas-Martín et al. (2019) for an in-depth description of this algorithm. For the sake of completeness, some of its main strengths and important features are briefly described in the following.
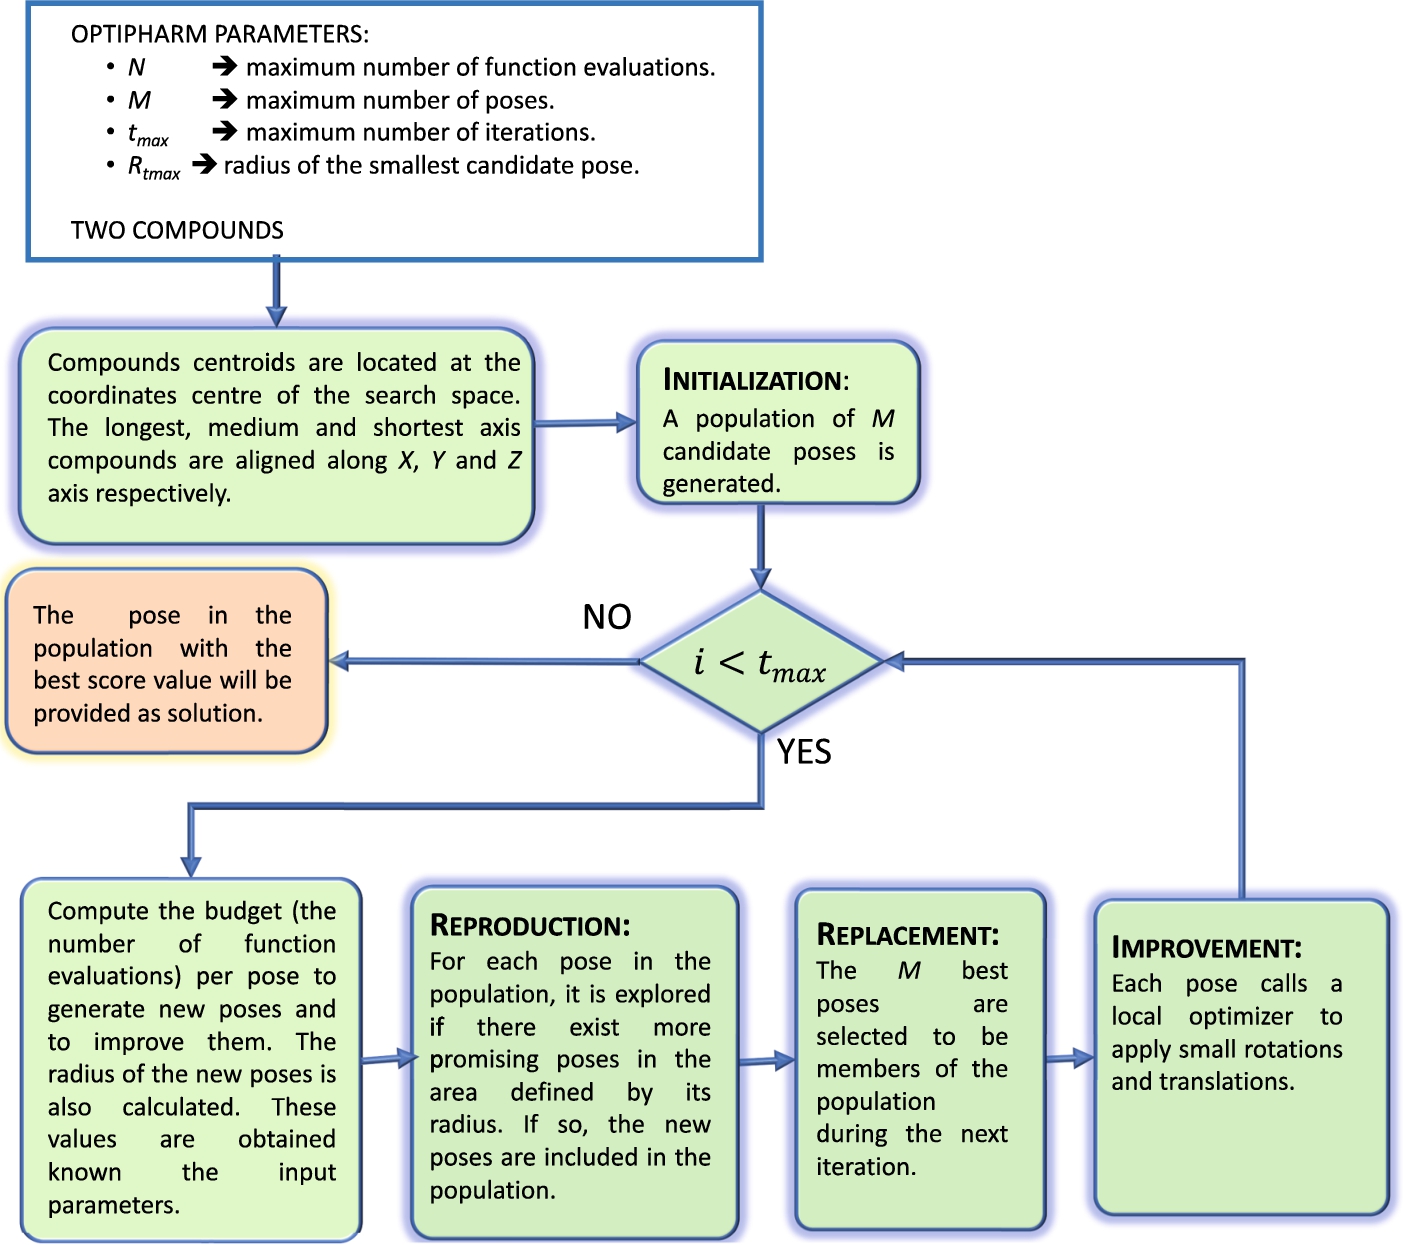
OptiPharm is a global evolutionary optimizer that can solve any optimization problem that concerns the computation of the similarity of two compounds, named query and target. It implements procedures to increasingly adjust the query molecule to the target, which remains fixed throughout the optimization method. A solution s represents the rotation and translation of the query with respect to the target. The parameters associated with s are dynamically bounded for each particular instance to reduce as much as possible the feasible region.
OptiPharm analyses the entire search space looking for likely areas where the local and global optima can be. To do so, it runs on a set of M solutions, called population, on which it applies a sequence of reproduction, selection and improvement procedures during several iterations.
Each solution in the population has a radius value that delimits a multidimensional subarea of the search space where the reproduction and improvement methods are applied. The radius corresponding to a solution depends on the iteration i where it was created. The real strength of the radius is that it allows us to focus the search on different subareas since many solutions with different radii can coexist simultaneously during the optimization procedure. Therefore, at the same stage of the optimization procedure, new promising regions are systematically analysed, while others are examined thoroughly. Besides, the maximum number of initial solutions M, the number of iterations
Figure 1 shows the main stages of the algorithm and a brief description of the procedures implemented.
Fig. 1
OptiPharm algorithm: main stages.
During this work, the scope of its functionalities has been extended to include the electrostatic potential as the scoring function. The new version has been called OptiPharm_ES. The electrostatic similarity between two compounds has been computed by using the source code of the ZAP Toolkit, also downloaded from https://docs.eyesopen.com/toolkits/cpp/zaptk/thewayofzap.html (OpenEye Scientific Software, 2019c). This approach ensures that the comparisons between methodologies are made under the same conditions. Additionally, OptiPharm_ES have been made available at https://hpca.ual.es/optipharm/ES.
4.1Hardware Setup
All the experiments in this work have been executed using a Bullx R424-E3, which consists of 2 Intel Xeon E5 2650v2 (16 cores), 128 GB of RAM memory and 1 TB HDD (http://hpca.ual.es/en/infraestructure) along with the cluster Eagle https://wiki.man.poznan.pl/hpc/index.php?title=Eagle.
4.2Benchmarks
In this work, a database provided by The Food and Drug Administration has been used (FDA). The Food and Drug Administration is a federal agency of the United States Department of Health and Human Services responsible for protecting and promoting public health by controlling, among other things, prescription and over-the-counter pharmaceutical drugs (medications). This agency provides a data set containing 1751 compounds, which represents approved medicines that can be safely used on humans in the USA. This database is useful since in the high similarity cases it would directly contribute to drug re-purposing. This is of relevant utility given the clear trend regarding re-purposing drugs observed over the last 5 years (Dakshanamurthy et al., 2012; Kumar and Zhang, 2018; Yuan et al., 2017).
The version of the database used in this work was obtained from DrugBank v5.0.1 (Wishart et al., 2018) and necessary mol2 files for the VS calculations were set up by using AmberTools (Case et al., 2017) by removing salts and neutralizing their protonation state, computing partial charges by MMFF94 force field, adding hydrogen atoms and minimizing energies (default parameters) (Halgren, 1995).
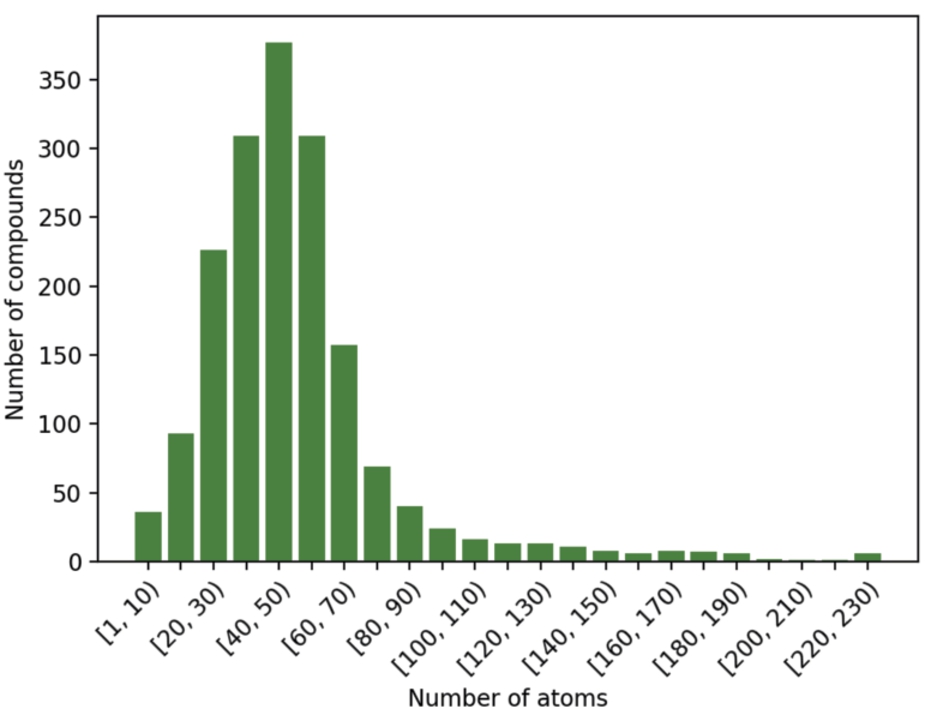
A comprehensive computational analysis may cover a representative sample of the database. The compounds included in the FDA database have different attributes, one of the most relevant for the study at hand being the number of atoms. In this work, a selection of 50 compounds has been made in the following way: the compounds in the database have been sorted by the number of atoms, including hydrogen, and then divided into 24 intervals (see Fig. 2). From each sector, at least one compound was chosen at random and proportional to the number of compounds in the sector.
Fig. 2
Number of compounds included in the FDA database, according to their number of atoms.
Finally, these comparisons between compounds have been run using OptiPharm_ES with the following input parameter configuration:
5Results
5.1Influence of the Size List of Top-Ranked Compounds in the LBVS-Shape Method
As previously mentioned, the LBVS-Shape bases its predictions on a pre-selection of the first best compounds in terms of superimposition score (N). In this subsection, a study has been conducted to know how the value of N affects the final results from the point of view of electrostatic similarity. In particular, the LBVS-Shape has been performed on the selected 50 queries and for five different values of N, i.e. N has been set to 175, 438, 876, 1313 and 1751 compounds. It means that for each query, we have selected either
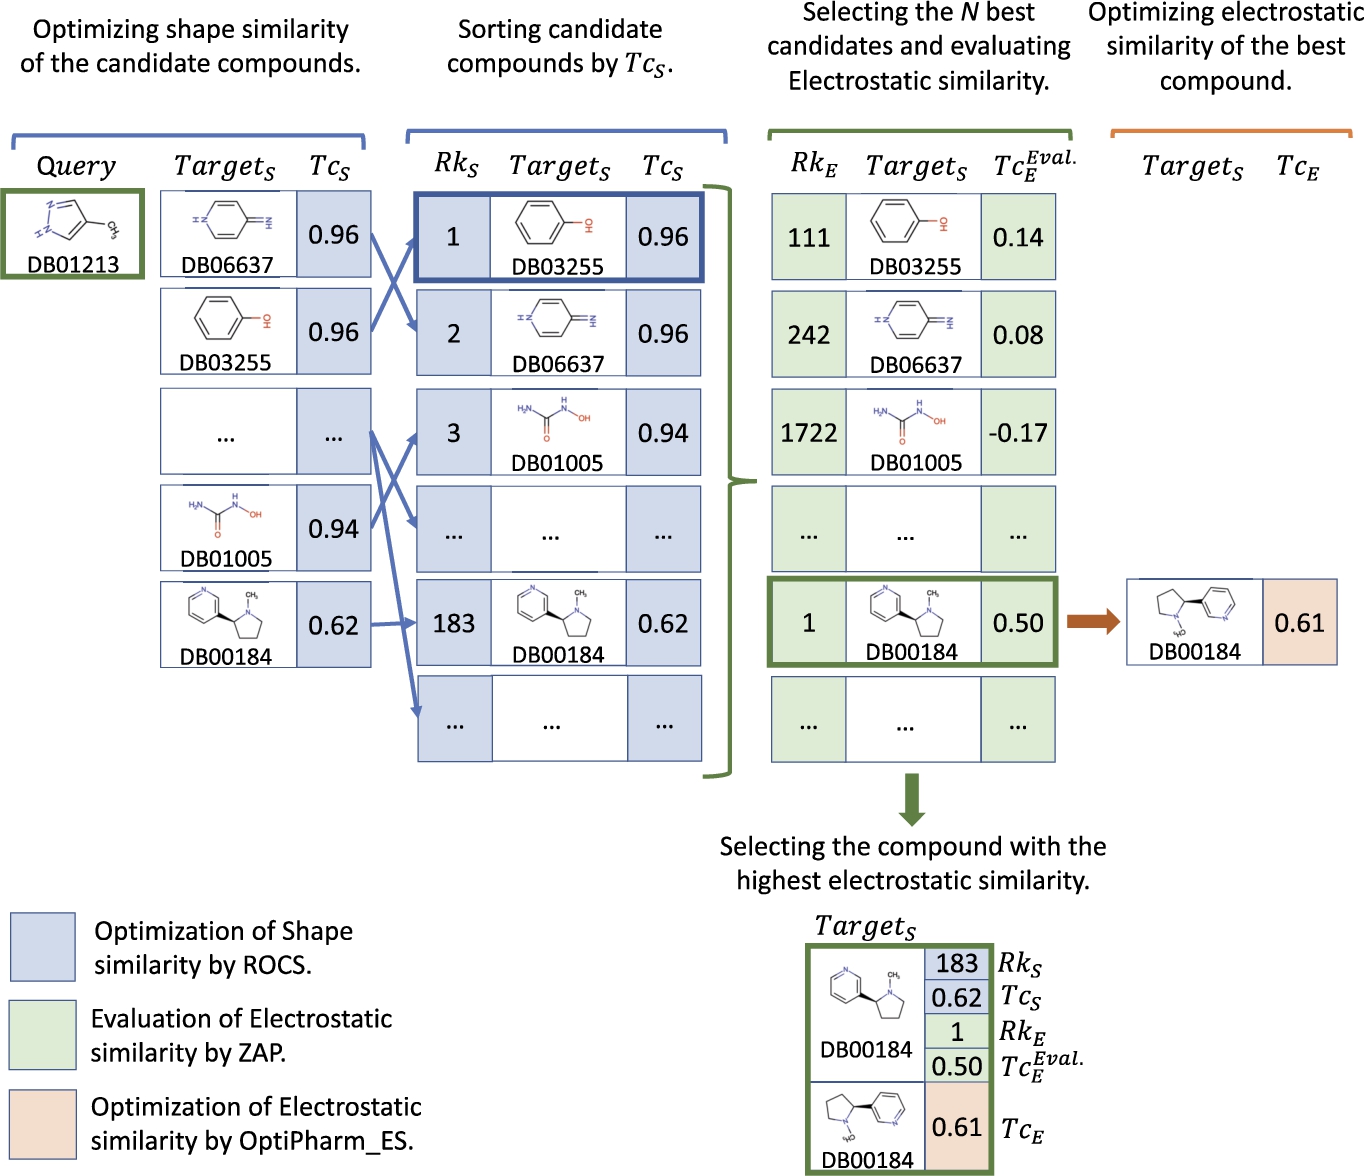
Figure 3 illustrates a toy example of the main steps of the LBVS-Shape method for the
Fig. 3
Toy example of the performance of the LBVS-Shape method for a particular case where
To get an overview of the results, average values of the BestComp found for the 50 queries and each value for N have been computed, and shown in Table 1. In particular, the average position
As it can be seen, the predictions seem to improve in term of electrostatic similarity as the number N of selected molecules in the sorted list increases (see columns
Table 1
Influence of the parameter N in the results obtained by the LBVS-Shape method. For each value of N, the following average values from the 50 queries, are shown: position in the shape ranking (
| N |
|
|
|
|
|
| 175 | 73 | 53 | 0.627 | 0.451 | 0.559 |
| 438 | 162 | 50 | 0.587 | 0.486 | 0.568 |
| 876 | 287 | 51 | 0.564 | 0.495 | 0.569 |
| 1313 | 324 | 50 | 0.559 | 0.497 | 0.570 |
| 1751 | 362 | 49 | 0.554 | 0.497 | 0.569 |
5.2Performance Comparison Between LBVS-Shape and LBVS-Electrostatic Methods
To analyse the performance of both methods, we have conducted a study in which the selected 50 molecular queries are processed with reference to the FDA database. Notice that comparing a query with itself always reaches the maximum similarity value, both for electrostatic potential as well as for shape. Subsequently, these results were removed when ranking the compounds. In other words, the compounds given as a result are not the most similar ones, but the second compounds in the ranked list. Additionally, as previously mentioned, the traditional method has been carried out considering the total number of compounds in the database
To illustrate how we generate the later summarizing tables, a sample of the results obtained by both methods when comparing a query to the molecules in the dataset is studied. In particular, the instance
Fig. 4
An example of the performance of the LBVS-Electrostatic method for a particular case where
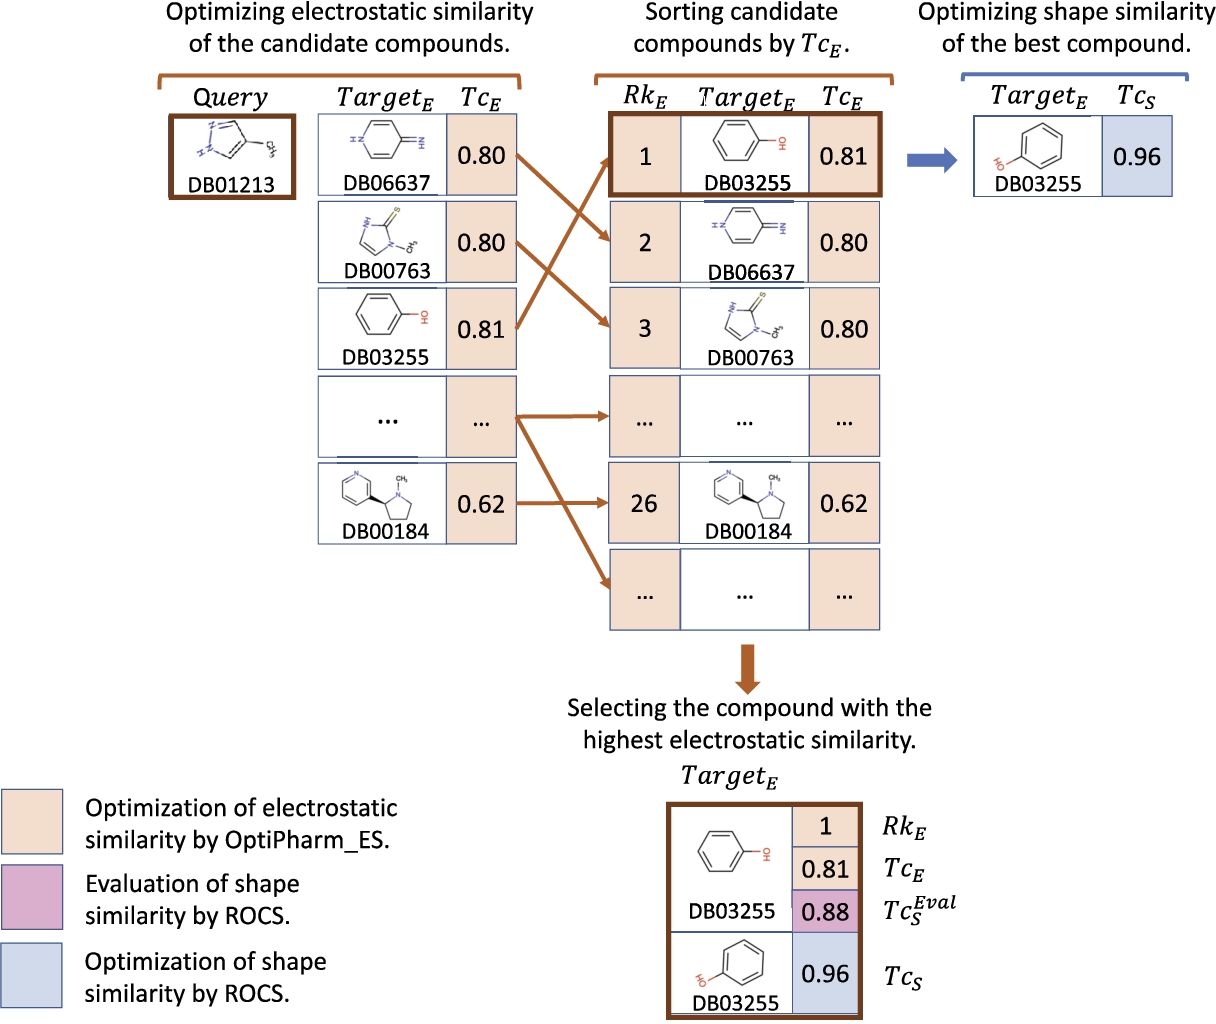
For the sake of clarity and comparison, the results shown in Figs. 3 and 4 are summarized in Table 2. The meaning of the columns as well as the particular values in the tables, are the ones previously explained and shown in each figure. The last row corresponds to the values associated with the best predictions. As can be observed, each method obtains a different compound as a top solution. LBVS-Shape provides the DB00184 molecule with a
Table 2
Summary of the results obtained for both LBVS-Shape and LBVS-Electrostatic methods for the query compound DB01213. The column notation, the colours included and the corresponding results come from Figs. 3 and 4, i.e. they maintain the same meaning as shown previously for those pictures. The last row indicates the results associated with the top solution selected for each method.
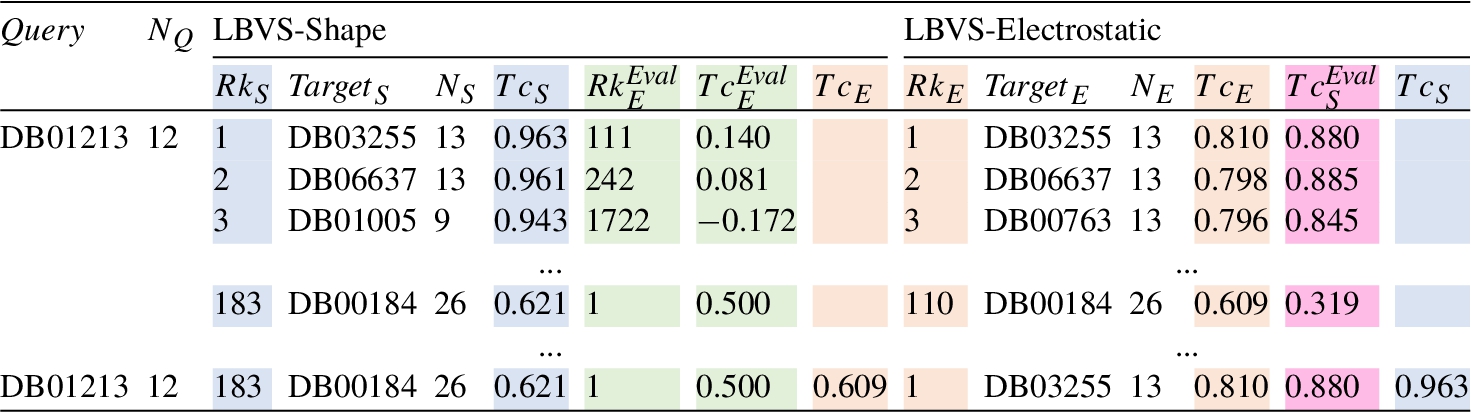
Fig. 5
Summary of results of LBVS-Shape and LBVS-Electrostatic where
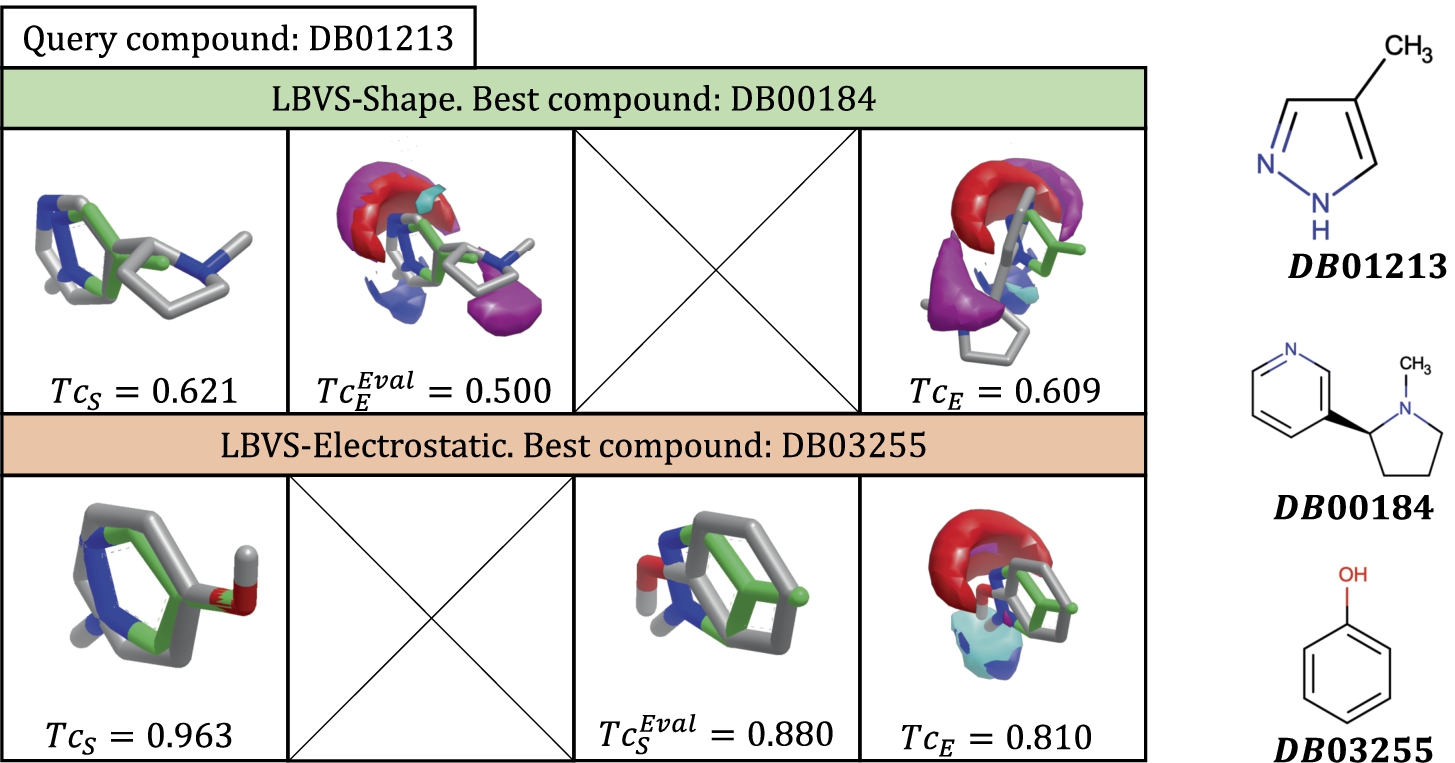
Table 3
Rows are sorted by the number of atoms of queries. For each query, the same procedure explained in Table 2 is followed. The last row summarizes the average values for each column.
|
|
| LBVS-Shape | LBVS-Electrostatic | |||||||||
|
|
|
|
|
|
|
|
|
|
|
| ||
| DB00529 | 10 | 316 | DB05266 | 35 | 0.496 | 0.437 | 0.593 | DB00818 | 31 | 0.720 | 0.468 | 0.614 |
| DB01213 | 12 | 182 | DB00184 | 26 | 0.621 | 0.500 | 0.609 | DB03255 | 13 | 0.810 | 0.880 | 0.963 |
| DB00173 | 15 | 102 | DB00851 | 23 | 0.792 | 0.546 | 0.536 | DB01119 | 21 | 0.834 | 0.777 | 0.830 |
| DB00172 | 17 | 24 | DB00128 | 16 | 0.881 | 0.469 | 0.561 | DB00677 | 25 | 0.699 | 0.690 | 0.769 |
| DB00331 | 20 | 380 | DB00961 | 40 | 0.598 | 0.599 | 0.697 | DB01018 | 24 | 0.790 | 0.559 | 0.649 |
| DB01119 | 21 | 513 | DB00828 | 15 | 0.655 | 0.519 | 0.613 | DB00173 | 15 | 0.832 | 0.779 | 0.829 |
| DB02513 | 25 | 27 | DB01275 | 20 | 0.872 | 0.526 | 0.569 | DB06637 | 13 | 0.915 | 0.745 | 0.805 |
| DB00915 | 28 | 125 | DB00160 | 13 | 0.684 | 0.404 | 0.543 | DB00478 | 34 | 0.946 | 0.673 | 0.924 |
| DB01352 | 29 | 1 | DB00306 | 32 | 0.926 | 0.947 | 0.983 | DB00306 | 32 | 0.983 | 0.901 | 0.926 |
| DB01365 | 30 | 180 | DB01191 | 33 | 0.738 | 0.902 | 0.960 | DB01626 | 26 | 0.964 | 0.628 | 0.824 |
| DB00657 | 33 | 47 | DB06770 | 16 | 0.788 | 0.396 | 0.517 | DB01043 | 34 | 0.979 | 0.609 | 0.861 |
| DB00478 | 34 | 30 | DB00752 | 21 | 0.787 | 0.508 | 0.637 | DB01043 | 34 | 0.957 | 0.615 | 0.879 |
| DB01043 | 34 | 27 | DB00945 | 21 | 0.765 | 0.400 | 0.478 | DB00657 | 33 | 0.973 | 0.711 | 0.861 |
| DB00380 | 35 | 601 | DB00731 | 50 | 0.620 | 0.380 | 0.407 | DB08971 | 56 | 0.505 | 0.435 | 0.655 |
| DB00693 | 37 | 1034 | DB04575 | 59 | 0.525 | 0.362 | 0.429 | DB00692 | 40 | 0.454 | 0.391 | 0.783 |
| DB09185 | 37 | 243 | DB01233 | 43 | 0.722 | 0.839 | 0.506 | DB09021 | 39 | 0.916 | 0.429 | 0.650 |
| DB07615 | 40 | 71 | DB04552 | 28 | 0.704 | 0.861 | 0.866 | DB09218 | 28 | 0.892 | 0.610 | 0.574 |
| DB09219 | 40 | 123 | DB00321 | 44 | 0.698 | 0.347 | 0.329 | DB00316 | 20 | 0.450 | 0.249 | 0.462 |
| DB00674 | 42 | 279 | DB00575 | 23 | 0.688 | 0.505 | 0.653 | DB00514 | 45 | 0.662 | 0.415 | 0.695 |
| DB00887 | 45 | 209 | DB00232 | 31 | 0.642 | 0.401 | 0.454 | DB01127 | 39 | 0.662 | 0.378 | 0.576 |
| DB01198 | 45 | 273 | DB00209 | 59 | 0.648 | 0.748 | 0.768 | DB00123 | 25 | 0.894 | 0.334 | 0.491 |
| DB01155 | 48 | 1 | DB01165 | 46 | 0.858 | 0.671 | 0.818 | DB01208 | 50 | 0.899 | 0.385 | 0.835 |
| DB00246 | 50 | 467 | DB00268 | 44 | 0.542 | 0.843 | 0.852 | DB05271 | 48 | 0.877 | 0.391 | 0.604 |
| DB00381 | 53 | 525 | DB00573 | 32 | 0.577 | 0.285 | 0.278 | DB00630 | 27 | 0.377 | 0.397 | 0.524 |
| DB00876 | 54 | 576 | DB01002 | 49 | 0.516 | 0.395 | 0.505 | DB00774 | 28 | 0.532 | 0.276 | 0.524 |
| DB09237 | 54 | 380 | DB09092 | 44 | 0.580 | 0.759 | 0.824 | DB08998 | 40 | 0.902 | 0.447 | 0.596 |
| DB00254 | 55 | 1100 | DB00271 | 28 | 0.521 | 0.626 | 0.836 | DB00271 | 28 | 0.836 | 0.219 | 0.521 |
| DB01268 | 57 | 902 | DB09014 | 54 | 0.518 | 0.792 | 0.765 | DB01409 | 48 | 0.883 | 0.421 | 0.564 |
| DB01196 | 60 | 7 | DB00783 | 44 | 0.741 | 0.397 | 0.385 | DB08797 | 17 | 0.527 | 0.195 | 0.385 |
| DB01621 | 66 | 274 | DB00268 | 44 | 0.552 | 0.821 | 0.845 | DB04861 | 55 | 0.867 | 0.330 | 0.454 |
| DB09236 | 66 | 459 | DB00607 | 51 | 0.509 | 0.406 | 0.438 | DB00449 | 54 | 0.664 | 0.439 | 0.551 |
| DB00632 | 69 | 537 | DB00511 | 123 | 0.348 | 0.067 | 0.246 | DB00898 | 9 | 0.997 | 0.126 | 0.137 |
| DB08903 | 69 | 6 | DB01433 | 58 | 0.621 | 0.840 | 0.867 | DB01359 | 51 | 0.888 | 0.307 | 0.464 |
| DB01419 | 70 | 380 | DB09209 | 61 | 0.431 | 0.854 | 0.879 | DB01611 | 51 | 0.933 | 0.291 | 0.423 |
| DB00320 | 80 | 204 | DB00438 | 59 | 0.515 | 0.367 | 0.396 | DB00120 | 23 | 0.563 | 0.245 | 0.278 |
| DB00728 | 91 | 1383 | DB06204 | 40 | 0.399 | 0.688 | 0.761 | DB09131 | 3 | 0.874 | 0.068 | 0.101 |
| DB00503 | 98 | 655 | DB00206 | 84 | 0.371 | 0.256 | 0.243 | DB01144 | 22 | 0.401 | 0.180 | 0.280 |
| DB01232 | 100 | 639 | DB06480 | 52 | 0.389 | 0.691 | 0.741 | DB09089 | 58 | 0.791 | 0.290 | 0.387 |
| DB00309 | 110 | 385 | DB01603 | 45 | 0.455 | 0.241 | 0.297 | DB00319 | 63 | 0.467 | 0.267 | 0.534 |
| DB04786 | 120 | 4 | DB09158 | 82 | 0.377 | 0.424 | 0.708 | DB09159 | 18 | 0.910 | 0.108 | 0.120 |
| DB09114 | 130 | 117 | DB00595 | 57 | 0.376 | 0.273 | 0.506 | DB00583 | 26 | 0.876 | 0.183 | 0.190 |
| DB06439 | 137 | 657 | DB01628 | 39 | 0.383 | 0.336 | 0.425 | DB00878 | 64 | 0.488 | 0.274 | 0.423 |
| DB01078 | 140 | 34 | DB00204 | 56 | 0.424 | 0.201 | 0.259 | DB01085 | 31 | 0.540 | 0.169 | 0.211 |
| DB01590 | 151 | 1037 | DB01193 | 53 | 0.265 | 0.248 | 0.358 | DB00653 | 6 | 0.529 | 0.070 | 0.100 |
| DB04894 | 152 | 82 | DB01199 | 87 | 0.361 | 0.348 | 0.484 | DB09131 | 3 | 0.662 | 0.006 | 0.040 |
| DB00403 | 167 | 325 | DB04855 | 84 | 0.261 | 0.325 | 0.395 | DB06335 | 49 | 0.575 | 0.120 | 0.198 |
| DB00732 | 169 | 640 | DB08967 | 52 | 0.222 | 0.236 | 0.353 | DB00653 | 6 | 0.508 | 0.051 | 0.069 |
| DB00050 | 194 | 7 | DB01369 | 141 | 0.349 | 0.238 | 0.383 | DB00516 | 19 | 0.385 | 0.059 | 0.080 |
| DB06699 | 221 | 1465 | DB01245 | 56 | 0.119 | 0.365 | 0.513 | DB09131 | 3 | 0.642 | 0.013 | 0.029 |
| DB06219 | 229 | 69 | DB01369 | 141 | 0.293 | 0.277 | 0.394 | DB09131 | 3 | 0.670 | 0.009 | 0.021 |
| Mean | 74 | 362 | – | 49 | 0.554 | 0.497 | 0.569 | – | 31 | 0.738 | 0.372 | 0.505 |
Once the specific case of DB01213 has been explained in detail, the results of the 50 queries have been summarized in Table 3. Columns
As evidenced, LBVS-Electrostatic obtains on average
Regarding shape similarity, it is possible to infer that, on average, the methods are equivalent in terms of accuracy of the predictions, i.e. LBVS-Shape obtains an average value of
Making a somewhat more detailed approach for compounds smaller than 50 atoms, which means the first 23 query compounds in the table, there are 5 cases where the difference is less than 0.05 (DB00529, DB00173, DB00331, DB00915 and DB01352) and in another 3 cases the difference is 0.1 (DB01043, DB07615 and DB01268). Considering the values of these 7 cases in which the shape LBVS-Electrostatic is smaller than that of LBVS-Shape, the average difference is 0.048, while the mean gain in electrostatic similarity for those 7 compounds is 0.271. In large compounds, which includes 27 queries, there are only two cases with similar characteristics, which are compounds DB09236 with a difference of 0.07 and DB06699 with a difference of 0.013, both of them for shape similarity. In view of these results, the LBVS-Electrostatic method seems to be justified when proposing new solutions for small compounds.
However, not all the improvements are related to electrostatic fields. The optimization of electrostatic potential using OptiPharm_ES might allow a better solution to be found in terms of shape too. Compounds DB01119 and DB1213 in Table 3 are some outstanding examples. For example, in the case of
5.3ZAP Toolkit Accuracy Problem
The ZAP Toolkit has been widely used in the literature to calculate the electrostatic similarity score for two compounds (Boström et al., 2013; Tresadern et al., 2009; Chu and Gochin, 2013; Kim et al., 2015; Kossmann et al., 2016; Woodring et al., 2017; Maccari et al., 2011; Kim et al., 2016; López-Ramos and Perruccio, 2010; Hevener et al., 2012; Kaoud et al., 2012; Tiikkainen et al., 2009; Massarotti et al., 2014; Oyarzabal et al., 2009; Haque and Pande).
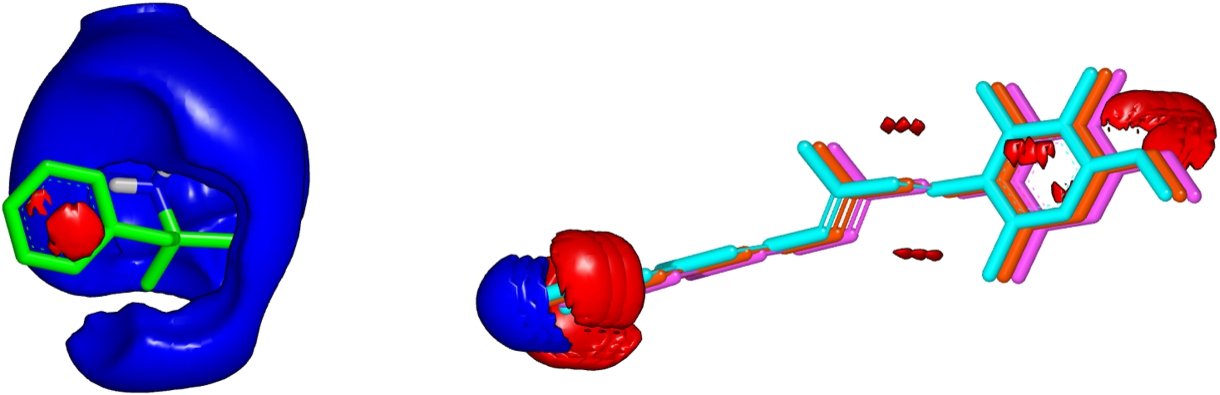
In this subsection we would like to remark that the ZAP Toolkit can return an erroneous value, which was discovered when using OptiPharm_ES. During the optimization procedure, OptiPharm_ES can progressively separate two input compounds aimed to escape from local optima and explore the searching space in depth. In fact, it is possible to analyse cases where no overlap exists between the input molecules. During the analysis of the results, we discovered that cases exist where the ZAP Toolkit can overflow, mainly when situations such as the previously mentioned happen. See Fig. 6 to see a particular example. Herein, compound DB01365 remains fixed on the left while compound DB00459 occupies three positions (red, blue and pink). The red compound obtains an electrostatic similarity value of 1. The light blue compound is displaced half a unit to the left, i.e. closer to the reference compound and its similarity value is 0.38. The pink compound is shifted 0.5 units to the right, that is, away from the reference compound. Its similarity value is 0. Calculations can be made using the ZAP Python script available at https://docs.eyesopen.com/toolkits/python/zaptk/thewayofzap.html in the Electrostatic Similarity section.
This problem has been solved in OptiPharm_ES by considering the poses with the previously mentioned problem unfeasible. It means that they are no longer considered during the optimization process.
Fig. 6
Compound DB01365 is printed green. Compound DB00459 is represented in three coloured figures: light blue, red and pink. Electrostatic fields are printed in dark blue and red using VIDA.
6Conclusions
In this work, a new approach to solve the LBVS problem based on the electrostatic similarity has been put forward. It has been called LBVS-Electrostatic. This methodology is based on the direct optimization of electrostatic similarity. For this purpose, a new version of OptiPharm has been used. Conversely, the method proposed in the literature, which has been named LBVS-Shape throughout the paper, looks for a sublist of the top compounds with the highest shape similarity by using ROCS, to later evaluate their electrostatic similarity with ZAP. In this work, a study to analyse the influence of the number of compounds in such a sublist has been carried out. As the results have shown, the larger the number of molecules considered, the better the prediction obtained in terms of electrostatic similarity. From this conclusion, a computational study has been carried out to compare the new method LBVS-Electrostatic with the one in the literature LBVS-Shape. To increase the probability of finding good predictions, LBVS-Shape has been executed taking into account the whole database prior to the electrostatic similarity evaluation. Even so, LBVS-Electrostatic performs better than LBVS-Shape, achieving better predictions in electrostatic potential for the 50 queries included in the study. Regarding the shape similarity, both methods behave in a similar fashion, on average obtaining compounds with similar shape similarity values. It is important to mention that the new methodology proposed in this paper is novel, which means that the predictions proposed have not been analysed previously.
Finally, we have shown that ZAP can return erroneous values. This is an important discovery, since it is the most commonly used software in the literature to measure the electrostatic similarity.
In the future, we have plans to implement this objective function from scratch, but for the study at hand, we considered that it was more important to compare it with the state-of-the-art software. Additionally, other functions measuring the pharmacophore similarity will be implemented. Finally, we will analyse the problem from a multi-objective perspective, where shape an electrostatic similarity are optimized simultaneously.
Appendices
A
AAppendix Availability of data and materials
• Project name: OptiPharm_ES.
• Project home page: https://hpca.ual.es/optipharm/ES/.
• Project source code repository: https://gitlab.hpca.ual.es/savins/optipharm_es.
• Operating system(s): Linux and MacOS.
• Programming language: C++.
• License: Mozilla Public License 2.0.
• Any restrictions to use by non-academics: licence needed, contact with the authors.
Acknowledgments
Powered@NLHPC: This research was partially supported by the supercomputing infrastructure of the NLHPC (ECM-02). This research was also partially supported by the supercomputing infrastructure of Poznan Supercomputing Center and by the e-infrastructure program of the Research Council of Norway, and the supercomputer center of UiT – the Arctic University of Norway. The authors also thankfully acknowledge the computer resources and the technical support provided by the Plataforma Andaluza de Bioinformática of the University of Málaga. This work was partially supported by the computing facilities of the Extremadura Research Centre for Advanced Technologies (CETA–CIEMAT), funded by the European Regional Development Fund (ERDF). CETA–CIEMAT belongs to CIEMAT and the Government of Spain. Additionally, the authors would also like to thank N.C. Cruz and J.J. Moreno for their technical support.
References
1 | Böhm, H.-J., Stahl, M. ((2003) ). The Use of Scoring Functions in Drug Discovery Applications. John Wiley & Sons, Inc., pp. 41–87. |
2 | Boström, J., Grant, J.A., Fjellström, O., Thelin, A., Gustafsson, D. ((2013) ). Potent fibrinolysis inhibitor discovered by shape and electrostatic complementarity to the drug tranexamic acid. Journal of Medicinal Chemistry, 56: (8), 3273–3280. |
3 | Böttcher, C., Belle, O.V., Belle, B. ((1974) ). Theory of Electric Polarization. Elsevier Scientific Pub. Co, Michigan. |
4 | Case, D.A., Cerutti, D.S., Cheatham, T.E., Darden, T.A., Duke, R.E., Giese, T.J., Gohlke, H., Goetz, A.W., Greene, D., Homeyer, N., Izadi, S., Kovalenko, A., Lee, T.S., LeGrand, S., Li, P., Lin, C., Liu, J., Luchko, T., Luo, R., Mermelstein, D., Merz, K.M., Monard, G., Nguyen, H., Omelyan, I., Onufriev, A., Pan, F., Qi, R., Roe, D.R., Roitberg, A., Sagui, C., Simmerling, C.L., Botello-Smith, W.M., Swails, J., Walker, R.C., Wang, J., Wolf, R.M., Wu, X., Xiao, L., York, D.M., Kollman, P.A. (2017). AMBER. University of California, San Francisco. |
5 | Chu, S., Gochin, M. ((2013) ). Identification of fragments targeting an alternative pocket on HIV-1 gp41 by NMR screening and similarity searching. Bioorganic and Medicinal Chemistry Letters, 23: (18), 5114–5118. |
6 | Connelly, P.R., Snyder, P.W., Zhang, Y., McClain, B., Quinn, B.P., Johnston, S., Medek, A., Tanoury, J., Griffith, J., Patrick Walters, W., Dokou, E., Knezic, D., Bransford, P. ((2015) ). The potency–insolubility conundrum in pharmaceuticals: mechanism and solution for hepatitis C protease inhibitors. Biophysical Chemistry, 196: , 100–108. |
7 | Dakshanamurthy, S., Issa, N.T., Assefnia, S., Seshasayee, A., Peters, O.J., Madhavan, S., Uren, A., Brown, M.L., Byers, S.W. ((2012) ). Predicting new indications for approved drugs using a proteochemometric method. Journal of Medicinal Chemistry, 55: (15), 6832–6848. |
8 | Dou, X., Jiang, L., Wang, Y., Jin, H., Liu, Z., Zhang, L. ((2018) ). Discovery of new GSK-3 β inhibitors through structure-based virtual screening. Bioorganic & Medicinal Chemistry Letters, 28: (2), 160–166. |
9 | Ellingson, B.A., Skillman, A.G., Nicholls, A. ((2010) ). Analysis of SM8 and Zap TK calculations and their geometric sensitivity. Journal of Computer-Aided Molecular Design, 24: (4), 335–342. |
10 | Fernández, J., Tóth, B.G.-, Redondo, J.L., Ortigosa, P.M., Arrondo, A.G. ((2017) ). A planar single-facility competitive location and design problem under the multi-deterministic choice rule. Computers & Operations Research, 78: , 305–315. |
11 | Ferrández, M.R., Redondo, J.L., Ivorra, B., Ramos, Á.M., Ortigosa, P.M. ((2019) ). Preference-based multi-objectivization applied to decision support for high-pressure thermal processes in food treatment. Applied Soft Computing, 79: , 326–340. |
12 | Gowthaman, R., Lyskov, S., Karanicolas, J. ((2015) ). DARC 2.0: improved docking and virtual screening at protein interaction sites. PLOS ONE, 10: (7), 0131612. |
13 | Grant, J.A., Pickup, B.T. ((1995) ). A Gaussian description of molecular shape. The Journal of Physical Chemistry, 99: (11), 3503–3510. |
14 | Grant, J.A., Gallardo, M.A., Pickup, B.T. ((1996) ). A fast method of molecular shape comparison: a simple application of a Gaussian description of molecular shape. Journal of Computational Chemistry, 17: (14), 1653–1666. |
15 | Halgren, T.A. ((1995) ). Potential energy functions. Current Opinion in Structural Biology, 5: (2), 205–210. |
16 | Hamza, A., Wei, N.-N., Zhan, C.-G. ((2012) ). Ligand-based virtual screening approach using a new scoring function. Journal of Chemical Information and Modeling, 52: (4), 963–974. |
17 | Haque, I., Pande, V. Method for rapidly approximating similarities. Patent number: US8706427B2. US8706427B2. |
18 | Hawkins, P.C.D., Stahl, G. ((2018) ). Ligand-based methods in GPCR computer-aided drug design. Methods in Molecular Biology, 1705: , 365–374. |
19 | Hevener, K.E., Mehboob, S., Su, P.-C., Truong, K., Boci, T., Deng, J., Ghassemi, M., Cook, J.L., Johnson, M.E. ((2012) ). Discovery of a novel and potent class of F. tularensis enoyl-reductase (FabI) inhibitors by molecular shape and electrostatic matching. Journal of Medicinal Chemistry, 55: (1), 268–279. |
20 | Ivorra, B., Ferrández, M.R., Crespo, M., Redondo, J.L., Ortigosa, P.M., Santiago, J.G., Ramos, Á.M. ((2018) ). Modelling and optimization applied to the design of fast hydrodynamic focusing microfluidic mixer for protein folding. Journal of Mathematics in Industry, 8: (1), 4. |
21 | Jaccard, P. ((1901) ). Distribution de la flore alpine dans le bassin des Dranses et dans quelques régions voisines. Bulletin de la Société Vaudoise des Sciences Naturelles, 37: , 241–272. |
22 | Kalászi, A., Szisz, D., Imre, G., Polgár, T. ((2014) ). Screen3D: A novel fully flexible high-throughput shape-similarity search method. Journal of Chemical Information and Modeling, 54: (4), 1036–1049. |
23 | Kaoud, T.S., Yan, C., Mitra, S., Tseng, C.-C., Jose, J., Taliaferro, J.M., Tuohetahuntila, M., Devkota, A., Sammons, R., Park, J., Park, H., Shi, Y., Hong, J., Ren, P., Dalby, K.N. ((2012) ). From in Silico discovery to intra-cellular activity: targeting JNK–protein interactions with small molecules. ACS Medicinal Chemistry Letters, 3: (9), 721–725. |
24 | Kar, S., Roy, K. ((2013) ). How far can virtual screening take us in drug discovery? Expert Opinion on Drug Discovery, 8: (3), 245–261. |
25 | Kim, E.-S., Cho, H., Lim, C., Lee, J.-Y., Lee, D.-I., Kim, S., Moon, A. ((2015) ). A natural piper-amide-like compound NED-135 exhibits a potent inhibitory effect on the invasive breast cancer cells. Chemico-Biological Interactions, 237: , 58–65. |
26 | Kim, Y.-R., Koh, H.-J., Kim, J.-S., Yun, J.-S., Jang, K., Lee, J.-Y., Jung, J.U., Yang, C.-S. ((2016) ). Peptide inhibition of p22phox and Rubicon interaction as a therapeutic strategy for septic shock. Biomaterials, 101: , 47–59. |
27 | Kossmann, B.R., Abdelmalak, M., Lopez, S., Tender, G., Yan, C., Pommier, Y., Marchand, C., Ivanov, I. ((2016) ). Discovery of selective inhibitors of tyrosyl-DNA phosphodiesterase 2 by targeting the enzyme DNA-binding cleft. Bioorganic and Medicinal Chemistry Letters, 26: (14), 3232–3236. |
28 | Kumar, A., Zhang, K.Y.J. ((2016) ). Application of shape similarity in pose selection and virtual screening in CSARdock2014 exercise. Journal of Chemical Information and Modeling, 56: (6), 965–973. |
29 | Kumar, A., Zhang, K.Y.J. ((2018) ). Advances in the development of shape similarity methods and their application in drug discovery. Frontiers in Chemistry, 6: , 315. |
30 | Lešnik, S., Štular, T., Brus, B., Knez, D., Gobec, S., Janežič, D., Konc, J. ((2015) ). LiSiCA: a software for ligand-based virtual screening and its application for the discovery of butyrylcholinesterase inhibitors. Journal of Chemical Information and Modeling, 55: (8), 1521–1528. |
31 | Liu, X., Jiang, H., Li, H. ((2011) ). SHAFTS: a hybrid approach for 3D molecular similarity calculation. 1. method and assessment of virtual screening. Journal of Chemical Information and Modeling, 51: (9), 2372–2385. |
32 | López-Ramos, M., Perruccio, F. ((2010) ). HPPD: Ligand- and target-based virtual screening on a herbicide target. Journal of Chemical Information and Modeling, 50: (5), 801–814. |
33 | López-Ramos, M., Perruccio, F., Lo, M., Perruccio, F. ((2009) ). HPPD: ligand- and target-based virtual screening on a herbicide target. Journal of Chemical Information and Modeling, 50: (1), 801–814. |
34 | Maccari, G., Jaeger, T., Moraca, F., Biava, M., Flohé, L., Botta, M. ((2011) ). A fast virtual screening approach to identify structurally diverse inhibitors of trypanothione reductase. Bioorganic and Medicinal Chemistry Letters, 21: (18), 5255–5258. |
35 | Massarotti, A., Brunco, A., Sorba, G., Tron, G.C. ((2014) ). ZINClick: a database of 16 million novel, patentable, and readily synthesizable 1,4-disubstituted triazoles. Journal of Chemical Information and Modeling, 54: (2), 396–406. |
36 | OpenEye Scientific Software (2019a). ROCS. Santa Fe, NM. www.eyesopen.com. |
37 | OpenEye Scientific Software (2019b). VIDA 4.4.0.4. Santa Fe, NM. www.eyesopen.com. |
38 | OpenEye Scientific Software (2019c). Zap Toolkit. Santa Fe, NM. www.eyesopen.com. |
39 | Oyarzabal, J., Howe, T., Alcazar, J., Andrés, J.I., Alvarez, R.M., Dautzenberg, F., Iturrino, L., Martínez, S., Van der Linden, I. ((2009) ). Novel approach for chemotype hopping based on annotated databases of chemically feasible fragments and a prospective case study: new melanin concentrating hormone antagonists. Journal of Medicinal Chemistry, 52: (7), 2076–2089. |
40 | Puertas-Martín, S., Redondo, J.L., Ortigosa, P.M., Pérez-Sánchez, H. ((2019) ). OptiPharm: an evolutionary algorithm to compare shape similarity. Scientific Reports, 9: (1), 1398. |
41 | Schmidt, T.C., Cosgrove, D.A., Boström, J. (2018). ReFlex3D: refined flexible alignment of molecules using shape and electrostatics. Journal of Chemical Information and Modeling, 7–00618. |
42 | Thomas, D.G., Chun, J., Chen, Z., Wei, G., Baker, N.A. ((2013) ). Parameterization of a geometric flow implicit solvation model. Journal of Computational Chemistry, 34: (8), 687–695. |
43 | Tiikkainen, P., Markt, P., Wolber, G., Kirchmair, J., Distinto, S., Poso, A., Kallioniemi, O. ((2009) ). Critical comparison of virtual screening methods against the muv data set. Journal of Chemical Information and Modeling, 49: (10), 2168–2178. |
44 | Tresadern, G., Bemporad, D., Howe, T. ((2009) ). A comparison of ligand based virtual screening methods and application to corticotropin releasing factor 1 receptor. Journal of Molecular Graphics and Modelling, 27: (8), 860–870. |
45 | Wang, Z., Lu, Y., Seibel, W., Miller, D.D., Li, W. ((2009) ). Identifying novel molecular structures for advanced melanoma by ligand-based virtual screening. Journal of Chemical Information and Modeling, 49: (6), 1420–1427. |
46 | Wishart, D.S., Feunang, Y.D., Guo, A.C., Lo, E.J., Marcu, A., Grant, J.R., Sajed, T., Johnson, D., Li, C., Sayeeda, Z., Assempour, N., Iynkkaran, I., Liu, Y., Maciejewski, A., Gale, N., Wilson, A., Chin, L., Cummings, R., Le, D., Pon, A., Knox, C., Wilson, M. ((2018) ). DrugBank 5.0: a major update to the DrugBank database for 2018. Nucleic Acids Research, 46: (D1), 1074–1082. |
47 | Woodring, J.L., Bachovchin, K.A., Brady, K.G., Gallerstein, M.F., Erath, J., Tanghe, S., Leed, S.E., Rodriguez, A., Mensa-Wilmot, K., Sciotti, R.J., Pollastri, M.P. ((2017) ). Optimization of physicochemical properties for 4-anilinoquinazoline inhibitors of trypanosome proliferation. European Journal of Medicinal Chemistry, 141: , 446–459. |
48 | Yan, X., Li, J., Liu, Z., Zheng, M., Ge, H., Xu, J. ((2013) ). Enhancing molecular shape comparison by weighted Gaussian functions. Journal of Chemical Information and Modeling, 53: (8), 1967–1978. |
49 | Yuan, S., Chan, J.F.-W., Den-Haan, H., Chik, K.K.-H., Zhang, A.J., Chan, C.C.-S., Poon, V.K.-M., Yip, C.C.-Y., Mak, W.W.-N., Zhu, Z., Zou, Z., Tee, K.-M., Cai, J.-P., Chan, K.-H., de la Peña, J., Pérez-Sánchez, H., Cerón-Carrasco, J.P., Yuen, K.-Y. ((2017) ). Structure-based discovery of clinically approved drugs as Zika virus NS2B-NS3 protease inhibitors that potently inhibit Zika virus infection in vitro and in vivo. Antiviral Research, 145: , 33–43. |


