
Identification of key genes and signalling pathways in clear cell renal cell carcinoma: An integrated bioinformatics approach
Abstract
BACKGROUND:
Clear cell Renal Cell Carcinoma (ccRCC) is one of the most prevalent types of kidney cancer. Unravelling the genes responsible for driving cellular changes and the transformation of cells in ccRCC pathogenesis is a complex process.
OBJECTIVE:
In this study, twelve microarray ccRCC datasets were chosen from the gene expression omnibus (GEO) database and subjected to integrated analysis.
METHODS:
Through GEO2R analysis, 179 common differentially expressed genes (DEGs) were identified among the datasets. The common DEGs were subjected to functional enrichment analysis using ToppFun followed by construction of protein-protein interaction network (PPIN) using Cytoscape. Clusters within the DEGs PPIN were identified using the Molecular Complex Detection (MCODE) Cytoscape plugin. To identify the hub genes, the centrality parameters degree, betweenness, and closeness scores were calculated for each DEGs in the PPIN. Additionally, Gene Expression Profiling Interactive Analysis (GEPIA) was utilized to validate the relative expression levels of hub genes in the normal and ccRCC tissues.
RESULTS:
The common DEGs were highly enriched in Hypoxia-inducible factor (HIF) signalling and metabolic reprogramming pathways. VEGFA, CAV1, LOX, CCND1, PLG, EGF, SLC2A1, and ENO2 were identified as hub genes.
CONCLUSION:
Among 8 hub genes, only the expression levels of VEGFA, LOX, CCND1, and EGF showed a unique expression pattern exclusively in ccRCC on compared to other type of cancers.
1.Introduction
Renal cell carcinoma (RCC) includes various subtypes of kidney tumours characterized by numerous genetic abnormalities. Clear cell renal cell carcinoma (ccRCC), also known as kidney renal clear cell carcinoma (KIRC) is a crucial RCC subtype that accounts for about 8 out of 10 kidney cancer diagnoses and 2–3% of all cancer [1]. According to GLOBOCAN, the global cancer statistics, more than four lakh new cases are reported, causing one lakh deaths per year in kidney cancer for the year 2020 [1, 2]. The ccRCC is characterized by clear cytoplasm in the malignant epithelial cells, dense alveoli, and acinar growth patterns interspersed with complex branched blood vessels [3]. The ccRCC tumour develops irrespective of age, but most cases are reported between 50 to 70 years with less than six percent of children and young adults affected [4, 5]. The exact cause of ccRCC progression is unknown, but the following factors increase the risk: smoking, repeated use of painkillers, patients with other kidney diseases undergoing dialysis, and major genetic predisposition conditions including gene mutations [6].
The biallelic loss of Von Hippel–Lindau (VHL) gene function has been reported in over 51% of ccRCC patients [7, 8]. The pVHL serves as a tumour suppressor, excreting negative regulation on hypoxia-inducible factor
In recent years, several drugs have undergone testing on ccRCC tumour patients, which either directly or indirectly target major signalling pathways [13]. However, tumour cells are developing resistance against drugs due to factors like tumour heterogeneity, lysosomal sequestration, mutation, altered expression in gene or alternate signalling pathways instead of the drug targeted pathways [14, 15]. The patients with the primary tumour stage undergoing nephrectomy are also exhibit signs of relapse [16]. So, identifying new biomarkers in ccRCC is necessary for early diagnosis in relapse and targeted therapeutic treatment. The development of high throughput techniques such as microarray and rapid processing of microarray datasets are being used to identify the differentially expressed genes (DEGs) in the cancer progression [17, 18, 19].
In this study, we aimed to discover the hub genes and key signalling pathways of ccRCC using an integrated bioinformatic approach. Subjecting the large number of ccRCC microarray datasets to integrated analysis brings out commonly altered DEGs in key signalling pathways and their role in cellular functions. Also, identifying the hub genes in these pathways will be a useful biomarker for ccRCC in clinical diagnosis and therapeutic applications.
2.Methodology
2.1Identification and screening of microarray datasets
The ccRCC microarray datasets were processed from Gene Expression Omnibus (GEO) (https://www.ncbi.nlm.nih.gov/geo/) by following selection and exclusion criteria as described in Barrett et al. (2012) [20]. Datasets were searched and collected from the GEO database using the two keywords “ccRCC”, and “clear cell renal cell carcinoma” . The following criteria were applied to exclude or include datasets from GEO search. Gene expression ccRCC array datasets from human kidney samples (excluding samples expression profiles from cell lines, patients’ blood samples, specific cells sorted using FACs). Analysed datasets comprised both ccRCC tumour and non-tumour/normal samples, each group consisting of more than ten samples. The datasets containing solely tumour samples without normal tissue were excluded, as they are inadequate for identifying DEGs due to the absence of control samples. Subsequently, the datasets containing repeated samples from other datasets were eliminated. In some instances, a few datasets were initially submitted and later updated with additional patient samples alongside the previous sets. In such cases, only the updated versions were retained, and the other datasets were excluded. Additionally, datasets where differentially expressed genes (DEGs) couldn’t be identified via GEO2R processing were also removed. Following these criteria, the final datasets for study were selected from the GEO database.
2.2Identification and screening of DEGs
The DEGs between ccRCC tumour and normal samples from the 12 collected datasets were screened by using an R language-based online tool called GEO2R (http://www.ncbi.nlm.nih.gov/geo/geo2r/) [21]. The DEGs between the ccRCC and normal tissue samples were identified in GEO2R using the Limma package. The False discovery rate (FDR) (Benjamini & Hochberg) was selected to limit the false-positive results, and the adjusted
2.3Functional enrichment analysis by ToppFun tool in ToppGene suite
The common DEGs identified were subjected to enrichment analysis using ToppFun online tool in ToppGene suit (https://toppgene.cchmc.org/). This analysis covered the Gene Ontology (GO) terms include cellular component (CC), molecular functions (MF), and biological processes (BP), and along with pathways related to the common DEGs [22]. To screen the GO terms and the signalling pathways, a cut-off criterion of q-value FDR B&H
2.4Construction of protein-protein interaction network (PPIN)
The construction of a PPIN for the common DEGs was performed using the STRING database version 11.5 (https://string-db.org/). This database offers both predicted and experimentally verified protein-protein network’s physical and functional association [23]. The STRING-generated TSV file provides comprehensive details, each gene’s full name and functional profile. Subsequently, the PPI network was visualized using Cytoscape software 3.8.2 (http://www.cytoscape.org/). Cytoscape serves as a versatile and dynamic visualisation tool, enabling the exploration of intricate biological linkages through various annotation and experimental data [24].
2.5Identification and analysis of clusters
The PPIN network of common DEGs of ccRCC was imported into Cytoscape, and the important clusters/modules from the PPI network were identified using Molecular Complex Detection (MCODE) version 2.0.0., The default MCODE parameters were utilized to analyse and identify the clusters, with a MCODE score
2.6Identification of hub genes by the centrality
In Cytoscape, the centrality parameters closeness, betweenness, and degree of common DEGs from the PPI network were assessed using the Network Analyzer plugin [24]. The distribution of the centrality parameters and DEGs with top centrality scores were plotted using BIC. The node degree and the parameters reliability can be assessed by analysing the distribution characteristics of centrality parameters. The top 10% of genes of common DEGs from the selected centrality parameters were identified using Venny 2.1.
2.7Validation of hub gene expression
Gene Expression Profiling Interactive Analysis (GEPIA) (http://gepia.cancer-pku.cn/index.html) is a user-friendly web server designed foranalysing the tumours and normal RNA sequencing expression data samples sourced from The Cancer Genome Atlas (TCGA) and the Genotype-Tissue Expression (GTEx) projects. GEPIA offers customizable functions to analyse tumour/normal differential expression [25]. The hub gene expression levels can be validated with expression data obtained from GEPIA [26]. Consequently, expression data for hub gene in ccRCC (contains data from TGCA) and control (contains data from both TGCA and GTEx) samples were acquired in the form of box plots using GEPIA. Furthermore, the median expression levels of hub genes in different cancers were gathered from GEPIA to discern the distinctive hub gene expression levels in ccRCC.
3.Results
3.1Identification and screening of microarray datasets and DEGs
In GEO, the screening for ccRCC datasets using keywords “ccRCC and clear cell renal cell carcinoma” yielded a total of 13,876 search results (Supp. Table 1). Initially, individual sample submissions were excluded. For instance, dataset GSE40435 included 101 samples each for control and test, resulting in 202 single sample submissions in the search results. Consequently, dataset GSE40435 was selected, and all similar duplicate single sample submissions from GSE4045 were excluded. After applying these exclusion criteria to all the datasets, we identified a total of 86 ccRCC datasets from the GEO database.
Following this, the datasets that included both human kidney ccRCC samples and their adjacent normal samples were prioritized for the study. Conversely, datasets featuring expression profiles from cell lines (E.g., GSE78179), patient blood (E.g., GSE117230), or urine samples (E.g., GSE7292) and specific cell samples such as FACS sorted immune cells from ccRCC tissues (E.g., GSE108310) were omitted. The datasets exclusively featuring expression profiles of tumour samples were excluded from the analysis (E.g., GSE29609) as DEGs cannot be identified without corresponding normal tissue profiles. Furthermore, datasets containing repetitive samples across multiple entries were excluded. Several datasets were initially submitted with a GSE number, but were subsequently updated to include additional patient samples alongside the existing sets with new GSE number. For example, GSE66272 is updated dataset which includes the samples from GSE66270, GSE66271. So, GSE 66272 was taken for the analysis to ensure data integrity. Also, datasets showing very less DEGs (GSE3 - only had 9 DEGs) and datasets showing error ((E.g., GSE781)) during GEO2R processing were excluded.
Figure 1.
The common genes between the 12 datasets were identified by Venny 2.1 and represented in flower plot.
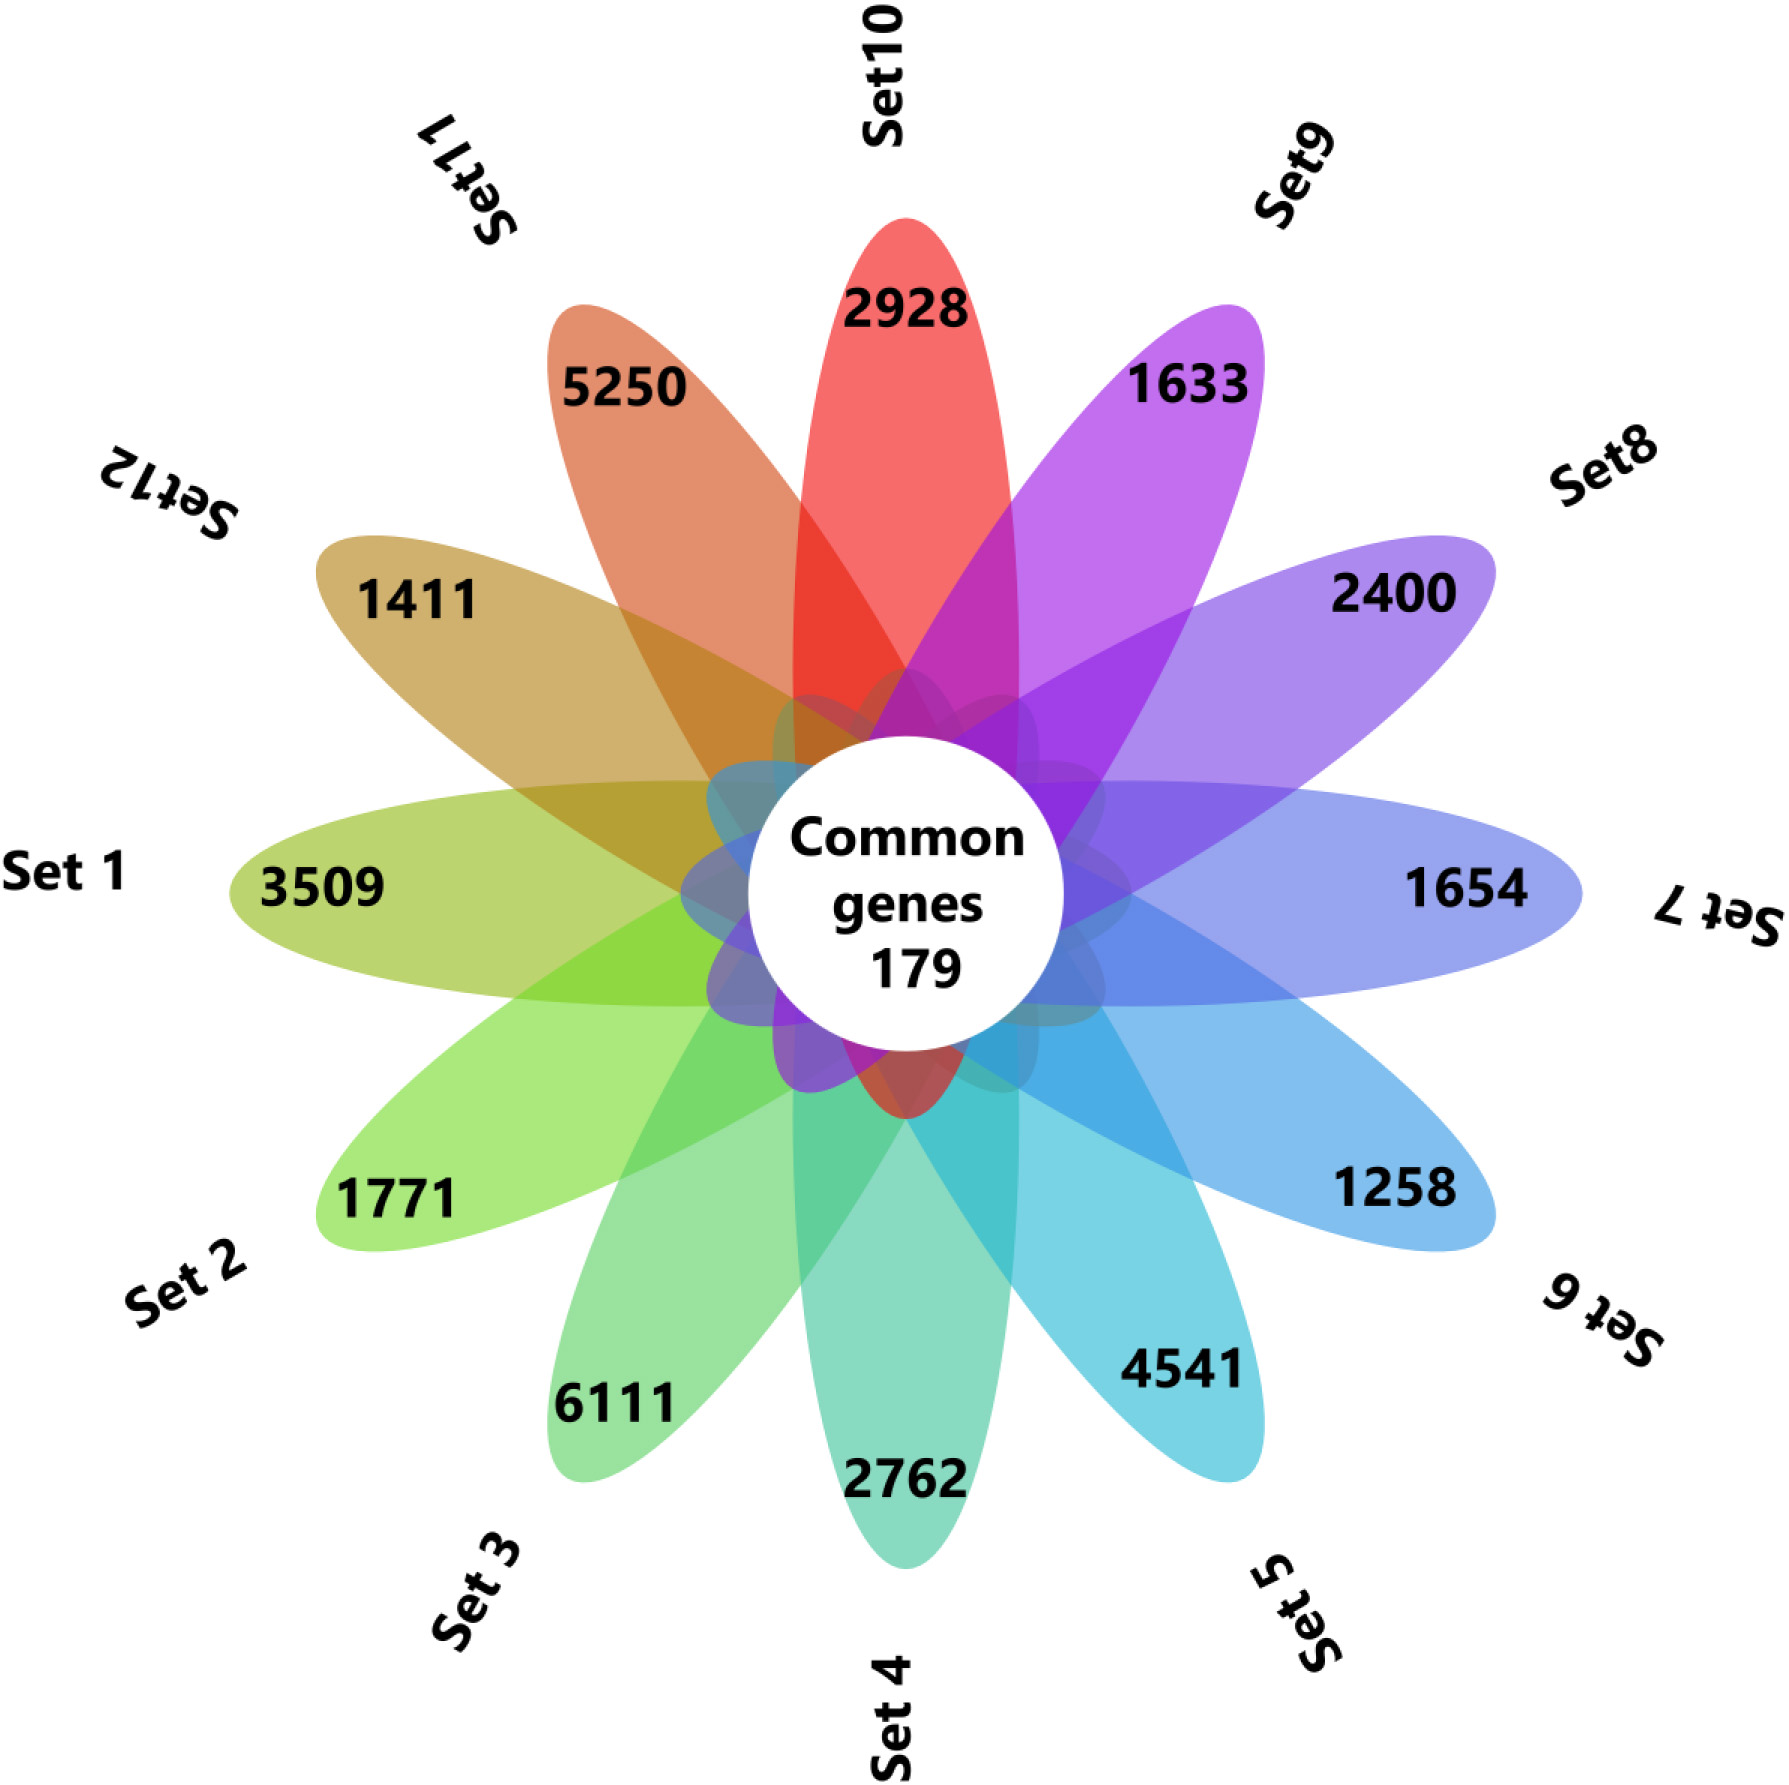
By following these criteria’s finally 12 datasets were chosen for this study
(Supp. Table 2). The selected datasets were subjected to analysis using the GEO2R online tool. The DEGs from all the datasets were obtained, and the differential expression was represented using a volcano plot
(Supp. Fig. 1). Initially, the normality of the samples and their distributions in all the datasets were checked in the GEO2R analysis
(Supp. Fig. 2). We filtered DEGs with logFC
3.2Functional enrichment analysis
Figure 2.
Top 10 enriched CC, MF, BP and pathways of common DEGs identified using ToppFun enrichment analysis tool.
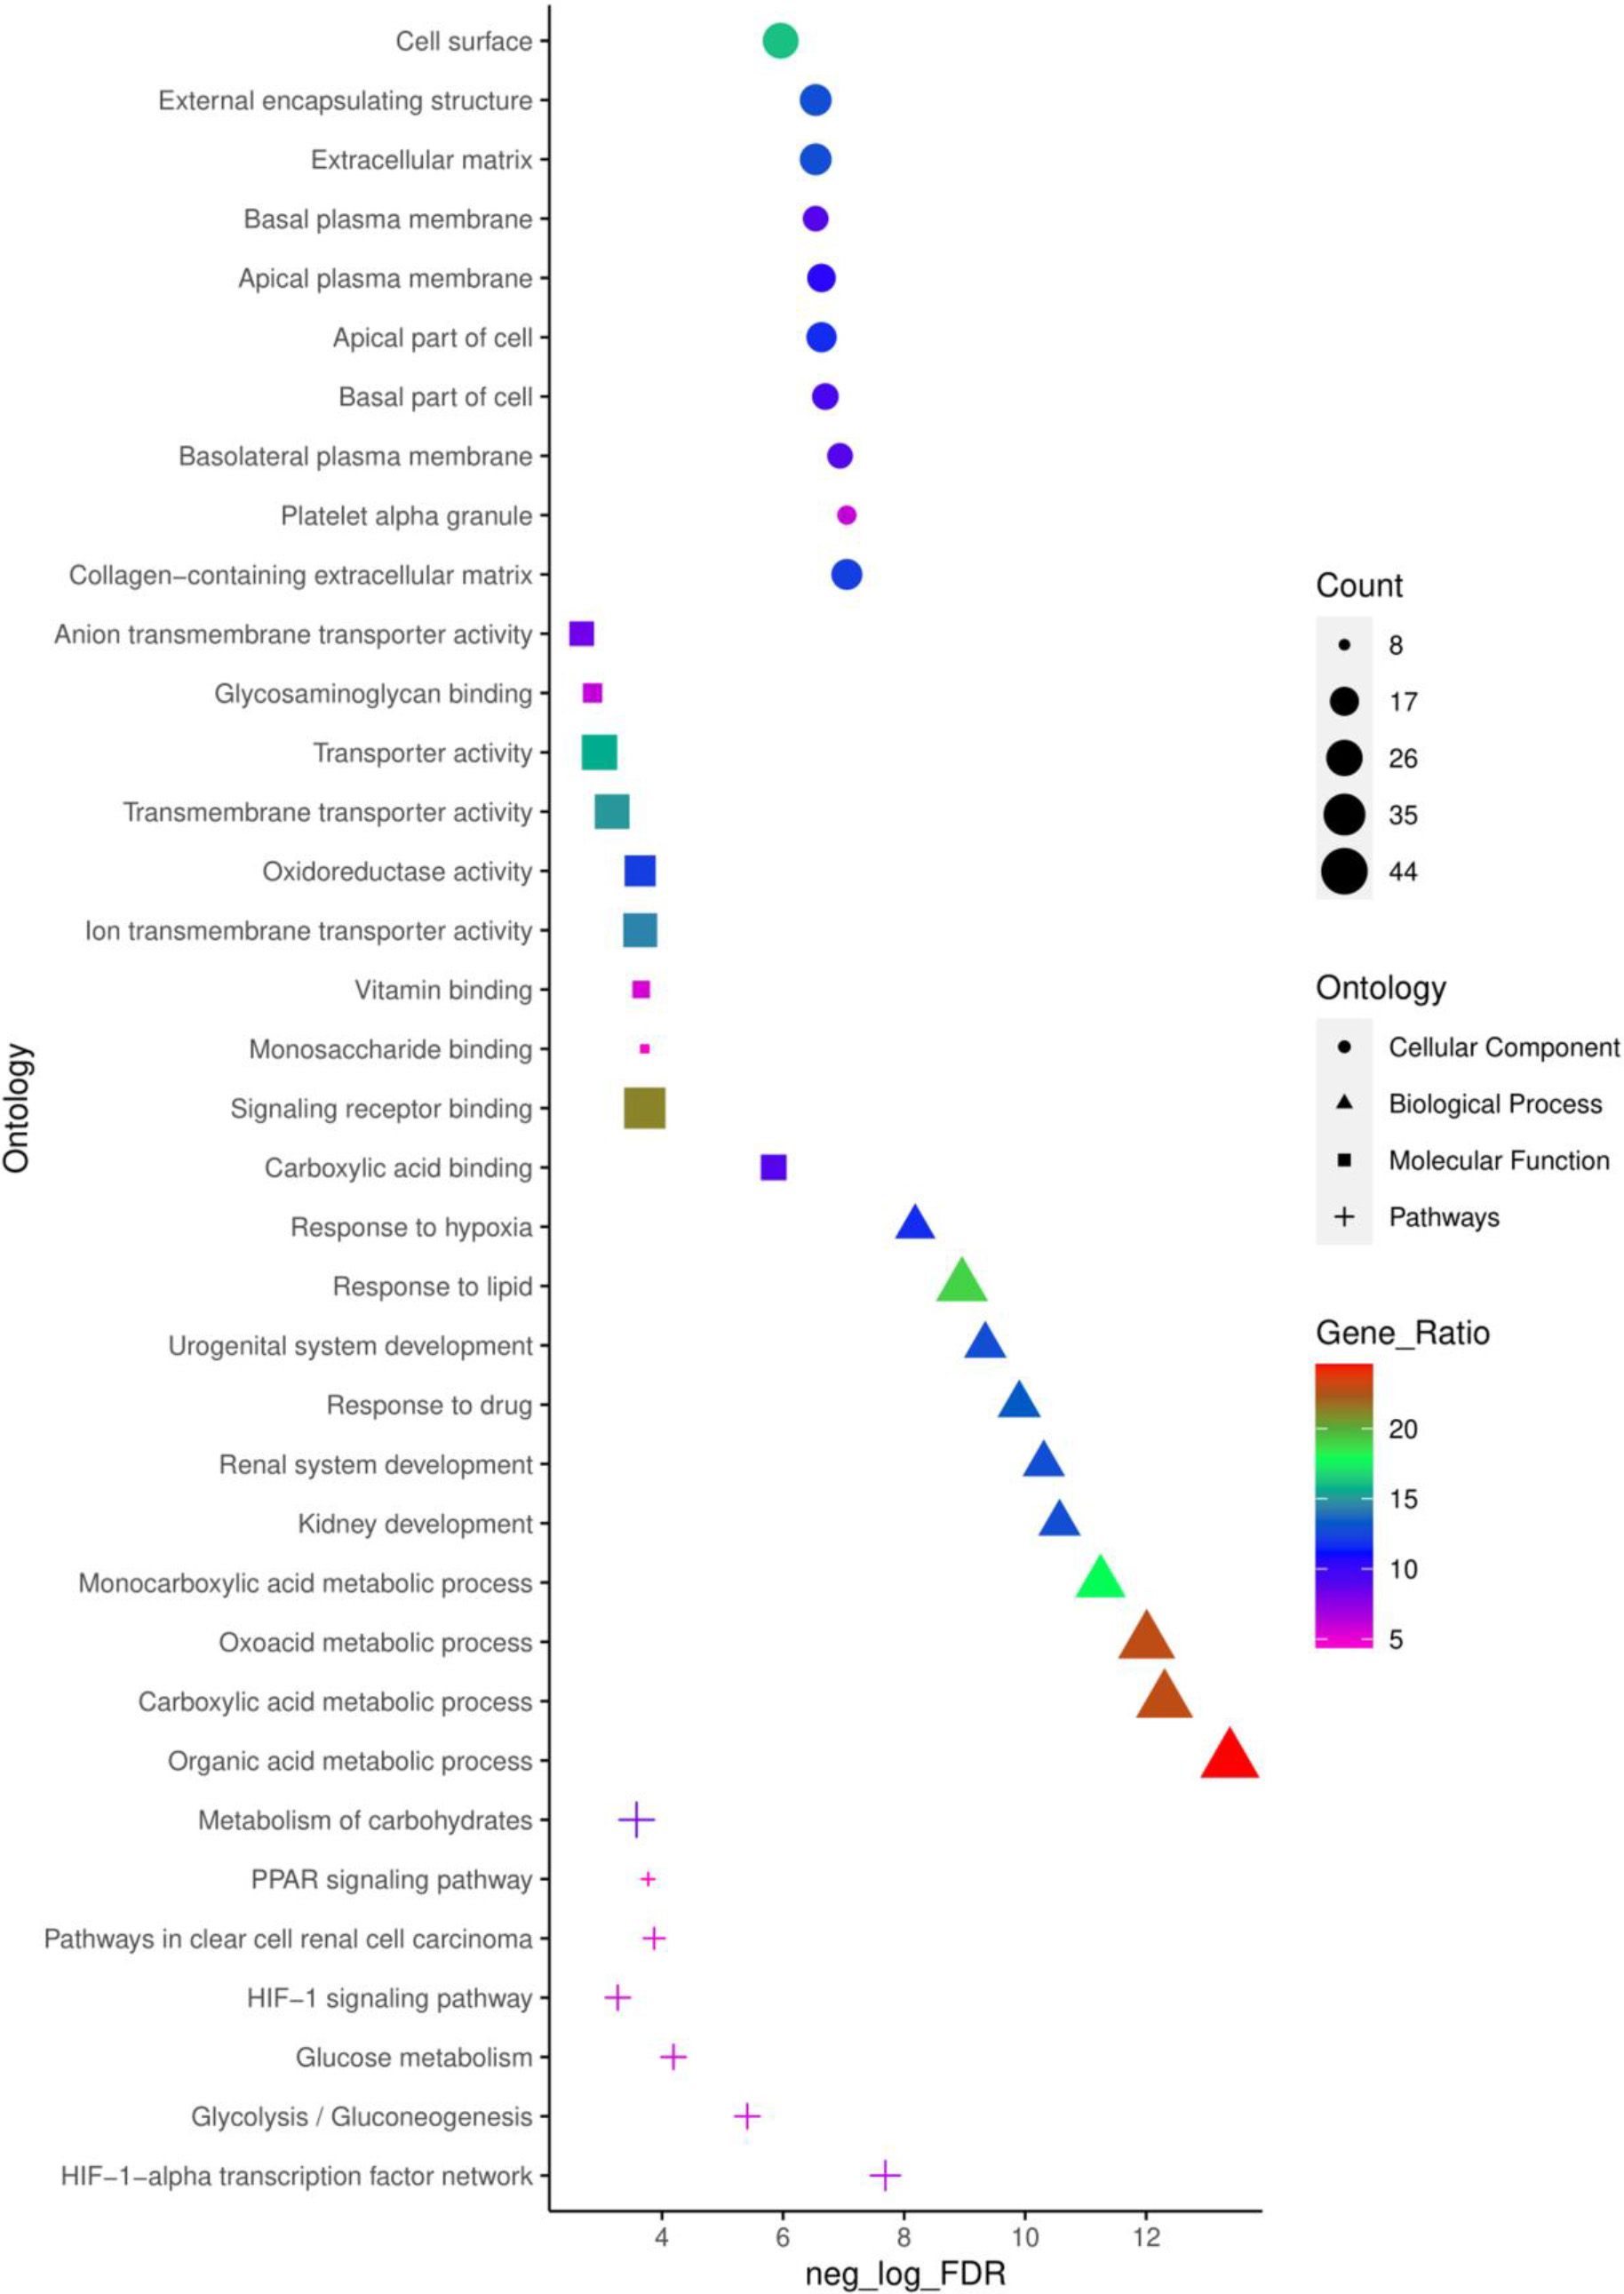
To obtain a deeper understanding of the biological functions and signalling pathways of the common 179 DEGs identified, ToppFun tool from the ToppGene suit was employed to conduct a GO annotation and pathway analysis. The top 10 enrichment in GO terms (Supp. Table 3) CC, BP, MF, and pathway (Supp. Table 4) from ToppFun analysis were listed in Fig. 2. In GO analysis of CC, the top significantly enriched terms were collagen-containing extracellular matrix (22 genes), platelet alpha granule (11 genes), and basolateral plasma membrane (16 genes). The top enriched terms of DEGs in the MF were carboxylic acid binding (16 genes), signalling receptor binding (38 genes), and monosaccharide binding (8 genes). The top enriched terms in the BP were the organic acid metabolic process (44 genes), carboxylic acid metabolic process (41 genes), and oxoacid metabolic process (41 genes).
The network of top 10 pathways from the enrichment analysis was given in
Supp. Table 4. The pathway analysis showed common DEGs were enriched in the HIF-1-
3.3Construction of PPI network, identification, and analysis of clusters
Figure 3.
Cluster identification of the PPI network using MCODE. The four most significant clusters were selected with a score of
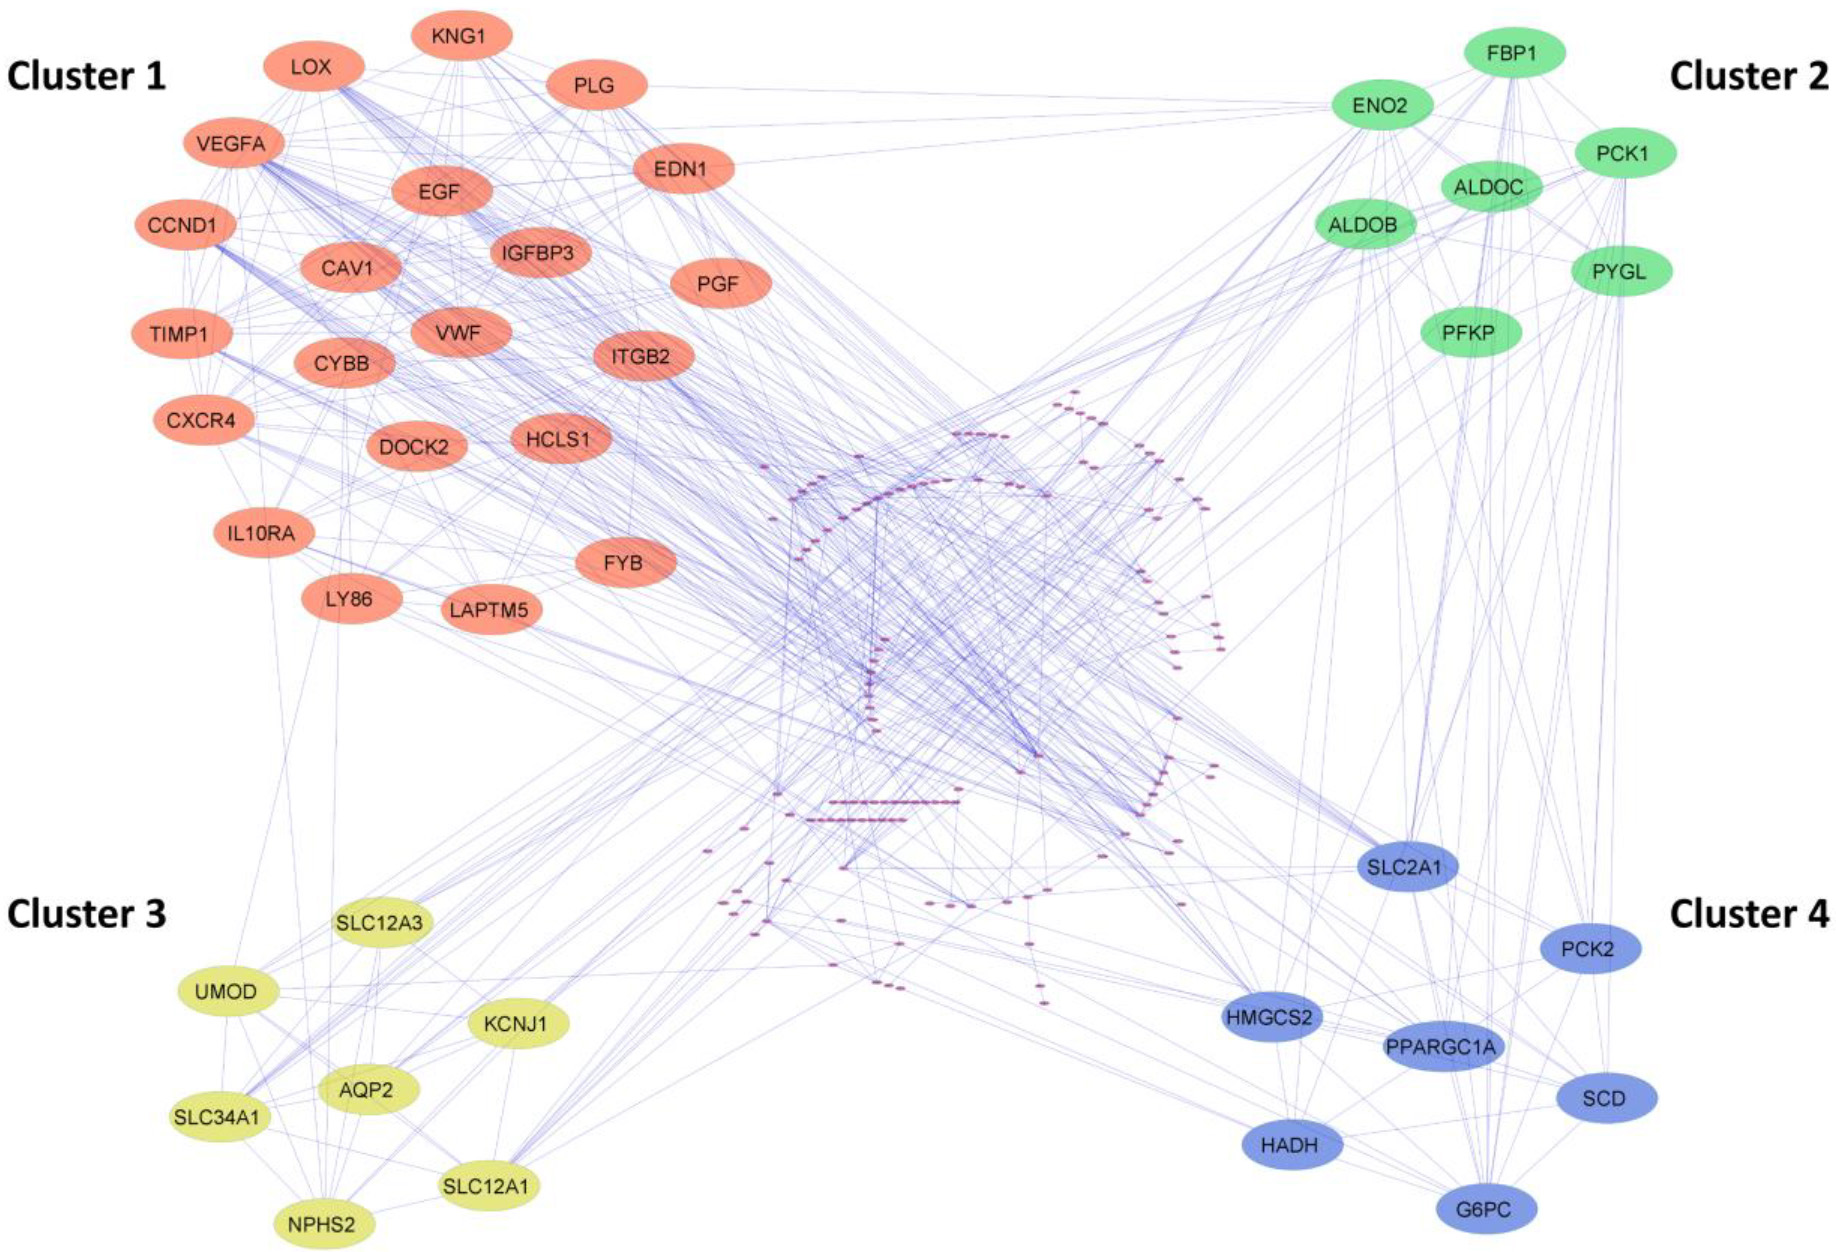
The PPI network of common DEGs from ccRCC datasets was constructed using STRING. The network encompasses 178 nodeswith 543 edges visually depictedin Cytoscape and represented in Supp Fig. 3. Utilizing the MCODE plugin within Cytoscape, clusters were discerned from the STRING generated PPI network based on the cut-off criteria of degrees
3.4Identification of hub genes by centrality
Figure 4.
(a) Identification of hub genes with top centrality scores (Degree, betweenness, closeness). (b) Heatmap showing expression pattern of eight hub genes in all the 12 ccRCC datasets.
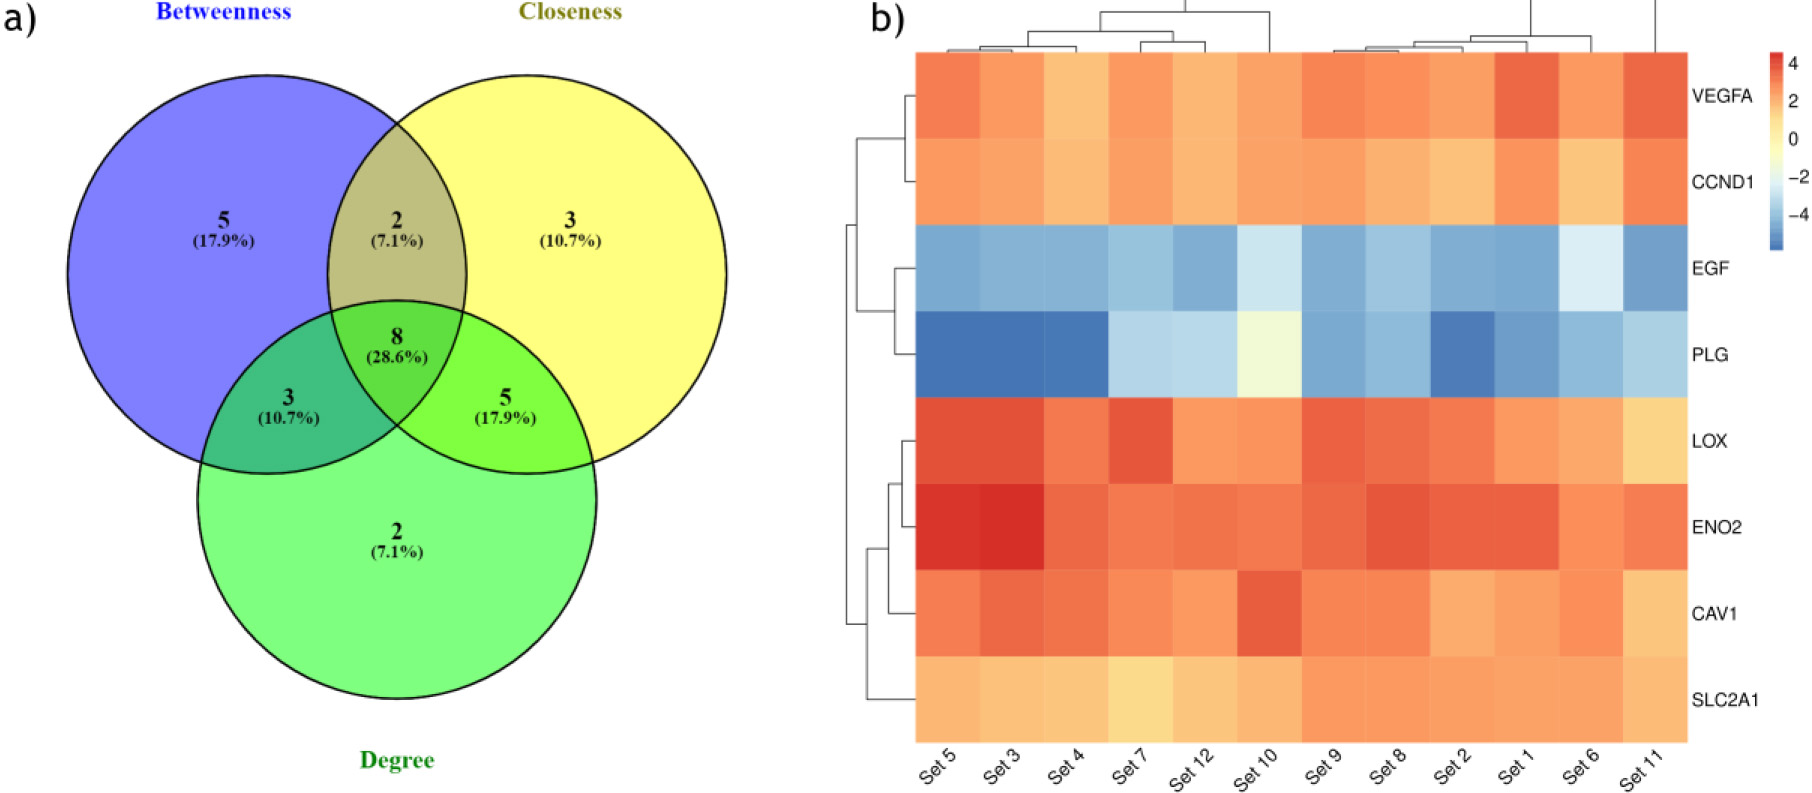
To identify the hub genes involved in the ccRCC manifestation, we examined the centralities closeness, betweenness, and degree of common DEGs using the network analyzer plugin within Cytoscape. The distribution of the three centralities were illustrated in the supplementary Fig. 4. Additionally, we displayed the correlations between degree and betweenness (Supp Fig. 5a), degree and closeness (Supp Fig. 5b), and betweenness and closeness (Supp Fig. 5c) were shown in the Supplementary Fig. 5. Subsequently, employing Venny 2.1, we identified 8 genes commonly present in the top 10% across all selected centralities, designating them as hub genes (Fig. 4a). Hub genes are key players in biological networks, central to regulating functions and pathways by interacting with many other genes. Their importance stems from their pivotal positions, as changes in these genes can significantly impact the entire system they control. Out of 8 hub genes, six genes VEGFA, CAV1, LOX, CCND1, PLG, and EGF, were a part of the first cluster, and two genes, ENO2 and SLC2A1, were present in both the second and fourth cluster. The expression levels of hub genes across all 12 ccRCC datasets were depicted in a heatmap (Fig. 4b).
3.5Validation of hub genes expression
Figure 5.
Validation of hub gene expression. Hub gene expression levels were validated with TGCA datasets obtained using GEPIA. VEGFA (a), CAV1 (b), LOX (c), CCND1 (d), PLG (e), EGF (f), ENO2 (g), SLC2A1 (h). (KIRC interchangeably used for ccRCC).
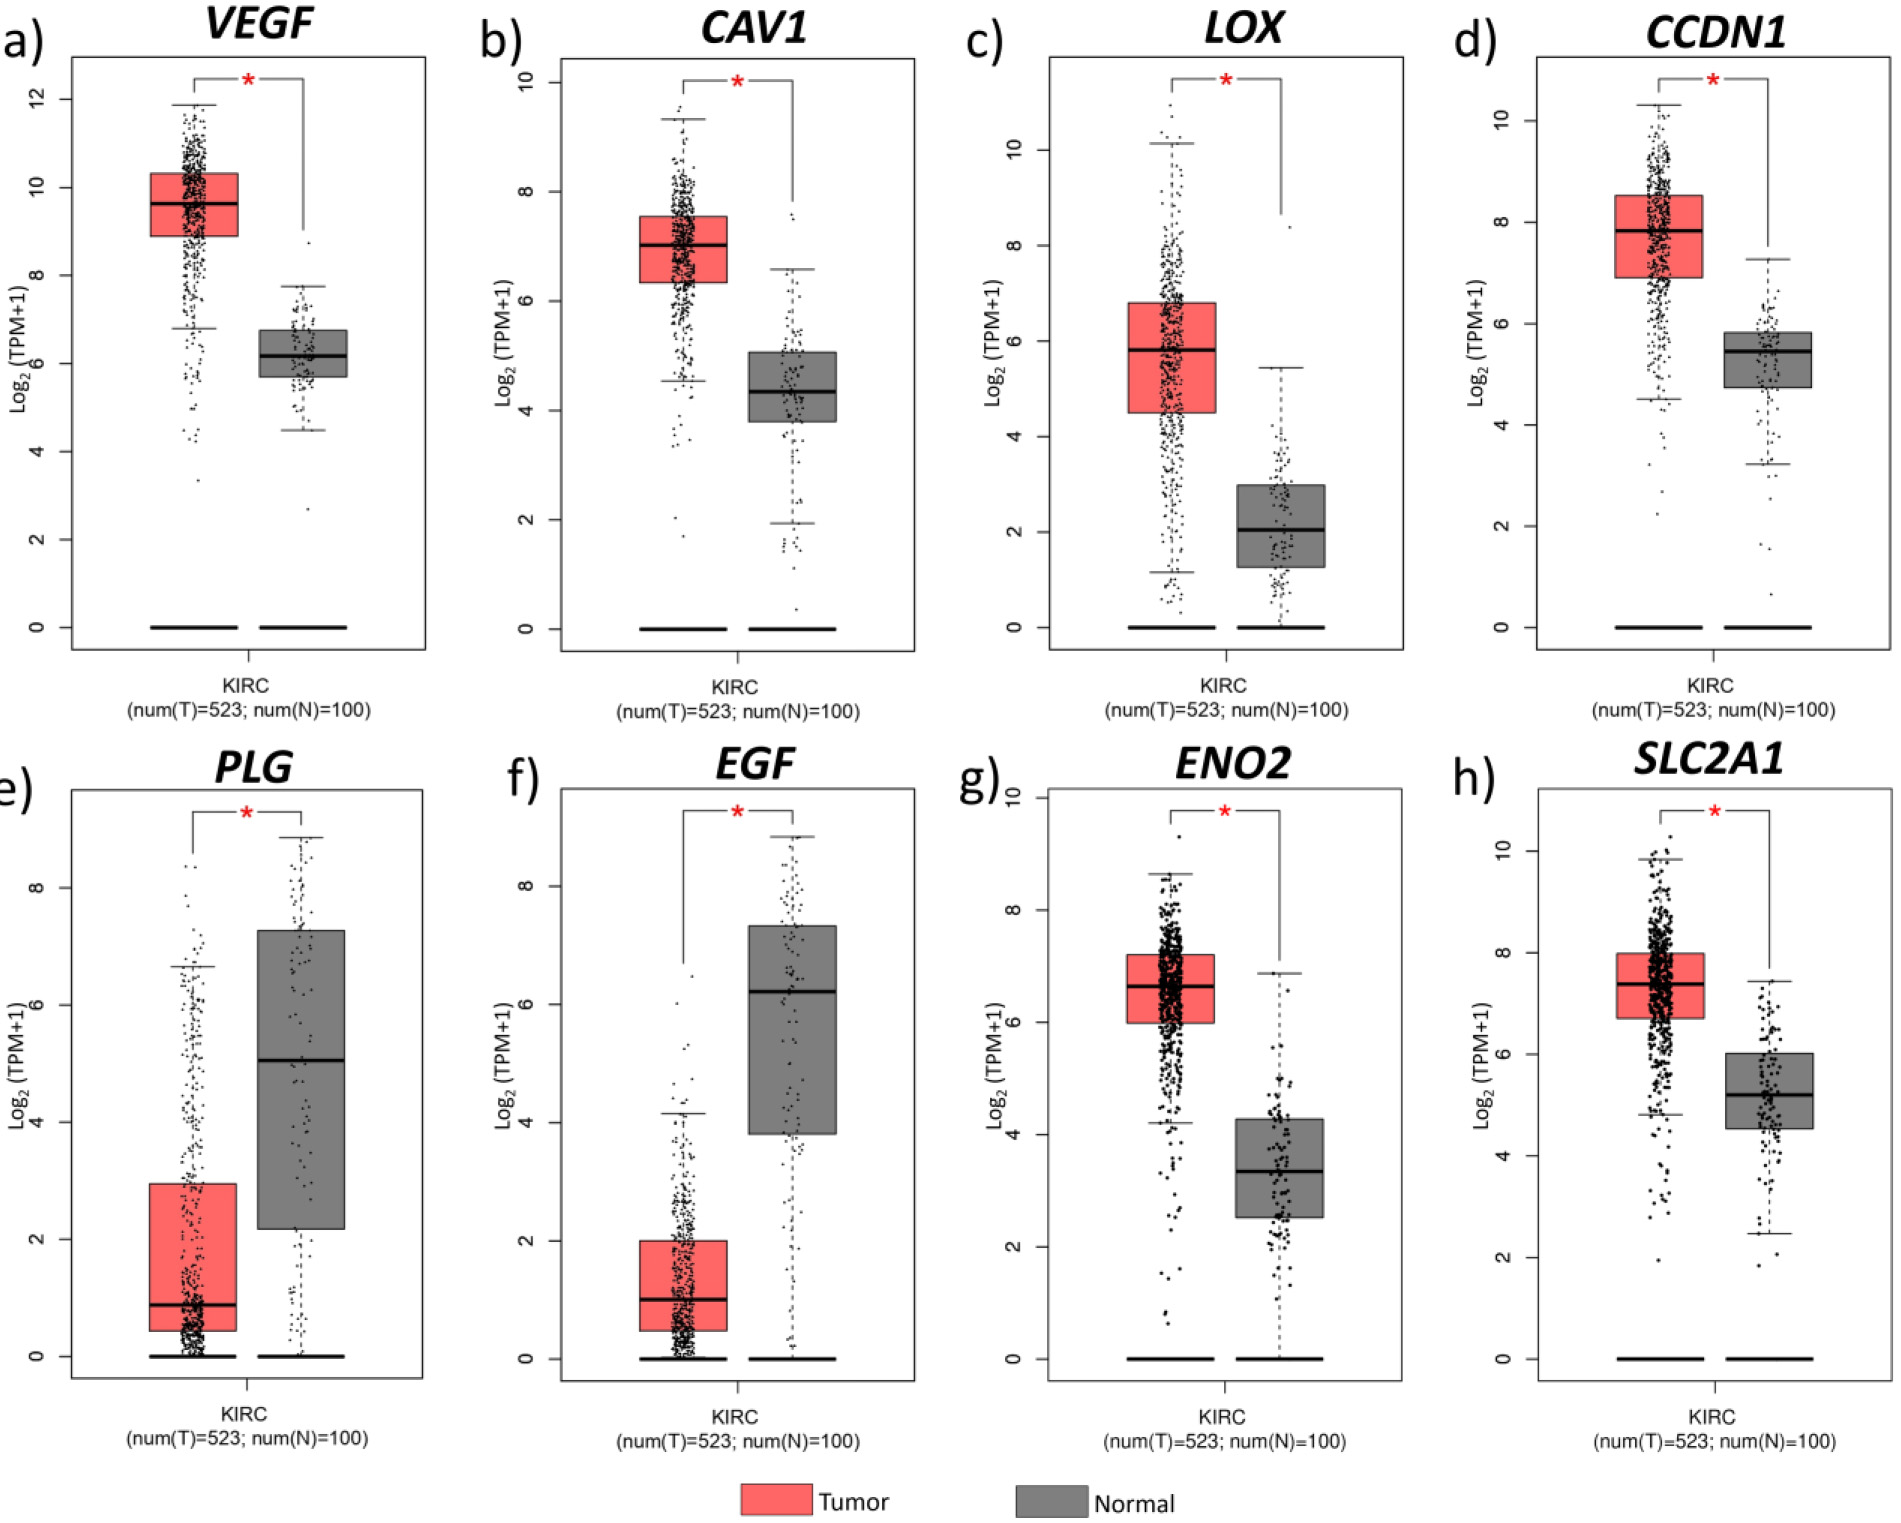
Figure 6.
Hub gene expression on different cancer types. Median expression levels of hub genes in different cancer types obtained from GEPIA. ACC, Adrenocortical carcinoma; BLCA, Bladder urothelial carcinoma; BRCA, Breast invasive carcinoma; CESC, Cervical squamous cell carcinoma and endocervical adenocarcinoma; CHOL, Cholangiocarcinoma; COAD, Colon adenocarcinoma; DLBC, Lymphoid Neoplasm Diffuse Large B-cell Lymphoma; ESCA, Esophageal carcinoma; GBM, Glioblastoma multiforme; HNSC, Head and Neck squamous cell carcinoma; KICH, Kidney chromophobe; KIRC, Kidney renal clear cell carcinoma; KIRP, Kidney renal papillary cell carcinoma; LAML, Acute myeloid leukemia; LGG, Brain lower grade glioma; LIHC, Liver hepatocellular carcinoma; LUAD, Lung adenocarcinoma; LUSC, Lung squamous cell carcinoma; OV, Ovarian serous cystadenocarcinoma; PAAD, Pancreatic adenocarcinoma; PCPG, Pheochromocytoma and Paraganglioma; PRAD, Prostate adenocarcinoma; READ, Rectum adenocarcinoma; SARC, Sarcoma; SKCM, Skin cutaneous melanoma; STAD. Stomach adenocarcinoma; TGCT, Testicular germ cell tumours; THCA, Thyroid carcinoma; THYM, Thymoma; UCEC, Uterine corpus endometrial carcinoma; UCS, Uterine carcinosarcoma.
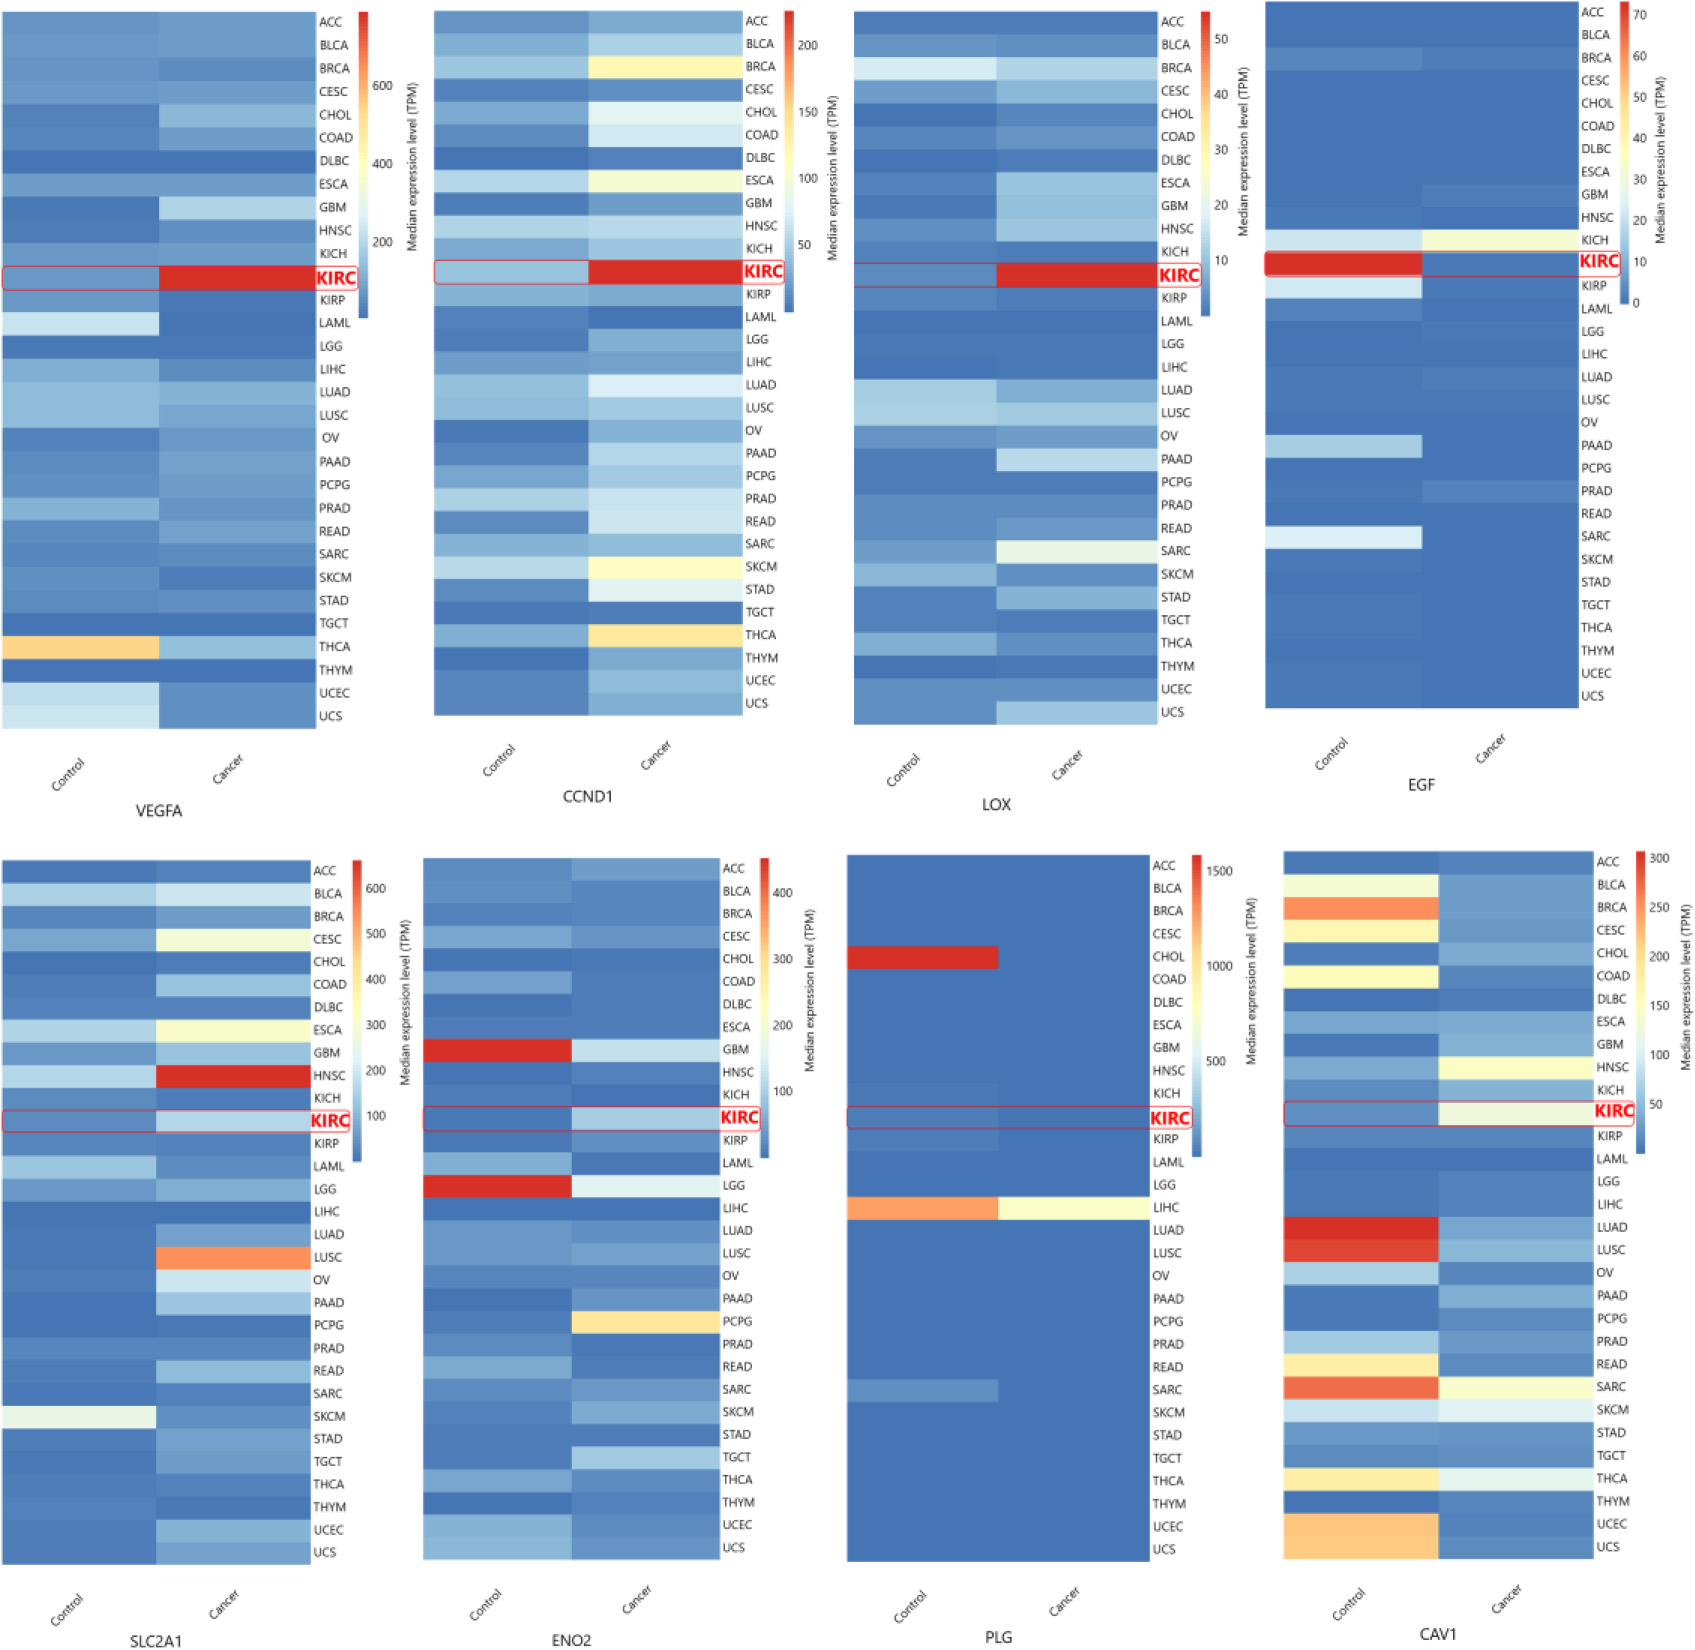
The hub genes identified in the ccRCC were validated by examining their gene expression in GEPIA. In the 12 GEO datasets VEGFA, CAV1, LOX, CCND1, SLC2A1, ENO2, showed increased expression while PLG and EGF were down regulated (Fig. 4b). These findings were confirmed by GEPIA, showing upregulation of VEGFA, CAV1, LOX, CCND1, SLC2A1, and ENO2 , and downregulation of PLG, EGF in ccRCC (Fig. 5). Comparison of hub gene expression levels between ccRCC and other cancers using GEPIA highlighted VEGFA, LOX, CCND1, and EGF as distinctly expressed in ccRCC. Comparison of hub gene median expression levels between ccRCC and other cancers using GEPIA highlighted VEGFA, LOX, CCND1, EGF as distinctly expressed in ccRCC (Fig. 6).
4.Discussion
The ccRCC is the most pervasive kidney cancer and exhibits poorer survival than the other subtypes such as chromophobe and papillary RCC. In the present study, integrated bioinformatic analysis was performed to identify the hub genes and key signaling pathways in ccRCC. In this study, we extensively searched the GEO database and identified 12 ccRCC datasets. The DEGs between the ccRCC tumour and normal samples were identified using the GEO2R tool. From all 12 datasets, 179 common DEGs were identified and subjected to GO and pathway enrichment analysis. GO analysis showed that the top biological function of these DEGs was enriched in the metabolic process such as the organic acid metabolic process, especially carboxylic acid metabolism.
Alteration in metabolic programs, including modifications in the fatty acid metabolic process, result in the accumulation of acetyl Co-A and synthetic fatty acids as lipid droplets in the cytoplasm of renal cell. These renal cells appear as a clear cell, which is the key histological phenotype in the ccRCC [29]. The top pathways identified from GO pathway analysis revealed that DEGs from the ccRCC samples were enriched in the HIF-1
The overall enrichment analysis revealed that DEGs in ccRCCs were significantly enriched in the HIF-1
Changes in glucose and lipid metabolism are closely related to ccRCC. Anaerobic glycolysis leads to an increased production of acetyl Co-A which serves as an essential source for fatty acid synthesis [29, 36]. Previous research has underscored the impact of fatty acid metabolism on ccRCC development, which was driven by HIF
The identification of hub genes among common DEGs involved calculating the centrality parameter for each gene within the common DEGs PPIN. Utilizing STRING, the PPIN of common DEGs was generated, and subsequent MCODE analysis in Cytoscape highlighted four clusters, specifically selecting clusters with degrees
The expression levels of these 8 hub genes were validated with TGCA ccRCC data obtained through GEPIA. The expression pattern of hub genes in all the 12 datasets included in our study were consistent from the results obtained from GEPIA. Also, we obtained median expression levels of these 8 genes in different cancers and found VEGFA, LOX, CCND1, (highly upregulated in ccRCC than other cancer types), and EGF (highly downregulated) expression levels were distinct in ccRCC. Out of these four genes, VEGFA, LOX, and CCND1 can be directly regulated through the HIF transcriptional machinery except EGF [38, 39, 40].
VEGFA (vascular endothelial growth factor A), a key gene involved in angiogenesis induced by the HIF signaling pathway in hypoxic conditions, is involved in the development of many vascularized tumours [34, 41]. In patients diagnosed with ccRCC, the genes most commonly found to be modified alongside VEGFA were those neighboring VHL, observed in 72.22% of cases [42]. The mutation in the VHL gene failed to regulate the degradation of HIF1 and 2
LOX (lysyl oxidases) is also one of the genes triggered by HIF-1
CCND1 (Cyclin D1) is a proto-oncogene that positively regulates the cell cycle progression by dimerizing the cyclin-dependent kinases (CDK) (CDK4 and CDK6) and conducts G1 to S phase transition. Higher expression of CCND1 has been reported in many cancers such as breast, ovarian, endometrial, and bladder cancer [52], along with ccRCC. Both high and low CCND1 levels were associated with the ccRCC than other RCCs (chromophobe and papillary RCC), where the CCND1 expression levels were unchanged [53]. So, CCND1 can be used as a biomarker for differentiating ccRCC from other RCC types [54]. The CCND1 levels decreased with an increase in the ccRCC tumour grade, which (low CCND1) leads to a poor prognosis in ccRCC patients. Patients with both low and high CCND1 levels showed recurrence of ccRCC [53].
EGF (Epidermal growth factor) expression leads to the dimerization of EGF receptors which induces the intracellular tyrosine kinase activity, which plays in cell proliferation, angiogenesis and blocks apoptosis. In our study in all 12 datasets, the expression levels of EGF were found highly reduced in ccRCC samples compared to normal adjacent cells in the kidney. In ccRCC tumour samples, the EGF expression levels were very low, whereas the EGFR levels were reported to be high in ccRCC samples [55]. The EGFR-induced prooncogenic signaling cascades such as AKT-PI3K-mTOR signaling pathways had a crucial role in ccRCC [55]. The EGFR signaling cascades can be activated by several mechanisms other than EGF in ccRCC [56], but the mechanism behind the downregulation of EGF has not been investigated in ccRCC. Also, the expression of CAV1 can be directly activated by HIF1 and HIF2, helping in caveolae formation which leads to the dimerization and phosphorylation of EGFR and activates the EGFR signaling cascade without the ligand interaction [57]. Because of this property, the tumours having hypoxia signatures activate the necessary downstream signaling cascades by initiating the receptor activation without their respective ligand [57]. Also, EGF treatment in A431 human epidermoid carcinoma cells showed complete downregulation of CAV1 [58]. So, increasing the EGF level might help to prevent the autoactivation of EGFR and regulate EGFR-induced pro-oncogenic signaling cascades such as AKT-PI3K-mTOR. Also, this autophosphorylation of receptor tyrosine kinases (RTKs) is needed for VEGFA-mediated activation of the class 1a PI3k signaling cascade [59]. Typically, the EGF expression levels are very high in the kidney compared to the other organs in our body. So increasing the EGF levels and inhibition of the EGFR signaling cascade might help to prevent the ccRCC cancer progression and prognosis.
Currently, various treatments like RTK inhibitors (such as sorafenib, sunitinib, pazopanib, axitinib, cabozantinib, and tivozanib), VEGF inhibitor (Bevacizumab), HIF2
To best of our knowledge, there have been no in vitro or in vivo studies conducted on treating ccRCC with EGF. Elevating EGF levels, especially in combination with existing drugs like RTK inhibitors, might enhance treatment efficacy for ccRCC. This study is primarily based on predictive bioinformatic integrated analysis. So comprehensive laboratory experiments are essential to explore the potential efficacy of EGF and other hub genes in ccRCC treatment.
5.Conclusion
In this study, we conducted an integrated analysis using ccRCC datasets sourced from the GEO database and identified eight hub genes. Notably, VEGFA, LOX, CCND1, and EGF were highly expressed in the ccRCC than other cancer types. These genes play pivotal roles in various processes crucial for tumour formation and progression, including angiogenesis, metastasis, cell cycle regulation, anti-apoptosis and drug resistance. These genes will be a suitable biomarker for ccRCC clinical applications. Apart from the HIF activated genes, (VEGFA, LOX, CCND1,) the drastic downregulation of EGF also has to be noted as an important alteration in ccRCC patients. Investigating the mechanisms behind the downregulation of EGF and identifying the role of EGF other than EGFR mediated functions will give new insights into clinical applications of ccRCC. However, it’s crucial to note that these findings, although predictive, require validation through laboratory experiments to substantiate the results obtained from bioinformatics analyses. Experimental verification will strengthen the reliability and applicability of these bioinformatics-driven conclusions.
Author contributions
Conception: Vinoth S, Satheeswaran Balasubramanian.
Interpretation or analysis of data: Vinoth S, Satheeswaran Balasubramanian.
Preparation of the manuscript Data curation.: Vinoth S.
Revision for important intellectual content. Ekambaram Perumal, Kirankumar Santhakumar.
Supervision; Kirankumar Santhakumar.
Supplementary data
The supplementary files are available to download from http://dx.doi.org/10.3233/CBM-230271.
Acknowledgments
The facilities provided by SRM Institute of Science and Technology is gratefully acknowledged. The authors thankfully acknowledge the financial assistance received from the Department of Biotechnology (DBT), New Delhi (BT/PR26189/GET/119/226/2017) and DST-SERB, New Delhi (EMR/2017/000465). Satheeswaran Balasubramanian acknowledges ICMR-SRF (No.45/51/2020-Nan/BMS) funded by ICMR, New Delhi, India for fellowship support.
References
[1] | H. Sung, J. Ferlay, R.L. Siegel, M. Laversanne, I. Soerjomataram, A. Jemal and F. Bray, Global cancer statistics 2020: GLOBOCAN estimates of incidence and mortality worldwide for 36 cancers in 185 countries, CA Cancer J Clin 71: ((2021) ), 209–249. |
[2] | E. Jonasch, C.L. Walker and W.K. Rathmell, Clear cell renal cell carcinoma ontogeny and mechanisms of lethality, Nat Rev Nephrol 17: ((2021) ), 245–261. |
[3] | B.S. Sanganeria, R. Misra and K.K. Shukla, Molecular Diagnostics in Renal Cancer, Molecular Diagnostics in Cancer Patients ((2019) ), 199–218. |
[4] | N. Shenoy, N. Vallumsetla, Y. Zou, J.N. Galeas, M. Shrivastava, C. Hu, K. Susztak and A. Verma, Role of DNA methylation in renal cell carcinoma, J Hematol Oncol 8 ((2015) ), 1–13. |
[5] | M. He, J. Cai, K. Zhu, W. Gu, M. Li, J. Xiong, Z. Guan, J. Wang and Q. Shu, Renal cell carcinoma in children and adolescents: Single-center experience and literature review, Medicine 100: ((2021) ), e23717. |
[6] | B. Ljungberg, S.C. Campbell, H.Y. Cho, D. Jacqmin, J.E. Lee, S. Weikert and L.A. Kiemeney, The epidemiology of renal cell carcinoma, Eur Urol 60: ((2011) ), 615–621. |
[7] | A. Kumar, N. Kumari, V. Gupta and R. Prasad, Renal cell carcinoma: Molecular aspects, Indian Journal of Clinical Biochemistry 33: ((2018) ), 246. |
[8] | I.J. Frew and H. Moch, A clearer view of the molecular complexity of clear cell renal cell carcinoma, Annual Review of Pathology: Mechanisms of Disease 10: ((2015) ), 263–289. |
[9] | E.R. Maher and R.N. Sandford, von Hippel-Lindau Disease: an Update, Curr Genet Med Rep 7: ((2019) ), 227–235. |
[10] | P.-H. Lin, C.-Y. Huang, K.-J. Yu, H.-C. Kan, C.-Y. Liu, C.-K. Chuang, Y.-C. Lu, Y.-H. Chang, I.-H. Shao and S.-T. Pang, Genomic characterization of clear cell renal cell carcinoma using targeted gene sequencing, Oncol Lett 21: ((2021) ), 169. |
[11] | H. Moch, A.L. Cubilla, P.A. Humphrey, V.E. Reuter and T.M. Ulbright, The 2016 WHO classification of tumours of the urinary system and male genital organs – Part A: Renal, penile, and testicular tumours, Eur Urol 70: ((2016) ), 93–105. |
[12] | S. Ramón y Cajal, M. Sesé, C. Capdevila, T. Aasen, L. De Mattos-Arruda, S.J. Diaz-Cano, J. Hernández-Losa and J. Castellví, Clinical implications of intratumor heterogeneity: challenges and opportunities, J Mol Med (Berl) 98: ((2020) ), 161–177. |
[13] | V. Schiavoni, R. Campagna, V. Pozzi, M. Cecati, G. Milanese, D. Sartini, E. Salvolini, A.B. Galosi and M. Emanuelli, Recent advances in the management of clear cell renal cell carcinoma: Novel biomarkers and targeted therapies, Cancers 15: ((2023) ), 3207. |
[14] | R. Tumkur Sitaram, M. Landström, G. Roos and B. Ljungberg, Significance of PI3K signalling pathway in clear cell renal cell carcinoma in relation to VHL and HIF status, J Clin Pathol 74: ((2021) ), 216–222. |
[15] | P. Makhov, S. Joshi, P. Ghatalia, A. Kutikov, R.G. Uzzo and V.M. Kolenko, Resistance to systemic therapies in clear cell renal cell carcinoma: Mechanisms and management strategies, Mol Cancer Ther 17: ((2018) ), 1355. |
[16] | Q.K. Li, C.P. Pavlovich, H. Zhang, C.R. Kinsinger and D.W. Chan, Challenges and opportunities in the proteomic characterization of clear cell renal cell carcinoma (ccRCC): A critical step towards the personalized care of renal cancers, Semin Cancer Biol 55: ((2019) ), 8–15. |
[17] | J. Wang, R. Peng, Z. Zhang, Y. Zhang, Y. Dai and Y. Sun, Identification and validation of key genes in hepatocellular carcinoma by bioinformatics analysis, Biomed Res Int 2021: ((2021) ), 1–13. |
[18] | L. Liu, C. He, Q. Zhou, G. Wang, Z. Lv and J. Liu, Identification of key genes and pathways of thyroid cancer by integrated bioinformatics analysis, J Cell Physiol 234: ((2019) ), 23647–23657. |
[19] | S. Mirhadi, S. Tam, Q. Li, N. Moghal, N.-A. Pham, J. Tong, B.J. Golbourn, J.R. Krieger, P. Taylor, M. Li, J. Weiss, S.N. Martins-Filho, V. Raghavan, Y. Mamatjan, A.A. Khan, M. Cabanero, S. Sakashita, K. Huo, S. Agnihotri, K. Ishizawa, T.K. Waddell, G. Zadeh, K. Yasufuku, G. Liu, F.A. Shepherd, M.F. Moran and M.-S. Tsao, Integrative analysis of non-small cell lung cancer patient-derived xenografts identifies distinct proteotypes associated with patient outcomes, Nature Communications 13: (1) ((2022) ), 1–17. |
[20] | T. Barrett, S.E. Wilhite, P. Ledoux, C. Evangelista, I.F. Kim, M. Tomashevsky, K.A. Marshall, K.H. Phillippy, P.M. Sherman, M. Holko, A. Yefanov, H. Lee, N. Zhang, C.L. Robertson, N. Serova, S. Davis and A. Soboleva, NCBI GEO: archive for functional genomics data sets – update, Nucleic Acids Res 41: ((2012) ), D991–D995. |
[21] | S. Davis and P.S. Meltzer, GEOquery: a bridge between the Gene Expression Omnibus (GEO) and BioConductor, Bioinformatics 23: ((2007) ), 1846–1847. |
[22] | J. Chen, E.E. Bardes, B.J. Aronow and A.G. Jegga, ToppGene Suite for gene list enrichment analysis and candidate gene prioritization, Nucleic Acids Res 37: ((2009) ), W305–W311. |
[23] | D. Szklarczyk, J.H. Morris, H. Cook, M. Kuhn, S. Wyder, M. Simonovic, A. Santos, N.T. Doncheva, A. Roth, P. Bork, L.J. Jensen and C. von Mering, The STRING database in 2017: quality-controlled protein–protein association networks, made broadly accessible, Nucleic Acids Res 45: ((2017) ), D362–D368. |
[24] | T. van Parys, I. Melckenbeeck, M. Houbraken, P. Audenaert, D. Colle, M. Pickavet, P. Demeester and Y. van de Peer, A Cytoscape app for motif enumeration with ISMAGS, Bioinformatics ((2016) ), btw626. |
[25] | Z. Tang, C. Li, B. Kang, G. Gao, C. Li and Z. Zhang, GEPIA: a web server for cancer and normal gene expression profiling and interactive analyses, Nucleic Acids Res 45: ((2017) ), W98–W102. |
[26] | F. Zhang, P. Wu, Y. Wang, M. Zhang, X. Wang, T. Wang, S. Li and D. Wei, Identification of significant genes with prognostic influence in clear cell renal cell carcinoma via bioinformatics analysis, Transl Androl Urol 9: ((2020) ), 452. |
[27] | W. Du, L. Zhang, A. Brett-Morris, B. Aguila, J. Kerner, C.L. Hoppel, M. Puchowicz, D. Serra, L. Herrero, B.I. Rini, S. Campbell and S.M. Welford, HIF drives lipid deposition and cancer in ccRCC via repression of fatty acid metabolism, Nat Commun 8: ((2017) ). |
[28] | W. Kimryn Rathmell, J.C. Rathmell and W. Marston Linehan, Metabolic pathways in kidney cancer: Current therapies and future directions, Https://DoiOrg/101200/JCO2018792309 36: ((2018) ), 3540–3546. |
[29] | X. Qi, Q. Li, X. Che, Q. Wang and G. Wu, The uniqueness of clear cell renal cell carcinoma: summary of the process and abnormality of glucose metabolism and lipid metabolism in ccRCC, Front Oncol 11: ((2021) ). |
[30] | L.J. Gudas, L. Fu, D.R. Minton, N.P. Mongan and D.M. Nanus, The Role of HIF1α in Renal Cell Carcinoma Tumorigenesis, J Mol Med (Berl) 92: ((2014) ), 825. |
[31] | L. Fu, G. Wang, M.M. Shevchuk, D.M. Nanus and L.J. Gudas, Generation of a mouse model of Von Hippel-Lindau kidney disease leading to renal cancers by expression of a constitutively active mutant of HIF1α, Cancer Res 71: ((2011) ), 6848–6856. |
[32] | F.J. Hes, J.W.M. Höppener and C.J.M. Lips, Pheochromocytoma in Von Hippel-Lindau Disease, J Clin Endocrinol Metab 88: ((2003) ), 969–974. |
[33] | M.M. Baldewijns, I.J.H. van Vlodrop, P.B. Vermeulen, P.M.M.B. Soetekouw, M. van Engeland and A.P. de Bruïne, VHL and HIF signalling in renal cell carcinogenesis, J Pathol 221: ((2010) ), 125–138. |
[34] | M.L. Mao, Y.H. Zhao, D.L. Ma and H.G. Liu, [Expression of VHL, VEGF and HIF-α in endolymphatic sac tumors], Zhonghua Bing Li Xue Za Zhi 50: ((2021) ), 1228–1233. |
[35] | O. Lombardi and D.R. Mole, HIF pathways in clear cell renal cancer, Biomarkers and Bioanalysis Overview ((2021) ). |
[36] | F. Meléndez-Rodríguez, O. Roche, R. Sanchez-Prieto and J. Aragones, Hypoxia-inducible factor 2-dependent pathways driving Von Hippel-Lindau-deficient renal cancer, Front Oncol 8: ((2018) ), 214. |
[37] | N. Pandey, V. Lanke and P.K. Vinod, Network-based metabolic characterization of renal cell carcinoma, Sci Rep 10: ((2020) ). |
[38] | Q. Xiao and G. Ge, Lysyl oxidase, extracellular matrix remodeling and cancer metastasis, Cancer Microenvironment 5: ((2012) ), 261. |
[39] | T.K. Choueiri and W.G. Kaelin, Targeting the HIF2–VEGF axis in renal cell carcinoma, Nature Medicine 26: (10) ((2020) ), 1519–1530. |
[40] | A.A. Tirpe, D. Gulei, S.M. Ciortea, C. Crivii and I. Berindan-Neagoe, Hypoxia: Overview on hypoxia-mediated mechanisms with a focus on the role of HIF genes, International Journal of Molecular Sciences 20: ((2019) ), 6140. |
[41] | C.H. Chen, J.M. Lai, T.Y. Chou, C.Y. Chen, L.J. Su, Y.C. Lee, T.S. Cheng, Y.R. Hong, C.K. Chou, J. Whang-Peng, Y.C. Wu and C.Y.F. Huang, VEGFA upregulates FLJ10540 and modulates migration and invasion of lung cancer via PI3K/AKT pathway, PLoS One 4: ((2009) ), e5052. |
[42] | Y. Situ, Q. Xu, L. Deng, Y. Zhu, R. Gao, L. Lei and Z. Shao, System analysis of VEGFA in renal cell carcinoma: The expression, prognosis, gene regulation network and regulation targets, Int J Biol Markers 37: ((2022) ), 90–101. |
[43] | P.M. Wierzbicki, J. Klacz, A. Kotulak-Chrzaszcz, A. Wronska, M. Stanislawowski, A. Rybarczyk, A. Ludziejewska, Z. Kmiec and M. Matuszewski, Prognostic significance of VHL, HIF1A, HIF2A, VEGFA and p53 expression in patients with clearcell renal cell carcinoma treated with sunitinib as firstline treatment, Int J Oncol 55: ((2019) ), 371–390. |
[44] | F.C. Zeng, M.Q. Zeng, L. Huang, Y.L. Li, B.M. Gao, J.J. Chen, R.Z. Xue and Z.Y. Tang, Downregulation of VEGFA inhibits proliferation, promotes apoptosis, and suppresses migration and invasion of renal clear cell carcinoma, Onco Targets Ther 9: ((2016) ), 2131–2141. |
[45] | V. Di Stefano, B. Torsello, C. Bianchi, I. Cifola, E. Mangano, G. Bovo, V. Cassina, S. De Marco, R. Corti, C. Meregalli, S. Bombelli, P. Viganò, C. Battaglia, G. Strada and R.A. Perego, Major action of endogenous lysyl oxidase in clear cell renal cell carcinoma progression and collagen stiffness revealed by primary cell cultures, Am J Pathol 186: ((2016) ), 2473–2485. |
[46] | B.J. Thibodeau, M. Fulton, L.E. Fortier, T.J. Geddes, B.L. Pruetz, S. Ahmed, A. Banes-Berceli, P.L. Zhang, G.D. Wilson and J. Hafron, Characterization of clear cell renal cell carcinoma by gene expression profiling, Urologic Oncology: Seminars and Original Investigations 34: ((2016) ), 168e1–168e9. |
[47] | S. Simonovic, C. Hinze, K.M. Schmidt-Ott, J. Busch, M. Jung, K. Jung and A. Rabien, Limited utility of qPCR-based detection of tumor-specific circulating mRNAs in whole blood from clear cell renal cell carcinoma patients, BMC Urol 20: ((2020) ), 1–12. |
[48] | J.T. Erler, K.L. Bennewith, M. Nicolau, N. Dornhöfer, C. Kong, Q.T. Le, J.T.A. Chi, S.S. Jeffrey and A.J. Giaccia, Lysyl oxidase is essential for hypoxia-induced metastasis, Nature 2006 440:7088 440: ((2006) ), 1222–1226. |
[49] | R. Nishikawa, T. Chiyomaru, H. Enokida, S. Inoguchi, T. Ishihara, R. Matsushita, Y. Goto, I. Fukumoto, M. Nakagawa and N. Seki, Tumour-suppressive microRNA-29s directly regulate LOXL2 expression and inhibit cancer cell migration and invasion in renal cell carcinoma, FEBS Lett 589: ((2015) ), 2136–2145. |
[50] | M. Wuest, M. Kuchar, S.K. Sharma, S. Richter, I. Hamann, M. Wang, L. Vos, J.R. Mackey, F. Wuest and R. Löser, Targeting lysyl oxidase for molecular imaging in breast cancer, Breast Cancer Research 17: ((2015) ), 1–15. |
[51] | H.R. Tang, L. Leung, G. Saturno, A. Viros, D. Smith, G. DI Leva, E. Morrison, D. Niculescu-Duvaz, F. Lopes, L. Johnson, N. Dhomen, C. Springer and R. Marais, Lysyl oxidase drives tumour progression by trapping EGF receptors at the cell surface, Nature Communications 8: (1) ((2017) ), 1–14. |
[52] | J. Dai, R.-J. Wei, R. Li, J.-B. Feng, Y.-L. Yu and P.-S. Liu, 4230-4235-A study of CCND1 with epithelial ovarian cancer cell proliferation and apoptosis, (n.d.). |
[53] | Q. shui Wang, F. Li, Z. qiang Liao, K. Li, X. liu Yang, Y. yu Lin, Y. lin Zhao, S. yun Weng, Y. Xia, Y. Ye, S. huan Li, C. yi Wang and Y. Lin, Low level of Cyclin-D1 correlates with worse prognosis of clear cell renal cell carcinoma patients, Cancer Med 8: ((2019) ), 4100–4109. |
[54] | W. Zhao, B. Tian, C. Wu, Y. Peng, H. Wang, W.L. Gu and F.H. Gao, DOG1, cyclin D1, CK7, CD117 and vimentin are useful immunohistochemical markers in distinguishing chromophobe renal cell carcinoma from clear cell renal cell carcinoma and renal oncocytoma, Pathol Res Pract 211: ((2015) ), 303–307. |
[55] | P. Wee and Z. Wang, Epidermal growth factor receptor cell proliferation signaling pathways, Cancers 9: ((2017) ), 52. |
[56] | C. Liu, L. Liu, K. Wang, X.F. Li, L.Y. Ge, R.Z. Ma, Y.D. Fan, L.C. Li, Z.F. Liu, M. Qiu, Y.C. Hao, Z.F. Shi, C.Y. Xia, K. Strååt, Y. Huang, L.L. Ma and D. Xu, VHL-HIF-2α axis-induced SMYD3 upregulation drives renal cell carcinoma progression via direct trns-activation of EGFR, Oncogene 2020 39:21 39: ((2020) ), 4286–4298. |
[57] | Y. Wang, O. Roche, C. Xu, E.H. Moriyama, P. Heir, J. Chung, F.C. Roos, Y. Chen, G. Finak, M. Milosevic, B.C. Wilson, T. Teh, M. Park, M.S. Irwin and M. Ohh, Hypoxia promotes ligand-independent EGF receptor signaling via hypoxia-inducible factor–mediated upregulation of caveolin-1, National Acad Sciences, (n.d.). |
[58] | D. Saavedra and T. Crombet, CIMAvax-EGF: A new therapeutic vaccine for advanced non-small cell lung cancer patients, Front Immunol 8: ((2017) ), 269. |
[59] | G.X. Ruan and A. Kazlauskas, VEGF-A engages at least three tyrosine kinases to activate PI3K/Akt, Cell Cycle 11: ((2012) ), 2047. |
[60] | L. Kasherman, D.H.W. Siu, R. Woodford and C.A. Harris, Angiogenesis inhibitors and immunomodulation in renal cell cancers: The past, present, and future, Cancers (Basel) 14: ((2022) ). |


