
Identification of Hub genes with prognostic values in colorectal cancer by integrated bioinformatics analysis
Abstract
BACKGROUND:
Our study aimed to investigate the Hub genes and their prognostic value in colorectal cancer (CRC) via bioinformatics analysis.
METHODS:
The data set of colorectal cancer was downloaded from the GEO database (GSE21510, GSE110224 and GSE74602) for differential expression analysis using the GEO2R tool. Hub genes were screened by protein-protein interaction (PPI) comprehensive analysis. GEPIA was used to verify the expression of Hub genes and evaluate its prognostic value. The protein expression of Hub gene in CRC was analyzed using the Human Protein Atlas database. The cBioPortal was used to analyze the type and frequency of Hub gene mutations, and the effects of mutation on the patients’ prognosis. The TIMER database was used to study the correlation between Hub genes and immune infiltration in CRC. Gene set enrichment analysis (GSEA) was used to explore the biological function and signal pathway of the Hub genes and corresponding co-expressed genes.
RESULTS:
We identified 346 differentially expressed genes (DEGs), including 117 upregulated and 229 downregulated. Four Hub genes (AURKA, CCNB1, EXO1 and CCNA2) were selected by survival analysis and differential expression validation. The protein and mRNA expression levels of AURKA, CCNB1, EXO1 and CCNA2 were higher in CRC tissues than in adjacent tissues. There were varying degrees of immune cell infiltration and gene mutation of Hub genes, especially B cells and CD8
CONCLUSION:
Overexpression of AURKA, CCNB1, CCNA2 and EXO1 had a better prognosis for CRC and this effect was correlation with gene mutation and infiltration of immune cells.
Abbreviations
| CRC | colorectal cancer |
| GEO | Gene Expression Omnibus |
| TCGA | The Cancer Genome Atlas |
| DEGs | differentially expressed genes |
| DFS | disease-free survival |
| GTEx | Genotype Tissue Expression |
| ROC | receiver’s operating characteristics |
| SMD | standard mean difference |
| GEPIA | Gene Expression Profiling Interactive |
| Analysis | |
| HPA | Human Protein Atlas |
| PPI | Protein-protein interaction |
| TIMER | Tumor Immune Estimation Resource |
| COAD | colon adenocarcinoma |
| GO | Gene Ontology |
| KEGG | Kyoto Encyclopedia of Genes and |
| Genomes | |
| BP | biological process |
| CC | cellular component |
| MF | molecular function |
1.Introduction
Colorectal cancer (CRC) is a common gastrointestinal malignancy with high morbidity and mortality [1]. The incidence of CRC showed an increasing trend with changes in lifestyle and dietary habits [2, 3]. The early diagnosis and treatment of CRC is crucial for improving the prognosis of CRC patients [4, 5]. The overall survival of patients with advanced CRC was very low [6]. However, the biomarkers for predicting the prognosis for CRC were lacked. Searching for effective prognostic biomarkers would aid in predicting prognosis and improving the treatment of CRC patients.
Gene mutations participate in the pathological mechanism of CRC [7]. At the cellular level, the accumulation of genomic changes induces transformation of normal colonic epithelial cells into cancer cells. It also creates a beneficial environment for the activation of oncogenes, which is a key step in the process of early CRC patients [8, 9]. It was reported that gene mutation in the pathological mechanism and prognosis of CRC [10]. For instance, P2X7 receptor (P2X7R) was overexpressed in CRC tissues, and a promoter of CRC onset [11, 12]. The mutations of p53 and RAS genes were adopted as the predictive and prognostic markers of CRC [13, 14]. In addition, the infiltration of different immune cell types is a major participant in the tumor microenvironment. Tumor infiltrating lymphocytes are important factors affecting the prognosis of patients with CRC [15]. Macrophage infiltration of solid tumors is associated with poor survival results [16]. CD8
In recent years, high-throughput sequencing technology and gene chip research have attracted extensive attention in the field of medicine. The characteristics of some databases containing a large number of samples provide a certain guarantee for the reliability and feasibility of medical research [18]. Through the research and analysis of this data, the Hub genes that play an important role in tumor genesis and development can be screened out [19]. In this study, we aimed to explore the Hub genes and their prognostic value in CRC via comprehensive bioinformatics analysis. We identified differentially expressed genes (DEGs) in expression profiles GSE21510 [20], GSE110224 [21] and GSE74602 from the Gene Expression Omnibus (GEO) database. Then, we screened the Hub genes by the protein-protein interaction (PPI) comprehensive analysis of DEGs. The mutation and tumor invasion of Hub genes, as well as its influence on the prognosis of CRC were analyzed. Finally, we investigated the physiological functions and signal pathways of Hub genes and co-expressed gene in CRC. Different online databases, tools and integrated data were applied in our study to provide new scientific basis and treatment methods for further study of the pathogenesis and prognosis of CRC patients.
2.Materials and methods
2.1Data source
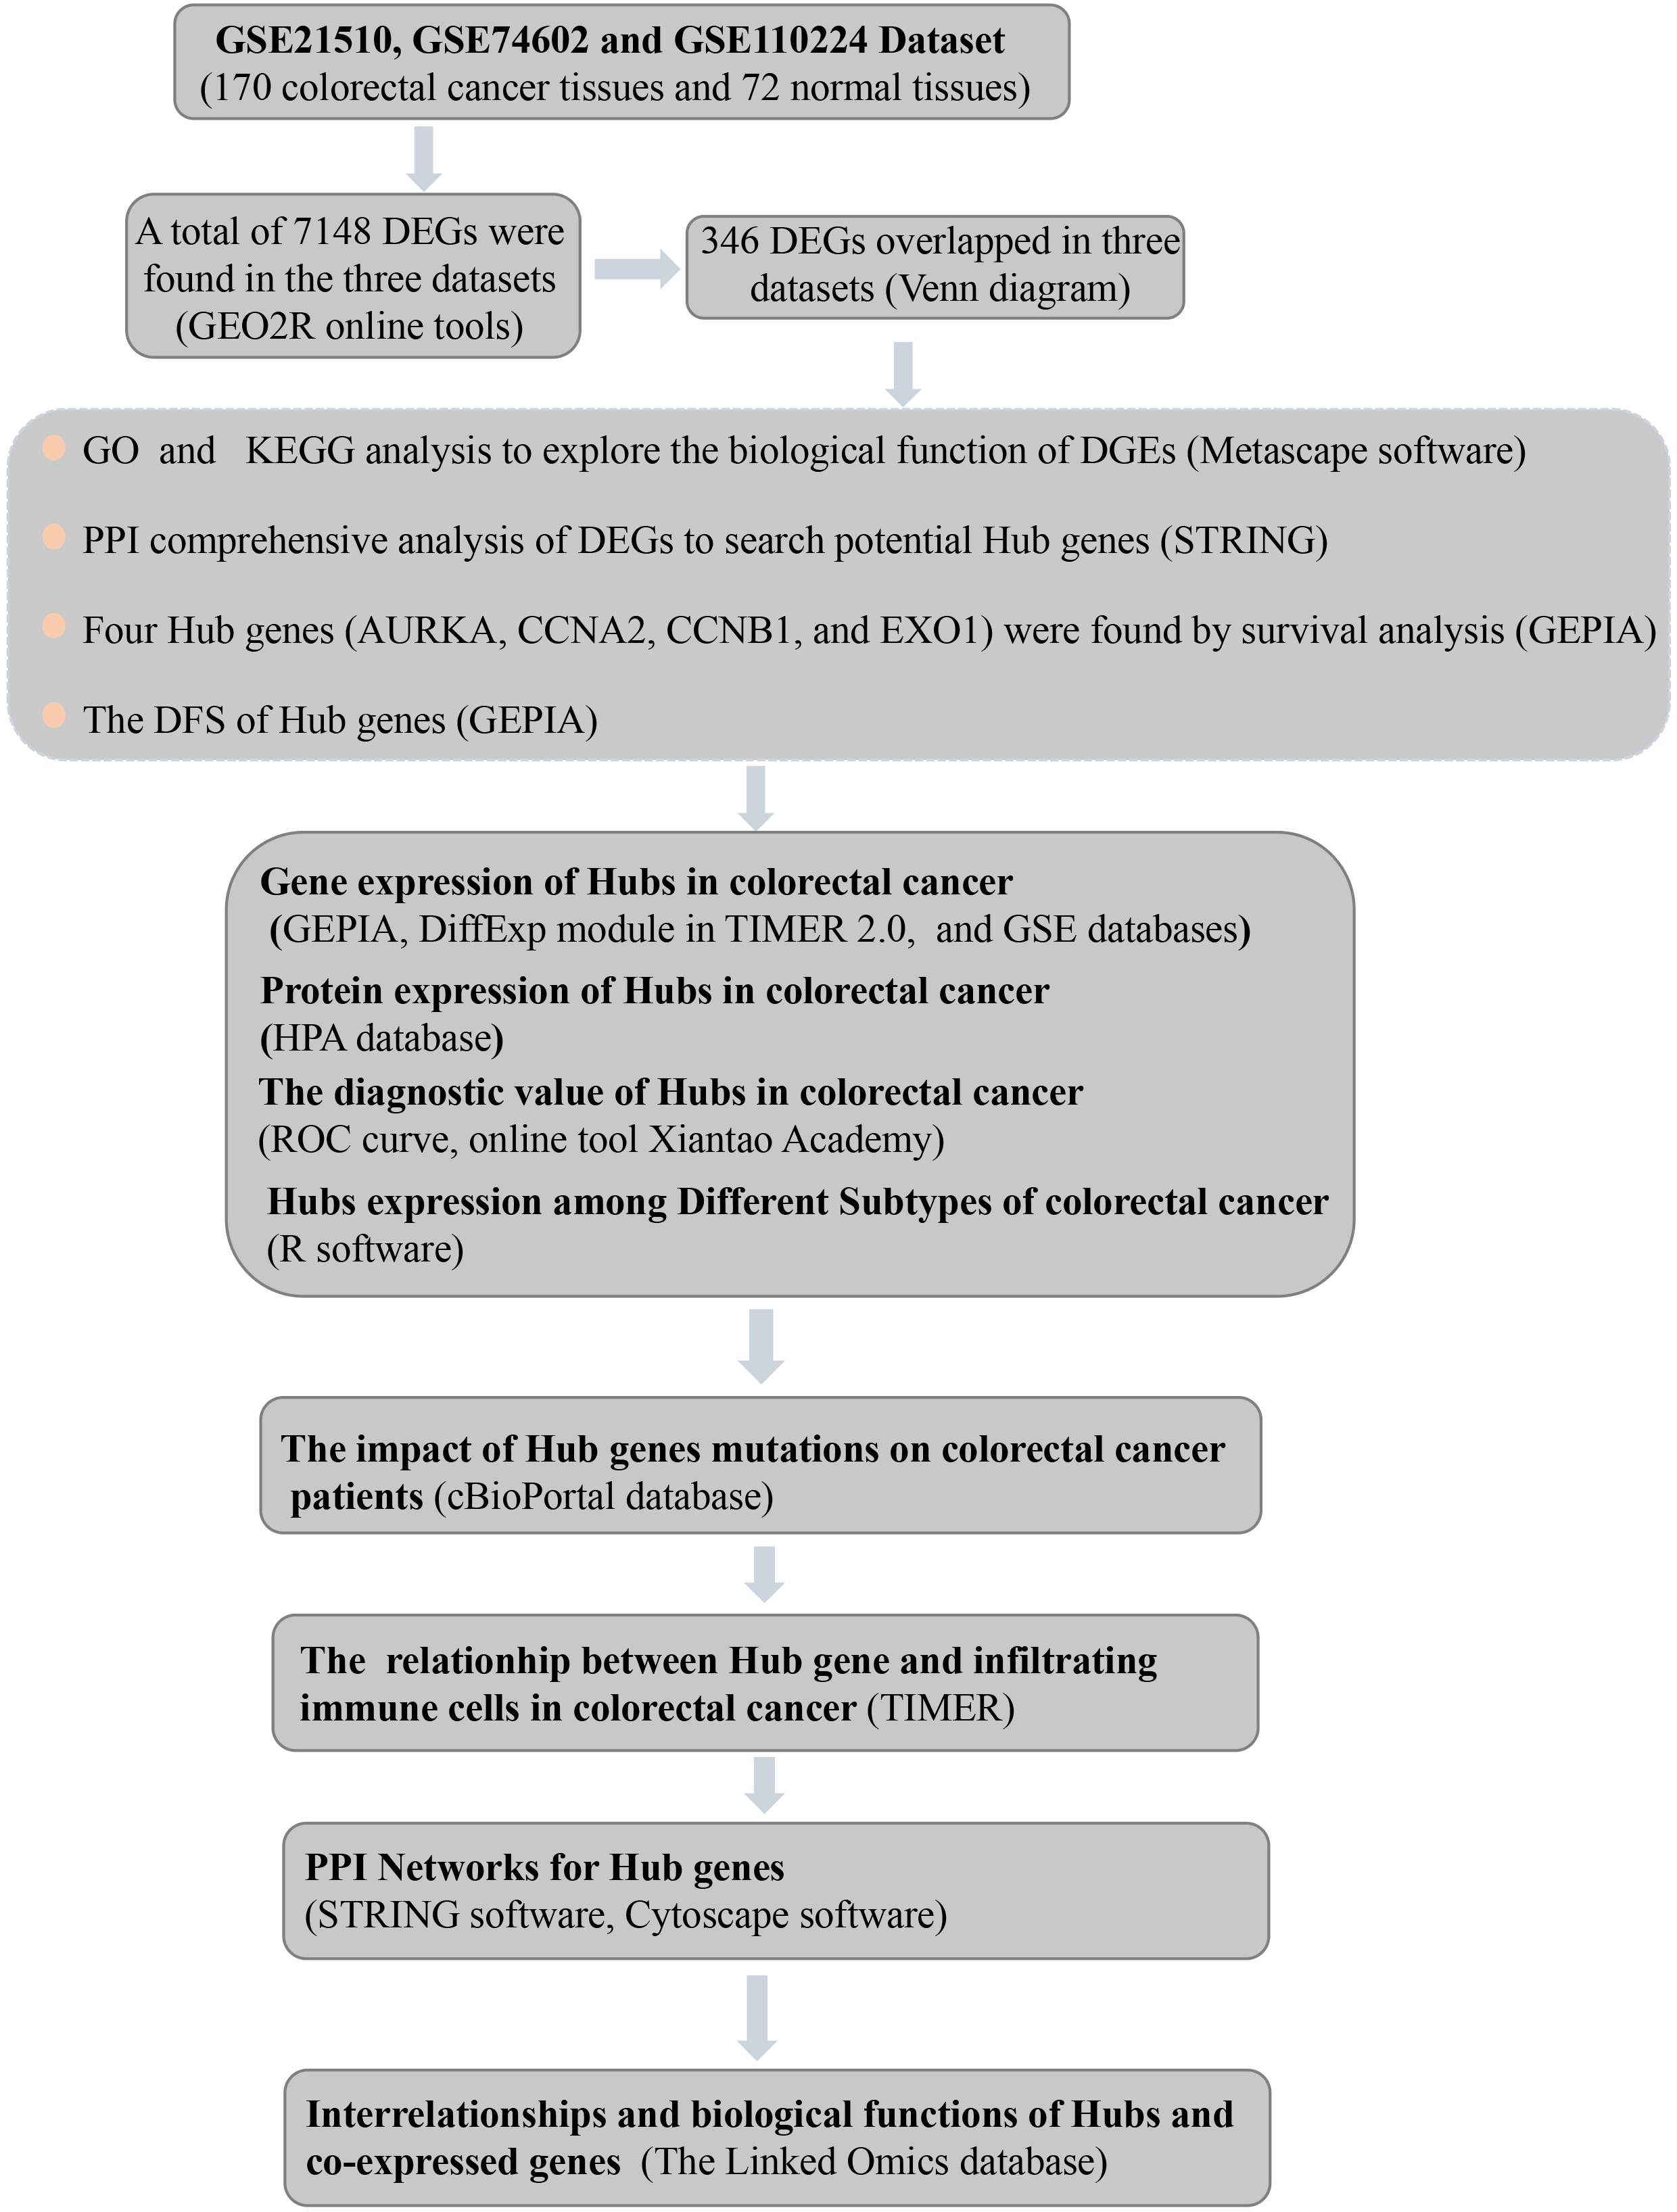
As one of the biggest collections of gene chips in the world, the GEO database is a comprehensive gene expression library at the National Center of Biotechnology Information (NCBI) (https://www.ncbi.nlm.nih.gov/ geo/). Expression profiles of GSE21510 and GSE110224 based on the GPL570 platform and GSE74602 based on the GPL6104 platform were obtained from the GEO database. GSE21510 contained 123 CRC samples and 25 normal tissues; GSE110224 included 17 CRC samples and 17 normal tissues, and GSE74602 contained 30 CRC samples and 30 normal tissue. Figure 1 shows the overall flowchart of the study.
Figure 1.
The flow diagram of study.
2.2Differential expressed gene analysis
The differentially expressed genes (DEGs) were filtered using a threshold of adjusted
2.3GO and KEGG pathway analysis
To further understand the biological functions and related signaling pathways of the DEGs, we performed Gene Ontology (GO) enrichment analysis and Kyoto Encylopaedia of Genes and Genomes (KEGG) pathway enrichment analysis using the Metascape (http:// metascape.org/) [23, 24]. An adjusted
2.4Protein-protein interaction (PPI) comprehensive analysis
PPI comprehensive analysis was performed using the online tool Search Tool for the Retrieval of Interacting Genes (STRING, https://string-db.org/) [25, 26]. The selected Hub genes were imported into the STRING, and the confidence score of
2.5Hub gene selection and analysis of survival and differential expression
The PPI analysis of DEGs was performed using the online tool STRING, and results with a minimum interaction score of 0.4 were visualized in Cytoscape software (version 3.8.2). The obtained results were used to select the Hub genes through the MCC algorithm in the Cytoscape cytoHubba application, and the top 30 genes were selected as potential Hub genes.
Gene Expression Profiling Interactive Analysis (GEPIA, http://gepia.cancer-pku.cn/) is a web server that analyzes cancerous and normal gene expression profiles and interactions in The Cancer Genome Atlas (TCGA, https://genomecancer.ucsc.edu/) and the Genotype Tissue Expression (GTEx, https://gtexportal.org/ home/) projects [27]. The overall survival of colorectal cancer patients and the expression level validation of Hub genes were evaluated using GEPIA.
2.6Protein expression and receiver operating characteristic (ROC) curves
The protein expression levels of Hub genes in human normal and cancer tissues were determined using the Human Protein Atlas (HPA) database (https://www.prot einatlas.org/), which respectively displays the expression of proteins in cells, normal tissues, and cancerous tissues. Receiver operating characteristic (ROC) curves were obtained from the online tool Xiantao Academy (https://www.xiantao.love/).
2.7Gene mutation status and survival analysis
cBioPortal (http://cbioportal.org) is an open-access resource for exploring, visualizing and analyzing multi-dimensional cancer genome data [29]. The cBioPortal was used to analyze the type and frequency of Hub gene mutations, and the effects of mutation on the patients’ prognosis.
2.8Immune infiltration analysis
The TIMER database contains 32 cancers and 10,897 tissue sample information from the TCGA database. It can realize systematic analysis of the correlation between immune infiltrates and other wide spectrum of factors, including related gene expression in tissues and prognosis, gene mutations and copy number of cancer patients [28]. In this study, we evaluated the infiltration of immune cells (CD8+ T cells, CD4+ T cells, B cells, dendritic cells, macrophages, and neutrophils) in CRC patients through TIMER database. The relationship between gene expression and tumor purity was also explored and visualized.
2.9Co-expression analysis
The Linked Omics database (http://www.linkes.org/) is a web-based platform for analyzing 32 TCGA cancer-related cubes [30]. The Link Finder module of Linked Omics was used to study the differentially expressed genes related to selected Hub genes in the TCGA-COAD, and the Pearson correlation coefficient was used for statistical analysis. All results are presented graphically in a volcano map, heat map or scatter plot. The Link-Interpreter module of Linked Omics performs pathway and network analysis of differentially expressed genes. Use the comprehensive functional classification database in the Web-based Web Gestalt to sign and sort the data in the Link Finder results, and use Gene set enrichment analysis (GSEA) to analyze the GO (CC, BP, MF) and KEGG channels. The GSEA program was run with 500 simulations, and the significance level was top 25.
2.10Statistical analyses
Data are represented as the mean
3.Results
3.1Identification and functional enrichment analysis of DEGs
We obtained 170 CRC tissues and 72 normal tissues from the GSE21510, GSE74602 and GSE110224 datasets. According to the cutoff criteria, a total of 7148 DEGs were screened from these three datasets. Among them, 4722, 1650, and 776 DEGs were obtained from the GSE21510, GSE74602, and GSE110224 datasets, respectively. Then 346 DEGs common to the three GEO datasets were detected via the Venn diagram, including 117 upregulated genes and 229 downregulated genes were identified (Fig. 2A and Table 1).
GO and KEGG pathway analysis were used to explore the biological functions and signal pathways of DEGs related to CRC. GO analysis indicated that the DEGs were mainly involved in the biological processing of the mitotic cell cycle process, regulation of hormone levels and response to nutrient levels (Fig. 2B), and associated with the cellular components including the apical part of cells, extracellular matrix and apical plasma member (Fig. 2B). The DGEs genes were linked to structural molecule activity, and signaling receptor activator activity (Fig. 2B). KEGG pathway analysis showed DEGs related to CRC were involved in bile secretion, pyruvate metabolism, viral protein interaction with cytokine and cytokine receptor, IL-17 signaling pathway, etc. (Fig. 2B).
Figure 2.
Differentially expressed of DEGs were selected from three GEO datasets. A, The DEGs with
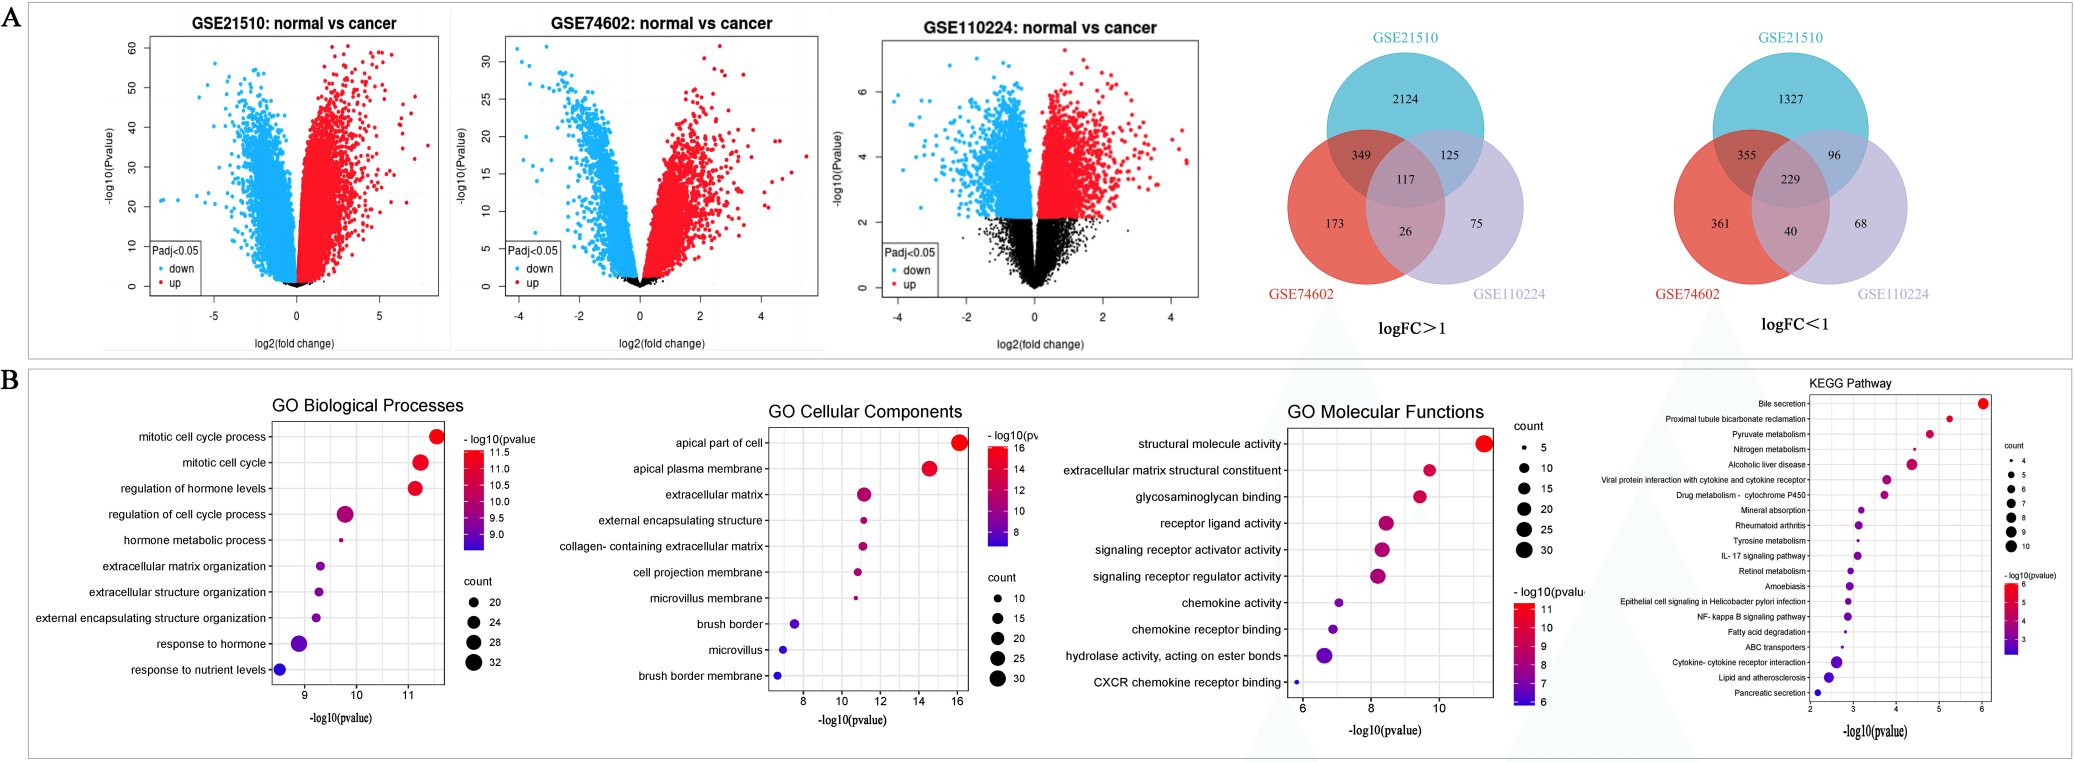
Table 1
DEGs extracted from GEO datasets
| DEGs | Gene symbol |
|---|---|
| Upregulated genes (117) | FOXQ1, CEMIP, CLDN1, ANLN, MMP1, COL11A1, CDK1, CXCL8, MMP7, MMP3, EPHX4, CTHRC1, TGFBI, ATAD2, MMP12, NUF2, VSNL1, AZGP1, PSAT1, TMPRSS3, NEBL, MAD2L1, RAD54B, CSE1L, RFC3, E2F7, NFE2L3, DPEP1, DLGAP5, PPAT, BUB1, LRP8, CEP55, KIF23, PHLDA1, CDH3, COL12A1, CCNB1, TRIP13, KIF14, CXCL1, THBS2, CXCL2, CHEK1, KRT6B, BACE2, SCD, TPX2, PLAU, NCAPG, MCM10, FABP6, DTL, CCNA2, AURKA, MTHFD2, NME1, CTPS1, FAM83D, COL1A1, CLDN2, SRPX2, TCN1, HILPDA, RIPK2, TRIB3, SQLE, SPP1, CXCL10, SULF1, COL8A1, MND1, UHRF1, SOX9, MSX1, STC2, PRC1, KIF20A, ENC1, LIPG, LEMD1, FANCI, CBX2, MET, MORC4, DDIAS, SLCO4A1, FAP, SLC7A5, PDPN, S100P, JPH1, GDF15, KIF2C, WDR4, RNASEH2A, NOLC1, TEAD4, SERPINB5, AUNIP, CDC25B, CDCA5, TESC, KLK6, TIMP1, CFB, SHMT2, REG1A, DUSP4, ERO1A, FOXM1, KRT80, REG1B, CDC45, PLEKHS1, KDELR3, EXO1 |
| Downregulated genes (229) | CLCA4, AQP8, MS4A12, CA4, SLC4A4, CLDN8, CA1, ZG16, CEACAM7, CA2, GUCA2B, DHRS9, MT1M, ABCG2, GUCA2A, SLC30A10, CD177, ANPEP, ADH1B, PKIB, BEST4, CDKN2B, PDE9A, TRPM6, GCNT2, GBA3, MMP28, SI, HSD17B2, C2orf88, SCNN1B, VSIG2, ADTRP, CHP2, EPB41L3, CLDN23, AKR1B10, KLF4, SLC51A, OGN, ADH1C, SLC51B, CDHR5, CXCL12, SCIN, SCARA5, ENTPD5, TEX11, LAMA1, GPAT3, DHRS11, CKB, CEACAM1, SLC16A9, SLC26A2, HIGD1A, LRRC19, HSD3B2, CWH43, TP53INP2, CHGA, SFRP1, NR3C2, SLC26A3, XDH, TSPAN7, TMEM100, SLC17A4, HSD11B2, TUBAL3, GCG, TMEM37, SEMA6A, AOC1, VIP, SELENBP1, HHLA2, RUNDC3B, ABCA8, EDN3, GDPD3, NXPE4, CES2, ABI3BP, SMPDL3A, NR5A2, CA7, C1orf115, LGALS2, METTL7A, PTPRH, MT1F, LDHD, SPIB, SLC25A34, CPNE8, CLIC5, TMEM171, AHCYL2, HMGCS2, TMCC3, NAAA, MEP1B, PCK1, MEP1A, APPL2, BEST2, LPAR1, PLPP1, SMIM14, MAOA, ARL14, LRRC66, MFAP5, UGT2A3, PHLPP2, PPP2R3A, ABCB1, NPY1R, CCL23, CR2, GPX3, PDK4, CFD, PIGZ, PIGR, LIFR, GHR, MAMDC2, C2orf40, CDHR2, SGK2, MXI1, MYO1A, NXPE1, ENPP3, BCAS1, C10orf99, CGN, FXYD3, FUCA1, PBLD, ACACB, PLCE1, PDE6A, SORBS2, JAM2, PLP1, RHOU, C7, SRI, SULT1B1, FMO5, TFCP2L1, MIER3, STMN2, ZNF575, BCHE, MYH11, SULT1A2, NEDD4L, A1CF, DEFB1, PCOLCE2, DENND2A, SLC25A20, GREM2, ETFDH, ANGPTL1, PYY, PTPRR, NKX2-3, ITM2A, EPHX2, SCG2, FHL1, TMEM56, ARHGAP44, PDE5A, NAT2, SST, RERGL, SEPP1, TRIM36, VWA5A, ANK2, SCGB2A1, EPB41L4B, ANK3, TCEA3, MMRN1, SLC22A23, HTR4, CAMK2N1, JCHAIN, KRT24, LRMP, SCN9A, CDH19, ZSCAN18, FABP4, ACOX1, HIST1H2BD, SLC22A5, SCGN, SCUBE2, CHGB, FBLN1, TINAG, PPP1R14D, SDPR, POU2AF1, CNR1, LYVE1, CAPN13, TMEM35A, MB, CD36, TCF21, SLC39A5, MYOT, DNASE1L3, BCL2, ADH1A, SORCS1, SOWAHA, MFAP4 PPP1R14A ATP1A2 |
DEG, differentially expressed gene; GEO, Gene Expression Omnibus.
3.2PPI network construction and Hub genes analysis
The PPI network diagram of DEGs was constructed by STRING, and analyzed and visualized by Cytoscape. The PPI network included 295 nodes and 1170 edges (Fig. 3A and B). Finally, we identified the most important nodes by the MCC algorithm. The new network included 30 nodes and 424 edges, and the top 30 central nodes were identified as potential Hub genes (Fig. 3C).
Figure 3.
The Hub genes were identified. A, STRING was used to constructed PPI networks of DEGs. B, Cytoscape was used to analyzed and visualized of PPI networks. Upregulated genes are shown in red and downregulated genes are shown in blue. C, The top 30 genes were selected using the MCC algorithm by Cytoscape’s plug-in cytoHubba. D–G, GEPIA was used to analyzed the correlation between overall survival and the expression of AURKA (D), CCNA2 (E), CCNB1 (F) and EXO1 (G) in colorectal cancer. H–K, The association between disease-free survival and the expression of AURKA (H), CCNA2 (I), CCNB1 (J) and EXO1 (K) in colorectal cancer by GEPIA.
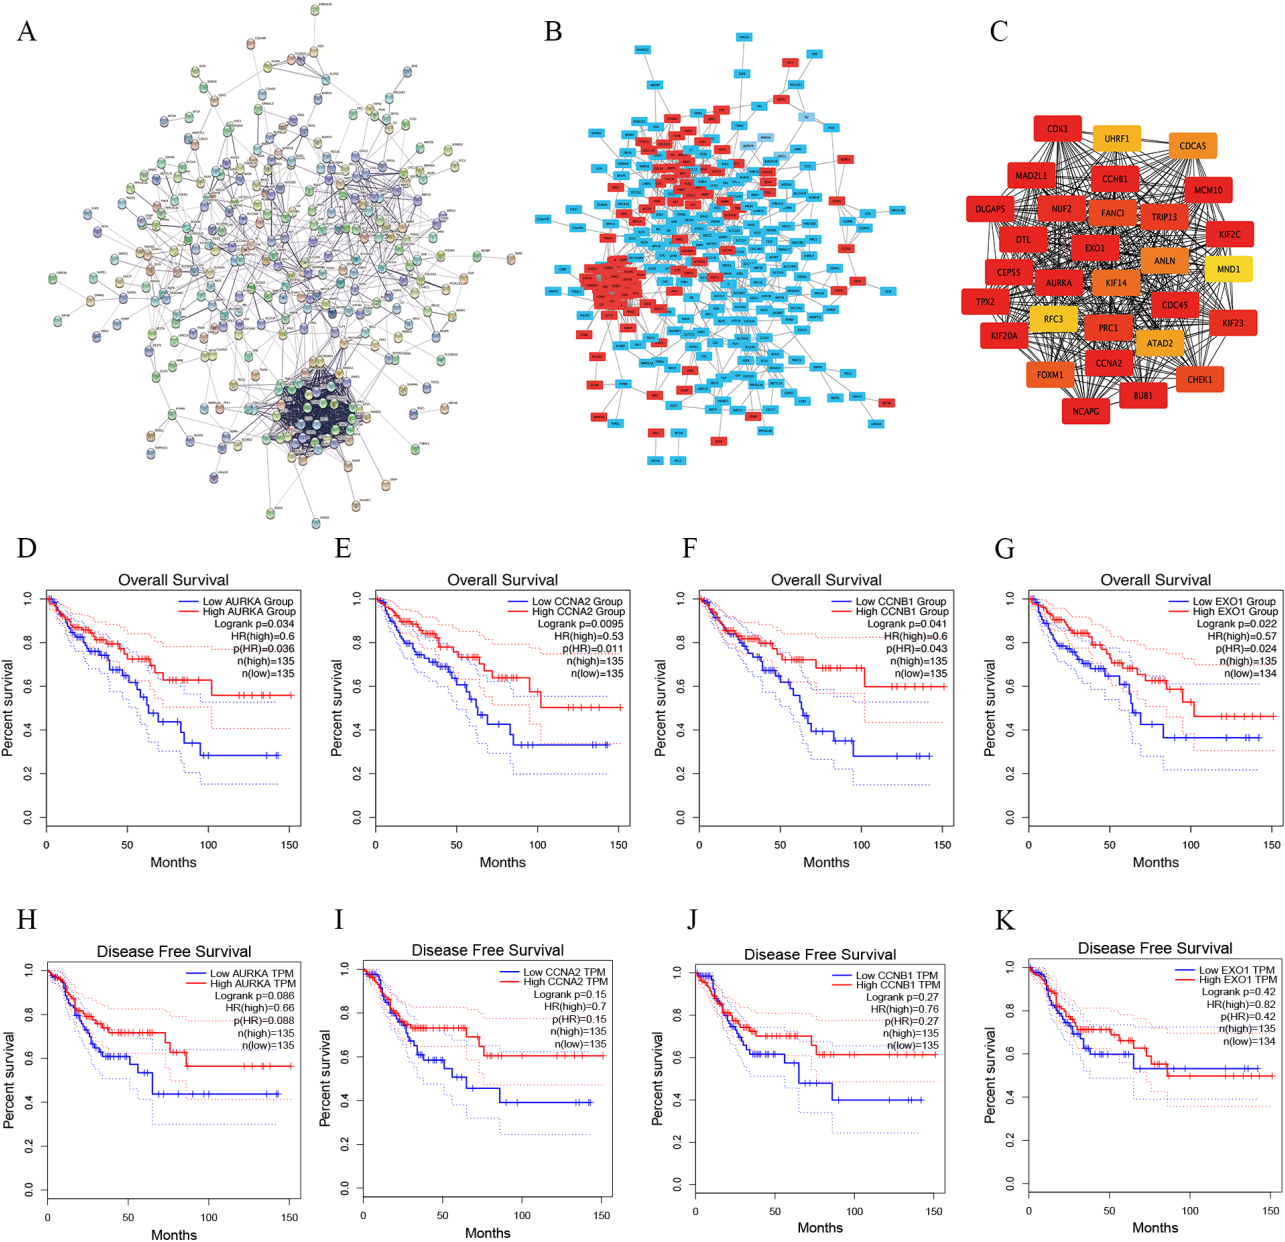
Then, we further analyzed the relationship between the expression of 30 potential Hub genes and the overall survival of patients with CRC using GEPIA, including 270 CRC patients. According to the screening criteria (
We verified the four Hub gene expression levels in colon adenocarcinoma (COAD) patients and normal via GEPIA, which included 275 tumors and 349 normal tissue. The result showed the expression levels of AURKA, CCNB1, EXO1 and CCNA2 significantly increased in tumors than those in normal tissue (
Subsequently, we investigated the expression of these four genes in various tumor tissues using the DiffExp module in TIMER 2.0. The statistical significance of differential expression was evaluated by the Wilcoxon test. We found that compared to normal tissues, AURKA, CCNB1, EXO1 and CCNA2 mRNA expression were significantly increased in COAD tumor tissues (Fig. 4C).
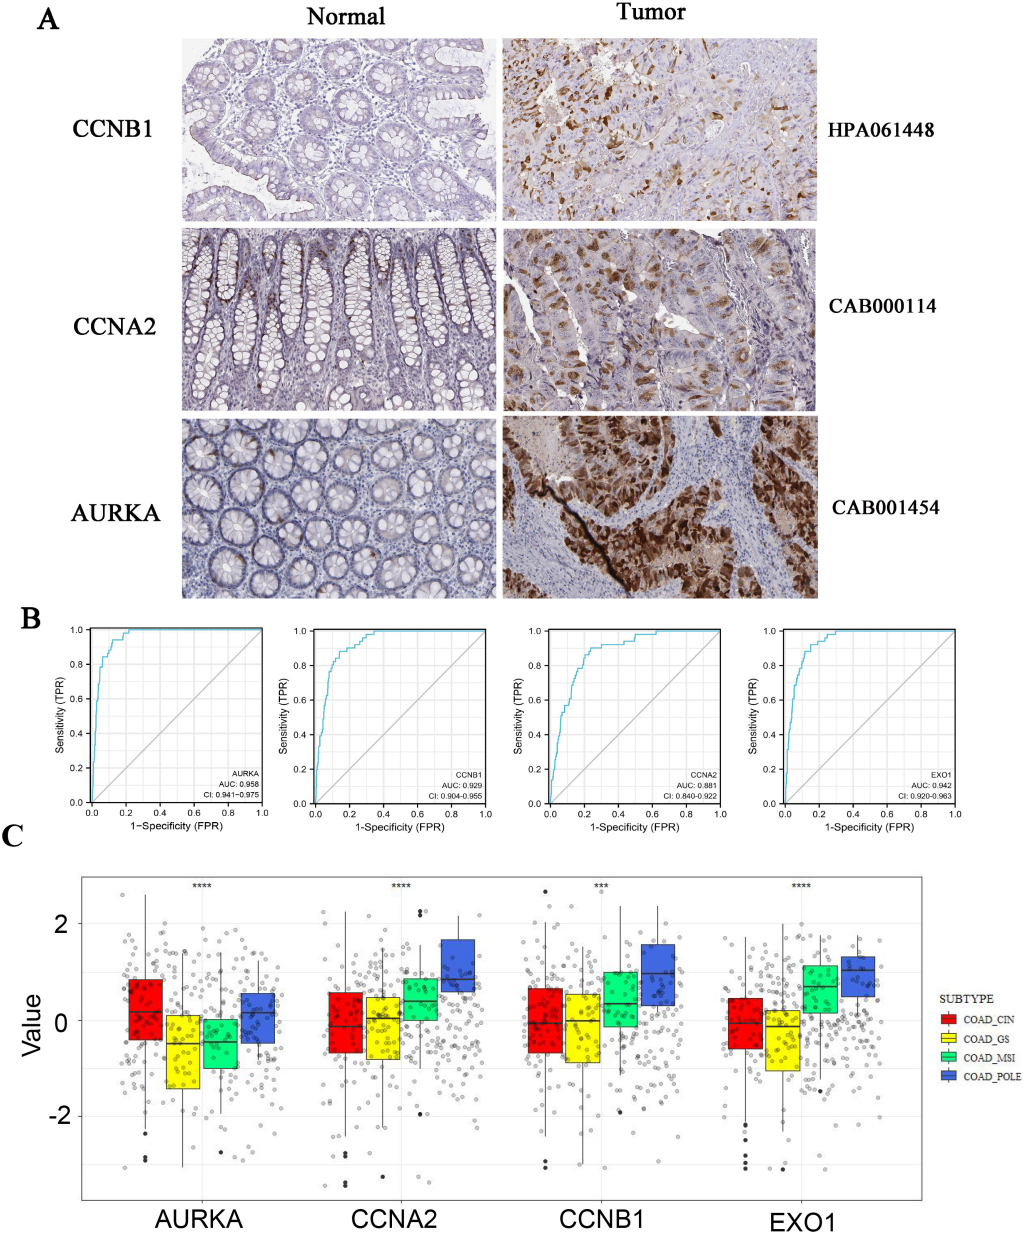
The HPA database was used to investigate the protein expression of AURKA, CCNB1, EXO1 and CCNA2 in CRC tissues. The protein expression of AURKA, CCNB1 and CCNA2 were increased in CRC tissues than that in normal tissues. The EXO1 protein expres-sion was not found in tissue from the HPA database (Fig. 5A). ROC curves displayed that the AUC of AURKA, CCNB1, CCNA2 and EXO1 was 0.958, 0.929, 0.881, and 0.942, respectively (Fig. 5B). It indicated that AURKA, CCNB1, CCNA2 and EXO1 have good diagnostic value for CRC. The differences of gene expression among different subtypes of CRC were investigated. The results displayed that there are differences in the expression levels of Hubs among different subtypes of CRC (POLE, MSI, CIN, and GS). AURKA was a higher expression in CIN subtypes. The CCNA2 expression was highest in the POLE subtypes of four types. The CCNB1 and EOX1 expressions were higher in MSI and POLE subtypes than in CIN and GS subtypes (Fig. 5C).
Figure 4.
The Hub genes was high expressed in colorectal cancer. A, GEPIA was used to analyzed the expression level of AURKA, CCNB1, EXO1 and CCNA2 in normal and colorectal cancer tissues. Red indicates tumor tissue and blue indicates normal tissue. *P < 0.05. B, The expression level of AURKA, CCNA2, CCNB1 and EXO1 were obtained from GSE21510, GSE110224 and GSE74602 datasets. C, The AURKA, CCNB1, EXO1 and CCNA2 in different tumors were obtained from TIMER database, *P < 0.05, **P < 0.01, ***P < 0. 001.
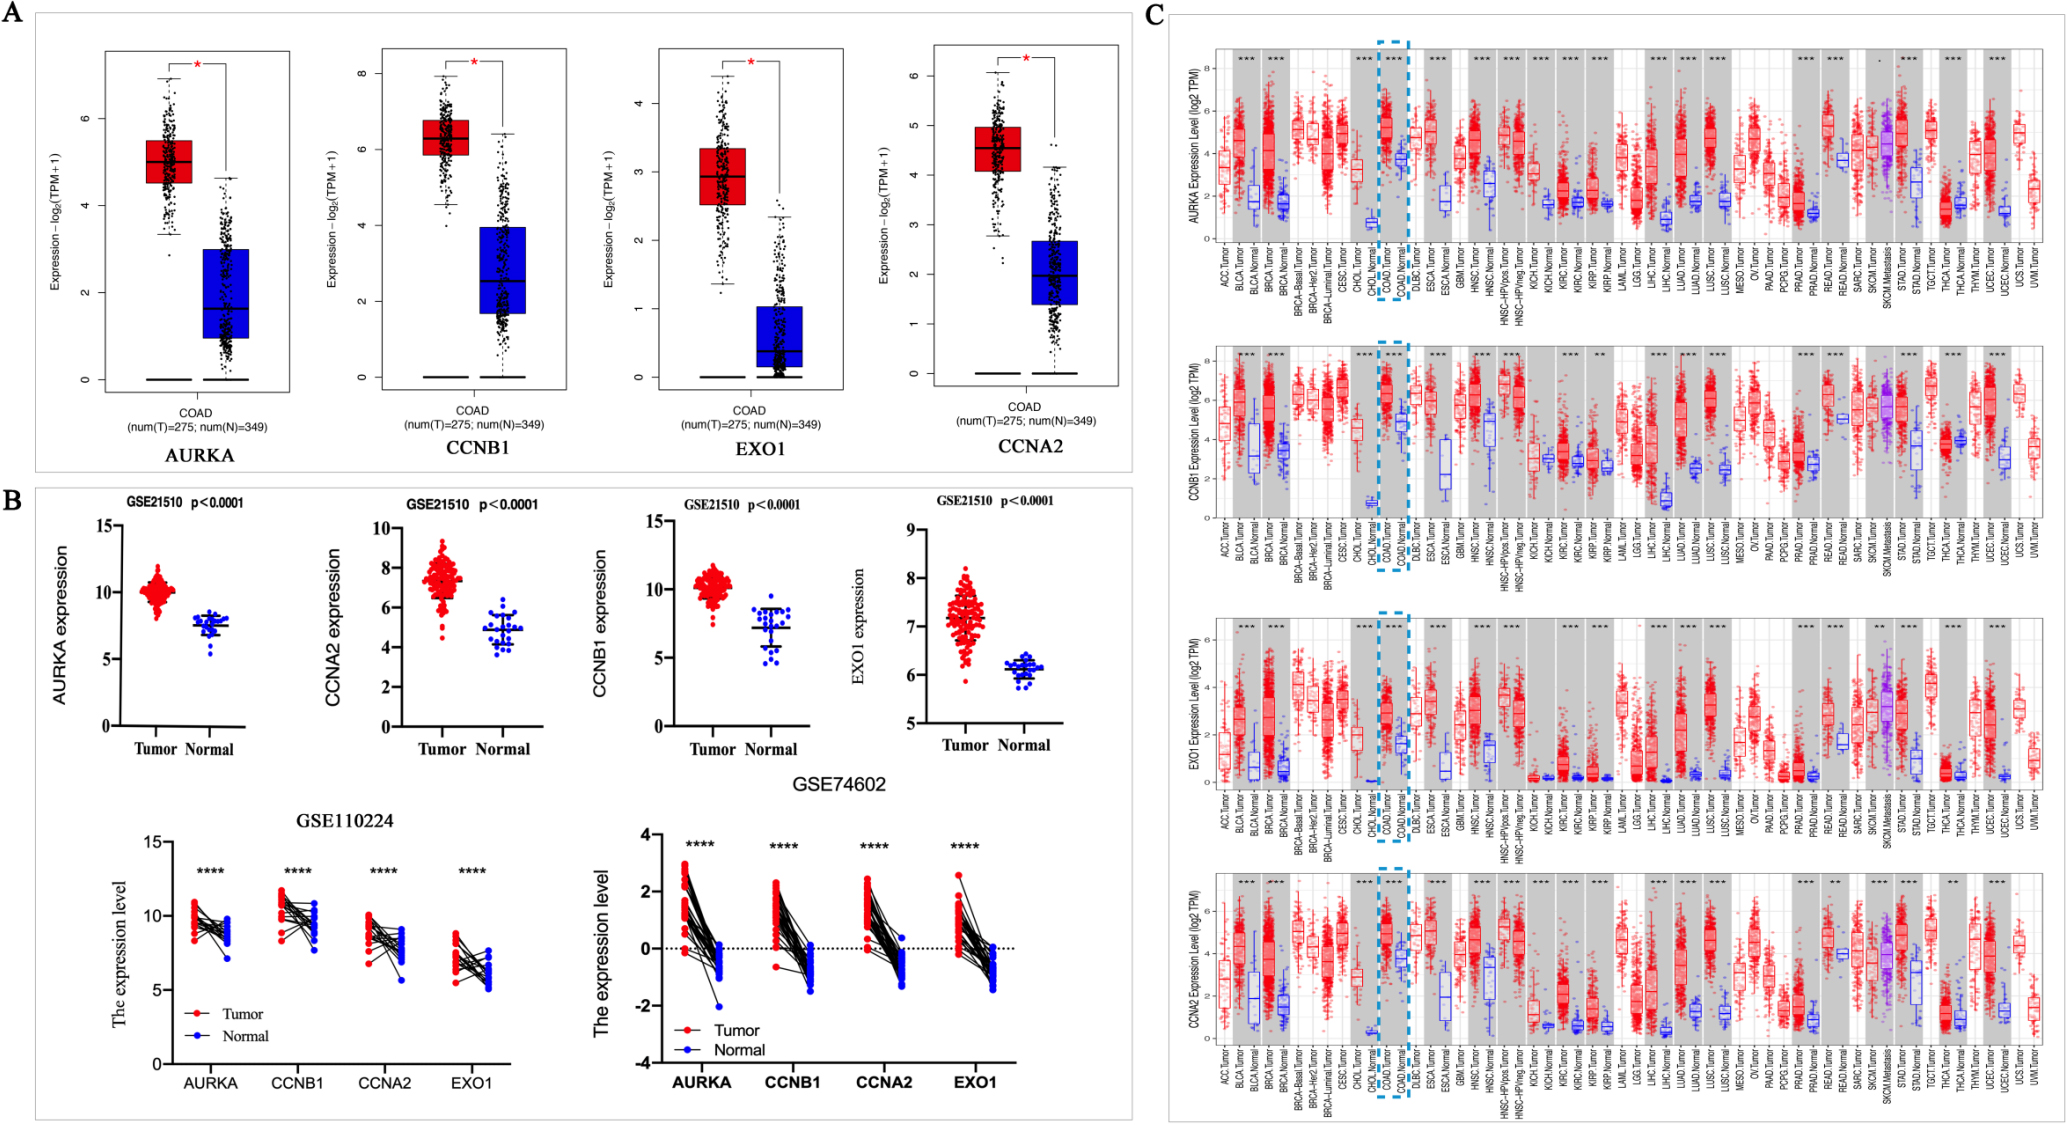
Figure 5.
The protein expression of Hub genes were up-regulated in colorectal cancer. A, HPA database was used to analyzed the protein expression of AURKA, CCNB1 and CCNA2 in normal and tumor tissue by immunohistochemistry. B, ROC curves of AURKA, CCNB1, EXO1 and CCNA2 were obtained from online tool Xiantao Academy. C, The differences of gene expression among four subtypes of colorectal cancer (POLE, MSI, CIN and GS) were investigated using R software.
3.3Genomic mutation of the Hub genes in CRC
We analyzed the gene mutations of AURKA, CCNB1, CCNA2 and EXO1 in CRC using the cBioPortal database. The results showed that AURKA had different mutation frequencies in different data sets, 13.64% of 22 cases (MSK, Cancer Discovery 202), 8.55% of 269 cases (TCGA, Nature 2012), 7.58% of 594 cases (TCGA, PanCancer Atlas), 4.26% of 47 cases (MSK, JCO Precis Oncol 2022), 3.82% of 471 cases (MSK, Gastroenterology 2020), 3.79% of 1134 cases (MSK, Cancer Cell 2018), 3.29% of 152 cases (MSK, Nat Commun 2022), 2.26% of 619 cases (DFCI, Cell Reports 2016) (Fig. 6A). Of the 3308 CRC patients in selected 8 data sets, 153 had a change in AURKA, and amplification is the most common type of AURKA mutation in CRC (Fig. 6B). There were 36 mutation sites in the AURKA gene (including 3 duplicate mutations in patients with multiple samples) (Fig. 6C). Furthermore, the results of survival analysis displayed that AURKA mutation had no effect on overall survival (
Figure 6.
The Hub gene mutation affected the prognosis of patients with colorectal cancer. A–E, The mutation frequency (A), mutant type (B), mutation site (C) and the effect of mutation on overall survival (D) and progression free survival time (E) of AURKA gene in colorectal cancer were obtained from cBioPortal. F–J, The mutation frequency (F), mutant type (G), mutation site (H) and the effect of mutation on overall survival (I) and disease free (J) of CCNB1 gene in colorectal cancer were obtained from cBioPortal. K–O, The mutation frequency (K), mutant type (L), mutation site (M) and the effect of mutation on overall survival (N) and progression free survival time (O) of CCNA2 gene in colorectal cancer were obtained from cBioPortal. P–T, The mutation frequency (P), mutant type (Q), mutation site (R) and the effect of mutation on overall survival (S) and disease free (T) of EXO1 gene in colorectal cancer were obtained from cBioPortal.
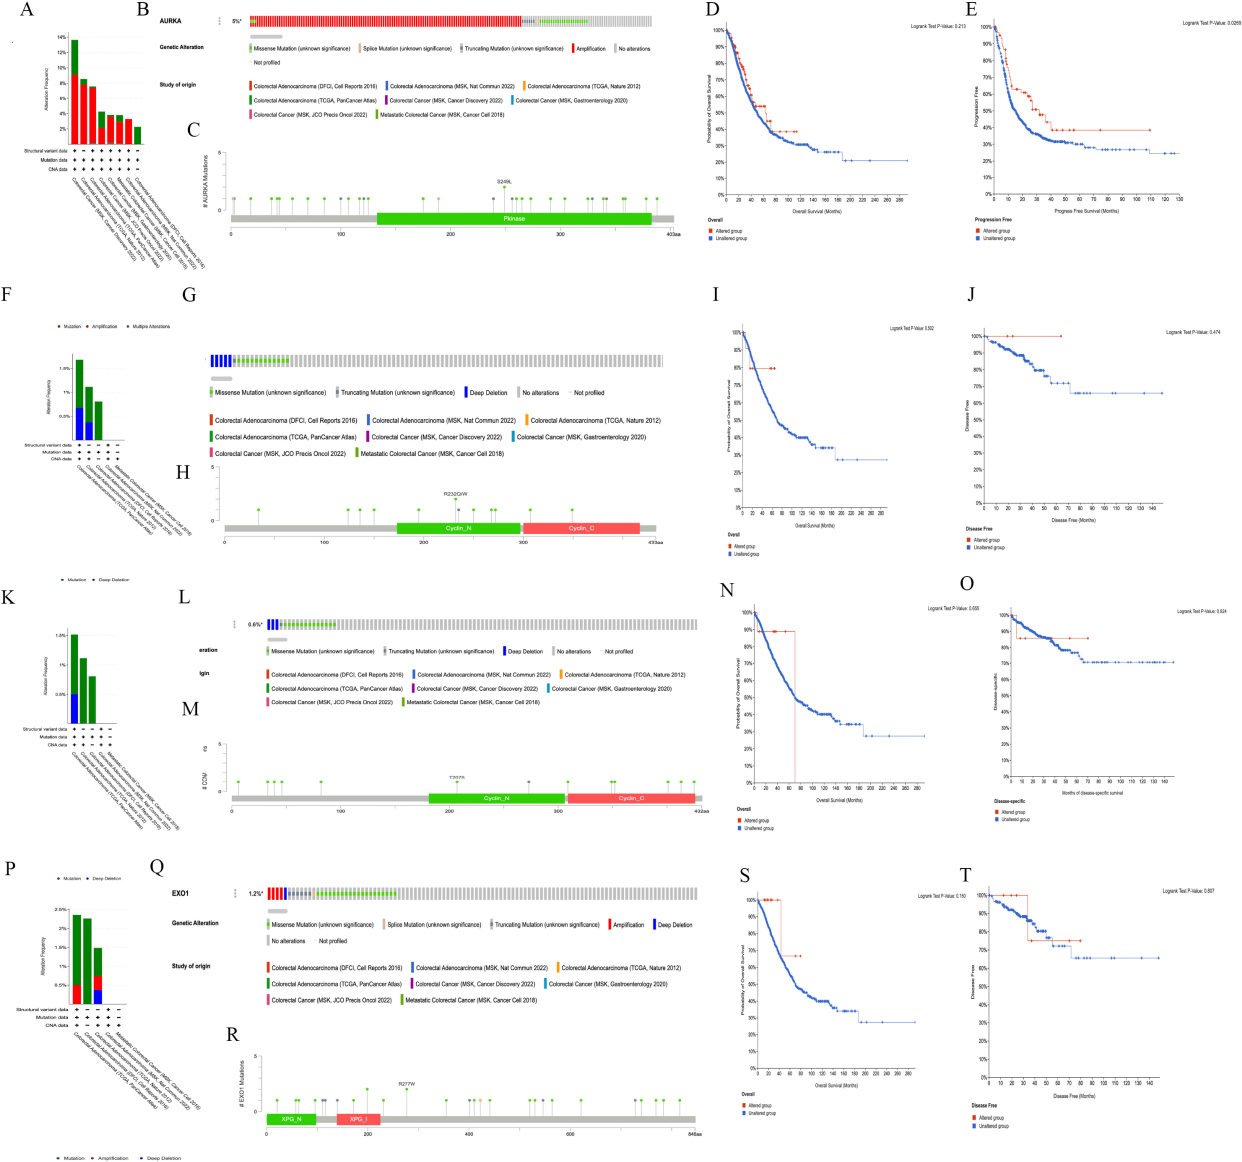
The CCNB1 mutation frequencies in different data sets were as follows: 1.68% of 594 cases (TCGA, PanCancer Atlas), 1.12% of 269 cases (TCGA, Nature 2012) and 0.81% of 619 cases (DFCI, Cell Reports 2016) (Fig. 6F). Of the 2650 CRC patients in the selected 5 data sets, 18 had a change in CCNB1 (mutation rate was 0.7%), and deep deletion is the common type of CCNB1 mutation in CRC (Fig. 6G). There were 13 mutation sites in the CCNB1 gene (including 1 duplicate mutation in patients with multiple samples) (Fig. 6H). The results of survival analysis showed that the mutations of CCNB1 gene did not affect the overall survival (
The CCNA2 mutation frequencies in different data sets were as follows: 1.52% of 594 cases (TCGA, PanCancer Atlas), 1.12% of 269 cases (TCGA, Nature 2012) and 0.81% of 619 cases (DFCI, Cell Reports 2016) (Fig. 6K). Of the 2650 CRC in the selected 5 databases, 17 had a change in CCNA2 (mutation rate was 0.6%) (Fig. 6L). There were 14 mutation sites in the CCNA2 gene (including 2 duplicate mutations in patients with multiple samples) (Fig. 6M). The mutations in the CCNA2 gene did not affect the overall survival (
The EXO1 mutation frequencies in different data sets were as follows: 2.36% of 594 cases (TCGA, PanCancer Atlas), 2.26% of 619 cases (DFCI, Cell Reports 2016), and 1.49% of 269 cases (TCGA, Nature 2012) (Fig. 6P). Of the 2650 CRC patients in the selected 5 databases, 32 had a change in EXO1, and deep deletion and amplification are the common type of EXO1 mutation in CRC (Fig. 6P and Q). There were 29 mutation sites in the EXO1 gene (including 1 duplicate mutation in patients with multiple samples) (Fig. 6R). Moreover, the EXO1 mutation had no effect on overall survival time (
3.4Correlation analysis between the Hub genes expression and infiltrating immune cells
Tumor infiltrating lymphocytes affect the survival of patients with CRC. So we using the TIMER database analyzed the correlation of AURKA, CCNB1, CCNA2 and EXO1 with six kinds of infiltrating immune cells and tumor purity in CRC. The results displayed that the AURKA expression was correlation with tumor purity (
3.5Constructing PPI networks
The functional interaction between proteins is necessary for the molecular mechanism and metabolism of malignancy. Therefore, we constructed the PPI network of AURKA, CCNB1, CCNA2 and EXO1 protein using STRING. Cytoscape software was used to analyze the PPI network formed by each gene and Hub genes (Fig. 8). Their results were helpful to reveal the pathogenesis of CRC and to search for therapeutic targets and prognostic biomarkers.
Figure 7.
The expression of Hub gene affected the immune cell infiltration level in colorectal cancer. A, C, E, G, TIMER database was used to analyze the correlation between AURKA (A), CCNB1 (C), CCNA2 (E) and EXO1 (G) gene expression and immune cell infiltration level, respectively. B, D, F, H, TIMER database was used to analyze the relationship between the copy number of AURKA (B), CCNB1 (D), CCNA2 (F) and EXO1 (H) infiltration level, respectively. *P < 0.05, **P < 0.01, ***P < 0. 001.
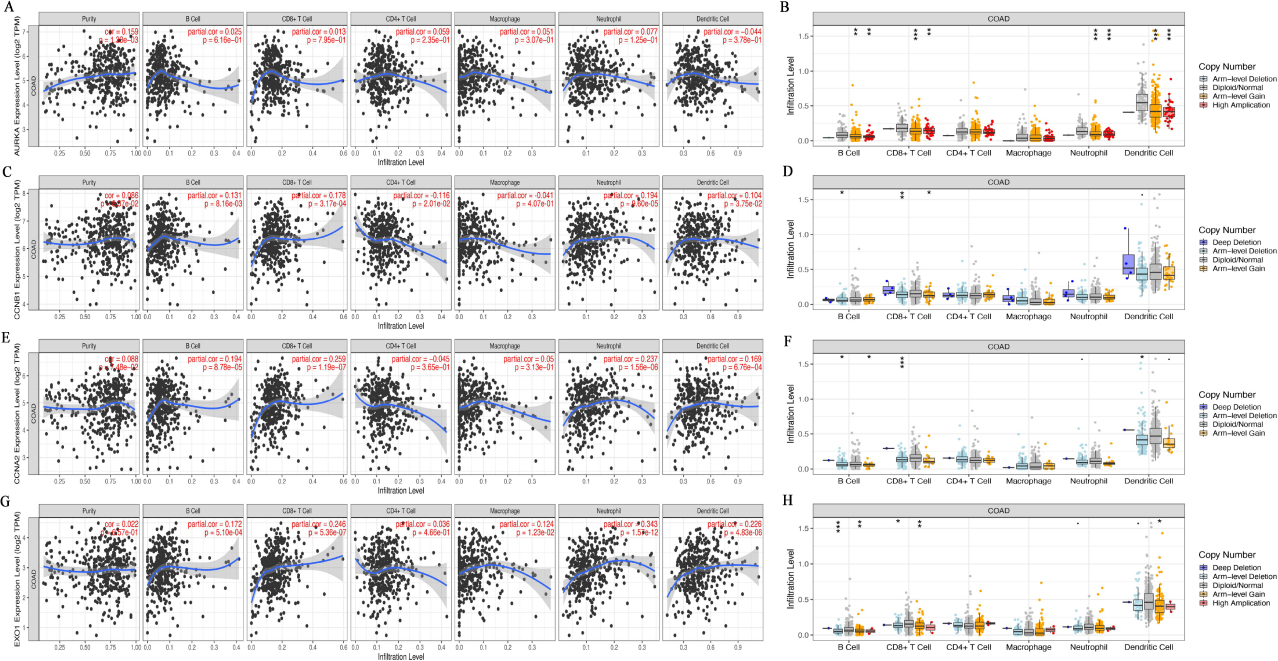
Figure 8.
The PPI network of Hub genes in colorectal cancer. A–D, The PPI network diagrams of AURKA (A), CCNB1 (B), CCNA2 (C) and EXO1 (D) were structured by STRING tool.
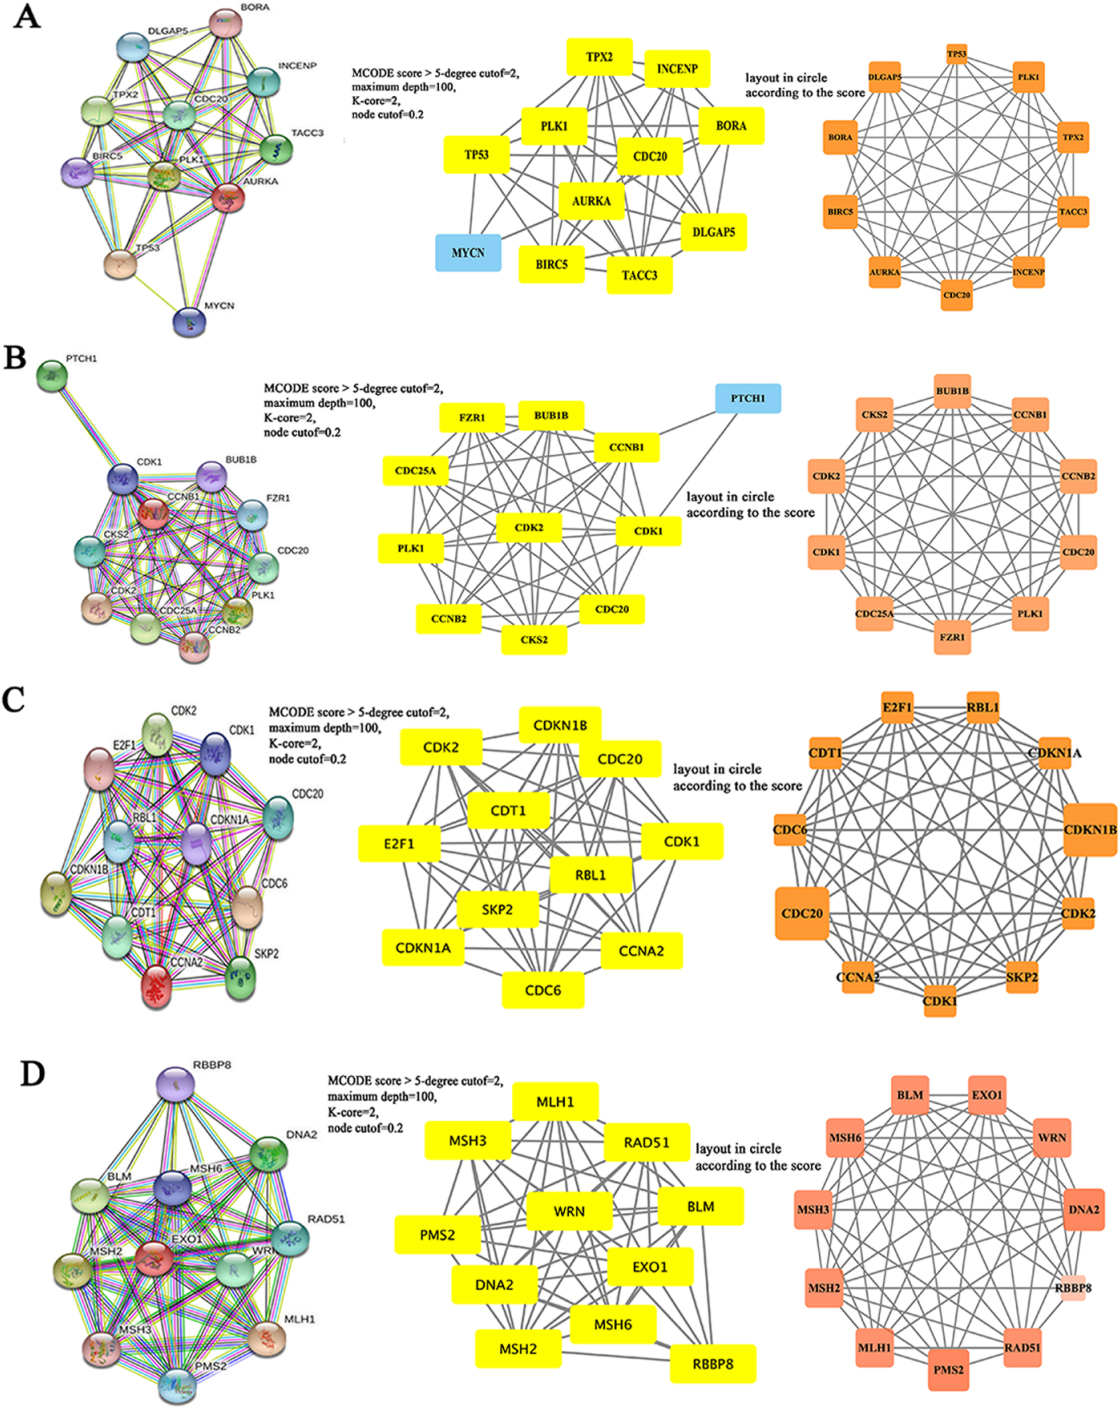
Figure 9.
The co-expression analysis of Hub genes. A–D, Linked Omics database was applied to analyzed the co-expressed genes of AURKA (A), CCNB1 (B), CCNA2 (C) and EXO1 (D). E, The correlations between Hub genes and their co-expressed genes were analyzed using Linked Omics database.
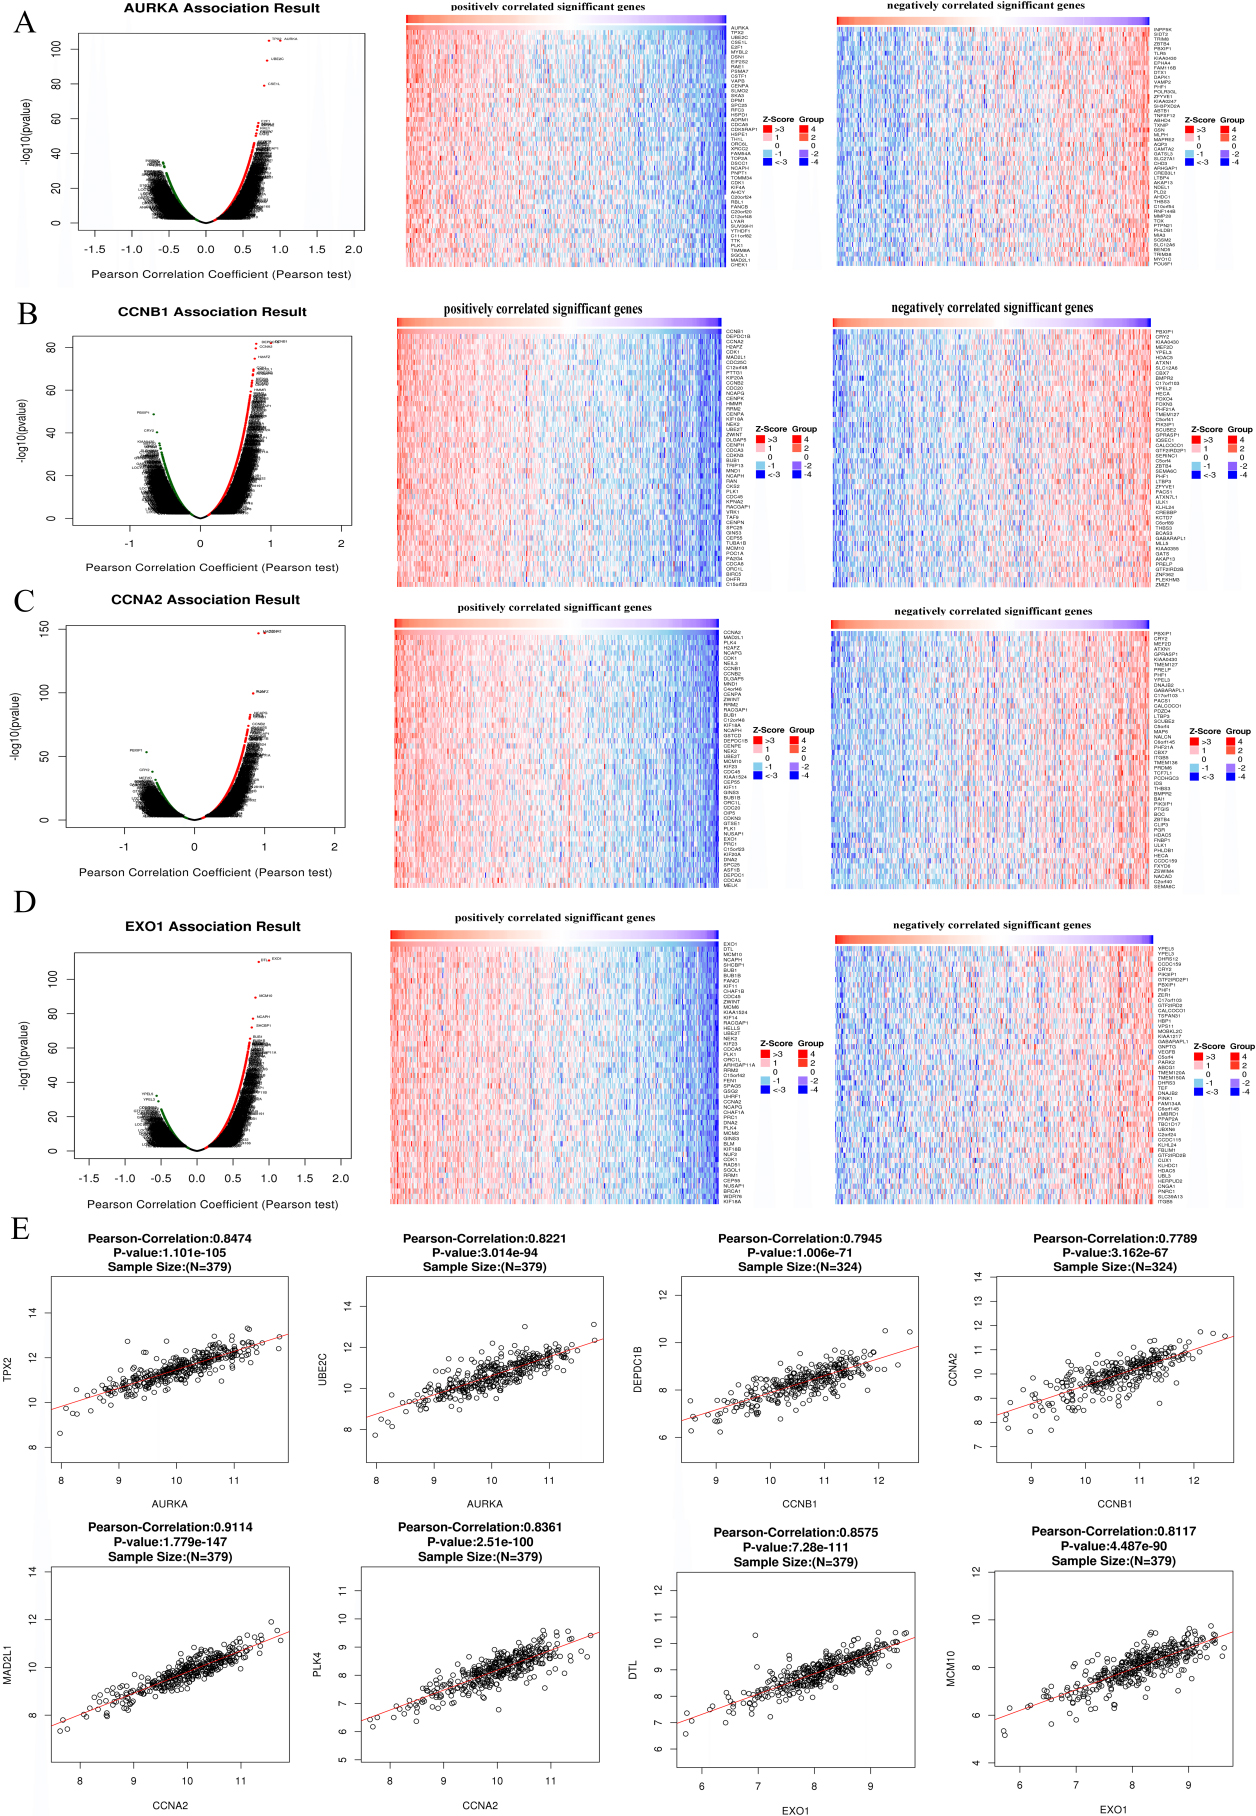
Figure 10.
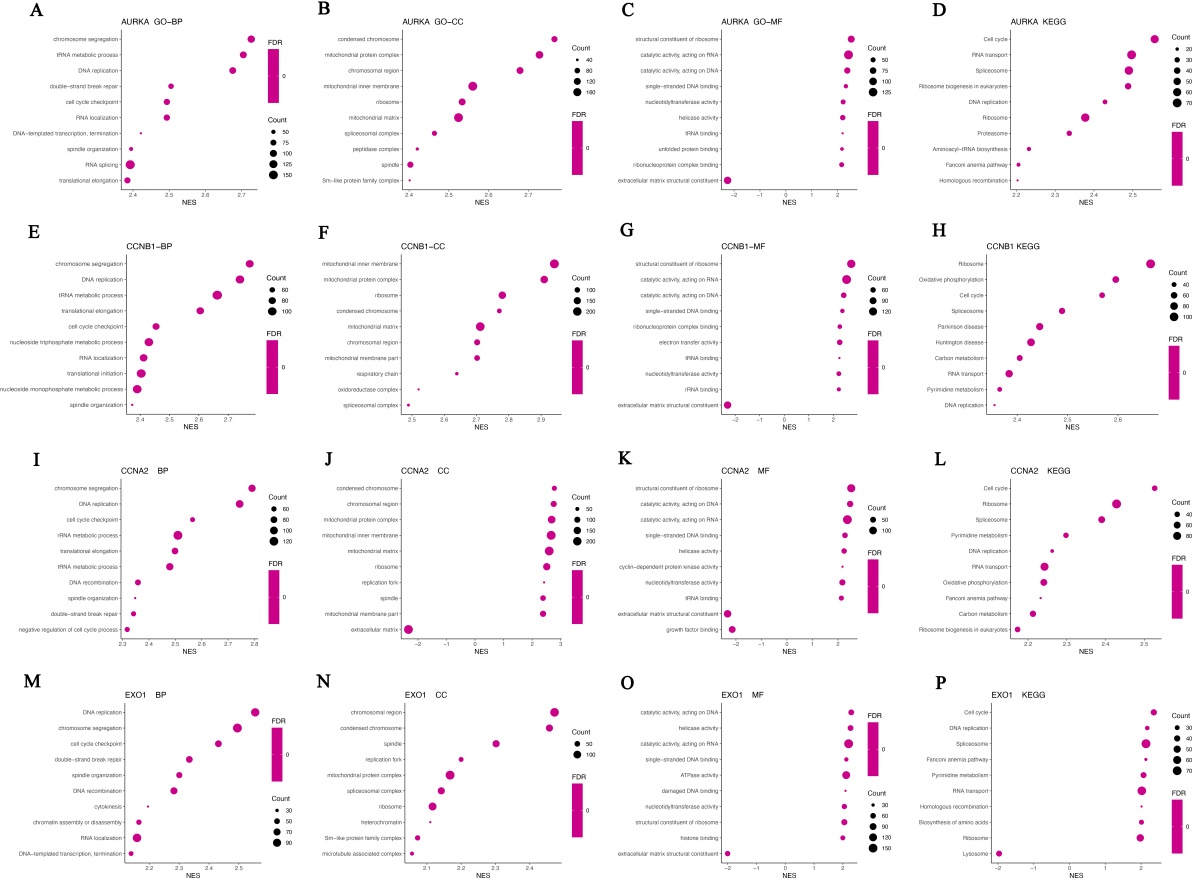
The biological functions and signal pathways of Hub genes and co-expressed genes. A–D, The biological process (A), cellular component (B), molecular function (C), and signal pathways (D) of AURKA and co-expressed genes were analyzed by GSEA analysis. E–H, The biological process (E), cellular component (F), molecular function (G), and signal pathways (H) of CCNB1 and co-expressed genes were analyzed by GSEA analysis. I–L, The biological process (I), cellular component (J), molecular function (K), and signal pathways (L) of CCNA2 and co-expressed genes were analyzed by GSEA analysis. M–P, The biological process (M), cellular component (N), molecular function (O), and signal pathways (P) of EXO1 and co-expressed genes were analyzed by GSEA analysis.
3.6Analysis of co-expression genes associated with the Hub genes
The mRNA sequences of 379 patients with TCGA-COAD were analyzed by the functional module method. The volcanic map showed that the number of genes with positive correlation with AURKA, CCNB1, CCNA2 and EXO1 was higher than that of negative correlation (Fig. 9A–D). The 50 important genes that were positively correlated and 50 genes that were negatively correlated with AURKA, CCNB1 and EXO1 were shown in Fig. 8A–D. AURKA was strong positive with TPX2 (Pearson correlation
3.7GSEA of the Hub genes and the co-expression genes
Furthermore, we analyzed the biological function of Hub genes and the co-expression genes by GSEA. AURKA co-expressed genes were mainly involved in the biological processing of chromosome segregation, DNA replication, cell cycle checkpoint and translational elongation, and associated with the cellular components including mitochondrial protein complex, mitochondrial inner membrane and ribosome (Fig. 10A and B). KEGG pathway analysis showed AURKA and co-expressed genes participated in Cell cycle, RNA transport and Ribosome biogenesis in eukaryotes (Fig. 10D). CCNB1, CCNA2 and their co-expressed genes were mainly involved in the biological processing of chromosome segregation, DNA replication and cell cycle checkpoint (Fig. 10E and I), and associated with cellular components including mitochondrial protein complex, mitochondrial inner membrane, mitochondrial matrix and ribosome (Fig. 10F and J). The molecular functions related to CCNB1 and CCNA2 included structural constituent of ribosome, catalytic activity-acting on DNA and RNA, extracellular matrix structural constituent, cyclin-dependent protein kinase activity (Fig. 10G and K). KEGG pathway analysis showed that CCNB1, CCNA2 and the co-expressed genes involved in cell cycle, ribosome, spliceosome, DNA replication and RNA transport (Fig. 10H and L). EXO1 and co-expressed genes were mainly located in chromosomal, mitochondrial and ribosome, and are mainly involved in physiological processes such as DNA replication, chromosome segregation, cell cycle checkpoint, DNA recombination, cytokinesis, chromatin assembly or disassembly, RNA localization and DNA-templated transcription, termination (Fig. 10M and N). The molecular functions of EXO1 and co-expressed genes include catalytic activity, acting on DNA and RNA, ATPase activity, nucleotidyltransferase activity and structural constituent of ribosome (Fig. 10O). KEGG path analysis shows that EXO1 and co-expressed genes participate in cell cycle pathways, DNA replication pathways, spliceosome pathways, RNA transport pathways, ribosome and lysosome pathways in CRC (Fig. 10P).
4.Discussion
CRC is gastrointestinal malignancy with a higher incident and mortality rate around the world. According to the International Agency for Research on Cancer (IARC) document, there are approximately 1.15 million new CRC cases and
In this study, we analyzed three datasets (GSE21510, GSE110224 and GSE74602) from the GEO database, and a total of 346 DEGs were identified, including 117 upregulated and 229 downregulated genes. KEGG pathway analysis showed that DEGs were primarily enriched in bile secretion. In addition to genetic and environmental factors, obesity and unhealthy lifestyle such as eating red meat, processed meat and high-fat diets can also increase the risk of CRC. In recent years, high-fat diets have been linked to increased levels of intestinal bile acids (BAs), which have been shown to promote intestinal cancer [33, 34]. The concentrations of deoxycholic acid (DCA), lithocholic acid (LCA) and ursodeoxycholic acid (UDCA) in the feces of CRC patients were higher than those in the healthy. DCA induces CRC by causing genomic instability, oxidative damage to DNA, damage to mitochondria and the endoplasmic reticulum, an increase in the micronucleus rate, and chromosome aneuploid mutation [35], and these damages further promoted the development of cancer cells [36]. DCA can induce cell proliferation or apoptosis through increasing the production of ROS and caspase family proteins, thereby improving the growth and progression of colon cancer cells [37].
Furthermore, four Hub genes were screened by integrated bioinformatic analyses. Through comprehensive expression analysis and survival analysis, AURKA, CCNB1, EXO1 and CCNA2 are key genes that may be associated with CRC. The expression of four Hub genes in CRC were significantly upregulated in CRC using TIMER 2.0, which was further validated in three GEO datasets (GSE21510, GSE110224 and GSE74602).
AURKA belongs to the family of serine/threonine kinases, whose activation is necessary for cell division processes. AURKA has been identified as a target gene for cancer treatment, and a small molecule that targets AURKA has been found [38]. Ozawa et al. showed that targeting AURKA could be a promising strategy for improving clinical outcomes in the treatment of gastrointestinal cancer [39]. Zhang et al. showed that MLN8237, an inhibitor of AURKA, efficiently reduced the proliferation and motility of pancreatic ductal adenocarcinoma cells [40]. Our results suggested that AURKA was high expressed in CRC patients. In addition, the mutation rate of AURKA in CRC patients was 5%, and the common mutation type was amplification in CRC. The AURKA gene existed at 36 mutations sites. and the mutation had no effect on overall survival time, but impacted the progression free survival time. Immune checkpoint therapy has demonstrated great clinical benefit in several cancer treatments in recent years [41]. The infiltration of macrophages into solid tumors was associated with poor survival outcomes, while the infiltration of CD8
Cell cycle dysregulation is one of the characteristics of CRC. Abnormal cell cycles could promote cell damage [42]. CCNB1 and CCNA2 are core regulatory proteins involved in mitosis and cell cycle [43]. Previous studies showed that CCNB1 was significantly correlated with the degree of tumor infiltration, aggressiveness, and adverse clinical outcome of patients with breast cancer and ovarian cancer [44]. CCNA2 is expressed in mammalian cells and is important for the onset of DNA replication (S phase) and mitosis by activating CDK2 and CDK1. Over-expression of cyclin A could be detected in cancers [45]. Our results determined that CCNB1 and CCNA2 were high expressed in CRC compared with normal tissue, and that CRC patients with high expression of CCNB1 and CCNA2 had a better prognosis. The mutations rates of CCNB1 and CCNA2 did not affect the overall survival and progression free survival time in patients with CRC. And the expression level of CCNB1 was correlation with B cells and CD8
EXO1 is an exonuclease associated with DNA mismatch repair (MMR), DNA double-strand break repair, nucleotide excision repair, and immunoglobulin maturation [46, 47]. High expression of EXO1 has been reported to be associated with poor prognosis for prostate and breast cancers [48, 49]. Our results supported that EXO1 was overexpressed in CRC. The patients with high expression of EXO1 had a better prognosis. The mutation rate of EXO1 in COAD patients was 1.4%, but the mutation had no effect on overall survival time and disease free time. The expression level of EXO1 was correlation with CD8
Cell cycle is comprised of four ordered phases, denoted G1 (Gap 1), S (DNA synthesis), G2 (Gap 2), and M (Mitosis) and contains multiple checkpoints throughout to ensure the faithful replication and segregation of chromosomes into daughter cells. Deregulation of the cell cycle is one of the mechanisms involved in the malignant phenotype of cancer, and regulating this pathway can be used as a therapeutic targeting strategy against cancer [50]. In our study, we performed GSEA to determine co-expressed genes of Hub genes. These co-expressed genes share a lot of similarities in the gene set enrichment analysis. Both of them had a close relationship with chromosome segregation, DNA replication, translational elongation and cell cycle checkpoint during the biological process. KEGG pathway analysis suggests that they are mainly involved in the Cell cycle pathways, DNA replication pathways, RNA transport pathways and Ribosome pathways. It suggested that Hub genes may participate in the pathological mechanism of CRC by affecting the physiological processes in the cell cycle.
Overall, Hub genes were associated with the prognosis of CRC patients, and gene mutations and immune infiltration were also involved in its effects. Previous studies have reported the significance of these Hub genes in CRC, and their value in prognosis [51, 52, 53]. Our study also demonstrated the importance of Hub genes, and further investigated the effects of gene mutation and immune infiltration in CRC. Besides, our research has some limitations. We did not verify the biological functions of Hub genes by in vivo and in vitro experiments. Meanwhile, the role of Hub genes in CRC also needs to be validated in large clinical cohorts.
5.Conclusion
Taken together, our study supported that AURKA, CCNB1, CCNA2 and EXO1 could be potential biomarkers for the prevention, diagnosis, and treatment of CRC. The high expression of AURKA, CCNB1, CCNA2 and EXO1 were associated with better prognosis, and this consequence was correlation with gene mutation and infiltration of immune cells.
Author contributions
Conception: Shan Li, Xuguang Sun.
Interpretation or analysis of data: Shan Li, Xuguang Sun, Ting Li, Binjie Xu, Yuyong Deng, Yanqing Shi.
Preparation of the manuscript: Shan Li.
Revision for important intellectual content: Xuguang Sun.
Supervision: Xuguang Sun.
Funding
National Natural Science Foundation of China (32360888).
Data availability statement
The data used to support the findings of this study are available from the corresponding author upon request.
Supplementary data
The supplementary files are available to download from http://dx.doi.org/10.3233/CBM-230113.
Acknowledgments
The data were extracted from the public databases, so no informed consent was required. A preprint has previously been published [54].
Conflict of interest
The authors declare that they have no known competing financial interests or personal relationships that could have appeared to influence the work reported in this paper.
References
[1] | I. Mármol, C. Sánchez-de-Diego, A. Pradilla Dieste, E. Cerrada and M.J. Rodriguez Yoldi, Colorectal carcinoma: A general overview and future perspectives in colorectal cancer, Int J Mol Sci 18: ((2017) ), 197. |
[2] | Y. Xi and P. Xu, Global colorectal cancer burden in 2020 and projections to 2040, Transl Oncol 14: ((2021) ), 101174. |
[3] | P. Favoriti, G. Carbone, M. Greco, F. Pirozzi, R.E. Pirozzi and F. Corcione, Worldwide burden of colorectal cancer: A review, Updates Surg 68: ((2016) ), 7–11. |
[4] | K. Simon, Colorectal cancer development and advances in screening, Clin Interv Aging 19: ((2016) ), 967–976. |
[5] | G. Buccafusca, I. Proserpio, A.C. Tralongo, S. Rametta Giuliano and P. Tralongo, Early colorectal cancer: Diagnosis, treatment and survivorship care, Crit Rev Oncol Hematol 136: ((2019) ), 20–30. |
[6] | H.H. Oh and Y.E. Joo, Novel biomarkers for the diagnosis and prognosis of colorectal cancer, Intest Res 18: ((2020) ), 168–183. |
[7] | R. Dienstmann and J. Tabernero, Spectrum of gene mutations in colorectal cancer: Implications for treatment, Cancer J 22: ((2016) ), 149–155. |
[8] | J. Bogaert and H. Prenen, Molecular genetics of colorectal cancer, Ann Gastroenterol 27: ((2014) ), 9–14. |
[9] | T. Armaghany, J.D. Wilson, Q. Chu and G. Mills, Genetic alterations in colorectal cancer, Gastrointest Cancer Res 5: ((2012) ), 19–27. |
[10] | R.L. Siegel, K.D. Miller, A. Goding Sauer, S.A. Fedewa, L.F. Butterly, J.C. Anderson, A. Cercek, R.A. Smith and A. Jemal, Colorectal cancer statistics, 2020, CA Cancer J Clin 70: ((2020) ), 145–164. |
[11] | J.C. Rotondo, C. Mazziotta, C. Lanzillotti, C. Stefani, G. Badiale, G. Campione, F. Martini and M. Tognon, The role of purinergic P2X7 receptor in inflammation and cancer: Novel molecular insights and clinical applications, Cancers (Basel) 14: ((2022) ), 1116. |
[12] | C. Bernardazzi, M.T.L. Castelo-Branco, B. Pê go, B.E. Ribeiro, S.L.B. Rosas, P.T. Santana, J.C. Machado, C. Leal, F. Thompson, R. Coutinho-Silva and H.S.P. de Souza, The P2X7 receptor promotes colorectal inflammation and tumorigenesis by modulating gut microbiota and the inflammasome, Int J Mol Sci 23: ((2022) ), 4616. |
[13] | P.M. Wilson, R.D. Ladner and H.J. Lenz, Predictive and prognostic markers in colorectal cancer, Gastrointest Cancer Res 1: ((2007) ), 237–246. |
[14] | E. Koncina, S. Haan, S. Rauh and E. Letellier, Prognostic and predictive molecular biomarkers for colorectal cancer: Updates and challenges, Cancers (Basel) 12: ((2020) ), 319. |
[15] | P. Ge, W. Wang, L. Li, G. Zhang, Z. Gao, Z. Tang, X. Dang and Y. Wu, Profiles of immune cell infiltration and immune-related genes in the tumor microenvironment of colorectal cancer, Biomed Pharmacother 118: ((2019) ), 109228. |
[16] | M.L. Pinto, E. Rios, C. Durães, R. Ribeiro, J.C. Machado, A. Mantovani, M.A. Barbosa, F. Carneiro and M.J. Oliveira, The two faces of tumor-associated macrophages and their clinical significance in colorectal cancer, Front Immunol 10: ((2019) ), 1875. |
[17] | A. Ling, S. Edin, M.L. Wikberg, Å. Öberg and R. Palmqvist, The intratumoural subsite and relation of CD8(+) and FOXP3(+) T lymphocytes in colorectal cancer provide important prognostic clues, Br J Cancer 110: ((2014) ), 2551–2559. |
[18] | V.S. Rao, S.K. Das, V.J. Rao and G. Srinubabu, Recent developments in life sciences research: Role of bioinformatics, African Journal of Biotechnology 7: ((2008) ), 495–503. |
[19] | Y. Wang and T. Zheng, Screening of hub genes and pathways in colorectal cancer with microarray technology, Pathol Oncol Res 20: ((2014) ), 611–618. |
[20] | S. Tsukamoto, T. Ishikawa, S. Iida, M. Ishiguro, K. Mogushi, H. Mizushima, H. Uetake, H. Tanaka and K. Sugihara, Clinical significance of osteoprotegerin expression in human colorectal cancer, Clin Cancer Res 17: ((2011) ), 2444–2450. |
[21] | E.I. Vlachavas, E. Pilalis, O. Papadodima, D. Koczan, S. Willis, S. Klippel, C. Cheng, L. Pan, C. Sachpekidis, A. Pintzas, V. Gregoriou, A. Dimitrakopoulou-Strauss and A. Chatziioannou, Radiogenomic Analysis of F-18-Fluorodeoxyglucose Positron Emission Tomography and Gene Expression Data Elucidates the Epidemiological Complexity of Colorectal Cancer Landscape, Comput Struct Biotechnol J 17: ((2019) ), 177–185. |
[22] | Y. Sui, S. Li, X.Q. Fu, Z.J. Zhao and S. Xing, Bioinformatics analyses of combined databases identify shared differentially expressed genes in cancer and autoimmune disease, J Transl Med 21: ((2023) ), 109. |
[23] | Y. Zhou, B. Zhou, L. Pache, M. Chang, A.H. Khodabakhshi, O. Tanaseichuk, C. Benner and S.K. Chanda, Metascape provides a biologist-oriented resource for the analysis of systems-level datasets, Nat Commun 10: ((2019) ), 1523. |
[24] | Y. Guan, F. Xu, Y. Wang, J. Tian, Z. Wan, Z. Wang and T. Chong, Identification of key genes and functions of circulating tumor cells in multiple cancers through bioinformatic analysis, BMC Med Genomics 13: ((2020) ), 140. |
[25] | D. Szklarczyk, A.L. Gable, K.C. Nastou, D. Lyon, R. Kirsch, S. Pyysalo, N.T. Doncheva, M. Legeay, T. Fang, P. Bork, L.J. Jensen and C. von Mering, The STRING database in 2021: Customizable protein-protein networks, and functional characterization of user-uploaded gene/measurement sets, Nucleic Acids Res 49: ((2021) ), D605–D612. |
[26] | C. Mazziotta, C.F. Cervellera, G. Badiale, I. Vitali, A. Touzé, M. Tognon, F. Martini and J.C. Rotondo, Distinct retinoic gene signatures discriminate Merkel cell polyomavirus-positive from -negative Merkel cell carcinoma cells, J Med Virol 95: ((2023) ), e28949. |
[27] | Z. Tang, C. Li, B. Kang, G. Gao, C. Li and Z. Zhang, GEPIA: A web server for cancer and normal gene expression profiling and interactive analyses, Nucleic Acids Res 45: ((2017) ), W98–W102. |
[28] | T. Li, J. Fan, B. Wang, N. Traugh, Q. Chen, J.S. Liu, B. Li and X.S. Liu, TIMER: A web server for comprehensive analysis of tumor-infiltrating immune cells, Cancer Res 77: ((2017) ), e108–e110. |
[29] | J. Gao, B.A. Aksoy, U. Dogrusoz, G. Dresdner, B. Gross, S.O. Sumer, Y. Sun, A. Jacobsen, R. Sinha, E. Larsson, E. Cerami, C. Sander and N. Schultz, Integrative analysis of complex cancer genomics and clinical profiles using the cBioPortal, Sci Signal 6: ((2013) ), pl1. |
[30] | S.V. Vasaikar, P. Straub, J. Wang and B. Zhang, LinkedOmics: Analyzing multi-omics data within and across 32 cancer types, Nucleic Acids Res 46: ((2018) ), D956–D963. |
[31] | H. Sung, J. Ferlay, R.L. Siegel, M. Laversanne, I. Soerjomataram, A. Jemal and F. Bray, Global Cancer Statistics 2020: GLOBOCAN Estimates of Incidence and Mortality Worldwide for 36 Cancers in 185 Countries, CA Cancer J Clin 71: ((2021) ), 209–249. |
[32] | H. Raskov, J.H. Søby, J. Troelsen, R.D. Bojesen and I. Gögenur, Driver gene mutations and epigenetics in colorectal cancer, Ann Surg 271: ((2020) ), 75–85. |
[33] | W. Jia, G. Xie and W. Jia, Bile acid-microbiota crosstalk in gastrointestinal inflammation and carcinogenesis, Nat Rev Gastroenterol Hepatol 15: ((2018) ), 111–128. |
[34] | B. Sanchez, Bile acid-microbiota crosstalk in gastrointestinal inflammation and carcinogenesis: A role for bifidobacteria and lactobacilli? Nat Rev Gastroenterol Hepatol 15: ((2018) ), 205. |
[35] | Y. Liu, S. Zhang, W. Zhou, D. Hu, H. Xu and G. Ji, Secondary bile acids and tumorigenesis in colorectal cancer, Front Oncol 12: ((2022) ), 813745. |
[36] | S. Peng, X. Huo, D. Rezaei, Q. Zhang, X. Zhang, C. Yu, K. Asanuma, E. Cheng, T.H. Pham, D.H. Wang, M. Chen, R.F. Souza and S.J. Spechler, In Barrett’s esophagus patients and Barrett’s cell lines, ursodeoxycholic acid increases antioxidant expression and prevents DNA damage by bile acids, Am J Physiol Gastrointest Liver Physiol 307: ((2014) ), G129–139. |
[37] | J. Ignacio Barrasa, N. Olmo, P. Perez-Ramos, A. Santiago-Gomez, E. Lecona, J. Turnay and M. Antonia Lizarbe, Deoxycholic and chenodeoxycholic bile acids induce apoptosis via oxidative stress in human colon adenocarcinoma cells, Apoptosis 16: ((2011) ), 1054–1067. |
[38] | R. Du, C. Huang, K. Liu, X. Li and Z. Dong, Targeting AURKA in Cancer: Molecular mechanisms and opportunities for Cancer therapy, Mol Cancer 20: ((2021) ), 15. |
[39] | H. Ozawa, H. Imazeki, Y. Ogiwara, H. Kawakubo, K. Fukuda, Y. Kitagawa and C. Kudo-Saito, Targeting AURKA in treatment of peritoneal tumor dissemination in gastrointestinal cancer, Transl Oncol 16: ((2022) ), 101307. |
[40] | Y. Zhang, Y. Ma, Y. Wang, D. Mukhopadhyay, Y. Bi and B. Ji, Aurora kinase a inhibitor MLN8237 suppresses pancreatic cancer growth, Pancreatology 22: ((2022) ), 619–625. |
[41] | Y. Yang, L. Ren, S. Li, X. Zheng, J. Liu, W. Li, W. Fu, J. Wang and G. Du, GABRP is a potential prognostic biomarker and correlated with immune infiltration and tumor microenvironment in pancreatic cancer, Transl Cancer Res 11: ((2022) ), 649–668. |
[42] | C.Y. Huang and L.C. Yu, Pathophysiological mechanisms of death resistance in colorectal carcinoma, World J Gastroenterol 21: ((2015) ), 11777–11792. |
[43] | B. Xie, S. Wang, N. Jiang and J.J. Li, Cyclin B1/CDK1-regulated mitochondrial bioenergetics in cell cycle progression and tumor resistance, Cancer Lett 443: ((2019) ), 56–66. |
[44] | F. Fei, J. Qu, K. Liu, C. Li, X. Wang, Y. Li and S. Zhang, The subcellular location of cyclin B1 and CDC25 associated with the formation of polyploid giant cancer cells and their clinicopathological significance, Lab Invest 99: ((2019) ), 483–498. |
[45] | C.H. Yam, T.K. Fung and R.Y. Poon, Cyclin A in cell cycle control and cancer, Cell Mol Life Sci 59: ((2002) ), 1317–1326. |
[46] | C.C. Chang, M.S. Hsieh, M.W. Lin, Y.H. Lee, Y.J. Hsiao, K.Y. Su, T.J. Su, S.L. Yu and J.S. Chen, Novel genetic prognostic signature for lung adenocarcinoma identified by differences in gene expression profiles of low- and high-grade histological subtypes, Biomolecules 12: ((2022) ), |
[47] | C.S. Zhou, M.T. Feng, X. Chen, Y. Gao, L. Chen, L.D. Li, D.H. Li and Y.Q. Cao, Exonuclease 1 (EXO1) is a potential prognostic biomarker and correlates with immune infiltrates in lung adenocarcinoma, Onco Targets Ther 14: ((2021) ), 1033–1048. |
[48] | F. Luo, Y.Z. Wang, D. Lin, J. Li and K. Yang, Exonuclease 1 expression is associated with clinical progression, metastasis, and survival prognosis of prostate cancer, J Cell Biochem 120: ((2019) ), 11383–11389. |
[49] | L. Qi, B. Zhou, J. Chen, W. Hu, R. Bai, C. Ye, X. Weng and S. Zheng, Significant prognostic values of differentially expressed-aberrantly methylated hub genes in breast cancer, J Cancer 10: ((2019) ), 6618–6634. |
[50] | K.L. Thu, I. Soria-Bretones, T.W. Mak and D.W. Cescon, Targeting the cell cycle in breast cancer: Towards the next phase, Cell Cycle 17: ((2018) ), 1871–1885. |
[51] | Y. Zhu, L. Sun, J. Yu, Y. Xiang, M. Shen, H.S. Wasan, S. Ruan and S. Qiu, Identification of biomarkers in colon cancer based on bioinformatic analysis, Transl Cancer Res 9: ((2020) ), 4879–4895. |
[52] | B. Zhao, Z. Wan, X. Zhang and Y. Zhao, Comprehensive analysis reveals a four-gene signature in colorectal cancer, Transl Cancer Res 9: ((2020) ), 1395–1405. |
[53] | J. Xi, H. Zhang, Y. Li, H. Su, X. Chen and X. Liang, Systematic analysis competing endogenous RNA coexpression network as a potentially prediction prognostic biomarker for colon adenocarcinoma, Medicine (Baltimore) 101: ((2022) ), e30681. |
[54] | X.S. Shan and T Li, Identification of hub genes and its relationship with colorectal cancer patient prognosis, PREPRINT (Version 1), (2022) . |


