
Increased Inhibition in Non-Primary Motor Areas of String-Instrument Players: A Preliminary Study with Paired-Pulse Transcranial Magnetic Stimulation
Abstract
Background: The muscle representations in non-primary motor area (NPMA) are located in the dorsal premotor area (PMd) and in the border region between the premotor area and the supplementary motor area (SMA).
Objective: We characterized the plasticity of intracortical inhibitory and excitatory circuits in muscle representations in primary motor cortex (M1) and in NPMA related to acquired fine motor skills. We compared local cortical inhibition and facilitation balance in M1 and in NPMA between control subjects (n = 6) and right-handed string-instrument players (n = 5).
Methods: Navigated transcranial magnetic stimulation (TMS) was used to compare motor thresholds (MTs), motor evoked potentials (MEPs), short-interval intracortical inhibition (SICI) and intracortical facilitation (ICF) in non-dominant hand muscle representations in M1 and NPMA.
Results: String-instrument players showed reduced SICI in M1 in the actively used left hand abductor digiti minimi (ADM) muscle representation at 3 ms inter-stimulus interval (ISI) with a conditioning stimulus (CS) intensity of 80% of MT and increased SICI in NPMA in ADM representation at 2 ms ISI and CS intensity of 50% of MT in comparison with controls. No differences between string-instrument players and controls were found for the SICI in the left hand opponens pollicis (OP) muscle representation, which is a muscle not intensively trained in string-instrument players.
Conclusions: These preliminary results indicate that the stronger inhibition in motor representations outside M1 in string-instrument players may be crucial when accurate movements of single muscles must be performed. In contrast, weaker inhibition in M1 in string-instrument players may benefit the performance of fast finger movements.
INTRODUCTION
The non-primary motor areas (NPMAs) anterior to primary motor cortex (M1) have representations of the upper limb muscles in both non-human primates and humans [1–6], but the role of these representationsoutside M1 is unclear. It has been claimed that an assessment of the integrity of corticospinal tract fibers originating from dorsolateral premotor cortex (PMd) may have some predictive value in the assessment of stroke recovery [7]. Even though the degree of motor recovery in stroke patients is most strongly correlated to the integrity of corticospinal tract fibers originating from M1, a higher integrity of corticospinal tract fibers from PMd also predicts a better recovery (7). Furthermore, it has been reported that motoneurons in NPMAs are recruited when individuals are learning skills requiring fine motor control [8].
Navigated TMS is a technique that enables exploration of the motor representations in M1 and NPMA separately. Previously, we have stimulated M1 and NPMAs in healthy subjects and mapped cortical muscle representations [3, 9]. In addition to M1, muscle responses could be evoked by stimulations of the PMd and border region between the PMd and the supplementary motor area (SMA) without any simultaneous activation of M1 [3, 9].
Intracortical inhibition and facilitation in the motor representations can be studied by paired-pulse TMS with different inter-stimulus intervals (ISIs) [10, 11]. In paired-pulse TMS, a subthreshold conditioning stimulus (CS) precedes the suprathreshold test stimulus (TS). Inter-stimulus intervals shorter than 6 ms produce short-interval intracortical inhibition (SICI), which can be seen as a decrease in MEP amplitudes when compared to single-pulse stimulation alone. Intracortical facilitation (ICF) is most pronounced with ISI values longer than 7 ms and can be detected as an increase in the MEP amplitude [10–12]. In our previous study, SICI and ICF were observed in motor representations in M1 and in NPMA. We noted that SICI at 2 ms ISI measured in the NPMA representation of opponens pollicis (OP) muscle was slightly weaker than inM1 [9].
The aim of the current study was to compare SICI and ICF in the intrinsic hand muscle representations in M1 and in NPMA (corresponding mainly to PMd) in a cohort of 5 string-instrument players with a control group of participants not actively playing any musical instrument. In our previous study, the overall size of the cortical representation of the actively used hand muscle was smaller in string-instrument players than in controls and also in comparison to the representation area of less actively used hand in the contralateral hemisphere [13]. We also hoped to clarify the role of NPMA motor representations in the control of skilled finger movements in subjects with long traininghistories.
MATERIAL AND METHODS
Subjects
We tested 5 string-instrument players (4 female violin players, 1 male guitar player, age 23.8 ± 2.2 years) and 6 control subjects (3 female, 3 male, age 24.3 ± 3.7 years) who had all participated also in our former studies [3, 9, 13]. The control group was a mixed group of figure skaters and non-trained healthy subjects. Handedness and footedness were determined according to the revised and reduced form of the Waterloo questionnaire [14]. One control subject was left-handed, all of the other participants were right-handed. In the string-instrument players, the duration of active practice varied between 14–21 years (mean 16.6 ± 2.1 years). Four of the string-instrument players (subjects 1, 2, 4, 5) had completed national basic level examinations (levels 1/3–3/3). Three of them had also passed higher examinations: subject 2 - the music institute level (level D), subject 1 - the secondlevel in music conservatory (level B) and subject 4 - the highest level in music conservatory (level A) (examination criteria: www.musicedu.fi; www.siba.fi). Subject 3 played regularly but had not completed any national examinations. None of the instrument players had practiced on the day of examination. The control subjects did not play any instrument but four of them had a long training history as figure skaters. In the figure skaters, the duration of practice had varied between 14–18 years (mean 16 ± 1.8 years). All of the figure skaters had ended regular practicing by the time of the study. The time between active practicing and the current study varied between 3–8 years (mean 4.5 ± 2.4 years). All of the figure skaters had competed at the national junior level and one also at the national senior level. All had demonstrated the skill requirements for competing in international junior competitions as described in the rules of the International Skating Union (www.ISU.org). Figure skaters were accepted as a control group since in figure skating,skillful motor sequences are not performed with intrinsic hand muscles, instead the upper limb movements consist of alignment of arms, extension/flexion movements of arms, wrist and fingers when performing jumps and choreographed arm and hand movements to the accompaniment of music [15].
All subjects were informed about the experiments and written consents were collected. The study was conducted in compliance with the Declaration of Helsinki and approved by the Ethics Committee of the Hospital District of Northern Savo (Kuopio, Finland).
Transcranial magnetic stimulation
We used navigated TMS (eXimia NBS, Nexstim Plc., Helsinki, Finland) for the stimulations. Navigated TMS combines traditional TMS and neuronavigation [16] and makes it possible to achieve an accurate stimulation of separate brain regions while having a continuous electric field display [17]. The most probable stimulation area in the cortex is that area where the induced electric field is strongest [18–20]. The computational electric field is calculated using the spherical model which is matched to individual MRIs [21, 22]. The computed electric field does account for the head and brain anatomy, stimulation intensity and coil parameters (3D position and orientation of the coil, shape of copper wiring in the coil) in each stimulated position but does not take into consideration differences in material conductivity [23]. After the determination of the resting motor threshold (RMT) and the corresponding electric field value (V/m) in the target motor region, the remote cortical regions can be stimulated at an intensity which is adjusted so that the induced electric field in the target region remains below a pre-determined RMT value [3, 9, 23]. Individual three-dimensional T1-weighted MR images (Siemens Avanto 1.5 T, Erlangen, Germany) were used for navigational purposes. A 3D surface MRI, peeled to 25 mm of depth from the scalp was used as the cortical mapping surface. At this depth, both sulci and gyri are easily identified [24]. Single and paired monophasic TMS pulses were delivered with a Magstim BiStim stimulator (Magstim Company Ltd., Whitland, Wales, UK) via a figure-of-eight-shaped 70-mm coil.
Optimal cortical representations of OP muscle were mapped and RMT values determined from the non-dominant M1 and NPMA in each subject. The non-dominant hemisphere was selected because in our previous study, right-handed string-instrument players displayed a significantly smaller representation area for the actively used left hand muscle in the non-dominant right hemisphere when compared to controls [13]. Suprathreshold MEPs, SICI and ICF were measured from OP and abductor digiti minimi muscles (ADM). These two muscles were selected because the non-dominant ADM is one of the most actively used muscles by string-instrument players whereas the OP muscle is less extensively used [25]. In the thenar musculature, the OP and abductor pollicis brevis (APB) muscles are imbricated which means that the MEP is a mixture of activation of these adjacent muscles. Although, it is a mixed response from these two muscles which is recorded, we will use the name OP because the position of the active electrode was medial to the first metacarpal bone above the OP muscle [9]. Since the cortical representations of the intrinsic hand muscles overlap widely [26], and MT values should not be affected by the magnitude of practice [27], the optimal target and MT for OP were determined and used also in the ADM single- and paired-pulse -measurements. Furthermore, SICI and ICF are very similar in different hand muscle representations [28]. Disposable surface electrodes (circular, diameter 9 mm, Ag-AgCl) were placed on the skin above the bellies of the OP and ADM muscles with the reference electrode positioned on the skin above the 1st metacarpophalangeal joint (OP) and above the 5th metacarpophalangeal joint (ADM). Muscle activity was monitored on-line and recorded by continuous electromyography (ME 6000, Mega Electronics Ltd., Kuopio, Finland). MEPs without preceding muscle activity (no motor unit potentials in the 50 ms preceding stimulations) were included in the analyses, peak-to-peak amplitudes were measured for all detected MEPs and latencies for single-pulse MEPs.
The location of the optimal representation of OP was sought from precentral gyrus corresponding anatomically to M1. Stimulations were delivered to the posterior part of the precentral gyrus with the coil being positioned perpendicular to the central sulcus and to the posterior-anterior direction of induced current (distance between adjacent stimulations 2 mm, time between stimulations 5 s). The stimulation location producing the highest MEP was selected to be the optimal target. The optimal coil orientation was determined by rotating the coil at 45° intervals around the optimal target. The coil orientation evoking the highest MEPs was selected and employed during these experiments. RMT was measured for the final target and defined as the minimum stimulation intensity (per cent of maximal stimulator output) and the corresponding electric field value (V/m) producing at least 5 MEPs (≥50 μV) out of 10 stimulations [29]. After determining the RMT, 10 suprathreshold (120% RMT) single-pulse MEPs were recorded.
In the determination of the optimal OP target in NPMAs, the cortical areas anterior to M1 were stimulated. The mapped areas included superior and middle frontal gyrus corresponding functionally to PMd and SMA [5, 30, 31]. Based on probability maps of cytoarchitectural subdivisions, the mapped areas corresponded to Brodmann areas (BA) 6 and 8 [30, 32]. Stimulations were delivered to precentral sulcus, superior frontal gyrus and sulci between superior and middle frontal gyrus with the coil orientationperpendicular to sulci. The location producing the highest MEP without simultaneous activation of M1 (electric field value in M1 below the RMT in M1) was selected as the optimal target. MT was measured and 10 single-pulse MEPs (120% RMT) were recorded as in M1.
SICI and ICF were measured in the optimal targets separately in both M1 and in NPMA. In the first paired-pulse TMS examination, four different ISIs were used (2, 3, 10 and 15 ms) while the CS and test-pulse intensities were kept constant (CS 80% and test-pulse 120% of local RMT intensity).Thereafter, the CS intensity was varied (30%, 50%, 70% and 90% of the local RMT intensity) but the ISI and test-pulse intensity were maintained at 2 ms (ISI) and 120% of RMT (test-pulse). Ten trials were performed for each ISI and CS intensity pair (inter-trial interval ≥5 s). In order keep stimulation sessions short, we did not examine the effect of CS intensity on the ICF.
Analyses
In the analyses, the highest and the lowest MEP values were excluded from each of the 10 stimulation trials and the mean MEP amplitudes were calculated from the remaining eight MEPs. Mean MEP latencies were calculated similarly from eight single-pulse MEPs. All of the MEPs which could be distinguished from the baseline were included in the analyses, even in cases when the peak-to-peak amplitude was lower than 50 μV. In the case of very low (typically ≤20 μV) responses, the amplitude was set to 0 μV. The amplitudes of paired-pulse MEP were normalized to single-pulse MEP amplitudes. The distances between coil locations and locations of maximal electric fields of optimal targets in M1 and in NPMA were measured as Euclidean distances.
Statistical analyses
Electrophysiological properties (RMT, amplitudes of single-pulse and paired-pulse MEPs, latencies of single-pulse MEPs) of M1 and NPMA were compared with each other in both groups and we also performed a between-group comparison. In addition, we compared mean single-pulse MEP amplitudes and latencies recorded from OP and ADM muscles.
Nonparametric statistical tests were used because the data was not normally distributed. The results are presented as mean ± S.D. RMTs, single- and paired-pulse MEP amplitudes were compared between M1 and NPMA by using the Wilcoxon signed ranks test. Mann-Whitney U test was used for the comparison between the groups. All the statistical tests were performed with SPSS 19 (SPSS Inc., Chicago, IL).
RESULTS
Locations of M1 and NPMA muscle representation areas
The TMS image data of one string-instrument player was lost because of a technical failure and it could not be recovered for these analyses. Optimal OP targets in M1 were located in the vicinity of the hand knob in the posterior part of the precentral gyrus and the optimal targets in NPMA in the vicinity of sulcus between middle and superior frontal gyri as described in our previous study [9]. The locations of optimal targets in NPMA correspond to BA 6 and to the border region of BA 6 and BA 8 and in functional terms to PMd and border region between PMd and SMA. MEPs could not be evoked by the stimulations of most medial part of superior frontal gyrus which belongs functionally to SMA. However, since the direction of current was towards the interhemispheric fissure, the activation of neurons in SMAs cannot be totally excluded [4, 5, 30, 33–37] The correspondence to functional areas cannot be exactly defined because the functional areas are not strictly bound by the anatomical landmarks. The distance between optimal targets in M1 and in NPMA was 26.6 ± 2.6 mm in string-instrument players (4 subjects) and 32.5 ± 7.5 mm in control subjects when this was defined as distances between coil locations. When estimated as distances between locations of maximal electric fields, the distances were 32.2 ± 3.7 mm in string-instrument players (4 subjects) and 33.3 ± 4.8 mm in controlsubjects (Fig. 1).
Resting motor threshold
The RMT was higher in NPMA than in M1 in string-instrument players (49 ± 6 % versus 39 ± 5 %, p = 0.042) as well as in control subjects (44 ± 6 % versus 36 ± 5 %, p = 0.027). There were no statistically significant differences detected between the groups.
Single-pulse MEPs
Mean single-pulse MEP amplitudes of OP and ADM muscles did not differ between the groups or within the groups in either area. In the control group, OP MEP amplitudes were higher in NPMA than in M1 (1167 ± 867 μV vs. 951 ± 956 μV, p = 0.046). The ADM MEP amplitudes did not differ between the representation areas (322 ± 200 μV in NPMA vs. 397 ± 252 μV in M1, p > 0.05). In string-instrument players, MEP amplitudes did not differ between the representation areas (OP MEP amplitudes: 1241 ± 682 μV in NPMA vs. 891 ± 648 μV in M1, p > 0.05; ADM MEP amplitudes: 692 ± 852 μV in NPMA vs. 905 ± 980 μV in M1, p > 0.05). The mean single-pulse MEP latencies of OP and ADM muscles after stimulations of M1 were 22.34 ± 1.53 ms (OP) and 22.26 ± 1.33 ms (ADM) in control group; and respectively 22.39 ± 1.11 ms (OP) and 22.32 ± 0.87 ms (ADM) in string-instrument players. The corresponding latencies after stimulations of NPMA were 21.58 ± 1.66 (OP) and 21.82 ± 1.40 (ADM) in control group; and 21.98 ± 1.10 (OP) and 22.08 ± 1.43 (ADM) in string-instrument players. There were no significant differences between the groups in MEP latencies in either area (p > 0.792), but in the control group, the MEP latencies stimulated from NPMA were significantly shorter than those of the M1 in OP muscle (0 = 0.028). In the string-instrument player group, no significant differences were observed in MEP latencies.
Short-interval intracortical inhibition and Intracortical facilitation
The normalized paired-pulse MEP amplitudes are presented in Tables 1 and 2.
Differences between the string-instrument players and the control group
In string-instrument players, SICI was weaker in M1 with 3 ms ISI producing a less marked decrease in ADM amplitudes when these were compared to the corresponding values in control subjects (p = 0.028) (Fig. 2). In contrast, in NPMA, string-instrument players displayed increased SICI with 50% of RMT CS intensity (ISI 2 ms) producing a greater decrease in ADM amplitudes (p = 0.045) (Fig. 2). No other significant differences were observed between the groups in SICI and ICF.
Differences within the groups
When SICI and ICF were compared between M1 and NPMA within the groups, string-instrument players showed stronger ICF of ADM responses in M1, inducing a greater increase in ADM amplitudes, with 10 ms ISI (p = 0.043), and the stronger SICI of ADM responses in NPMA with 30% CS intensity (p = 0.043). In the control subjects, the ICF was stronger in ADM responses, in M1 with 15 ms ISI (p = 0.046) and SICI in ADM responses was weaker in NPMA with 3 ms ISI (p = 0.046). When SICI and ICF were compared between the ADM and OP muscles within the groups, control subjects showed stronger ICF of ADM responses in M1 with 15 ms ISI (p = 0.046).
DISCUSSION
We found that local inhibition (SICI) was increased in the non-primary motor area (NPMA) cortical representation of left ADM muscle in the string-instrument players which is a muscle actively used by right-handed string-instrument players. In M1, the effect was opposite, SICI was reduced in the string-instrument players. These results may indicate that cortical control of an actively used muscle is more effectively focused on the primary motor representation in M1 in fine motor skill specialists. The weaker inhibition in M1 in actively used hand muscle representation in string-instrument players may be interpreted as an increased readiness to recruit a local motoneuron population.
TMS studies have shown that during the initial phase of learning a new fine motor skill, SICI decreases, MEP amplitudes increase and motor representations enlarge, i.e. phenomena which represent increased activation of synapses and deactivation of silent synapses [38–41]. Continuing practice leads to the formation of new synapses [42, 43] and axonal sprouting [44]. In musicians, the synaptic plasticity is enhanced and cortical excitability is regulated more stringently than in non-musicians [45]. This more effective regulation of cortical excitability is seen as a steeper input-output curve of MEP amplitudes and a steeper SICI curve [45]. These findings can be interpreted as a higher capability to recruit fast volitional movements and a greater capability to prevent the unwanted spread of activation, both of which lead to more focused cortical activation.
In our previous report, more focused functional ADM muscle representations were also demonstrated in string-instrument players than in controls [13] even though earlier studies have reported also contrasting results [27, 46, 47]. Structural evaluations have demonstrated both decreased and increased grey matter density in highly active sensorimotor cortices in musicians [48, 49]. The conflicting results may reflect the different roles of the studied muscles in the trained skill as well as differences in the degree of co-activation with adjacent muscles. Spatially wider motor representations and the greater overlap of proximal and distal muscles are both related to skills demanding synchronous activation of different muscles [50–52] and more focused cortical activation may be associated with skills demanding accurate single-muscle movements. A more focused cortical activation in musicians has also been reported in fMRI studies [53, 54]. Even though increased activity in SMA and especially in caudal PMd, has been related to the learning phase of a fine motor skill, no evidence has been found for any higher activity of these areas in well-learned skill performance [53]. This may be because there is less need for preparation of movement sequences, error detection and correction; it is especially these types of activities which are processed in PMA and SMA [31, 55, 56]. In fMRI studies, the increased activity of any neurons is seen as an increase in the BOLD signal and it cannot separate activity of motoneurons from other cortical neurons. The SMA proper and posterior parts of PMA are connected strongly to M1 and the majority of neurons in these areas are responsible for the preparation and correction of movement sequences via M1 motoneurons [5]. Thus, more focused cortical activation in fMRI studies and the shift of activation towards M1 in learned skill performance cannot be unequivocally interpreted as more focused muscle representations i.e. activation of more focused motoneuron population but may be evidence of a reduction of PMA and SMA activation because of a diminished need to concentrate on preparation and timing of the movements. In the present study, the stronger SICI in the representation of the actively used hand muscle in NPMA of string-instrument players suggests that also the direct cortical control of voluntary movements has been shifted towards M1.
The sensory input (vibration) to the actively used hand muscle has been demonstrated to decrease SICI in multiple intrinsic hand muscles in musicians whereas in non-musicians this reduction in SICI was seen only in the vibrated muscle [57]. The representations in NPMAs have projections from somatosensory associative cortices (BA 5) but do not possess direct connections from S1 [58, 59]. The strong connections between S1 and M1 and the importance of sensorimotor organization in professional musicians could potentially explain the importance of motor control from M1 representations.
Based on stroke studies, the representation areas in NPMAs anterior to M1 may be relevant in the recovery from an M1 lesion, even though the best motor recovery is related to increased activation of M1. Previous studies have revealed a shift in the motor representations anterior to M1 in the affected hemisphere of stroke patients [60]. A positive correlation has been observed in stroke patients between the integrity of corticospinal tract fibers originating from M1 and PMd and grip strength pointing to an important role of PMd representations in stroke recovery [7]. In particular, those patients with poor recovery displayed increased activation in NPMAs when performing paretic hand movements [61–63]. These studies indicate that in severe M1 damage and intense motor impairment, the recruitment of motoneurons from NPMAs might be beneficial even if recovery will not be as complete as in patients in whom activation is being restored towards M1. Therefore, the role of NPMA representations is more likely to be compensatory for M1 in making rough limb movements while M1 representations are necessary in performing fine motor movements.
There were no significant differences in SICI and ICF between OP and ADM muscles in string-instrument players although ADM is more actively used. We could have expected a similar difference in inhibition between the muscles than between the inhibition in ADM representations in string-instrument players and controls. Although RMT should not be affected by long-term practice of fine motor skills [27], OP and ADM muscles may have a slightly different threshold which could have some effect on results. We determined RMT only for OP muscle and used CS and TS intensities proportional to OP RMT intensity.
Because of the small sample size, the results should be viewed as preliminary and interpretations discussed with caution. The results will need to be confirmed in future studies. The cortical excitability should also be studied between the hemispheres to confirm that the active use of left hand muscles in right-handed string-instrument players is related to altered cortical excitability. One confounding factor is the heterogeneity of subjects in the control group. One of the subjects was left-handed, all other subjects right-handed. Previous studies have shown heterogeneous results when cortical excitability has been compared between left- and right-handed subjects. Differences in SICI and ICF were found in the study of Civardi et al. showing stronger SICI and weaker ICF in both hemispheres in right- handed subjects when compared to their left-handed counterparts [64]. However, Bäumer et al. did not detect any differences in the values of SICI and ICF between left- and right-handed subjects [65]. Furthermore, no differences were observed between left- and right-handed subjects in SICI between dominant- and non-dominant hemispheres with classical paired-pulse protocol in the study of Ilic et al. [66]. Since there is no clear evidence about the dependency of handedness in SICI and ICF and the non-dominant hemisphere was stimulated in all subjects, it is unlikely that the single left-handed subject in a group of six controls would skew the results substantially, however the effect of handedness may not be totally ruled out. In addition, four of the subjects in the control group had a long practice history as figure skaters. Although a figure skater does not perform any complex motor sequences with the small hand muscles, the learning-related plasticity in other motor representations may exert some effect on SICI and ICF in the primary and secondary hand motor representations.
One further limitation in interpreting the results is the separation of muscle representations in NPMA and in M1. The electric field value remained below RMT in M1 when the optimal target in NPMA was stimulated with local RMT intensity. When the optimal target in NPMA was stimulated at 120% of local RMT intensity, the electric field value exceeded the MT value in M1 in some subjects. Since the optimal direction of the current differed between M1 and NPMA (from the lateral to the medial direction in NPMA and from the posterior to the anterior direction in M1), it seems improbable that there was any considerable activation of motoneurons in M1 when NPMA was stimulated. However, we cannot totally exclude the possibility of activation of motoneurons in M1 or in cortical area between the optimal targets in M1 and NPMA, especially when NPMA was stimulated with 120% RMT intensity. The only way to exclude the activation of M1 would have been to stimulate the optimal target in M1 with an identical electric field value as used in the induction of M1 when NPMA was stimulated with 120% RMT intensity and with the same direction of current that was used in NPMA. Therefore, it is possible that in our results, the MEPs, SICI and ICF have been affected by mild activation of M1 motoneurons when stimulating NPMA with 120% RMT intensity.
It is not possible to define the exact functional area in the NPMAs producing muscle responses because there are not any anatomical landmarks which would separate PMd from SMA. The PMd and SMA are functionally distinct motor areas anterior to M1 [5, 67]. Both areas are located in BA 6. Pre-SMA (the more frontal part of SMA) is located in BA 8. There are no clear anatomical landmarks with which these functionally distinct areas, PMd and SMA, can be separated. Based on the probabilistic maps of Geyer et al., the cytoarchitectural border between BA 6 and BA 8 is frontally in the level of anterior commissure [30]. SMA is located more medially (near to the interhemispheric fissure) than PMd. It is most probable that the MEPs evoked by the stimulations of sulcus between middle and superior frontal gyrus were produced from PMd. Since the current was directed towards thesuperior frontal gyrus, we cannot rule out the possibility of motoneuron activation in SMA. If TMS pulses activated motor representations in PMd and SMA, then the results may be affected by differences in the cortical excitability balances between these areas.
It appears unlikely that M1 motoneurons had been activated polysynaptically via connections from NPMA to M1 because the latencies were similar after stimulations of M1 and NPMA to ADM muscles in both groups and to the OP muscle in the string-instrument players. Even though the stimulus locations in NPMAs most probably are independent muscle representations, the possibility for separate clusters of primary representations cannot be excluded. This would mean that the primary muscle representations would extend anterior to the precentral gyrus. In monkeys, novel neural connections and functionally active synapses were observed from higher visual centers to the intraparietal cortex after tool-use training which demanded visual and somatosensory information processing [44]. Thus, one could speculate that the motoneurons in NPMAs are part of the primary representation and can be activated by TMS, even if recruited to use only after damage to the M1 representations. According to both the cytoarchitectural and functional classifications of the cortex, the primary motor cortex with giant pyramidal cells in cortical layer V is located in the posterior part of the precentral gyrus and areas anterior to this region with their own distinctive cytoarchitectural structures and characteristic functions are considered to be the premotor and supplementary motor areas (BA 6 and BA 8). Therefore it is perhaps more accurate to presume that the motoneurons/muscle representations originating in PMA and SMA are distinct from the primary representation in M1. The study of Schulz et al. also demonstrated that corticospinal tract fibers originating from different parts of NPMA exerted different effects on stroke recovery. The integrity of fibers originating from SMA did not exhibit any positive correlation with stroke recovery similar to those fibers originating from M1 and PMd, indicating that they have differing activities or functions [7].
The latencies were even faster to the OP muscle and OP MEP amplitudes were higher after stimulations of NPMA than to M1 in the control group. Since the MT was higher in NPMA, the higher amplitudes and faster MEP latencies most probably reflect the activation of a sparse but widely spread motoneuron population in NPMA. This finding is in line with our previous study [9].
Since the threshold to activate cortical interneurons may differ from the RMT, it is possible that the higher absolute stimulation intensities in NPMAs may have activated local inhibitory interneurons more effectively, thus producing stronger SICI in NPMA [68, 69]. This may explain, at least in part, the differences in SICI between M1 and NPMA within the groups at low CS intensities. Nevertheless this would not account for the differences in SICI between the groups.
In conclusion, the current study provides preliminary evidence for the need for more effective inhibition of motor representations of actively used hand muscles in NPMAs in string-instrument players. This may be beneficial in the prevention of any unnecessary spread of cortical activation when finely-controlled single muscle movements must be performed rapidly. Weaker SICI in string-instrument players in M1 in the actively used hand muscle representation may enable fast recruitment of M1 motoneurons when needed.
CONFLICTS OF INTEREST
Karhu J. is affiliated part-time as the Medical Advisor of Nexstim Plc. Vaalto S. and Julkunen P. have received unrelated consulting compensation from Nexstim Plc, the manufacturer of the navigated TMS devices. Könönen M., Määttä S. and Säisänen L. do not have financial interests or potential conflicts of interest.
ACKNOWLEDGMENTS
We thank our subjects for participating in the study. Many thanks to the personnel of the Unit of Clinical Neurophysiology of Kuopio University Hospital, the Department of Clinical Neurophysiology and BioMag Laboratory of Helsinki University Central Hospital and Aalto University for their support. We also thank TEKES (Finnish Funding Agency for Technology and Innovation) for financing the work of Vaalto S. and Säisänen L. (grant number 741/05), Kuopio University Hospital for financing the examinations of the subjects and Emil Aaltonen Foundation for financing the work of Vaalto S.
REFERENCES
[1] | Dum RP , Strick PL . Spinal cord terminations of the medial wall motor areas in macaque monkeys. J Neurosci. (1996) ;16: (20):6513–6525. |
[2] | Dum RP , Strick PL . Frontal lobe inputs to the digit representations of the motor areas on the lateral surface of the hemisphere. J Neurosci. (2005) ;25: (6):1375–1386. |
[3] | Teitti S , Määttä S , Säisänen L , Könönen M , Vanninen R , Hannula H , Mervaala E , Karhu J . Non-primary motor areas in the human frontal lobe are connected directly to hand muscles. Neuroimage. (2008) ;40: (3):1243–1250. |
[4] | Fink GR , Frackowiak RS , Pietrzyk U , Passingham RE . Multiple nonprimary motor areas in the human cortex. J Neurophysiol. (1997) ;77: (4):2164–2174. |
[5] | Johansen-Berg H , Behrens TE , Robson MD , Drobnjak I , Rushworth MF , Brady JM , Smith SM , Higham DJ , Matthews PM . Changes in connectivity profiles define functionally distinct regions in human medial frontal cortex. Proc Natl Acad Sci U S A. (2004) ;101: (36):13335–13340. |
[6] | Seo JP , Jang SH . Different Characteristics of the Corticospinal Tract According to the Cerebral Origin: DTI Study. AJNR Am J Neuroradiol.(2013) . |
[7] | Schulz R , Park CH , Boudrias MH , Gerloff C , Hummel FC , Ward NS . Assessing the integrity of corticospinal pathways from primary and secondary cortical motor areas after stroke. Stroke. (2012) ;43: (8):2248–2251. |
[8] | Kim DE , Shin MJ , Lee KM , Chu K , Woo SH , Kim YR , Song EC , Lee JW , Park SH , Roh JK . Musical training-induced functional reorganization of the adult brain: Functional magnetic resonance imaging and transcranial magnetic stimulation study on amateur string players. Hum Brain Ma. (2004) ;23: (4):188–199. |
[9] | Vaalto S , Säisänen L , Könönen M , Julkunen P , Hukkanen T , Määttä S , Karhu J . Corticospinal output and cortical excitation-inhibition balance in distal hand muscle representations in nonprimary motor area. Hum Brain Mapp. (2011) ;32: (10):1692–16703. |
[10] | Kujirai T , Caramia MD , Rothwell JC , Day BL , Thompson PD , Ferbert A , Wroe S , Asselman P , Marsden CD . Corticocortical inhibition in human motor cortex. J Physiol. (1993) ;471: , 501–519. |
[11] | Ziemann U , Rothwell JC , Ridding MC . Interaction between intracortical inhibition and facilitation in human motor cortex. J Physiol. (1996) ;496: (pt 3):873–881. |
[12] | Valls-Sole J , Pascual-Leone A , Wassermann EM , Hallett M . Human motor evoked responses to paired transcranial magnetic stimuli. Electroencephalogr Clin Neurophysiol. (1992) ;85: (6):355–364. |
[13] | Vaalto S , Julkunen P , Säisänen L , Könönen M , Määttä S , Karhu J . Long-term plasticity may be manifested as reduction or expansion of cortical representations of actively used muscles in motor skill specialists. Neuroreport. (2013) ;24: (11):596–600. |
[14] | Elias LJ , Bryden MP , Bulman-Fleming MB . Footedness is a better predictor than is handedness of emotional lateralization. Neuropsychologia. (1998) ;36: (1):37–43. |
[15] | Fassi C , Smith G , Stark-Slapnik N . Figure skating with Carlo Fassi. New York: Scribner; (1980) |
[16] | Ruohonen J , Karhu J . Navigated transcranial magnetic stimulation. Neurophysiol Clin. (2010) ;40: (1):7–17. |
[17] | Julkunen P , Säisänen L , Danner N , Niskanen E , Hukkanen T , Mervaala E , Könönen M . Comparison of navigated and non-navigated transcranial magnetic stimulation for motor cortex mapping, motor threshold and motor evoked potentials. Neuroimage. (2009) ;44: (3):790–795. |
[18] | Ravazzani P , Ruohonen J , Grandori F , Tognola G . Magnetic stimulation of the nervous system: Induced electric field in unbounded, semi-infinite, spherical, and cylindrical media. Ann Biomed Eng. (1996) ;24: (5):606–616. |
[19] | Ruohonen J . Background physics for magnetic stimulation. Suppl Clin Neurophysiol. (2003) ;56: , 3–12. |
[20] | Thielscher A , Kammer T . Linking physics with physiology in TMS: A sphere field model to determine the cortical stimulation site in TMS. Neuroimage. (2002) ;17: (3):1117–1130. |
[21] | Sarvas J . Basic mathematical and electromagnetic concepts of the biomagnetic inverse problem. Phys Med Biol. (1987) ;32: (1):11–22. |
[22] | Tarkiainen A , Liljestrom M , Seppa M , Salmelin R . The 3D topography of MEG source localization accuracy: Effects of conductor model and noise. Clin Neurophysiol. (2003) ;114: (10):1977–1992. |
[23] | Hannula H , Ylioja S , Pertovaara A , Korvenoja A , Ruohonen J , Ilmoniemi RJ , Carlson S . Somatotopic blocking of sensation with navigated transcranial magnetic stimulation of the primary somatosensory cortex. Hum Brain Ma. (2005) ;26: (2):100–109. |
[24] | Danner N , Julkunen P , Könönen M , Säisänen L , Nurkkala J , Karhu J . Navigated transcranial magnetic stimulation and computed electric field strength reduce stimulator-dependent differences in the motor threshold. J Neurosci Methods. (2008) ;174: (1):116–122. |
[25] | Mozart L . A treatise on the fundamental principles of violin playing. Oxford: Oxford University Press; (1948) . |
[26] | Wilson SA , Thickbroom GW , Mastaglia FL . Transcranial magnetic stimulation mapping of the motor cortex in normal subjects. The representation of two intrinsic hand muscles.J Neurol Sci. (1993) ;118: (2):134–144. |
[27] | Pascual-Leone A , Cammarota A , Wassermann EM , Brasil-Neto JP , Cohen LG , Hallett M . Modulation of motor cortical outputs to the reading hand of braille readers. Ann Neurol. (1993) ;34: (1):33–37. |
[28] | Säisänen L , Julkunen P , Niskanen E , Hukkanen T , Mervaala E , Karhu J , Könönen M . Short- and intermediate-interval cortical inhibition and facilitation assessed by navigated transcranial magnetic stimulation. J Neurosci Methods. (2011) ;195: (2):241–248. |
[29] | Rossini PM , Barker AT , Berardelli A , Caramia MD , Caruso G , Cracco RQ , Dimitrijevic MR , Hallett M , Katayama Y , Lucking CH , et al. Non-invasive electrical and magnetic stimulation of the brain, spinal cord and roots: Basic principles and procedures for routine clinical application. Report of an IFCN committee. Electroencephalogr Clin Neurophysiol. (1994) ;91: (2):79–92. |
[30] | Geyer S . The Microstructural Border between the Motor and the Cognitive Domain in the Human Cerebral Cortex. Wien:Springer; (2004) . |
[31] | Orgogozo JM , Larsen B . Activation of the supplementary motor area during voluntary movement in man suggests it works as a supramotor area. Science. (1979) ;206: (4420)847–850. |
[32] | Brodmann K . Vergleichende Lokalisationslehre der Grosshirnrinde in ihren Prinzipien dargestellt auf Grund des Zellenbaues. Leipzig, Germany: J.A. Barth; (1990) . |
[33] | Lee KM , Chang KH , Roh JK . Subregions within the supplementary motor area activated at different stages of movement preparation and execution. Neuroimage. (1999) ;9: (1):117–123. |
[34] | Pochon JB , Levy R , Poline JB , Crozier S , Lehericy S , Pillon B , Deweer B , Le Bihan D , Dubois B . The role of dorsolateral prefrontal cortex in the preparation of forthcoming actions: An fMRI study. Cereb Cortex. (2001) ;11: (3):260–266. |
[35] | Gerardin E , Sirigu A , Lehericy S , Poline JB , Gaymard B , Marsault C , Agid Y , Le Bihan D . Partially overlapping neural networks for real and imagined hand movements. Cereb Cortex. (2000) ;10: (11):1093–1104. |
[36] | Grafton ST , Fagg AH , Arbib MA . Dorsal premotor cortex and conditional movement selection: A PET functional mapping study. J Neurophysiol. (1998) ;79: (2):1092–1097. |
[37] | Toni I , Schluter ND , Josephs O , Friston K , Passingham RE . Signal-, set- and movement-related activity in the human brain: An event-related fMRI study. Cereb Cortex. (1999) ;9: (1):35–49. |
[38] | Ziemann U , Ilic TV , Pauli C , Meintzschel F , Ruge D . Learning modifies subsequent induction of long-term potentiation-like and long-term depression-like plasticity in human motor cortex. J Neurosci. (2004) ;24: (7):1666–1672. |
[39] | Muellbacher W , Ziemann U , Boroojerdi B , Cohen L , Hallett M . Role of the human motor cortex in rapid motor learning. Exp Brain Res. (2001) ;136: (4):431–438. |
[40] | Liepert J , Classen J , Cohen LG , Hallett M . Task-dependent changes of intracortical inhibition. Exp Brain Res. (1998) ;118: (3):421–426. |
[41] | Pascual-Leone A , Nguyet D , Cohen LG , Brasil-Neto JP , Cammarota A , Hallett M . Modulation of muscle responses evoked by transcranial magnetic stimulation during the acquisition of new fine motor skills. J Neurophysiol. (1995) ;74: (3):1037–1045. |
[42] | Kleim JA , Hogg TM , VandenBerg PM , Cooper NR , Bruneau R , Remple M . Cortical synaptogenesis and motor map reorganization occur during late, but not early, phase of motor skill learning. J Neurosci. (2004) ;24: (3):628–633. |
[43] | Knott GW , Holtmaat A , Wilbrecht L , Welker E , Svoboda K . Spine growth precedes synapse formation in the adult neocortex in vivo. Nat Neurosci. (2006) ;9: (9):1117–1124. |
[44] | Hihara S , Notoya T , Tanaka M , Ichinose S , Ojima H , Obayashi S , Fujii N , Iriki A . Extension of corticocortical afferents into the anterior bank of the intraparietal sulcus by tool-use training in adult monkeys. Neuropsychologia. (2006) ;44: (13):2636–2646. |
[45] | Rosenkranz K , Williamon A , Rothwell JC . Motorcortical excitability and synaptic plasticity is enhanced in professional musicians. J Neurosci. (2007) ;27: (19):5200–5206. |
[46] | Pascual-Leone A , Wassermann EM , Sadato N , Hallett M . The role of reading activity on the modulation of motor cortical outputs to the reading hand in Braille readers. Ann Neurol. (1995) ;38: (6):910–915. |
[47] | Schwenkreis P , El Tom S , Ragert P , Pleger B , Tegenthoff M , Dinse HR . Assessment of sensorimotor cortical representation asymmetries and motor skills in violin players. Eur J Neurosci. (2007) ;26: (11):3291–3302. |
[48] | Gaser C , Schlaug G . Gray matter differences between musicians and nonmusicians. Ann N Y Acad Sci. (2003) ;999: , 514–517. |
[49] | James CE , Oechslin MS , Van De Ville D , Hauert CA , Descloux C , Lazeyras F . Musical training intensity yields opposite effects on grey matter density in cognitive versus sensorimotor networks. Brain Struct Funct (2014) ;219: (1):353–66. |
[50] | Liepert J , Terborg C , Weiller C . Motor plasticity induced by synchronized thumb and foot movements. Exp Brain Res. (1999) ;125: (4):435–439. |
[51] | Pearce AJ , Thickbroom GW , Byrnes ML , Mastaglia FL . Functional reorganisation of the corticomotor projection to the hand in skilled racquet players. Exp Brain Res. (2000) ;130: (2):238–243. |
[52] | Tyc F , Boyadjian A , Devanne H . Motor cortex plasticity induced by extensive training revealed by transcranial magnetic stimulation in human. Eur J Neurosci. (2005) ;21: (1):259–266. |
[53] | Meister I , Krings T , Foltys H , Boroojerdi B , Muller M , Topper R , Thron A . Effects of long-term practice and task complexity in musicians and nonmusicians performing simple and complex motor tasks: Implications for cortical motor organization. Hum Brain Ma. (2005) ;25: (3):345–352. |
[54] | Lotze M , Scheler G , Tan HR , Braun C , Birbaumer N . The musician’s brain: Functional imaging of amateurs and professionals during performance and imagery. Neuroimage. (2003) ;20: (3):1817–1829. |
[55] | Roland PE , Larsen B , Lassen NA , Skinhoj E . Supplementary motor area and other cortical areas in organization of voluntary movements in man. J Neurophysiol. (1980) ;43: (1):118–136. |
[56] | Cunningham DA , Machado A , Yue GH , Carey JR , Plow EB . Functional somatotopy revealed across multiple cortical regions using a model of complex motor task. Brain Res. 25–36. |
[57] | Rosenkranz K , Williamon A , Butler K , Cordivari C , Lees AJ , Rothwell JC . Pathophysiological differences between musician’s dystonia and writer’s cram. Brain. (2005) ;128: (Pt 4):918–931. |
[58] | Borich MR , Brodie SM , Gray WA , Ionta S , Boyd LA . Understanding the role of the primary somatosensory cortex: Opportunities for rehabilitation. Neuropsychologia. (2015) ;79: (Pt B):246–55. |
[59] | Kandel E , Schwartz J , Jessell T . Principles of Neural Science. 4th ed. New York: McGraw-Hill; (2000) . |
[60] | Fridman EA , Hanakawa T , Chung M , Hummel F , Leiguarda RC , Cohen LG . Reorganization of the human ipsilesional premotor cortex after stroke. Brain. (2004) ;127: (Pt 4):747–758. |
[61] | Ward N . Assessment of cortical reorganisation for hand function after stroke. J Physiol. (2011) ;589: (Pt 23):5625–5632. |
[62] | Ward NS , Brown MM , Thompson AJ , Frackowiak RS . Neural correlates of outcome after stroke: A cross-sectional fMRI study. Brain. (2003) ;126: (Pt 6):1430–1448. |
[63] | Ward NS , Newton JM , Swayne OB , Lee L , Thompson AJ , Greenwood RJ , Rothwell JC , Frackowiak RS . Motor system activation after subcortical stroke depends on corticospinal system integrity. Brain. (2006) ;129: (Pt 3):809–819. |
[64] | Civardi C , Cavalli A , Naldi P , Varrasi C , Cantello R . Hemispheric asymmetries of cortico-cortical connections in human hand motor areas. Clin Neurophysiol. (2000) ;111: (4):624–629. |
[65] | Bäumer T , Dammann E , Bock F , Klöppel S , Siebner HR , Munchau A . Laterality of interhemispheric inhibition depends on handedness. Exp Brain Res. (2007) ;180: (2):195–203. |
[66] | Ilic TV , Jung P , Ziemann U . Subtle hemispheric asymmetry of motor cortical inhibitory tone. Clin Neurophysiol. (2004) ;115: (2):330–340. |
[67] | Penfield W , Welch K . The supplementary motor area of the cerebral cortex; a clinical and experimental study. AMA Arch Neurol Psychiatry. (1951) ;66: (3):289–317. |
[68] | Lo YL , Fook-Chong S . The silent period threshold as a measure of corticospinal inhibition. J Clin Neurophysiol. (2005) ;22: (3):176–179. |
[69] | Kallioniemi E , Säisänen L , Könönen M , Awiszus F , Julkunen P . On the estimation of silent period thresholds in transcranial magnetic stimulation. Clin Neurophysiol. (2014) ;125: (11):2247–2252. |
Figures and Tables
Fig.1
Optimal OP muscle representation areas in non-dominant M1 and in NPMA. The four pictures in the upper panel display the representations from the string-instrument players (the image data of one string-instrument player was lost because of a technical failure) and the six pictures in the lower panel show the representations from the control subjects. Electric field values induced with 120% MT intensity are shown in NPMAs and in M1.
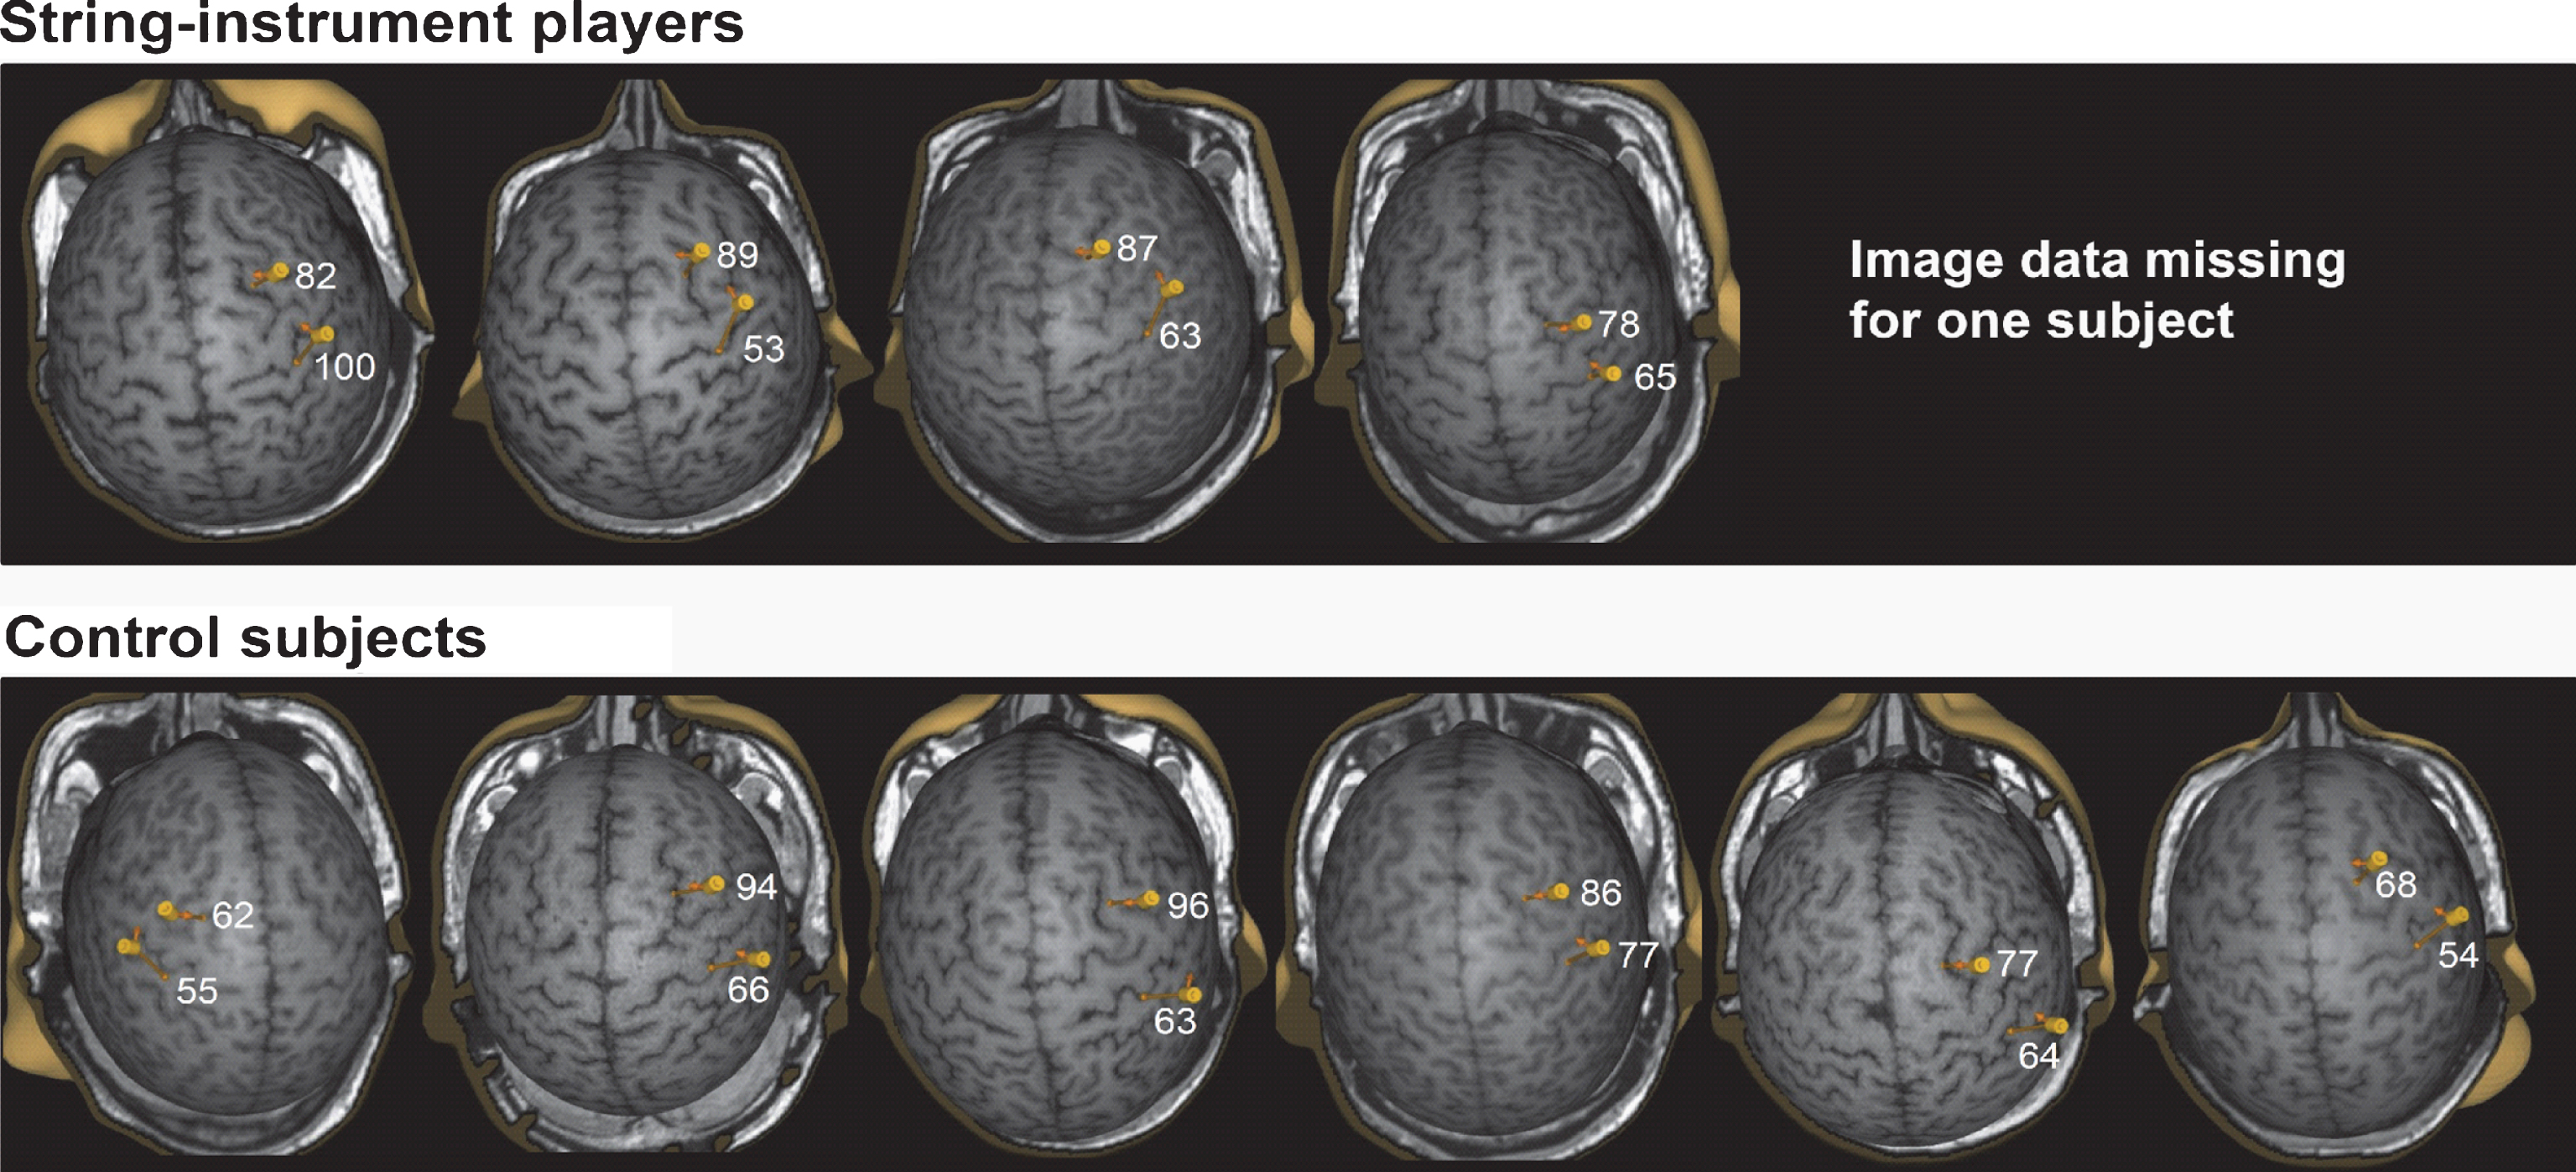
Fig.2
In the string-instrument players, SICI was decreased with 3 ms ISI in M1 ADM muscle representation (upper left) and increased with 50% CS intensity in NPMA ADM muscle representation (upper right) when compared with control subjects. These kinds of differences were not observed in OP muscle (lower panel).
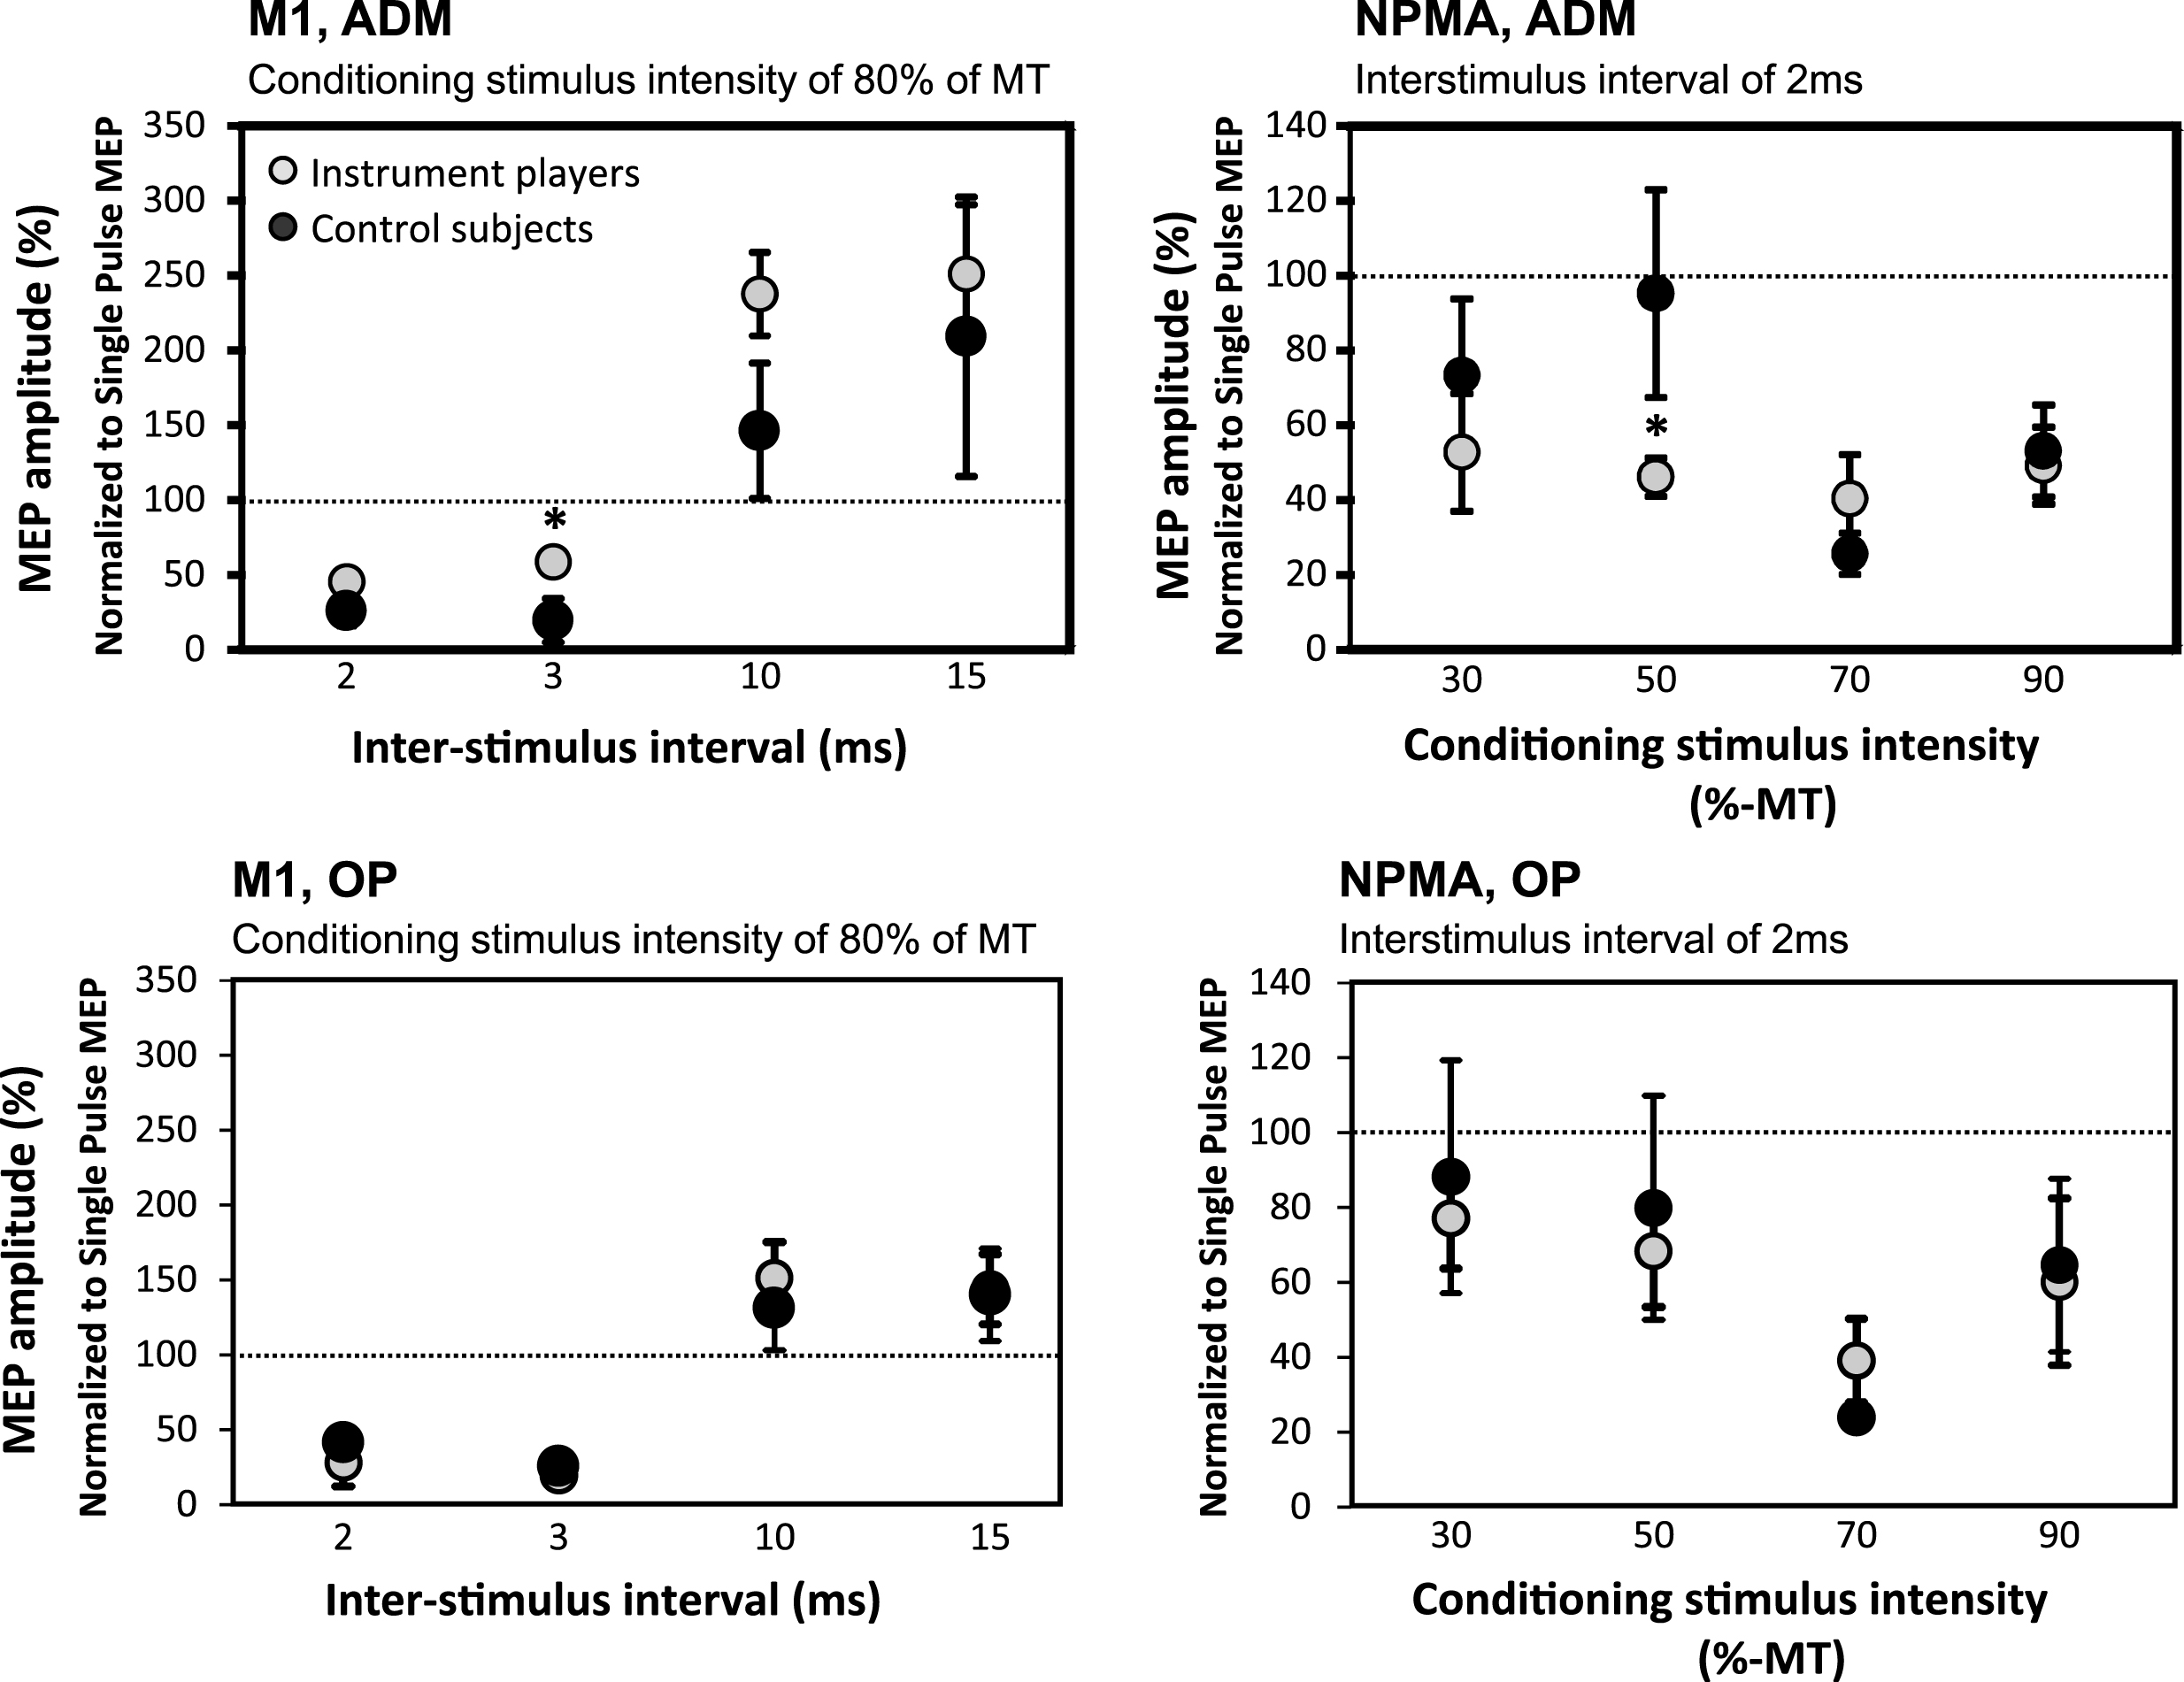
Table 1
Normalized paired-pulse MEP amplitudes (% of single-pulse MEP amplitudes): stimulation of primary motor area and non-primary motor area with constant CS intensity of 80% MT and variable ISIs, and measured from opponens pollicis (OP) and abductor digiti minimi (ADM) muscles in string-instrument players and control subjects. Presented as mean (SD). Bold values indicate statistically significant SICI or ICF effect
| ISI (ms) | 2 | 3 | 10 | 15 | ||||
| Muscle | OP | ADM | OP | ADM | OP | ADM | OP | ADM |
| Stimulation of Primary motor area, M1 | ||||||||
| Players | 28 (20) | 45 (22) | 19 (8) | 58 (33)* | 151 (62) | 238 (101)# | 144 (69) | 251 (209) |
| Controls | 41 (39) | 26 (19) | 26 (20) | 19 (8)# | 131 (58) | 146 (68) | 140 (57) | 209 (103) # & |
| Stimulation of Non-primary motor area, NPMA | ||||||||
| Players | 54 (41) | 63 (40) | 27 (25) | 29 (27) | 102 (62) | 113 (85) | 106 (60) | 118 (106) |
| Controls | 41 (31) | 45 (25) | 40 (26) | 27 (12) | 162 (163) | 118 (87) | 113 (50) | 135 (82) |
* = significant difference between the groups, #= significant difference between the stimulated areas, & = significant difference between the recorded muscles.
Table 2
Normalized paired-pulse MEP amplitudes (% of single-pulse MEP amplitudes): stimulation of primary motor area and non-primary motor area with constant ISI 2 ms and variable CS intensity, and measured from opponens pollicis (OP) and abductor digiti minimi (ADM) muscles in string-instrument players and control subjects. Presented as mean (SD). Bold values indicate a statistically significant SICI or ICF effect
| CS (%) | 30 | 50 | 70 | 90 | ||||
| Muscle | OP | ADM | OP | ADM | OP | ADM | OP | ADM |
| Stimulation of Primary motor area, M1 | ||||||||
| Players | 79 (57) | 110 (79) | 83 (84) | 93 (57) | 31 (21) | 61 (59) | 37 (59) | 37 (30) |
| Controls | 145 (202) | 90 (50) | 111 (101) | 92 (59) | 42 (54) | 50 (55) | 36 (34) | 38 (37) |
| Stimulation of Non-primary motor area, NPMA | ||||||||
| Players | 77 (33) | 53 (35)# | 68 (36) | 46 (12)* | 39 (27) | 40 (26) | 60 (55) | 49 (23) |
| Controls | 88 (76) | 73 (50) | 80 (73) | 95 (68) | 24 (9) | 26 (13) | 65 (57) | 53 (30) |
* = significant difference between the groups, #= significant difference between the stimulated areas.

