The influence of activities and duration on comfort and discomfort development in time of aircraft passengers
Abstract
BACKGROUND: Discomfort increases when duration of sitting is longer. Aircraft passengers are subjected to prolonged sitting in restricted postures, which can cause discomfort.
OBJECTIVE: To examine the relationship between duration of sitting and development of discomfort, as well as the influence of different passenger activities.
METHODS: Participants (n = 18) performed four different activities in three conditions during an aircraft seat test. Discomfort was measured every 15 min on an 11-point scale. A short online survey asked passengers (n = 114) when they felt most refreshed during their last flight.
RESULTS: Discomfort was significantly lower during the ‘food’ activity for condition 2 (hot meal), compared to conditions 1 and 3 (drinks, snack). The largest decrease in discomfort was during the 15 min break between two conditions, in which participants could walk around. Respondents from the online survey indicated they felt most refreshed after food (34.8%), sleeping (27.0%) and walking through the plane (25.2%). Walking was mentioned more often as most refreshing activity by long-haul passengers (>6 h) compared to short-haul passengers (<2 h).
CONCLUSIONS: Passengers can be distracted from feeling discomfort by providing food and drinks. Airlines and seat manufacturers can increase comfort by stimulating passengers to move in their seat.
1Introduction
Many people who spend most of their time sitting down have an increased health risk. Hu et al. [1]state that, for women, for each 2 hours increase in sitting time at work per day, the risk of obesity increases by 5% and the risk of diabetes type II by 7%. Besides health, there are studies that show that prolonged sitting increases discomfort. According to several studies, discomfort increases when the duration of sitting is even longer. For instance, Porter et al. [2] observed an increase in discomfort of the back, buttocks and thighs over time in a 135–minute drive. Na et al. [3] established an increase in whole body discomfort over time when driving a car for 45 minutes, while Le et al. [4] noticed that movement of the driver occurred more often as time progressed to alleviate pressure from discomfort.
Discomfort can be seen as “an unpleasant state of the human body in reaction to its physical environment” [5]. According to Zhang et al. [6], comfort and discomfort are two independent factors associated with different underlying factors. Discomfort is associated with feelings of pain, soreness, numbness and stiffness, and is caused by physical constraints in the design. On the other hand, comfort is associated with feelings of relaxation and well-being. Thus, reducing discomfort will not necessarily increase comfort, but in order to accomplish a high level of comfort, the level of discomfort should be low [7].
Aircraft passengers are subjected to prolonged sitting in a restricted posture; depending on the duration of the flight, this could be up to 15 hours. Although previous studies have investigated the development of discomfort in time, these studies have been performed in work environments [8], for car driver seats [2–4] or for glider pilot seats [9], but not for aircraft passenger seats. Furthermore, it is important to take into account the activities that aircraft passengers perform [5], as demonstrated for office seats in the studies by Groenesteijn et al. [10] and Ellegast et al. [11].
Therefore, the research question for this study is: What is the effect of discomfort development over time for aircraft passengers? Is this different for different activities? On the other hand, feeling refreshed is associated with feelings of comfort, which is why a second research question has been formulated: According to aircraft passengers, what is the most refreshing activity? Is there a difference for the duration of flights?
2Method
In an aircraft seat test, for an airline, selecting new economy seats, there was a possibility to study the effect of activities and duration on the development of discomfort. Participants sat in three types of seats in order to evaluate whether there were differences between the seats. The results of this test are proprietary information. However, this experiment provided the possibility of adding various activities such as eating, sleeping and reading, and participants were able to walk around between seat test sessions.
In a consecutive study, a short survey was posted online. In order to investigate the influence of activities and duration on comfort, respondents were asked after which activity they felt most refreshed
2.1Participants
Eighteen people (8 male, 10 female) volunteered to participate in the aircraft seat test. Their average age was 33 years (18–61 years), average stature 1.72 m (1.57–1.97 m) and average weight 68 kg (52–94). Twelve participants were Dutch, six were international, and three who were Asian. Participants were carefully selected in order to obtain a representative sample of the expected passenger population, in terms of diversity in age, nationality and anthropometry (stature and weight).
Respondents for the online survey were contacted through e-mail and social media (Facebook). In total, 134 respondents accessed the questionnaire; only 114 people completed the questionnaire (54 male; 55 female; 5 unknown). The nationality of respondents was German (68.5%), Dutch (17.6%) and other (13.9%, e.g. Austrian, Belgian, Italian, and Spanish). Their average age was 30 years (range 16–63 years). Nearly all respondents were economy class passengers (96.5%), and a large majority were travelling for holiday purposes (64.9% vs. 35.1% business).
2.2Experimental setting
In the aircraft seat test, three of the most common economy class seats used from leading aircraft seat manufacturers (selected by the airline) were used. The airline is a flag carrier and the seats are intended for regular economy class on medium to long-haul flights, which is why in the experiment the seats were separated at a pitch of 32” (813 mm). In the laboratory environment, seats were placed in two rows of three types per seat. Participants were seated in the second row, as illustrated in Fig. 1. Seats were placed on a 3 degrees inclined floor to simulate the slope of an airplane at cruising altitude. The different seats were visually separated and given code names.
Three groups of three people participated in the aircraft seat test simultaneously. The order in which the seats were presented to the participants was systematically varied. As illustrated in Fig. 2, each group of three participants received a specific order of seats (six different orders: ABC, BCA, CAB, BAC, CBA, ACB).
2.3Measurements
During the aircraft seat test, discomfort was measured using the Local Perceived Discomfort (LPD) method [12]. A body map consisting of 22 regions was given to the participants, who were asked to rate their perceived discomfort of the body regions on an 11-point scale (ranging from 0 = no discomfort to 10 = extreme discomfort, almost maximum). The marking of the body regions was completed at the start of the test and then every 15 minutes thereafter. During the experiment, participants were not allowed to talk to each other to prevent influencing each other.
The online survey was a short questionnaire aimed to identify the most refreshing activity for an aircraft passenger based on his or her last flight experience. Respondents were asked details about their last flight, such as when was the last time they flew on a aircraft (last week; last month; last six months; last year; over a year ago). They were asked which airline they used and the duration of the flight (<2 h; 2–4 h; 4–6 h; >6 h). They were also asked the class (economy; premium economy; business) and for what purpose (business; holiday). Questions about personal information included gender, nationality, age, standing height and weight. Respondents were asked when they felt most refreshed during their last flight: after getting food; after watching a movie; after sleeping; after reading; after walking through the plane (e.g. visit bathroom). It was also possible to provide additional comments.
2.4Protocol
Three groups of three people participated in the aircraft seat test simultaneously. Each participant sat for 1.5 hour in each seat (total sitting duration was 4.5 hours). During each condition, four activities were simulated: upright sitting (for ‘take-off’), eating and drinking, reading (an inflight magazine), and sleeping or relaxing (reclined). After every 1.5 hour sitting, participants were allowed a 15 min break to walk around, stretch their legs and have a toilet break. The total experiment duration was approximately 6 hours and took place in one day.
At the start of each condition, the seats were covered by a white sheet, which was taken away just before sitting down. So, the first impression was based only by physical contact and not by visual appearance, as research has shown that this first view can have an influence on perceived comfort [13].
The survey (about the most refreshing activity for aircraft passengers) was available online for one month in April 2013.
2.5Data analysis
Local Perceived Discomfort scores were analysed in two ways: the development of discomfort in time and the average increase in discomfort per activity. First, the LPD scores from the participants at t = 0 were subtracted from the LPD scores at consecutive times of measurement (t = 15, t = 30, t = 45, t = 60, t = 75, t = 90 min). One LPD score was calculated by summing up the LPD scores from each of the 22 body regions. These corrected and summed LPD scores were compared for each measurement time using Friedman’s ANOVA (IBM SPSS Statistics 20). Furthermore, General Linear Model (GLM) repeated measures was used with condition (1, 2, 3) and time of measurement (t = 15, t = 30, t = 45, t = 60, t = 75, t = 90 min) as within subjects factors, and order of the seats as between subjects factor. Significance was accepted at p < 0.05.
Second, the discomfort development in time (ΔLPD) was calculated by subtracting each LPD score from the next time of measurement (e.g. T30-T15), thereby obtaining scores for T0–15, T15–30, T30–45, T45–60, T60–75 and T75–90. The duration of activities varied, which is why the increase in discomfort was averaged for a 15 min interval (i.e. activity take-off was complete during T0–15, food during T15–30, reading during T30–45 and T45–60, and sleeping during T60–75 and T75–90). This resulted in an average 15 min increase in Local Perceived Discomfort per condition. Additionally, GLM repeated measures were used with each condition (1, 2, 3) and activity (take-off, food, reading, sleeping) as within subjects factors, and order of the seats as between subjects factor. Significance was accepted at p < 0.05. The activity walking was completed in between two conditions, and was calculated by subtracting T90 from the T0 from the nextcondition.
For the results from the survey, a Chi-square Test was used to compare the responses between short, medium and long haul passengers (<2 h, 2–4 h, 4–6 h, >6 h). Significance was accepted at p < 0.05.
3Results
3.1Local perceived discomfort
The development of Local Perceived Discomfort in time for each condition is shown in Fig. 3. The first 15 minutes, participants were sitting upright for ‘take-off’ (T0–15). Food and drinks were served after 15 minutes (T15–30), followed by the activity reading (T30–60). For the last 30 minutes of every condition, participants were sleeping or relaxing (T60–90).
From Fig. 3 it appears that the development of perceived discomfort is lower in the middle condition (condition 2) as compared with the first and last condition. However, only during t = 30 min (‘food’ activity), a significant difference (p < 0.01, χ2(2) = 11.63) between conditions was found, with the average LPD score for condition 2 being significantly lower than for conditions 1 and 3. A significant effect was found for time (p < 0.01, F(2.76) = 13.0), but no significant main effect was found for condition, nor were there significant interaction effects between condition, time and order.
Figure 4 shows the average 15 min development in local perceived discomfort (ΔLPD) for each of the four activities per condition. The activity of walking was completed between conditions 1 and 2 and conditions 2 and 3 and was shown separately. It appeared that during take-off, ΔLPD was lower for the second and third condition compared with the previous conditions. In contrast, for sleeping, ΔLPD appeared to increase during the successive conditions. During the food activity in condition 2, ΔLPD was negative, meaning that the discomfort was reduced during these 15 minutes. However, no significant main effects were found for condition or activity, nor were there significant interaction effects between condition, activity and order.
3.2Survey results
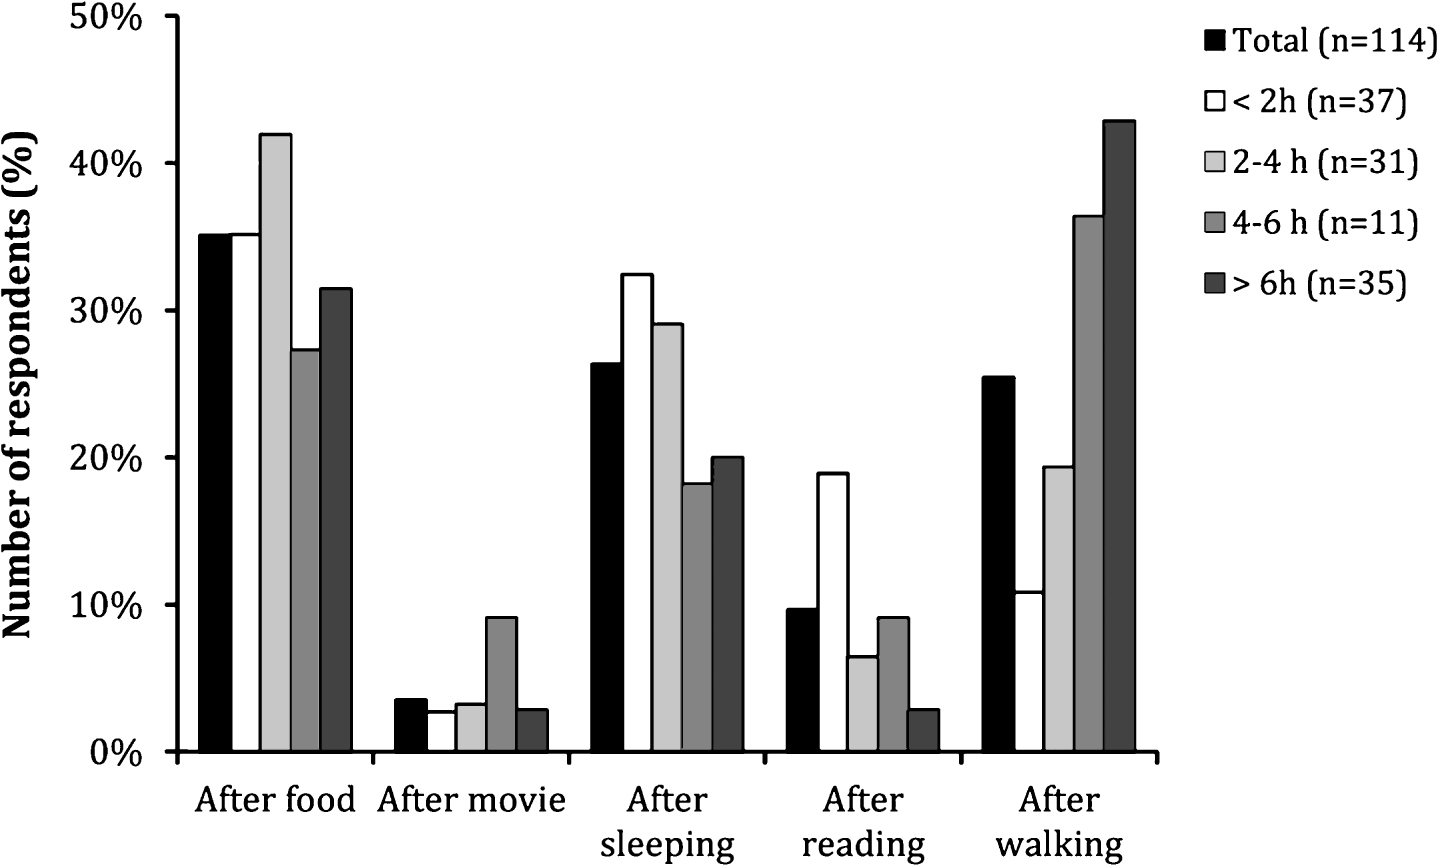
Overall, respondents from the survey indicated that they felt most refreshed during the flight after food (34.8%), after sleeping (27.0%) and after walking through the plane (25.2%), as shown in Fig. 5. However, differences existed between passengers from short-haul (<2 hours) and long-haul flights (>6 hours). For short-haul passengers (n = 38), most refreshing activities were food and sleeping, whereas for long-haul passengers (n = 35), the most refreshing activity was walking through the plane.
No significant effects were found for the duration of the flight. However, the percentage of respondents who felt most refreshed after walking through the plane appeared to increase with the duration of the flight. Over 10% of short haul passengers (<2 h flight) indicated that they felt most refreshed after walking, this was more than 40% then for long haul passengers (>6 h flight).Four respondents (all with >6 h flights) additionally mentioned that they felt refreshed after getting a warm towel for refreshing the face and the hands.
4Discussion
The aircraft seat test demonstrated that the increase in discomfort was different for different activities. The survey indicated that, depending on the duration of the flight, other activities contributed to the refreshed feeling of passengers. According to Helander and Zhang [7], sitting discomfort is related to more physical aspects, such as uneven pressure, while comfort is related to luxury and refreshment. Short haul passengers (<2 h) indicated they felt most refreshed after food and sleeping, whereas long haul passengers (<6 h) indicated they felt most refreshed after walking through the plane. The results from the airline test also indicated that the increase in discomfort was lower after participants had a 15 min break in which they could walk around the room.
Bazley et al. [8] studied patterns of discomfort during the workday and throughout the workweek, and found that physical discomfort increased during the workday. During the workweek, discomfort was low at the beginning, increasing towards the middle of the week and decreasing again by the end of the workweek. Results of the aircraft seat test showed that the development of discomfort was lowest in the middle condition and higher in the first and last condition. Although this seems to be the opposite of the findings by Bazley et al. [8], perhaps the same mechanisms play a role here with regard to expectations and mood. In the first condition, participants did not know what to expect, while during the middle condition, participants were halfway through the experiment and possibly bored during the last condition, which might have increased their awareness of discomfort.
Since the survey was available online, it was possible for everyone to complete it, and the authenticity of respondents could not be controlled. The answers from one respondent were deleted because these were clearly not authentic. Furthermore, respondents were asked to recall their last flight experience, which might have been difficult to remember. For the majority of respondents (66%), their last flight was within the past six months. However, for 16% of respondents, their last flight was over a year ago.
In line with Hiemstra-van Mastrigt et al. [14], body movement was found to be a key issue in preventing discomfort and providing comfort. They found passengers who played an active game in the back seat of a car felt significantly more refreshed and fit than when performing other activities, such as reading a book, working on a laptop or gaming on a tablet pc. From an airline point of view, passengers crowding the aisle would not be a desirable prospect, but by providing passengers with the possibility to play a game and move about in their seat might perhaps be a possibility and contribute to passengers feeling refreshed during a longer flight. This concept could be an opportunity for aircraft seat manufacturers.
The development of discomfort (LPD) is not compared to a different order of activities. The order of the seats systematically varied for each participant, but the order of the activities was the same because this is the expected order when passengers are on a flight (i.e. first upright sitting for take-off; sleeping only after already sitting for a while). The durations of activities may be short for long-haul seats, but observations of train passengers by Groenesteijn et al. [15] showed that the average duration of the activities reading and staring/sleeping were 28 min and 29 min, respectively. Furthermore, the activities performed in this study were imposed, which could have influenced comfort and discomfort ratings. In a natural setting, passengers might perform different activities besides reading and sleeping, such as using the in-flight entertainment system (IFE), for example to watch a movie, listening to music or talking with other passengers.
A significant difference was found in LPD score after 30 minutes (‘food’ activity) for condition 2 compared with conditions 1 and 3. Also, the ΔLPD during the food activity for condition 2 was negative; meaning that discomfort was reduced in this time, however, this was not found to be significant. A possible reason for the difference in perceived discomfort during this time of measurement was that participants were offered a hot beverage (coffee/tea) and a biscuit during the first condition (1), and cold soft drinks and a candy bar in the last condition (3), whereas they received a complete hot meal during condition 2.
5Conclusion
The aircraft seat test showed that the discomfort of passengers increased over time, but activities had an influence on the development of discomfort. During eating and drinking, the increase of discomfort was lower than for other activities, and decreased when participants were offered a complete meal (compared to just drinks and a snack). Discomfort decreased significantly, however, after each 15 min break between conditions, in which participants were able to stretch their legs and walked.
Respondents from the online survey indicated that they felt most refreshed after walking through the plane, especially the passengers on long-haul (>6 hours) flights. Similarly, in a study by Hiemstra-van Mastrigt et al. [14], it was shown that car passengers felt significantly more fit and more refreshed after playing an active game while seated in the back seat compared with other activities. The concluding results of this study were that movement is important to feel refreshed and comfortable.
The results of the active seating study therefore offer an interesting suggestion for airlines to distract passengers from feeling discomfort by providing food and drinks, and stimulate walking in the plane. Seat manufacturers, on the other hand, could minimize seat discomfort by stimulating passengers to move in their seat, e.g. by playing a game, to improve comfort by giving a more refreshed feeling.
Conflict of interest
The authors have no conflict of interest to report.
Acknowledgments
The authors would like to thank KLM Royal Dutch Airlines, who supported this study financially, and David van Dongen and Tineke Janssen in particular for their help in the construction and execution of the research.
REFERENCES
[1] | Hu FB , Li TY , Colditz GA , Willett WC , Manson JE . Television watching and other sedentary behaviors in relation to risk of obesity and type 2 diabetes mellitus in women. The Journal of the American Medical Association (JAMA) (2003) ;289: (14):1785–91. |
[2] | Porter JM , Gyi DE , Tait HA . Interface pressure data and the prediction of driver discomfort in road trials. Applied Ergonomics (2003) ;34: (3):207–14. |
[3] | Na S , Lim S , Choi H-S , Chung MK . Evaluation of driver’s discomfort and postural change using dynamic body pressure distribution. International Journal of Industrial Ergonomics (2005) ;35: (12):1085–96. |
[4] | Le P , Rose J , Knapik G , Marras WS . Objective classification of vehicle seat discomfort. Ergonomics (2014) ;57: (4):536–44. |
[5] | Vink P , Hallbeck S . Comfort and discomfort studies demonstrate the need for a new model. Applied Ergonomics (2012) ;43: , 271–76. |
[6] | Zhang L , Helander M , Drury C . Identifying factors of comfort and discomfort. Human Factors (1996) ;38: , 377–89. |
[7] | Helander MG , Zhang L . Field studies of comfort and discomfort in sitting. Ergonomics (1997) ;40: (9):895–915. |
[8] | Bazley C , Nugent R , Vink P . Patterns of discomfort during work. Journal of Ergonomics136 (2015) ;5: : doi:10.4172/2165-7556.1000136 |
[9] | Jackson C , Emck AJ , Hunston MJ , Jarvis PC . Pressure measurements and comfort of foam safety cushions for confined seating. Aviation, Space, and Environmental Medicine (2009) ;80: (6):6. |
[10] | Groenesteijn L , Ellegast RP , Keller K , Krause F , Berger H , De Looze MP . Office task effects on comfort and body dynamics in five dynamic office chairs. Applied Ergonomics (2012) ;43: (2):320–8. |
[11] | Ellegast RP , Keller K , Groenesteijn L , Krause F , Berger H , Vink P . Comparison of four specific dynamic office chairs with a conventional office chair: Impact upon muscle activation, physical activity and posture. Applied Ergonomics (2012) ;43: (2):296–307. |
[12] | Van der Grinten MP , Smitt P . Development of a practical method for measuring body part discomfort. In: Kumar S. (Ed.), Advances in Industrial Ergonomics and Safety IV. Taylor & Francis, London (1992) ; pp. 311–8. |
[13] | Bronkhorst RE , Kuijt-Evers LFM , Cremer R , Van Rhijn JW , Krause F , De Looze MP , Rebel J . Emotie en comfort in cabines: Rapportage TNO basisfinanciering team 40. Hoofddorp: TNO Arbeid. Publ.nr. R2014871/4020054. Vertrouwelijk, 2001. |
[14] | Hiemstra-van Mastrigt S , Kamp I , Van Veen SAT , Vink P , Bosch T . The influence of active seating on car passengers’ perceived comfort and activity levels. Applied Ergonomics (2015) ;47: :211–9. |
[15] | Groenesteijn L , Hiemstra-van Mastrigt S , Gallais C , Blok M , Kuijt-Evers L , Vink P . Activities, postures and comfort perception of train passengers as input for train seat design. Ergonomics (2014) ;57: (8):1154–65. |
Figures and Tables
Fig.1
Top view of experimental setting; participants were always seated in the second row.
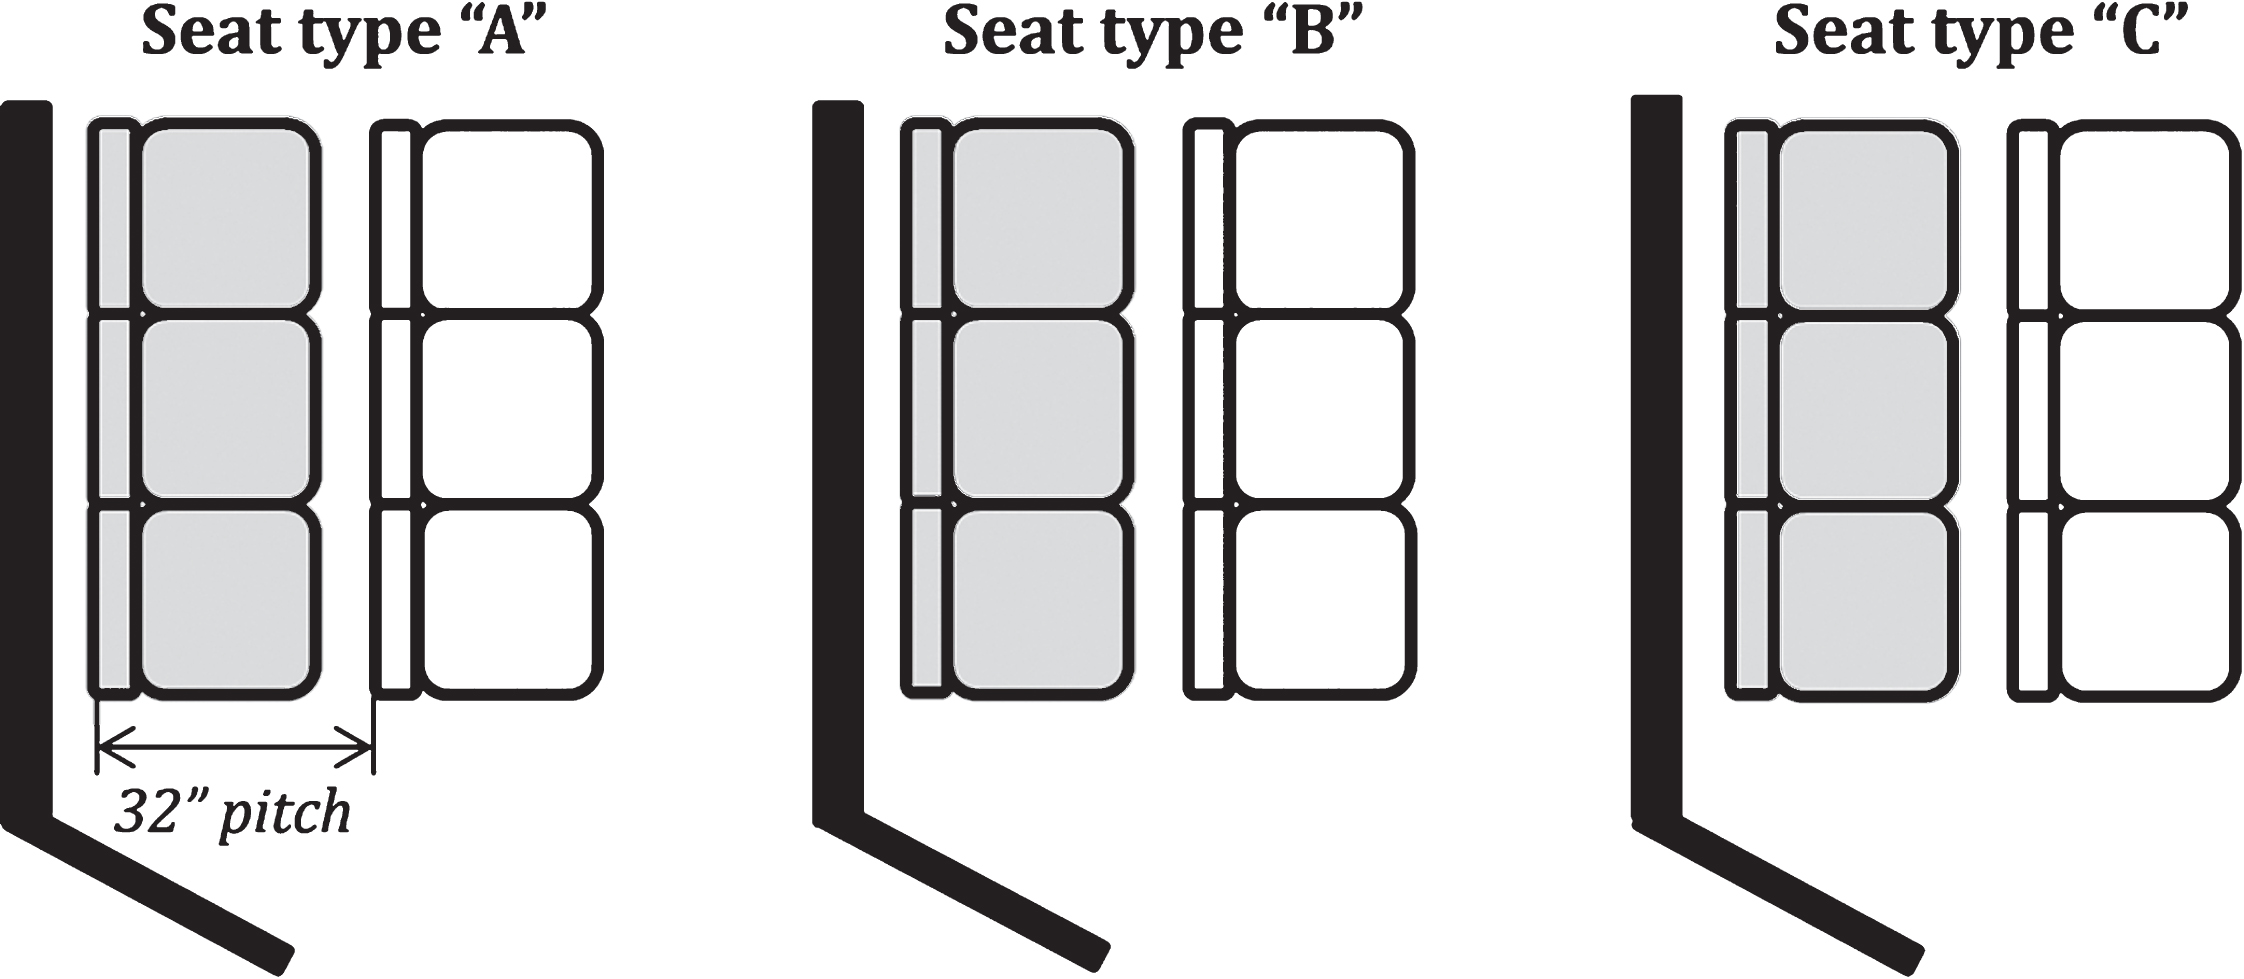
Fig.2
Order of different type of seats for six groups of participants.
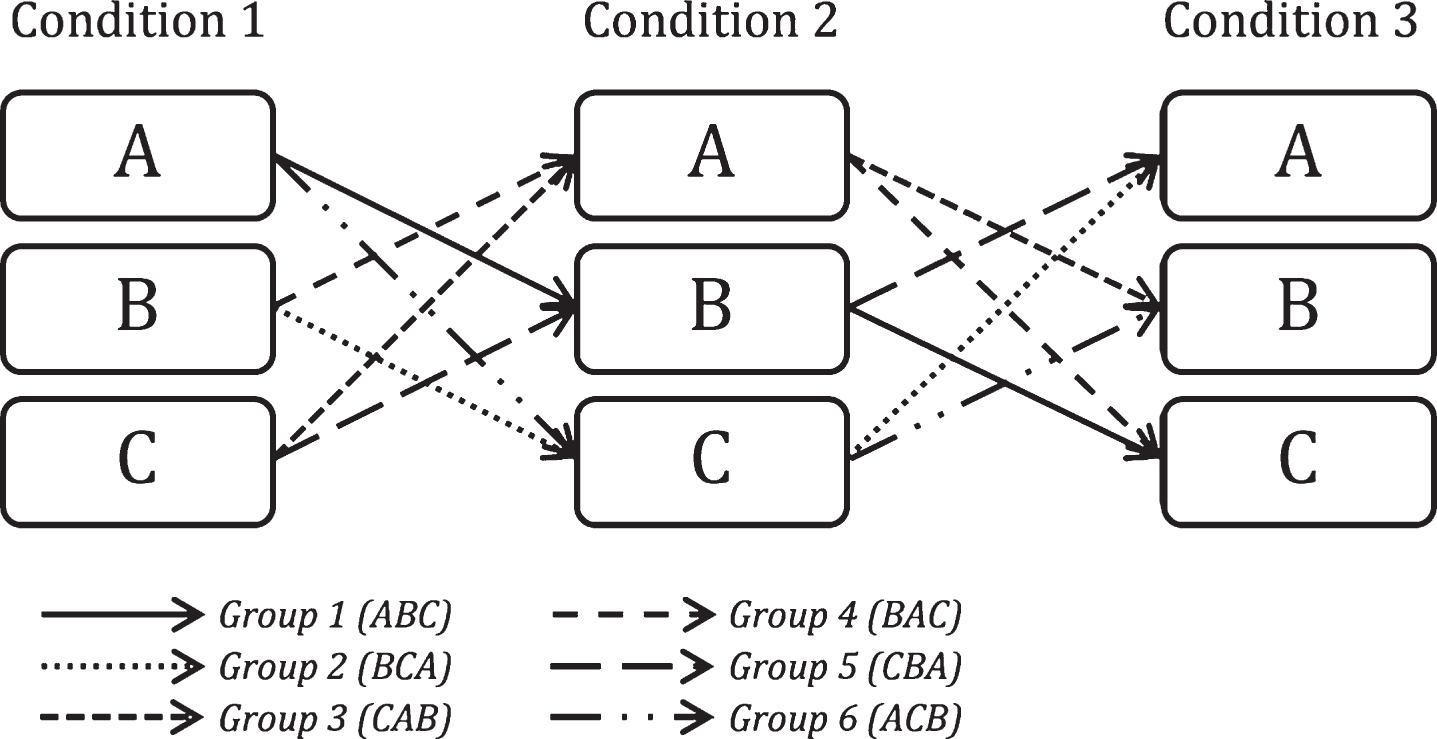
Fig.3
Development of Local Perceived Discomfort in time for each condition (condition 1 is the first condition, condition 3 is the last condition). The asterisk (*) indicates a significant difference (p < 0.01) at t = 30 min.
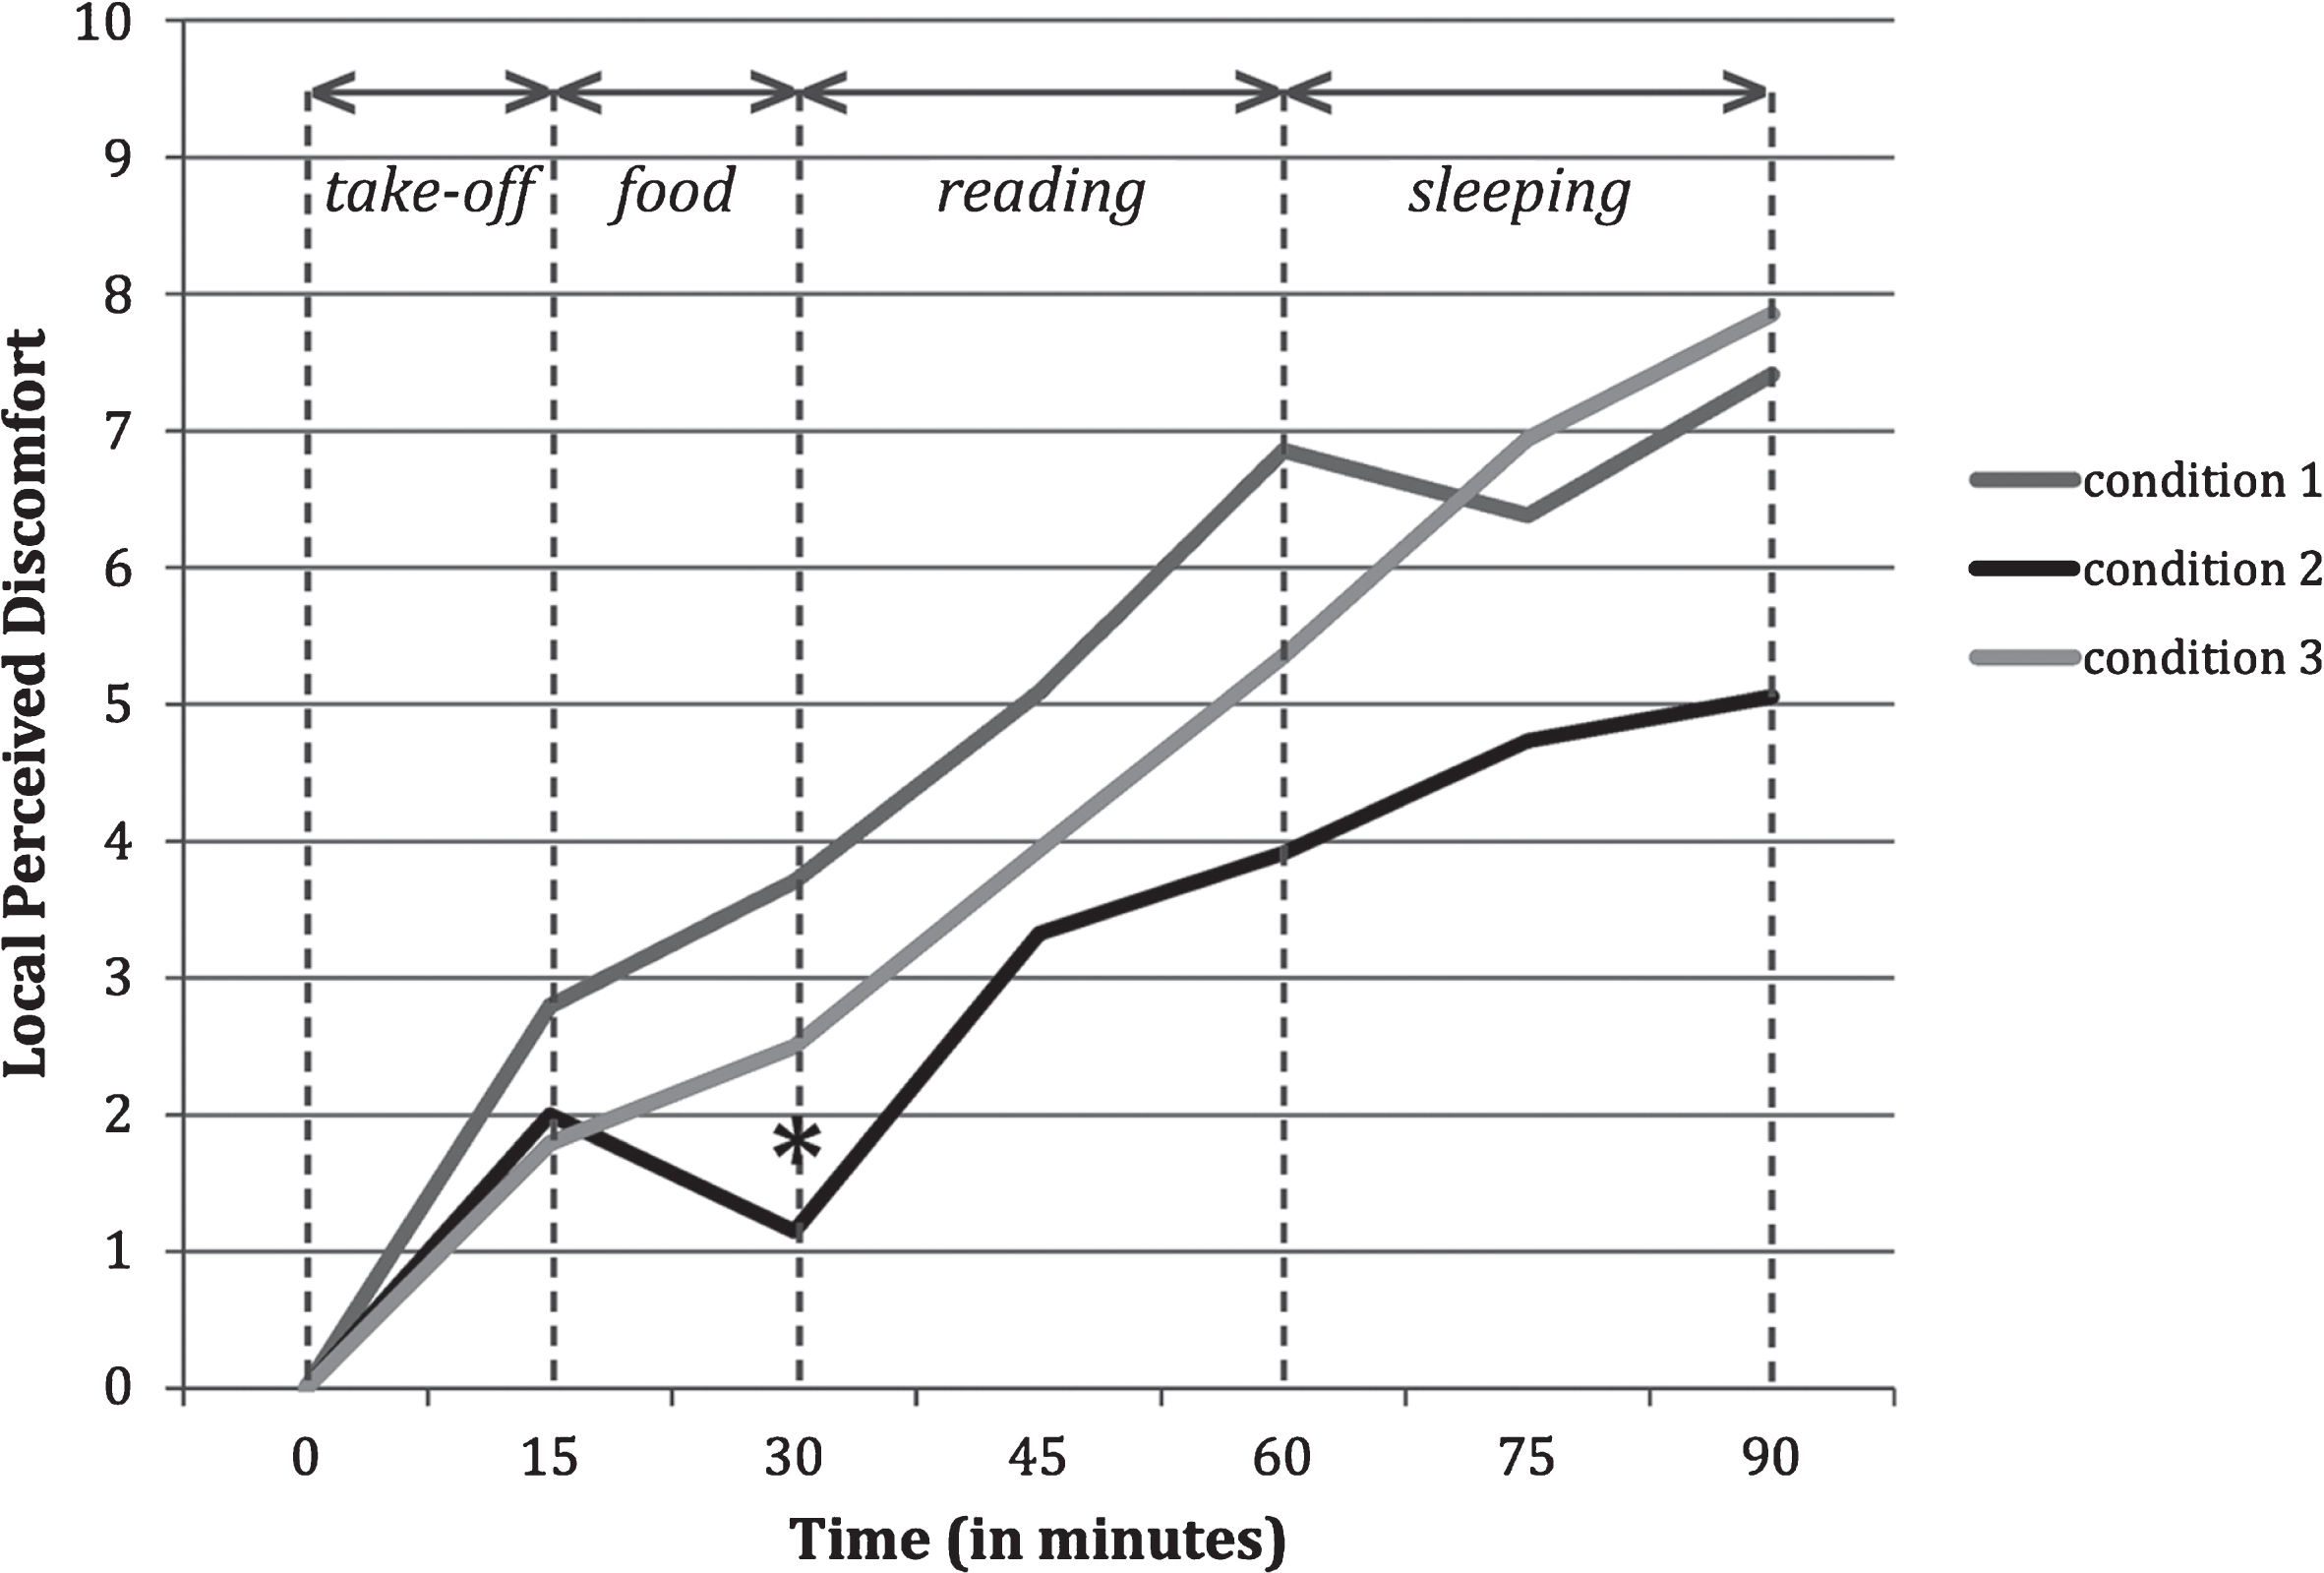
Fig.4
Average 15 min development of discomfort for each activity per condition (left) and between two successive conditions (right). The activity walking was done between conditions 1 and 2 and conditions 2 and 3. Error bars indicate the standard deviation.
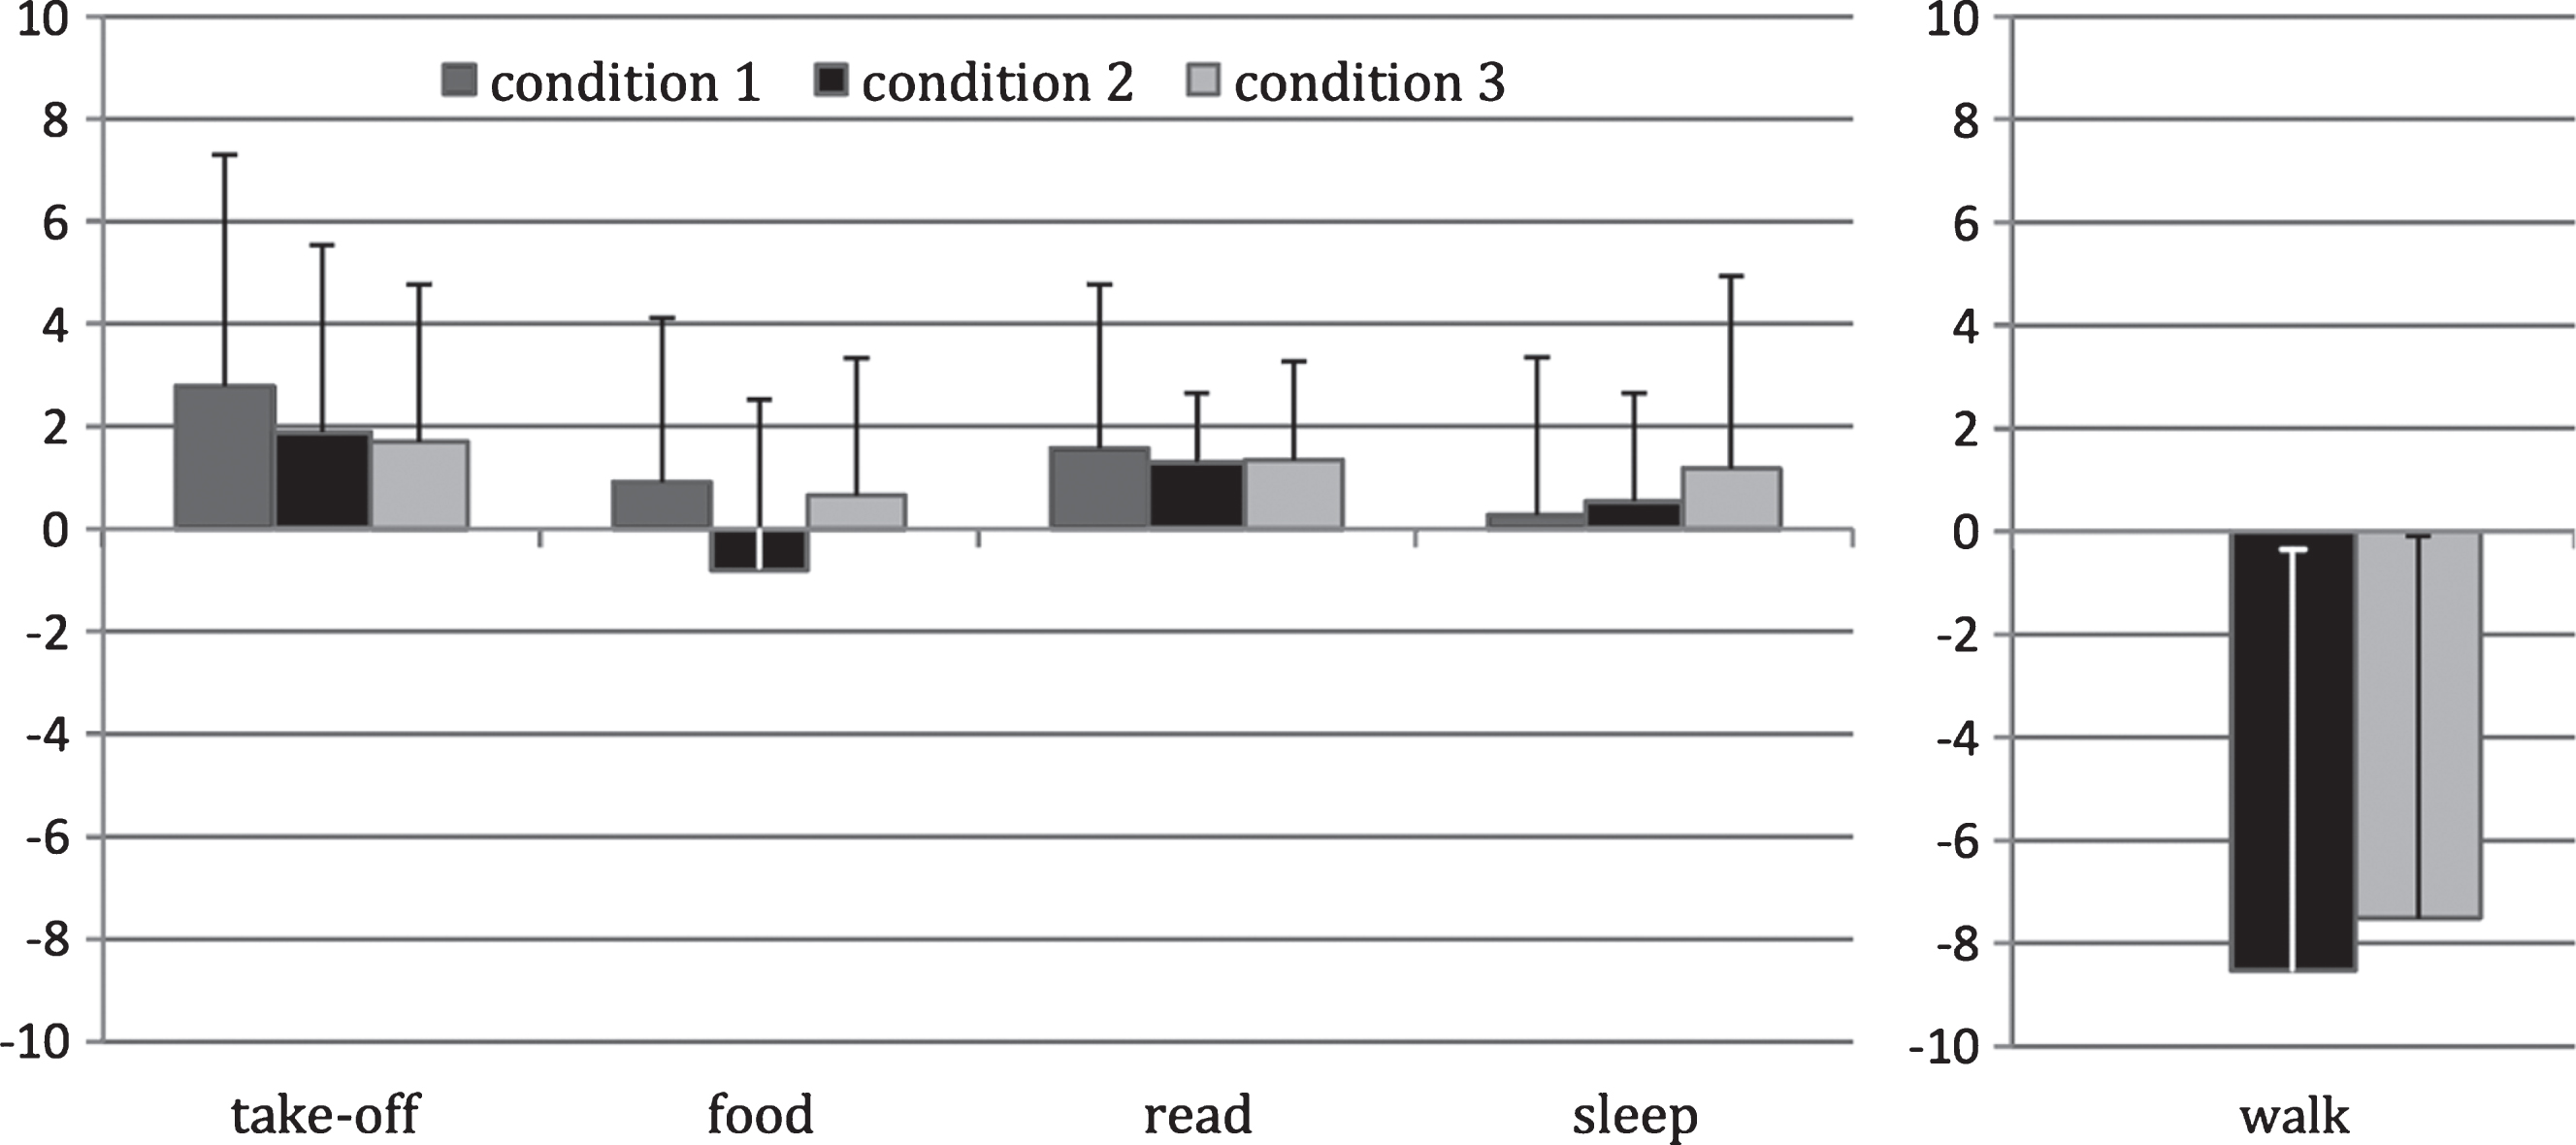
Fig.5
Most refreshing activity according to respondents of the online survey (n = 114), for short flights (<2 h), short-medium flights (2–4 h), medium-long haul flights (4–6 h) and long haul flights (>6 h).