
Technical-tactical behavior analysis of general duty police officers during non-compliant suspect apprehensions: A novel approach to establish minimum force requirements
Abstract
BACKGROUND:
While effective apprehensions of non-compliant suspects are central to public safety, the minimal force needed to transition a suspect from standing to the ground, vital for apprehension success, has not been established.
OBJECTIVE:
To examine the technical-tactical behaviors of general duty police officers during simulated apprehensions and quantify the minimum force required to destabilize non-compliant suspects.
METHODS:
Task simulations conducted with 91 officers were analyzed to identify common grappling movements, strikes, control tactics, and changes in body posture. A separate assessment of 55 male officers aimed to determine the minimum force required for destabilization in five body regions (wrist, forearm, shoulder, mid-chest, and mid-back). Data are presented as mean±standard deviation.
RESULTS:
On average, apprehensions took 7.3±3.2 seconds. While all officers used grappling movements (100%) and the majority employed control tactics (75%), strikes were seldom used (4%). Apprehensions typically began with a two-handed pull (97%; Contact Phase), 55% then attempted an arm bar takedown, followed by a two-handed cross-body pull (68%; Transition/Control Phase), and a two-handed push to the ground (19%; Ground Phase). All officers began in the upright posture, with most shifting to squat (75%), kneel (58%), or bent (45%) postures to complete the apprehension. The minimum force required to disrupt balance differed across body regions (wrist: 54±12 kg; forearm: 49±12 kg; shoulder: 42±10 kg; mid-chest: 44±11 kg; mid-back: 30±7 kg, all P < 0.05), except between the shoulder and chest (P = 0.19).
CONCLUSION:
These findings provide insights that can enhance the design and accuracy of future apprehension evaluations and inform the optimization of law enforcement physical employment standards.
1Introduction
One of the most physically demanding and essential tasks in law enforcement is the arrest of non-compliant suspects [1, 2]. In Canada, 99.9% of police-public encounters were resolved without the use of force, according to recent data from Canada’s national police force [3]. However, in rare instances, where force is necessary, the physical ability of officers becomes critical. Failure to adequately manage non-compliant suspects owing to insufficient physical ability could lead to increased risk for officers and the general public, including potential harm or situational escalation [1]. To mitigate these risks and guide officers in responding effectively to various scenarios, the Canadian Association of Chiefs of Police introduced the National Use of Force Framework (NUFF) [4, 5]. Designed to aid officers from Canadian law enforcement agencies, the NUFF assists in selecting suitable intervention options based on a comprehensive assessment of the suspect’s behavior and characteristics, such as indications of mental illness, drug, or alcohol-induced impairments, along with the overall situation [4, 5]. In specific scenarios, officers may need to employ soft (distraction to facilitate control) or hard (stopping or changing suspect behavior to allow control) physical control techniques to effectively manage non-compliant suspects and ensure the safety of everyone involved [3, 5].
Soft control techniques, such as open-hand strikes, pressure points, and soft takedowns, are primarily used to guide or divert a suspect without causing harm and account for 12% of all Canadian national police intervention options [3]. However, hard control techniques, like hard takedowns and empty-hand strikes, constitute 34% and are employed as more aggressive methods when a stronger response is necessary [3]. Insufficient strength to execute these tasks may increase risks to the health and safety of the officer, co-workers, and general public [1, 2, 6]. As a result, the underlying physical ability required to apprehend a non-compliant suspect effectively and successfully is frequently incorporated into physical employment standards (PES) for frontline operational policing [1, 2, 7–11]. However, the challenge lies in defining the minimum level of muscular strength needed for skill-based tasks, such as apprehending a non-compliant suspect, as these tasks cannot be directly replicated for standardized evaluation.
Over the past three decades, substantial research has been dedicated to developing tests to assess an officer’s ability to control and restrain non-compliant suspects. These studies can be broadly categorized into those that related on self-reported questionnaires [1, 2, 9, 10, 12–14], expert interviews [2, 10, 15], observational methods [16], and those that employed task simulations to identify physical fitness characteristics predictive of job performance [7, 8, 17, 18]. Although these studies have advanced law enforcement practices, policies, and training, they have not culminated in definitive criterion-based standards. This is not a reflection of the empirical rigor of individual studies but rather an emphasis on the complexity of the task and the diversity of methodologies and findings. Further research aimed at establishing such standards is important to ensure accurate assessments of apprehension-related physical abilities across different law enforcement contexts [19].
Recognizing these gaps, additional studies have focused on quantifying the physical strength required to control or restrain a suspect [1, 2, 6, 7, 9, 16, 20]. For instance, the seminal work of Wilmore and Davis [7] first established that men and women could offer 18.2 kg resistance for the left arm and 27.3 kg for the right arm when forced into handcuffs. Building on this, Farenholtz and Rhodes [9, 12] found that officers needed to exert 35 kg of force to physically control inmates (pushing/pulling movements), a finding that has been re-validated using the same experimental protocol [1, 16, 21]. More recent studies have quantified the force necessary to retract a suspect’s arm when in a prone position on the ground than muscular strength, were critical factors associated with successfully retracting a suspect’s arm for handcuffing [20]. However, to date, no study has determined the minimum force required to bring a non-compliant suspect from a standing position to the ground, a critical component of successful suspect apprehensions [1, 18].
The purpose of this study was to employ a two-phase approach to characterize the ‘takedown’ phase during a non-compliant suspect apprehension. A key method employed to achieve this objective was to conduct a technical-tactical behavior analysis of a representative task simulation in a controlled environment (Phase 1). Furthermore, the influence of officer characteristics (age, sex, height, body mass, and body mass index) and years of general duty experience on the frequency and duration of these technical-tactical behaviors were examined. The second objective was to determine the minimum force required to destabilize a non-compliant suspect at various common body contact points used for grappling and control techniques (Phase 2). Ultimately, the findings gleaned from this research aim to inform the creation of a novel PES for law enforcement.
2Methods
2.1Ethical approval
Ethical approval for this study was obtained from the Veritas Independent Review Board (#2019-0703) in accordance with the Tri-Council Policy Statement: Ethical Conduct for Research Involving Humans. All participants provided written informed consent before their participation in the study.
2.2Phase 1: Technical-tactical behavior analysis of non-compliant apprehensions
To characterize non-compliant suspect apprehensions, 91 general duty police officers (74 males, 17 females) and nine male Police Defensive Tactics (PDT) instructors from a national police force participated in a task simulation. This simulation, developed by experts with prior experience in apprehending non-compliant suspects, ensured representation from all Canadian regions, non-commissioned ranks, rural and urban policing environments, various sex/gender, visible minorities, and indigenous populations to mitigate bias [22].
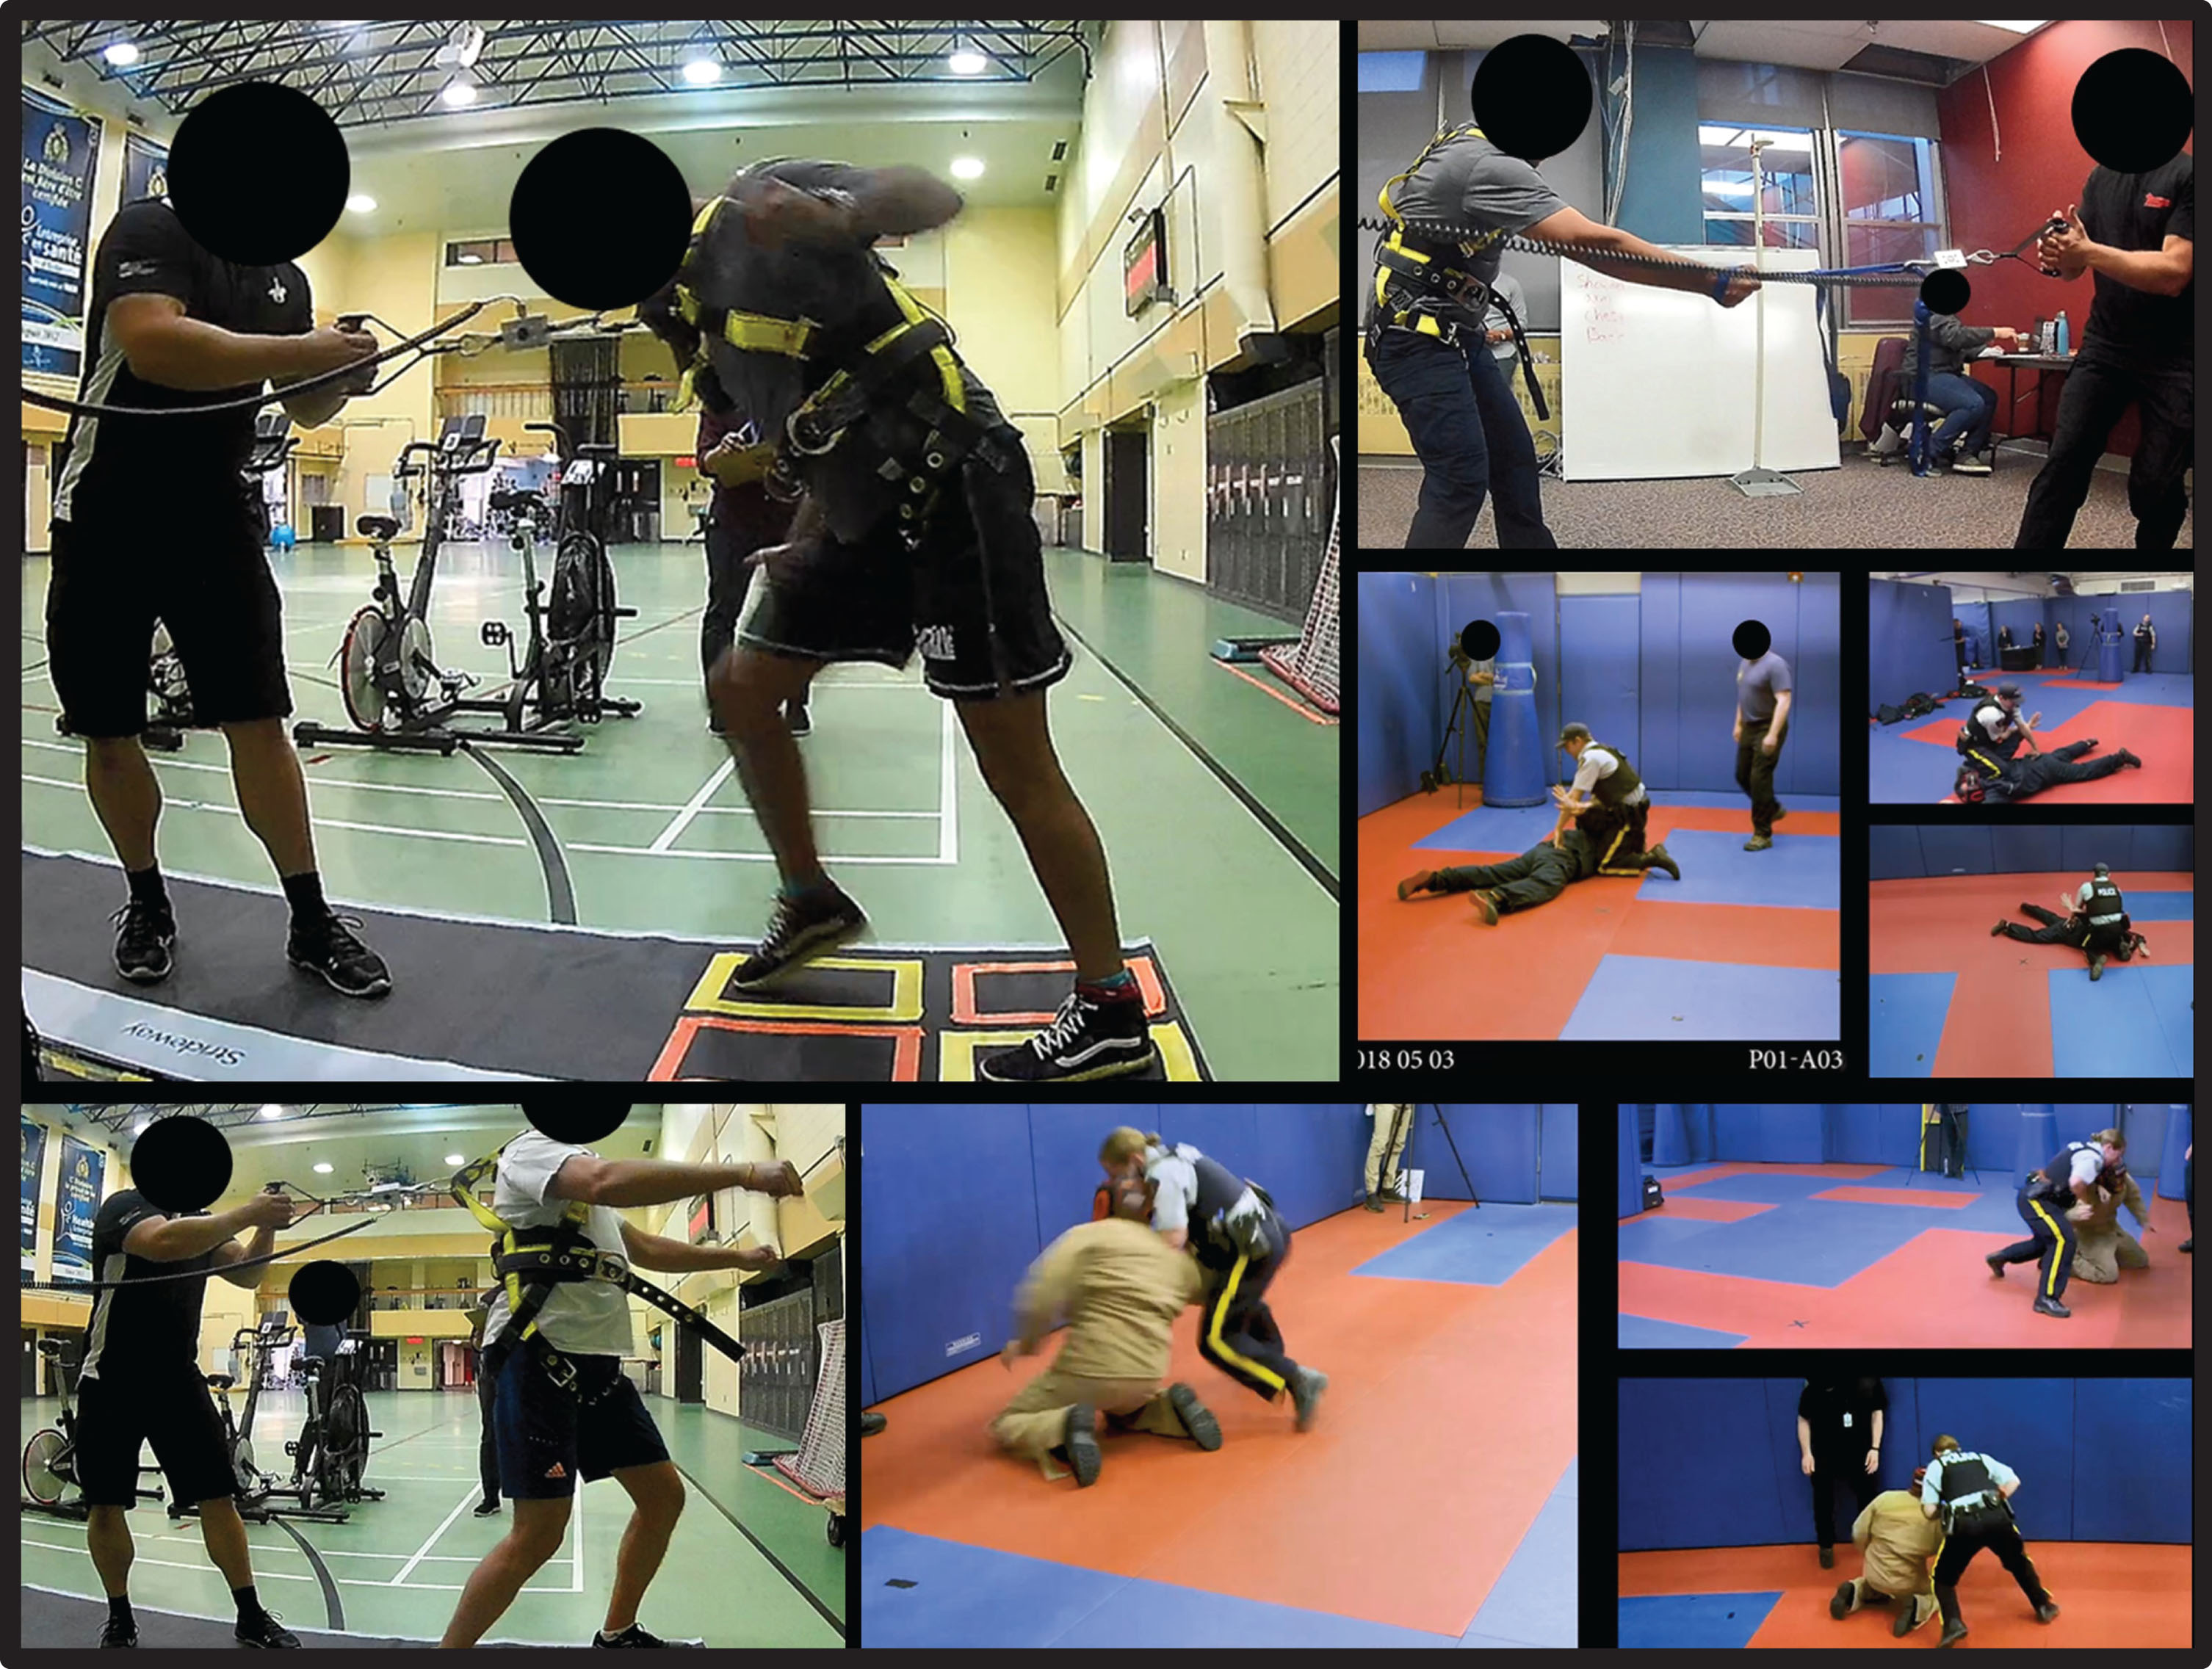
Prior to participation, officers provided demographic data, physical characteristics, and years of general duty experience using an electronic questionnaire. In contrast, the instructors provided demographic data and physical characteristics. These instructors, experienced in offering frequent physical resistance to officers during PDT training, assumed the role of suspects who were most likely to resist arrest. This suspect profile was based on Canada’s national use of force database and insights from experiential experts (male, 173–175 cm tall, and weighing 80–100 kg) [23]. Task simulations were conducted at the National Police Training Academy in Regina, SK, from May to July 2018, in a classroom specially equipped with safety padding on the floors and walls. All officers were briefed in detail about a standardized scenario: the apprehension of a non-compliant suspect with an outstanding warrant, encountered in a bar during an evening patrol. To promote natural responses to the simulated suspect’s behavior, no specific instructions were provided to the officers on tactics or strategies for apprehensions. Actors were instructed to consistently exhibit a transition from passive to active resistance upon officer contact, and to avoid offering their arms for arrest. Their resistance level was defined as maintaining a standing position for a duration of 3 to 5 seconds, contingent on the officer’s actions. Importantly, the actors were not directed to react in a specific manner in response to the movements, strikes, or tactics employed by officers. To ensure safety, several actors were on standby for each session, breaks were provided as required, and a safety officer was always present. Handcuffing was excluded from the simulation to reduce the risk of injury and emphasis was placed on control and takedown techniques to bring suspects to the ground. Task simulations were captured from all angles using three video cameras (Model HDR-SR11, SONY, Minato City, Tokyo, Japan), which were set up on the periphery of the room and centrally on the ceiling to facilitate a comprehensive time-motion analysis, as illustrated in Fig. 1.
Fig. 1
Multiple screenshots showcasing various stages of task simulations and the force quantification protocol in action.
Following participation, officers completed a questionnaire using modified 7-point Likert scales to rate their perceived realism of the simulation’s movements (1 = ‘choreographed’; 4 = ‘sparring’; and 7 = ‘expected on duty’), the actor’s resistance level (1 = ‘none’; 4 = ‘moderate’; and 7 = ‘high’), and their physical exertion level (RPE: 1 = ‘minimal’; 4 = ‘moderate’; and 7 = ‘maximal’). This feedback served to validate the intensity of physical interactions between officers and actors.
2.3Phase 2: Minimum force required to destabilize a non-compliant suspect
In Phase 2, 55 male police officers from Ottawa, ON, and Montreal, QC, participated in trials aimed at identifying the minimum force required to destabilize the most common person to resist arrest. To ensure the validity of the force measurements, participating officers had similar physical characteristics as the suspect profile [23]. These officers were in good health, actively engaged in physical activity, and had no injuries that could hinder their task performance.
Upon arrival, the participants’ standing height and body mass were recorded using a portable stadiometer (Model 213; Seca Industries, Hanover, MD, USA) and a digital weighing scale (Model 869; Seca Health Scales, Hamburg, Germany), respectively. Outfitted with an industrial safety harness (WELKFORDER®, Ningbo Senzhijie Trading Co., Ningbo City, Zhejiang, China) and positioned in a staggered stance, officers resisted forces applied at five body contact points (wrist, elbow, shoulder, mid-chest, and mid-back). This force was applied at a 90 degree angle via a strap connected to a digital force gauge featuring an external load cell (Chatillon DFSII-500, ITM Instruments Inc., Sainte-Anne-de-Bellevue, QC, Canada) until a compensatory step was taken, indicating the loss of balance (Fig. 1). To ensure accurate minimum force measurements, officers were instructed to avoid excessively counterbalancing the applied forces. Each participant completed ten trials for every contact point, resulting in 50 trials per individual. All but two trials (due to participant exemption requests) were video recorded (Model HDR-SR11, SONY, Minato City, Tokyo, Japan). To validate that the peak force was the appropriate metric, a subset of officers (n = 12) performed the trials on a Tekscan Strideway Pressure Sensor (Tekscan Inc., Boston, MA, USA) connected to the force gauge and load cell. The exact moment the back foot was lifted from the sensor mat indicated a loss of balance.
2.4Data and statistical analysis
2.4.1Phase 1: Technical-tactical behavior analysis
Data Collection and Participant Comparison: A comprehensive technical-tactical behavior analysis was performed on the simulation data, from which time-motion information was extracted. This data was gathered using Microsoft Excel (Microsoft Office 365; Redmond, WA, USA) and analyzed through a custom-designed matrix to determine the frequency and duration of specific grappling movements, strikes, and control tactics employed by officers, as well as associated changes in body posture, all of which are described in Table 1.
Table 1
Overview of grappling movements, strikes, control tactics, and body postures assessed during the technical-tactical behavior analysis
| Grappling movements | Strikes | Control tactics | Body postures |
| 1-hand pull Using one hand to grasp and pull the opponent towards oneself or off-balance. | Punch A strike delivered with a closed fist, targeting the face, torso, or body. | Oleoresin capsicum spray Used temporarily to incapacitate by causing intense eye and skin irritation. | Upright Standing straight with a vertical torso, head aligned with the spine. |
| 2-hand pull Using both hands to draw the opponent closer or destabilize their stance. | Elbow A close-quarter strike using the elbow to target the head or chest. | Use of force tools Devices or weapons, like batons or tasers, to manage or control resistance. | Bent Leaning forward with a flexed torso, often at the waist. |
| 1-hand cross-body pull Grasping the opponent with one hand across the body, pulling diagonally to disrupt balance. | Kick An extended leg movement, usually targeting the legs, body, or head. | Wristlocks The wrist is twisted, leveraging pain compliance to control. | Squat Bending at the knees with heels grounded and buttocks near the heels. |
| 2-hand cross-body pull Using both hands to seize and pull diagonally across the body. | Knee A thrusting motion using the knee, commonly aimed at the torso or thigh. | Nose-to-toes takedown A maneuver that focuses on leveraging an individual’s forward momentum to ground them. | Kneel Resting on one’s knees, typically with the buttocks resting on the heels. |
| 1-hand push Applying force with one hand to push away or off-balance. | 1-leg takedown Seizing one leg, usually the lead leg, to unbalance and bring an individual to the ground. | Mount Straddling an individual’s torso while they’re on their back for control. | |
| 2-hand push Using both hands to exert force, propelling backward or destabilizing one’s position. | 2-leg takedown Capturing both legs at one time, often driving forward, to take an individual down. | Prone Lying face down on the ground. | |
| Armbar takedown Leveraging the arm against a joint, extending it, to control or bring an individual to the ground. | |||
| Body lock takedown Wrapping arms around the torso, securing a grip, and take an individual down. | |||
| 1-leg trip (inside/outside) Using one leg to contact another individual’s from from either its inner or outer side, causing a loss of balance. | |||
| 2-leg trip (sweep) Using the leg to sweep both of an individual’s legs out from under them, causing a takedown. | |||
Physical characteristics were compared across various groups: between male and female officers, between male officers and actors, between female officers and actors, and between the combined officer sample (comprising both males and females) and actors. When the normality assumption was met, independent two-tailed t-tests were employed to assess differences between groups. When the homoscedasticity assumption of equal variances was not met, Welch’s t-test was used, whereas the Wilcoxon rank-sum test served as a non-parametric alternative for analyzing median differences when normality was not assumed.
Frequency, duration and behavior pattern recognition: To examine the frequency distribution (percentage of officers) across behavior categories, namely grappling movements, strikes, control tactics, and observed body postures, a chi-square test of independence was employed. This test determined whether there were significant variations in the adoption of various technical-tactical behaviors among officers. For behaviors within categories that had sufficient expected frequencies, pairwise comparisons were conducted using additional chi-square tests to identify specific behaviors that significantly deviated from an expected uniform distribution. In instances where the expected frequencies were low, such as with the strike category, Fisher’s Exact Test was applied to assess significance. Subsequently, Principal Component Analysis (PCA) was conducted to capture the multivariate nature of officer behaviors during the simulations [24]. The objective was to uncover the underlying patterns and principal components that best represented observed variance. Based on the PCA results, K-means clustering was applied to stratify officers into distinct behavioral clusters [25, 26], which allowed for the categorization of officers based on their techniques and postural changes. This method was chosen because of its computational efficiency and suitability for data assumed to form roughly spherical clusters of similar size. Both the Elbow Method and silhouette score metrics were used to optimize the clustering process and determine the optimal number of clusters [27–29]. This analysis excluded strikes owing to their infrequent use and only included the five most frequent behaviors within each category.
The mean duration of technical-tactical behaviors was analyzed using the Friedman test. Post hoc pairwise comparisons were conducted using Dunn’s test for multiple comparisons to determine whether the durations differed between the categories. Friedman’s test was also employed to examine differences in duration within each category by applying the same post hoc procedure. The analysis excluded strikes owing to their infrequent use, and certain grappling movements and control tactics were omitted if they had one or zero observations.
Correlational analysis of officer characteristics and behaviors: Spearman’s rank-order correlations were used to examine the relationships between officer characteristics, years of experience, and various outcomes, such as the frequency and duration of different behaviors and total apprehension time. This non-parametric method was chosen because of its robustness in analyzing relationships that do not meet the assumption of normality [30].
Officer perceptions and actor consistency in simulations: The officers’ perceptions during the task simulations were measured in terms of realism, RPE, and perceived resistance. Additionally, Spearman’s rank-order correlations were used to explore potential associations between these perceptual measures and various officer variables, such as years of experience, behavior frequency and duration, total apprehension time, and actor ID, to determine whether the actor involved influenced these metrics. To further validate the consistency and reproducibility of the simulations across different actors, Kruskal-Wallis tests were employed. It was important to confirm that the involvement of multiple actors did not unduly influence or bias officers’ actions and perceptions.
2.4.2Phase 2: Minimum force quantification analysis
To assess difference in physical characteristics between officers and force applicators, the same statistical tests were employed as Phase 1. For the force quantification assessment, the peak force (kg) applied during the trials at each body contact point was measured. The data analysis consisted of four steps. First, a researcher reviewed and classified all trial videos using an author-developed stratification chart (0 = upright start; 1 = anticipation; 2 = excessive counterbalance; 3 = mixed anticipation/counterbalance). Second, all trials classified as ‘2’ on the categorization chart (i.e., excessive counterbalance) were removed to avoid inflating the perceived minimum force required to destabilize a non-compliant suspect. Trials classified as ‘3’ were independently reviewed by a second investigator, and those that exhibited excessive counterbalance were removed. Third, a one-way ANOVA with the repeated factor of peak force (10 trials) was conducted to examine the potential learning effects at each body contact point (wrist, forearm, shoulder, mid-chest, and mid-back). If a significant effect was observed, post-hoc comparisons were performed using paired two-tailed t-tests. Fourth, the absolute deviation around the median was used with a factor of 2.5, a moderately conservative approach recommended for detecting outliers [31]. Identified outliers were reviewed and removed only in instances in which the participant fell during the trial. Finally, a mixed-effects model was used to assess the differences in force between each body contact point, and post-hoc comparisons were performed using Tukey’s multiple comparison test.
For both phases, descriptive statistics are presented as the mean (standard deviation [SD]), unless otherwise indicated. All statistical analyses and figures were generated using RStudio: Integrated Development for R (RStudio 4.30, Boston, MA, USA) and GraphPad Prism (Version 9, Dotmatics, La Jolla, CA, USA). The significance level (alpha) for all analyses was set at 0.05.
3Results
3.1Phase 1: Characterization of officer behaviors during simulated apprehensions
3.1.1Participant characteristics
Table 2 provides detailed demographic and physical characteristics of police officers and actors. While there were no differences in age, height, body mass, and body mass index for the entire officer sample compared to the actors (all P > 0.05), differences emerged between male officers, female officers, and actors. Specifically, male officers were younger than the actors (P = 0.04), although their height, body mass, and body mass index were comparable (all P > 0.05). In contrast, female officers were shorter and weighed less than the actors (both P < 0.05), whereas age and body mass index were similar (both P > 0.05). When male and female officers were compared, male officers were taller and heavier than their female counterparts, resulting in a greater body mass index (all P < 0.05). However, female officers were more experienced in general duty policing than were male officers (P = 0.006).
Table 2
Characteristics of police officers and actors in Phase 1 (task simulations) and of officers and force applicators in Phase 2 (force quantification)
| PHASE 1 | PHASE 2 | |||||
| TASK SIMULATIONS | FORCE QUANTIFICATION | |||||
| Variable | Male Officers | Female Officers | All Officers | Actors | Officers | Force Applicators |
| Total (n) | 74 | 17 | 91 | 10 | 55 | 6 |
| Age (years) | 37 (8)* | 39 (6) | 37 (8) | 41 (6) | 41 (8)‡ | 34 (6) |
| Height (cm) | 181 (6) | 169 (8)* † | 179 (8) | 178 (7) | 179 (4) | 176 (2) |
| Body mass (kg) | 94 (15) | 75 (14)* † | 90 (17) | 86 (7) | 88 (7) | 79 (13) |
| Body mass index (kg/m2) | 29 (4) | 26 (3) | 28 (4) | 27 (3) | 28 (2) | 26 (4) |
| General duty experience (years) | 8 (4) § | 13 (7) | 9 (5) | –– | –– | –– |
Notes: All data are presented as mean (standard deviation). Body mass index: mass [kg]/height [m]2. The actors that played the role of the suspect in the simulation were experienced PDT instructors. Two actors did not provide their age, height, and body mass, whereas police officers did not provide data on age (n = 5), height (n = 1), body mass (n = 1), or years of experience in general duty policing (n = 1). All police officers involved in the force quantification were male. Force applicators refer to individuals who applied force until a compensatory backward or forward step was taken (off balance). *Significantly lower compared to actors. †Significantly lower than that of male officers. §Significantly lower than that of female officers. ‡Significantly greater compared to force applicators. All P < 0.05.
3.1.2Technical-tactical behavior frequency
Figure 2 provides a detailed breakdown of the frequency distribution across behavior categories, highlighting the adoption rates of various grappling movements, control tactics, strikes, and body postures. Chi-square analysis indicated significant variations in the adoption of grappling movements, strikes, and control tactics (χ2 = 74.8, P < 0.001). Every officer employed at least one grappling technique, whereas 75% performed at least one control tactic during the apprehension. In contrast, strikes were the least employed, with only 4% of officers using them during the simulations. Furthermore, no significant correlations emerged between officers’ characteristics and years of experience in relation to the number of specific grappling movements and control tactics performed by officers or the specific body postures adopted during the simulations (Table 3).
Fig. 2
Frequency distribution of technical-tactical behaviors among officers during task simulations. This figure displays the proportion of officers adopting various technical-tactical behaviors, categorized into grappling movements (blue), control tactics (red), strikes (purple), and body postures (black/grey). The length of each bar represents the proportion of officers exhibiting each behavior within its category, with the adoption frequency denoted by a color gradient from dark (frequent) to light (infrequent) shades. Behaviors significantly deviating from the expected uniform distribution are marked with an asterisk (*), indicating a significant difference (P < 0.05) and highlighting distinct tendencies in officer behavior during simulations.
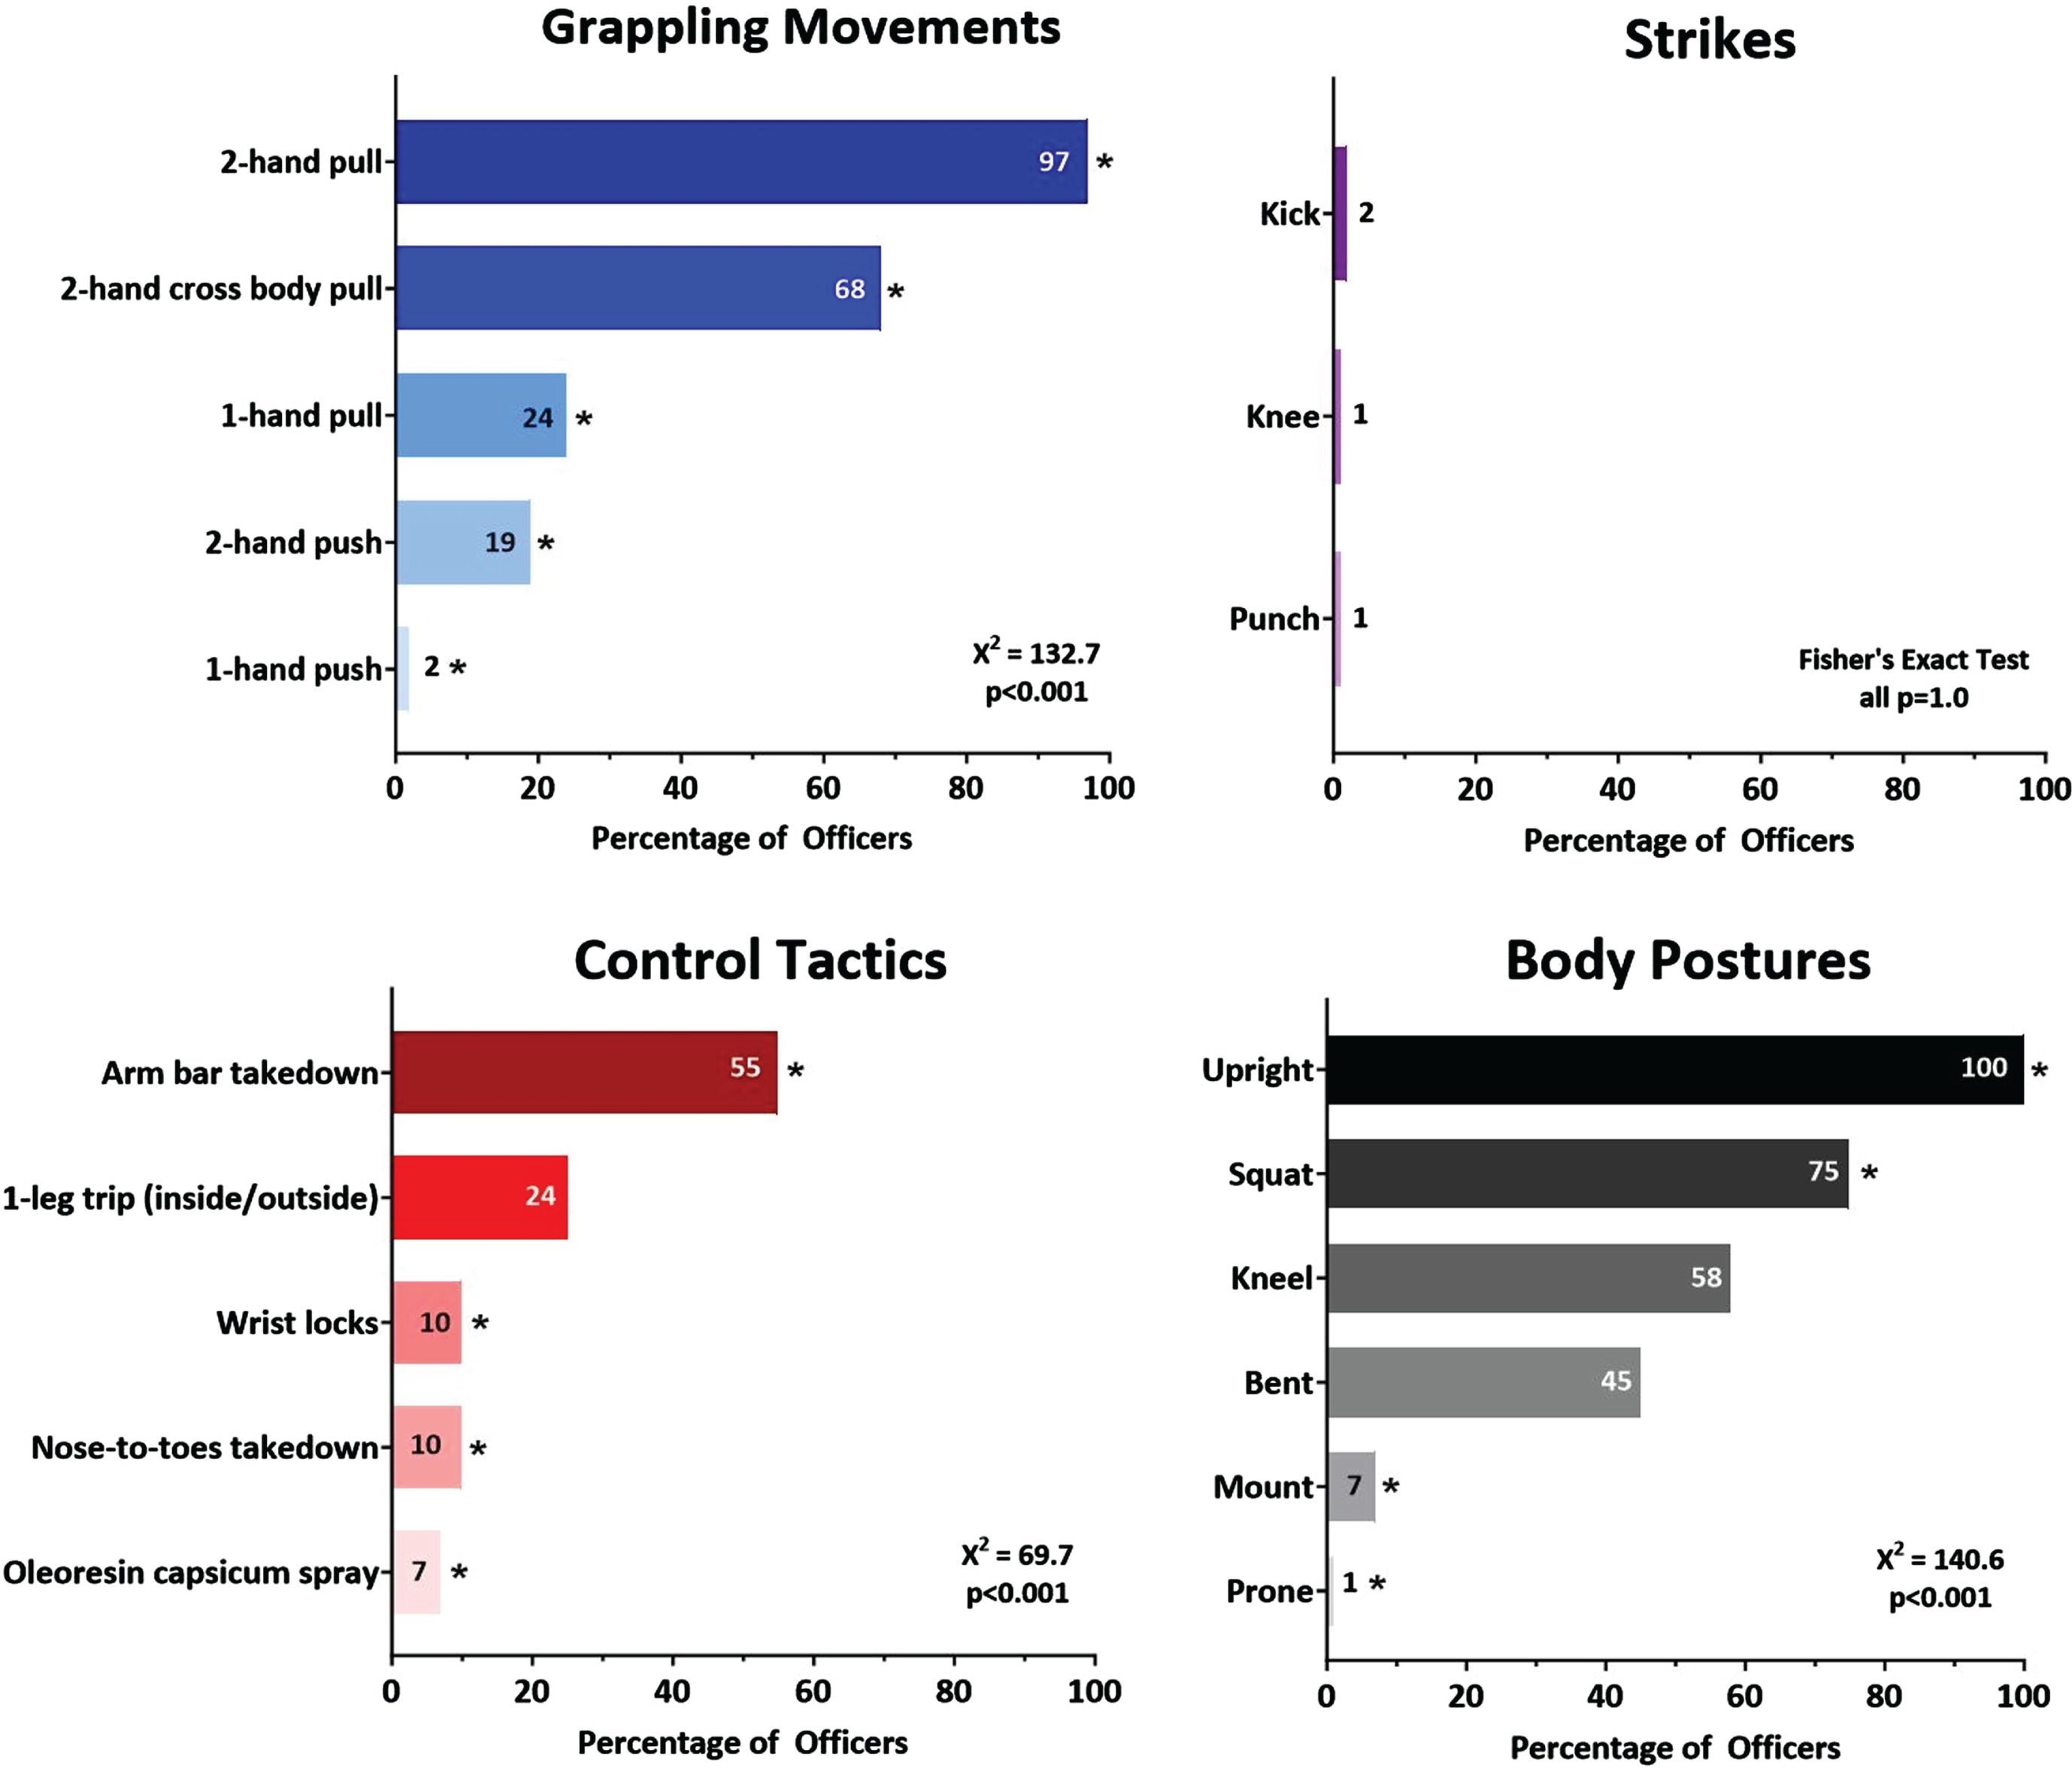
Table 3
Spearman correlations between officer characteristics, years of general duty experience, and actors in relation to behavior counts and duration, as well as total apprehension time
| Variable Pairs | Spearman’s rho | P-Value |
| Grappling Movements (#) | ||
| Age (years) | 0.147 | 0.179 |
| Sex (M/F) | –0.003 | 0.978 |
| Height (cm) | –0.041 | 0.711 |
| Body mass (kg) | –0.004 | 0.970 |
| Body mass index (kg/m2) | 0.051 | 0.642 |
| General duty experience (years) | 0.017 | 0.880 |
| Actor ID | –0.055 | 0.618 |
| Grappling Movements (s) | ||
| Age (years) | 0.041 | 0.710 |
| Sex (M/F) | 0.051 | 0.643 |
| Height (cm) | –0.014 | 0.900 |
| Body mass (kg) | 0.002 | 0.985 |
| Body mass index (kg/m2) | 0.001 | 0.997 |
| General duty experience (years) | –0.059 | 0.589 |
| Actor ID | –0.014 | 0.895 |
| Control Tactics (#) | ||
| Age (years) | –0.020 | 0.857 |
| Sex (M/F) | –0.045 | 0.680 |
| Height (cm) | 0.179 | 0.102 |
| Body mass (kg) | 0.159 | 0.146 |
| Body mass index (kg/m2) | 0.119 | 0.277 |
| General duty experience (years) | 0.076 | 0.488 |
| Actor ID | –0.072 | 0.515 |
| Control Tactics (s) | ||
| Age (years) | 0.109 | 0.322 |
| Sex (M/F) | –0.088 | 0.423 |
| Height (cm) | 0.03 | 0.784 |
| Body mass (kg) | –0.01 | 0.930 |
| Body mass index (kg/m2) | –0.069 | 0.529 |
| General duty experience (years) | 0.068 | 0.537 |
| Actor ID | 0.039 | 0.722 |
| Body Postures (#) | ||
| Age (years) | –0.048 | 0.662 |
| Sex (M/F) | –0.024 | 0.827 |
| Height (cm) | 0.040 | 0.711 |
| Body mass (kg) | 0.064 | 0.556 |
| Body mass index (kg/m2) | 0.080 | 0.466 |
| General duty experience (years) | –0.082 | 0.455 |
| Actor ID | 0.045 | 0.687 |
| Total Apprehension Time (s) | ||
| Age (years) | 0.136 | 0.214 |
| Sex (M/F) | 0.147 | 0.178 |
| Height (cm) | –0.033 | 0.760 |
| Body mass (kg) | –0.019 | 0.860 |
| Body mass index (kg/m2) | 0.002 | 0.985 |
| General duty experience (years) | 0.007 | 0.987 |
| Actor ID | –0.043 | 0.694 |
Notes: Spearman’s rho denotes the strength and direction of the relationship between the paired data. All correlations were greater than P = 0.05, indicating no statistically significant associations. Actor ID: Refers to multiple actors (identified with specific IDs) that participated in the study.
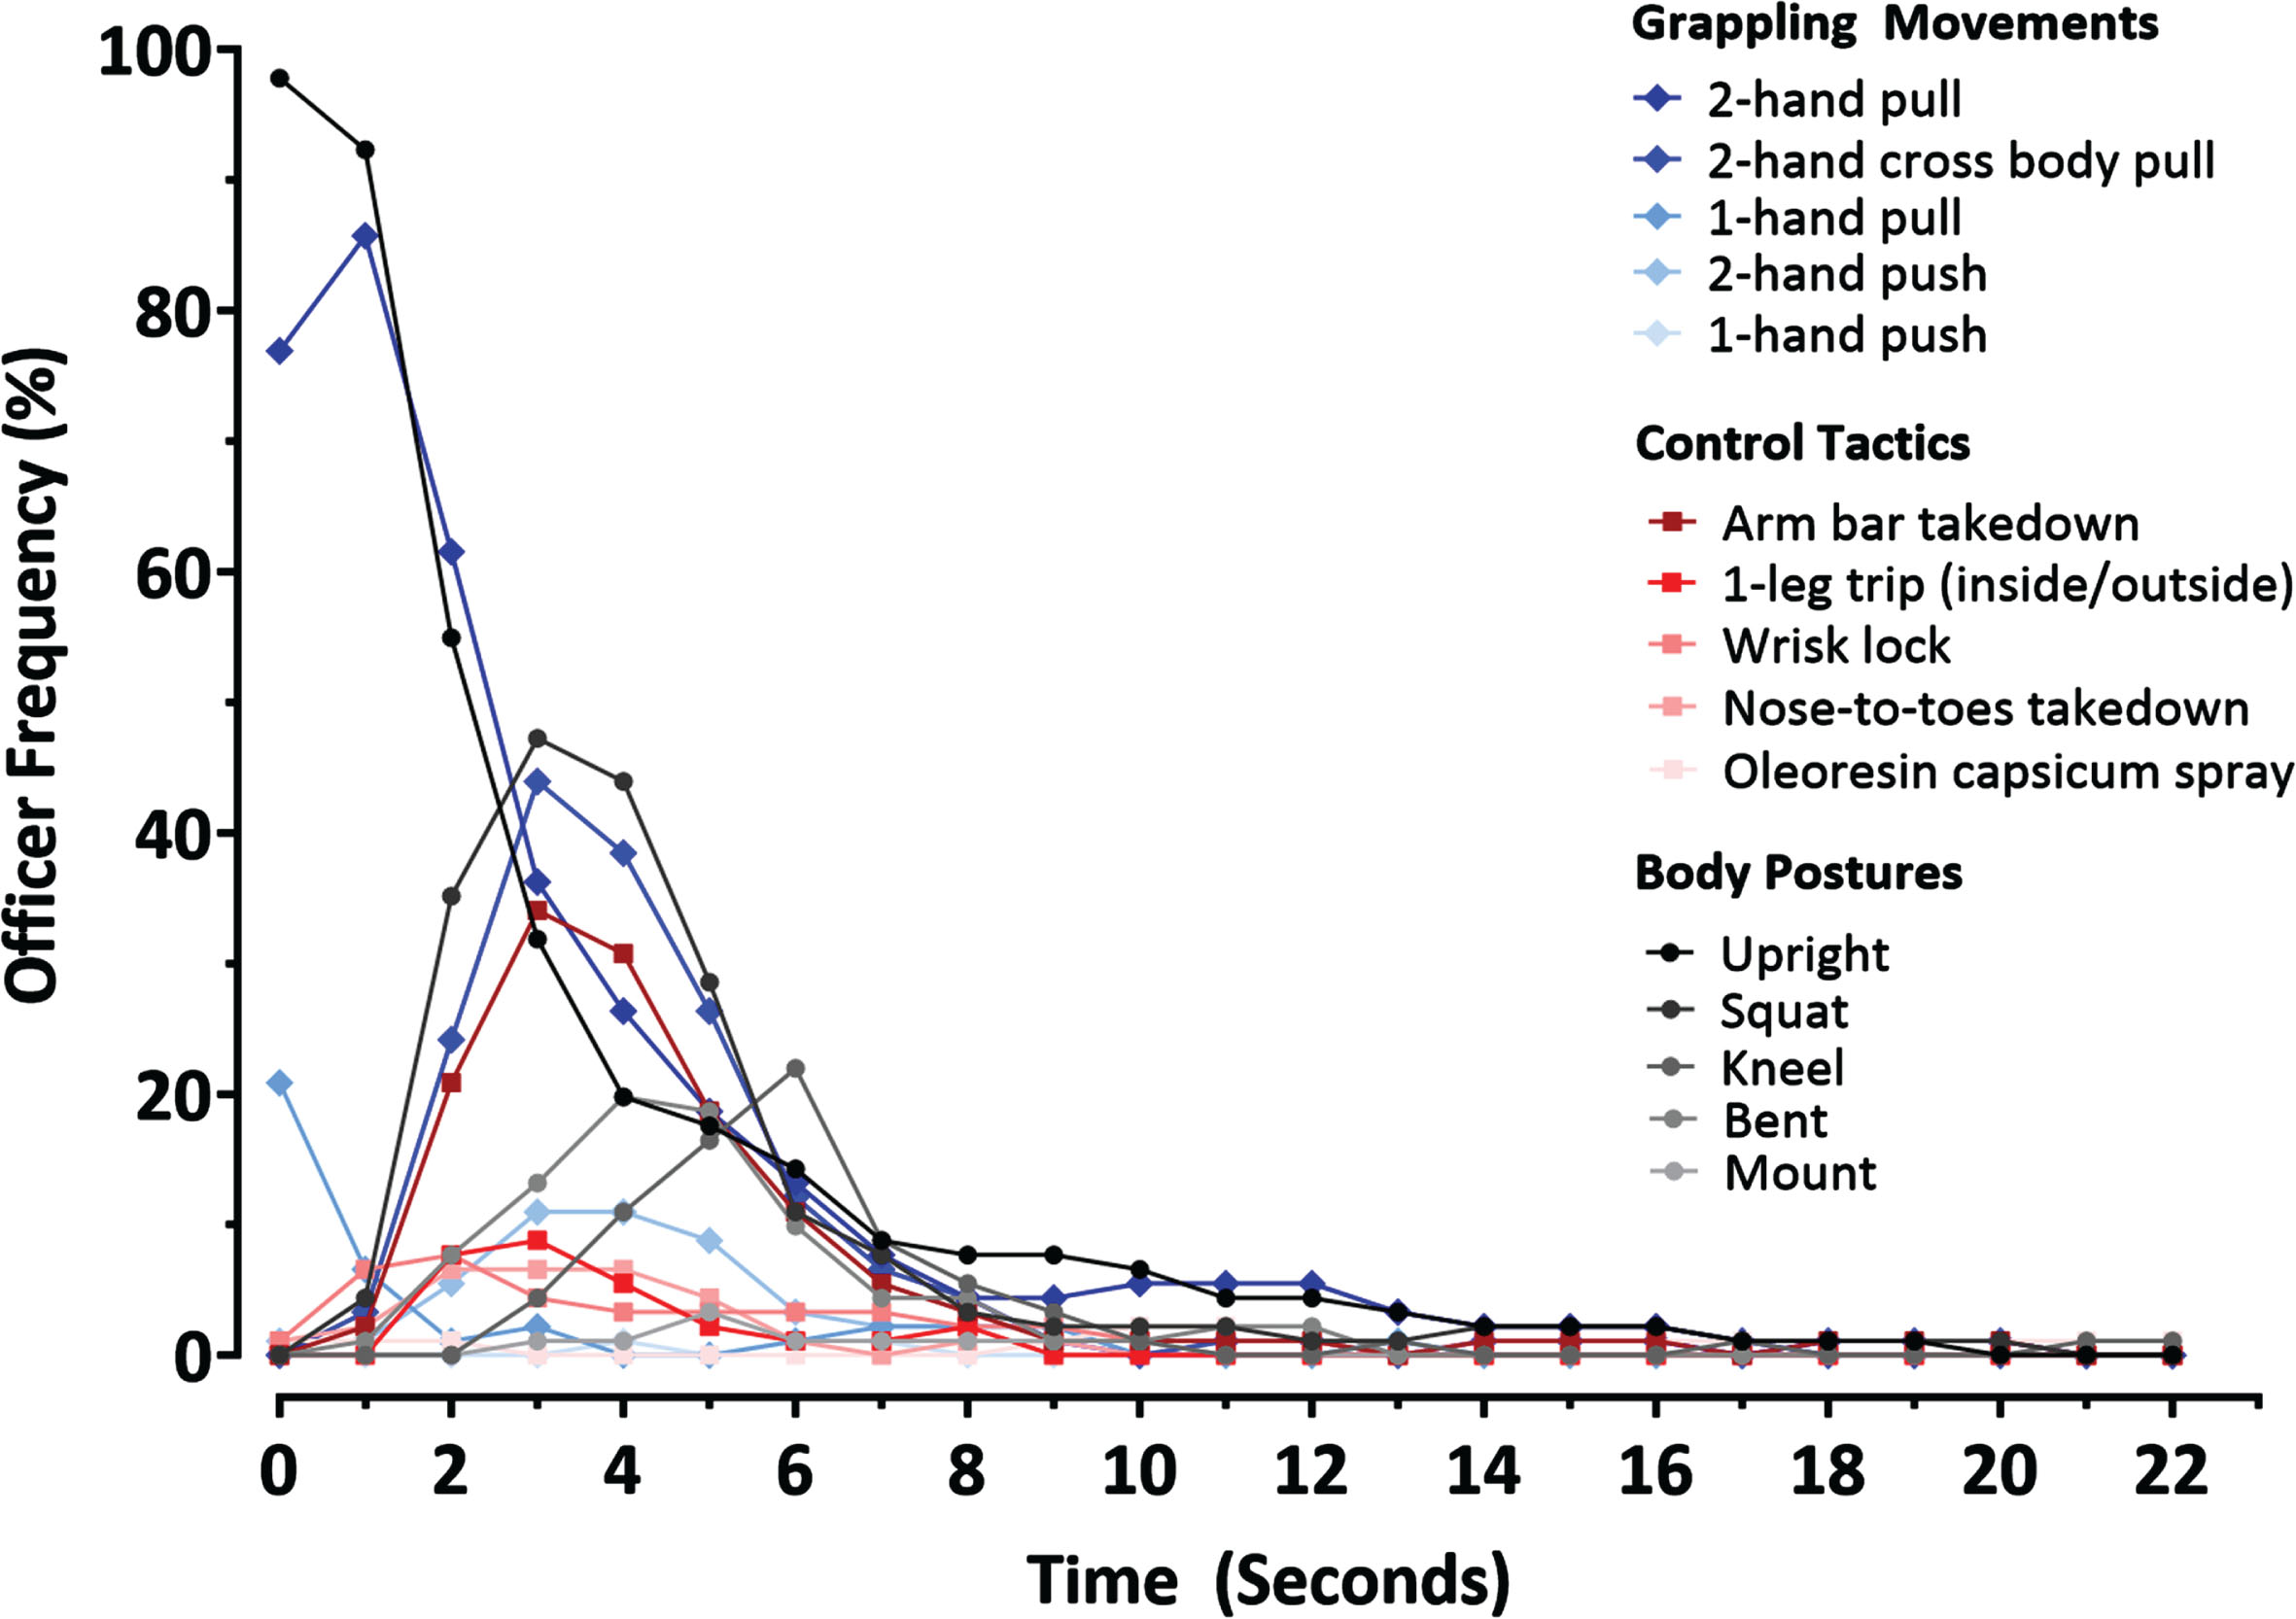
Figure 3 provides a temporal overview depicting the relative frequency of officers executing each grappling movement, control tactic, and body posture over a span of 22 seconds, which represents the longest apprehension. This dataset set the stage for the subsequent PCA and cluster analyses, which aimed to define distinct officer behavioral patterns during the simulations.
Fig. 3
Temporal distribution of technical-tactical behaviors during task simulations. This figure depicts the relative frequency of officers executing each grappling movement, control tactic, and observed body posture, over a maximum performance time of 22 seconds. The displayed data informed PCA and cluster analysis, elucidating distinct officer behavioral patterns during apprehensions.
3.1.3Cluster analysis of officer behaviors
PCA identified three principal components (PC) that accounted for 96.3% of the observed variance during the simulations. The PCs were divided into PC1 (66.9%), PC2 (21.2%), and PC3 (8.2%). Cluster analysis subsequently demonstrated the presence of four distinct behavioral clusters among the officers. Officers grouped under ‘Cluster 0,’ which comprised 53% of the sample, showed a pattern that included grappling movements, primarily 1-hand pulls and 2-hand pushes. Their control tactics mainly consisted of wrist locks, nose-to-toe takedowns, and 1-leg trips. Throughout the simulation, officers maintained a predominantly bent posture. ‘Cluster 1’ officers, encompassing 20% of the sample, mainly used 2-hand and 1-hand cross-body pulls when grappling, which was used in tandem with the arm bar takedown as the preferred control tactic and squatting posture for the duration of the simulation. ‘Cluster 2’ officers, representing 13% of the participants, primarily used the 2-hand pull for grappling. However, they rarely employed control tactics and remained primarily in an upright posture. Lastly, the ‘Cluster 3’ group, equally representing 13% of the sample, employed diverse grappling techniques but unique control tactics. The key observation in this group was the use of oleoresin capsicum spray, both early and later in the simulation, and typically adopting a kneeling posture. To validate these cluster categorizations, one-way ANOVA tests were conducted, which showed significant variances across the different categories within the identified clusters (all P < 0.05).
3.1.4Technical-tactical behavior duration
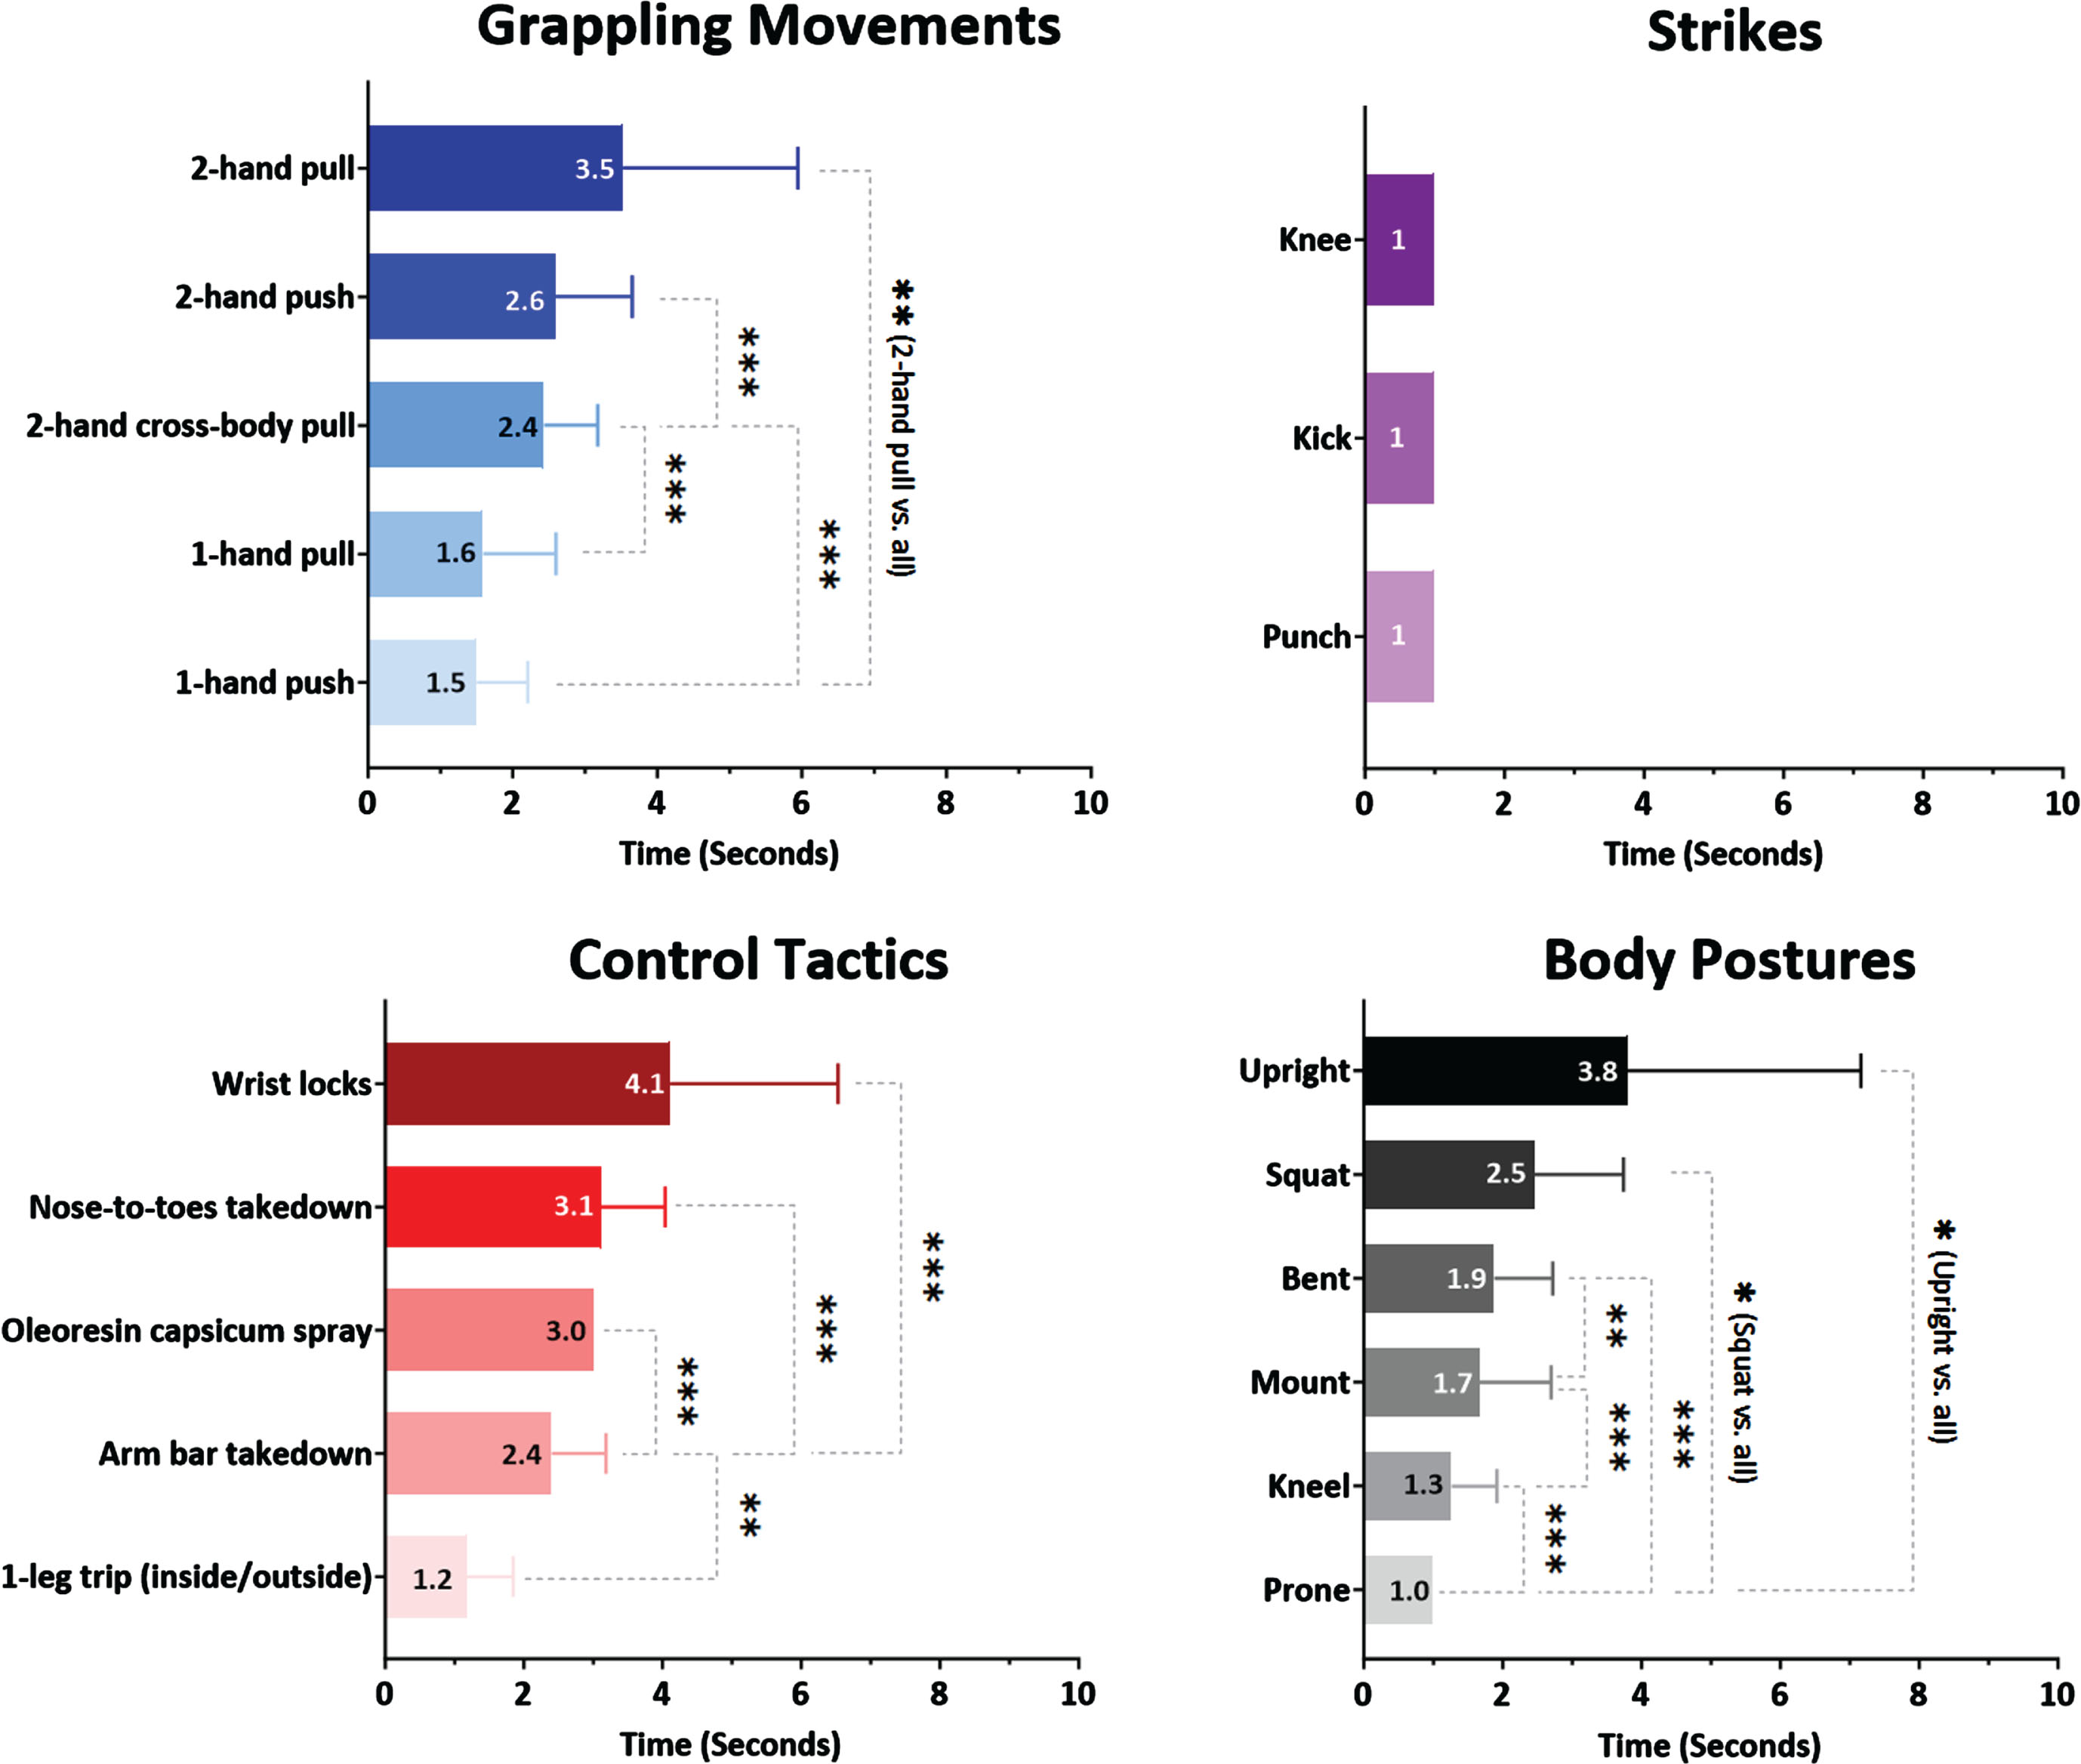
The average duration of task simulations was 7.3±3.2 seconds. When examining the durations across behavior categories, a significant difference was observed (Friedman’s statistic = 15.8, P < 0.001). Specifically, grappling movements were the most time-consuming, averaging 6.2±2.6 seconds. Control tactics followed, with an average duration of 2.2±1.7 seconds. In contrast, the strikes were relatively brief, lasting for only 0.1±0.2 seconds. These durations differed significantly across all the categories (all P < 0.05). Figure 4 illustrates these findings, presenting the mean duration of each grappling movement, control tactic, and body posture, in descending order. Further analysis demonstrated that the durations of specific grappling movements (Friedman’s statistic = 214.1, P < 0.001), control tactics (Friedman’s statistic = 74.4, P < 0.001), and body posture (Friedman’s statistic = 257.9, P < 0.001) were significantly different. However, such variations were not observed within the strike category (Friedman statistic = 2.0, P = 0.367). Furthermore, officer characteristics and years of service were not associated with the duration of grappling movements, control tactics, body postures, or total apprehension time (Table 3).
Fig. 4
Mean duration of technical-tactical behaviors during task simulations. This figure displays the mean duration and standard deviation of various technical-tactical behaviors performed by officers, categorized into grappling movements (blue), control tactics (red), strikes (purple), and body postures (black/gray). Each bar illustrates the mean duration of a specific behavior within its category, with darker to lighter shades within each category representing longer to shorter durations, respectively. The significance of differences in mean durations between behaviors is indicated by asterisks adjacent to the bars, with *P < 0.05, **P < 0.01, and ***P < 0.001.
3.1.5Officer perception analysis
Table 4 presents officers’ perceptions during task simulations relative to their characteristics and years of general duty experience. On average, officers rated the realism of the task simulations at 5.1±1.5, which falls somewhere between ‘sparing’ and ‘expected while on duty’. However, this assessment of realism was not tied to any of the officer’s characteristics or years of experience, (all P > 0.05). In terms of exertion, officers described their effort as ‘minimal-to-moderate,’ with an RPE of 3.0±1.2. This measure also lacked a significant correlation with officer characteristics or years of experience (all P > 0.05). The perceived level of resistance offered by the actors was rated at 3.7±1.1, suggesting low-to-moderate resistance levels. Mirroring the other metrics, this was also not correlated with officer characteristics and experience (P > 0.05).
Table 4
Spearman correlations between officer characteristics, years of general duty experience, and actors in relation to perceived realism, RPE, and actor resistance
| Variable Pairs | Spearman’s rho | P-Value |
| Realism | ||
| Age (years) | 0.024 | 0.831 |
| Sex (M/F) | 0.072 | 0.509 |
| Height (cm) | 0.021 | 0.845 |
| Body mass (kg) | –0.052 | 0.630 |
| Body mass index (kg/m2) | –0.039 | 0.717 |
| General duty experience (years) | –0.198 | 0.069 |
| Actor ID | 0.178 | 0.108 |
| Physical Exertion | ||
| Age (years) | –0.078 | 0.488 |
| Sex (M/F) | –0.065 | 0.549 |
| Height (cm) | 0.051 | 0.642 |
| Body mass (kg) | –0.069 | 0.529 |
| Body mass index (kg/m2) | –0.116 | 0.289 |
| General duty experience (years) | –0.130 | 0.238 |
| Actor ID | 0.207 | 0.059 |
| Actor Resistance | ||
| Age (years) | –0.052 | 0.831 |
| Sex (M/F) | –0.110 | 0.509 |
| Height (cm) | 0.133 | 0.845 |
| Body mass (kg) | 0.055 | 0.630 |
| Body mass index (kg/m2) | –0.014 | 0.717 |
| General duty experience (years) | –0.085 | 0.069 |
| Actor ID | 0.007 | 0.948 |
Notes: Spearman’s rho denotes the strength and direction of the relationship between the paired data. All correlations were greater than P = 0.05, indicating no statistically significant associations. Actor ID: Refers to multiple actors (identified with specific IDs) that participated in the study.
3.1.6Actor influence on behaviors and perception
Results from the Kruskal-Wallis test showed that multiple actors did not significantly influence the frequency and duration of technical-tactical behaviors or their perceptual assessments of the simulations (all P > 0.05). Furthermore, no significant correlations were identified between the actor and any technical-tactical behavior component or with the perceptual feedback received (all P > 0.05, Tables 3 and 4).
3.2Phase 2: Minimum force quantification
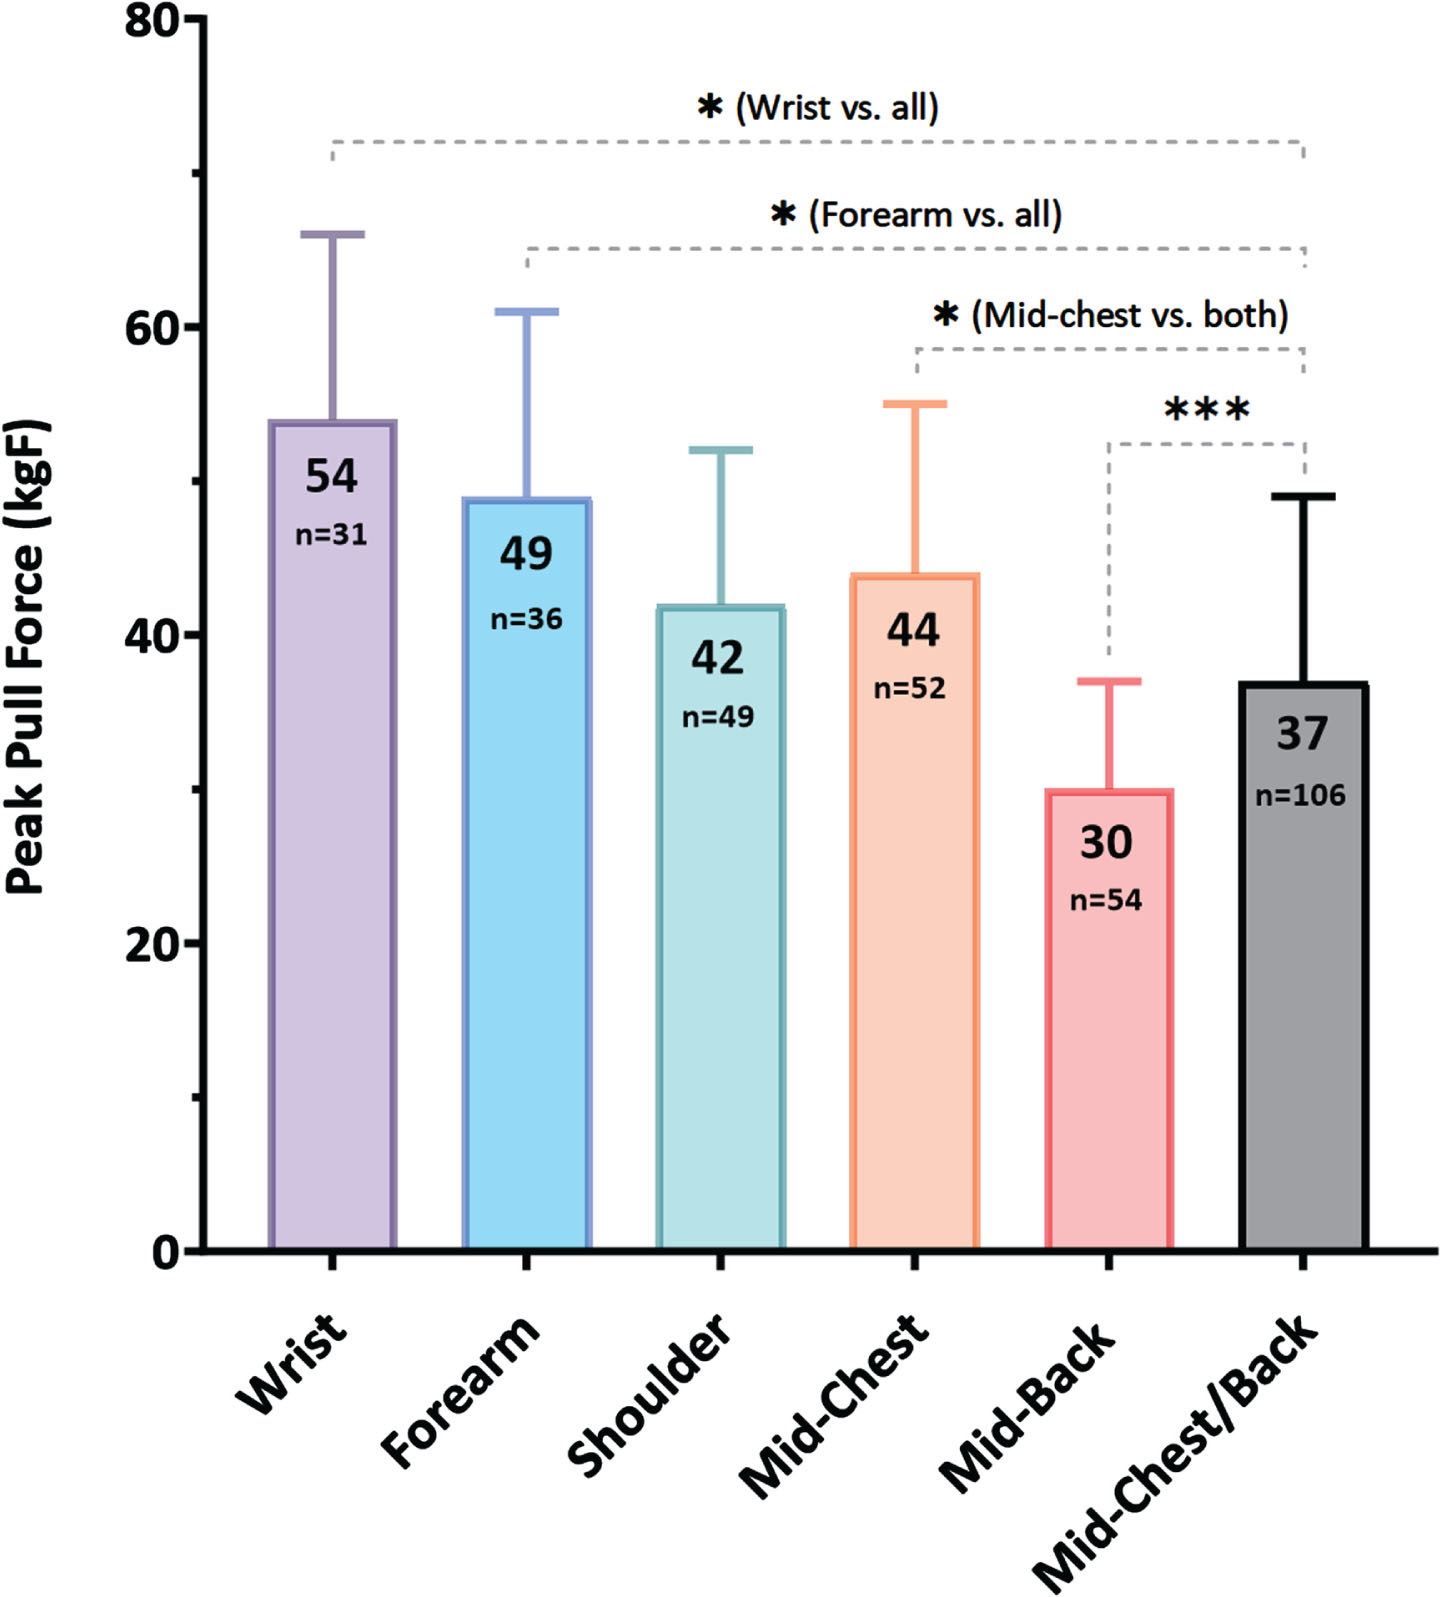
Table 2 presents the descriptive statistics of the police officers in the study and individuals applying force in the tests, while Figure 5 illustrates the minimum force required to disrupt the stability of the participants, physically resembling the common suspect profile. Each body region where the force was applied represented common body contact points during prevalent grappling movements and control tactics. The combined force data for the mid-chest and mid-back are depicted as a single column in the Figure, which represents the combined pushing and pulling movements of the torso.
Fig. 5
Mean minimum force requirements for destabilizing non-compliant suspects at primary body contact points. This figure shows the average force necessary to disrupt the balance of the most commonly encountered non-compliant suspects at key contact areas: wrist, forearm, shoulder, mid-chest, and mid-back. The combined force for the mid-chest and mid-back is represented as a single bar, capturing the aggregate dynamics of the pushing and pulling movements during apprehensions. The force was applied at a 90-degree angle for each contact point. Error bars represent standard deviation. Significance levels are indicated by asterisks: *P < 0.05 and ***P < 0.001.
Officers were older than force applicators (p = 0.046), while height, mass, and BMI did not differ between the groups (all P > 0.05). The most participants were excluded from the wrist measurements (n = 24), followed by the forearm (n = 19). Fewer exclusions occurred in the shoulder (n = 6), mid-chest (n = 3), or mid-back (n = 1) measurements. The force measured during the initial trial was consistently lower than that measured in subsequent trials across all contact points (all P < 0.05). Owing to this observed learning effect, data from the first trial were excluded from all participants.
Significant differences in peak force were observed across the five contact points (P < 0.001). Specifically, the force at the wrist was higher than that measured from the forearm, shoulder, mid-chest, mid-back, and combined mid-chest/back metric (all P < 0.05). The force exerted at the forearm was greater than at the shoulder, mid-chest, mid-back, and the combined mid-chest/back (all P > 0.05). Comparative analyses revealed that the shoulder and mid-chest showed similar force requirements (P = 0.193), while the mid-chest demanded a higher force for destabilization compared to both the mid-back and the combined mid-chest/back metric (both P < 0.05). Conversely, the force at the mid-back was significantly lower than that for the combined mid-chest/back (P < 0.001).
4Discussion
In this study, we implemented a novel two-phase systematic approach. Phase 1 aimed to characterize the dynamics of non-compliant suspect apprehensions, with a particular focus on the takedown phase. Phase 2 sought to define the minimum force required to destabilize the most common suspect to resist arrest. The technical-tactical behavior analysis indicated that officers predominantly employed grappling movements and control tactics to manage and ground suspects, with minimal use of strikes. Based on these results, we developed a protocol to measure the minimal force required to destabilize officers with physical characteristics similar to those of the typical suspect, which is critical for ensuring successful ground transition for restraint. The findings revealed a hierarchy of force necessary to disrupt a suspect’s balance at various body contact points, essential for the effective execution of grappling and control tactics. Specifically, the wrist required the most force, followed by the forearm, mid-chest, shoulder, and mid-back. Collectively, these findings have significant implications for law enforcement PES, highlighting the importance of physical attributes such as strength, power, and mobility in general duty police officers. Furthermore, they advocate for specialized training programs that focus on guiding officers to the precise application of force, particularly at the key contact points identified.
4.1Characterization of officer behaviors in simulated non-compliant apprehensions
4.1.1Most common physical control techniques
The frequency analysis demonstrated the complex dynamics involved in apprehending non-compliant suspects, with grappling movements emerging as the primary techniques for physical control techniques. As shown in Fig. 3, every officer executed at least one of the following techniques: 2-hand pulls (97%), 2-hand cross-body pulls (68%), 1-hand pulls (24%), and 2-hand pushes (19%). Conversely, control tactics and strikes were observed in 75% and 4% of simulations, respectively. These findings align with those of Anderson. Plecas, and Segger [1], where 93% of officers reported using push and pull techniques in confrontations. Their study further showed that 86% of officers applied twisting, turning, and control holds, whereas 57% used wrestling movements. Notably, 88% of surveyed officers deemed these maneuvers essential. Regarding control tactics, the arm bar takedown was the most frequently used, by 55% of officers, followed by the 1-leg trip (24%). Wristlocks and nose-to-toe takedowns were employed by 10% of officers. However, the aforementioned study indicated a higher preference for wrist or arm locks (72% of officers) and takedowns (43% of officers) [1]. Such disparities may be due to methodological differences between the studies. While this research involved direct observations from simulated apprehensions, the earlier study collected data through surveys.
4.1.2Identified technical-tactical behavior patterns
The combination of PCA and cluster analysis provided detailed insight into the distinct behavioral patterns’ officers exhibited during non-compliant suspect apprehensions. Beyond isolated movements and techniques, this analysis revealed groupings in which these techniques were typically executed. Grappling movements, which include techniques like the 2-hand pull and the 1-hand pull, often form part of a broader tactical strategy. This interconnection is further evident in postural changes, underscoring the whole-body nature of the adaptive responses. Cluster analysis categorized officers into distinct behavioral patterns. Notably, 73% of officers adopted strategies characterized by proactive control (Cluster 0) and reactive grappling (Cluster 1). The prevalence of these clusters indicates a tendency among officers to favor swift engagement or adaptability in confrontational situations.
The behavioral patterns identified in this study emphasize the importance of comprehensive physical assessments within PES for general duty police officers. While existing standards aim to assess foundational physical capabilities such as strength, mobility, agility, endurance, and others, integrating the patterns can make these standards more relevant and practical. As highlighted, most officers demonstrated behaviors aligned with proactive control and reactive grappling. Therefore, a tailored physical control assessment might evaluate an officer’s ability to fluidly execute grappling movements in a sequence, transitioning between 1-hand pulls, 2-hand pushes, 2-hand cross-body pulls, and 1-hand cross-body pulls, while simultaneously shifting between upright and bent postures, which is essential for maintaining control, balance, and adaptability during apprehensions. By refining existing standards or developing new ones grounded in these observational patterns, law enforcement agencies can evaluate an officer’s readiness for real-world situations more effectively. After all, an officer’s decisions in real-time scenarios stem from their physical prowess and grasp of the situation’s evolving dynamics. Emphasizing versatile training programs ensures that officers are equipped to navigate through the diverse challenges they encounter.
4.1.3Duration of technical-tactical behaviors
In this study’s task simulation, where actors transitioned from passive to active resistance, apprehensions lasted an average of 7 seconds, with performances ranging from 3 to 22 seconds. This is particularly shorter compared to Anderson, Plecas, and Segger’s findings [1], where interventions demanding physical control averaged around 10 minutes, ranging from a brief 2 minutes to an extended 29 minutes. However, the durations observed in this study align more closely with Alpert and Dunham [15], who found that in nearly 35% of encounters, officers managed to apprehend suspects within 30 seconds, although these faster interventions often involved higher levels of force when compared with longer encounters. The disparities in findings between these studies could be largely attributed to differences in methodological approaches. Both Anderson et al. [4] and Alpert and Dunham [15] used self-reported questionnaires, potentially introducing recall bias and associated inaccuracies [32]. Conversely, Alpert and Dunham [17] provided a broader perspective by capturing all types of police-public encounters, thus providing a more comprehensive view of police use of force.
The variability observed in the durations of various technical-tactical behaviors, as depicted in Fig. 4, underscores the complex nature of real-world encounters and the challenges that general duty police officers face in rapidly changing situations [4, 5, 14, 33]. Nevertheless, it is important to remember that these were simulations rather than actual on-field encounters. Therefore, these durations should be interpreted carefully. Additionally, given that all officers in this study were trained under the NUFF framework, the findings may not extend universally, especially to agencies that operate under different use of force guidelines guidelines [4, 5].
4.1.4Methodological rigor and consistency in simulated apprehensions
This study enlisted PDT instructors instructors to play the role of suspects in simulations. They were given specific instructions on intensity levels and were directed to transition from passive to active resistance upon contact with the officer. By adopting such methodological measures, the variability that multiple actors can often introduce into the simulations was minimized. This consistency was reflected across various aspects of the study, such as the number of grappling movements and control tactics performed by each officer, duration of technical-tactical behaviors, total apprehension time, and perceptual feedback such as RPE, task realism, and resistance level (Tables 3 and 4). Ultimately, this reliability reinforces the validity of our findings, indicating their practical applicability. Although our methodological approach reduced actor-related variability, it is important to acknowledge that the simulations may not entirely replicate the unpredictability and intricate dynamics of real-world policing situations.
4.1.5Associations between officer characteristics and technical-tactical behaviors
When exploring the relationships between officer attributes, such as age, sex, height, body mass, body mass index, years of general duty experience, and factors such as the frequency and duration of grappling movements, control tactics, body postures, and total apprehension time, no significant correlations were evident (Table 3). This suggests that the inherent physical and demographic traits of officers may not markedly impact the efficiency of task execution in these simulations. Notably, these observations appear to deviate from those of previous studies, highlighted in two recent systematic reviews [34, 35]. For instance, Wilmore and Davis [7] found a significant association between age and performance, specifically among male police officers. Similarly, Dillern et al. [18] noted a strong inverse relationship between age and performance during simulated apprehensions among male student officers. These discrepancies could be attributed, in part, to differences in research methodologies. While previous studies relied on an arrest simulation device and subjective scoring methods, this study employed quantifiable metrics centered on the frequency and duration of the different technical-tactical behavior categories, as well as total apprehension time. Another distinction lies in this study’s diverse demographics, encompassing a wider age range and 19% female participants. In summary, our findings indicate that, within the specific parameters of our simulation, the inherent physical and demographic traits of officers did not influence the efficiency of task execution. This contrasts with prior research that suggested a more pronounced impact of such characteristics on performance, potentially highlighting the importance of the chosen metrics and diversity within the study population in understanding the complexities of suspect apprehensions.
4.1.6Officer perceptions of task simulation
Overall, officers rated the simulation as moderately realistic, strengthening the validity of the most frequent technical-tactical behaviors and patterns employed by officers in managing non-compliant suspects. Importantly, this perception remained consistent among officers, irrespective of age, sex, height, body mass, body mass index, or years of general duty policing experience, emphasizing the broad relevance of these simulations (Table 4). In terms of RPE and the actor’s resistance, officers generally perceived their experiences as minimal-to-moderate and low-to-moderate, respectively. Remarkably, these perceptions were not influenced by any officer characteristics, indicating that individual physical attributes and experience may not influence officers’ perceptions in these simulated settings (Table 4). Although task simulations may not completely capture the physical intensity of real-world confrontations, our findings underscore their reliability in task characterization, maintaining face validity and reducing the risk of injury.
4.2Minimum force standards to control and destabilize non-compliant suspects
This study showed a clear hierarchy in the minimum force required to destabilize a non-compliant suspect across various body contact points commonly engaged in grappling movements and control tactics. The wrist required the highest force, averaging 54 kg, followed by the forearm, mid-chest, shoulder, and mid-back, which required 9%, 19%, 22%, and 44% less force than the wrist, respectively (Fig. 5). Notably, the force requirements at the shoulder and chest were similar, with an average of ∼43 kg for these locations, 12% less than the forearm, but 36% higher than the back. Specifically, the chest required 38% more force than the back for destabilization. For a more comprehensive understanding of force dynamics in controlling suspects through push-pull actions, mid-chest and mid-back data were combined. Consequently, the wrist required 31% more force than the combined mid-chest/back point, whereas the forearm, shoulder, and mid-chest required 24%, 12%, and 16% more force, respectively. In contrast, the mid-back required 23% less force.
Historical research by Farenholtz and Rhodes [9, 12], later affirmed by Bonneau and Brown [6] in the Physical Abilities Requirement Evaluation (PARE), estimated that controlling an average male inmate required ∼35 kg of force. Later, Jamnik et al. [2, 10], while refining the Fitness Test for Correctional Officer (FITCO) standard, reported a slightly increased force of ∼38.6 kg for push/pull control and also evaluated the force used by officers in wrist restraint and arm retraction, aligning with prior work from Wilmore and Davis [7]. Recent investigations have explored the force needed to retract the arm of a suspect lying prone [11, 20], showing that technique and experience are paramount over force for effective apprehension [20]. In practical situations, as evidenced by the identified patterns, officers often use several physical control techniques in sequence to destabilize and skillfully ground a non-compliant suspect [3, 5, 13, 14, 33, 36]. These methods arise from the complexities of real-life high-risk situations that require force for the safety of officers and the public [4, 5]. As such, the defined minimum force requirements to destabilize non-compliant suspects across various body contact points common to several grappling movements and control tactics address a key knowledge gap in the literature [1, 18].
4.3Perspectives and Future Directions
If suspect apprehensions are identified as an essential task, patterns identified for grappling movements and postural changes, along with the minimum force requirements should be integrated into future general duty police PES. Integrating these patterns and force standards will ensure that officers can meet the minimum physical demands of their roles, irrespective of age, sex, or body morphology. By prioritizing this integration, the safety of officers and the public can be enhanced, officers’ physical fitness and force application skills can be maintained through regular training based on these standards [37], and injury rates and the levels of force used in public encounters may decrease [13, 14].
One notable limitation of our study is the absence of detailed metrics of participants’ physical capacity, particularly strength and power, despite relying on demographics and physical attributes such as age, sex, height, body mass, and body mass index. A comprehensive evaluation of these aspects in further research can provide a more comprehensive understanding of the efficiency of force application and suspect control techniques. Additionally, to strengthen the significance and application of our findings, there is a need for future research that validates these findings in practical real-world scenarios. Such validations will better reflect the diverse challenges and unpredictable variables that may not be represented in controlled suspect apprehension simulations, thus strengthening the generalizability and applicability of the findings.
Furthermore, the use of force training and standards can vary considerably between law enforcement agencies and jurisdictions, both within Canada and internationally [38]. Therefore, individual agencies should aim to incorporate force standards tailored to their specific requirements when refining or creating PES and training programs. This strategy will not only ensure operational efficiency, but also contribute to a safer and more effective workforce. Finally, it is necessary to evaluate the feasibility and benefits of establishing international standards for law enforcement, as PES development often encounters financial, logistical, and time constraints. Furthermore, the type of law enforcement and employer agendas can restrict the scope of PES development, particularly in terms of content and construct validity [19]. To address this, Petersen et al. [39] proposed an objective approach to developing task simulation assessments for specific criterion tasks, incorporating criterion-referenced standards. This approach, later supported by the NATO Research and Technology Organization’s (RTO) Human Factors and Medicine (HFM) Panel [40], suggest the inclusion of combat-like tasks into PES. Such integration promises to elevate PES, making them more relevant and rigorous for a range of physically demanding law enforcement roles. The adoption of these refined standards across law enforcement agencies can foster greater uniformity and enhance the overall quality of law enforcement practices, playing a pivotal role in the continuous evolution and enhancement of law enforcement PES [36, 41–43].
5Conclusion
This study characterized the dynamics of non-compliant suspect apprehensions using task simulations, demonstrating that officers predominantly used grappling movements and control tactics, whereas strikes were sparingly employed to manage or subdue suspects. Based on these results, minimum force standards were defined at specific body contact points to effectively destabilize non-compliant suspects and ensure proficient arrest execution by officers. These findings underscore the importance of physical strength in daily policing tasks, especially during encounters with non-compliant individuals. They advocate for the necessity of comprehensive and standardized training programs focused on enhancing key physical attributes, including strength, power, mobility, and agility. Such training is essential for adequately preparing officers to meet the demands and challenges of their profession. Although further research is required to solidify these conclusions in real-world settings, the significance of such strategic approaches in ensuring safe and skilled law enforcement practices is evident. In essence, this research reinforces the commitment to enhance the safety and welfare of both officers and the communities they tirelessly serve.
Acknowledgments
The authors would like to thank all participants who participated in this study. They extend a special thank you to Dr. Tara Reilly, Simon Bélanger, Phil Newton, Barry Stockbrugger Evan Walsh, Étienne Chassé, and other members of the extended research team for their invaluable contributions. They also wish to acknowledge the indispensable support of Angie Boucher, Sara Lowes, Sheryl Raymond, Dave Evans, and Sean Martel from the Royal Canadian Mounted Police throughout this project.
Conflict of interest
The authors declare that they have no conflicts of interest.
Funding
The authors report that this project was funded through collaboration between the Canadian Forces Morale and Welfare Services and the Royal Canadian Mounted Police.
Ethics statement
Ethical approval for this study was obtained from the Veritas Independent Review Board (#2019-0703) in accordance with the Tri-Council Policy Statement: Ethical Conduct for Research Involving Humans. All participants provided written informed consent before their participation in the study.
References
[1] | Anderson GS , Plecas D , Segger T . Police officer physical ability testing–Re-validating a selection criterion. Policing: An Int J Police Strategies Manag. (2001) ;24: (1):8–31. |
[2] | Jamnik VK , Thomas SG , Shaw JA , Gledhill N . Identification and characterization of the critical physically demanding tasks encountered by correctional officers. Appl Physiol Nutr Metab. (2010) ;35: (1):45–58. |
[3] | Royal Canadian Mounted Police. 2021 Police Intervention Options Report. Ottawa, ON, Canada: Government of Canada, 2022 [updated October 11, 2022]. Available from: https://www.rcmp-grc.gc.ca/transparenc/police-info-policieres/intervention/2021/index-eng.htm. |
[4] | Canadian Association of Chiefs of Police. A National Use of Force Framework. Ottawa, ON, Canada: Canadian Association of Chiefs of Police, 2000. |
[5] | Royal Canadian Mounted Police. Incident Management / Intervention Model. Ottawa, ON, Canada: Government of Canada; 2022 [cited September 21, 2023]. Available from: https://www.rcmp-grc.gc.ca/en/incident-management-intervention-model-imim. |
[6] | Bonneau J , Brown J . Physical ability, fitness and police work. J Clin Forensic Med. (1995) ;2: (3):157–64. |
[7] | Wilmore JH , Davis JA . Validation of a physical abilities field test for the selection of state traffic officers. Med Sci Sports Exerc. (1977) ;9: (1):63. |
[8] | Beck AQ , Clasey JL , Yates JW , Koebke NC , Palmer TG , Abel MG . Relationship of physical fitness measures vs. occupational physical ability in campus law enforcement officers. J Strength Cond Res. (2015) ;29: (8):2340–50. |
[9] | Farenholtz DW , Rhodes EC . Development of physical abilities test for municipal police officers in British Columbia. Can J Appl Sport Sci.Abstract. (1986) ;11: (3). |
[10] | Jamnik VK , Thomas SG , Burr JF , Gledhill N . Construction, validation, and derivation of performance standards for a fitness test for correctional officer applicants. Appl Physiol Nutr Metab. (2010) ;35: (1):59–70. |
[11] | Koedijk M , Renden PG , Oudejans RR , Hutter RI . Training for the job: Evaluation of a self-defence training programme for correctional officers. Ergonomics. (2019) ;62: (12):1585–97. |
[12] | Farenholtz DW , Rhodes EC . Recommended Canadian standards for police physical abilities. Can Police Coll J. (1990) ;14: (1):37–49. |
[13] | Garner JH , Maxwell CD . Measuring the amount of force used by and against the police in six jurisdictions. Use of force by police: Overview of national and local data. (1999) 25–44. |
[14] | Garner JH , Maxwell CD , Heraux CG . Characteristics associated with the prevalence and severity of force used by the police. Justice Q. (2002) ;19: (4):705–46. |
[15] | Alpert GP , Dunham RG Understanding police use of force: Officers, suspects, and reciprocity. Cambridge (UK): Cambridge University Press; 2004 August 16. |
[16] | Bonneau J Task analysis RCMP: Surrey and rural studies. Unpublished paper. 1988. |
[17] | Greenberg GJ , Berger RA . A model to assess one’s ability to apprehend and restrain a resisting suspect in police work. J Occup Med. (1983) 809–13. |
[18] | Dillern T , Jenssen OR , Lagestad P , Nygård Ø , Ingebrigtsen J . Arresting a struggling subject; does the forthcoming police officers physical fitness have an impact on the outcome? Open Sports Sci J. (2014) ;7: (Suppl-1,M2):2–7. |
[19] | Beck B , Billing DC , Carr AJ . Developing physical and physiological employment standards: Translation of job analysis findings to assessments and performance standards–A systematic review. Int J Ind Ergon. (2016) ;56: :9–16. |
[20] | Delbridge K , Caldwell J , Middleton K , Drain JR , Hayes A , Burdon CA , et al. Is muscular strength a critical physical attribute for the apprehension of a simulated non-compliant suspect? Ergonomics. (2021) ;64: (9):1183–90. |
[21] | Bonneau J Revision to the Doghandlers Task Analysis. RCMP Health Services Directorate, Ottawa, ON, Canada 1994 January. |
[22] | Hayes AC , Groeller H , Drain JR , Delbridge K , Caldwell JN . The physiological demand of a task simulation varies when developed by independent groups of experiential experts. Appl Ergon. (2022) ;102: :103715. |
[23] | Royal Canadian Mounted Police. 2010 to 2019 Police Intervention Options Report. Ottawa, ON, Canada: Government of Canada; 2022 [cited September 21, 2023]. Available from: https://www.rcmp-grc.gc.ca/transparenc/police-info-policieres/intervention/2010-2019/index-eng.htm. |
[24] | Drees H , Sabourin A . Principal component analysis for multivariate extremes. Electron J Statist. (2021) ;15: (1):908–43. |
[25] | Schubert E , Lang A , Feher G Accelerating spherical kmeans. Int Conf Similarity Search Appl. 2021. Springer. |
[26] | Knittel J , Koch S , Ertl T Efficient sparse spherical k-means for document clustering. Proc 21st ACM Symp Doc Eng. 2021. |
[27] | Batool F , Hennig C . Clustering with the average silhouette width. Comput Stat Data Anal. (2021) ;158: :107190. |
[28] | Altieri F , Pietracaprina A , Pucci G , Vandin F , editors. Scalable distributed approximation of internal measures for clustering evaluation. Proc 2021 SIAM Int Conf Data Min (SDM); 2021. SIAM. |
[29] | Alam A Hybridization of K-means with improved firefly algorithm for automatic clustering in high dimension. arXiv preprint. 2023; arXiv:230210765. |
[30] | Schober P , Boer C , Schwarte LA . Correlation coefficients: Appropriate use and interpretation. Anesth Analg. (2018) ;126: (5):1763–8. |
[31] | Leys C , Ley C , Klein O , Bernard P , Licata L . Detecting outliers: Do not use standard deviation around the mean, use absolute deviation around the median. J Exp Soc Psychol. (2013) ;49: (4):764–6. |
[32] | Walentynowicz M , Schneider S , Stone AA . The effects of time frames on self-report. PLOS ONE. (2018) ;13: (8):e0201655. |
[33] | Kiedrowski JS , Melchers R-F , Petrunik M , Maxwell C A discussion of the collection and analysis of data on the use of force in encounters between the police and members of the public. Ottawa (ON): Public Safety Canada=Sécurité publique Canada; 2015. |
[34] | Marins EF , David GB , Del Vecchio FB . Characterization of the physical fitness of police officers: A systematic review. J Strength Cond Res. (2019) ;33: (10):2860–74. |
[35] | Massuça LM , Santos V , Monteiro LF . Identifying the Physical Fitness and Health Evaluations for Police Officers: Brief Systematic Review with an Emphasis on the Portuguese Research. Biology. (2022) ;11: (7):1061. |
[36] | Zumbo BD . Standard-setting methodology: Establishing performance standards and setting cut-scores to assist score interpretation. Appl Physiol Nutr Metab. (2016) ;41: (6 Suppl 2):S74–82. |
[37] | Alpert GP , Smith MR . Police use-of-force data: Where we are and where we should be going. Police Q. (1999) ;2: (1):57–78. |
[38] | Bennell C , Jones NJ , Corey S . Does use-of-force simulation training in Canadian police agencies incorporate principles of effective training? Psychol Public Policy Law. (2007) ;13: (1):35. |
[39] | Petersen SR , Anderson GS , Tipton MJ , Docherty D , Graham TE , Sharkey BJ , et al. Towards best practice in physical and physiological employment standards. Appl Physiol Nutr Metab. (2016) ;41: (6 Suppl 2):S47–62. |
[40] | Reilly T , Drain J , Blacker S , Sharp M , Hauret K HFMCombat Integration: Implications for Physical Employment Standards Science and Technology Organization (STO). Brussels (BE): North Atlantic Treaty Organization (NATO); 2019. |
[41] | Milligan GS , Reilly TJ , Zumbo BD , Tipton MJ . Validity and reliability of physical employment standards. Appl Physiol Nutr Metab. (2016) ;41: (6 Suppl 2):S83–91. |
[42] | Gledhill N , Bonneau J Objectives, process and consensus summary of the National Forum on bona fide occupational requirements. Proceedings of the Consensus Forum on Establishing BONA FIDE Requirements for Physically Demanding Occupations, York University, Toronto, ON, Canada; 2000. |
[43] | Taylor NA , Fullagar HH , Mott BJ , Sampson JA , Groeller H . Employment standards for Australian urban firefighters: Part The essential, physically demanding tasks. J Occup Environ Med. (2015) ;57: (10):1063–71. |

