
Impact of workplace displacement during a natural disaster on computer performance metrics: A 2-year interrupted time series analysis
Abstract
BACKGROUND:
Remote working may enhance company resiliency during natural disasters and other events causing workplace displacement.
OBJECTIVE:
We conducted an interrupted time series analysis to investigate the impact of Hurricane Harvey on employee computer use during and after a seven-month displacement period from the physical workplace.
METHODS:
Ergonomic software was used to collect information on employees’ computer usage.
RESULTS:
Although there was no change in total computer use in response to the hurricane (β 0.25), active computer use significantly declined (β –0.90). All measured computer use behaviors returned to baseline prior to the complete return to the physical workspace.
CONCLUSION:
Despite a transient period of reduced activity during closure of the workplace building, productivity returned to normal prior to the employees’ return to a commercial workspace. The ability to work remotely may improve resiliency of employees to perform workplace tasks during events causing workplace displacement.
1Introduction
Annually, natural disasters cause significant burden, including adverse effects on health and economic losses [1]. Since the 1980s, losses due to these events have tripled globally [2]. In 2019 alone, the United State sustained at least 14 major weather-related disasters costing an estimated 45 billion US dollars [3]. One of the major drivers of increasing losses from natural disasters is economic growth in affected areas [4]. The ability for employees to continue work without disruption during natural disasters could reduce some of these economic losses [5]. One way to avoid disruption and improve resiliency during natural disasters is to promote teleworking or remote work. While the technology makes it possible to continue working, we have yet to objectively measure how efficiently employees work while displaced during situations such as natural disasters. To enable companies to create viable disaster-recovery plans for their employees, it is critical that we understand the impact of disasters on workplace productivity.
Between 17 August and 2 September 2017, the greater Houston area was impacted by a devastating Category 4 hurricane, Hurricane Harvey. Over a five-day period, rainfall reached 33 trillion gallons, affecting more than 13 million people in Texas and Louisiana and costing an estimated $160 billion in damages [6]. In response to extreme flooding, many businesses were forced to close operations. Some businesses encouraged remote work in order to avoid complete loss of function. The aim of this study was to evaluate the impact of Hurricane Harvey on workplace productivity among displaced employees.
2Materials and methods
We performed an interrupted time series analysis of routinely collected daily measurements of objective computer performance data from 3 January 2017 to 28 December 2018 [7, 8]. This study was approved by the Texas A&M University Institutional Review Board (IRB2018-1623M).
2.1Study setting
Workplace productivity measures were collected from a Fortune 500 corporation, employing more than 15,000 employees in the greater Houston area. In response to Hurricane Harvey, this company was forced to close their corporate office for a seven-month period, displacing many workers including the 264 randomly selected for analysis here. The company had systems in place allowing employees to continue working virtually from alternative work locations (i.e., home, family residence, hotel) during disaster recovery. The commercial office space was open and in full operation until 24 August 2017 when the building was forced to close due to extreme weather. The building was closed completely until 24 September 2017, when some campus facilities began to reopen and a staged return to work began. By 1 April 2018, all commercial office space was open, and employees were fully returned to the traditional workplace. We used these defined time periods to inform the segmented regression model.
2.2Data collection
Prior to the natural disaster, the company had installed RSIGuard® software (Cority Enviance version 6) on employees’ computers (used in the traditional workplace and remotely). RSIGuard® collects over 100 objective data points on computer performance (e.g. hours of computer use, words typed per day, number of mouse clicks, etc.) [9]. Traditionally, this information is used by companies to monitor scheduled and natural breaks to avoid musculoskeletal injuries. Here, we use these same metrics to measure patterns in computer performance before, during and after workplace displacement. The final dataset represented consecutive official workdays from 2017 through 2018. Metrics presented here were chosen to be the most common amongst this class of ergonomic software.
2.3Measures
We analyzed five daily metrics of employee computer usage routinely collected by the RSIGuard® system: total number of hours worked per employee, total active work time, keyboard use per active minute, mouse usage per active minute, words typed per hour, and number of typographical errors per word typed. The total number of hours worked per day was estimated as the difference between the time an employee logged into their work computer and the time they logged out. The number of “active” hours worked was estimated as the total number of hours the employee spent actively engaging with the computer (i.e., actively typing, mouse scrolling or clicking). This metric has been reported and utilized in other studies related to active computer use [10, 11]. These activities were selected since they have been used as an indicator of workplace productivity and computer use in previous studies [10–13]. Many of the other metrics kept by Cority software are proprietary and tied to features such as their break timer that provides micro break suggestions. By communicating in this smaller and more common set of metrics, we hope to establish consistent metrics across software companies by using agreed upon terms.
2.4Statistical analysis
We included four linear segments defined as baseline (1 Jan to 23 Aug 2017), complete storm displacement (24 Aug to 24 Sept 2017), staged return to office (25 Sept 2017 to 31 Mar 2018), and complete return to office (1 Apr 2018 to 31 Dec 2018). Because we detected serial autocorrelation in our data (based on Cumby-Huizinga test for autocorrelation), we used Prais Winston AR (1) segmented regression to assess changes in workplace measures during complete displacement from the workplace, staged return to the workplace and complete return to the workplace, accounting for autocorrelation in residuals and applying robust standard errors. Analyses were performed using the itsa command in STATA/IC 15.1 (College Station, TX).
2.5Patient and public involvement
This study relied on secondary data analysis provided to TAMU by a corporation and did not include patient or public involvement.
3Results
During the study period, the company employed an average of 243 employees at the participating Houston site; 68% of employees worked in engineering, 9% in finance and trading, and 23% in HR and corporate operations. On average, employees spent a total of 11.1 hours (SD 0.7) at work per day and 3.4 active hours (SD 0.5) (Fig. 1). Average computer use metrics during the four time periods are presented in Table 1.
Fig. 1
Daily total and active work time (per employee) at a large corporate office prior to, during and following workplace displacement due to Hurricane Harvey –Houston TX, January 2017 to December 2018. *Total number of hours worked was defined as the time between first computer use and last computer use for the day; active hours at work was defined as the number of hours with active computer engagement during the day (e.g., keyboard use, mouse use).
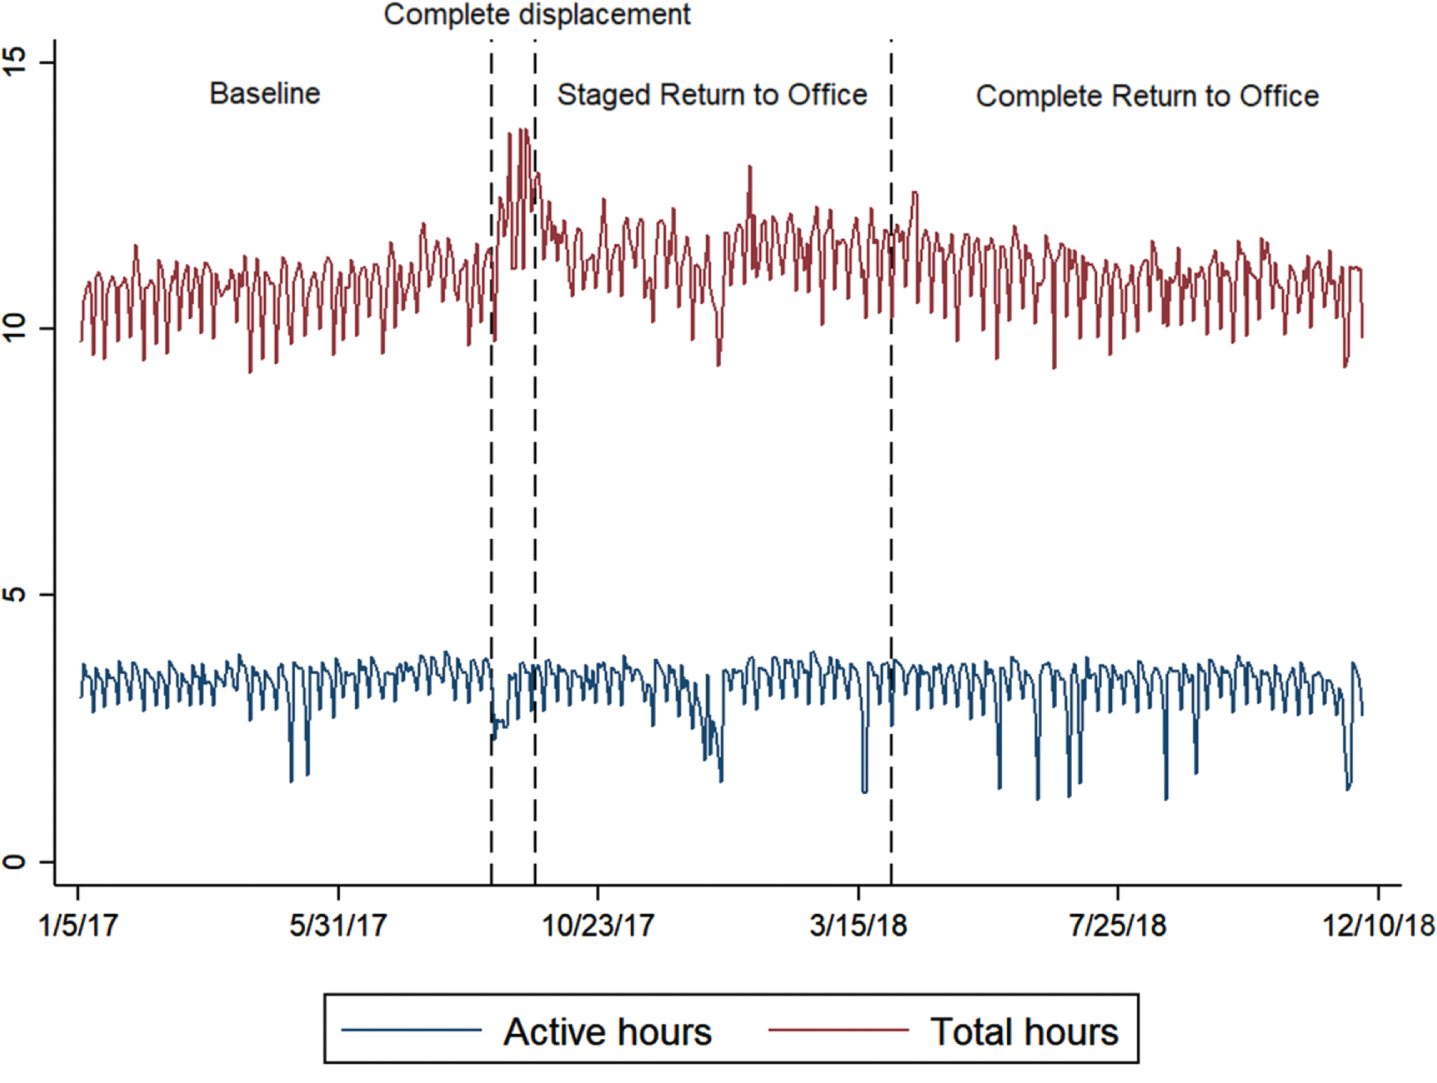
Table 1
Average workplace productivity measures before, during and after Hurricane Harvey
| Workplace productivity measure | Baseline period* | Complete displacement from workplace* | Staged return to workplace* | Complete return to workplace* |
| Mean (SD) | Mean (SD) | Mean (SD) | Mean (SD) | |
| Total hours worked† | 10.8 (0.6) | 12.1 (1.1) | 11.5 (0.6) | 11.0 (0.6) |
| Active hours worked† | 3.4 (0.3) | 3.1 (0.5) | 3.4 (0.5) | 3.3 (0.5) |
| Percent of active time using keyboard | 36.1 (0.9) | 36.6 (1.1) | 34.7 (1.0) | 33.9 (1.3) |
| Percent of active time using mouse | 87.5 (0.6) | 85.3 (1.2) | 86.7 (0.8) | 86.8 (0.7) |
| Words typed per active hour | 221.5 (9.9) | 251.4 (19.3) | 221.6 (16.1) | 225.7 (16.7) |
| Typos per word typed | 0.29 (0.01) | 0.27 (0.01) | 0.29 (0.01) | 0.29 (0.01) |
*Baseline period included 1 Jan to 23 Aug 2017; the period of complete displacement from the workplace due to Hurricane Harvey included 24 Aug to 23 Sept 2017; the period of staged return to workplace included 24 Sept 2017 to 31 Mar 2018; and the period where employees were completely returned to the workplace included 1 Apr to 31 Dec 2018. †Total number of hours worked was defined as the time between first computer use and last computer use for the day; number of “active” hours worked was defined as the number of hours with active computer engagement during the day (e.g., keyboard use, mouse use).
At the time of the hurricane, we observed no change in the total number of hours worked (β 0.25), but a significant decline in the number of hours employees were actively working at their computer (β –0.90) (Table 2). Throughout the remainder of the period where employees were completely displaced from the physical workplace, we observed an increase in both the total amount of time worked (β 0.10) and the number of active hours worked (β 0.06) (Fig. 2). The total number of work hours began to decline once staged return to the physical workplace began (β –1.54), and throughout the staged return period, total hours worked and total active hours declined (β –0.11 and β –0.06, respectively). During the period where employees were completely returned to the physical workplace, we saw no change in total hours worked or the number of active hours worked (β 0.00 and β 0.00, respectively).
Table 2
Changes in workplace productivity measures before, during and after Hurricane Harvey
| Workplace productivity measure | Complete displacement from workplace* | Staged return to workplace* | Complete return to workplace* | |||
| β1 (95% CI)† | β2 (95% CI)† | β1 (95% CI)† | β2 (95% CI)† | β1 (95% CI)† | β2 (95% CI)† | |
| Total hours worked§ | 0.25 (–0.38, 0.90) | 0.10 (0.04, 0.17) | –1.54 (–2.24, –0.84) | –0.11 (–0.17, –0.04) | –0.05 (–0.35, 0.25) | 0.00 (–0.01, 0.00) |
| Active hours worked§ | –0.90 (–1.43, –0.38) | 0.06 (0.01, 0.11) | –0.24 (–0.81, 0.33) | –0.06 (–0.11, –0.01) | 0.06 (–0.18, 0.31) | 0.00 (0.00, 0.00) |
| Percent of active time using keyboard | 1.33 (0.27, 2.38) | –0.03 (–0.13, 0.08) | –0.88 (–2.03, 0.27) | 0.02 (–0.08, 0.13) | 0.88 (0.38, 1.37) | 0.00 (–0.01, 0.01) |
| Percent of active time using mouse | –1.62 (–2.46, –0.77) | –0.10 (–0.18, –0.01) | 2.17 (1.26, 3.09) | 0.09 (0.01, 0.18) | –0.19 (–0.61, 0.22) | 0.00 (–0.01, 0.01) |
| Words typed per keyboard hour | 27.7 (9.11, 46.38) | 1.16 (–0.69, 3.01) | –35.49 (–55.66, –15.32) | –1.08 (–2.93, –0.76) | 8.52 (–1.16, 18.19) | –0.01 (–0.12, 0.10) |
| Typos per word typed | –0.02 (–0.03, 0.00) | 0.00 (0.00, 0.00) | 0.01 (0.00, 0.03) | 0.00 (0.00, 0.00) | 0.00 (0.00, 0.01) | 0.00 (0.00, 0.00) |
*Baseline period included 1 Jan to 23 Aug 2017; the period of complete displacement from the workplace due to Hurricane Harvey included 24 Aug to 23 Sept 2017; the period of staged return to workplace included 24 Sept 2017 to 31 Mar 2018; and the period where employees were completely returned to the workplace included 1 Apr to 31 Dec 2018. † Estimated slope value and corresponding 95% confidence interval derived from Prais Winston segmented regression indicating change in workplace productivity measure compared to previous time period; β1 values represent the slope at transition from one period to the next; β2 values represent the slope during the time period. §Total number of hours worked was defined as the time between first computer use and last computer use for the day; number of “active” hours worked was defined as the number of hours with active computer engagement during the day (e.g., keyboard use, mouse use).
Fig. 2
Interrupted time series analysis of workplace performance measures prior to, during and following workplace displacement due to Hurricane Harvey including a) time at work, b) active time at work, * c) words typed per keyboard hour, and d) typographical errors per word –Houston TX, January 2017 to December 2018. Segmented regression was applied to compare workplace performance measures during the baseline period (1/5/2017 to 8/24/2017), period of complete displacement due to natural disaster (8/25/2017 to 9/19/17), staged return to workplace (10/1/2017), complete return to the workplace (4/1/2018). * Total number of hours worked was defined as the time between first computer use and last computer use for the day; active hours at work was defined as the number of hours with active computer engagement during the day (e.g., keyboard use, mouse use).
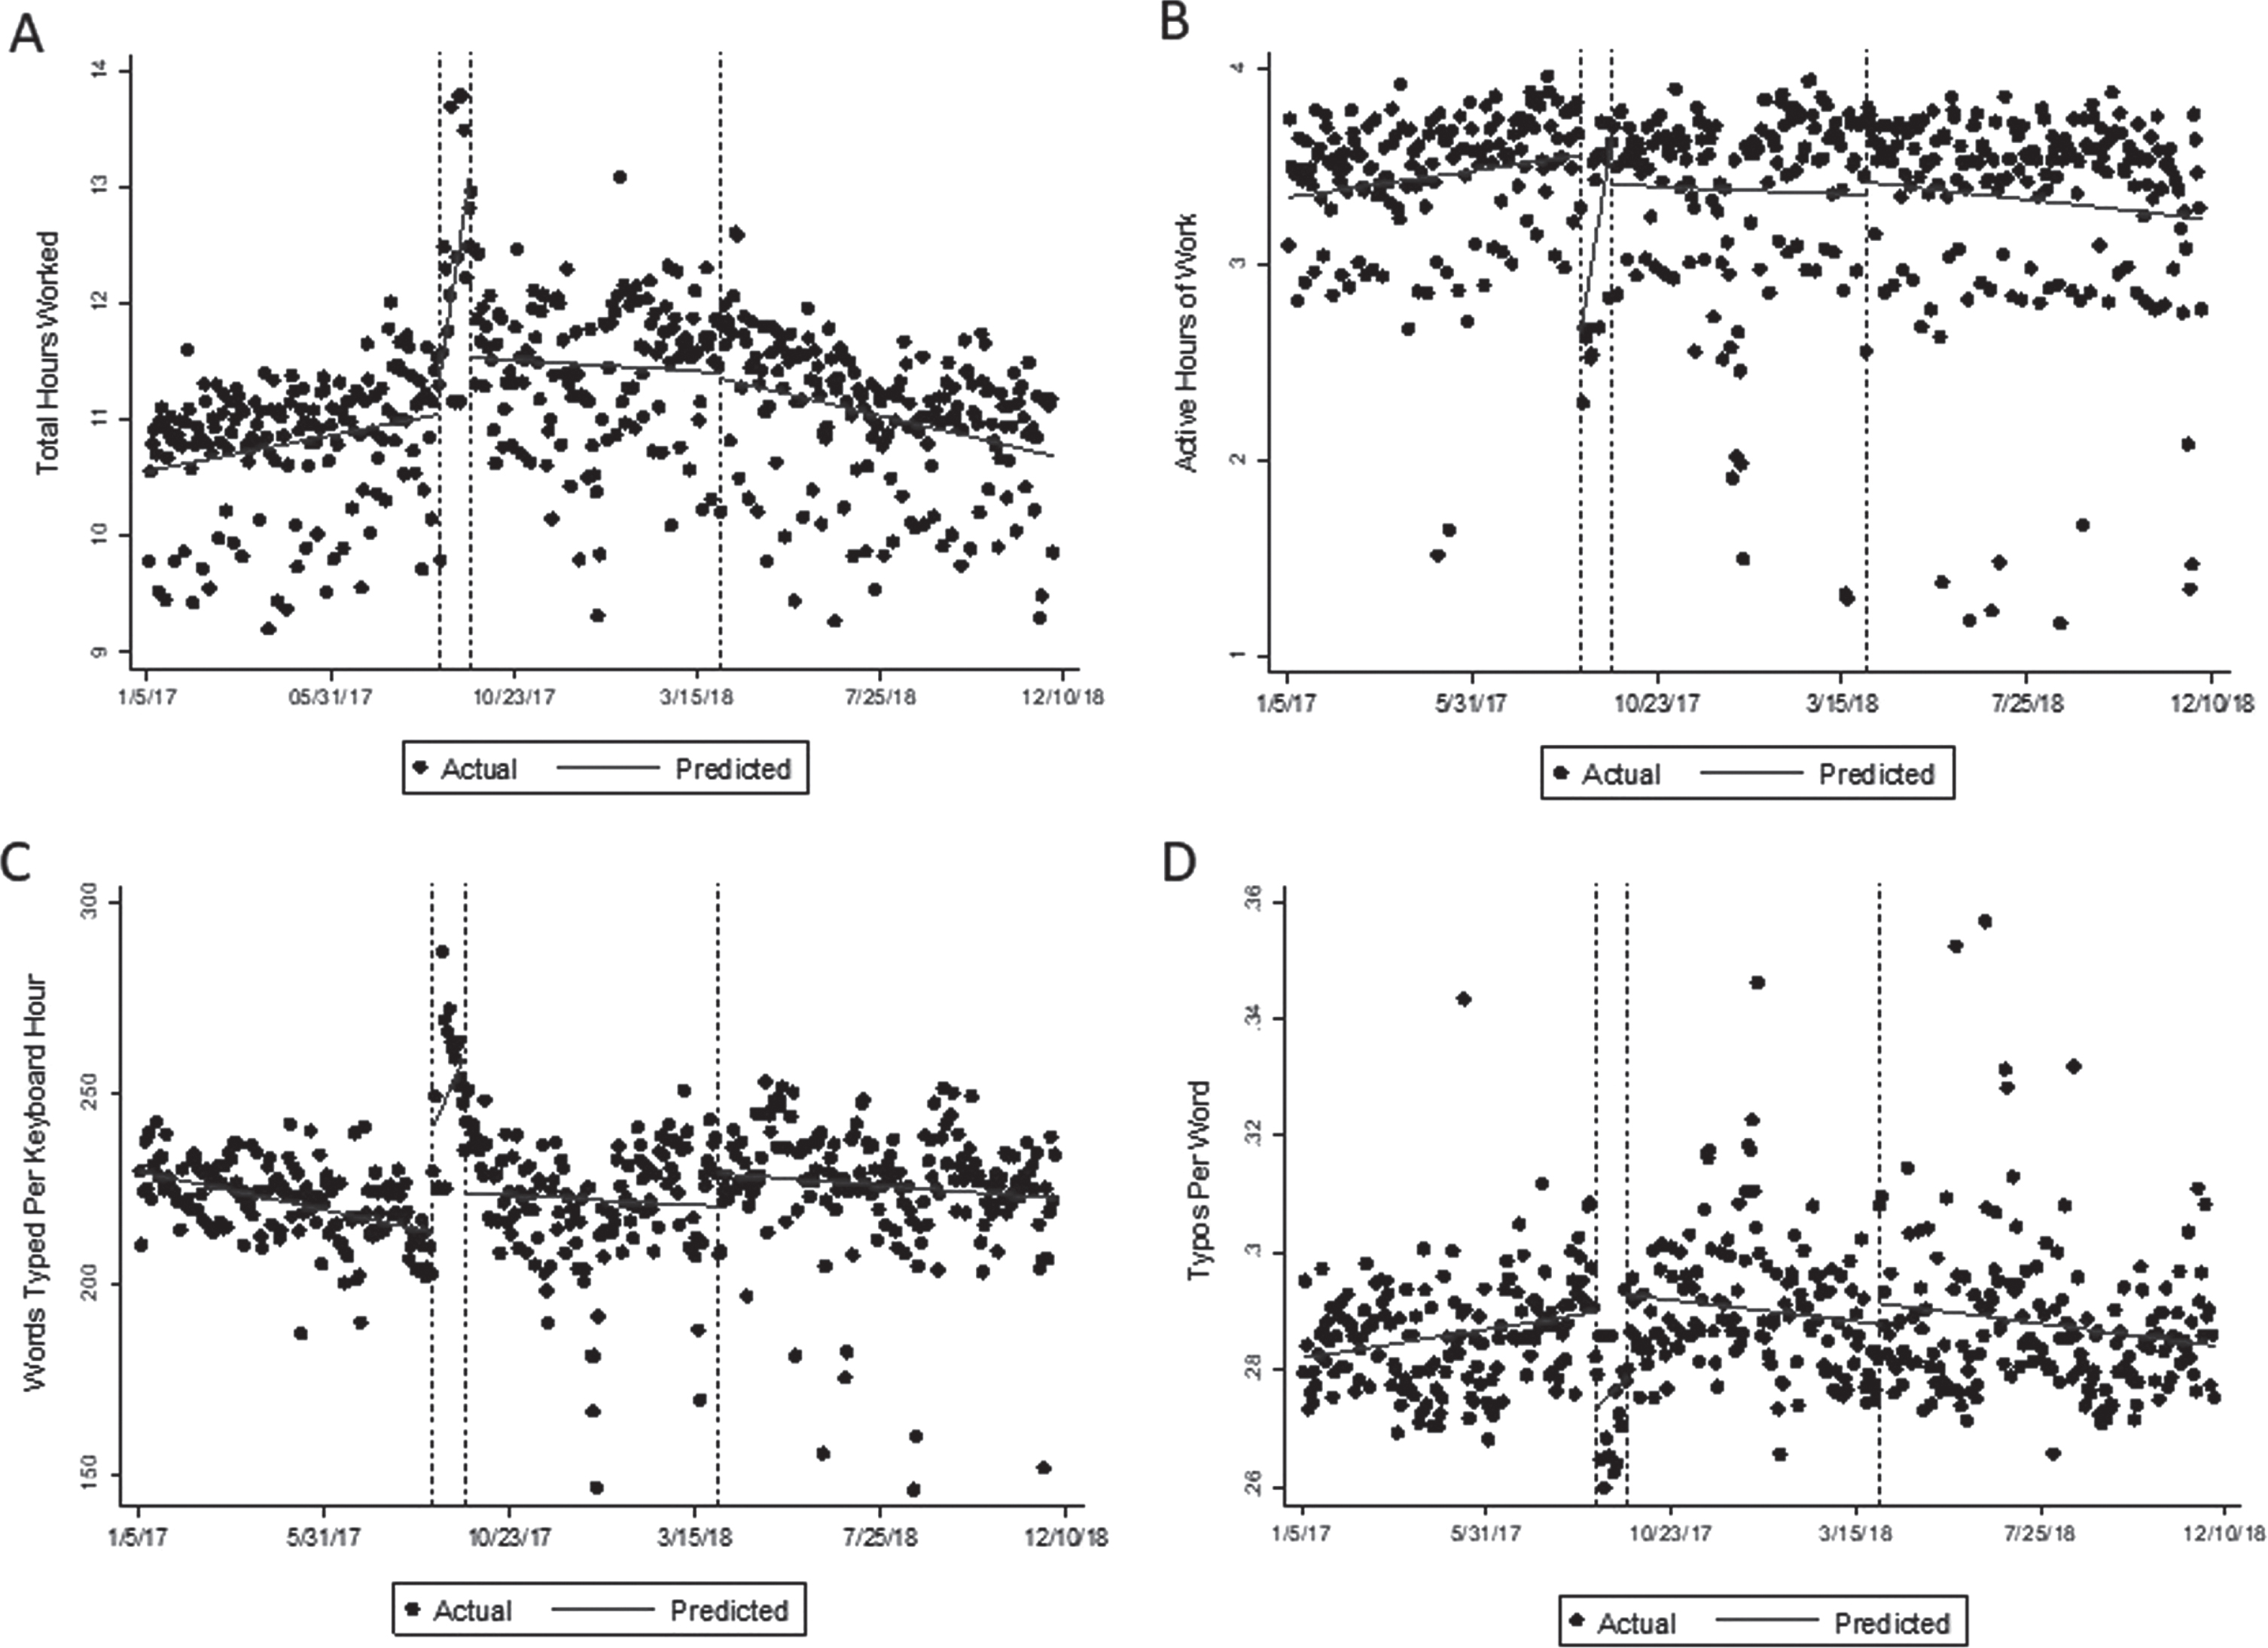
We observed a significant increase in active keyboard use (β 1.33) and words typed per keyboard hour (β 27.7), and a decline in active mouse use (β –1.62) during the hurricane. These behaviors appeared to recover during the staged return to the physical workplace (Table 2).
4Discussion
Displacement from the workplace due to Hurricane Harvey had a significant but temporary impact on workplace computer output of employees at a large commercial office space in Houston, TX, USA. While the total daily hours increased during the displacement period, the number of active hours immediately declined in response to the hurricane and steadily increased during the displacement period. No other changes in computer performance were observed. Our findings suggest that although there may be an immediate impact of displacement during natural disasters and other events, given the availability of alternative working conditions, productivity may return to baseline levels relatively quickly. These findings suggest that remote work allows employees to return to typical computer use even without the ability to return to their traditional workspace. To our knowledge, our study is the first to quantify the disruption of the computer usage by employees during a natural disaster and their subsequent return to a renovated and restored office. In the context of the ongoing SARS-CoV-2 pandemic and the necessitated transition to remote work for non-essential employees to mitigate transmission, these results may be useful for informing indirect effects of the pandemic [14]. In recent studies of those pandemic related impacts we see in Davis et al. and Gerding et al. detailed information on the lack of proper home office ergonomic equipment and the need for corporations to invest in evaluation and intervention of those new work locations [15, 16].
This study presents several strengths and limitations. Using routinely collected data, we were able to apply a quasi-experimental analysis of workplace productivity measures prior to, during and following a major natural disaster in the greater Houston area. This was a novel application of the interrupted time series method and provides unique insights into workplace behavior during disasters and other disrupting events. Although routinely recording a range of behaviors, RSIGuard® data only provide information on work completed on the computer, which is not necessarily representative of the employee’s entire workday or productivity. We selected the variables in our analysis as a rough indicator of workplace productivity. However, true measures of productivity are difficult to determine due to the variation in objective measurements of “productivity” across industries and between employees. Future studies should consider using validated, objective questionnaires to collect supplemental measures of employee productivity during disaster recovery. The impacts of remote work on work and personal life balance are beyond this study. It should be noted that similar to pandemic remote work in 2020, employee feedback
to the corporation included a wide variety of comfort levels with the living at work approach necessitated by the storm displacement. In balancing future remote work policies, employers should consider employee access to quiet work space, other family responsibilities, provision of high-speed connections, access to ergonomically correct furnishings and other potential imbalances to access, recruitment and retention that remote work could have on the health and careers of certain workers. Finally, although these data are representative of white-collar employees in Houston, Texas, results may not be generalizable for other companies or other industries.
5Conclusion
This study provides supportive evidence for incorporating remote working policies in a company’s organizational strategy prior to a natural disaster or other disrupting event. These findings are particularly informative given current social distancing policies and dramatic increases in the demand for remote work in 2020/21.
Author contributions
KS was responsible for study design, data collection and initial analyses, and the drafting of the initial manuscript; MB served as PI for the funding sources of this project, development of the study concept and revision and submission of the manuscript; GS and LC contributed to the study design and revising the manuscript; AKR advised on the study design, performed data analyses, and contributed to revising the manuscript.
Conflict of interest
The authors have no potential conflicts of interest to disclose.
Data sharing statement
We do not have permission to share study data; however, access to the code used to perform analysis can be provided upon reasonable request.
Funding
This work was supported in part by a National Institute for Occupational Safety and Health (NIOSH) Training Grant 2TO3OH009410-09-00, BP America Inc., the Texas A&M Ergo Center. The study sponsors had no influence on the conduct of the study, the analysis or the decision to publish.
References
[1] | UN Office for Disaster Risk Reduction. The human cost of natural disasters: a global perspective. Geneva, Switzerland: UN Office for Disaster Risk Reduction, (2015) . |
[2] | Hoeppe P . Trends in weather related disasters –Consequences for insurers and society. Weather and Climate Extremes. (2016) ;11: :70–9. doi: https://doi.org/10.1016/j.wace.2015.10.002 |
[3] | NOAA. Billion-dollar weather and climate disasters: events https://www.ncdc.noaa.gov/billions/events/US/2019 [Accessed 18 August 2020]. |
[4] | Botzen WJW , Deschenes O , Sanders M . The economic impacts of natural disasters: a review of models and empirical studies. Rev Environ Econ Policy. (2019) ;13: (2):167–88. doi:10.1093/reep/rez004 |
[5] | Madrigano J , Chandra A , Costigan T , et al. Beyond disaster preparedness: building a resilience-oriented workforce for the future. Int J Environ Res Public Health. (2019) ;14: (12):1563. doi: 10.3390/ijerph14121563 |
[6] | Shultz JM , Galea S . Mitigating the mental and physical health consequences of Hurricane Harvey. JAMA. (2017) ;318: (15):1437–38. doi: 10.1001/jama.2017.14618 |
[7] | Bernal JL , Cummins S , Gasparrini A . Interrupted time series regression for the evaluation of public health interventions: a tutorial. Int J Epidemiol. (2017) ;46: (1):348–55. doi: 10.1093/ije/dyw098 |
[8] | Lopez Bernal J , Soumerai S , Gasparrini A . A methodological framework for model selection in interrupted time series studies. J Clin Epidemiol. (2018) ;103: :82–91. doi: 10.1016/j.jclinepi.2018.05.026 |
[9] | Enviance. RSIGuard https://www.rsiguard.com/2020 [Available from: https://www.rsiguard.com/accessed 19 August 2020.. |
[10] | Sharma P , Pickens A , Mehta R , et al. Smart Software Can Increase Sit-Stand Desk Transitions During Active Computer Use. Int J Environ Res Public Health. (2019) ;16: (13):2438. doi: 10.3390/ijerph16132438 |
[11] | Garrett G , Zhao H , Pickens A , et al. Computer-based prompt’s impact on postural variability and sit-stand desk usage behavior; a cluster randomized control trial. Appl Ergon. (2019) ;79: :17–24. doi: https://doi.org/10.1016/j.apergo.2019.04.003 |
[12] | Sharma PP , Mehta RK , Pickens A , et al. Sit-stand desk software can now monitor and prompt office workers to change health behaviors. Hum Factors. (2019) ;61: (5):816–24. doi: 10.1177/0018720818807043 |
[13] | Sharma PP , Benden M , Mehta RK , et al. A quantitative evaluation of electric sit-stand desk usage: 3-month in-situ workplace study. IISE Trans Occup Ergon Hum Factors. (2018) ;6: (2):76–83. doi: 10.1080/24725838.2018.1521351 |
[14] | Gallaway MS , Rigler J , Robinson S , et al. Trends in COVID-19 incidence after implementation of mitigation measures - Arizona, January 22-August 7, 2020. MMWR Morb Mortal Wkly Rep. (2020) ;69: (40):1460–63. doi: 10.15585/mmwr.mm6940e3 |
[15] | Davis KG , Kotowski SE , Daniels D , Gerding T , Naylor J , Syck M . The Home Office: Ergonomic Lessons From the “New Normal”, Ergonomics In Design. (2020) ;28: (4):4–10. |
[16] | Gerding T , Syck M , Daniel D , Naylor J , Kotowski SE , Gillespie GL , Freeman AM , Huston TR , Davis KG . An assessment of ergonomic issues in the home offices of university employees sent home due to the COVID-19 pandemic. Work. (2021) ;68: (4):981–92. |


