
Productivity in older versus younger workers: A systematic literature review
Abstract
BACKGROUND:
Worldwide ageing and thus, workforce ageing, is a concern for both developed and developing nations.
OBJECTIVE:
The aim of the current research was to determine, through a systematic literature review, the effects of age in three dimensions that are often used to define or assess productivity at work.
METHODS:
PICO framework was used to generate search strategies, inclusion criteria and terms. Scopus and PubMed databases were used. Peer-reviewed journal papers written in English and published (or in press) between January 2014 and December 2018 were included.
RESULTS:
After filtering through inclusion criteria, 74 papers were included in the review. Considering productivity, 41%of the findings showed no differences between younger and older workers, 31%report better productivity of younger workers and 28%reported that older workers had better productivity than younger workers. Performance was better in older workers (58%), presenteeism generally showed no significant differences between age groups (61%). Absenteeism was the only outcome where younger workers outperformed older workers (43%).
CONCLUSION:
Overall, there was no difference in productivity between older and younger workers. Older workers performed better than younger workers, but had more absenteeism, while presenteeism showed no differences. As ageing has come to workplaces, holistic approaches addressing total health are suggested to overcome the worldwide workforce ageing phenomenon.
1Introduction
Humanity is living an unprecedented situation. We are living longer than ever before [1, 2]. It is estimated that by 2050 the world’s population aged 60 years and older is expected to be about two billion, and today, 125 million people are aged 80 years or older [3]. By 2050, there will be almost this many (120 million) living in China alone, and 434 million people in this age group worldwide. By 2050, 80%of all older people will live in low- and middle-income countries [3].
Aging has been defined as the persistent decline in the age-specific fitness components of an organism due to internal physiological deterioration and as a complex biological process in which changes at mol-ecular, cellular, and organ levels result in a progress-ive, inevitable, and inescapable decrease in the body’s ability to respond appropriately to internal and/or ex-ternal stressors [4]. It is undeniable that ageing is associated with more chronic illness and other concomitant conditions, such as hearing loss, cataracts and refractive errors, back and neck pain, osteoarthritis, chronic obstructive pulmonary disease, diabetes, depression, and dementia [3]. It is often assumed that ageing presents biological and social changes in individuals, resulting from the impact of the accumulation of a wide variety of molecular and cellular damage over time which leads to a gradual decrease in physical and mental capacity, a growing risk of disease, and ultimately, death. However, these changes are neither linear nor consistent, and they are only loosely associated with a person’s age in years [1, 3], otherwise why while some 70 year-olds enjoy extremely good health and functioning, other 70 year-olds are frail and require significant help from others? While frailty is generally regarded as a problem of old age, the symptoms by which the phenotype is identified can also occur in younger people [5].
Age has been linked with decrements in some cap-acities, both physical and cognitive [4]. However, ageing alone is not necessarily associated with illness or lower performance, since there is a wide variation of ageing effects on people‘s capabilities related to how closely they are associated with other factors such as regular physical activity and everyday pract-ice of a particular skill. For example, physical str-ength can be associated with a lack of use, and it is not uncommon to find industrial working populations to show a conditioned pattern as a result of years of physical work, thus strength and work capacity can be maintained as they grow old [6, 7]. The definition of which age can be considered as “old” regarding work varies. For example, according to the Centers for Disease Control and Prevention (CDC), the age of 40 years is used as a starting point for the “older worker” [4] while the World Health Organization (WHO) states that it should be 45 years of age [8].
There are several definitions of productivity. For instance, the Organization for Economic Co-ope-ration and Development (OECD) defines it as a ratio of a volume measure of output to a volume measure of input use [9]. The International Labour Office (ILO) defines productivity as how efficiently resources are used; where it can be measured in terms of all factors of production combined (total factor productivity) or in terms of labour productivity, which is defined as output or value added divided by the amount of labour used to generate that output [10]. According to this latter definition, labour productivity increases when value added rises through the better use of all factors of production, either through efficiency or effectiveness or both [11]. Efficiency is determined by the amount of all types of resources that are necessary to obtain certain results and effectiveness by comparing what can produced with what was actually produced (i.e. planned versus actual outputs). Consequently, effectiveness is not related to the amount of resources that need to be committed to achieve that output. Productivity can be determined by looking at the obtained production (effectiveness) versus the invested effort for reaching the result (efficiency) i.e., if we can reach more with less effort, the level of productivity increases. Therefore, productivity can be defined as the sum of efficiency and effectiveness [11]. Some authors define productivity in terms of absenteeism and presenteeism [12, 13]. This is also correct, since not attending at work and getting paid (absenteeism) and showing up to work sick and producing less (presenteeism) can be converted to either direct or indirect cost, thus affecting productivity. In the current review, productivity will be considered in terms of three main components: performance (qu-antity or quality of work performed), absenteeism (not showing at work) and presenteeism (showing up sick).
Productivity deficiencies and age stereotypes are common towards older workers. The overall percep-tion is that older workers are weaker, have less ada-ptability, are less technologically savvy and show overall less performance than their younger counterparts. This can translate into discriminatory policies, thus affecting perceptions at an individual, company and state’s point of view, contributing to the creation of artificial barriers to older workers. [14–21]. A mixture of stereotypes and facts related to the decline associated with ageing are present in the literature and in the general populations thinking, which could prevent a sustainable working and overall quality of life for older workers (current and future). Therefore, the aim of this paper was to find, through a systematic literature review, the level of productivity of older workers when compared against their younger counterparts.
2Methods
To achieve the outlined goals, the systematic literature review (SLR) methodology [22] was used in this study. This methodology, besides being replicable and scientifically transparent, is also very useful to generate a basic framework for an in-depth analysis of the existing literature [22]. However, prior to the SLR, and as suggested by Denyer and Tranfield [23], a scoping study (exploratory review) of the field was produced. This was helpful to elucidate the existing basis of the topic, to identify if the proposed SLR fits the current body of knowledge, to define the key concepts and to define the research question to be addressed. Also, this SLR followed the five-step approach defined by Denyer and Tranfield [23]:
• Step 1: question formulation
• Step 2: locating studies
• Step 3: study selection and evaluation
• Step 4: analysis and synthesis
• Step 5: reporting and using the results
2.1Step 1: Question formulation
The first step (Step 1) of this SLR consisted of def-ining the research question for the study. The PICO (Population, Intervention, Control, Outcomes) fram-ework was used to generate this question since, according to Sacket et al. [24] and Thabane et al. [25], dividing a research question into four categories allows for a better understanding and identification of relevant information. Hence, the research question formulated for this SLR was: In workers’ population (P), how does the age group (I) younger (<45 years old) or older (>45 years old) (C) influence the work productivity (O)?
2.2Step 2: Locating studies
Step 2 comprised the selection of the bibliographic databases and the definition of the search strings to be used, which were aligned with the research question. Scopus and PubMed databases were selected as they cover a wide range of research areas with the most relevant peer-reviewed journals [26]. The sea-rch strategy considered 3 categories that were com-bined using a Boolean AND operator: (Work terms) AND (Ageing Terms) AND (Productivity terms). The terms within each category were combined using the Boolean OR operator (Table 1).
Table 1
Search terms
| Category | Terms |
| Work terms | worker OR workers OR employee OR employees OR laborer OR operator OR workplace OR “work environment” OR occupational. |
| Ageing terms | ageing OR aging OR aged OR elderly OR senior OR seniors OR older. |
| Productivity terms | performance OR production OR productivity OR output OR “task performance” OR “functional performance” OR efficiency OR effectiveness OR “performance capabilities” OR “work outcome” OR “client satisfaction” OR absenteeism OR presenteeism. |
2.3Step 3: Study selection and evaluation
Then, in Step 3, the inclusion and exclusion criteria were defined to select the most relevant studies to include in the review. The following key inclusion criteria were defined prior to the search: The search string was applied for Title, Abstract and Keywords in Scopus and Title and Abstract in PubMed; Original articles written in English and published (or in press) in peer-reviewed journals between January 2014 and December 2018.
References and abstracts were loaded into Mendeley and then transferred to Rayyan software, which was used, by three of the authors, for the screening of title and abstracts to identify relevant papers to retrieve for full text analysis. This process was performed independently by two of the authors applying the exclusion criteria at level 1a (Table 2) adapted from Kennedy et al., [27]. If the authors did not know how to answer a question, they were instructed to move forward to Level 1b (Table 2). Disagreements between authors were referred to a third author, and a decision was then made regarding its inclusion. Finally, full texts were independently reviewed for inclusion by the three authors applying the exclusion criteria defined at level 1b (Table 2).
Table 2
Screening questions and the response that led to exclusion
| Level of review | Question | Answer |
| 1a (Title and abstract) | Did a comparison to establish differences between age groups occur (at least two group one older than 45 and the other one younger than 45 years old)? | No |
| Did the comparison occur between workers? | No | |
| Is the article a review, commentary, letter to the editor, editorial or two pages or less in length? | Yes | |
| Is the article a RCT, NRCT, Test-retest or present any kind of intervention (independent variable)? | Yes | |
| Is the outcome a performance OR production OR productivity OR absenteeism OR presenteeism? | No | |
| 1b (Full article) | Should the article have been excluded in Level 1a (title and abstract) review for any of the following reasons (Refer to criteria 1–5 listed above)? | Yes |
RCT: random control trial, NRCT: Non-randomized controlled trial.
2.4Step 4: Analysis and synthesis
Step 4 consisted of analysing each paper in detail, extracting, and storing the information, to identify key issues. Primary studies meeting the inclusion criteria, which were reported in included reviews, were identified and the corresponding data extracted using a standardized data extraction form. The Quality Assessment Tools known as “QualSyst tools” was selected as it allows appraising quality and assessing potential for bias over a wide variety of research designs from experimental to observational [28]. Furthermore, this tool has one version for quantitative studies and another one for qualitative studies. The former version was the one used in this review. The quantitative version corresponds to a checklist of 14 questions, giving the possibility of answering “yes”, “no”, “partial” or “not applicable”. The corresponding score are 2 points for “yes” 1 point for “partial”, and 0 points for “no”. The total score is the average score computed with all (applied) answers.
The QualSyst was used by three of the authors to evaluate the internal and external validity of the studies considered in the review. The QualSyst tool was originally created as a threshold that allows a study to be included in a review through a cut-off point (0.55 to 0.75) [28]. In this review the QualSyst cut-off score of 0.55 was chosen in order to capture 75%of the articles initially deemed as relevant for the review as well as to ensure inclusion of several descriptive articles which contained valuable data [29].
2.5Step 5: Reporting and using the results
The current paper can be considered as a formal presentation of the results obtained, comprising Step 5. The results were grouped (Tables 4 to 10) according to the productivity variables considered namely: performance, presenteeism and absenteeism. In this paper productivity considered the three variables me-ntioned before. Furthermore, the results were categorized according to the sample population considered in the reviewers’ papers: workers with no baseline sickness nor health condition and workers with a declared baseline sickness or health condition.
Table 4
Summary of the results
| Variable | Workers with no a BS nor HC | Workers with declared BS or HC | Overall results | ||||||
| (+) | (+/–) | (–) | (+) | (+/–) | (–) | (+) | (+/–) | (–) | |
| Performance | 11 | 3 | 3 | 0 | 2 | 0 | 11 | 5 | 3 |
| Presenteeism | 4 | 5 | 2 | 1 | 6 | 0 | 5 | 11 | 2 |
| Absenteeism | 7 | 12 | 16 | 2 | 8 | 6 | 9 | 20 | 22 |
| Productivity | 22 (35%) | 20 (32%) | 21 (33%) | 3 (12%) | 16 (64%) | 6 (24%) | 25 (28%) | 36 (41%) | 27 (31%) |
BS: baseline sickness, HC: health condition. For this study productivity is performance + presenteeism + absenteeism.
Table 5
Performance findings with no specific baseline sickness
| Author | Study design | Main objective | Number (n), age (yr) country (c) | Occupation/ industry | Type of analysis (statistic test) | Relevant results | QR |
| Ang & Madsen, 2015 | Cohort | Examine the productivity growth effects of educational attainment among different age groups and educational categories | n: 567 observations yr: three age groups (20–34, 35–49, and 50–64) c: 21 OECD countries over the period 1870–2009 | Not specified | Analysed whether the oldest educated age cohort contributes more to productivity growth than its younger counterpart and, therefore, whether raising the pension age among educated workers can counterbalance the income drag of increasing old-age dependency (Regression model) | (+) older workers (50+) with tertiary education are markedly more productive than their younger counterparts. | 0,8 |
| Bal et al., 2015 | longitudinal study | To investigate the longitudinal effects of mass career customization (MCC) on job attitudes and objective career outcomes of employees | n: 4222 yr: younger than the mean age (25 years), and for employees one SD older than the mean (43 years). c: Netherlands | employees of a professional financial service firm | All employees from one large company completed online surveys during 2009, 2010 and 2011 regarding perceptions of MCC on engagement, commitment and productivity mediated by supervisor support (Factor analysis) | (+) mass career customization (MCC) use with engagement were more strongly positive among middle-aged and older workers who received high manager support | 0,73 |
| *Bal & Dorenbosch, 2015 | Cross-sectional | Investigate whether the availability and actual use of individualised Human Resource Management (HRM) contributes to organisational performance (absenteeism and growth) | n: 591 organizations yr: average age 39,6 (24,78) years. Two age groups used, below 45 and 45 and above c: Netherlands | National survey aimed to all workers from public, private and non-profit organizations | Stratified representative online and paper survey. Respondents (company owners, management team members or HR managers) were able to participate through filling out either a paper-and pencil or a digital questionnaire. (hierarchical regression analyses) | (+/–) There was no difference in sickness absence (+/–) There was no difference in performance growth | 0,89 |
| Chiesa et al., 2016 | Cross-sectional | To explore the relationship between organizational age stereotypes and occupational self-efficacy, the latter defined as the competence that a person feels concerning the ability to successfully fulfil his or her job tasks | n: 4667 yr: 18 to 65 year (under 50 and over 50 years old) c: Italy | Italian bank sector’s employees | Online survey regarding the outcome variables were collected among participants. Demographics and the Occupational Self-Efficacy Scale (short form) were used and then analysed exploratory factor analysis | (+) Older workers are productive, reliable but few adaptable to the changes. Older workers’ productivity was positively evaluated by respondents. | 0,87 |
| Dewa et al., 2016 | Cross-sectional | Exploring contribution of high chronic exposure to stressful work demands and need for recovery (NFR) to work productivity loss controlling for the contribution of other factors, including demographic characteristics, work environment, work perception, and health status. | n:2219 yr: <30, 30–39, 40–49, 50–59, 60–64, or > 65 years c: Canada | Not specified | Data from a population-based survey of 2219 Ontario workers. The Work Limitations Questionnaire was used to measure work productivity loss (WPL). The relationship between NFR and WPL was examined using four multiple regression models. (multiple regression) | (+) Those who are in younger age groups (under 39) have higher mean percentage of time during which they experience losses with respect to the four productivity loss dimensions | 0,73 |
| *Fritzsche et al., 2014 | Cross-sectional | To investigate simultaneous effects of both team level factors on absenteeism and performance (error rates) over one year in a sample of 56 car assembly teams | n:623 yr: under 25 years, 25–35 years, 35–45 years,45–55 and over 55 years c: Germany | Car assembly operators | Individual demographics as well as measures of absenteeism and job performance were collected from personnel software during a sampling period of 14 months including 254 working days. (Hierarchical regression analyses) | (+/–) age was related to prolonged absenteeism and more mistakes in work planning, but not to overall performance (–) age was related to prolonged absenteeism and more mistakes in work planning, but not to overall performance | 0,94 |
| Godinho et al., 2016 | Cross-sectional | To analyse the prevalence of reduced work ability and associated factors among technical-administrative workers in a public university. | n:600 yr: 21 to 68 years, average 45.1 (SD±11.0); c: Brazil | Technical-administrative workers in education | Work ability was measured using the work ability index. (Poisson regression) | (–) Age 50 years old or above was found to be associated with reduced work ability | 0,84 |
| Ishii et al., 2018 | Cross-sectional | To examine the relationships between productivity, work engagement, and self-reported work-related sedentary behaviour in Japanese adults at various worksites. | n:2572 yr: (20–59 years old) 20–29, 30–39, 40–49, 50–59 years c: Japan | Not specified | 2572 individuals (20–59 years old) via an internet survey and assessed their demographic characteristics, work-related characteristics, and sedentary behaviour (Logistic regression analyses) | (+/–) Sedentarism mediated productivity and engagement independent of age. | 0,83 |
| Jankowiak et al., 2018 | Cross-sectional | To obtain normative values on the Norwegian Function Assessment Scale (NFAS) as part of the Study on Mental Health at Work. | n: 4511 employees. yr: Ages 31 to 60 (51–60, 41–50, 31–40) c: Germany | Not specified | NFAS was included in the Study on Mental Health at Work in 2011/12, in a representative German survey of employees. Data was analysed by age decades, professional qualification, and by disabilities, congenital diseases and accidents, stratified by sex (generalised linear regression analyses) | (–) Age was associated with the NFAS total and domain scores of both sexes. | 0,92 |
| Kozuki & Wuliji, 2018 | Cross-sectional | To describe village health teams (VHT) productivity and performance in Busia District, Uganda, explore the relationship between VHT productivity and performance, and investigate independent factors that influence VHT productivity and performance. | n:147 yr: <35, 35–50 > = 50 c: Uganda | Community health workers | Data were collected between March and May 2013 on the performance and productivity of VHT members related to village visits and activities for saving maternal and child lives, as well as on independent factors that may be associated with these measures. Data were collected through direct observation of VHT activities, structured interviews with VHTs, and review of available records (multiple linear regression models) | (+) older age (>50) was significantly associated with greater productivity | 0,89 |
| Lee, 2016 | Cross-sectional | Examined how performance of work requiring emotional labour mediates employee age by using an individual’s pride in their job as a criterion variable. | n:167 yr: younger adults (25 to 44 years old) and older adults (45 to 65 years old) c: USA | Public service employees | Survey examined how performance of work requiring emotional labour mediates employee age by using an individual’s pride in their job as a criterion variable. (structural equation modelling) | (+) Employee age was positively related to job pride. Older employees had more pride in their job than the younger employees did, used false face acting less often, and reported performing more work requiring emotional labour than did the younger employees | 0,71 |
| Lohela-Karlsson et al., 2018 | Cross-sectional | To investigate the prevalence of perceived health and work environment problems and how these are associated with subjective production loss among women and men at an academic workplace. | n:2022 yr: ≤29, 30–39, 40–49, 50–59, and ≥60 years. c: Sweden | Academics | Questionnaire applied in 2011 to all employees at a Swedish university to investigate differences in health and work environment problems. Employees who reported having experienced work environment or health problems in the previous seven days were included in the analyses in order to investigate differences in subjective production loss. (Spearman correlations, Student’s t-test, One-way Anova and generalized linear models.) | (+) lowest levels of production loss was among the oldest employees aged 50 or above. | 0,80 |
| Mache et al., 2015 | Cross-sectional | To evaluate psychiatrists’ work ability and to examine on whether the motivational concept of work engagement and other supportive job demands are associated with work ability among psychiatrists working in German hospitals. | n: 248 yr: <25, 26–30, 31–35, 36–40, 41–45, 46–50, >50 c: Germany | Psychiatrists working in German hospitals | The Utrecht Work Engagement Scale, the Copenhagen Psychosocial Questionnaire and the Work Ability Index were used to evaluate psychiatrists’ work engagement, working conditions and work ability correlation-regression- reliability analyses and analysis of variance (ANOVA) | (–) The scores in the category excellent work ability decreased significantly with age. Psychiatrists aged 26–35 years showed the highest work ability scores compared to the other age groups. | 0,87 |
| Malinen et al., 2018 | Cross-sectional | To examine the relationship between operators’ age, experience and mechanized harvesting productivity in clear cutting and thinning. | n: 28 operators and 38 different CTL harvesters. yr: 20–24, 25–29, 30–34, 35–39, 40–44, 45–50, 50–54 years c: Finland | Operators and CTL harvesters | The data were five-year follow-up data from 28 operators and 38 CTL harvesters. Productivities were converted to relative productivities and average productivity models were created (productivity ratio models) | (+) The relative productivity of operators at the age of 45 years in clear cuttings was 17.8%higher and in thinning 14.9%higher than that of operators at the age of 25 years. | 0,8 |
| Martinez et al., 2015 | Cross-sectional | to evaluate the association between exposure to psychosocial work stressors (job strain and effort-reward imbalance) and changes in work ability in a 3-year cohort of Brazilian hospital employees. | n:423 yr: under 29.9 years old, 30.0–39.9 years old, 40.0–49.9 years old, +50 years c: Brazil | Healthcare | Work ability and psychosocial work stressors questionnaires. Logistic regression models adjusted for potential con-founders such as: demographic, occupational features, social support, over commitment, and situations liable to cause pain/injury. (Logistic regression models) | (+) Decrease of work ability occurred more often among the participants younger than 30 years old compared to the older ones | 0,81 |
| Nakagawa et al., 2014 | Cross-sectional | Investigated the association of job demands (i.e., psychological demands) and job resources (i.e., decision latitude, supervisor support, co-worker support, and extrinsic reward) with job performance. | n: 1,198 workers yr: 36.9 (8.2) years 20’s or less, 30’s, 40’s, and 50’s or more c: Japan | Manufacturing company | Completed a self-administered questionnaire that included the Job Content Questionnaire, Effort-Reward Imbalance Questionnaire, World Health Organization Health and Work Performance Questionnaire, and demographic survey. Hierarchical multiple regression analyses were conducted. hierarchical multiple regression analyses | (+) Age was positively assessed with performance. The association of decision latitude with job performance was stronger among participants in the 40’s and older groups than among participants in the 30’s and younger age groups. | 0,83 |
| Tsai & Thompson, 2015 | Cross-sectional | Test relations between social determinants, performance and injuries | n: 194 Chinese immigrants yr: 18–25, 26–35, 36–45, 46–55, 56–65, >65 years c: USA | Food services sector in King County | Multi measure interview; tested the integrated model using structural equation modelling (structural equation modelling (SEM)) | (+) Age was positively associated with perceived work performance | 0,81 |
*Author with multiple findings and present in more than one table.
Table 6
Presenteeism findings with no specific baseline sickness
| Author | Study design | Main objective | Number (n), age (yr), country (c) | Occupation/ industry | Type of analysis (statistic test) | Relevant results | QR |
| *Chambers et al., 2017 | Cross-sectional | To estimate rates of presenteeism in the New Zealand senior medical workforce and identify reasons why this workforce feels pressured to work through illness. | n: 1,806 yr: 20–29, 30–39, 40–49, 50–59, >60 c: New Zealand | Doctors and dentist | Survey to publicly employed senior doctors and dentists. Relationships between rates of presenteeism, sick leave and demographic factors were explored alongside views on cultural and professional norms. (Spearman’s rank correlation coefficients, Kruskal–Wallis non-parametric ANOVA and Chi-square tests) | (+) Women and younger doctors had highest rates of presenteeism. Older respondents were less likely to assert presenteeism and turn up to work infectious. There was a negative association between age and both number of sick leave days taken and number of presenteeism days. | 0,73 |
| Chiu et al., 2017 | Cross-sectional | To describe the magnitude of and characterize reasons for working with the flue (ILI) across a range of occupation types and work settings among healthcare professionals (HCP) and non-HCP | n: 1,914 yr: 18–34; 35–49; 50 + years c: USA | Health care professionals and nonprofessional HCP | Using a national nonprobability Internet panel survey of 1,914 HCP during the 2014–2015 influenza season, calculated the frequency of working with self-reported ILI (chi-square tests) | (+/–) no relationship was found between presenteeism and study variables | 0,57 |
| DErrico et al., 2016 | Cross-sectional | to assess which workrelated factors were associated with presenteeism among European workers | n: 30,279 yr: 15–24, 25–34, 35–44, 45–54, 55 + years c: Europe | All occupations in registry | Conducted on data from the European Working Conditions Survey 2010. The relationship between work related factors and presenteeism was assessed through Poisson multivariate robust regression models, adjusting for individual and work related characteristics (Poisson multivariate robust regression models) | (+) 25–34 and 35–44 age groups had higher presenteeism in Europe. | 0,73 |
| *Gerich, 2014 | Cross-sectional | Comparing the association between adjustment latitude and days of sickness absence and presence with an estimator of the individual’s decision-making propensity. | n:781 yr: ≤34, 35–54, ≥55 years c: Austria | Manual and non-manual Occupations | Through a traditional mail questionnaire examined the association between adjustment latitude and days of sickness absence, sickness presence, and an estimator for the individual sickness absence and sickness presence propensity. (Regression model) | (+/–) age was not associated with presenteeism (–) age was associated with SA but not presenteeism | 0,74 |
| *Grossmeier et al., 2015 | Longitudinal | To assess how health status change influenced concurrent and subsequent levels of change in self-reported absenteeism and presenteeism | n: 96,679 employees from 16 large age and sex-diverse companies. yr: 18–25, 26–35, 36–45, 46–55, 56–65 years c: USA | Not specified | Online questionnaire between 2007 and 2012 including measures of the employee’s health risk profile, indicators of absenteeism from work because of health-related issues, and the productivity limitations employees experience because of health- related issues. (structural equation modelling) | (+/–) age does not impact the rate of change in productivity over time. | 0,88 |
| Jeon et al., 2014 | Cross-sectional | to identify the association between presenteeism and long working hours, shiftwork, and occupational stress | n: 6,220 yr: <30, 30–39, 40–49, 50–59, ≥60 (15 to 83) c: Korea | Blue- and white-collar workers | Analysed data from the second Korean Working Conditions Survey (KWCS) conducted in 2010 to test the statistical association between presenteeism and working hours, shiftwork, and occupational stress (multivariate logistic regression) | (–) younger workers had a lower rate of presenteeism than older age groups | 0,89 |
| *Kenny et al., 2018 | Cross-sectional | To compare professional classical orchestral musicians of different ages on a range of physical and psychological factors and effects in performance | n: 377 yr: 18–30, 31–45, 46–55, 55 + years c: Australia | Professional orchestral musicians | Respondents were sent a self-report survey at the commencement of the study, which they mailed in self-addressed, stamped return envelopes provided by the researchers. A range of physical tests was performed in situ (i.e., at the orchestra’s location) by trained physiotherapists under the supervision of an occupational therapist (TD) (ANOVA) | (+/–) Older age groups of professional orchestral musicians, had no difference either in terms of their physical function, performance-related pain, effort exerted while playing, psychological measures assessing social anxiety (although the oldest group had the lowest scores on this measure), music performance anxiety, depression, core self-concept, days lost from work, or workplace satisfaction. | 0,78 |
| *Kim & Mo, 2016 | Cross-sectional | To examine the association of this nonstandard employment with absenteeism and presenteeism. | n: 26,611 full-time waged workers yr: 15–24, 25–34, 35–44, 45–54, 55–64, and≥65 years old. c: Korea | Not specified | Self-reported data from the third wave of the Korean Working Conditions Survey in 2011. Employment condition was classified into six categories based on two contracts (Logistic regression models, odds ratios (OR) with 95 %confidence intervals (CI).) | (–) Both absenteeism and presenteeism generally were more frequent among women, older individuals, less educated individuals, individuals with lower incomes, and individuals with longer working hours. | 0,90 |
| Mandiracioglu et al., 2015 | Cross-sectional | To explore the relationship between person-based variables and other work-related variables of presenteeism in four different private sector workplaces | n: 413 yr: 18–29, 30–39, 40–49, 50 years or older c: Turkey | Supermarket, food, packing and service sectors | Self-administered questionnaire related to demographic and socio-economic characteristics, social networks, work-related factors, lifestyle factors and state of health. Presenteeism was assessed using the Stanford Presenteeism Scale 6 (SPS-6). (ANOVA and t tests and linear regression analysis) | (+/–) Age was not associated with presenteeism | 0,76 |
| Susser & Ziebarth, 2016 | Cross-sectional | To profile the presenteeism in the United States. | n: 6,354 yr: Under 25, 25–34, 35–65, Above 65 years c: USA | All occupations on the registry | Uses the Bureau of Labor Statistics (BLS) provided ATUS survey. In 2011, a special “Leave Module” was included in the ATUS. (empirical analysis). | (+) Presenteeism was highest for age groups 25–34 | 0,76 |
| Taloyan et al., 2016 | Cross-sectional | To investigate prevalence of (sickness presenteeism) SP among the Police employees in Sweden in 2007 and in 2010; and the association between demographics, seniority, occupational group and self-reported health and SP | n: from 2007 (n = 17,512) and 2010 (n = 18,415) yr: under 35, 35–54, 55 + c: Sweden | Police employees | Web based self-reported surveys of the employees of the Swedish Police, in 2007 and 2010. (logistic regression with odds ratios (OR) and 95%confidence intervals (CI)) | (+) Older employees (>54 years of age) had significantly lower risk of high SP than younger (<35 years of age) in the adjusted models, also middle-aged employees had lower OR than the younger employees. | 0,83 |
*Author with multiple findings and present in more than one table.
Table 7
Absenteeism findings with no specific baseline sickness
| Author | Study design | Main objective | Number (n), age (yr) country (c) | Occupation/ industry | Type of analysis (statistic test) | Relevant results | QR |
| Aaviksoo & Kiivet, 2016 | Cross sectional | To describe sickness absence patterns before and after the implementation of sickness benefit cuts and to evaluate the change in sick-leave use after the reform | n: 227,981 sick-leave users in 2008 and 152,102 sick-leave users in 2011 yr: 20–64-year-old. Compared age cohorts in 9-year intervals 20–29; 30–39; 40–49; 50–59; 60–64. c: Estonia | All workers part of Estonian Health Insurance Fund (EHIF) in 2008 and 2011 | based on all sick-leave episodes of 20–64-year-old employees registered by the Estonian Health Insurance Fund in 2008 and 2011- Population and absentee-level sickness absence measures were used to describe sickness absence. Multiple logistic regression analysis was performed to explore associations between sick-pay cut and sickness absence measures (Multiple logistic regression, Odds ratio with 95%CI and rate ratio (RR) at 95%CI.) | (+/–) younger (20–29) and older groups (60–64) had higher levels of absenteeism. | 0,87 |
| Airaksinen et al., 2018 | Cross-sectional | To develop and validate a risk prediction model for long-term sickness absence | n: 65775 municipal employees from FPS and 13 527 employed adults from HeSSup yr: 20–24, 30–34, 40–44, and 50–54 years c: Finland | Public service workers | Survey responses on work and lifestyle related questions were linked to sickness absence records to develop a prediction score for medically-certified sickness absence lasting > 9 days and≥90 days. (Regression models) | (–) age was a predictor of sickness absence, but so do other factors (self-rated health, depression, sex, socioeconomic position, previous sickness absences, number of chronic diseases, smoking, shift work, working night shift, and quadratic terms for body mass index and Jenkins sleep scale). | 0,89 |
| Antai et al., 2015 | Cross-sectional | To investigate the association between poor work-life balance and sickness absence in 4 Nordic welfare states | n: 4186 yr: 15–29, 30–49, 50–65 years c: Denmark, Finland, Sweden, and Norway | Not specified | Multivariable logistic regression analysis obtained from the 2010 European Working Conditions Survey (EWCS). Self-reported sickness absence was measured as absence for≥7 days from work for health reasons. (Multivariable logistic regression) | (+/–) age did not show a significant association with a sickness absence | 0,89 |
| Ariansen, 2014 | Retrospective analysis study | To examine whether the heightened sickness absence among young pregnant women in Norway is due to a pre- ponderance of working-class women in this group | n: 180 483 yr: 20 to 54-year, pregnant working women individuals c: Norway | All women employed in Norway during study period | Data collected by the Norwegian Labour and Welfare Administration, the Norwegian Tax Administration and the Ministry of Health and Care Services. Number of sick days were used. (A zero-inflated Poisson regression) | (+) Young pregnant women have a higher frequency of sick- ness absence than do their older counterparts. Occupational class largely accounts for the age differentials, but only among first-time pregnant women | 0,89 |
| Assuncao et al., 2016 | Cross-sectional | To examine whether individual characteristics and working conditions influenced reports of sick leave among a population of Brazilian magistrates. | n:569 yr: under 34; 34–46; above 46 c: Brazil | Court Magistrates | A web-based survey was conducted in 2011 in such a way as to reach the entire population of Brazilian Labor-law magistrates across the country. The variable of interest related to the question: “Have you taken any medical leave due to illness over the last 12 months?” (Logistic regression) | (+/–) no significant effect of age was found on sick leave. Organizational factors and personal factors were significantly associated with absenteeism among the magistrates | 0,70 |
| *Bal & Dorenbosch, 2015 | Cross-sectional | Investigate whether the availability and actual use of individualised Human Resource Management (HRM) contributes to organisational performance (absenteeism and growth) | n: 591 organizations yr: average age 39,6 (24,78) years. Two age groups used, below 45 and 45 and above c: Netherlands | National survey aimed to all workers from public, private and non-profit organizations | Stratified representative online and paper survey. Respondents (company owners, management team members or HR managers) were able to participate through filling out either a paper-and pencil or a digital questionnaire. (hierarchical regression analyses) | (+/–) There was no difference in sickness absence (+/–) There was no difference in performance growth | 0,89 |
| Bogaert et al., 2014 | Cross-sectional | To examine the mental, physical, and work-related health of Flemish secondary school teachers and identify the impact on those health variables by demographic and teaching-related factors and various types of absence | n: 1066 yr: under 30, 30–55 years, >55 years c: Belgium | Teachers | Online survey conducted across a representative sample of secondary school teachers. Work-related factors such as job satisfaction, occupational stress, and absenteeism were also collected. (t-tests and ANOVAs, and Pearson coefficients) | (+/–) age had no effect on absenteeism | 0,80 |
| Catano & Bissonnette, 2014 | Cross-sectional | To investigate the relationship between shift work and sickness absence while controlling for organizational and individual characteristics | n:20000 yr: <25, 26–30, 31–40, 42–50, >51 c: Canada | 6000 private-sector firms and 20 000 employees Not specified | Used archive data collected from three national surveys in Canada. The employees reported the number of paid sickness absence days in the past 12 months. (chi-squared analyses, hierarchical regressions) | (+/–) age had no effect on sickness absence | 0,80 |
| *Chambers et al., 2017 | Cross-sectional | To estimate rates of presenteeism in the New Zealand senior medical workforce and identify reasons why this workforce feels pressured to work through illness. | n: 1,806 yr: 20–29, 30–39, 40–49, 50–59, >60 c: New Zealand | Doctors and dentist | Survey to publicly employed senior doctors and dentists. Relationships between rates of presenteeism, sick leave and demographic factors were explored alongside views on cultural and professional norms. (Spearman’s rank correlation coefficients, Kruskal–Wallis non-parametric ANOVA and Chi-square tests) | (+) Women and younger doctors had highest rates of presenteeism. Older respondents were less likely to assert presenteeism and turn up to work infectious. There was a negative association between age and both number of sick leave days taken and number of presenteeism days. | 0,73 |
| Fitzgerald et al., 2016 | Cross-sectional | To investigate what health status outcomes and lifestyle characteristics influence the frequency of workplace absenteeism, using objective measures for both absenteeism and health status outcomes. | n: 828 yr: 18–29, 30–44, 45–65 c: Ireland | Not specified | Questionnaires and Annual count absenteeism data were collected. Physical assessments included objective health status measures (BMI, midway waist circumference and blood pressure). FFQ measured diet quality from which DASH (Dietary Approaches to Stop Hypertension) scores were constructed. Examined associations between health status outcomes, lifestyle characteristics and absenteeism. (zero-inflated negative binomial regression model) | (+/–) age was not associated with SA | 0,82 |
| *Fritzsche et al., 2014 | Cross-sectional | To investigate simultaneous effects of both team level factors on absenteeism and performance (error rates) over one year in a sample of 56 car assembly teams | n: 623 yr: under 25 years, 25–35 years, 35–45 years, 45–55 and over 55 years c: Germany | Car assembly operators | Individual demographics as well as measures of absenteeism and job performance were collected from personnel software during a sampling period of 14 months including 254 working days. (Hierarchical regression analyses) | (+/–) age was related to prolonged absenteeism and more mistakes in work planning, but not to overall performance (–) age was related to prolonged absenteeism and more mistakes in work planning, but not to overall performance | 0,94 |
| Gabbay et al., 2015 | Cross-sectional | To investigate whether use of the fit note (compared to its predecessor, the ‘sick note’) has contributed to a reduction in the likelihood of the patient having a ‘long-term’ (>12 week) certified sickness episode at seven practices. | n: N/S yr:<35, 35–50, >50 years c: UK | Not specified | Twelve-month collection of fit note data at 68 general practices in eight regions of England, Wales and Scotland between 2011 and 2013. Secondary analysis of sick note data collected at seven general practices in 2001/2002. All employed patients receiving at least one fit note at practices within the collection period were included in the study. (Logistic regression models) | (–) older patient age was significantly associated with the >3 week, >6 week and long-term (>12 week) SA | 0,78 |
| Gajewski et al., 2015 | Longitudinal | To investigate the associations between demographic variables and sick leave use. | n: 2,407 males and 4,374 females yr: 20–34, 35–44, 45–54, 55+ c: USA | Full-Time Civil Servants working at a Federal Agency | Analysed sick leave use among civil servants at a federal agency from 2004 to 2012 by demographic and other specific variables. (Generalized linear models with the Poisson distributions) | (–) younger groups took the least amount of sick leave | 0,83 |
| Grynderup et al., 2017 | Longitudinal | To investigate to what extent morning or evening cortisol levels were associated with long-term sickness absence and if cortisol mediated the association between workplace bullying and long-term sickness absence | n: 5418 eligible participants contributed with 7451 observations across the three rounds of the study yr: <35 years, 35–44 years, 45–54 years, >55 years c: Denmark | Civil servants and hospital employees | Participants came from two Danish cohort studies, the (“Psychosocial Risk factors for Stress and Mental disease”) cohort and the “Workplace Bullying and Harassment”. Information about exposure to workplace bullying and morning and evening salivary cortisol was collected at three time points with approximately two years in between. After each data collection, all participants were followed for two years in registers. Association between cortisol levels and subsequent sickness absence was assessed by logistic regression (logistic regression) | (+/–) age was not associated with SA | 0,82 |
| *Gerich, 2014 | Cross-sectional | Comparing the association between adjustment latitude and days of sickness absence and presence with an estimator of the individual’s decision-making propensity. | n: 781 yr: ≤34, 35–54, ≥55 years c: Austria | Manual and non-manual occupations | Through a traditional mail questionnaire examined the association between adjustment latitude and days of sickness absence, sickness presence, and an estimator for the individual sickness absence and sickness presence propensity. (Regression model) | (+/–) age was not associated with presenteeism (–) age was associated with SA but not presenteeism | 0,74 |
| *Grossmeier et al., 2015 | Longitudinal | To assess how health status change influenced concurrent and subsequent levels of change in self-reported absenteeism and presenteeism | n: 96,679 employees from 16 large age and sex-diverse companies. yr: 18–25, 26–35, 36–45, 46–55, 56–65 years c: USA | Not specified | Online questionnaire between 2007 and 2012 including measures of the employee’s health risk profile, indicators of absenteeism from work because of health-related issues, and the productivity limitations employees experience because of health- related issues. (structural equation modelling) | (+/–) age does not impact the rate of change in productivity over time. | 0,88 |
| *Kenny et al., 2018 | Cross-sectional | To compare professional classical orchestral musicians of different ages on a range of physical and psychological factors and effects in performance | n: 377 yr: 18–30, 31–45, 46–55, 55 + years c: Australia | Professional orchestral musicians from eight Australian orchestras | Respondents were sent a self-report survey at the commencement of the study, which they mailed in self-addressed, stamped return envelopes provided by the researchers. A range of physical tests was performed in situ (i.e., at the orchestra’s location) by trained physiotherapists under the supervision of an occupational therapist (TD) (ANOVA) | (+/–) Older age groups of professional orchestral musicians, had no difference either in terms of their physical function, performance-related pain, effort exerted while playing, psychological measures assessing social anxiety (although the oldest group had the lowest scores on this measure), music performance anxiety, depression, core self-concept, days lost from work, or workplace satisfaction. | 0,78 |
| *Kim & Mo, 2016 | Cross-sectional | To examine the association of this nonstandard employment with absenteeism and presenteeism. | n: 26,611 full-time waged workers yr: 15–24, 25–34, 35–44, 45–54, 55–64, and≥65 years old. c: Korea | Not specified | Self-reported data from the third wave of the Korean Working Conditions Survey in 2011. Employment condition was classified into six categories based on two contracts (Logistic regression models, odds ratios (OR) with 95%confidence intervals (CI).) | (–) Both absenteeism and presenteeism generally were more frequent among women, older individuals, less educated individuals, individuals with lower incomes, and individuals with longer working hours. | 0,90 |
| Krane et al., 2014 | Cross-sectional | To assess the development in sickness absence rates, short-term and long-term absence, and frequency of sick leave episodes from 2004 to 2008 in the health and care sectors in the cities of Kristiansand, Norway, and Aarhus, Denmark. | n: 3,181 (Norway) and 8,545 employees (Denmark) yr: 20–29, 30–39, 40–49, 50–59, 60–67 years c: Denmark, Norway | Healthcare workers | Data from 2004 to 2008 extracted from the personnel registers of the municipalities for 3,181 and 8,545 female employees, respectively. Age-specific comparative statistics on sickness absence rates (number of calendar days of sickness absence/possible working days) and number of sick leave episodes were calculated for each year of the study period (logistic regression models) | (+) SA rates were highest in the 20–29-year-old age groups in both countries. | 0,83 |
| Leao et al., 2017 | Cross-sectional | To investigate the risk factors for incidence and duration of sickness absence in a large cohort of healthy workers, who were followed from their first day of work in the municipality. | n: 18,450 yr: ≤24, 25–34, 35–44, ≥45 c: Brazil | Municipal workers (health, primary education, various inspection services and a range of blue- and white-collar jobs) | Data of certified sickness absences longer than 3 days were analysed. The association between sickness absence and socio demographic and occupational characteristics was examined using negative binomial regression models (regression models) | (–) The occurrence of absence increased with age. Other factors were involved. | 0,90 |
| Leao et al., 2015 | Cross-sectional | To assess the profile and indicators of sickness absence among public workers from the municipality of Goiania, in the State of Goiás, Brazil. | n: 28,230 yr: 18–40, 41–70 c: Brazil | Public sector employees | A cross-sectional study on certified sick leaves, lasting longer than three days. Prevalence rates were calculated using as main criteria the number of individuals, episodes and sick days (regression models) | (–) The occurrence of absence increased with age. Other factors were involved. | 0,88 |
| Milner et al., 2015 | Longitudinal | To examine the relationship between changes in an individual’s overall psychosocial job quality and variation in sickness absence using data from a longitudinal cohort study | n: 13,000 yr: 15–24, 25–34, 35–44, 45–54, 55–64, ≥65 c: Australia | Not specified | Examined the relationship between changes in individuals’ overall psychosocial job quality and variation in sickness absence. The outcome variables were paid sickness absence (yes/no) and number of days of paid sickness absence in the past year (2005–2012). The main exposure variable was psychosocial job quality, measured using a psychosocial job quality index (levels of job control, demands and complexity, insecurity, and perceptions of unfair pay). Analysis was conducted using longitudinal fixed-effects logistic regression models and negative binomial regression models. (logistic regression models and negative binomial regression models) | (–) Results showed significant effect of age on SA | 0,99 |
| MurciaLopez et al., 2016 | Cross-sectional | to determine whether the duration of SA episodes has been affected during the economic crisis period, and to what extent. | n: 983,108 workers and 451,801 SA episodes. yr: <25, 25–34, 35–44, 45–54, 55–64, >64 years c: Spain | Spanish workers | Bivariate and multivariate analyses were performed using Cox proportional hazards models to estimate the hazard ratios (HRs) and corresponding 95%confidence intervals (95%CIs) | (–) SA duration increasing with age for both sexes | 0,83 |
| Mytton et al., 2016 | Cross-sectional | to explore longitudinal associations of active commuting (cycling to work and walking to work with physical wellbeing), mental wellbeing and sickness absence. | n:801 yr: 16–29, 30–39, 40–49, 50–59, ≥60 years c: UK | Cambridge workers | Used data from the Commuting and Health in Cambridge study to test associations between: (a) maintenance of cycling (or walking) to work over a one year period and indices of wellbeing at the end of that one year period; and (b) associations between change in cycling (or walking) to work and change in indices of wellbeing. Linear regression was used for testing associations and negative binomial regression for sickness absence (Regression models) | (+/–) no clear relationship was found between age and SA | 0,83 |
| Natti et al., 2015 | Longitudinal | to investigate whether the effects of time pressure on long sickness absence vary by the level of working time control | n: 3400 yr: 18–34, 35–49, 50–64 c: Finland | Finnish workers | Self-rated survey (Finnish Quality of Work Life Survey 2003). A negative binomial model was used in the analysis of long-term sickness absence days during 2004–2006. The results are adjusted for several background and work-related factors and controlled for baseline absenteeism in 2002. (ANOVA) | (–) Sickness absence was more common for participants aged 50 years and above than other groups | 0,90 |
| Natti et al., 2014 | Cross-sectional | n: 1447 men and 1624 women yr: 15–34, 35–49, 50–64 c: Finland | Finnish workers who worked day shifts or had shiftwork | Survey of a representative sample of Finnish employees A negative binomial model was used in the analysis of long-term sickness absence days. The results were adjusted for various background and work-related factors (ANOVA) | (–) Sickness absence was more common for older participants. Other cofactor involved (females, employees without children, employees with a lower level of education, employees with normal working hours, long job tenure, and previous sickness absence) | 0,90 | |
| Nordstrom et al., 2016 | Longitudinal | to determine if a history of sickness absence among recruits is associated with the average level of sickness absence in workplaces | n:747 236 yr: 17.4–36.3, 36.4–41.4, 41.5–45.8, 45.9–64.2 years c: Sweden | Administration and government-owned companies; municipal; county council; private (limited companies and other non-public companies); other (both public and non-public). | Swedish workplaces with at least 5 employees in 2006 were selected. Workplaces were categorized according to the average workplace sickness absence in 2006 and the recruits were categorized according to the individual sickness absence in 2005 (multinomial logistic regression) | (–) The older the age of the recruits, the greater the proportion of those recruited to the workplaces with the highest average sickness absence | 0,92 |
| Oenning et al., 2014 | Longitudinal | To identify risk factors for absenteeism among workers with sick leave in an oil company | n: 120 cases and 656 controls yr: >30 to 40 > 40 to 50 > 50 years c: Brazil | Petroleum industry workers | Following up all employees of an oil company in the North-Northeast of Brazil from 2007 to 2009. The response variable used to represent absenteeism with sick leave was the average incidence of sick leave, defined as the ratio between total sick days and potential working days in the period. (logistic regression) | (+/–) Age of the workers did not affect the quantity of absences in the short term. | 0,78 |
| Rabacow et al., 2014a | Longitudinal | To analyse lifestyle risk factors related to direct healthcare costs and the indirect costs due to sick leave among workers of an airline company in Brazil. | n: 2,201 yr: ≤29, 30 to 39, 40 to 49, ≥50 years c: Brazil | Airline industry (Administrative jobs, Call centre, Blue-collar jobs, Aircrew) | Independent variables collected by interview at enrolment in the study and health registers. Logistic regression analysis was used to determine the influence of socio-demographic, type of work and lifestyle-related factors on sick leave (logistic regression analysis) | (+) Reduced absenteeism with increasing age. Sick leave episodes were more frequent in women, in young employees (under 24 years old), and in participants with lower education levels | 0,82 |
| Rabacow et al., 2014b | Longitudinal | To analyse the relationships among lifestyle-related factors and sick leave and to examine whether gender differences in sickness absence can be explained by differences in socio-demographic, work and lifestyle-related factors among Brazilian workers. | n: 2.150 yr: ≤29, 30 to 39, 40 to 49, ≥50 years c: Brazil | Brazilian airline company | Questionnaire on enrolment in the study for demographics and lifestyle. Data on sick leave days were available from the company register, and insurance records. Multivariate linear regression analysis was used to investigate the association between direct and indirect healthcare costs with sociodemographic, work, and lifestyle-related factors. (logistic regression analysis) | (+) Absenteeism decreased with increasing age. Older employees and those with higher educational levels had lower odds to have absenteeism. | 0,81 |
| Salonen et al., 2018 | Longitudinal | To examine diagnosis-specific sickness absences of different lengths as predictors of disability retirement in different occupational classes. | n: 1 727 644 yr: 25–62 (25–34, 35–44, 45–54, 55–62 years) c: Finland | Non-retired Finnish population | data were drawn from several linked registers of the Social Insurance Institution of Finland (the Finnish Centre for Pensions and Statistic Finland). Data on sociodemographic characteristics in 2006, new medically certified SA episodes > 10 working days starting in 2005 and new disability pensions from 2007 to 2014 were linked using the participants’ personal identification numbers (Cox proportional hazards regression) | (–) SA was more prevalent among older participants | 0,84 |
| Sigursteinsdottir & Rafnsdóttir, 2015 | Longitudinal | Examine sickness and sickness absence of employees who work within the educational system and the care services (elderly care and care of disabled people) in the wake of the economic crisis. | n: 2356 yr: <30, 31–40, 41 –50, 51–60, >60 years c: Iceland | Public sector employees (educational system (primary school teachers and kindergarten teachers) and the care services (elderly care and care of disabled people) | The study was based on mixed methods research comprising a balanced panel data set and focus groups. An online survey conducted three times among. The generalized estimating equations (GEE) were used to analyze the quantitative data, and focused coding was used to analyze the qualitative data. (Cochran’s Q test, and chi-square test and Generalized estimating equations (GEE)) | (+) Sickness and sickness absence were more common among younger than older employees | 0,72 |
| Skerjanc & Fikfak, 2015 | Cross-sectional | To assess the relationship between stressful life events and sickness presence among health care workers at the University Medical Centre Ljubljana (UMC Ljubljana). | n: 5,865 yr: under 50, 50 and above c: Slovenia | Healthcare workers | Self-rated questionnaire composed of two standardized international questionnaires. (logistic regression) | (+) Odds for sickness presence were more displayed in workers aged less than 50 | 0,73 |
| Slany et al., 2014 | Cross-sectional | To explore the associations between psychosocial work factors measured following a comprehensive instrument and long sickness absence in European employees of 34 countries. | n: 16 120 male and 16 588 female employees from the 2010 European working conditions survey. yr: age as continuous variable c: Europe | European workers in registry | Register data from European working conditions survey. Twenty-five psychosocial work factors were explored (multivariate logistic regression) | (–) Older age was a strong risk factor to have long sickness absence | 0,85 |
| Viitasalo & Natti, 2015 | Cross-sectional | To examine how perceived age discrimination at work is related to the number of sick leave days in the subsequent 3-year period. | n: 6322 employees yr: 40–44, 45 54 and 55–64 c: Finland | Not specified | A representative sample of Finnish employees was merged with register-based follow-up data. A negative binomial model was used in the analysis of subsequent sickness absence days (Chi square, ANOVA, negative binomial model) | (–) Sickness absence was more common for older participants and employees without dependent children, employees with a lower level of education, employees with non-day working time arrangements, and employees with delayed information on changes, low social support at work, previous sickness absence, and perceived age discrimination. | 0,86 |
*Author with multiple findings and present in more than one table.
Table 8
Performance findings with specific baseline sickness or condition
| Author | Study design | Main objective | Number (n), age (yr) country (c) | Occupation/industry | Type of analysis (statistic test) | Relevant results | QR |
| Giannini et al., 2015 | Longitudinal | To determine the association between voice disorders and loss of work ability among female teachers at public schools in Sao Paulo. | n: 167 teachers, and the control group comprised 105 teachers. yr: 20–29 years 30–39 years 40–49 years 50–65 years c: Brazil | Teachers | Questionnaires of Teachers post evaluation by an otorhinolary|ngologist. The control group was randomly selected from the same schools as those in the case group. Both groups answered the following questionnaires: sociodemographic, lifestyles, working conditions, work organization, conditions of vocal production—teacher (CVP-T), and Work Ability Index (WAI). (Logistic regression models) | (+/–) There was no association between having a vocal disorder and poor and moderate work ability regardless of age and unfavourable acoustics. | 0,81 |
| *Frey et al., 2015 | Cross-sectional | Examine associations of chronic health conditions on workplace productivity and accidents among US Department of Energy employees | n: 1854 ≤34 years old, 35 to 49 years old, and ≥50 years old. yr: c: USA | Blue- and white-collar workers from top management to line operators | Online Self-rated questionnaire.. In addition to promoting the survey through newsletters, the researchers e-mailed a random sample of employees from each worksite and invited them to complete the online, anonymous survey (Generalized linear models) | (+/–) No relationship was found between productivity and age (+/–) No relationship was found between presenteeism and age (+/–) No relationship was found between absenteeism and age | 0,90 |
*Author with multiple findings and present in more than one table.
Table 9
Presenteeism findings with specific baseline sickness or condition
| Author | Study design | Main objective | Number (n), age (yr) country (c) | Occupation/ industry | Type of analysis (statistic test) | Relevant results | QR |
| Ackerman et al., 2015 | Cross-sectional | To compare Health-Related Quality of Life (HRQoL) and psychological distress in younger people with hip or knee osteoarthritis (OA) to age- and sex-matched population norms, and evaluate work limitations in this group | n: 147 yr: 20–29, 30–39, 40–49 and 50–59 age groups c: Australia | Workers from the orthopaedic outpatient and Osteoarthritis Hip and Knee Service clinics at three major public hospitals in Victoria, Australia | HRQoL was assessed using the Assessment of Quality of Life (AQoL) instrument (minimal important difference 0.06 AQoL units) and compared to population norms. Psychological distress was assessed using the Kessler Psychological Distress Scale (K10) and the prevalence of high/very high distress was compared to Australian population data. Work limitations were evaluated using the Workplace Activity Limitations Scale (WALS). (chisquare, two-sample t-tests. analysis of variance and multiple linear regression) | (+) younger people with hip or knee OA experience a substantial personal burden regarding being less able to perform at their jobs | 0,77 |
| *Evans-Lacko & Knap, 2016 | Cross-sectional | Estimate workplace productivity (absenteeism and presenteeism) associated with depression across eight diverse countries. | n: Questionnaires were collected from approximately 1000 respondents per country. yr: (18–24, 25–44, and 45–64 years) c: Brazil, Canada, China, Japan, South Korea, Mexico, South Africa, and the USA | Not specified | Register and selfrated survey Also examined the individual, workplace, and societal factors associated with lower productivity. Performed secondary analysis on data collected in the Global IDEA (Impact of Depression in the Workplace in Europe Audit) survey which collected data on presenteeism and absenteeism associated with depression and their correlates. Participants were recruited through an online market research panel. (generalized estimating equations (GEE)) | (+/–) age was not associated with presenteeism (+) individuals of middle age (relative to younger age) tended to have lower levels of depression-related absenteeism. | 0,83 |
| *Fouad et al., 2017 | Cross-sectional | The aim of this study was to evaluate the effect of chronic disease(s) on work productivity through sickness absence and presenteeism | n: 516 yr: <30, 30–39, 40–49, 50–60 c: Egypt | Shipyards workers with chronic disease | Self-rated questionnaire (Health & Work Performance Questionnaire) information was collected on chronic disease status and work productivity. Propensity-score matching was performed to identify matched-pairs of workers (Wilcoxon two-sample test, Kruskal–Wallis test, Spearman correlation and logistic regression model) | (+/–) No relationship was found between presenteeism and age (+/–) no relationship was found between SA and age | 0,92 |
| *Frey et al., 2015 | Cross-sectional | Examine associations of chronic health conditions on workplace productivity and accidents among US Department of Energy employees | n: 1854 ≤34 years old, 35 to 49 years old, and ≥50 years old. yr: c: USA | Blue- and white-collar workers from top management to line operators | Online Self-rated questionnaire. In addition to promoting the survey through newsletters, the researchers e-mailed a random sample of employees from each worksite and invited them to complete the online, anonymous survey (Generalized linear models) | (+/–) no relationship was found between productivity and age (+/–) no relationship was found between presenteeism and age (+/–) no relationship was found between absenteeism and age | 0,9 |
| *Lau et al., 2015 | Cross-sectional | To identify the factors associated with sickness presence among patients undergoing treatment. | n:251 Below 29, 30–39, 40–49, 50 and over yr: c: Norway | Not specified | Participants were recruited from patients who met for their first session at a return to Work clinic. Self-rated questionnaire that included questions on background information, mental health and functioning, and psychosocial work factors. (Pearson chi-squared tests and regression analysis) | (+/–) No significant difference was found between age and sickness presenteeism or SA | 0,79 |
| *Oosterhaven et al., 2018 | Cross-sectional | To examine the 1-year prevalence of presenteeism related to hand eczema in a population of hand eczema patients who visited a tertiary referral centre. | n:346 yr: 20–35, 36–50, 51–67 c: Netherlands | Workers, occupations not specified | Self-rated questionnaire Respondents answered questions about socio-demographic factors, clinical features, occupational characteristics, and hand eczema related to occupational exposure. (Logistic regression) | (+/–) Age was not associated with presenteeism | 0,73 |
*Author with multiple findings and present in more than one table.
Table 10
Absenteeism findings with specific baseline sickness or condition
| Author | Study design | Main objective | Number (n), age (yr) country (c) | Occupation/industry | Type of analysis (statistic test) | Relevant results | QR |
| Demou et al., 2018 | Cross-sectional | To examine the impact musculoskeletal (MSK) and mental health (MH) conditions on SA duration in healthcare workers, using a bespoke database over a 6-year period, and to assess how health, sociodemographic factors, work characteristics and occupational factors affect SA duration | n: 11 694 yr: 16–29, 30–39, 40–49, 50–59, 60 + years c: Scotland | Healthcare workers. The study population includes all participants in the EASY (Early Access to Support for You) SA management service of a Scottish health board | Survival analyses were used to estimate SA duration due to MSK and MH problems over 6 years, and Cox’s proportional hazards models to determine the HRs of returning to work, using a bespoke Scottish health board database with over 53 000 SA events. SA duration and time to return-to-work (RTW) were estimated for employees by age, gender, job and health conditions. (Kaplan-Meier survival analysis and Cox proportional hazards model) | (–) Age was one of the influential sociodemographic variables affecting return-to-work (RTW) | 0,8 |
| Endo et al., 2015 | Longitudinal | To find risk factors for recurrent sickness absence due to depression after RTW. | n: 540 yr: 18–29, 30–39, 40–49, +50 c: Japan | Telecommunication workers | Workers who returned to work from April 2002 to March 2008 after their first leave of absence due to depression. The Cox proportional hazard model was employed to find risk factors for recurrent sickness absence by analyzing variables including demographic, work-related and work environmental factors. (Kaplan–Meier survival analysis, Cox proportional hazard model) | (+/–) There were no statistically significant differences in recurrent sickness absence in terms of age | 0,73 |
| Ervasti et al., 2017 | Longitudinal | To investigate sociodemographic, health-related, and work-related psychosocial predictors of work disability in three different age groups | n:71791 yr: 18 to 34, 35 to 50, and more than 50 years c: Finland | Not specified | Followed groups for 7 years (2005 to 2011) for all-cause and cause-specific work disability. Using negative binomial regression, we obtained both relative risk estimates and absolute rates, that is, days of work disability per person-year. (Chi-squared tests, negative binomial regression) | (–) Work disability days were highest among aging (>50 years) employees. | 0,86 |
| Ervasti et al., 2014 | Longitudinal | Examine the associations of temporary employment with (i) the onset of work disability due to depression, (ii) the length of disability episodes, and (iii) the recurrence of work disability, taking into account the possible effect modification of sociodemographic factors. | n: 107,828 yr: 18–35, 36–44, 45–52, 53–65 years c: Finland | Finnish public sector employees | Linked the prospective cohort study data of 107 828 Finnish public sector employees to national registers on work disability (>9 days) due to depression from January 2005 to December 2011 (Cox proportional hazard regression) | (+/–) No effect modification of age, explaining the recurrence of work disability due to depression, Age modified the association between type of employment and the length of work disability episode | 0,86 |
| *Evans-Lacko & Knapp, 2016 | Cross-sectional | Estimate workplace productivity (absenteeism and presenteeism) associated with depression across eight diverse countries. | n: Questionnaires were collected from approximately 1000 respondents per country. yr: (18–24, 25–44, and 45–64 years) c: Brazil, Canada, China, Japan, South Korea, Mexico, South Africa, and the USA | Not specified | Register and self-rated survey Also examined the individual, workplace, and societal factors associated with lower productivity. Performed secondary analysis on data collected in the Global IDEA (Impact of Depression in the Workplace in Europe Audit) survey which collected data on presenteeism and absenteeism associated with depression and their correlates. Participants were recruited through an online market research panel. (generalized estimating equations (GEE)) | (+) Individuals of middle age (relative to younger age) tended to have lower levels of depression-related absenteeism. | 0,83 |
| *Fouad et al., 2017 | Cross-sectional | The aim of this study was to evaluate the effect of chronic disease(s) on work productivity through sickness absence and presenteeism | n: 516 yr: <30, 30–39, 40–49, 50–60 c: Egypt | Shipyards workers with chronic disease | Self-rated questionnaire (Health & Work Performance Questionnaire) information was collected on chronic disease status and work productivity. Propensity-score matching was performed to identify matched-pairs of workers (Wilcoxon two-sample test, Kruskal–Wallis test, Spearman correlation and logistic regression model) | (+/–) no relationship was found between absenteeism and age | 0,92 |
| *Frey et al., 2015 | Cross-sectional | Examine associations of chronic health conditions on workplace productivity and accidents among US Department of Energy employees | n: 1854 ≤34 years old, 35 to 49 years old, and ≥50 years old. yr: c: USA | Blue- and white-collar workers from top management to line operators | Online self-rated questionnaire. In addition to promoting the survey through newsletters, the researchers e-mailed a random sample of employees from each worksite and invited them to complete the online, anonymous survey (Generalized linear models) | (+/–) No relationship was found between absenteeism and age | 0,9 |
| Gangan & Yang, 2018 | Cross-sectional | To evaluate whether work absences are associated with increased health services utilization, total health care costs, and depression-related costs among employed individuals, aged 18 to 64 years with depression. | n: 3478 yr: 18–30, 31–45, 46–65 c: USA | Not specified | Analysis of pooled data from the 2011 to 2014 Medical Expenditure Panel Survey (MEPS). In this study, were pooled: health status, health services utilization, health expenditures, and sources of payments. (Independent sample t tests, logistic regression, Generalized linear models) | (+/–) No relationship was reported between age and absenteeism | 0,83 |
| Haeffner et al., 2018 | Cross-sectional | Describing and analysing absenteeism of Brazilian workers, notified with MSD, from 2007 to 2012, regarding sociodemographic and occupational factors, besides those related to the condition | n: 32,438 yr: 15 –19, 20–29, 30–39, 40–49, 50–59, 60 + years c: Brazil | All workers in the registry | The records came from the Information System of Notifiable Diseases, which notifies workers on a social security system, as well as informal workers. Analyzed sociodemographic, work organization and injury variables. (Mann-Whitney U test and the Kruskal-Wallis test) | (–) Those aged 50 to 59 years had the highest rate of SA. There were longer periods of absence for illiterate people, aged rom 50 to 59 years, who worked for more than 6 daily hours. | 0,83 |
| *Lau et al., 2015 | Cross-sectional | To identify the factors associated with sickness presence among patients undergoing treatment. | n: 251 Below 29, 30–39, 40–49, 50 and over yr: c: Norway | Not specified | Participants were recruited from patients who met for their first session at a return to Work clinic. Self-rated questionnaire that included questions on background information, mental health and functioning, and psychosocial work factors. (Pearson chi-squared tests and regression analysis) | (+/–) No significant difference was found between age and sickness presenteeism or SA | 0,79 |
| Mittendorfer-Rutz & Dorner, 2018 | Cross-sectional | to investigate the relation of socio-economic status (SES), measured as education, occupation, and income, with the 12-month prevalence of severe pain and with pain-related sickness absence | n: 8084 yr: 15–34, 35–49, 50–64 years c: Austria | Occupation was assessed in three categories: self-employed (which also included freelancers and farmers), white-collar workers (which also comprised civil servants), and blue-collar workers | Used subjects aged between 15 and 65 years from the Austrian Health Interview Survey in 2006/07. Associations of SES with the 1-year prevalence of severe pain and sickness absence due to pain in those with severe pain was assessed with logistic regression analysis and adjusted for socio-demographic and chronic medical conditions. (logistic regression models) | (+) Higher age was associated with a higher chance of severe pain, but not with being on sickness absence. Younger subjects (15–34) with severe pain had higher rates of sickness absence | 0,89 |
| Mesas et al., 2014 | Cross-sectional | To examine whether 3 types of chronic pain are associated with absenteeism and with the number of days absent from work in the general population of Spain. | n: 8283. yr: 18–34, 35–54, 55–70 years c: Spain | Spanish workers (Executive -scientific and intellectual, Technical- office and service professionals, agricultural- operator and mechanical Unskilled) | Self-reported information on pain and absenteeism Multivariate regression models were adjusted for the main confounders. (Mann-Whitney and Kruskal-Wallis tests and logistic regression) | (+/–) Younger age (18–34) was associated with absenteeism, whereas older age (55–70) was associated with longer duration of absenteeism | 0,88 |
| Smith et al., 2014 | Cross-sectional | To examine the extent to which a greater prevalence of pre-existing chronic conditions among older workers explains why older age is associated with longer duration of sickness absence (SA)following a musculoskeletal work-related injury in British Columbia. | n: 300000 yr: 15–24, 25–34, 35–44, 45–54, and ≥55 years. c: Canada | Not specified | Data from workers’ compensation claims in British Columbia. Path models examined the relationships between age and days of absence and the relative contribution of eight different pre-existing chronic conditions to this relationship. Models were adjusted for individual, injury, occupational, and industrial covariates (path models) | (–) Older age was associated with greater median days of SA | 0,84 |
| Virtanen et al., 2015 | Longitudinal | To identify subgroups among persons with diabetes based on potential risk factors for work disability | n: 2445 yr: above 50, under 50 years c: Finland, France and UK | Gas and electricity, office workers | Registers of employees with diabetes from three prospective cohorts (the Finnish Public Sector study, the GAZEL study, and the Whitehall II study) Study-specific latent class analysis was used to identify subgroups according to prevalent comorbid disease and health-risk behaviours. Study-specific associations with work disability at follow-up were pooled using fixed-effects meta-analysis (negative binomial regression analysis) | (–) Age 50 years at baseline was associated with higher number of work disability days at follow-up. Other factors involved (female sex, lower occupational grade, comorbid somatic disease, psychological symptoms, obesity, low physical activity, and abstinence from alcohol) | 0,88 |
| Zoer et al., 2014 | Cross-sectional | Determine whether the prevalence of musculoskeletal complaints, resulting work impairment and desirable and feasible adjustments in work differs between employees of various age groups at a railway company. | n: 2,021 yr: 22–35, 36–45, 46–55 and 56–66 years c: Netherlands | Service employees, train drivers, train conductors and service electricians | Self-rated questionnaire about musculoskeletal complaints by body regions, the resulting work impairment and the desirable and feasible adjustments in their own work situation. (chi-square test, regression analyses) | (–) Impairments in work due to the musculoskeletal complaints only differed significantly between age groups for lower back complaints, which occurred most often in the oldest age group. | 0,83 |
3Results
3.1Overall results
Figure 1 shows the results of the search strategy. The search on the databases resulted in an initial number of 9,048 papers (SCOPUS: 7,723 and PubMed: 1,325), which was then reduced to 8,063 after the removal of duplicates entries. After screening the title, abstract and keywords of each article, 126 papers were identified as being potentially relevant. After reviewing the corresponding full-texts, 85 papers were selected based on the inclusion criteria. Finally, after applying the QualSyst, nine papers were removed due to their methodological quality and thus 74 papers were included in the final review.
Fig. 1
PRISMA flow diagram of included studies.
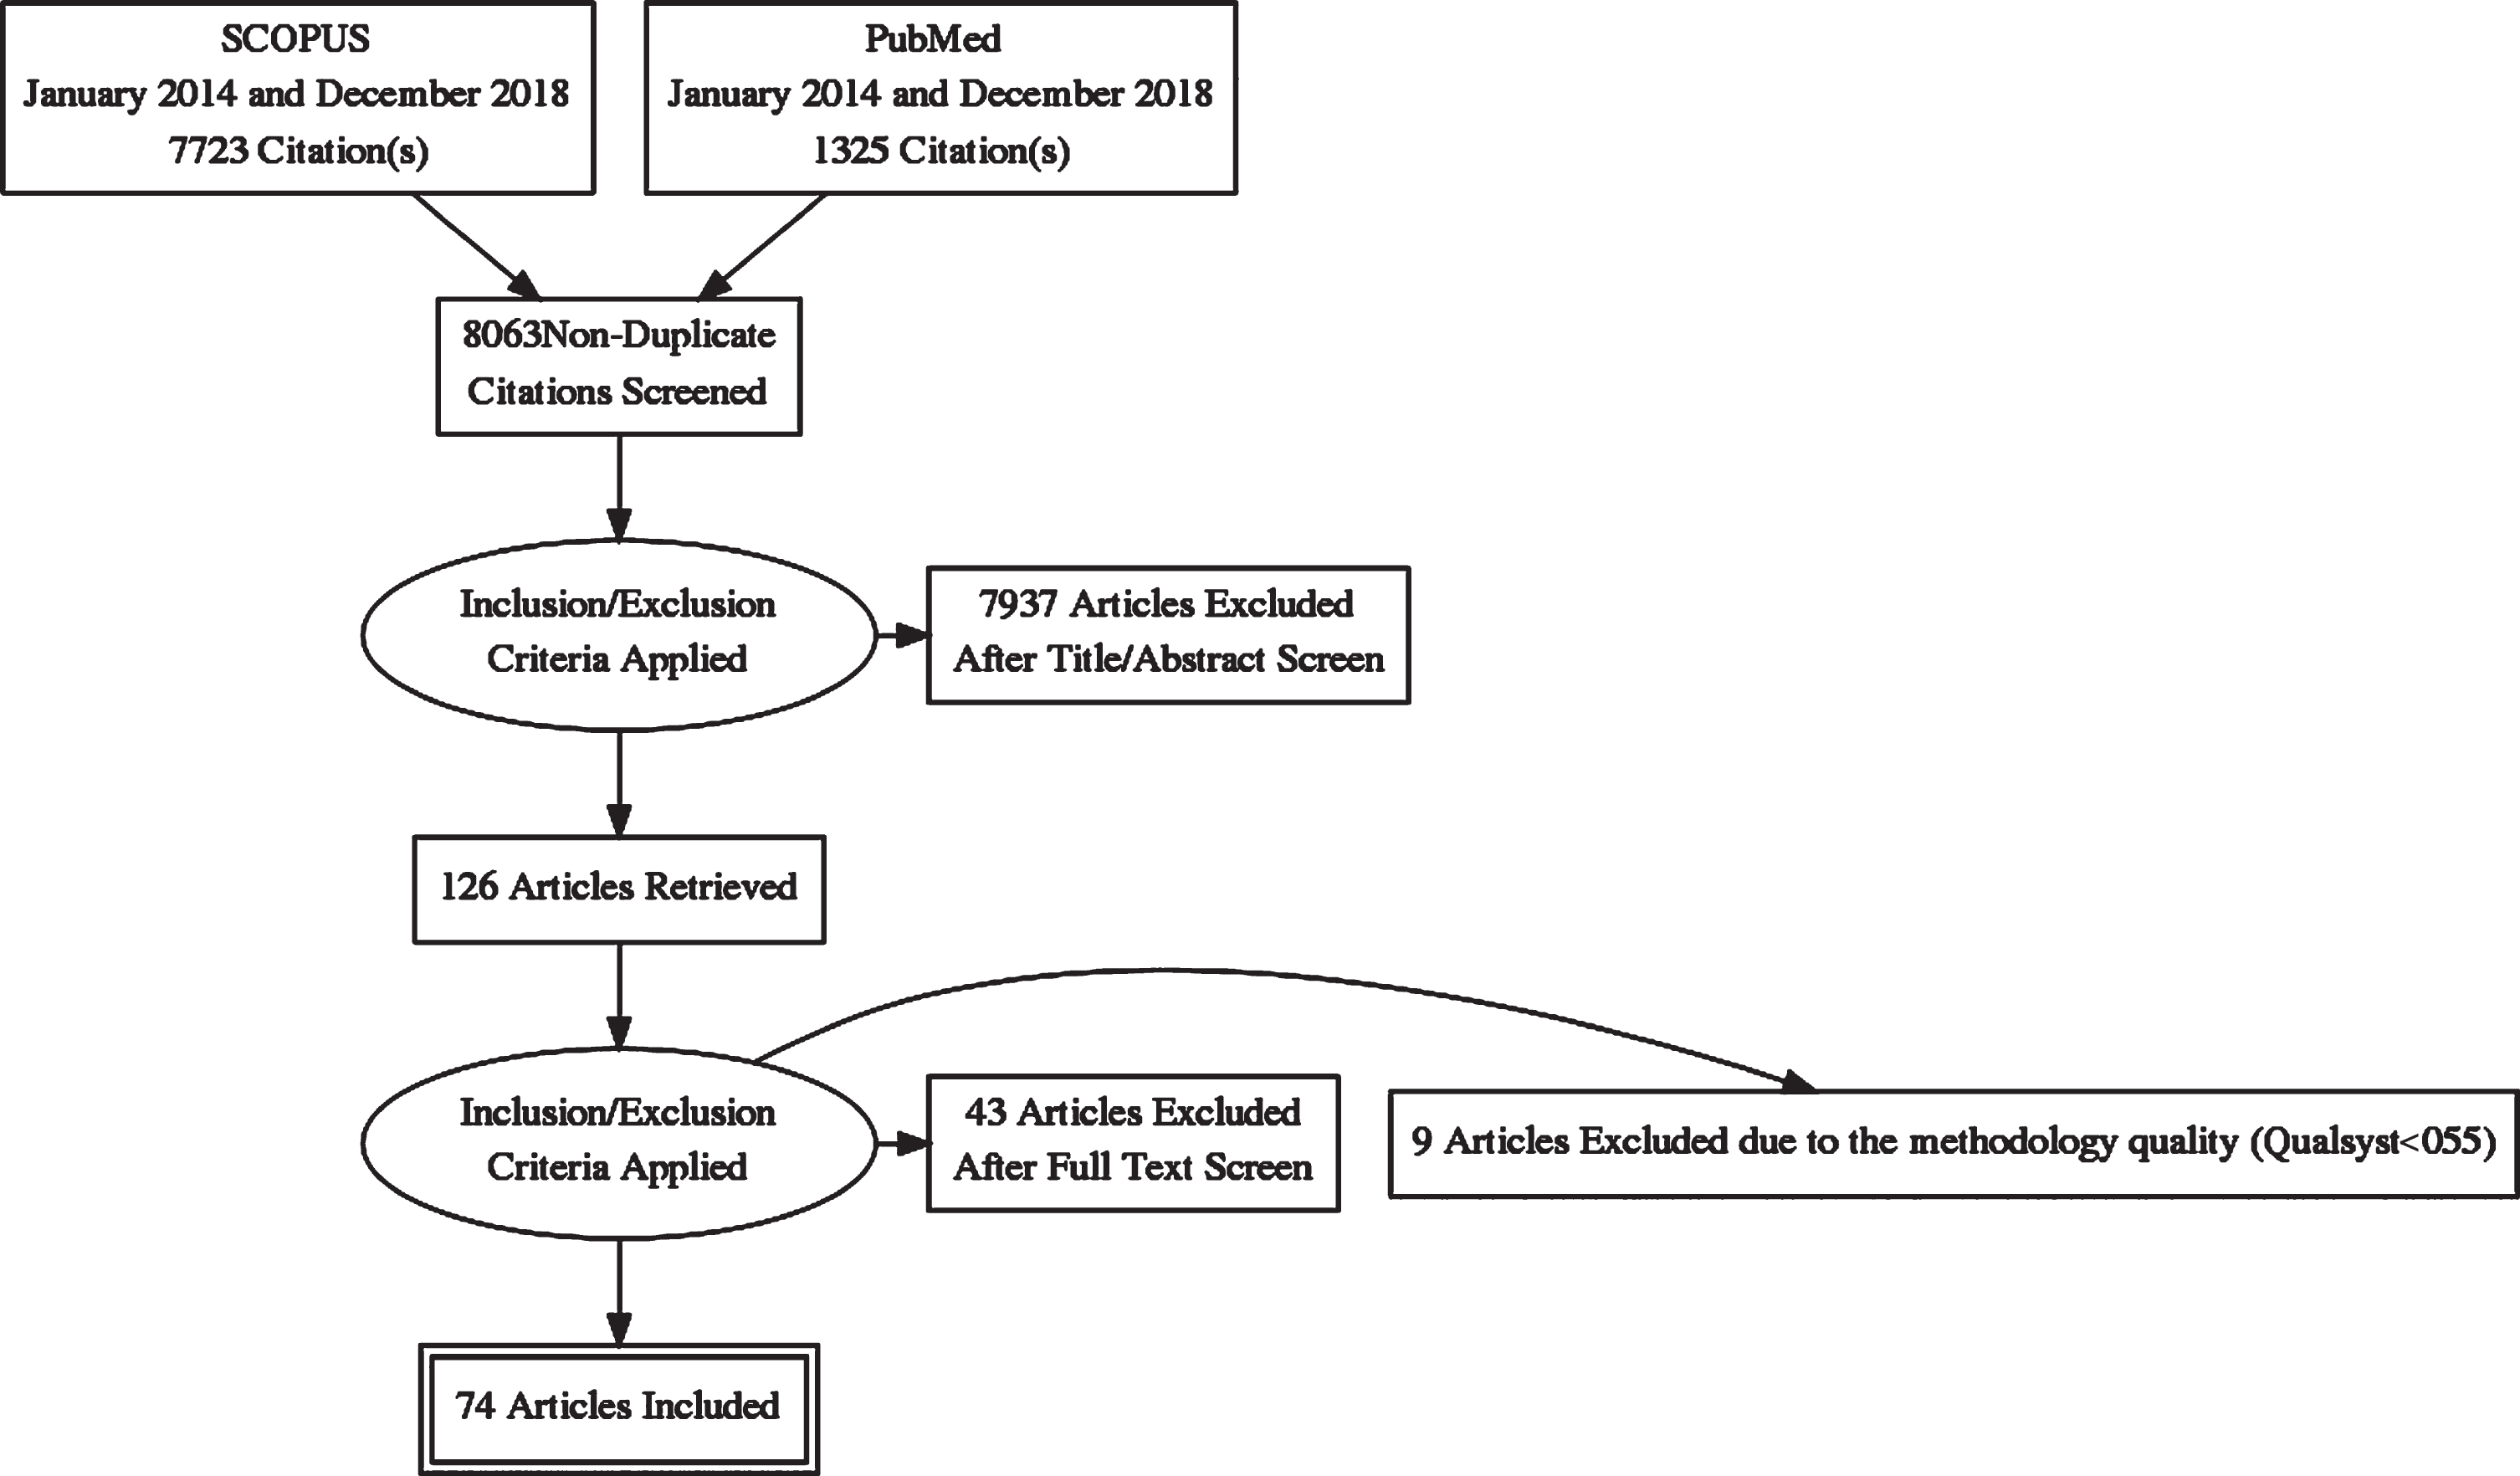
Even though 74 papers were included, some of them considered more than one outcome, therefore in order to calculate %and frequencies, if one study considered more than one outcome, it was counted as a new one to the overall quantity within a particular outcome. Therefore, 88 findings were retrieved, of which 19 were related to performance, 18 were related to presenteeism and 51 were related to absenteeism. Some papers considered populations with specific diseases or baseline sickness and other considered the outcomes without mentioning any particular disease. All of them were included but analyzed separately, since absenteeism and presenteeism inherently imply that people has become ill to the point of showing sick at work or not showing at all, independently of the causes. In the case of studies that considered workers with baseline sickness or health condition, only those studies were age comparisons were made (i.e.: younger workers (under 45 years old) versus older workers (above 45 years old with the same disease or health condition).
For example, Gangan and Yang [30] considered absenteeism in workers suffering from depression or the case of Ackerman et al. [31] that analyzed outcome variables patients with knee osteoarthritis. Others, however, only mentioned the outcome without specifying any particular disease, such as Ang and Madsen [32] and Chiesa et al. [20].
The obtained findings used longitudinal (20) and cross-sectional (67) research approaches. Studies included in the current review considered many countries part of 5 continents. Table 3 summarizes the continents and main countries of the selected studies. Note from Table 3, that some papers used data or studied outcomes in more than one country, thus the quantity does not match the actual number of studies.
Table 3
Continent and countries of studies analyzed
| Continent | Main countries | Subtotal number of countries |
| Europe | Finland (9), Norway (4), Sweden (4), Netherlands (4), Denmark (3), Germany (3), UK (3), Austria (2), Spain (2), EU as a whole (2) Iceland (1), Scotland (1), Ireland (1), Italy (1), France (1), Estonia (1), Belgium (1), Slovenia (1), Turkey (1). | 45 |
| Americas | Brazil (10), United States (8), Canada (3) | 21 |
| Asia | Japan (3), Korea (2) | 5 |
| Oceania | Australia (3), New Zealand (1) | 4 |
| Africa | Uganda (1), Egypt (1) | 2 |
| More than one continent | OECD countries | 2 |
| Total | 79 |
Before presenting the results, it is important to mention the column with results presented in Tables 4 to 10. The findings were classified as (+) when older workers performed better in a particular outcome than their younger counterparts, (–) when older workers performed worse than younger workers and (+/–) when there was no difference between older and younger workers. Out of the total 88 findings included for analysis, 63 did not report any particular disease or health condition. From those 63 findings, 12 findings came from seven studies that had more than one outcome. 25 findings came from studies that did report a particular disease or health condition related to one of the outcome variables, where 9 findings came from four studies reported more than one outcome. A summary of the described findings can be seen in Tables 4 to 10.
3.1.1Performance
As can be seen in Table 4, the majority of the studies analyzed regarding performance, considering both studies focused on a particular illness or in general, show that older workers are more productive than younger workers. In 58%(11 out of 19) studies showed that older workers had higher productivity than younger ones. Following this trend, it was found that in 26%(5 out of 19) there were not significant differences between ages. Finally, 16%(3 out of 19) of the papers showed that younger workers were more productive than older ones.
3.1.2Presenteeism
Observing Table 4, regarding presenteeism, 61%(11 out of 18) of the studies did not find significant differences between ages. Followed by 28%(5 out of 18) that found older workers had less presenteeism that younger workers and 11%(2 out of 18) where younger workers had less presenteeism.
3.1.3Absenteeism
Also from Table 4, when considering absenteeism, 43%(22 out of 51) of the studies found that older workers had higher absenteeism than their younger counterparts, 39%(20 out of 51) showed that there were no differences between older and younger workers and 18%(9 out of 50) reported that older workers had lower absenteeism than younger ones.
3.1.4Productivity
Finally, productivity results from Table 4 show that in 41%of the findings there was no significant difference between older and younger workers, followed by 31%where younger workers had better indicators than older workers and 28%where older workers had better results than their younger counterparts.
3.2Workers with no baseline disease nor health condition
As can be seen in Table 4, 63 out of 88 findings used one of the outcomes under study without mentioning a baseline sickness nor health condition.
3.2.1Performance
A total of 17 findings conveyed performance, where 11 (65%) found that older workers outper-formed their younger counterparts (+), three (18%) found younger workers performed better and three (18%) found no difference between older and younger workers (+/–).
3.2.2Presenteeism
As can be seen in Table 6, 11 findings used presenteeism, where in Table 4, (36%) older workers presented less presenteeism than young workers (+); five (46%) found that there were no differences between young and older workers (+/–); and two (18%) showed that young workers had less presenteeism (–).
3.2.3Absenteeism
From Table 7, it can be observed that 35 findings evaluated absenteeism, where in seven (20%) older workers had lower absenteeism (+); 12 (34%) showed no differences between young and older workers (+/–) and in 16 (46%) studies young workers presented less absenteeism (–).
3.3Workers with a declared baseline sickness or health condition
As mentioned before, there were 25 findings that focused on performance outcomes in workers’ populations with a baseline sickness or health condition, such as diabetes, depression, TMERT, arthritis, chronic pain, osteoarthritis, cardiovascular diseases, among others. It is important to highlight that four studies presented more than one dependent variable (Performance, Absenteeism and Presentism).
3.3.1Performance
Only two findings included (Table 8) did not find significant differences between older and younger workers’ performance (+/–). In these particular cases, they focused on workers with chronic health conditions, like respiratory conditions, mental illness and cardiovascular diseases, among others [89] and in teachers with voice disorders [86].
3.3.2Presenteeism
Observing Table 9, it can be noticed that seven findings evaluated presenteeism. In one, where all workers had knee osteoarthritis, young workers were found to report more presenteeism than older workers (+). On the other hand, in the remaining six, no differences were found between young and old workers (+/).
4Discussion
The aim of this of this article was to find, through a systematic literature review, what is the level of productivity of older workers when compared against their younger counterparts. Reviewing the 74 papers selected according to the pre-defined criteria and ext-racting the 88 findings, it is possible to note that 41%showed no significant differences between you-nger and older workers in productivity; 31%of the reviewed findings report better productivity of younger workers compared to the oldest and 28%reported that older workers had better productivity than younger workers. Overall, there is evidence indicating that older workers have no difference in productive than younger workers. However, it is important to mention that these results are different from the findings presented by other research, that found negative impact of age in productivity, especially those that used the company (or overall) pro-ductivity associated with age [101–104]. Changes in workforce age structure may have an impact on production system performance or productivity; however, despite several reviews of aging and work productivity that have been conducted previously, the link between age and productivity is still unclear due to the lack of empirical evidence, and by the fact that productivity effects of aging are still difficult to be estimated [105].
In this section, the primary review findings are discussed separately according to each variable: performance, presentism and absenteeism. The authors realized that the diverse nature of the studies and the variables used in the reviewed studies were quite different, mainly due to the populations studied, age cut-off points to define older workers used and mostly the definitions used to define productivity.
4.1Performance
Regarding performance, it was found that older workers had generally higher levels than younger workers. A possible explanation could be the inverted U-shaped model of performance related to age. Basically this theory states that performance is low in the beginning of an individual‘s work life, then starting to increase as the person gains experience and confidence, for then reaching a plateau, and finally slowly decreasing until retirement age [106]. The inverted U- shaped model has been reported by other authors, with different peak ages, but all of them find that a person's performance, even though it is might be lower than their peak, is higher than were they were young beginners [107–109]. Study design is also related with the inverted U-shaped performance model. For example, there may be differences in re-sults depending upon whether data were collected cross-sectionally or longitudinally. For example, the effect of intraindividual aging on performance obs-erved in longitudinal studies may be smaller in magnitude than the effect of broad age group differences observed in cross-sectional studies at any one point in time [110]. Thus, examining the potential moderating effects of sample and data collection characteristics is not only important for research methodology purposes but for theoretical and practical reasons too. It allows to identify the conditions under which age is likely to have positive, zero, or negative associations with various components of job performance [110]. In the current review, only 2 papers used a longitudinal design, where 1 found older workers had higher performance [33] and 1 found no difference [86]. Meanwhile, 17 studies used a cross-sectional design, where 10 found that older workers outper-formed younger workers, 5 found no differences and 2 that showed younger workers outperformed older ones. Since there were only 2 studies that analyzed performances with a longitudinal design, it is difficult to say if design had an effect in the results.
It might be possible that physically demanding jobs (strength, vision, endurance, etc.) could act as a confounding factor, making older workers to perform in a poorer manner compared to younger ones, especially considering the fact that by varying levels, decline experienced by ageing in those areas [6]. It is worth mentioning however, that this is not a rule and should be taken with caution, since people that have higher levels of healthy life expectancy through being active, both socially and physically at work and at their personal life’s, usually experience no significant problems impacting their performance with increasing age [3, 15]. From a physical performance standpoint, an older worker’s experience may allow him or her to compensate for excessive physical de-mands [111], therefore type of work is also relevant to performance. For example, in the current review, some studies used nationwide registers [32, 34, 36] of workers while others used specific sectors [44, 84]. The latter ones allow to discuss the implications of work characteristics. The majority of the studies where older workers showed better performance were associated with services, such as financial services, healthcare, public service and community work, food service and academics [20, 33, 38–41, 44]. Just two studies of the ones that mention a particular sector or occupation showed poorer results in older workers in financial services and healthcare [35, 42]. Even though older workers can experience a decrease in some capabilities, other attributes such as wisdom and emotional maturity improve with age [111]. This emotional improvement has been reported in professional orchestra musicians, were older ones reported less anxiety while performing [87], possibly explaining why in the current review most of the papers that reported better performance in older workers were in the sector related with service. Contrary to what could be expected, two studies that found better performance in the older groups, were conducted in jobs more physically demanding, such as operators/ harvesters and manufacturing [43, 45]. In general, capability declines can affect workers but not necessarily their performance. For instance, after passing the performance maximum for men and woman in the age of 20 to 30 years, inevitably a continuous decreasing in muscle strength occurs, however, in industry this is less of a concern nowadays with the diminishing role of physical work than in a time when it was the human body’s physical strength that was of the highest importance [6]. Ageing is not always linked to physical under performance, since firstly people that have higher levels of healthy life expectancy through being active, both socially and physically at work and at their personal life’s, usually experience no significant problems impacting their performance with increasing age [3, 15]. From a physical performance standpoint, an older worker’s experience may allow him or her to compensate for excessive physical demands [111]. Most of the evidence used to argue under performance in older workers that found reduction in physical capabilities used maximal capacities, and not the submaximal ones commonly used in industry, thus the ecological validity of these findings can be certainly questioned [7]. The same applies to cognitive capabilities, where although changes in cognition have been shown to occur across the lifespan, research has also indicated that such changes in laboratory tests (often times novel tasks) do not parallel changes in work performance. For instance, many jobs in which older workers are employed rely heavily on accumulated knowledge that relates to crystallized intelligence [111]. Research has shown that older adults perform well at tasks at which they are expert or in environments in which they are familiar [112].
These findings provide evidence that, for instance, a worker may not have enough experience to perform certain jobs when younger, but may have too slow of a reaction time or not enough physical strength to perform other tasks when older, therefore, the ideal work situation is one that matches the demands of the job to the abilities of the employee in order to facilitate optimal worker performance without the employee experiencing any health problems [111]. This review provides evidence that performance is not affected necessarily by age, probably due to compensatory strategies [111]. “Aging is a very dynamic process. You can be too old for a job at 30, and too young for a job at 45. It’s a continuous process” [113].
None of the reviewed studies considered the subjective age which was consider an important performance factor, since feeling younger than chr-onological age has been related to increased health, vitality, and productivity [114, 115]. Additionally, there were several confounding factors that studies due to methodological and economic constrains cannot address entirely. For example, some studies used and controlled several variables such as income level or job position and age but were conducted in one company or sector [20, 33, 35], whilst other used quite large and representative samples and accounted for a very good sampling strategy but used and controlled fewer variables [32, 34, 39].
4.2Presenteeism and absenteeism
Presenteeism was found to mainly have no significant difference between ages (61%). However, 28%of the studies that considered this outcome found that older workers had less presenteeism than their younger counterparts, while 11%found the opposite. Again, in all of the reviewed studies, presenteeism was self-reported which may have produced biased findings in the older worker groups.
Absenteeism analyzed in the publications, showed that 43%of them reported that older workers had higher levels absenteeism, followed by 39%that sho-wed no differences and 18%that showed that younger workers had more absenteeism. This is probably to the fact that ageing is often associated with higher rates of chronic illness, therefore it was not a surprise and it was already reported in previous works [3]. When comparing findings that focused in studies with no declared condition and those that studied younger and older workers with a particular disease (i.e. arthritis), it was found that 50%of the findings showed no significant differences in those with a particular disease versus 34%in those with no declared illness. In fact, when performing the same analysis, the findings with no declared illness shows that in 46% of them younger workers had less absenteeism compared to 38% in the group with a declared condition. Thus, it could be implied that when sick, age might not be as important as the sickness in itself. This was the case for example, in a study comparing young versus older workers with knee or hip osteoarthritis [31]. Therefore, one could assume that absenteeism rates in older workers could be due to diminished physical capabilities mediated by age related illness, being illness the key point and not age. This indicates that a particular sickness is generally responsible for absenteeism and not merely age. Further studies or reviews could focus in this particular topic in order to elucidated more clearly patterns mediating age, sickness and absenteeism. Other research has found that older workers usually have less accidents but need longer to recover from injuries, thus suggesting that possibly the long time to recover of an older worker can also affect absenteeism [111, 116]. Therefore, overall “safer” jobs and health focus approaches could be used to increase or prevent productivity loses. According to WHO, maintaining healthy beha-viors throughout life, particularly eating a balanced diet, engaging in regular physical activity, and refra-ining from tobacco use, contribute to reducing the risk of non-communicable diseases and improving physical and mental capacity [3]. People have private and working lives, both interdependent from one another, where evidence supports that risk factors in the workplace can contribute to common health problems previously considered unrelated to work and vice versa, there focusing in strategies that address health in general are more effective [117]. This topic will be further discussed in the following section.
4.3Theoretical and practical implications
Ageing of the workforce is here to stay and probably will increase. In the US, according to the U.S. Bureau of Labor Statistics (BLS), nearly 40 %of people ages 55 and older were working or actively looking for work in 2014. That labour participation rate, is expected to increase faster for the oldest segments of the population, especially for those with ages between 65 and 74 and 75 and older through 2024, where in contrast, participation rates for most other age groups in the labour force are not proje-cted to change much over the 2014-24 decade [118]. Europe has experienced similar changes in its workforce, where in 2016 the employment rate for older workers aged 55–64 in the EU stood at 55.3%, com-pared with 66.6%for those aged 15–64 as a whole, where the increase has been largest among older women [2]. However, and despite a substantial gro-wth in the employment rates of older workers over the past decade in many EU countries, the European Commission’s Joint Employment Report 2017 highlights the potential to increase these rates further [2]. Ageing is not happening exclusively in the developed world, it is estimated that by 2050, one in five people in poor nations will be over 60 years old [119].
Age alone is not the only factor associated with productivity, where it is usually mediated with several other ones, such as type of work, work environment and individual characteristics [120]. Also, the relationship between age and work is not simple; factors including the physical nature of the job and worker’s health and fitness interact with age to either increase or decrease the potential effect of age [121]. In that regard, the high rate older people at the workplaces and the coexistence of a multigenerational workforce like never before can present issues at the time to set practical recommendations in organizations [122]. Adding up to the equation are radical changes in work arrangements, due to the fast pace and demanding economic and technological environments. All of them present significant challenges for occupational health and safety, where a lack of holistic long-term interventions addressing the needs of younger and older workers are not commonly found nor known by organization [4, 122].
As mentioned previously in the introduction section, healthy life expectancy is key, where a longer stay in good health improves average labour productivity during working age. WHO defines healthy life expectancy as the average number of years that a person can expect to live in full health [123]. Over the last century, healthy life expectancy increased about one-to-one with life expectancy, meaning that future generations are not only expect to live longer but also to live a longer part of their life in full health [15]. Therefore companies and governments that encourage practices, incentives and policies that aim to improve Total Worker Health (TWH), should be imitated, since it has been suggested that implementing policies and practices addressing TWH has helped maintaining a healthy private/work life [117, 122]. TWH, concept used by NIOSH in the early 2000, stands for “policies, programs, and practices that integrate protection from work-related safety and health hazards with promotion of injury and illness prevention efforts to advance worker well-being” [117]. It involves considering all aspects of work in a coordinated manner, where TWH is concerned with the entire working life of individuals, integrating occupational safety, work health protection programs together with general health promotion may be more effective for safeguarding worker safety, health, and well-being than either of these programmatic activities on their own [117, 122]. TWH differs from traditional wellness programs in that it includes all aspects that might contribute to illness in a systemic integrated manner, and not focusing only in isolated one-dimensional interventions [122]. Since absenteeism is more prevalent in older people, TWH could provide a more effective framework for future research and interventions, thus aligning more with healthy life expectancy and considering the individual as a nontrivial being. Supportive environments enable people to do what is important to them, despite losses in capacity [3, 123–125]. Strategies may be needed to identify workers at particular risk of health-related job loss, when older, and to assist them—for example, through interventions to promote their fitness in middle and later life [5]. As mentioned previously TWH can help providing this support framework, through identifying potential difficulties for current and future older workers in order to reduce or eliminating them. This interventions, should focus on several fronts, like nonphysical space, such as changes in work organization such as flexible schedules, part-time work, programmed retirement or job rotation [6].
Additionally, the physical space, like the workstation and overall physical environment can be modi-fied to reduce unnecessary demands, implementing aids related to manual handling, electric tools, lighter equipment, temperature, interfaces and adjustable work stations [6, 126]. Transgenerational Design/ Age-differentiated work design, or designing for all generations, is the best way to address workplace ergonomics, i.e. interventions that are all inclusive and promulgate that better design means better design for everyone, not just older workers [6, 111].
Finally, it is important to considerer that older and younger workers have differences, especially in what motivates them and keeps them engaged at their jobs sustaining high levels of performance. For example, Bal and De Lange [127] found that flexibility is valued differently and make older workers perform better. In particular, they found that flexibility, like working from home and a flexible schedule, are more preferred by older workers and additionally increasing their performance, in order to accommodate caring for self or others, while younger workers report feeling more engaged with their job, but not increasing their performance. Other studies found that the concept of individualized career customization, i.e. to offer different incentives according to preference and individual‘s stage of life, is useful for maintaining performance and reducing absenteeism within older workers. Younger workers prefer more career development incentives while older ones prefer more flexibility [33, 60]. Finally, organizations can retain their older workers longer if they provide sufficient support, the work offered is satisfying, and part-time work is available [128].
4.4Limitation of this review
A probable limitation of this review includes the search process itself, which researchers using this information should be aware of when interpreting the results presented in this paper. This SLR was based on journal papers found in only two specific bibliographic databases (Scopus and PubMed). Despite knowing that these databases cover a very wide range of different areas, searching in different databases, such as Google Scholar or MEDLINE, or checking the references of the articles included could also have provided relevant information that might have been relevant to this review.
One major limitation is related to the information of the analyzed studies. Productivity was often heterogeneously defined. For example, some author take the ILO definition used in the current research, while others define it in terms of presenteeism and/or absenteeism (Gordois et al. 2016; Grossmeir 2015). This presents a challenge for research since it is not wrong or right to use one or another, since in the end, absence and presenteeism can be translated to monetary burden, thus being closely related to performance. Another shortcoming of the literature review was the fact that the most used performance indicator was self-reported by the participants. Obviously this could present bias, therefore this measure could be complemented by performance information from supervisors [129] or company information [130], thus providing a potentially more unbiased source of information. Finally, future research should include work arrangements in the analysis, for example working hours and pays schemes. Work arrangements, such as performance-based salary and long hours, have been shown to impact both health [131] and productivity [132]. Thus, these work arrangements and other ones such as contract type should also be introduced since they can provide a broader view of the issues that can compromise health and productivity, especially in jobs with high physical and/or mental demands such as healthcare [132].
5Conclusion
The current review found that older workers do not lose performance when compared against younger ones, in fact they performed better. Presenteeism showed no differences between age groups. The only outcome where older workers showed more adverse results was regarding absenteeism. Possible explanations could be related to the fast pace ageing of the world’s population and its workforce, together with a mixture of complex physiological, socio demographic, economic and technical changes.
New holistic frameworks, such as Total Worker Health (TWH) have linked common chronic diseases that are usually associated with ageing to be in part attributed to adverse work conditions. In fact, it can be considered a vicious cycle since in terms of productivity it also affects it. Holistic interventions focusing on TWH can provide a more accurate framework that can be used to address physical/cognitive decline of and ageing workforce and particularly of more frailty prone individuals, thus maintaining overall health and sustaining both healthy life expectancy and productivity throughout an individual’s life cycle.
Conflict of interest
None to report.
Acknowledgments
This work was supported by the Mutual de Seguridad C.Ch.C en el marco del fondo “Proyectos de Investigación e Innovación SUSESO”. “Trabajo fue seleccionado en la Convocatoria de Proyectos de Investigación e Innovación de Prevención de Accidentes y Enfermedades Profesionales “2017” de la Superintendencia de Seguridad Social (Chile), y fue financiado por “Mutual de la C.Ch.C” con recursos del Seguro Social de la Ley N° 16.744 de Accidentes del Trabajo y Enfermedades Profesionales”.
References
[1] | WHO. Global Health and Ageing. Global Health and Aging. Geneva; 2011. |
[2] | European Commission. Joint Employment Report. 2017. |
[3] | WHO. Ageing and health, Fact Sheets. Geneva: World Health Organization; (2018) . |
[4] | Kenny GP , Groeller H , McGinn R , Flouris AD . Age, human performance, and physical employment standards. Appl Physiol Nutr Metab=Physiol Appl Nutr Metab. (2016) ;41: (6 Suppl 2):S92–107. |
[5] | Palmer KT , D’Angelo S , Harris EC , Linaker C , Gale CR , Evandrou M , et al. Frailty, prefrailty and employment outcomes in Health and Employment after Fifty (HEAF) Study. Occup Environ Med. (2017) ;74: (7):476–82. |
[6] | Strasser H . The “art of Aging” from an ergonomics viewpoint - Wisdoms on age. Occup Ergon. (2018) ;13: (S1):S1–24. |
[7] | Fox BRR , Brogmus GE , Maynard WS . Aging Workers & Ergonomics A Fresh Perspective. Prof Safety; Des Plaines. (2015) ;(January):33–41. |
[8] | WHO.WHOTechnical Report Series, Aging andWorking Capacity. Geneva; 1993. |
[9] | OECD. OECD Productivity Manual: A Guide to the Measurement of Industry-Level and Aggregate Productivity Growth. Vol. 2, Measuring Productivity - OECD Manual. 2001. |
[10] | ILO. Key Indicators of the Labour Market. Ninth. ILO, editor. Geneva: International Labor Organization Cataloguing in Publication Data; (2016) . |
[11] | Azadeh A , Zarrin M . An intelligent framework for productivity assessment and analysis of human resource from resilience engineering, motivational factors, HSE and ergonomics perspectives. Saf Sci. (2016) ;89: :55–71. |
[12] | Gordois AL , Toth PP , Quek RG , Proudfoot EM , Paoli CJ , Gandra SR . Productivity losses associated with cardiovascular disease: a systematic review. Expert Rev Pharmacoeconomics Outcomes Res. (2016) ;16: (6):759–69. |
[13] | Grossmeier J , Mangen DJ , Terry PE , Haglund-Howieson L . Health risk change as a predictor of productivity change. J Occup Environ Med. (2015) ;57: (4):347–54. |
[14] | ILO. Age discrimination and older workers: Theory and legislation in comparative context Conditions of Work and Employment Series N°20. Ghosheh N, editor . GENEVA; (2008) . 67p. |
[15] | Strulik H , Werner K . 50 is the new 30—long-run trends of schooling and retirement explained by human aging. J Econ Growth. (2016) ;21: (2):165–87. |
[16] | Schloegel U , Stegmann S , van Dick R , Maedche A . Age stereotypes in distributed software development: The impact of culture on age-related performance expectations. Inf Softw Technol. (2018) ;97: :146–62. |
[17] | Kirchner C , Bock OL , Volker I . The effects of priming with age stereotypes on a PC-based mail-sorting task. Ergonomics. (2017) ;60: (4):512–7. |
[18] | Schloegel U , Stegmann S , Maedche A , van Dick R . Age stereotypes in agile software development - an empirical study of performance expectations. Inf Technol People. (2018) ;31: (1):41–62. |
[19] | McNamara TK , Pitt-Catsouphes M , Sarkisian N , Besen E , Kidahashi M . Age bias in the workplace: Cultural stereotypes and in-group favoritism. Int J Aging Hum Dev. (2016) ;83: (2):156–83. |
[20] | Chiesa R , Toderi S , Dordoni P , Henkens K , Fiabane EM , Setti I . Older workers: stereotypes and occupational self-efficacy. J Manag Psychol. (2016) ;31: (7):1152–66. |
[21] | McNamara TK , Pitt-Catsouphes M , Sarkisian N , Besen E , Kidahashi M . Age Bias in the Workplace: Cultural Stereotypes and In-Group Favoritism. Int J Aging Hum Dev. (2016) ;83: (2):156–83. |
[22] | Tranfield D , Denyer D , Smart P . Towards a methodology for developing evidence-informed management knowledge by means of systematic review. Br J Manag. (2003) ;14: (3):207–22. |
[23] | Denyer D , Tranfield D . Producing a systematic review. In: The Sage Handbook of Organizational Research Methods. (2009) . pp. 671–89. |
[24] | Sackett D , Richardson W , Rosenberg W , Haynes R . How to practice and teach evidence-based medicine. New York:Churchill Livingstone; (1997) . pp. 118–128. |
[25] | Thabane L , Thomas T , Ye C , Paul J . Posing the research question: not so simple. Can J Anesth Can d’anesthésie. (2009) ;56: (1):71. |
[26] | Falagas ME , Pitsouni EI , Malietzis G a , Pappas G . Comparison of PubMed, Scopus, Web of Science, and Google Scholar: strengths and weaknesses. FASEB J. (2008) [cited 2014 Jul 16]; 22: (2):338–42. |
[27] | Kennedy CA , Amick III BC , Dennerlein JT , Brewer S , Catli S , Williams R , et al. Systematic Review of the Role of Occupational Health and Safety Interventions in the Prevention of Upper Extremity Musculoskeletal Symptoms, Signs, Disorders, Injuries, Claims and Lost Time. J Occup Rehabil. (2010) ;20: (2):127–62. |
[28] | Kmet LM , Lee RC , Cook LS . Standard quality assessment criteria for evaluating primary research from a variety of fields. . . . Technol Assess . . . . 2004;(February). |
[29] | Kandula T , Park SB , Cohn RJ , Krishnan A V . Farrar MA . Pediatric chemotherapy induced peripheral neuropathy: A systematic review of current knowledge. Cancer Treat Rev. (2016) ;50: :118–28. |
[30] | Gangan N , Yang Y . The Impact of Work Absences on Health Services Utilization. (2018) ;60: (3):139–45. |
[31] | Ackerman IN , Bucknill A , Page RS , Broughton NS , Roberts C , Cavka B , et al. The substantial personal burden experienced by younger people with hip or knee osteoarthritis. Osteoarthr Cartil. (2015) ;23: (8):1276–84. |
[32] | Ang JB , Madsen JB . Imitation versus innovation in an aging society: international evidence since 1870. J Popul Econ. (2015) ;28: (2):299–327. |
[33] | Bal PM , van Kleef M , Jansen PGW . The impact of career customization on work outcomes: Boundary conditions of manager support and employee age. J Organ Behav. (2015) ;36: (3):421–40. |
[34] | Dewa CS , Nieuwenhuijsen K , Sluiter JK . How Does the Presence of High Need for Recovery Affect the Association Between Perceived High Chronic Exposure to Stressful Work Demands and Work Productivity Loss? J Occup Environ Med. (2016) ;58: (6):617–22. |
[35] | Godinho MR , Greco RM , Teixeira MTB , Teixeira LR , Guerra MR , Chaoubah A . Work ability and associated factors of Brazilian technical-administrative workers in education. BMC Res Notes. (2016) ;9: :1. |
[36] | Ishii K , Shibata A , Oka K . Work Engagement, Productivity, and Self-Reported Work-Related Sedentary Behavior among Japanese Adults: A Cross-Sectional Study. J Occup Environ Med. (2018) ;60: (4):e173–7. |
[37] | Jankowiak S , Rose U , Kersten N . Application of the ICF based Norwegian function assessment scale to employees in Germany. J Occup Med Toxicol. (2018) ;13: (1):3. |
[38] | Kozuki N , Wuliji T . Measuring productivity and its relationship to community health worker performance in Uganda: a cross-sectional study. BMC Health Serv Res. (2018) ;18: (1):340. |
[39] | Krane L , Johnsen R , Fleten N , Nielsen C V . Stapelfeldt CM . Jensen C , et al. Sickness absence patterns and trends in the health care sector: 5-year monitoring of female municipal employees in the health and care sectors in Norway and Denmark. Hum Resour Health. (2014) ;12: (1):1–8. |
[40] | Lee HJ . Effects of public-service employee age and performance of emotional labor on job pride. Soc Behav Pers. (2016) ;44: (8):1339–48. |
[41] | Lohela-Karlsson M , Nybergh L , Jensen I . Perceived health and work-environment related problems and associated subjective production loss in an academic population. BMC Public Health. (2018) ;18: (1):257. |
[42] | Mache S , Vitzthum K , Groneberg DA . High work ability and performance in psychiatric health care services: Associations with organizational, individual and contextual factors. Neurol Psychiatry Brain Res. (2015) ;21: (2):88–95. |
[43] | Malinen J , Taskinen J , Tolppa T . Productivity of cut-to-length harvesting by operators’ age and experience. Croat J For Eng. (2018) ;39: (1):15–22. |
[44] | Martinez MC , do Rosário Dias de Oliveira Latorre M , Fischer FM . A cohort study of psychosocial work stressors on work ability among Brazilian hospital workers. Am J Ind Med. (2015) ;58: (7):795–806. |
[45] | Nakagawa Y , Akiomi I , Kawakami N , Tsuno K , Tomioka K , Nakanishi M , et al. Job Demands, Job Resources, and Job Performance in Japanese Workers: A Cross-sectional Study. Ind Health. (2014) ;52: (6):471–9. |
[46] | Tsai JH-C , Thompson EA . Effects of Social Determinants on Chinese Immigrant Food Service Workers’ Work Performance and Injuries: Mental Health as a Mediator. J Occup Environ Med. (2015) ;57: (7):806–13. |
[47] | Chambers C , Frampton C , Barclay M . Presenteeism in the New Zealand senior medical workforce—A mixed-methods analysis. N Z Med J. (2017) ;130: (1449):10–21. |
[48] | Chiu S , Black CL , Yue X , Greby SM , Laney AS , Campbell AP , et al. Working with influenza-like illness: Presenteeism among US health care personnel during the 2014-2015 influenza season. Am J Infect Control. (2017) ;45: (11):1254–8. |
[49] | d’Errico A , Ardito C , Leombruni R . Work organization, exposure to workplace hazards and sickness presenteeism in the European employed population. Am J Ind Med. (2016) ;59: (1):57–72. |
[50] | Jeon SH , Leem JH , Park SG , Heo YS , Lee BJ , Moon SH , et al. Association among working hours, occupational stress, and presenteeism among wage workers: Results from the second Korean Working Conditions Survey. Ann Occup Environ Med. (2014) ;26: (1):1–8. |
[51] | Mandiracioglu A , Bolukbas O , Demirel M , Gumeli F . Factors related to presenteeism among employees of the private sector. Int J Occup Saf Ergon. (2015) ;21: (1):80–5. |
[52] | Milner A , Butterworth P , Bentley R , Kavanagh AM , Lamontagne AD . Sickness absence and psychosocial job quality: An analysis from a longitudinal survey of working Australians, 2005-2012. Am J Epidemiol (2015) ;181: (10):781–8. |
[53] | Susser P , Ziebarth NR . Profiling the U.S. Sick Leave Landscape: Presenteeism among Females. Health Serv Res. (2016) ;51: (6):2305–17. |
[54] | Taloyan M , Kecklund G , Thörn L , Kjeldgård L , Westerlund H , Svedberg P , et al. Sickness presence in the Swedish Police in 2007 and in 2010: Associations with demographic factors, job characteristics, and health. Work. (2016) ;54: (2):379–87. |
[55] | Avila A . Self-reported medical leave by Brazilian Labor-law magistrates. (2016) ;55: :715–24. |
[56] | Aaviksoo E , Kiivet RA . Influence of the sickness benefit reform on sickness absence. Health Policy (New York). (2016) ;120: (9):1070–8. |
[57] | Airaksinen J , Jokela M , Virtanen M , Oksanen T , Koskenvuo M , Pentti J , et al. Prediction of long-term absence due to sickness in employees: Development and validation of a multifactorial risk score in two cohort studies. Scand J Work Environ Heal. (2018) ;44: (3):274–82. |
[58] | Antai D , Braithwaite P , Oke A , Anthony D . A ‘Balanced’ Life: Work- Life Balance and Sickness Absence in Four Nordic Countries. Int J Occup Environ Med. (2015) ;4: :209–17. |
[59] | Ariansen AMS . Age, occupational class and sickness absence during pregnancy: a retrospective analysis study of the Norwegian population registry. BMJ Open. (2014) ;4: (5):e004381. |
[60] | Bal PM , Dorenbosch L . Age-related differences in the relations between individualised HRM and organisational performance: A large-scale employer survey. Hum Resour Manag J. (2015) ;25: (1):41–61. |
[61] | Bogaert I , De Martelaer K , Deforche B , Clarys P , Zinzen E . Associations between different types of physical activity and teachers’ perceived mental, physical, and work-related health. BMC Public Health. (2014) ;14: (1):534. |
[62] | Catano VM , Bissonnette AB . Examining paid sickness absence by shift workers. Occup Med (Chic Ill). (2014) ;64: (4):287–93. |
[63] | Ervasti J , Mattila-Holappa P , Joensuu M , Pentti J , Lallukka T , Kivimäki M , et al. Predictors of Depression and Musculoskeletal Disorder Related Work Disability among Young, Middle-Aged, and Aging Employees. J Occup Environ Med. (2017) ;59: (1):114–9. |
[64] | Fitzgerald S , Kirby A , Murphy A , Geaney F . Obesity, diet quality and absenteeism in a working population. Public Health Nutr. (2016) ;19: (18):3287–95. |
[65] | Gabbay M , Shiels C , Hillage J . Factors associated with the length of fit note-certified sickness episodes in the UK. Occup Environ Med. (2015) ;72: (7):467–75. |
[66] | Gajewski K , Burris D , Spears DR , Sullivan K , Oyinloye O , McNeil C , et al. Demographic trends of sick leave absenteeism among civil service employees at a federal agency from 2004 to 2012. J Occup Environ Med. (2015) ;57: (3):277–83. |
[67] | Grynderup MB , Nabe-nielsen K , Lange T , Conway PM , Bonde JP , Garde AH , et al. The associations between workplace bullying, salivary cortisol, and long-term sickness absence: a longitudinal study. 2017;1-11. |
[68] | Leão de AL M , Barbosa-Branco A , Rassi Neto E , Ribeiro CAN , Turchi MD . Absenteísmo-doença no serviço público municipal de Goiânia. Rev Bras Epidemiol. (2015) ;18: (1):262–77. |
[69] | Leao ALM , Barbosa-Branco A , Turchi MD , Steenstra IA , Cole DC . Sickness absence among municipal workers in a Brazilian municipality: a secondary data analysis. BMC Res Notes. (2017) ;10: (1):773. |
[70] | Mittendorfer-Rutz E , Dorner TE . Socio-economic factors associated with the 1-year prevalence of severe pain and pain-related sickness absence in the Austrian population. Wien Klin Wochenschr. (2018) ;130: (1-2):4–13. |
[71] | Murcia López G , Delclós Clanchet J , Ubalde López M , Calvo Bonacho E , Benavides FG . Has the Spanish economic crisis affected the duration of sickness absence episodes? Soc Sci Med. (2016) ;160: :29–34. |
[72] | Mytton OT , Panter J , Ogilvie D . Longitudinal associations of active commuting with wellbeing and sickness absence. Prev Med (Baltim). (2016) ;84: :19–26. |
[73] | Nätti J , Oinas T , Härmä M , Anttila T , Kandolin I . Combined effects of shiftwork and individual working time control on long-term sickness absence: A prospective study of finnish employees. J Occup Environ Med. (2014) ;56: (7):732–8. |
[74] | Nätti J , Oinas T , Anttila T . Time pressure, working time control and long-term sickness absence. Occup Environ Med. (2015) ;72: (4):265–70. |
[75] | Nordström K , Hemmingsson T , Ekberg K , Johansson G . Sickness absence in workplaces: Does it reflect a healthy hire effect? Int J Occup Med Environ Health. (2016) ;29: (2):315–30. |
[76] | Oenning NSX , Carvalho FM , Lima VMC . Risk factors for absenteeism due to sick leave in the petroleum industry. Rev Saude Publica. (2014) ;48: (1):103–12. |
[77] | Rabacow FM , Levy RB , Menezes PR , do Carmo Luiz O , Malik AM , Burdorf A . The influence of lifestyle and gender on sickness absence in Brazilian workers. BMC Public Health. (2014) ;14: (1):317. |
[78] | Rabacow FM , Luiz do O C , Malik AM , Burdorf A . Lifestyle factors, direct and indirect costs for a Brazilian airline company. Rev Saude Publica. (2014) ;48: (6):949–57. |
[79] | Salonen L , Blomgren J , Laaksonen M , Niemelä M . Sickness absence as a predictor of disability retirement in different occupational classes: A register-based study of a working-age cohort in Finland in 2007-2014. BMJ Open. (2018) ;8: (5):1–8. |
[80] | Sigursteinsdóttir H , Rafnsdóttir GL . Sickness and sickness absence of remaining employees in a time of economic crisis: A study among employees of municipalities in Iceland. Soc Sci Med. (2015) ;132: (October 2008):95–102. |
[81] | Skerjanc A , Fikfak MD . Sickness presence and stressful life events of health care workers. Cent Eur J Public Health. (2015) ;23: (3):240–3. |
[82] | Slany C , Schütte S , Chastang JF , Parent-Thirion A , Vermeylen G , Niedhammer I . Psychosocial work factors and long sickness absence in Europe. Int J Occup Environ Health. (2014) ;20: (1):16–25. |
[83] | Viitasalo N , Nätti J . Perceived Age Discrimination at Work and Subsequent Long-Term Sickness Absence Among Finnish Employees. J Occup Environ Med. (2015) ;57: (7):801–5. |
[84] | Fritzsche L , Wegge J , Schmauder M , Kliegel M , Schmidt KH . Good ergonomics and team diversity reduce absenteeism and errors in car manufacturing. Ergonomics. (2014) ;57: (2):148–61. |
[85] | Gerich J . Sickness presence, sick leave and adjustment latitude. Int J Occup Med Environ Health. (2014) ;27: (5):736–46. |
[86] | Giannini SPP , Latorre MDRDDO , Fischer FM , Ghirardi ACDAM , Ferreira LP . Teachers’ voice disorders and loss of work ability: A case-control study. J Voice. (2015) ;29: (2):209–17. |
[87] | Kenny D , Driscoll T , Ackermann B . Effects of Aging on Musical Performance in Professional Orchestral Musicians. Med Probl Perform Art. (2018) ;33: (1):39–46. |
[88] | Kim JY , Lee J , Muntaner C , Kim SS . Who is working while sick? Nonstandard employment and its association with absenteeism and presenteeism in South Korea. Int Arch Occup Environ Health. (2016) ;89: (7):1095–101. |
[89] | Frey JJ , Osteen PJ , Berglund PA , Jinnett K , Ko J . Predicting the impact of chronic health conditions on workplace productivity and accidents: Results from two US Department of Energy National Laboratories. J Occup Environ Med. (2015) ;57: (4):436–44. |
[90] | Oosterhaven JAF , Flach PA , Bültmann U , Schuttelaar MLA . Presenteeism in a Dutch hand eczema population—a cross-sectional survey. Contact Dermatitis. (2018) ;79: (1):10–9. |
[91] | Demou E , Smith S , Bhaskar A , Mackay DF , Brown J , Hunt K , et al. Evaluating sickness absence duration by musculoskeletal and mental health issues: A retrospective cohort study of Scottish healthcare workers. BMJ Open. (2018) ;8: (1):1–11. |
[92] | Endo M , Muto T , Haruyama Y , Yuhara M , Sairenchi T , Kato R . Risk factors of recurrent sickness absence due to depression: a two-year cohort study among Japanese employees. Int Arch Occup Environ Health. (2015) ;88: (1):75–83. |
[93] | Haeffner R , Kalinke LP , Felli VEA , Mantovani de M F , Consonni D , Sarquis LMM . Absenteísmo por distúrbios musculoesqueléticos em trabalhadores do Brasil: milhares de dias de trabalho perdidos. Rev Bras Epidemiol. (2018) ;21: . |
[94] | Mesas AE , González AD , Mesas CE , De Andrade SM , Magro IS , Del Llano J . The association of chronic neck pain, low back pain, and migraine with absenteeism due to health problems in Spanish workers. Spine (Phila Pa 1976). (2014) ;39: (15):1243–53. |
[95] | Smith P , Bielecky A , Ibrahim S , Mustard C , Saunders R , Beaton D , et al. Impact of pre-existing chronic conditions on age differences in sickness absence after a musculoskeletal work injury: A path analysis approach. Scand J Work Environ Heal. (2014) ;40: (2):167–75. |
[96] | Virtanen M , Vahtera J , Head J , Dray-Spira R , Okuloff A , Tabak AG , et al. Work disability among employees with diabetes: Latent class analysis of risk factors in three prospective cohort studies. PLoS One. (2015) ;10: (11):1–14. |
[97] | Zoer I , Frings-Dresen MHW , Sluiter JK . Are musculoskeletal complaints, related work impairment and desirable adjustments in work age-specific? Int Arch Occup Environ Health. (2014) ;87: (6):647–54. |
[98] | Evans-Lacko S , Knapp M . Global patterns of workplace productivity for people with depression: absenteeism and presenteeism costs across eight diverse countries. Soc Psychiatry Psychiatr Epidemiol. (2016) ;51: (11):1525–37. |
[99] | Fouad AM , Waheed A , Gamal A , Amer SA , Abdellah RF , Shebl FM . Effect of chronic diseases on work productivity: A propensity score analysis. J Occup Environ Med. (2017) ;59: (5):480–5. |
[100] | Lau B , Victor M , Ruud T . Sickness absence and presence among employees in treatment for common mental disorders. Scand J Public Health. (2015) ;44: (4):338–46. |
[101] | Ilmakunnas P , Maliranta M . How does the age structure of worker flows affect firm performance? J Product Anal. (2016) ;46: (1):43–62. |
[102] | Kahn LB , Lange F . Employer learning, productivity, and the earnings distribution: Evidence from performance measuresc. Rev Econ Stud. (2014) ;81: (4):1575–613. |
[103] | Rocha R . Aging, productivity and wages: Is an aging workforce a burden to firms? Espacios. (2017) ;38: (39). |
[104] | Schubert T , Andersson M . Old is gold? The effects of employee age on innovation and the moderating effects of employment turnover. Econ Innov New Technol. (2015) ;24: :95–113. |
[105] | Boenzi F , Mossa G , Mummolo G , Romano VA . Workforce aging in production systems: Modeling and performance evaluation. Procedia Eng. (2015) ;100: (January):1108–15. |
[106] | Pfeifer C , Wagner J . Age and gender effects of workforce composition on productivity and profits: Evidence from a new type of data for German enterprises. Contemp Econ. (2014) ;8: (1):25–46. |
[107] | Grund C , Westergaard-Nielsen N . Age structure of the workforce and firm performance. Int J Manpow. (2008) ;29: (5):410–22. |
[108] | Cardoso AR , Guimarães P , Varejão J . Are older workers worthy of their pay? An empirical investigation of age-productivity and age-wage Nexuses. Economist. (2011) ;159: (2):95–111. |
[109] | Dostie B . Wages, productivity and aging. Economist. (2011) ;159: (2):139–58. |
[110] | Ng TWH , Feldman DC . The Relationship of Age to Ten Dimensions of Job Performance. J Appl Psychol. (2008) ;93: (2):392–423. |
[111] | Kowalski-Trakofler KM , Steiner LJ , Schwerha DJ . Safety considerations for the aging workforce. Saf Sci. (2005) ;43: (10):779–93. |
[112] | Montepare JM . Subjective age: Toward a guiding lifespan framework. Int J Behav Dev. (2009) ;33: (1):42–6. |
[113] | Hallett M . Tap into the power of older workers. Saf Heal. (1997) ;155: (2):28–32. |
[114] | Montepare JM . Subjective age: Toward a guiding lifespan framework. Int J Behav Dev. (2009) ;33: (1):42–6. |
[115] | Stephan Y , Chalabaev A , Kotter-Gruhn D , Jaconelli A . “Feeling Younger, Being Stronger”: An Experimental Study of Subjective Age and Physical Functioning Among Older Adults. Journals Gerontol Ser B Psychol Sci Soc Sci. (2013) ;68: (1):1–7. |
[116] | Nowrouzi-Kia B , Gohar B , Casole J , Chidu C , Dumond J , McDougall A , et al. A systematic review of lost-time injuries in the global mining industry. Work A J Prev Assess Rehabil. (2018) ;60: (1):49–61. |
[117] | NIOSH. A National Agenda to Advance Total Worker Health Research, Practice, Policy, and Capacity. National Occupational Research Agenda (NORA) National Total Worker Health ® Agenda. Cincinnati, OH; 2016. |
[118] | Toossi M , Torpey E . Older workers: Labor force trends and career options. 2017. |
[119] | Shetty P . Grey matter: ageing in developing countries. Lancet. (2012) ;379: (9823):1285–7. |
[120] | Liberty Mutual Research Institute. AgingWorkforce: New Challenges in Safety and Disability Research. (2009) ;12: (2). |
[121] | Flower DJC , Tipton MJ , Milligan GS . Considerations for physical employment standards in the aging workforce. Milligan GS, Blacker SD, Brown PEH, Siddall AG, editors. Work A J Prev Assess Rehabil. (2019) ;63: (4):509–19. |
[122] | Sorensen G , McLellana D , Sabbathc E , Dennerleinb JM , Naglera E Hurtadog D . et alIntegrating Worksite Health Protection and Health Promotion: A Conceptual Model for Intervention and Research. Prev Med (Baltim). (2017) ;37: (4):784–90. |
[123] | WHO. Global health observatory data repository. 2012. |
[124] | Murphy G , Belin A , Dupont C , Oulès L , Kuipers Y , Ilmarinen J , et al. Safer and healthier work at any age: final overall analysis report [Internet]. 2016. |
[125] | Hashim J , Wok S . Competence, performance and trainability of older workers of higher educational institutions in Malaysia. Empl Relations. (2014) ;36: (1):82–106. |
[126] | Loch CH , Sting FJ , Bauer N , Mauermann H . How BMW is defusing the demographic time bomb. Harv Bus Rev. (2010) ;88: (3):99–102. |
[127] | Bal PM , De Lange AH . From flexibility human resource management to employee engagement and perceived job performance across the lifespan: A multisample study. J Occup Organ Psychol. (2015) ;88: (1):126–54. |
[128] | Oakman J , Howie L . How can organisations influence their older employees’ decision of when to retire? Work A J Prev Assess Rehabil. (2013) ;45: (3):389–97. |
[129] | Gostautait≐ B , Buciūnien≐ I . The role of work characteristics in enhancing older employees’ performance: evidence from a post-Soviet country. Int J Hum Resour Manag. (2015) ;26: (6):757–82. |
[130] | Alessandri G , Borgogni L . Stability and Change of Job Performance Across the Career Span. Hum Perform. (2015) ;28: (5):381–404. |
[131] | Allan J , Bender KA , Theodossiou I . Performance pay and low-grade stress: An experimental study. Work A J Prev Assess Rehabil. 2020;Pre-press:1-9. |
[132] | Berryman P , Lukes E , Keller SM . Effects of Extended Work Shifts and Shift Work on Patient Safety, Productivity, and Employee Health. AAOHN J. (2009) ;57: (12):497–502. |


