
Properties of measurements obtained during cardiopulmonary exercise testing in individuals with Myalgic Encephalomyelitis/Chronic Fatigue Syndrome
Abstract
BACKGROUND:
Diminished cardiopulmonary exercise test (CPET) performance indicates the physiological basis for reduced capacity for activities of daily living and work. Thus, it may be a biomarker for Myalgic Encephalomyelitis/Chronic Fatigue Syndrome (ME/CFS).
OBJECTIVE:
To determine statistical properties of cardiac, pulmonary, and metabolic measurements obtained during CPET in people with ME/CFS.
METHODS:
Fifty-one females with ME/CFS and 10 sedentary females with similar age and body mass received cardiac, pulmonary, and metabolic measurements during 2 CPETs separated by 24 hours. Two-way analysis of variance and effect size calculations (Cohen’s d) were used to assess the magnitude and statistical significance of differences in measurements between groups. Reliability of CPET measurements was estimated using intraclass correlation coefficients (ICC2,1). Responsiveness of CPET measurements was assessed using minimum detectable change outside the 95% confidence interval (MDC95) and coefficients of variation (CoV).
RESULTS:
CPET measurements demonstrated moderate to high reliability for individuals with ME/CFS. Comparing subjects with ME/CFS and control subjects yielded moderate to large effect sizes on all CPET measurements. MDC95 for all individuals with ME/CFS generally exceeded control subjects and CoVs for CPET measurements were comparable between groups.
CONCLUSIONS:
CPET measurements demonstrate adequate responsiveness and reproducibility for research and clinical applications.
1Introduction
Measurements of cardiovascular, pulmonary, and metabolic function during exercise are used in a wide variety of clinical and research applications. Estimates about physiological functioning are made based on a synthesis of data from continuous measurements during pulmonary analysis and electrocardiography [1]. These estimates are often used to substantiate the physiological basis for the inability to complete activities of daily living and work [2, 3]. The non-invasive nature of measurements obtained during cardiopulmonary exercise testing (CPET) has led to their common use to diagnose, form a prognosis, and establish clinical outcomes in individual with various health conditions.
The value of interpretations based on clinical data depend on the soundness of the data’s statistical properties. Several studies support that CPET measurements obtained both at and below peak levels of exertion demonstrate sufficient reproducibility in individuals with various fatiguing cardiovascular, pulmonary, and metabolic health conditions. For example, moderate to strong reproducibility and responsiveness already has been identified for individuals with cystic fibrosis [4], end-stage renal disease [5], fibrotic interstitial pneumonia [6], pulmonary arterial hypertension [7], restrictive lung disease [8], stable angina, severe heart failure [9], valvular heart disease [10]. Indeed, the ability to detect small changes in cardiovascular, pulmonary, and metabolic functioning is one of the important appeals of CPET measurements in these clinical populations [9].
One emerging application for CPET measurements is to characterize cardiovascular, pulmonary, and metabolic functioning in individuals with Myalgic Encephalomyelitis/Chronic Fatigue Syndrome (ME/CFS). According to Fukuda and colleagues [11] an individual must have persistent or relapsing fatigue for greater than 6 months to meet criteria for ME/CFS. In addition to the specific fatigue criteria, ME/CFS is characterized by a broad spectrum of disabling deficits in autonomic function, immune compromise, and cognitive disturbance [11, 12]. A single bout of peak exercise is thought to promote symptoms and disability in individuals with ME/CFS [13, 14]. However, a single CPET may be insufficient to document the cardiovascular, pulmonary, and metabolic disturbances that are potentially associated with latent symptomatology in individuals with ME/CFS following a single acute bout of peak exercise. Thus, our group has advocated for the use of a serial CPET protocol consisting of 2 CPET procedures within 24 hours [15].
Although preliminary evidence suggests the addition of a second CPET within 24 hours increases the sensitivity of CPET to detect cardiovascular, pulmonary, and metabolic changes that may be associated with symptoms [16–18], the reproducibility and responsiveness of CPET measurements in individuals with ME/CFS, as yet, remains unclear. In addition, no studies are currently available that compare the reproducibility and responsiveness of serial CPET measurements between individuals with ME/CFS and matched non-disabled sedentary individuals. Therefore, the purpose of this study was to document the reproducibility and responsiveness of two CPET measurements acquired 24 hours apart in individuals with ME/CFS and matched non-disabled sedentary individuals.
2Method
2.1Subjects
Subjects from different parts of the United States were referred by their physician to a testing facility for evaluation of functional capacity. Subjects either met common case definition for ME/CFS [11, 12] or were diagnosed with ME/CFS by their referring physician. The case definition criteria included a history of fatigue lasting greater than 6 months that was unexplained by another physical or psychological health condition. In addition, all subjects demonstrated at least 4 of the following symptoms: malaise for a minimum of 24 hours following exercise, impaired memory or concentration, unrefreshing sleep, muscle pain, multiple joint pain without signs of inflammation, headaches of new type or severity, sore throat, and/or tender cervical or axillary lymph nodes. Ten sedentary, but otherwise non-disabled, control subjects from the community were also recruited for the study. Purposive sampling of control subjects was completed to ensure that control subjects’ sex, age, and body mass index was similar to the sample of subjects with ME/CFS. ‘Sedentary’ was operationally defined as exercising to the point of perspiration one time or less per week. All subjects were required to undergo and complete two days of exercise testing for inclusion in the study. All participants signed an informed consent document prior to testing. This retrospective study of clinical records received exempt review approval by the Institutional Review Board at University of the Pacific in Stockton, California.
2.2Procedure
After providing clinical informed consent, each subject received an exercise challenge consisting of two peak cardiopulmonary exercise tests (CPET) on an electronically braked bicycle ergometer, administered approximately 24 hours apart [17–20]. Before the exercise test, the entire procedure for exercise testing was explained in detail to each individual and informed consent was obtained. Subjects were fitted with 10-lead electrocardiography (ECG) electrodes for monitoring of heart rhythm, a mask, and headgear for collection of expired air, and a pulse oximeter for monitoring arterial oxygen saturation. Subjects were allowed to pedal for a short period (less than one minute). Workload was increased 15 watts per minute until voluntary exhaustion. ECG was monitored continuously for signs of cardiac arrhythmia or ischemia, and pulse oximetry was monitored to ensure safe levels of arterial oxygenation. Subjects were encouraged to pedal as long as possible, and testing was terminated when criteria for peak effort were met [1]. Subjects then remained seated on the ergometer and recovery was monitored for 2–5 minutes.
2.3Data analysis
Descriptive statistics. Descriptive statistics for demographic variables and CPET variables were calculated for each cohort, including means and standard deviations (SD). CPET measurements at peak effort and ventilatory anaerobic threshold (VAT) were analyzed. The time point of deflection in ventilation-time graph was identified, and CPET measurements at the time point corresponding with the deflection were taken to represent values at VAT [19]. One-way analysis of variance was used to determine the significance of differences between cohorts in continuous demographic variables. Bland-Altman plots were created for visual inspection of the data. The 95% limits of agreement (95% LOA) were calculated, given the mean Test #1 and Test #2±2 standard deviations of the marginal differences between Test #1 and Test #2, for individuals with ME/CFS and non-disabled sedentary individuals. Lines indicating the 95% LOA were superimposed on each plot [20].
Visual inspection of subgroup histograms and Q-Q plots, as well as the Shapiro-Wilk test, were used to assess the null hypothesis that measurement distributions were normal. Two-way analysis of variance (ANOVA) was used to assess the significance of between-groups, between-tests, and group-by-test differences in CPET measurements. Statistical significance of ANOVA testing was set at α ≤.025.
Reliability. Intraclass correlation coefficients and corresponding 95% confidence intervals (CI) were calculated for CPET measurements, using formula 2,1 (ICC2,1) [21, 22]. Strength of reproducibility among the variables was based on Munro’s criteria for evaluation of correlation coefficients: very low = 0.15–0.24, low = 0.25–0.49, moderate = 0.50–0.69, high = 0.70–0.89, and very high =0.90–1.00 [23].
Sensitivity to change. The strength of the relationship between CPET measurement variables in individuals with ME/CFS was compared to control subjects by calculating standardized mean differences (SMD; Cohen’s d) [24]. SMD were interpreted using Cohen’s guidelines for evaluation: small = 0.20–0.49, medium = 0.50–0.79, and large≥.80. Sensitivity to change of CPET measurements was determined by calculating minimal detectable change outside a 95% confidence interval (MDC95) for each subscale, given by the product of 1.96, √2, and the standard error of CPET measures. Standard error of CPET measure was given by the square root of the product of Test #1 CPET measurement variance and CPET measurement reliability subtracted from 1 [25]. Coefficients of variation (CoV) also were calculated for each CPET measurement at peak effort and VT, given by the standard deviation of the CPET measure divided by the mean value for the CPET measure [5, 7, 8, 26].
SPSS 25.0 for Mac (Chicago, IL, USA) was used for all data analysis. For all analyses, differences were considered statistically significant at p≤0.05, except for ANOVA, in which a Bonferroni-corrected alpha value was used (p≤0.025).
3Results
3.1Descriptive statistics
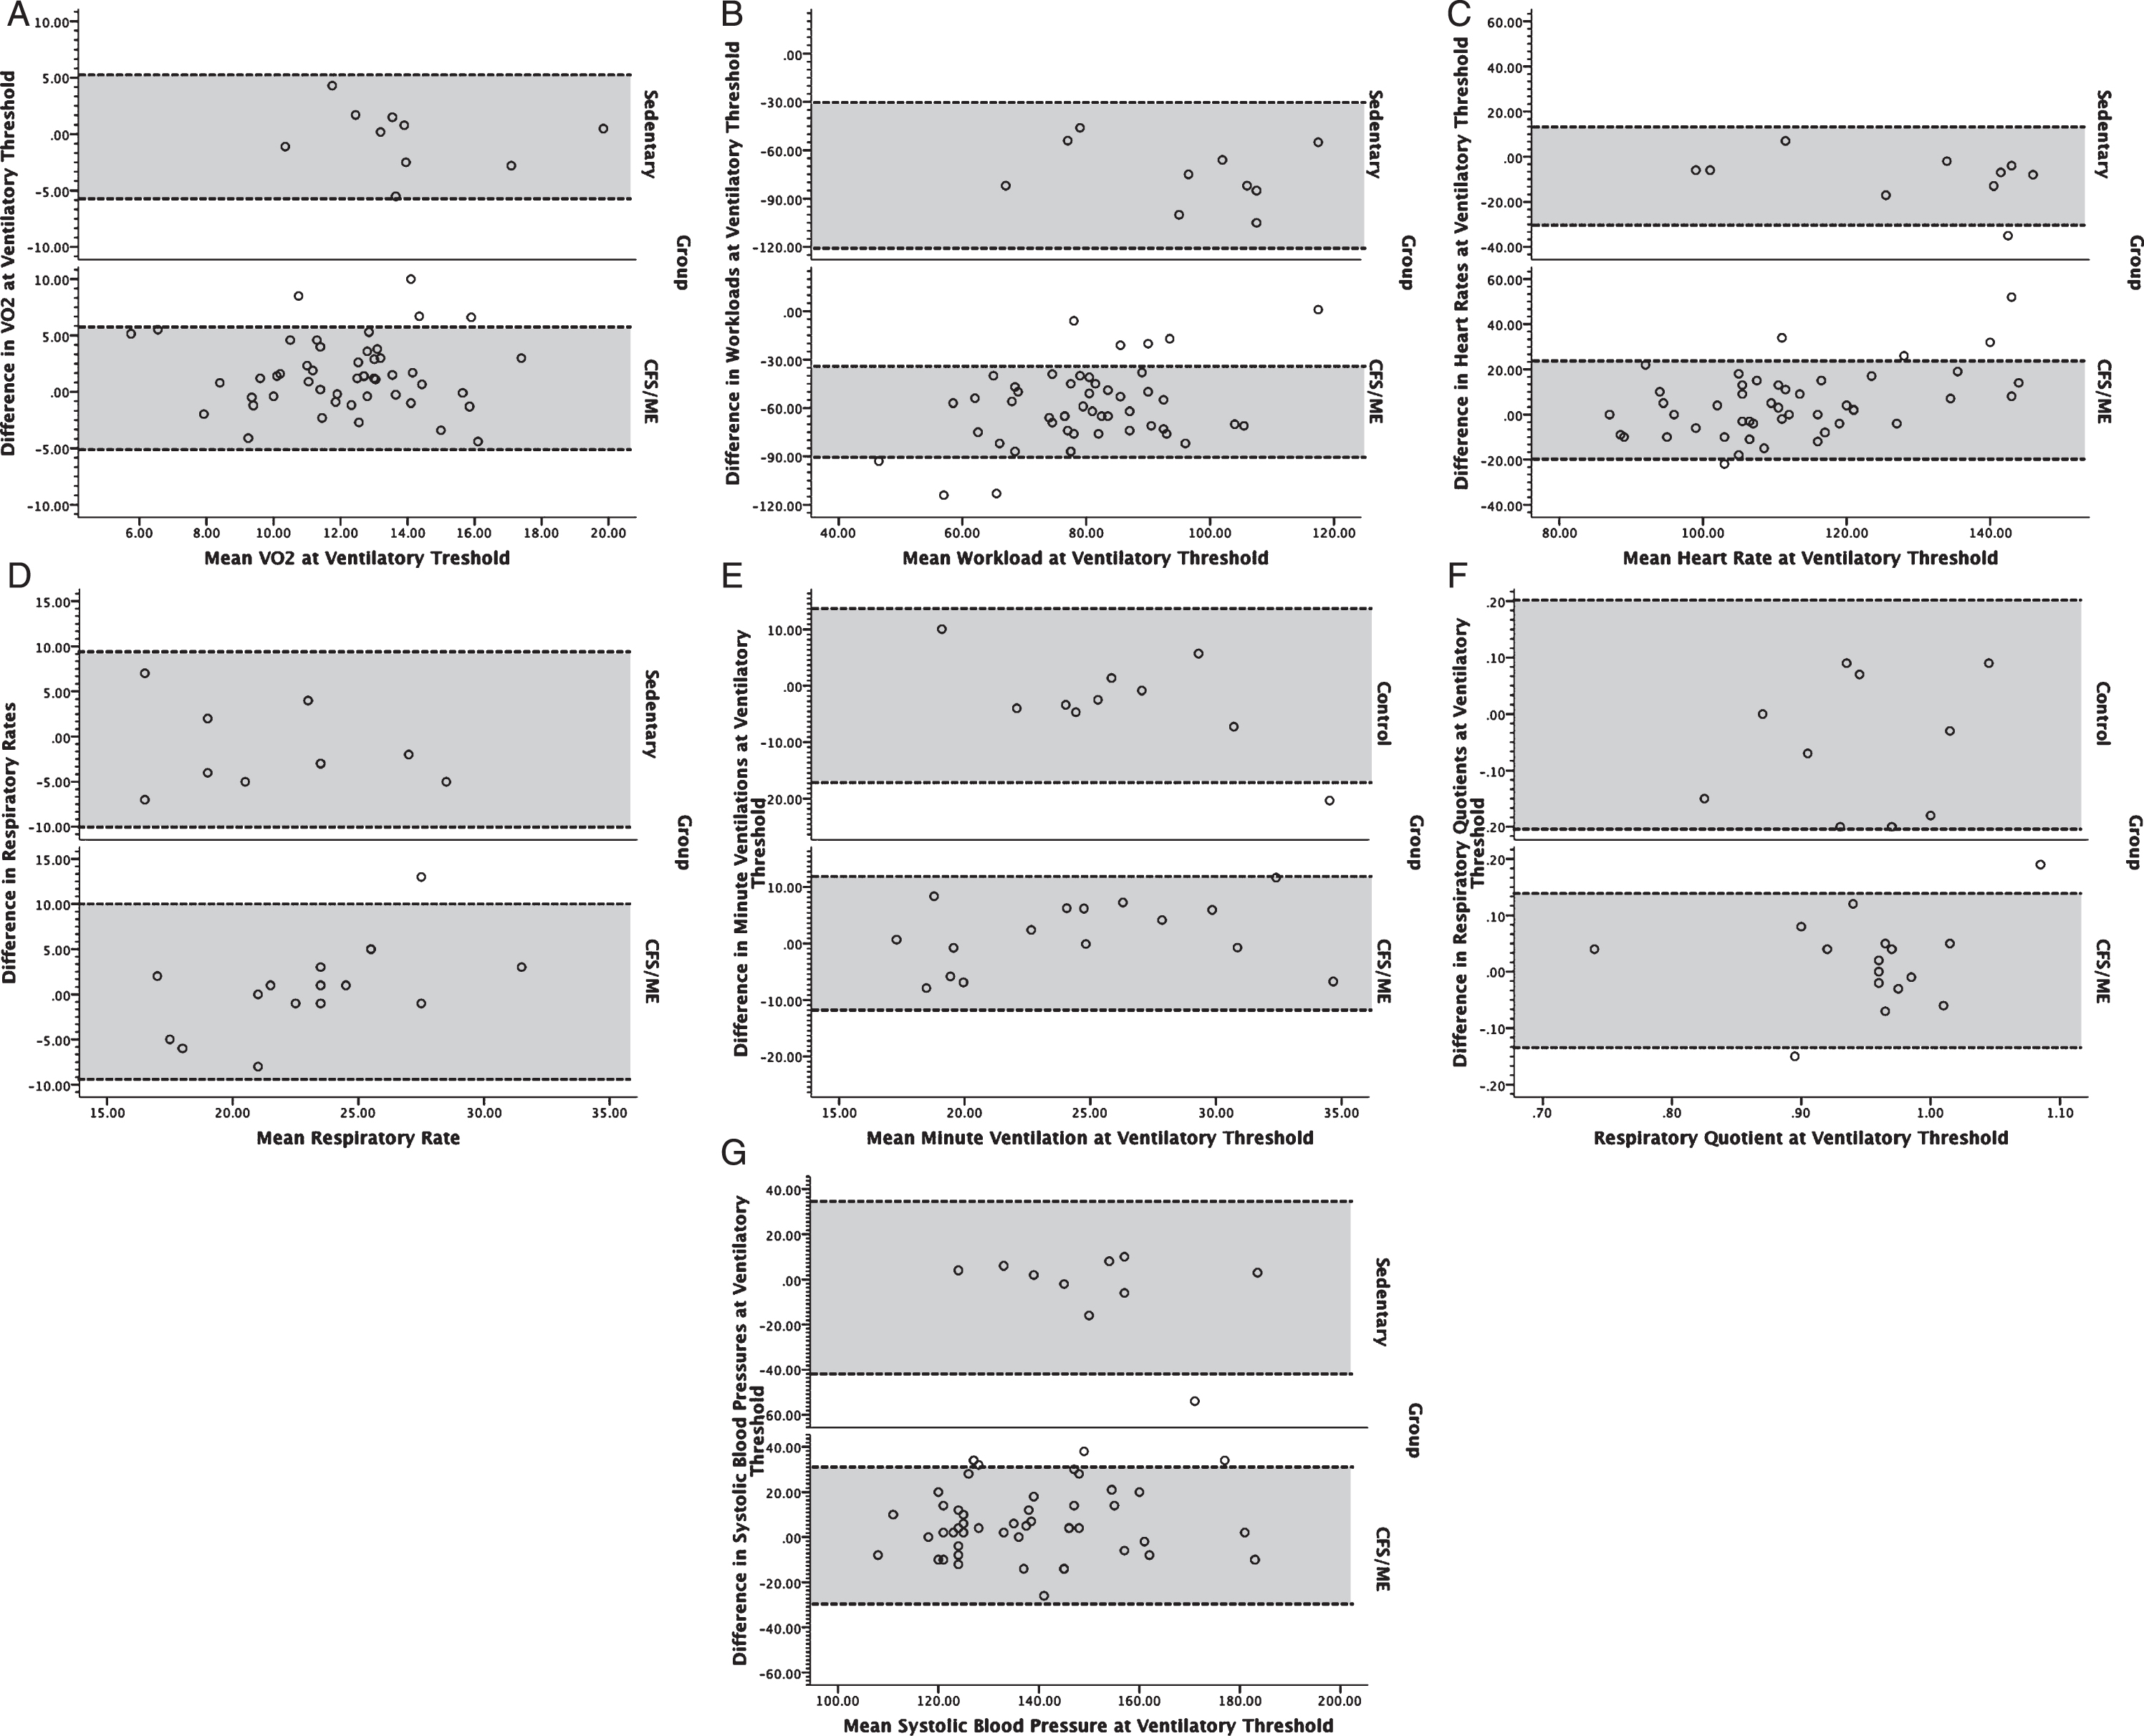
A total of 61 subjects participated in the study, including 51 individuals with ME/CFS (51 women) and 10 non-disabled sedentary subjects (10 women). Groups did not significantly differ with respect to sex, age (individuals with ME/CFS: 40.8±7.7 years [mean±standard deviation]; control subjects: 46.3±8.1 years), and BMI (individuals with ME/CFS: 26.0±5.0 kg/m2, control subjects: 29.0±4.2 kg/m2). All subjects achieved peak test criteria on both tests according to American Heart Association guidelines [27]. Visual inspection of Bland Altman plots revealed slightly broader interval for 95% LOA both at peak exercise (Fig. 1) and ventilatory threshold (Fig. 2) in individuals with ME/CFS compared to sedentary individuals. Outliers were present among both groups, and generally constituted less than 10% of the ME/CFS sample. All outliers were included in the analysis because they constituted a low proportion of each respective sample. In addition, inclusion of outliers would result in reliability and responsiveness estimates that are conservative because they serve to increase the variance within each sample in a manner that typically would be encountered in clinical and research applications. Despite the presence of outliers, data distributions for non-disabled subjects and subjects with ME/CFS were normally distributed (p > 0.05).
Fig. 1
Bland-Altman plots for volume of oxygen consumed (VO2; A), workload (B), heart rate (C), respiratory rate (D), minute ventilation (E), respiratory exchange ratio (F), and systolic blood pressure (G) at peak exercise for individuals with ME/CFS (bottom) and controls (top). Dotted lines bounding the shaded regions on each chart represent the 95% limits of agreement.
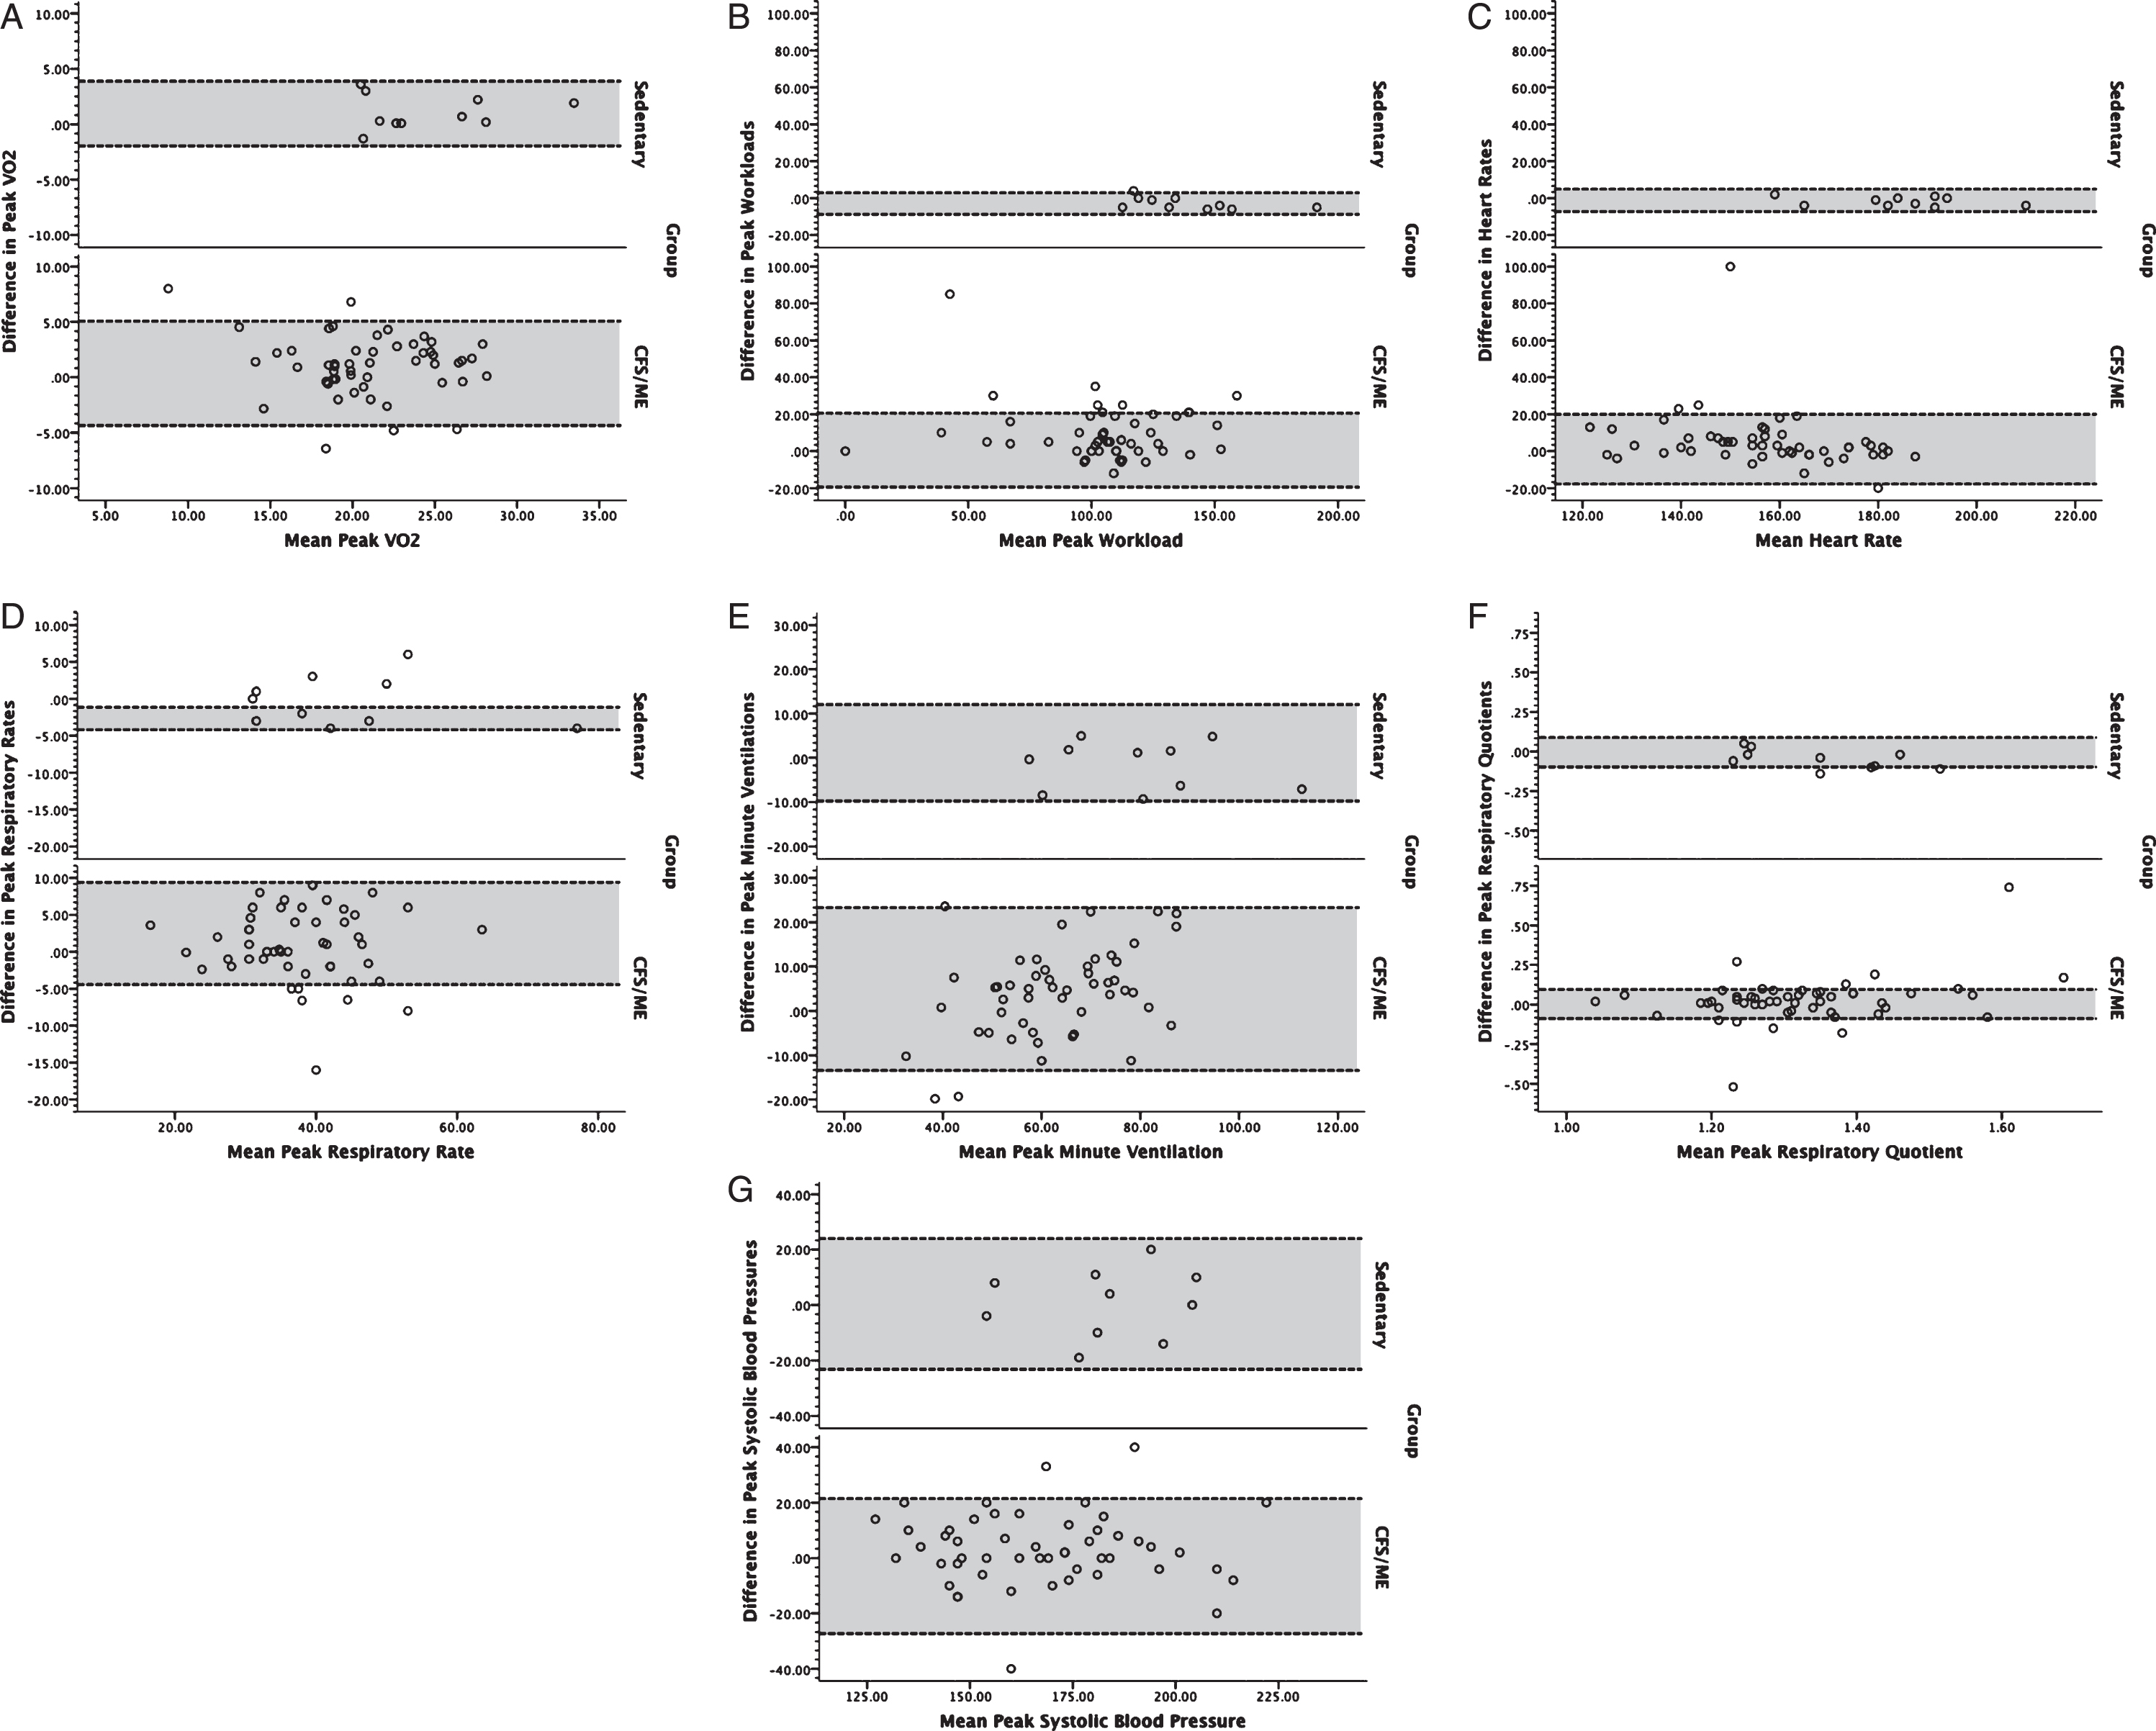
Fig. 2
Bland-Altman plots for volume of oxygen consumed (VO2; A), workload (B), heart rate (C), respiratory rate (D), minute ventilation (E), respiratory exchange ratio (F), and systolic blood pressure (G) at ventilatory anaerobic threshold for individuals with ME/CFS (bottom) and controls (top). Dotted lines bounding the shaded regions on each chart represent the 95% limits of agreement.
Measurements obtained at peak exertion for VO2, workload, heart rate, minute ventilation, and systolic blood pressure demonstrated significant main effects for group (p < 0.01), with the ME/CFS group demonstrating lower mean values than control subjects (Table 1). However, main effects for respiratory rate and respiratory exchange ratio at peak were not significantly different between groups. At VAT, there were significant main effects for group (p < .01) for VO2, workload, heart rate, and systolic blood pressure. There were no significant main effects for time (i.e., Test 1 and Test 2) for measurements obtained at peak exertion and VAT. Although there was a general decrease in CPET measurements obtained at peak exertion and VAT for subjects with ME/CFS, only workload demonstrated a significant group * test effect (p < 0.01).
Table 1
Metabolic characteristics of controls and individuals with Myalgic Encephalomyelitis/Chronic Fatigue Syndrome (ME/CFS) during two peak exercise tests conducted 24 hours apart. Values presented as: mean (standard deviation). Values for non-disabled subjects served as basis for inferential comparison of means
| Control Subjects | Individuals with ME/CFS | p-value | |||||
| (n = 10) | (n = 51) | ||||||
| Test 1 | Test 2 | Test 1 | Test 2 | Group | Test | Group * Test | |
| Peak | |||||||
| VO2 (ml/kg/min) | 25.0 (4.4) | 24.0 (4.3) | 21.4 (4.1) | 20.4 (4.5) | 0.005* | 0.274 | 0.980 |
| Workload (W) | 137.2 (23.2) | 140.0 (24.9) | 109.6 (28.9) | 100.2 (31.2) | <0.001† | 0.636 | 0.428 |
| Heart rate (beats/min) | 183.5 (14.2) | 185.3 (15.0) | 159.4 (16.6) | 154.1 (20.0) | <0.001† | 0.671 | 0.445 |
| Minute ventilation (L/min) | 78.4 (16.9) | 80.1 (17.8) | 64.9 (16.3) | 60.8 (12.3) | 0.001* | 0.659 | 0.455 |
| Respiratory rate (breaths/min) | 43.9 (13.9) | 44.3 (14.3) | 39.2 (8.8) | 37.3 (9.0) | 0.248 | 0.861 | 0.861 |
| Respiratory exchange ratio | 1.3 (0.1) | 1.4 (0.1) | 1.3 (0.2) | 1.3 (0.1) | 0.321 | 0.703 | 0.427 |
| Systolic blood pressure (mmHg) | 185.3 (19.9) | 182.6 (19.2) | 169.1 (23.8) | 165.5 (24.0) | 0.007* | 0.569 | 0.915 |
| Ventilatory anaerobic threshold | |||||||
| VO2 (ml/kg/min) | 13.8 (2.8) | 14.1 (3.3) | 12.7 (2.9) | 11.4 (2.9) | 0.002* | 0.939 | 0.100 |
| Workload (W) | 58.0 (16.7) | 63.5 (19.5) | 49.5 (20.4) | 44.1 (25.8) | <0.001† | 0.103 | <0.001† |
| Heart rate (beats/min) | 123.9 (16.9) | 133.0 (20.9) | 113.7 (18.9) | 109.7 (13.9) | 0.001* | 0.650 | 0.273 |
| Systolic blood pressure (mmHg) | 149.1 (16.5) | 153.6 (22.9) | 140.6 (19.1) | 134.2 (18.5) | 0.001* | 0.545 | 0.083 |
* –Statistically significant difference, p < 0.01. †–Statistically significant difference, p < 0.001.
3.2Reliability
All CPET measurements at peak exertion for sedentary subjects demonstrated very high test-retest reliability, with ICC2,1 values ranging from 0.834 to 0.990 (Table 2). In individuals with ME/CFS, CPET measurements at peak exertion demonstrated moderate to high reliability with ICC2,1 values ranging from 0.631 to 0.871, except respiratory exchange ratio. Despite the relatively low test-retest reliability for respiratory exchange ratio, this measurement exceeded the threshold necessary to indicate a peak test for both tests in all subjects. CPET measurements at VAT also showed moderate to high reliability in control subjects (range: 0.548–0.747) and individuals with ME/CFS (range: 0.426–0.845).
Table 2
24-hour test-retest reliability of metabolic measurements in controls and individuals with Myalgic Encephalomyelitis/Chronic Fatigue Syndrome (ME/CFS). Values presented as intraclass correlation coefficient formula 2,1 (95% confidence interval)
| Control Subjects | Individuals with ME/CFS | |
| (n = 10) | (n = 51) | |
| Peak | ||
| VO2 (ml/kg/min) | 0.938 (0.773, 0.984) | 0.801 (0.676, 0.882) |
| Workload (W) | 0.990 (0.961, 0.998) | 0.871 (0.784, 0.924) |
| Heart rate (beats/min | 0.986 (0.943, 0.996) | 0.631 (0.430, 0.772) |
| Minute ventilation (L/min) | 0.950 (0.812, 0.987) | 0.759 (0.613, 0.855) |
| Respiratory rate (breaths/min) | 0.971 (0.889, 0.993) | 0.848 (0.749, 0.911) |
| Respiratory exchange ratio | 0.834 (0.465, 0.956) | 0.483 (0.242, 0.668) |
| Systolic blood pressure (mmHg) | 0.845 (0.458, 0.963) | 0.843 (0.739, 0.908) |
| Ventilatory anaerobic threshold | ||
| VO2 (ml/kg/min) | 0.582 (–0.031, 0.877) | 0.426 (0.167, 0.630) |
| Workload (W) | 0.747 (0.263, 0.930) | 0.498 (0.254 0.682) |
| Heart rate (beats/min) | 0.830 (0.455, 0.955) | 0.613 (0.398, 0.764) |
| Systolic blood pressure (mmHg) | 0.548 (–0.081, 0.865) | 0.845 (0.458, 0.963) |
3.3Effect size
SMDs in Table 3 suggested moderate to large effect sizes comparing control subjects with ME/CFS on all Test #1 CPET measurements (range: 0.5–1.1) and Test #2 measurements (range: 0.4–1.6), except respiratory exchange ratio which demonstrated no detectable effect size on Test #1 and a small effect size on Test #2 (d = 0.4; Table 3). CPET measurements observed at VAT demonstrated moderate effect sizes on Test #1 and large effect sizes on Test #2.
Table 3
Standardized effect sizes (Cohen’s d) comparing change in metabolic measurements completed during two peak exercise tests completed 24 hours apart in controls and individuals with Myalgic Encephalomyelitis/Chronic Fatigue Syndrome (ME/CFS)
| Test #1, peak | |
| VO2 (ml/kg/min) | 0.8 |
| Workload (W) | 1.1 |
| Heart rate (beats/min) | 1.6 |
| Minute ventilation (L/min) | 0.8 |
| Respiratory rate (breaths/min) | 0.5 |
| Respiratory exchange ratio | 0.0 |
| Systolic blood pressure (mmHg) | 0.9 |
| Test #1, ventilatory anaerobic threshold | |
| VO2 (ml/kg/min) | 0.4 |
| Workload (W) | 0.5 |
| Heart rate (beats/min) | 0.5 |
| Systolic blood pressure (mmHg) | 0.5 |
| Test #2, peak | |
| VO2 (ml/kg/min) | 0.8 |
| Workload (W) | 1.4 |
| Heart rate (beats/min) | 1.6 |
| Minute ventilation (L/min) | 1.3 |
| Respiratory rate (breaths/min) | 0.6 |
| Respiratory exchange ratio | 0.4 |
| Systolic blood pressure (mmHg) | 0.8 |
| Test #2, ventilatory anaerobic threshold | |
| VO2 (ml/kg/min) | 0.9 |
| Workload (W) | 0.8 |
| Heart rate (beats/min) | 1.3 |
| Systolic blood pressure (mmHg) | 0.9 |
3.4Minimum detectable change
MDC95, in Table 4, for variables at peak exertion in ME/CFS was generally higher compared to sedentary subjects, except for respiratory rate. Likewise, at VAT, MDC95 was higher in ME/CFS for all variables except systolic blood pressure.
Table 4
Minimum detectable change (MDC) outside the 95% confidence interval for metabolic measurements in controls and individuals with Myalgic Encephalomyelitis/Chronic Fatigue Syndrome (ME/CFS). MDC was given as 1.96 * √2 * Standard Error of Measure, given by √(Test 1 Variance * 1 –Intraclass Correlation Coefficient of Test 1 and Test 2)
| Control Subjects | Individuals with ME/CFS | |
| (n = 10) | (n = 51) | |
| Peak | ||
| VO2 (ml/kg/min) | 3.0 | 5.1 |
| Workload (W) | 7.6 | 28.8 |
| Heart rate (beats/min) | 4.7 | 28.0 |
| Minute ventilation (L/min) | 10.5 | 5.5 |
| Respiratory rate (breaths/min) | 6.6 | 3.2 |
| Respiratory exchange ratio | 0.11 | 0.39 |
| Systolic blood pressure (mmHg) | 21.7 | 26.1 |
| Ventilatory anaerobic threshold | ||
| VO2 (ml/kg/min) | 5.0 | 9.5 |
| Workload (W) | 23.3 | 40.1 |
| Heart rate (beats/min) | 19.3 | 32.6 |
| Systolic blood pressure (mmHg) | 30.7 | 20.8 |
3.5Coefficients of variation
Table 5 includes CoV for CPET measurements. At peak exertion, CoV of control subjects ranged from 7–32% for Test #1 and 9–32% for Test #2, while CoV for ME/CFS ranged from 10–25% for Test #1 and 9–31% for Test #2. At VAT, CoV for control subjects ranged from 11–29% for Test #1 and 15–31% for Test #2, while CoV for ME/CFS were 14–41% for Test #1 and 13–59% for Test #2.
Table 5
Coefficients of variation for metabolic measurements in controls and individuals with Myalgic Encephalomyelitis/Chronic Fatigue Syndrome (ME/CFS)
| Control Subjects | Individuals with ME/CFS | |
| (n = 10) | (n = 51) | |
| Test #1, measurements at peak | ||
| VO2 (ml/kg/min) | 0.18 | 0.19 |
| Workload (W) | 0.17 | 0.26 |
| Heart rate (beats/min) | 0.08 | 0.10 |
| Minute ventilation (L/min) | 0.22 | 0.25 |
| Respiratory rate (breaths/min) | 0.32 | 0.23 |
| Respiratory exchange ratio | 0.07 | 0.13 |
| Systolic blood pressure (mmHg) | 0.10 | 0.14 |
| Test #1, measurements at ventilatory anaerobic threshold | ||
| VO2 (ml/kg/min) | 0.20 | 0.22 |
| Workload (W) | 0.29 | 0.41 |
| Heart rate (beats/min) | 0.14 | 0.17 |
| Systolic blood pressure (mmHg) | 0.11 | 0.14 |
| Test #2, measurements at peak | ||
| VO2 (ml/kg/min) | 0.18 | 0.22 |
| Workload (W) | 0.18 | 0.31 |
| Heart rate (beats/min) | 0.08 | 0.13 |
| Minute ventilation (L/min) | 0.22 | 0.20 |
| Respiratory rate (breaths/min) | 0.32 | 0.24 |
| Respiratory exchange ratio | 0.09 | 0.09 |
| Systolic blood pressure (mmHg) | 0.10 | 0.15 |
| Test #2, measurements at ventilatory anaerobic threshold | ||
| VO2 (ml/kg/min) | 0.23 | 0.26 |
| Workload (W) | 0.31 | 0.59 |
| Heart rate (beats/min) | 0.16 | 0.13 |
| Systolic blood pressure (mmHg) | 0.15 | 0.14 |
4Discussion
Objective measures for fatigue are valuable in establishing a diagnosis and prognosis, as well as determining the presence of a physiologically verifiable basis for decrements in activities of daily living and work. However, the diagnostic and prognostic value of objective measures is dictated by their clinimetric properties. Formalized guidelines for CPET in people with ME/CFS are available [15]. Previous studies have documented increases in symptoms and disablement associated with 24-hour test-retest CPET paradigm described in this study [28], as well as significant decreases in various CPET measurements on the second day of a 2-day CPET task [16–18, 29]. Indeed, objective workload measurements obtained during CPET have been proposed as a potential biomarker for the disease, particularly reduced workloads at VAT during the second day of a 2-day CPET task [18, 29]. However, the statistical behavior of objective physiological measures previously had been unknown in this population. This study was conducted to fill a current gap in the literature in establishing the reproducibility and responsiveness of measurements obtained during CPET in people with ME/CFS, in order to help identify thresholds for “positive” tests to use CPET as a biomarker, and also to power future research studies using CPET methodology.
Individuals with ME/CFS and control subjects demonstrated significant differences in CPET measurements at peak exertion during both phases of the 24-hour test-retest CPET paradigm. In this study, all subjects met criteria for peak effort, which allowed for the comparison of physiologically valid CPET data and mitigated the risk for variance due to symptom limited CPET data in a clinical population characterized by disabling fatigue. Compared to control subjects, individuals with ME/CFS demonstrated significantly lower VO2, workload, heart rate, and minute ventilation during Test #1 and Test #2. Effect sizes of between-groups differences were large. These CPET measurements showed further declines during Test #2 in ME/CFS and the significance of between-groups measurements was maintained. The significant group * test interaction for workload at VAT is consistent with prior data [29]. Although group * test effects were not significant for many measurements at peak exertion, between-day reductions were noted for VO2 (4.7%), heart rate (3.3%), minute ventilation (6.3%), and respiratory rate (4.8%) that may be clinically relevant. To place these findings in a functional context, VO2 measurement at peak exertion for control subjects would be considered normal according to Weber’s classification [30], whereas VO2 for both tests 1 and 2 for ME/CFS would be considered impaired. Similar non-significant but potentially important between-day trends were noted for VO2 (10.2%), heart rate (3.5%), and systolic blood pressure (4.6%) at VAT. These observations at VAT are notable, because they correspond with the level at which functioning is possible before anaerobic metabolism predominates. Premature onset of VAT in ME/CFS is thought to be due to impaired oxidative metabolism, which reduces the threshold at which oxidative metabolism can contribute effectively to energy production [31].
CPET measurements in this study largely demonstrated at least moderate 24-hour test-retest reliability in individuals with ME/CFS. In contrast, CPET measurements for control subjects exhibited very strong test-retest reliability. In this study, the achievement of peak test criteria by all participants mitigates variance related to a symptom-limited CPET data. While the 95% LOA was slightly broader in individuals with ME/CFS compared to sedentary individuals across CPET measurements, outliers were infrequent. Indeed, symptoms of ME/CFS could still serve as a source of measurement variance if the physiological measurements are associated with the features of the condition’s underlying etiology. Observed outliers may be associated with severity of symptoms as an etiological issue. All participants achieved establish criteria for peak test, so future etiological studies involving the observed outliers may have particular research and clinical relevance in order to subgroup patients for more optimal treatment [38, 39].
One long-standing tenet of CPET measurements is they have high intertest reliability [4, 5, 7, 8, 10, 27, 32–37], which is supported by findings from sedentary individuals in this study. These data suggest that CPET measurements ordinarily have a low error variance. ME/CFS is a unique diagnosis compared to other fatiguing health conditions, because it involves a presentation of waxing and waning functional disablement rather than a constant or predictable pattern [38, 39]. PEM is also known to be initiated by bouts of physical and cognitive activity [11, 12]. The waxing and waning functional impairment of ME/CFS suggests the presence of biological variance as a fundamental part of the patho-etiology of ME/CFS. Although challenging for CPET reliability studies in ME/CFS, the observation of measurement deviation between days actually may be clinically important when using a methodology like CPET that is known to ordinarily demonstrate a low error variance. This raises the importance of absolute reliability measures, such as CoV, which are less sensitive to heterogeneity in test performance than relative reliability measures, such as ICC. In this study, CoV were generally comparable between groups on Test #1 and Test #2, without a clear pattern that within-groups heterogeneity in performance affected one group more than the other.
Since no consensus currently exists for establishing the measurement responsiveness, several estimates were calculated in this study’s analysis to assist future researchers. Comparing control subjects and individuals with ME/CFS, most CPET measurements at peak exertion demonstrated moderate to large effect sizes and most CPET measurements at anaerobic threshold demonstrated moderate effect sizes. Effect size calculations in this study should be used to perform sample size calculations in future randomized clinical trials that involve non-disabled sedentary individuals as control subjects. Qualitative analysis of values for minimum detectable change suggest that a greater change in CPET measurements is necessary to be observed in individuals with ME/CFS than controls in order to be confident the change exceeds measurement variance.
Perhaps an ideal study design for reliability analyses would involve application of a test in a large number of subjects that are not expected to change in clinical presentation. However, people with ME/CFS are known to vary symptomatically, functionally, and physiologically between days on a two-day CPET paradigm [13, 14, 16, 17, 28, 39, 40]. Future studies regarding the reliability of CPET measurements in individuals with ME/CFS might give consideration to allowing for complete recovery to baseline symptomatic status, or could involve individuals with another fatiguing health condition that has stable reproducibility with respect to CPET measures. In addition, larger prospective datasets from future multicenter studies involving standardized CPET methodology [15] and a priori sample size calculations [41] may be compared against the findings of this study. Despite these remaining unanswered questions, CPET measurements of cardiac, pulmonary, and metabolic characteristics appear to have sufficient test-retest reliability to be considered as a clinical evaluation and as an endpoint in future clinical trials.
Conflict of interest
The authors affirm they have no conflicts of interest related to the content presented in this manuscript.
References
[1] | American Thoracic Society, American College of Chest P. ATS/ACCP Statement on cardiopulmonary exercise testing. Am J Respir Crit Care Med. (2003) ;167: (2):211–77. |
[2] | Ciccolella ME , Davenport TE , Boone T . Legal aspects of aerobic capacity: objective evidence of the ability to work. Professionalization of Exercise Physiology. (2011) ;14: (9):1–11. |
[3] | Ciccolella ME , Davenport TE . Scientific and legal challenges to the functional capacity evaluation in chronic fatigue syndrome. Fatigue: Biomedicine to Behavior. (2013) ;1: (4):243–55. |
[4] | McKone EF , Barry SC , FitzGerald MX , Gallagher CG . Reproducibility of maximal exercise ergometer testing in patients with cystic fibrosis. Chest. (1999) ;116: (2):363–8. |
[5] | Koufaki P , Naish PF , Mercer TH . Reproducibility of exercise tolerance in patients with end-stage renal disease. Arch Phys Med Rehabil. (2001) ;82: (10):1421–4. |
[6] | Eaton T , Young P , Milne D , Wells AU . Six-minute walk, maximal exercise tests: reproducibility in fibrotic interstitial pneumonia. Am J Respir Crit Care Med. (2005) ;171: (10):1150–7. |
[7] | Hansen JE , Sun XG , Yasunobu Y , Garafano RP , Gates G , Barst RJ , et al. Reproducibility of cardiopulmonary exercise measurements in patients with pulmonary arterial hypertension. Chest. (2004) ;126: (3):816–24. |
[8] | Marciniuk DD , Watts RE , Gallagher CG . Reproducibility of incremental maximal cycle ergometer testing in patients with restrictive lung disease. Thorax. (1993) ;48: (9):894–8. |
[9] | Meyer K , Westbrook S , Schwaibold M , Hajric R , Peters K , Roskamm H . Short-term reproducibility of cardiopulmonary measurements during exercise testing in patients with severe chronic heart failure. Am Heart J. (1997) ;134: (1):20–6. |
[10] | Lehmann G , Kolling K . Reproducibility of cardiopulmonary exercise parameters in patients with valvular heart disease. Chest. (1996) ;110: (3):685–92. |
[11] | Fukuda K , Straus SE , Hickie I , Sharpe MC , Dobbins JG , Komaroff A . The chronic fatigue syndrome: a comprehensive approach to its definition and study. International Chronic Fatigue Syndrome Study Group. Ann Intern Med. (1994) ;121: (12):953–9. |
[12] | Carruthers BM , van de Sande MI , De Meirleir KL , Klimas NG , Broderick G , Mitchell T , et al. Myalgic encephalomyelitis: International Consensus Criteria. J Intern Med. (2011) ;270: (4):327–38. |
[13] | Van Ness JM , Snell CR , Strayer DR , Dempsey Lt , Stevens SR . Subclassifying chronic fatigue syndrome through exercise testing. Med Sci Sports Exerc. (2003) ;35: (6):908–13. |
[14] | Van Ness JM , Stevens SR , Bateman L , Stiles TL , Snell CR . Postexertional malaise in women with chronic fatigue syndrome. J Womens Health (Larchmt). (2010) ;19: (2):239–44. |
[15] | Stevens S , Snell C , Stevens J , Keller B , VanNess JM . Cardiopulmonary Exercise Test Methodology for Assessing Exertion Intolerance in Myalgic Encephalomyelitis/Chronic Fatigue Syndrome. Front Pediatr. (2018) ;6: :242. |
[16] | Hodges LD , Nielsen T , Baken D . Physiological measures in participants with chronic fatigue syndrome, multiple sclerosis and healthy controls following repeated exercise: a pilot study. Clin Physiol Funct Imaging. (2018) ;38: (4):639–44. |
[17] | Keller BA , Pryor JL , Giloteaux L . Inability of myalgic encephalomyelitis/chronic fatigue syndrome patients to reproduce VO(2)peak indicates functional impairment. J Transl Med. (2014) ;12: :104. |
[18] | Snell CR , Stevens SR , Davenport TE , Van Ness JM . Discriminative validity of metabolic and workload measurements for identifying people with chronic fatigue syndrome. Phys Ther. (2013) ;93: (11):1484–92. |
[19] | Wasserman K , Stringer WW , Casaburi R , Koike A , Cooper CB . Determination of the anaerobic threshold by gas exchange: biochemical considerations, methodology and physiological effects. Z Kardiol. (1994) ;83: Suppl 3:1–12. |
[20] | Rankin G , Stokes M . Reliability of assessment tools in rehabilitation: an illustration of appropriate statistical analyses. Clin Rehabil. (1998) ;12: (3):187–99. |
[21] | Shrout PE , Fleiss JL . Intraclass correlations: uses in assessing rater reliability. Psychol Bull. (1979) ;86: (2):420–8. |
[22] | Wyrwich KW , Tierney WM , Wolinsky FD . Further evidence supporting an SEM-based criterion for identifying meaningful intra-individual changes in health-related quality of life. J Clin Epidemiol. (1999) ;52: (9):861–73. |
[23] | Munro BH . Statistical Methods for Health Care Research (4th ed.). Philadelphia, PA: Lippincott; (2001) . |
[24] | Cohen J . Statistical Power Analyses for the Behavioral Sciences. New York City, NY: Academic Press; (1998) . |
[25] | Beckerman H , Roebroeck ME , Lankhorst GJ , Becher JG , Bezemer PD , Verbeek AL . Smallest real difference, a link between reproducibility and responsiveness. Qual Life Res. (2001) ;10: (7):571–8. |
[26] | Janicki JS , Gupta S , Ferris ST , McElroy PA . Long-term reproducibility of respiratory gas exchange measurements during exercise in patients with stable cardiac failure. Chest. (1990) ;97: (1):12–7. |
[27] | Balady GJ , Arena R , Sietsema K , Myers J , Coke L , Fletcher GF , et al. Clinician’s Guide to cardiopulmonary exercise testing in adults: a scientific statement from the American Heart Association. Circulation. (2010) ;122: (2):191–225. |
[28] | Davenport TE , Stevens SR , Baroni K , Van Ness M , Snell CR . Diagnostic accuracy of symptoms characterising chronic fatigue syndrome. Disabil Rehabil. (2011) ;33: (19-20):1768–75. |
[29] | Nelson MJ , Buckley JD , Thomson RL , Clark D , Kwiatek R , Davison K . Diagnostic sensitivity of 2-day cardiopulmonary exercise testing in Myalgic Encephalomyelitis/Chronic Fatigue Syndrome. J Transl Med. (2019) ;17: (1):80. |
[30] | Weber KT , Janicki JS . Cardiopulmonary Exercise Testing. Philadelphia, PA: W.B. Saunders; (1988) . |
[31] | Vermeulen RC , Vermeulen van Eck IW . Decreased oxygen extraction during cardiopulmonary exercise test in patients with chronic fatigue syndrome. J Transl Med. (2014) ;12: :20. |
[32] | Brown SE , Fischer CE , Stansbury DW , Light RW . Reproducibility of VO2max in patients with chronic air-flow obstruction. Am Rev Respir Dis.. (1985) ;131: (3):435–8. |
[33] | Covey MK , Larson JL , Alex CG , Wirtz S , Langbein WE . Test-retest reliability of symptom-limited cycle ergometer tests in patients with chronic obstructive pulmonary disease. Nurs Res. (1999) ;48: (1):9–19. |
[34] | Cox NJ , Hendriks JC , Binkhorst RA , Folgering HT , van Herwaarden CL . Reproducibility of incremental maximal cycle ergometer tests in patients with mild to moderate obstructive lung diseases. Lung. (1989) ;167: (2):129–33. |
[35] | Dideriksen K , Mikkelsen UR . Reproducibility of incremental maximal cycle ergometer tests in healthy recreationally active subjects. Clin Physiol Funct Imaging. (2017) ;37: (2):173–82. |
[36] | Puente-Maestu L , Sanz ML , Sanz P , Nunez A , Gonzalez F , Whipp BJ . Reproducibility of the parameters of the on-transient cardiopulmonary responses during moderate exercise in patients with chronic obstructive pulmonary disease. Eur J Appl Physiol. (2001) ;85: (5):434–41. |
[37] | Skinner JS , Wilmore KM , Jaskolska A , Jaskolski A , Daw EW , Rice T , et al. Reproducibility of maximal exercise test data in the HERITAGE family study. Med Sci Sports Exerc. (1999) ;31: (11):1623–8. |
[38] | Carruthers BM , Jain AK , De Meirleir KL , Peterson DL , Klimas NG , Lerner AM , et al. Myalgic encephalomyelitis/chronic fatigue syndrome: clinical working case definition, diagnostic and treatment protocols. Journal of Chronic Fatigue Syndrome. (2003) ;11: (1):7–115. |
[39] | Larson B , Davenport TE , Stevens SR , Stevens J , Van Ness JM , Snell CR . Reproducibility of measurements obtained during cardiopulmonary exercise testing in individuals with fatiguing health conditions: a case series. Cardiopulmonary Physical Therapy Journal. (2019) ;30: (4):145–52. |
[40] | Davenport TE , Lehnen M , Stevens SR , VanNess JM , Stevens J , Snell CR . Chronotropic Intolerance: An Overlooked Determinant of Symptoms and Activity Limitation in Myalgic Encephalomyelitis/Chronic Fatigue Syndrome? Front Pediatr. (2019) ;7: :82. |
[41] | Zou GY . Sample size formulas for estimating intraclass correlation coefficients with precision and assurance. Stat Med. (2012) ;31: (29):3972–81. |


