
Visual fatigue during control room work in process industries
Abstract
BACKGROUND:
Working in front of computer screens is visually demanding and related to adverse eye symptoms. Occurrence of glare further increases visual fatigue.
OBJECTIVE:
This paper presents results from an examination of visual ergonomics in control room environments at two Swedish process industries.
METHODS:
Visual conditions were examined and evaluated in nine control rooms and eighteen process operators answered questions about their perceived workload and visual experiences.
RESULTS:
When working in the control rooms, the mental workload was rated significantly higher by the participants, compared to experienced performance. The operators further experienced significantly higher visual fatigue and blurred vision compared to double vision and sore eyes. Visual demands were increased in conditions where contrast glare was present, as well as frequent changes of focusing distances, and low contrast between background and characters in computer screens.
CONCLUSIONS:
Suboptimal visual working conditions in the control rooms contributes to increased visual demands on the operators. Presence of glare is leading to visual fatigue and an unnecessary high mental load. The findings support the relevance of considering principles of general and visual ergonomics when designing and organizing work in control rooms. Workstation design should also be flexible to allow for individual and contextual adjustments.
1Introduction
The continuous development and use of information and communication technology has led to that more employees now are working in different types of control room environments, supervising and controlling a large number of varying processes. Control room environments can be found within the industrial process and manufacturing industry, transport sector (e.g., traffic surveillance, and operation of trains, airlines and ships), as well as in the media industry, such as television production and image processing.
The visual comfort of control room operators is dependent on a variety of design and environmental factors. During work with computer screens, this includes the design of, e.g., font size, character and line spacing, contrast and colour. The lighting in the room and at the work station, the height and placement of screens, which affect the gaze angle and viewing distance, are also important [1, 2]. When working with computers, the eyes need to converge (come together). A clear image of the screen should be projected on the retina of the eyes, either through accommodation (change in focus) or by using corrective lenses or glasses. When the eyes must adjust for a clear retinal image, the intensity of muscle activity in trapezius increases [3–5]. In a recent experimental study, an induced transient increase was found in trapezius muscle blood flow when the study participants’ were exposed to moderate glare [6]. Even lower degrees of blur may cause impaired performance and visual discomfort, and people working in poor visual conditions are more likely to suffer from musculoskeletal disorders [7].
Ensuring good visual conditions are especially important for older operators, since our vision declines with age. Reduced light level, low contrast, or glare will significantly decrease the visual functions in older individuals [8, 9].
Supervisory work tasks in control room environments require the operators to perform continuous visual assessments in combination with active interventions, often monitoring more than one digital display simultaneously. Commonly, this requires frequent changes of focusing distances. When the light conditions differ between these visual distances, the eyes need to adapt to the luminance differences. During this adaption, the operator may experience visual impairment [10].
Frequent use of digital displays further contributes to a deterioration of the so-called binocular control (collaboration between the two eyes), since most of the work occurs in a static two-dimensional (2D) visual environment –working with a flat screen [11]. If this is combined with other visually impaired factors, binocular control is further reduced resulting in an increased load on the visual system.
When performing tasks that require high visual demands for longer periods of time, there is an increased risk for vision and eye symptoms referred to collectively as computer vision syndrome (CVS). Previous research have proposed a relationship between design and environmental factors, such as workplace lighting, glare, flickering light, upward gaze, reflections on surfaces, readability, and eye-related disorders [12, 13].
Visual demanding tasks that requires sustained attention, involves memory tasks and that the operator needs to concentrate, results in a lower blink frequency. This may affect the tear film and lead to eye-related disorders such as dryness, sore eyes and redness [14], especially in the upward gaze direction while the blink frequency is further reduced. The presence of dry eyes is significantly elevated with increasing age [15].
A reduced visibility, e.g. from inappropriate lighting design with indirect or direct glare, will reduce the visibility of the task and/or the image on the retina. This glare will add further stress on an operators’ visual system (cf. 16, 17, 18]. Glare is caused when the eyes are exposed to a stronger light than they are set for. The light may come from artificial lighting, sunshine or daylight through windows, and reflections from high-gloss surfaces. Glare can be divided into two main types, discomfort glare (psychological) and disability glare (physiological). Both types may arise from direct light or indirectly reflected light. Discomfort glare is more common in the light sensitivity caused by light differences in the field of view. The glare can have direct effects and obstruct visual ability, and may also cause an increased mental strain [19].
On the other hand, good visual conditions have been shown to mitigate discomfort and optimize productivity [20]. For instance, improved lighting conditions can enhance cognitive performance, such as working memory and sustained attention [21], and reduce sleepiness among control room operators [22].
Recently, several previous ergonomics studies have addressed the design of control room environments and how work can be evaluated. For example, methods for design and evaluation of control room design [23, 24], collaborative communication [25], and effects of shift work on cognitive performance in control room operators [22], to mention a few. However, visual ergonomic conditions in control room environments has received less attention.
The study presented in this paper is part of an ongoing research project investigating visual ergonomics in control room environments. In all, the project will encompass about 25 different workplaces, representing various visual and working conditions. The project is set out to systematically examine and evaluate visual ergonomic challenges in control rooms in relation to the design of the working environment and the tasks performed by the control room operators. The evaluation is further compared to legal requirements and guidelines available. The overall project aim is to formulate practical recommendations for physical design, and organization of work in control room environments. Specifically, this paper aims to report and discuss visual requirements associated with working in control rooms in process industries.
2Material and methods
Nine control room environments for various industrial processes and operations were examined and evaluated during this study.
The visual ergonomic aspects were evaluated by measuring the following parameters: illuminance (lx) and luminance (cd/m2), contrast glare and reflection glare. Further, the physical layout of the control room was described and measured in terms of visual distances and viewing angles, as well as screen / monitor visibility. Eye tracking glasses were used to analyse eye fixation changes. A subjective assessment was performed using questionnaires where the process operators responded to questions about their perceived experience of the working environment. The study adhered to the tenets of the Helsinki declaration, and written, informed consent was obtained from all respondents.
2.1Participants
Eighteen process operators (four women and fourteen men) participated in the survey, representing an age range of 28–64 years (mean 46.4±13.2). Further, twelve of the participants were over 40 years old. On average, the participants had been working with current tasks in 18.6±12.8 years. Two operators participated in each control room, except for two control rooms where one and three operators participated. All process operators were permanently employed and all, but two participants worked full-time and in 5-shift (mornings 06–14, afternoons 14–22, nights 22–06 during weekdays, followed by 06–18 and 18–06 during weekends). One operator worked part-time, and another worked only during daytime.
Initially, a brief dialogue was held with the participating process operators to introduce the research project, procedures and measuring equipment, as well as to get an understanding of the work. Questions were asked about the operators’ typical working day and the tasks that they perform.
In the control room, the operators underwent a visual acuity (VA) test using a logMAR 4 m ETDRS visual chart. Participants were wearing their own optical correction for far distance during the test. When this was the case, the participants wear an adequate correction based on individual visual status, visual distances and visual tasks during work in the control room (i.e., single vision lenses or specially designed “VDU-progressive lenses” for presbyopia or contact lenses). Twelve of the eighteen operators perceived a VA of 0.00 logMAR (Snellen decimal 1.00) or more, four operators perceived a VA of 0.10 logMAR (Snellen decimal 0.8), and one operator perceived a VA of 0.3 logMAR (Snellen decimal 0.5). Elliot et al. [26] and Lovie-Kitchin [27] found that normal distance visual acuity (DVA) was approximately logMAR -0.1 (Snellen decimal 1.25) between 25 and 30 years of age. These studies further concluded a presence of a “gradual, but small decline in DVA throughout adulthood”, indicating a logMAR 0.1 (Snellen decimal 0.8) at an age over 75 years of age.
2.2Subjective assessments
The CISS questionnaire, originally developed for evaluating various treatments for convergence insufficiency in children [28], but later validated and proven useful also for adult respondents [29–31] was used to evaluate vision experience. The questions were answered on a five-digit descriptive scale 0–4, corresponding to: (0) Never; (1) Rarely; (2) Sometimes; (3) Often; (4) Always (Table 1). Further, the Raw TLX (RTLX, a modified NASA-TLX) questionnaire [32] was used to evaluate participants’ experiences of their workload The questions were answered in a 10-degree Visual Analogue Scale (VAS). The questions encompassed mental and physical workload, and further included questions about perceived time pressure (temporal demands), performance, effort and frustration. The built-in premise is that combinations of these six dimensions represent the “workload” experienced by the participants during their work as process operators in a control room environment. This modified version of NASA TLX, the Raw TLX questionnaire, has eliminated the weighting process which is used to analyse the subscales individually (i.e., the six dimensions representing the workload). RTLX includes an assessment of the overall workload (OW) represented by a combination, similar to the NASA TLX questionnaire [32].
Table 1
Questionnaire about vision experience, based on the CISS questionnaire
| Eye symptoms | Other eye-related symptoms |
| Tired eyes | Headaches |
| Uncomfortable eyes | Feel sleepy |
| Hurting eyes | Lose concentration |
| Double vision | Difficult remembering tasks read |
| Visual objects are blurred | Read slowly |
| Sore eyes | Lose place regarding the visual tasks |
| Re-read the same information | |
| Feeling pulling around the eyes | |
| See the visual objects move, jump etc. |
2.3Light measurements
A portable Hagner photometer S2 and an LMK Mobile advanced digital luminance camera with analysis software (LMK Glare Analysis, AddOn) were used to map and measure illuminance and luminance in the workplace. With the analysis software, it was possible to get quantitative renderings of luminance on critical surfaces like desks and monitors in the control rooms. The purpose of the measurements was to identify any major differences in luminance within the field of view and between the different visual environments where changes in focus occur.
2.4Eye tracking
An Eye Tracker (Tobii Glasses 2) with the manufacturer’s analysis software (Tobii Pro Lab) was used to evaluate frequent changes in focusing distances due to monitoring different digital displays with different visual distances. The eye tracker was used to record eye movements when the operator was performing his or her normal work tasks. Each recording lasted for about 10–15 minutes (mean 13±3) per participant with a sampling frequency of 50 Hz (Fig. 1).
Fig. 1
Example of a control room operator wearing eye tracker glasses while monitoring operations.
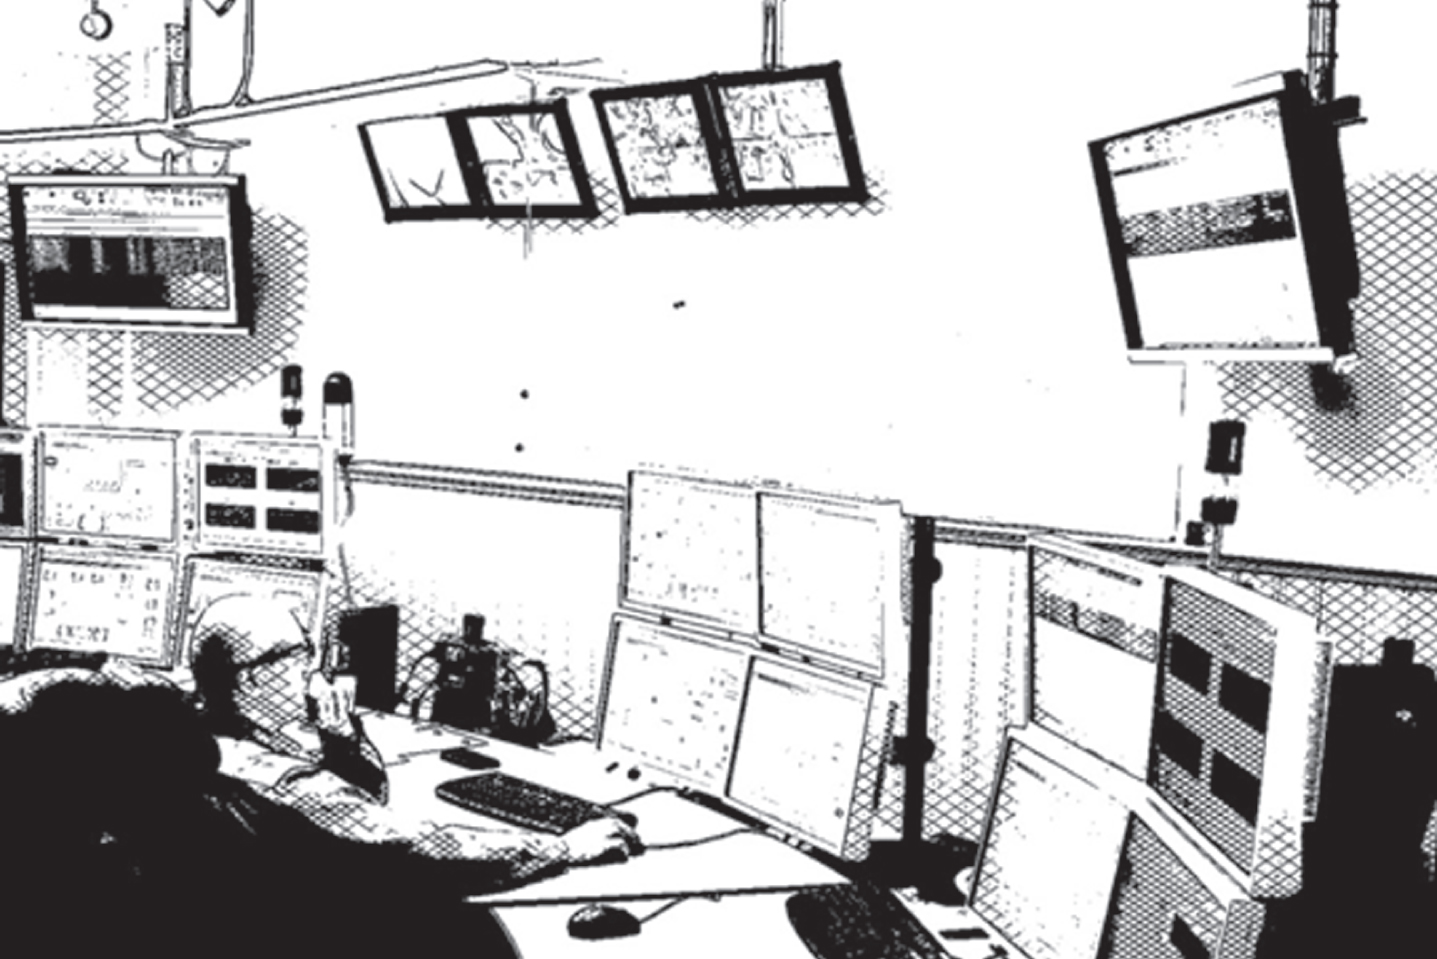
Prior to each recording session, the eye tracker was adjusted to ensure a good fit onto each test participant’s head. If the participant was wearing optical prescription glasses, the eye tracker was fitted outside the spectacles. Thereafter, the participant was asked to look at a calibration card for a few seconds to ensure good recording quality. The eye tracker is using a tracking technique of corneal reflection, binocular and dark pupil tracking.
2.5Other work environment measurements
The physical layout of each visited control room and its workstations was photographed and measured by hand. A sketch was made, illustrating the location of panels, table and wall-mounted displays, furniture, as well as type and placement of light sources. Based on the location where the operators state that they perform most of the work, the operators’ focus distances, downward gaze angles to screens placed on the office table, and upward gaze angles to screens further away were checked with a steel tape measure. The reflective properties (gloss unit) on surfaces were measured using a gloss meter (Minigloss 101 N, manufactured by AB Kontrollmetod) with an angle of incidence of 60° and measuring range 0–100. The visibility and readability of the displays was mapped by checking character sizes, colours and luminance contrast between the digital characters and the computer screen background.
2.6Analysis of data
Repeated-measures ANOVA with Tukey or Dunn were used (InStat; Graph-Pad Software Inc., San Diego, CA, USA) to analyse and compare perceived workload, vision experience and other eye-related symptoms. Correlation was obtained using a linear Pearson correlation test. The alpha level was set to 0.05 in all the analyses. The results further describe and summarize collected data in terms of differences between control room designs and the participants’ visual status.
3Results
3.1Process operators’ estimation of vision experience and workload
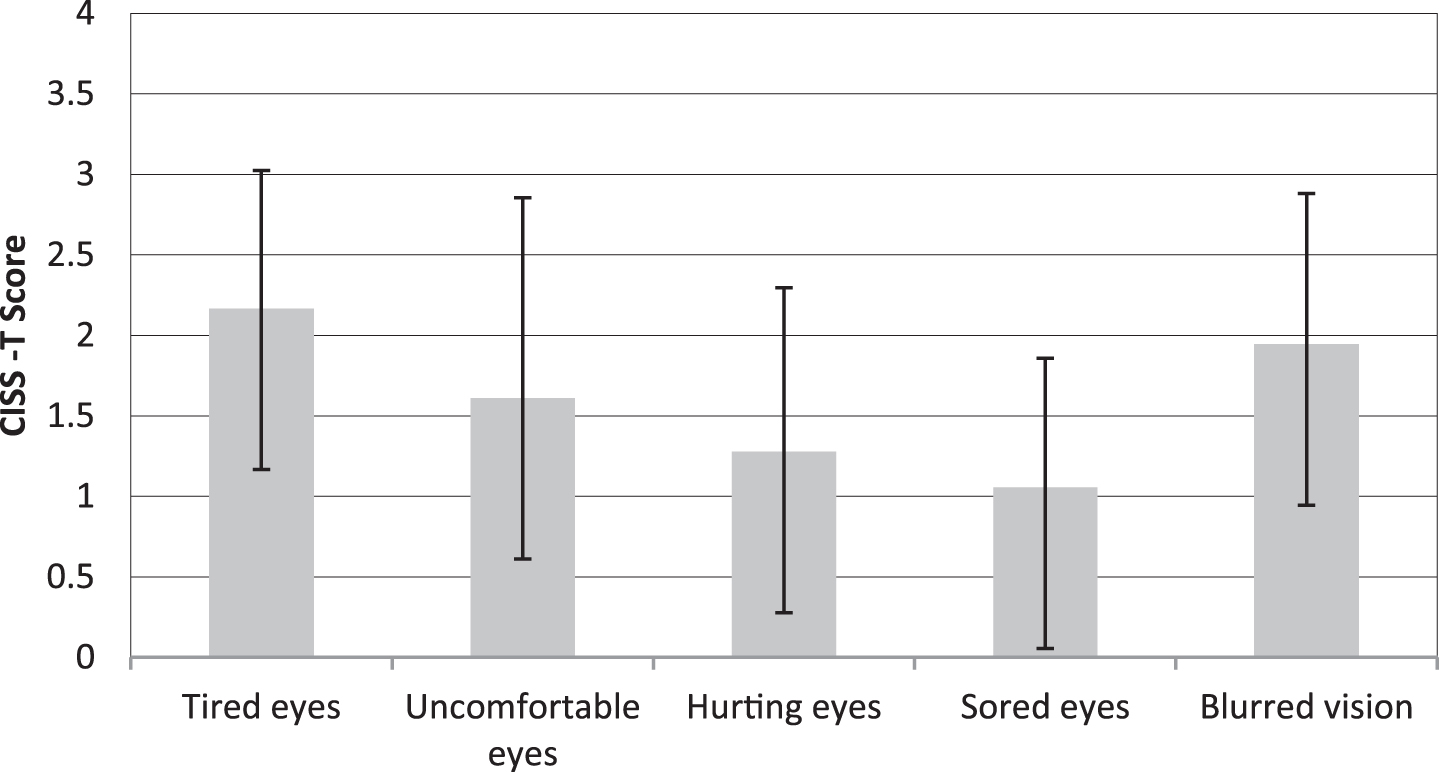
Figure 2 reports the distribution of eye symptoms during control room work, as experienced by the 18 participating process operators. A respondent that never has experienced any of these eye symptoms would answer 0, while a respondent that always experience a certain symptom would answer 4. It is reasonable to assume that everybody occasionally may experience some of these symptoms during work. Here, we are especially concerned over the operators that state that they often (score of 3) suffer from tired, uncomfortable or hurting eyes, or blurred vision. No-one, however, responded that this is something that they suffer always, during work. An analysis of variance showed significant differences between different eye symptoms (p < 0.0001). Pairwise comparisons showed that the operators scored tired eyes and blurred vision as significant higher compared to double vision (p < 0.001; p < 0.001) and sore eyes (p < 0.001; p < 0.05). Moreover, a significant difference was found regarding a higher rating in tired eyes compared to hurting eyes (p < 0.01). The overall rating of perceived eye symptoms (mean 9.05,±5.34) was found to not correlate to age.
Fig. 2
Distribution of the most scored experiences of eye symptoms (mean value and standard deviation) in control room when performing tasks.
When analysing the variation of the other eye-related symptoms included in the CISS questionnaire, a significant difference was found between the symptoms (p < 0.0001). Pairwise comparisons showed that the operators scored sleepiness as significant higher compared to headache (p < 0.01) and read slowly (p < 0.01). Furthermore, all participants indicated that they sometimes (score of 2) felt sleepy when performing control room tasks, and five operators stated that they experienced this often (score of 3). Mean and standard deviation for the aspects of vision experience that was scored highest by the participants are illustrated in Table 2.
Table 2
Mean and standard deviation (SD) for the most scored aspects of vision experience, as perceived by the process operators when working in the control room
| Re-read the text | Feel sleepy | Lose concentration | Read slowly | Lose place regarding the visual tasks | Difficult remembering tasks read | |
| Mean | 1.17 | 2.11 | 1.56 | 1.22 | 1.28 | 1.72 |
| SD | ±0.70 | ±0.68 | ±0.62 | ±1.06 | ±0.83 | ±0.96 |
Note: Answered in a five-digit scale 0–4.
An analysis of variance showed a significant difference between the perceived and rated workload (p = 0.0089). During the analyses, one extreme outlier that disproportionally skew the analysis was excluded from the data set. The mental workload (e.g. to choose, calculate, remember, search, decide) was perceived as the most prominent by the respondents Pairwise comparisons showed that the mental workload was rated significantly higher compared to experienced performance (p < 0.01). Table 3 shows mean and standard deviation of the aspects of workload. The overall workload was found to not correlate to age.
Table 3
Mean and standard deviation (SD) for the aspects of workload including overall workload (OW), as perceived by the process operators when working in control room
| Mental workload | Physical workload | Time pressure | Performance | Effort | Frustration | OW | |
| Mean | 5.39 | 4.56 | 4.33 | 3.611 | 4.72 | 4.33 | 4.49 |
| SD | ±2.14 | ±2.28 | ±1.78 | ±3.05 | ±1.60 | ±1.91 | ±0.58 |
Note: Answered in a 10-degree Visual Analog Scale (VAS) where 0 is low and 10 is high. 1One outlier, M 3.23 SD±2.68 with extreme outlier excluded.
Further analysis did not show a higher rate in eye symptoms, vision experience and workload in operators who perceived a lower VA than 0.00 logMAR (Snellen decimal 1.00).
The results of the lighting measurements in the control rooms are presented as measured values within the field of view, based on existing light levels at the time of visit. The control rooms were visited during daytime, but only control room 2 had windows to the outside. In all other control rooms, the lighting was artificial. Reflectivity (gloss unit) of the surface was measured in areas within the field of view that were more reflective.
Illumination levels were generally low (mean 167 lx±181; ranging between 5 and 800 lx). The interviews showed that this was a deliberate choice of the operators themselves, who preferred subdued light levels. Control room 2, with windows to the outside, had a more adapted illuminance level due to the prevailing daylight. The Correlated Color Temperature, CCT, measured in Kelvin (K) regarding used fluorescent lamps were soft white (2700 K) or warm white (3000 K).
A compilation of the measured values for illumination (lx) and luminance (cd/m2) including screen luminance representing the nine control rooms is shown in Table 4. Mean and measures of spread (minimum, maximum, and standard deviation) are used to describe and summarize the results.
Table 4
A compilation of the measured values (mean, minimum, maximum, and standard deviation) for luminance (cd/m2) and illumination (lx) for each control room, including screen luminance
| Luminance (cd/m2) | Illuminance (lx) | ||||||||
| Mean | SD | Min | Max | Screen luminance | Mean | SD | Min | Max | |
| Room 1 | 57 | 50 | 4 | 130 | 14–31; 290–105 | 155 | 74 | 100 | 250 |
| Room 2 | 141 | 147 | 30 | 460 | 130–60 | 433 | 172 | 250 | 700 |
| Room 3 | 78 | 78 | 5 | 230 | 130–105; 2130–230 | 272 | 121 | 30 | 460 |
| Room 4 | 46 | 51 | 2 | 120 | 120–120; 22–120 | 139 | 181 | 45 | 540 |
| Room 5 | 182 | 314 | 2 | 970 | 115–90; 25–110 | 34 | 09 | 25 | 50 |
| Room 6 | 81 | 96 | 1 | 250 | 14–110; 21–60 | 113 | 62 | 20 | 170 |
| Room 7 | 42 | 47 | 3 | 120 | 13–60; 25–35 | 242 | 330 | 20 | 800 |
| Room 8 | 113 | 160 | 4 | 530 | 14–115; 25–95 | 167 | 90 | 60 | 350 |
| Room 9 | 68 | 79 | 3 | 260 | 13–120; 25–75 | 11 | 06 | 05 | 20 |
Note: 1Screens on the office table, 2Screens further away.
To further describe the visual environment, luminance on the computer screens and the area behind the computer screens were measured. In eight of the nine control rooms, screens placed within the field of view had a higher luminance (80–230 cd/m2) compared to the light condition in general (Table 4, column cd/m2).
Measured and calculated contrast on screens were suboptimal on several screens in control room 1 and 2. For example, in control room1, the contrast between the background and the characters (details on screen) in three used screens ranged between 31–77 per cent, calculated by using contrast formula of Michelson contrast [33]. Measured luminance values regarding characters ranged from 4–10 cd/m2 and the background of the screens had a luminance between 19–31 cd/m2. Hence, the lowest measured contrast ratio was 1.9 : 1 and the highest measured contrast ratio was 7.7 : 1 (mean contrast ratio 3.6 : 1).
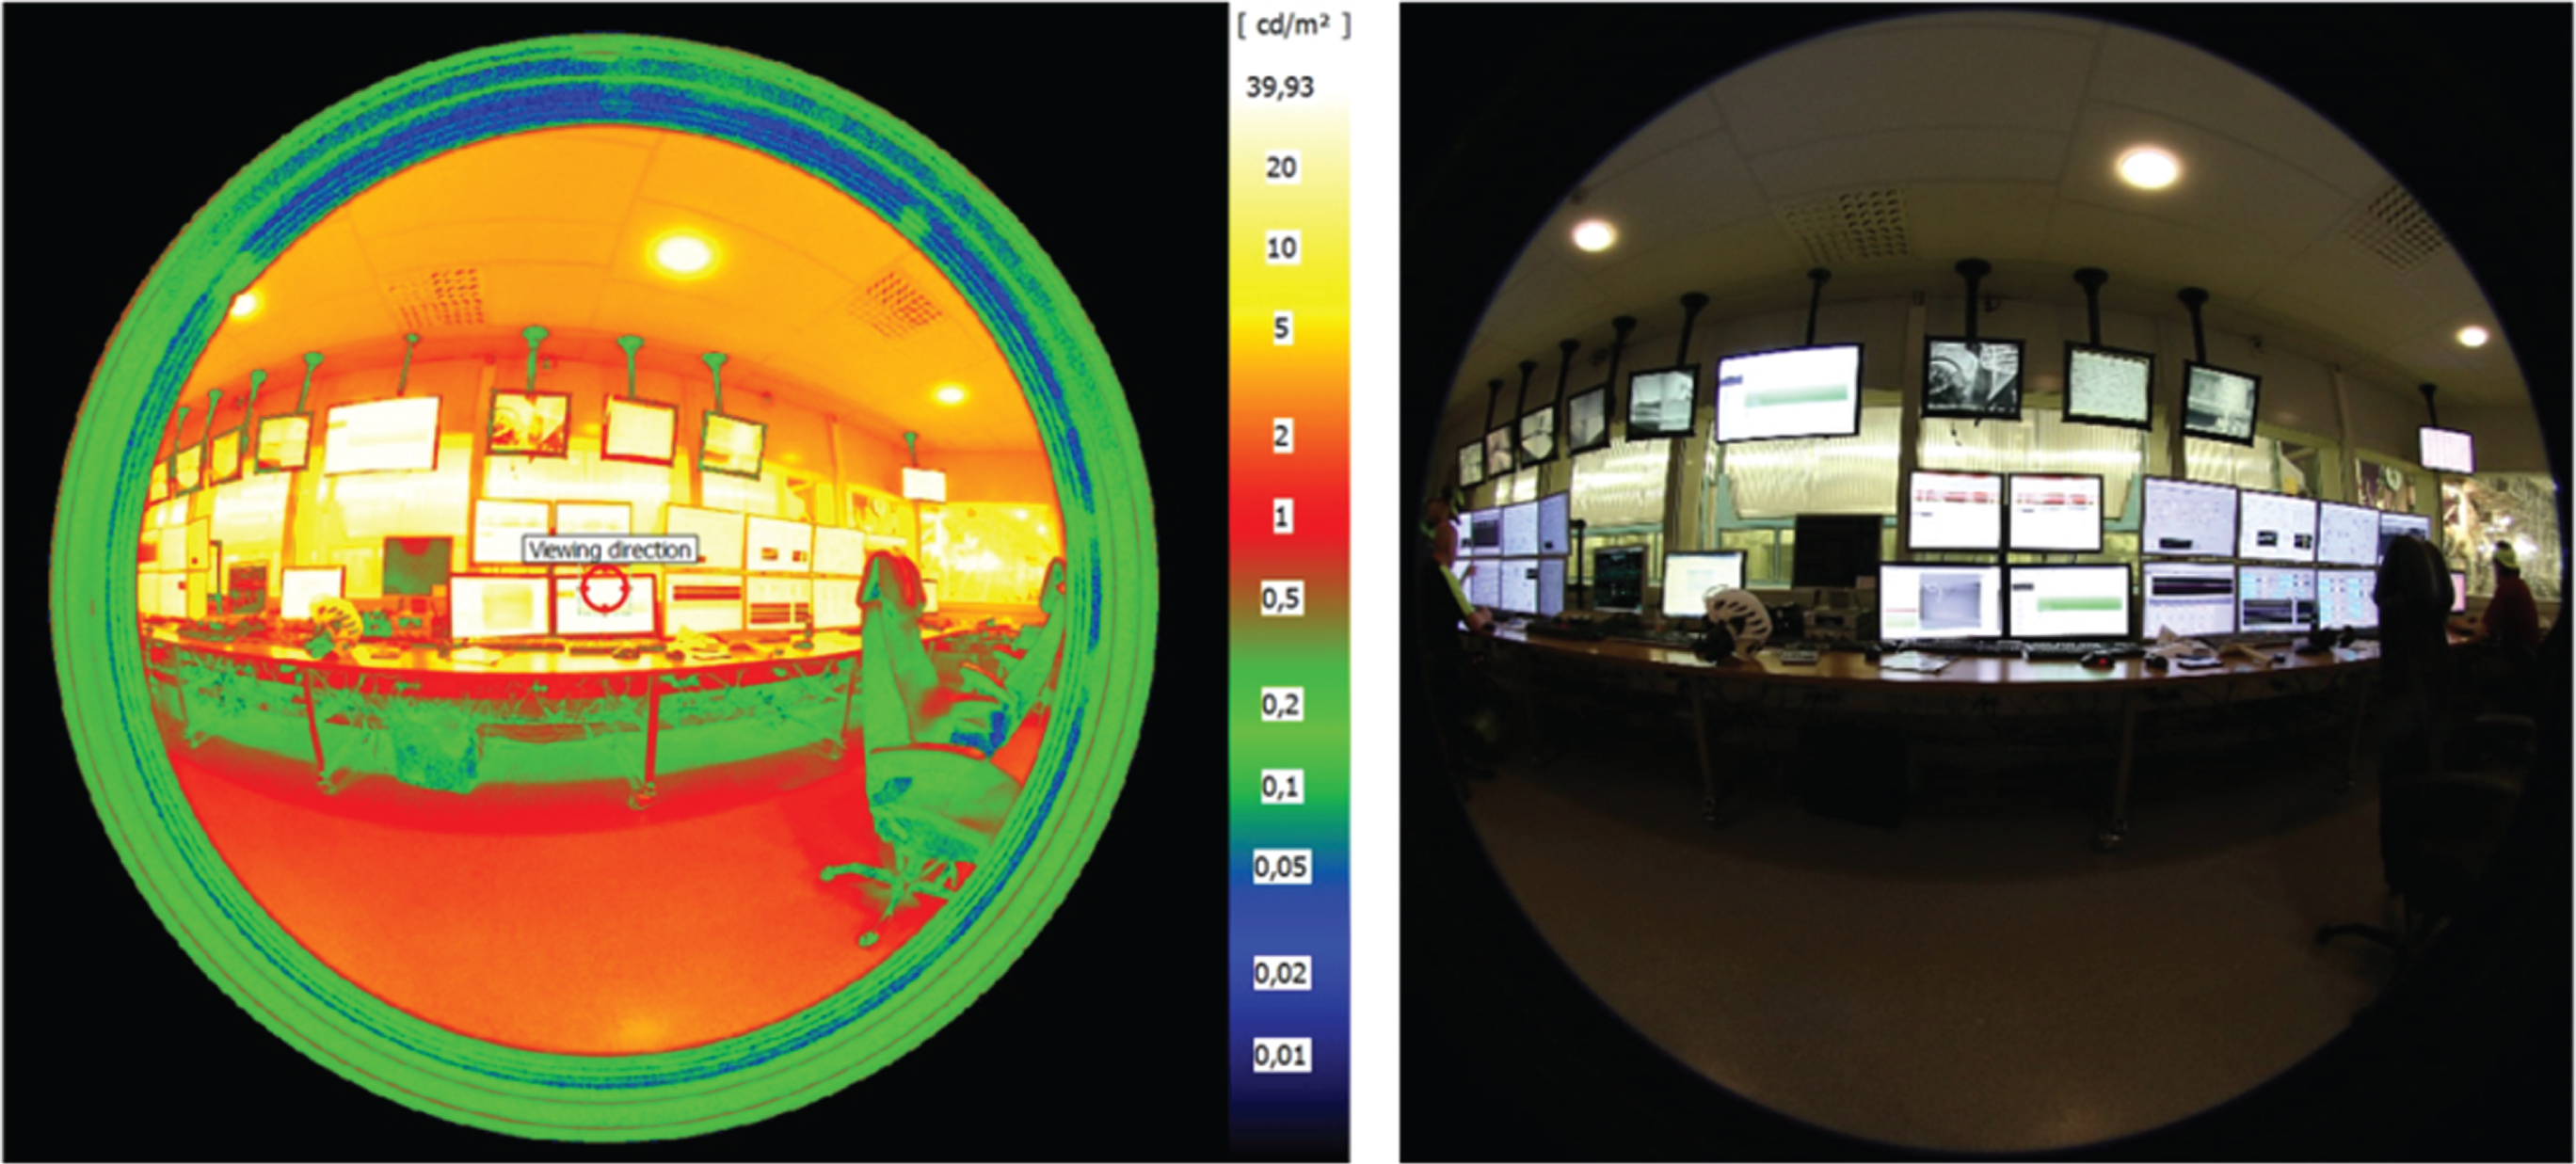
Figure 3 illustrates a control room with considerable differences in luminance within the operator’s field of view. It was induced by light reflecting through the control room windows from a large protective steel plate that was placed just outside the control room. The luminance reached 970 cd/m2with gloss unit 199 through the windows (a horizontal light beam corresponding to the luminaires existed). Measured contrast was 5 : 1 (lowest luminance compared with the highest luminance while performing work tasks.
Fig. 3
Pictures taken with LMK Mobile advanced digital luminance camera with analysis software (LMK Glare Analysis, AddOn) illustrates reflected glare within the field of view in one of the control rooms. A yellow/white colour corresponds to highest luminance (luminance image).
3.2Visual distances and visual objects in the control rooms
To further describe visual environments in the evaluated control rooms, a summary is included in Table 5, showing visual distances to screens, character size on used screens, and upward gaze angles to screens further away. The screens that were monitored by the operators featured both production automation and control programs (distance 1), and closed-circuit TV systems (CCTV) for surveillance of the production and other relevant information (distance 2). Character and object sizes were found to be larger on the screens further away.
Table 5
Details of visual distance, character size and upward gaze angle
| Distance 1 (m) | Distance 2 (m) | Character size (mm) | Upward gaze angle2 (°) | |
| Room 1 | 1.50–1.75 | 2.65–2.80 | 3–4 | 10–30 |
| Room 2 | 0.75–1.00 | 1.60–1.80 | 3–4 | 10–30 |
| Room 3 | 1.25–1.50 | 2.30–3.60 | 3–4 | 30–50 |
| Room 4 | 0.75–1.00 | 1.70–2.10 | 3–4 | 5–20 |
| Room 5 | 0.75–1.00 | 1.10–1.30 | 3–4 | 30–50 |
| Room 6 | 1.50–1.60 | 1.80–1.85 | 4–5 | 5–10 |
| Room 7 | 0.60–0.70 | 1.00–1.10 | 4–5 | 15–40 |
| Room 8 | 0.70–0.80 | 3.00–3.10 | 3–10 | 5–25 |
| Room 9 | 1.10–1.40 | 2.20–2.30 | 4–5 | 20–50 |
Distance 1 represents visual distance to screens on the office table and Distance 2 represents visual distance to screens further away. Gaze angle is based on office position and is dependent on individual length and angle of the chair back.
3.3Changes in focus and visual distances
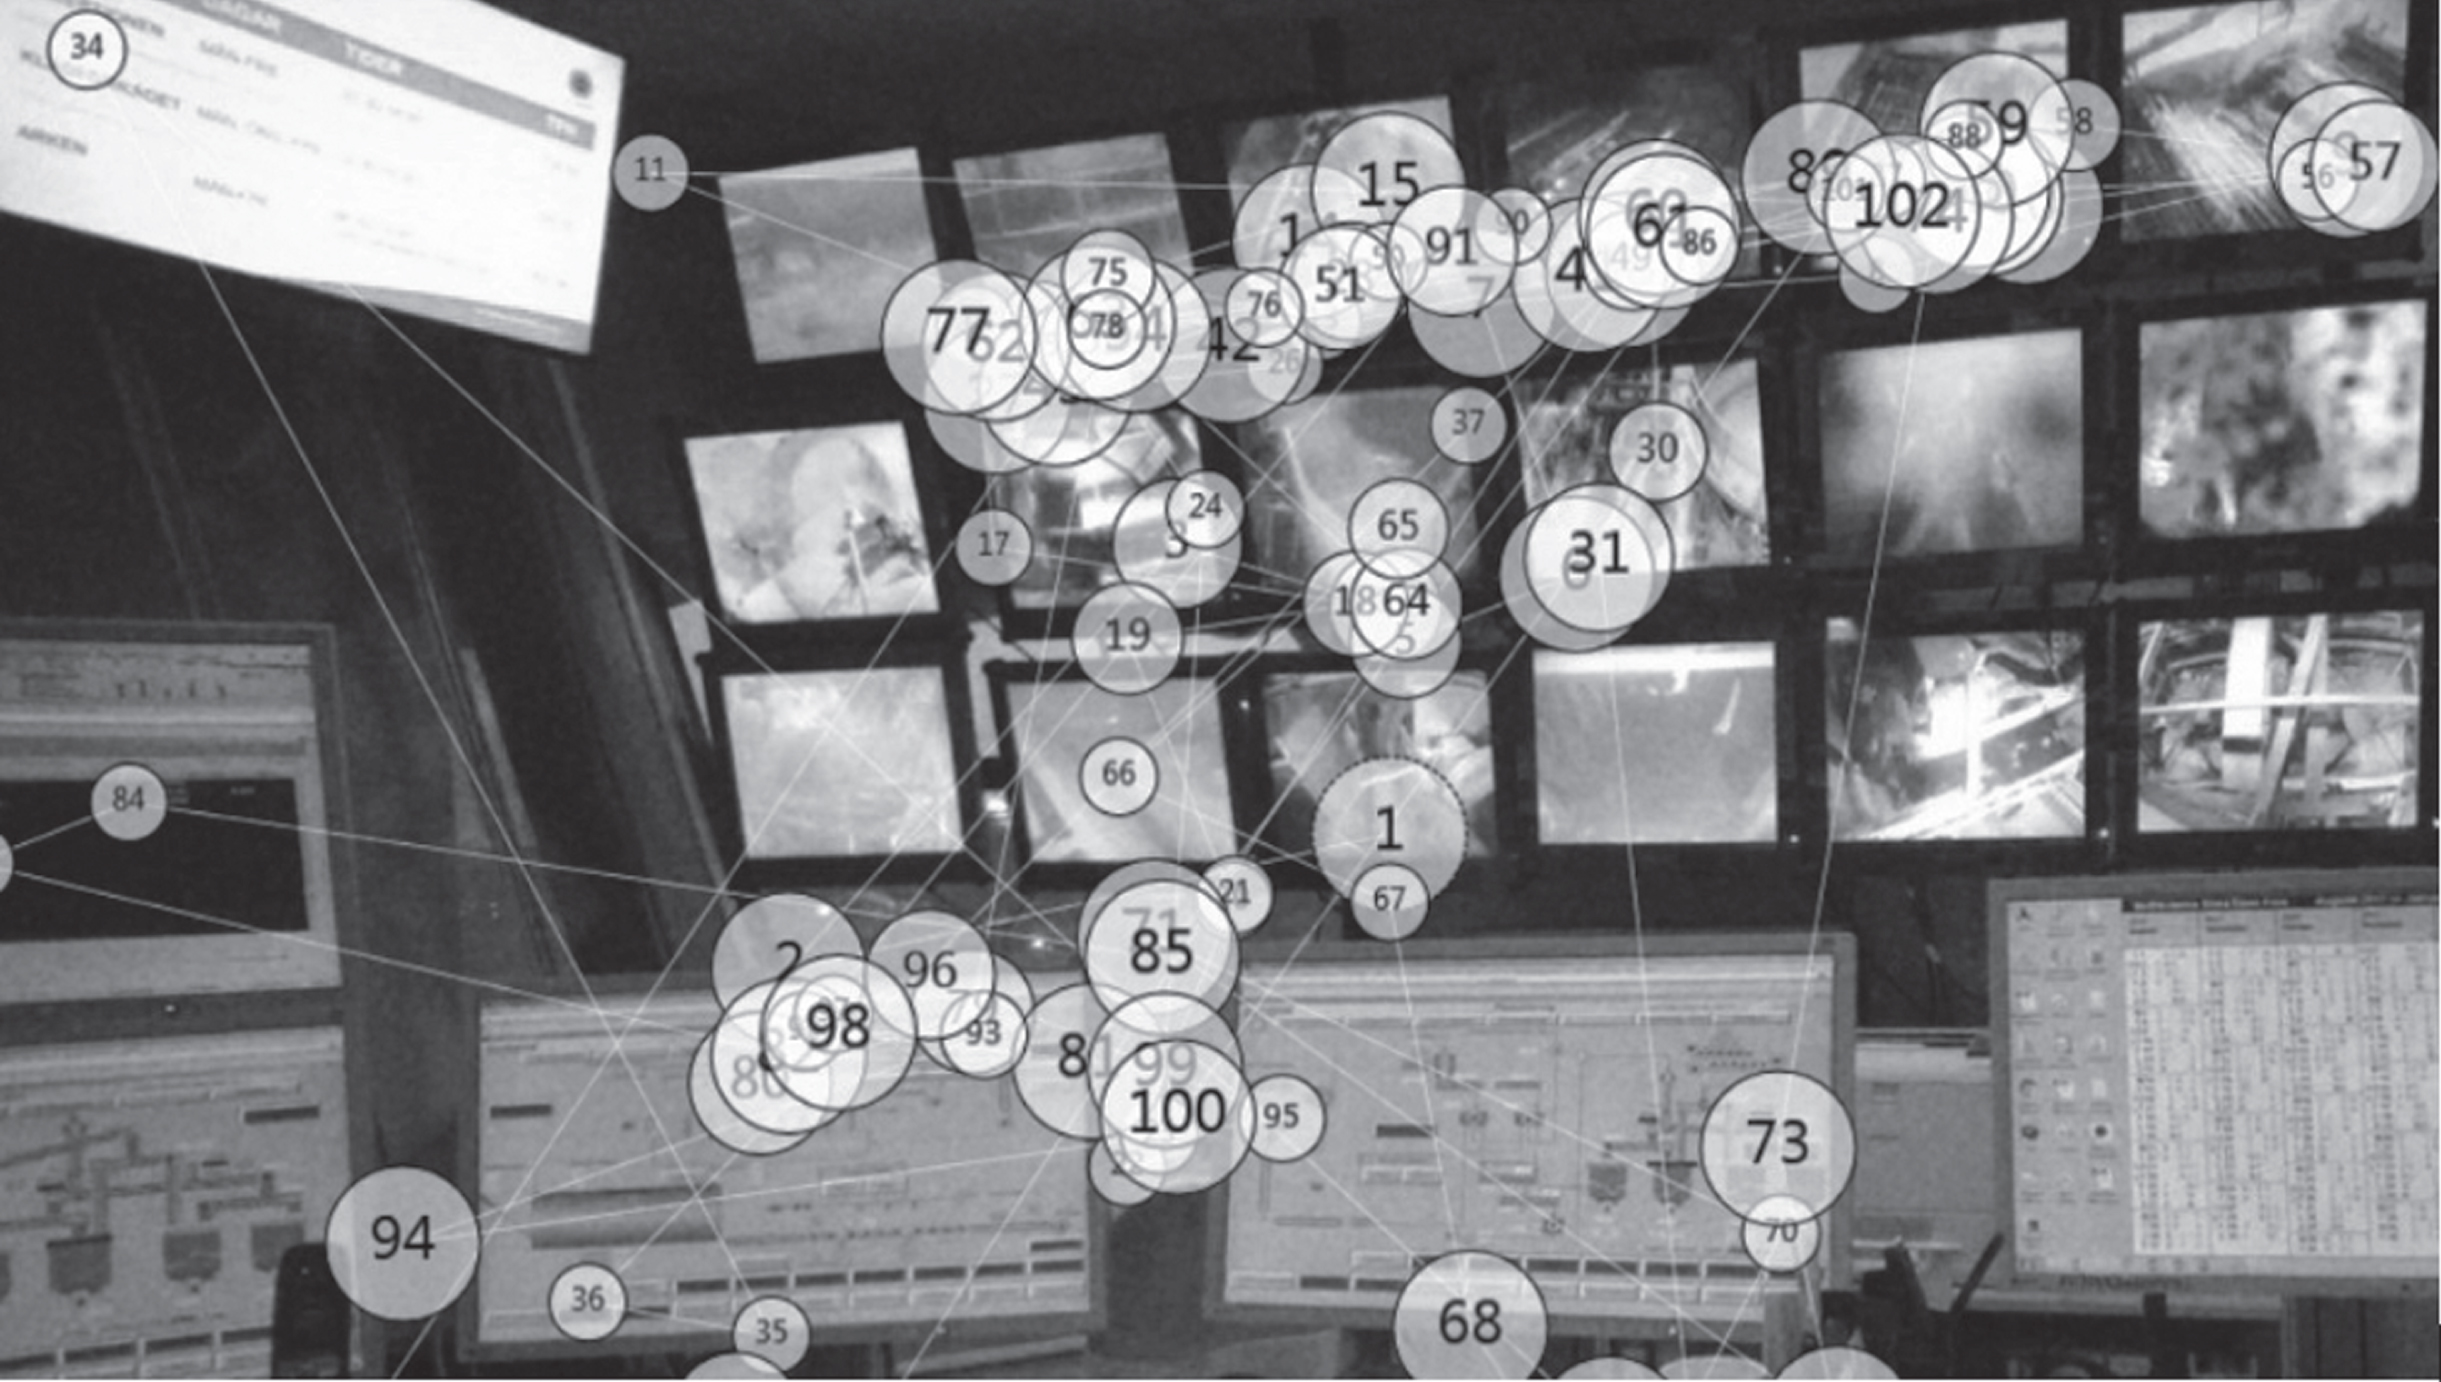
The operators’ eye movements during the individual recordings with the eye tracker were analysed for changes in focus according to used visual distances. The analysis showed that the average number of fixations was 1420±480 representing the individuals’ entire recordings (average time of the individual recordings was 13±3 minutes). In six of the nine control rooms, the supervisory work involved major differences in visual distances, in combination with frequent changes between screens placed on the office table and other screens mounted on the wall further away. Further analysis of the data from the eye-tracker recording representing one of the control rooms showed a change in focus just below 100 times and changes in major visual distances about 20 times during one minute of work (Figure 4).
Fig. 4
Illustration of recorded eye movements in one of the control rooms where supervisory work involved continuous differences in visual distances.
4Discussion
The results in this study show that the mental workload was rated the highest by the participating operators. Further, the process operators indicated some work-related eye problems and experienced pronounced visual fatigue and blurred vision. Summarising the results comparing differences in control room design, indicated raised visual demands in conditions where contrast glare was present, as well as frequent changes of focusing distances, and low contrast between background and characters in computer screens.
4.1Discussion of results
Computer work is a visually demanding work and thus susceptible to external environmental factors such as incorrect lighting design. In work environments that include supervisory work using computer screens, light sources from e.g. ceiling luminaire, pendant luminaire, desk luminaire and the sun’s inflow from windows, can either directly or indirectly (through reflections from the screen or other surrounding surfaces) affect the visual quality.
The process operators described a work-related increase of discomfort glare and disability glare that induces visual fatigue. The symptoms are caused by disparity in luminance, i.e., contrast glare, within the field of view [34]. Symptoms may also be influenced by visual distances, upward gaze angles and contrast between characters and background on screens, as well as the participant's visual status [1, 2]. Results in this study further showed that contrast glare affected the operators’ ability to see clearly while working.
The control rooms generally had low illuminance levels. The operators stated that they preferred subdued light to get a better view of equipment and the process outside the control room. Increased illuminance levels resulted in disturbing reflections in the windows that made it difficult to see outside. Recommended illumination in office environments including computer work is minimum 500 lux [35–37]. Prevailing daylight from windows gave a good prerequisite for sufficient lighting conditions.
Contrast glare induced by i.e., computer screens, reflected light or fluorescent lamps within the field of view were present in eight of the nine control rooms (for detailed illuminance- and luminance values, see Table 4). Accordingly, since high luminance differences were present in those control rooms the operators eyes probability had difficulty staying adapted to the luminance of the work task which caused eye discomfort and/or disability glare [38]. The recommendation of the uniformity within the room, i.e., working area, is a ratio of higher than 0.7 (maximum and minimum luminance) [36].
The lowest measured contrast between background and characters on screens was 2 : 1. The general recommendation regarding contrast between characters and background on displays is 3 : 1 as a lowest value [39]. This recommendation could be difficult to implement in an environment with a low illuminance in general, as the background would need to be in the white sense. Given that the operators prefer low illuminance levels in the control rooms, the background setting in whitening mode is not preferable. An important issue regarding visibility of computer screen tasks is the font size in relation to the visual distance. The scientific literature includes several recommendations for suitable viewing angles and distances, some of them conflicting [40]. According to the much-referred to international ISO standard [41], the visual angel should be about 22 arcmin, i.e., approximately 4 millimeter at a visual distance of 70 centimeter. Since viewing distances and character sizes are influenced by age [42], it is however important that the design allows for individual adjustments depending on context of use. In this study, we found that screens used for supervising and controlling the production (i.e., software for automation and control), were placed in front of the operators on the office table. Typical viewing distances were 60–175 centimeters with character and object size between 3–5 millimeters. The screens showing CCTV or other type of information, were placed further away on viewing distances between 100–310 centimeters and with character and object sizes between 5–10 millimeters. Hence, we noted that these sizes had been customized to fit the viewing distances in line with ergonomic requirements for office work with visual display terminals [41] due to a larger inch value of the screens.
Moreover, frequent changes in focusing distances were necessary during the continuous visual assessments of different computer screens. Visual conditions differed between these visual distances and therefore, the operators’ eyes constantly needed to adapt to the luminance differences of the screens. Due to these luminance differences, it is fair to assume that the operators would experience visual difficulties [10]. The visual demands are further increased by the low contrast of the screens. This is an important aspect to take into account regarding computer workers with binocular problems, since they are more likely to experience visual discomfort due to oculomotor imbalance under working conditions of glare even at levels lower than measured values present in this study [43]. Additionally, visual related changes associated with increasing age will decrease the accommodative capacity, (i.e., presbyopia) and will result in decreased visual function, such as decreased contrast sensitivity, increased glare sensitivity and decreased dark adaptation [9, 44].
In one of the visited control rooms, light reflecting through the windows (~970 cd/m2) caused contrast glare within the field of view. In this specific control room, the average luminance within the field of view was 182±314 cd/m2. Previous studies show that computer users prefer a luminance between 60–85 cd/m2 in surrounding area [10], about half of the measured luminance and gloss above 60 gloss units decrease visibility and visual performance [45]. The gloss value measured on the steel plate, which induced the contrast glare, was 199.
The process operators who scored highest on self-reported eye-related problems (i.e., visual fatigue) all worked in control rooms with high contrast glare, thus being subjected to increased visual requirements.
The operators’ visual system is under high strain [46] since the screens are flat. When glare is present or visibility is reduced, an increase of visual demands occurs [47], and the intensity of muscle blood flow in trapezius increases [48] leading to an increased risk of musculoskeletal disorders. Oculomotor load is increased with the severity of the glare condition while performing computer work [47] and may therefore be a contributory factor to computer vision syndrome (CVS).
Furthermore, work that repeatedly requires an upward gaze direction, leading to reduced blink frequency, can lead to eye-related disorders such as dryness, soring eyes and redness [14]. Neck symptoms, head posture, neck muscle activity, eye symptoms and eye function of computer users may be influenced by the placement of the screen or monitor used [49, 50]. For example, an increased height of the display is associated with lower blink frequency, increased risk for adverse eye symptoms, and a decreased amplitude of accommodation [51–53]. This is of interest also in the present study, where the operators had upward gaze angles included in their work supervising and controlling a large number of varying processes using screens with several viewing distances. In our findings, we see that the operators that more often needed to assume an upward gaze direction, have more pronounced problems (see Table 5). The material is to limited to draw any statistical conclusions about operators’ age in relation to eye symptoms, but previous research have shown that the presence of dry eyes is significantly elevated with increasing age [15].
The participating operators perceived the mental workload as the most prominent workload. Over time, this may lead to mental fatigue and increased stress levels [54]. This is demonstrated in the present study when more than half of the operators stating that they sometimes or often experience difficulties remembering what they had just read. All process operators also reported occasional sleepiness during work. This may be an effect of the low illumination levels in the control rooms in addition to shift work schedule. A previous study on sleepiness among control room operators [22] recommend improved lighting conditions as a useful ergonomic strategy, since bright light facilitates cognitive performance, i.e., working memory, sustained attention etc. [21].
4.2Methodological considerations
The research design of this study adopts a multi-methods approach that elicits detailed and rich information on the visual working conditions in the visited control rooms and how the operators perceive their workload, visual experiences and eye-related health. Working in front of computer screens involves visual and cognitive demands. While the visual demands are thoroughly mapped by objective photometric measurements, we can compare these metrics with the operators’ subjective assessment of their visual comfort, as well as the results from the eye tracker to identify sources of problems. Together, the methods address several dimensions and bring together different disciplines. The purpose is however not to reach one valid result, but to obtain a comprehensive and contextualized understanding of the problem and inspire a greater range of solutions, as suggested by for instance Mingers and Brocklesby [55].
When asking participants to answer questionnaires on workload and visual experience there can be several factors influencing the answers. As discussed earlier, age is directly related to visual functions. While gender is believed to have no significant influence on glare perception [56], the prevalence of dry eye is higher in women than men [12]. Further, there are some anatomical differences between women and men that affects the prevalence of age-related eye disease, but there are also socioeconomic factors such as access to medical care that needs to be considered when investigating causes of gender differences [57].
When interpreting results of the questionnaires there may be cultural factors to consider [56] as well as differences in visual performance. For example, if the operator has been accustomed to certain conditions in the working environment, the experience and expectations may influence the perception and be reflected in the answers. Moreover, a full vision exam stating that all participants had normal or corrected to normal vision would elucidate and strengthen the results regarding eye symptoms [12, 58]. Further, current physical and emotional state can affect a respondent’s perception of comfort and lead to a critical view of the luminous conditions, depending on positive or negative circumstances. Nevertheless, since psychosocial factors clearly matter, the greater reason for evaluation of visual working conditions to not exclusively be based on photometric measurements.
4.3Recommendations in brief
In sum, the results from this study indicate that many supervisory tasks in the control rooms include major changes in focus distances with considerable differences in luminance, as well as sizeable luminance differences within the field of view causing visual contrast glare.
Visited control rooms in this study all displayed production technology and process control systems with various levels of automation and of various age. With the rapid growth in advanced automation and computer technologies, it is reasonable to assume that workers of various sizes, shapes and ages who spend a large part of their working days in front of computer screens will perform a raise in work in control room environments. To prevent the health risks associated with computer work, it is important that the control rooms are designed in a way that provide optimal support for a wide range of users.
There is a large body of generic knowledge available on the importance of ergonomics to successful (and unsuccessful) systems. Several types of ergonomics handbooks, guidelines and standards are in existence worldwide. Yet, it seems the application of ergonomic principles and methods in practice, is not utilized to its full potential. When (re)designing future control rooms, it is therefore recommended to apply fundamental principles of general and visual ergonomics described in, for instance, the multi-part standard ISO 9241 covering ergonomics of human-computer interaction, and in the seminal works by Anshel [59] and Pheasant and Haslegrave [60], to mention but a few. Lighting requirements have been described in detail in e.g. IESNA [35]. It is further advisable to perform task analyses [61] to identify demands for all commonly performed tasks and equipment used –not only the primary task –to minimize the need for unnecessary changes of focus distances and avoid upward gaze directions. Moreover, there is a need to integrate new technologies regarding lighting design in control rooms to meet psychological and physiological aspects [62] in order to provide an accurate visual environment.
The findings illustrate important aspects of the operators’ experiences during control room work. Yet, the described approach may require further adaptations to accommodate evaluation of novel systems that are now making an entry in occupational settings, such as curved and flexible screens, ‘smart lighting’ and new types of luminaires.
5Conclusions
The multi-method research design employed in this study has elicited a comprehensive and contextualized understanding of the visual working conditions in the control rooms, as well as of the operators’ perceived workload, visual experience and eye-related health.
The findings establish a relationship between large differences in luminance levels within the field of view and control rooms operators who self-report that they are troubled by eye symptoms. Visual fatigue among the participating operators could be related to some of the visual conditions in the control room environments. Working with flat screens contributes to elevated visual demands. When a process operator is exposed to glare, further stress is placed on the visual system leading to visual fatigue. This may lead to an increased risk for pain in the neck and shoulders and may further contribute towards an unnecessary high mental load affecting the working memory.
The research findings presented in this study support the relevance of providing an optimized visual environment that considers principles of general and visual ergonomics, as well as guidelines for lighting when designing and organizing work in control rooms. Given that more and older workers are likely to spend more time working with computers, it is also recommended that workstations are designed for flexibility that allows for individual and contextual adjustments.
Conflict of interest
None to report.
Acknowledgments
This study is part of a larger research project financially supported by AFA Försäkring through the 160255 project “The importance of an optimized visual ergonomics for sustainable control room work”.
References
[1] | Long J , Helland M . A multidisciplinary approach to solving computer related vision problems. Ophthalmic and Physiological Optics. (2012) ;32: (5):429–35. |
[2] | Long J , Rosenfield M , Helland M , Anshel J . Visual ergonomics standards for contemporary office environments. Ergonomics Australia. (2014) ;10: (1):7. |
[3] | Richter HO , Bänziger T , Forsman M . Eye-lens accommodation load and static trapezius muscle activity. European Journal of Applied Physiology. (2011) ;111: (1):29–36. |
[4] | Domkin D , Forsman M , Richter HO . Ciliary muscle contraction force and trapezius muscle activity during manual tracking of a moving visual target. Journal of Electromyography and Kinesiology. (2016) ;28: :193–8. |
[5] | Domkin D , Forsman M , Richter HO . Effect of ciliary-muscle contraction force on trapezius muscle activity during computer mouse work. European Journal of Applied Physiology. (2019) ;119: (2):389–97. |
[6] | Mork R , Falkenberg HK , Fostervold KI , Thorud HMS . Visual and psychological stress during computer work in healthy, young females—physiological responses. International Archives of Occupational and Environmental Health. (2018) ;91: (7):811–30. |
[7] | Hemphälä H , Eklund J . A visual ergonomics intervention in mail sorting facilities: effects on eyes, muscles and productivity. Applied Ergonomics. (2012) ;43: (1):217–29. |
[8] | Haegerstrom-Portnoy G , Schneck ME , Brabyn JA . Seeing into old age: vision function beyond acuity. Optometry and Vision Science. (1999) ;76: (3):141–58. |
[9] | Nylén P , Favero F , Glimne S , Teär Fahnehjelm K , Eklund J . Vision, light and aging: A literature overview on older-age workers. Work. (2014) ;47: (3):399–412. |
[10] | Sheedy JE , Smith R , Hayes J . Visual effects of the luminance surrounding a computer display. Ergonomics. (2005) ;48: (9):1114–28. |
[11] | Glimne S , Öqvist Seimyr G , Brautaset R . Effect of 3-Dimensional Central Stimuli on Near Point of Convergence. Strabismus. (2015) ;23: (3):121–5. |
[12] | Rosenfield M . Computer vision syndrome: a review of ocular causes and potential treatments. Ophthalmic and Physiological Optics. (2011) ;31: (5):502–15. |
[13] | Gowrisankaran S , Sheedy JE . Computer vision syndrome: A review. Work. (2015) ;52: (2):303–14. |
[14] | Helland M , Horgen G , Kvikstad TM , Garthus T , Aarås A . Will musculoskeletal, visual and psychosocial stress change for visual display unit (VDU) operators when moving from a single-occupancy office to an office landscape? International Journal of Occupational Safety and Ergonomics. (2008) ;14: (3):259–74. |
[15] | Stapleton F , Garrett Q , Chan C , Craig JP . The epidemiology of dry eye disease. Dry Eye: Springer; 2015. p. 21-9. |
[16] | Jainta S , Dehnert A , Heinrich SP , Jaschinski W . Binocular coordination during reading of blurred and nonblurred text. Investigative Ophthalmology & Visual Science. (2011) ;52: (13):9416–24. |
[17] | Jaschinski-Kruza W . Dark vergence in relation to fixation disparity at different luminance and blur levels. Vision Research. (1994) ;34: (9):1197–204. |
[18] | Pickwell L , Yekta A , Jenkins T . Effect of reading in low illumination on fixation disparity. American Journal of Optometry and Physiological Optics. (1987) ;64: (7):513–8. |
[19] | Garzia RP . Vision and reading: Mosby Incorporated; 1996. |
[20] | Richter H , Long J . The pitfalls of the traditional office ergonomics model in the current mobile work environment: Is visual ergonomic health literacy the remedy? WORK A Journal of Prevention, Assessment & Rehabilitation. 2019. |
[21] | Kretschmer V , Schmidt K-H , Griefahn B . Bright-light effects on cognitive performance in elderly persons working simulated night shifts: psychological well-being as a mediator? International Archives of Occupational and Environmental Health. (2013) ;86: (8):901–14. |
[22] | Kazemi R , Haidarimoghadam R , Motamedzadeh M , Golmohamadi R , Soltanian A , Zoghipaydar MR . Effects of shift work on cognitive performance, sleep quality, and sleepiness among petrochemical control room operators. Journal of Circadian Rhythms. 2016;14. |
[23] | Simonsen E , Osvalder A-L . Categories of measures to guide choice of human factors methods for nuclear power plant control room evaluation. Safety Science. (2018) ;102: :101–9. |
[24] | Stanton NA , Salmon P , Jenkins D , Walker G . Human Factors in the Design and Evaluation of Central Control Room Operations. Boca Raton, FL: CRC Press. Taylor & Francis Group; 2010. |
[25] | Kataria A , Holder E , Praetorius G , Baldauf M , Schröder-Hinrichs J . Exploring Bridge-Engine Control Room Collaborative Team Communication. TransNav - the International Journal on Marine Navigation and Safety of Sea Transportation. (2015) ;9: (2):169–76. |
[26] | Elliott D , Yang K , Whitaker D . Visual acuity changes throughout adulthood in normal, healthy eyes: seeing beyond 6/6. Optometry and Vision Science: Official Publication of the American Academy of Optometry. (1995) ;72: (3):186–91. |
[27] | Lovie-Kitchin J . Relationships Between Distance Visual Acuity and Age in Children and Adults With Normal Vision. Investigative Ophthalmology & Visual Science. (2002) ;43: (13):4704. |
[28] | Borsting EJ , Rouse MW , Mitchell GL , Scheiman M , Cotter SA , Cooper J , et al. Validity and reliability of the revised convergence insufficiency symptom survey in children aged 9 to 18 years. Optometry and Vision Science. (2003) ;80: (12):832–8. |
[29] | Lee S , Park W , Kwon M , Lee H , Eom J , Mah K . Validity of the convergence insufficiency symptom survey in adults. Korean J Vis Sci. (2010) ;12: (3):181–90. |
[30] | Rouse MW , Borsting EJ , Lynn Mitchell G , Scheiman M , Cotter SA , Cooper J , et al. Validity and reliability of the revised convergence insufficiency symptom survey in adults. Ophthalmic and Physiological Optics. (2004) ;24: (5):384–90. |
[31] | Johansson J , Pansell T , Ygge J , Seimyr GÖ . Monocular and binocular reading performance in subjects with normal binocular vision. Clinical and Experimental Optometry. (2014) ;97: (4):341–8. |
[32] | Hart SG , editor NASA-task load index (NASA-TLX); 20 years later. Proceedings of the human factors and ergonomics society annual meeting; 2006: Sage publications Sage CA: Los Angeles, CA. |
[33] | Ortiz-Jaramillo B , Kumcu A , Platisa L , Philips W , editors. Computing contrast ratio in images using local content information. 2015 20th Symposium on Signal Processing, Images and Computer Vision (STSIVA); 2015: IEEE. |
[34] | Glimne S , Österman C . Eye symptoms and reading abilities of computer users subjected to visually impaired direct glare. International Journal of Industrial Ergonomics. (2019) ;72: :173–9. |
[35] | IESNA. The Lighting Handbook: Reference and Application. New York: IESNA - Illuminating Engineering Society of North America; 2011. |
[36] | CEN. EN 12464-1:2011. Light and lighting - Lighting of work places - Part 1: Indoor work places: European Committee for Standardization (CEN); 2011. |
[37] | ANSI/IESNA. RP-1-04. American National Standard Practice for Office Lighting: Illuminating Engineering Society of North America (IESNA); 2004. |
[38] | Osterhaus W , Hemphälä H , Nylén P . Lighting at computer workstations. Work. (2015) ;52: (2):315–28. |
[39] | Snyder HL . Chapter 20 - Image Quality. In: Helander M, editor. Handbook of Human-Computer Interaction. Amsterdam: North-Holland; 1988. p. 437-74. |
[40] | Woo EHC , White P , Lai CWK . Ergonomics standards and guidelines for computer workstation design and the impact on users’ health –a review. Ergonomics. (2016) ;59: (3):464–75. |
[41] | ISO9241-5:1998. Ergonomic requirements for office work with visual display terminals (VDTs)-Part 5: Workstation layout and postural requirements. Geneva: International Organization for Standardization; 1998. |
[42] | Wu H-C . Electronic paper display preferred viewing distance and character size for different age groups. Ergonomics. (2011) ;54: (9):806–14. |
[43] | Glimne S . Effects of glare on binocular vision and reading behaviour performing computer work. Stockholm: Karolinska Institutet, Sweden; 2015. |
[44] | McMurdo ME , Gaskell A . Dark adaptation and falls in the elderly. Gerontology. (1991) ;37: (4):221–4. |
[45] | Brunnström K , Josefsson K , Andrén B , Nordin H , Rydell N , editors. 66.3: Visual Ergonomic Effects of Screen Gloss on LCDs. SID Symposium Digest of Technical Papers; 2008: Wiley Online Library. |
[46] | Glimne S , Brautaset R , Seimyr GÖ . The effect of glare on eye movements when reading. Work. (2015) ;50: (2):213–20. |
[47] | Glimne S , Seimyr GÖ , Ygge J , Nylén P , Brautaset R . Measuring glare induced visual fatigue by fixation disparity variation. Work. (2013) ;45: (4):431–7. |
[48] | Richter HO , Zetterlund C , Lundqvist L-O . Eye-neck interactions triggered by visually deficient computer work. Work. (2011) ;39: (1):67–78. |
[49] | Daum KM , Clore KA , Simms SS , Vesely JW , Wilczek DD , Spittle BM , et al. Productivity associated with visual status of computer users. Optometry-Journal of the American Optometric Association. (2004) ;75: (1):33–47. |
[50] | Hagberg M , Rempel D . Work-related Disorders and the Operation of Computer VDT’s. Handbook of human-computer interaction: Elsevier; 1997. p. 1415-29. |
[51] | Atchison DA , Claydon CA , Irwin SE . Amplitude of accommodation for different head positions and different directions of eye gaze. Optometry and vision science: official publication of the American Academy of Optometry. (1994) ;71: (5):339–45. |
[52] | Jaschinski-Kruza W . Visual strain during VDU work: the effect of viewing distance and dark focus. Ergonomics. (1988) ;31: (10):1449–65. |
[53] | Saito S , Miyao M , Kondo T , Sakakibara H , Toyoshima H . Ergonomic evaluation of working posture of VDT operation using personal computer with flat panel display. Industrial Health. (1997) ;35: (2):264–70. |
[54] | Fallahi M , Motamedzade M , Heidarimoghadam R , Soltanian AR , Miyake S . Effects of mental workload on physiological and subjective responses during traffic density monitoring: a field study. Applied Ergonomics. (2016) ;52: :95–103. |
[55] | Mingers J , Brocklesby J . Multimethodology: towards a framework for mixing methodologies. Omega. (1997) ;25: (5):489–509. |
[56] | Pierson C , Wienold J , Bodart M . Discomfort glare perception in daylighting: influencing factors. Energy Procedia. (2017) ;122: :331–6. |
[57] | Zetterberg M . Age-related eye disease and gender. Maturitas. (2016) ;83: :19–26. |
[58] | Blehm C , Vishnu S , Khattak A , Mitra S , Yee RW . Computer vision syndrome: a review. Survey of Ophthalmology. (2005) ;50: (3):253–62. |
[59] | Anshel J . Visual ergonomics handbook: CRC Press; (2005) . |
[60] | Pheasant S , Haslegrave CM . Bodyspace: Anthropometry, ergonomics and the design of work: CRC Press; (2018) . |
[61] | Stanton NA . Hierarchical task analysis: Developments, and applications, and extensions. Applied Ergonomics. (2006) ;37: (1):55–79. |
[62] | Long J , Toomingas A , Forsman M , Glimne S , Helland M , Hemphälä H , et al. A definition of visual ergonomics. Applied Ergonomics. (2014) ;45: (126):3e1264. |


