
Developing and hosting web data apps in R programming for official statistics
Abstract
Official statistics place particular emphasis on communication and dissemination of surveys’ results to citizens and stakeholders. This is typically done through the publication of press releases and presentation of aggregated data of statistical surveys. The use of web services and software that allow users to interact with the results of official statistics comes to further enhance communication, dissemination, literacy and overall quality of official statistics. This paper is related to the objectives and context of reaching a wider audience through engaging users and explains how an NSO (National Statistical Office) member without specialized knowledge of frontend-backend programming techniques can create such web services in R programming environment through “Shiny” library. The paper also reviews the issue of hosting “Shiny” apps and presents existing approaches. For demonstration purposes, an experimental version of such an application was constructed that presents in an interactive way the quarterly results of the new statistical product of the Hellenic Statistical Authority (ELSTAT) on Greek business demography.
1.Introduction
One of the primary goals of the European Statistical System is to disseminate [1] and communicate official statistics [2]. Official statistics as a public good are better understood and more useful for stakeholders through their effective dissemination and communication [3]. Overall quality of official statistics is also being affected by successful implementation of COP (code of practice) principles [4] while new quality challenges for official statistics have already emerged due to globalization and technology advancements [5]. The improvement in the quality of official statistics has, in turn, been designed to boost public’s trust, which is associated with a greater willingness to participate-cooperate, with the corresponding positive effects on the production of high quality official statistics [4].
It is a common practice for surveys’ results to be disseminated through communication channels such as official institution websites, social media (e.g. twitter, linkedin) [6], and electronic and printed media after they have been processed. In the case of the Hellenic Statistical Authority (ELSTAT), the results of a survey are usually issued through a relevant press release that includes electronic files with references to the main points of the produced results but also from attached electronic spreadsheets with the corresponding aggregated data. Results are also being channelized in social media and press so that results are shared with public.
Although this presentation of the results is sufficient to inform stakeholders, in the context of this paper, we propose the use of web apps that enhance the user’s interaction [7] with the results, which improves the understanding [8] of research by positively contributing to the relevance and reproduction [9] of the services provided by the official statistics carrier. Such apps have also been used as instruments for teaching statistics [10, 11], tools for promoting statistical knowledge [12] and raising awareness for the official statistics in a wider audience. In their multipurpose usage should also be noticed the promotion of statistical literacy [13, 14] whilst it should be added up that they have been evaluated as to their contribution [15]. Such apps should also be considered as part of the greater data science context that is an interdisciplinary field gaining more and more attention on official statistic’s community [16, 17, 18]. It should be also mentioned that COVID-19 worked as an accelerator of developing data web apps with official statistics sources promoting public briefing and awareness about pandemic [19].
The paper is organized as follows. In Section 2 the literature review is being presented while in Section 3.1 the how-to build methodology of web apps is being explained with R’s “Shiny” package. Next, in Section 3.2 the problem of hosting web apps built on Shiny package is being analyzed and existing approaches are being illustrated. In Section 4 follows a demo implementation of such an app that can be utilized to promote communication and dissemination of official statistics to stakeholders and in Section 5 conclusions which summarize the content provided by the present paper are being discussed.
2.Literature review
According to the DSMOS model (Data Science Model for Official Statistics) [20] dissemination of official statistics stands as a primary factor with data visualization and model deployment being as factor’s indicator. Data science is also interconnected with the creation of data-driven web apps [21] which in turn has also been used for improving data literacy [14]. However, as appealing as it is to use such an application, the issue of its implementation is equally complex. Typically, knowledge of front-end technologies such as HTML, React, Angular, Vue, and CSS is required for the development of a web application’s graphical interface, formatting, and interaction with the user [22]. Back-end technologies must also be comprehended, which typically include a web server, the application, a scripting language (e.g., PHP, Python, Ruby on Rails, etc.), and a database [23]. As a consequence, there is a wide range of skills that one should have as knowledge for the development of a complete web application [24], plus a possible steep learning curve, they should be considered as significant challenges for a non-programmer.
In recent years, however, a different approach has been taken to the development of web applications and even to those that emphasize data management, analysis and modeling. This cognitive gap was filled by tools such as the Shiny library [25, 26] for users of the R language or Dash [27], Streamlit [28] and Voila [29] for Python users. The central philosophy is that it is sufficient to know R or Python and use any of the above packages and their corresponding functions to build an online dashboard [30], fast prototypes’ apps [31] or even integrated applications such as real-time applications for the development of predictions from machine learning models. These libraries were created to alleviate the burden from painstaking work from using of a variety of tools [32] and to allow the user to focus on the application one wants to implement rather than how to implement it technically. It is no coincidence that there are several publications with applications built on Shiny that aim to teach statistics [10, 13, 15, 16, 25, 33] or some complex object [33] or to present in an interactive and visual way specialized discoveries [34].
This work focuses on the Shiny Library which refers to the R-language whose community comes largely from the subject of statistics. The idea of using Shiny apps for dissemination and communication of official statistics has been recently introduced in [14] which aiming to provide better understating of data to the users. However in [14] is not analyzed how a user can develop and deploy a Shiny application. Hosting-deploying a Shiny application is an issue by itself with a variety of different approaches based on different criteria [20, 21]. These different approaches are illustrated in Section 3.2.
3.Methodology
3.1Developing a Shiny app
The web apps mentioned in the introduction are, in fact, online dynamic dashboards [22] but not only, with visually driven options that allow the user to interact with the survey findings [23]. The visually driven options can be determined differently for each survey, and their contents are based on the survey managers’ expertise of the subject within a bespoke – tailored design model. The R programming language, namely the Shiny package/library, was used to create a trial of such an applet [24]. The Shiny package allows users to create input objects, calculations, and output objects through a variety of functions [25, 26]. Each application in Shiny operates according to the rationale outlined below: When a user interacts with an input object (e.g., a drop-down list of options) then an input event is triggered. Shiny’s “ear” then recognizes the type and characteristics of the input event in order to automatically produce a reaction to the specific event. Finally, this reaction can result in the creation of an output object (e.g. a diagram, a scoreboard, etc.). The Shiny library is an excellent tool for developing web applications (via rapid prototyping) [31] to meet the needs of data services. This library enables R language users without programming knowledge to develop frontend and backend applications using all of the R language’s features. At the same time, Shiny ensures that all the necessary functions in the backend and frontend [26] are executed in the background in order for the web application to be executed.
Shiny’s workflow
There are two basic functions in a Shiny application. The first function is known as “ui”, and the second is known as “server” [26]. The frontend of the web application can be built in the first function using appropriate commands-functions. This includes both input objects that will be processed in the backend and output objects that will be the visible result of the processing from a backend script. Within the ui function, library functions that control the architectural design and aesthetics of the application’s frontend can also be placed. Each input object is created using a suitable function of the Shiny library and is given a set of parameters, of which include, an id, a caption for the object, and an initial value, constitute the object’s original state. All parameters in an input object are stored as an item in a list that includes all of the input objects’ elements and has the predefined name “input”. Access to the data of any input object can be obtained in the backend by accessing the input list with the first argument of the object’s creation function, i.e. the id.
The backend is made up of a plethora of functions that use in their calculations both the values of input objects and other data that is statically stored in the R’s interface. Shiny has special backend functions that monitor changes in the values of input objects. As a result, by changing an input event, these special functions can instantly produce a reaction (e.g., creating a scatter plot from the values of the input objects). Typically, this reaction is an output object. Each output object has some values that are stored as an item in a R list called “output” and contains all the information about the output objects generated in the backend at any given time. When running a Shiny application, the only thing that remains in the workflow is to print the output objects in the frontend. This is accomplished in the ui function by calling the corresponding function of output’s object printing, which takes only the name of the object in the list of output objects as an argument. It’s worth noting at this point that in “Shiny” there are two ways of “listening” in what’s going on regarding events taking place in an app. The first way is known as the “observer” method, while the second is known as the “reactive” method. The first method re-executes the code that exists within it instantly when the value of an input object in the body of its code changes. Although this appears to be normal, it can result in the development of inefficient applications. Let’s consider the following example. Let suppose that an output object is a forecast price that indicates whether or not a creditor is solvent. Assume that this result is predicted by training a classification model with 22 input objects, each of which is the completion of a questionnaire field at the frontend of the application. In this case, the listener’s change to a single input object will automatically trigger the recalculation of the entire model in a very short time. Consider that it is reasonable to want for the application to respond after answering all of the questionnaire’s questions. In the preceding example, the implementation will cause the execution of the predictive model 22 times. That is why there is a second kind of listener. The literature describes this as “lazy,” whereas it only calculates the body of its code when a specific event changes (e.g. the pressing of a submit-execution button). As a result, the predictive model will be calculated only once, using all 22 entry values from the questionnaire all at once.
Example of a Shiny application
A Shiny application can be included in a single script, or it can be divided into two scripts, the first representing the frontend and the second the backend. In the case of a complex application with many lines of code, the approach with the two scripts is more efficient. Also, for the loading of libraries or external data sources (e.g., databases, spreadsheets, etc.), it is recommended to create separate scripts and integrate them into the body of the final application before the start of the ui and server functions. When a Shiny app is launched, the commands within the scripts are executed only once, and the code is then executed only through the two functions listed in the Shiny app. A simple example of a Shiny application is provided below. When we go to build an application in Shiny, we are given this predefined example in the IDE Rstudio. This example includes a slider box as an input object and a frequency histogram as an output object.
Code is available in code.R script in: https://drive.google.com/drive/folders/199UekXOk83rehvlcIQ8ZR_BQvKzD5P_d?usp=sharing
Description of how the above code works
The input and output objects, as well as some functions that provide spatial and aesthetic management of the frontend canvas, are included in the ui function. In essence, they are Shiny commands that are translated into corresponding HTML, CSS, and JavaScript code. However, in addition to the fixed options provided by the existing functions of a library version, the author of the application can place his own code in HTML, CSS, and JavaScript and have complete control over the application’s frontend.
The application divides the frontend into a grid in its basic version, with column creation options, sidebar options, a central panel, a tab set panel, and so on. Aside from the Shiny’s grid, there are R libraries such as Shiny dashboard [27] that allow you to fine-tune the architectural design of the application without writing any additional code. There are also libraries, such as Shiny Widgets [28], that help to expand the available input objects provided by Shiny. In the above example the code
sliderInput(“bins”, “Number of bins:”, min
creates the app’s input object. The ID of the object is “bins,”, the caption is “Number of bins:” and the object in question is required to declare the slider’s minimum, maximum, and current value.
The code:
output$distPlot
acts as an instantaneous listener, generating a randomly generated frequency histogram with each change of the input$bins, with the number of bins in the histogram determined by the respective value of the input$bins. The last line is returned as a diagram, which is saved as “distPlot” in the list of output objects. The plotOutput (“distPlot”) code is used to print the output object in the frontend ground using the plotOutput() function.
If building the UI of a Shiny app is still a burden, at the time this paper was written, there are some packages alleviating this difficulty. “Designer” [29] is an R package which enables users to create UI components in a Shiny app via drag n drop while generates also the equivalent code for your scripts. “Shiny UI editor” [30] is one new package from Rstudio’s (Posit) team that operates in a similar way with Designer. There is also a package called “ShinyWYSIWYG” [31] which ventures one step further to include also the server logic through it’s GUI while also producing the corresponding R code. These packages are extremely handy creating an abstraction level for app creators and aim to enhance focus on R code that hasn’t to do with coding a functional design. Last but not least there are addition R packages that aim to help user succeed in creating complex UI [27, 28, 32, 33].
3.2Hosting a Shiny app
Although building an application in Shiny is a quite simple, creative and fast task (depending on complexity of the app), hosting an application as an online service presents technical challenges [20, 34]. Shiny creates a web server for you, but that’s where the problems begin. The issue stems from the fact that the R language, on which the specific library is based, is a single threaded process. Even though there have been publications [8, 10, 14] about creating Shiny R apps and using for the needs of official statistics there is little to no information about different types of hosting-deploying an app. Hosting and maintaining a Shiny app in an production level is a quite technical procedure as it will be shown below while deploying procedure should considered as a critical factor concerning their use from NSOs. Fortunately, there are a variety of approaches addressing this problem. Before selecting a solution for hosting “Shiny” apps questions should be asked such as how many concurrent users there should be able to interact with the app, whether the app should be hosted in-house or outsourced( cloud infrastructure vendors). Consideration should also be taken on topics such as the total expenses, authentication an authorization capabilities and overall security.
Localhost R Studio Desktop
Running Shiny app can be done from a personal computer (i.e a laptop) directly from R Studio Desktop. This is the fastest way to host a Shiny app but it comes with an important flaw. Interaction with the app is limited to one concurrent user due to R’s single threaded nature. It’s an in-house hosting solution, providing no authentication or authorization, no additional expenses and no security in terms of https/ssl. This way of hosting a Shiny app can be utilized for projects’ drafts and mockups presentation.
Shinyapps.io
This is an online service that provides Shiny app hosting and it can be a free or a paid service. Adding an app to this service is particularly simple and can be done directly from the RStudio IDE. It is a free service in the beginning (with limited options and computing resources) [34], but there is a fee if someone wants to use all of the service’s features. The service’s advantages include ease of installation and compliance with security parameters such as encryption and authentication (in the licensed version of the service). It is also possible to scale and support the service’s use. Shinyapps.io is an outsourced way of hosting, enables existence of concurrent users and depending on hosting plan it can provide authentication, authorization and security.
Shiny server opensource
If someone intends to self-host Shiny apps, there is a free and opensource version of the Shiny server that can be used in an operating system. While this version enables the existence of concurrent users(but with limitations), there are disadvantages for production-level applications such absence of built in authentication-authorization options.
Shiny server pro and Rstudio Connect
To address the issues raised above, solutions such as RStudio’s Shiny server pro, a commercial version of Shiny server that provides for more complete control of Shiny application hosting, have been developed (which solves the problems mentioned above).
There is also the “Rstudio Connect” service. Rstudio connect supports enterprise-level hosting of Shiny applications [35], user authentication via options such as LDAP, Google OAuth 2.0, and others, database connections, user management in roles and access rights, and the ability to scale resources for the best possible application operation. This service is available online under a fee by the time this paper was written. So Rstudio connect is an outsourced way of hosting Shiny apps which satisfies scalability, authorization, authentication, security but it comes as a paid service.
Docker and Shiny Proxy
In recent years, it has become clear that the containerization technique is gaining traction in applications that are intended to be used in production rather than in a test environment. Docker is a popular piece of software [20] that harnesses some powerful kernel-level technology. It generates lightweight virtual machines through its images (i.e. preinstalled applications in an operating system) that run within an existing operating system. Unlike the traditional creation of a virtual machine, the creation of a container from a “Docker image” [20] in Docker does not necessitate the allocation-commitment of our system’s computing resources in advance. Furthermore, different containers can communicate with one another, thus providing complete freedom during the development of a service, such as the simultaneous existence of containers for production, testing, research-development, or the use of different software versions (e.g. different containers with different versions of the R language). We can also run many docker containers at the same time using our original operating system, which solves the problem of R’s single-threaded-nature, i.e. the use of the service by a single simultaneous user. Moreover Docker appears with a DevOps’ philosophy suitable for usage in reproducible research.
Figure 1.
Selecting categories in the tab “select and compare data”.
In order to address the shortcomings of Shiny server opensource and allow concurrent usage [20] of Shiny apps and enable authorization features, the Shinyproxy software, which is based in java enterprise, was developed in 2016. It employs mature authentication and certification techniques and can launch multiple Docker containers at the same time, including the installation of the R language and a R Shiny application. It also works with reverse proxies (e.g., Ngnix, Apache) [20] to redirect users to their respective containers as needed. Shiny Proxy also supports load balancing [43] via communication with the Docker API, as well as collaboration with Docker Swarm in cases where scaling [43] number of concurrent users is critical. Furthermore, the data encryption issue also is addressed [20] and SSL certificate application is supported. With this approach, we can have enterprise-level functionality while still using opensource technologies. At the time this paper was written one can find several solutions of hosting Shiny apps with docker and Shinyproxy.
Hosting in cloud environments
Of course, there is also the ability to host a Shiny app into a PaaS (platform as a service) cloud computing environment. Companies like Amazon, Digital ocean etc. provide all necessary components to share your Shiny apps with stakeholders. In addition, the popularity of Shiny apps has led them develop products such as “one-click-installation” droplets that has to do with Shiny hosting. Deployment in Heroku is also popular which is a PaaS suitable for running containerized apps.
4.Application
Demo of a Shiny application in Docker and Shinyproxy
This section presents a trial application that we created to illustrate the whole workflow (development and hosting) in which this research is focused on. In the hosting part of the workflow, Shinyproxy and Docker approach was used as the most proper one for Research and Development uses whilst not being compromised anything in terms of software engineering principals. Code of demo app is available in https://drive.google.com/drive/folders/199UekXOk83rehvlcIQ8ZR_BQvKzD5P_d?usp=sharing (corresponding files are appfinal.R and data.xlsx). At any case in order to successfully run the app please ensure that you’ve downloaded these two files in the same folder of your system.
In order to implement this workflow, first of all we build the shiny app following guidelines mentioned in Section 3.1 of the present manuscript. Next we used a linux ubuntu server 22.04 version in order to deploy the other components that are required in order to implemenent the proposed workflow. Then, docker software and shinyproxy software were also installed in the system. Then, we used the image of openanalytics/r-ver:4.1.3 in order to build the docker image and then running the corresponding docker container while also we used an (.yml) file to provide guidelines to shinyproxy in explain to it how to proceed as a proxy middleware and split each user to a different docker container that contains our app. Next, we installed upon them a Nginx http web server to operate as a proxy to our inner infrastructure. In order to provide more security to our workflow at the top of it we also installed an SSL certificate from Let’s Encrypt service [36].
Figure 2.
Filtering data of a column in the tab ”select and compare data”.
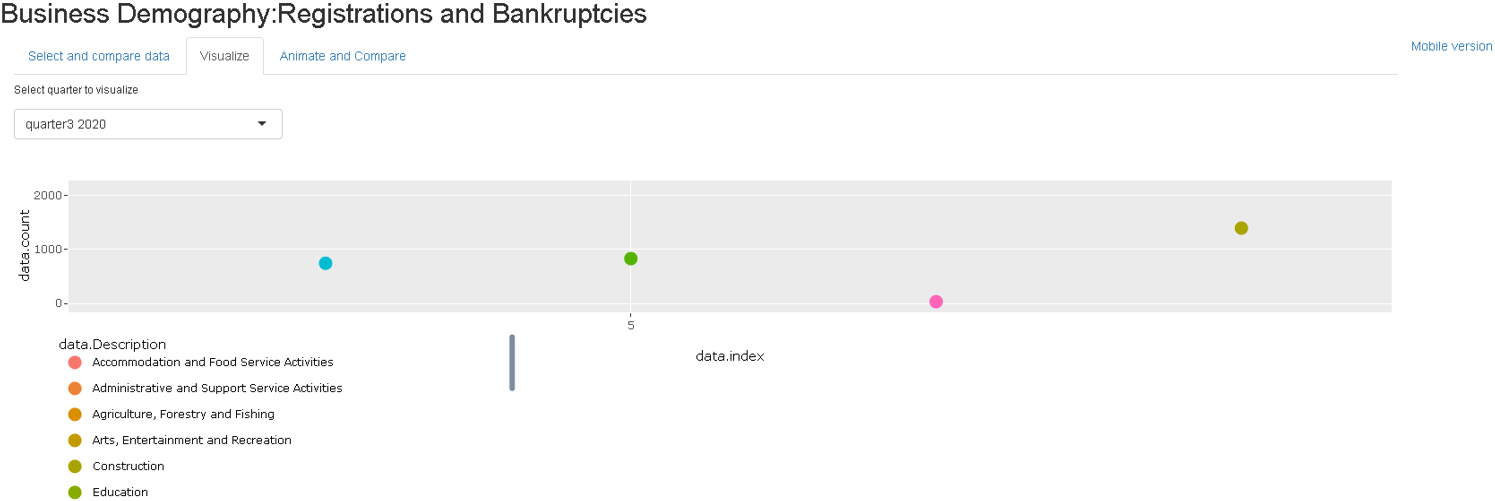
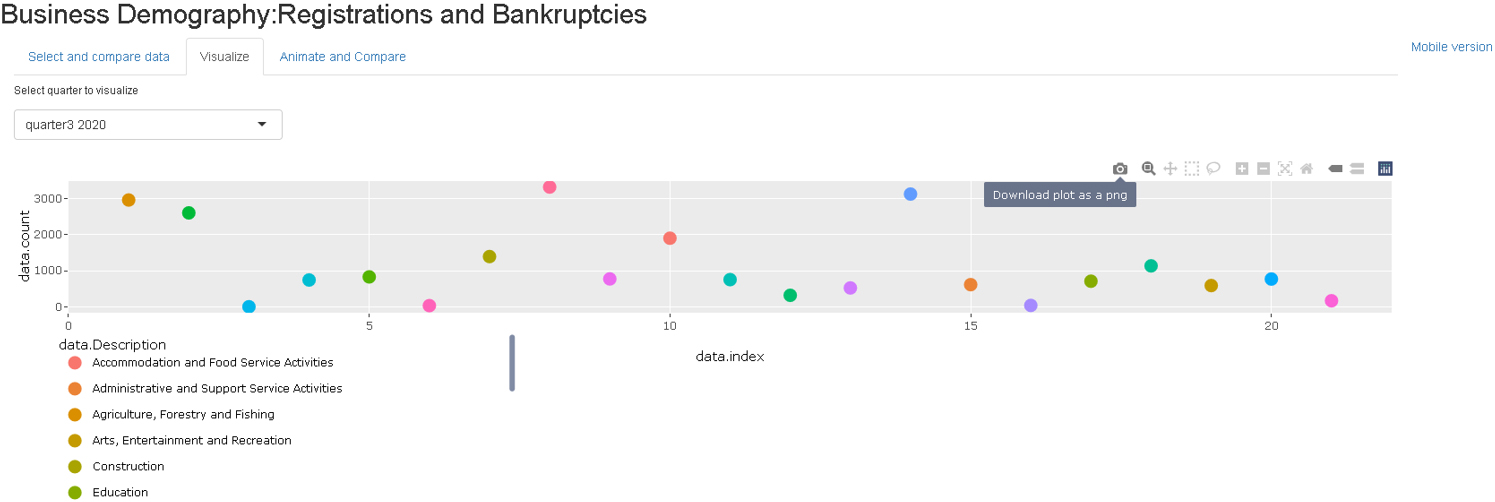
Figure 3.
Visualizing enterprises’ information by a specified quarter.
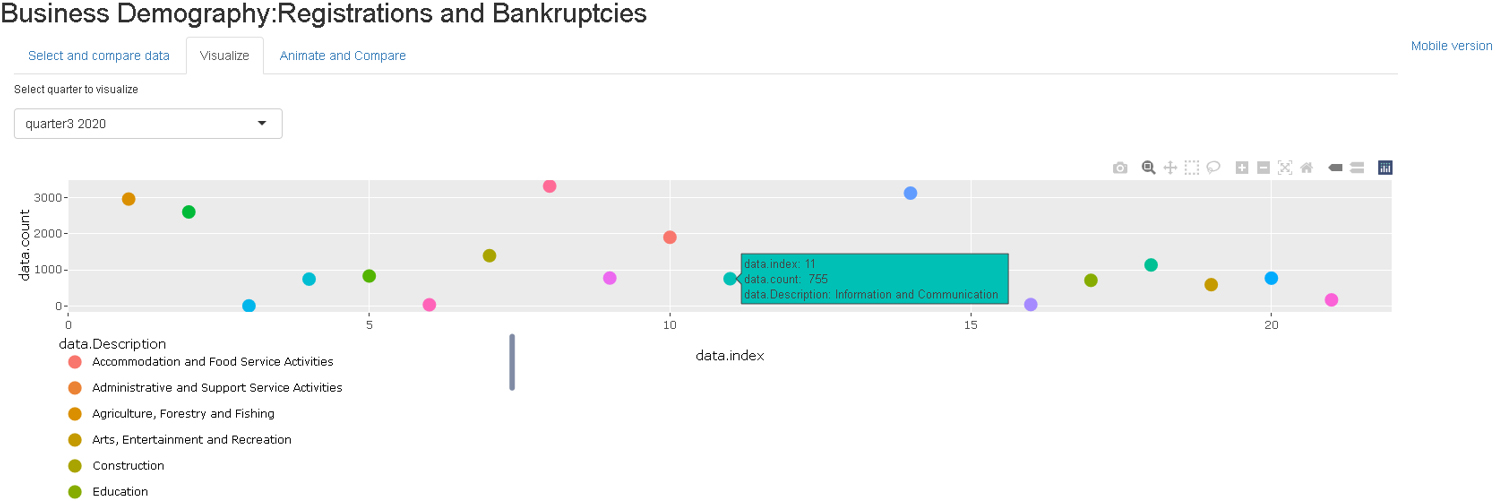
Figure 4.
Magnified sub area with its points.
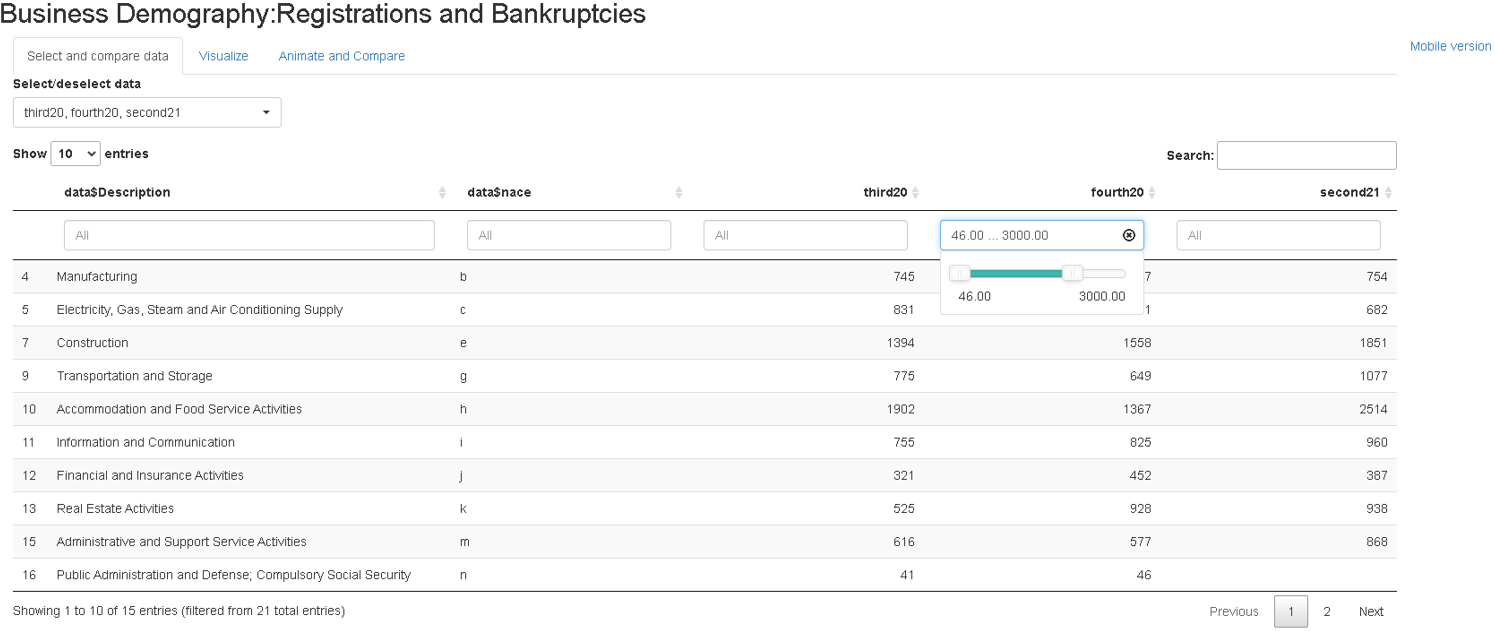
Figure 5.
Taking snapshot of the diagram.
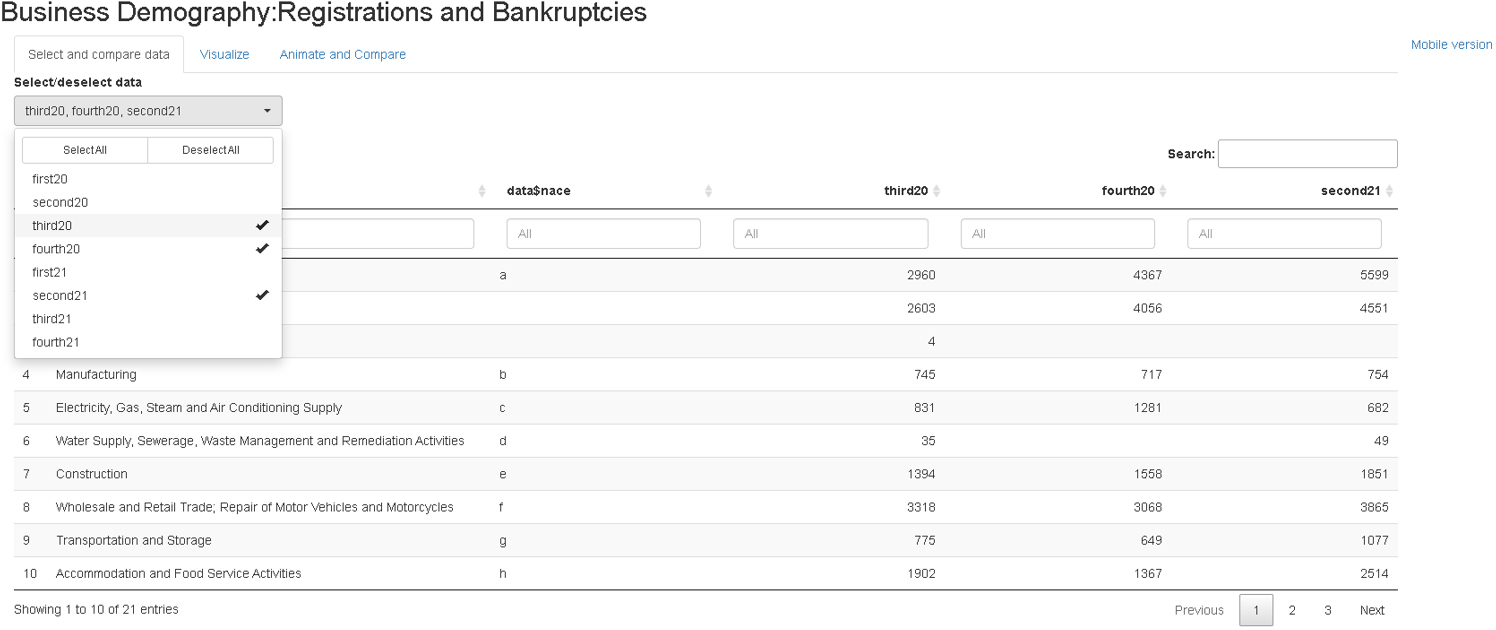
Figure 6.
Selecting quarters and starting animation.
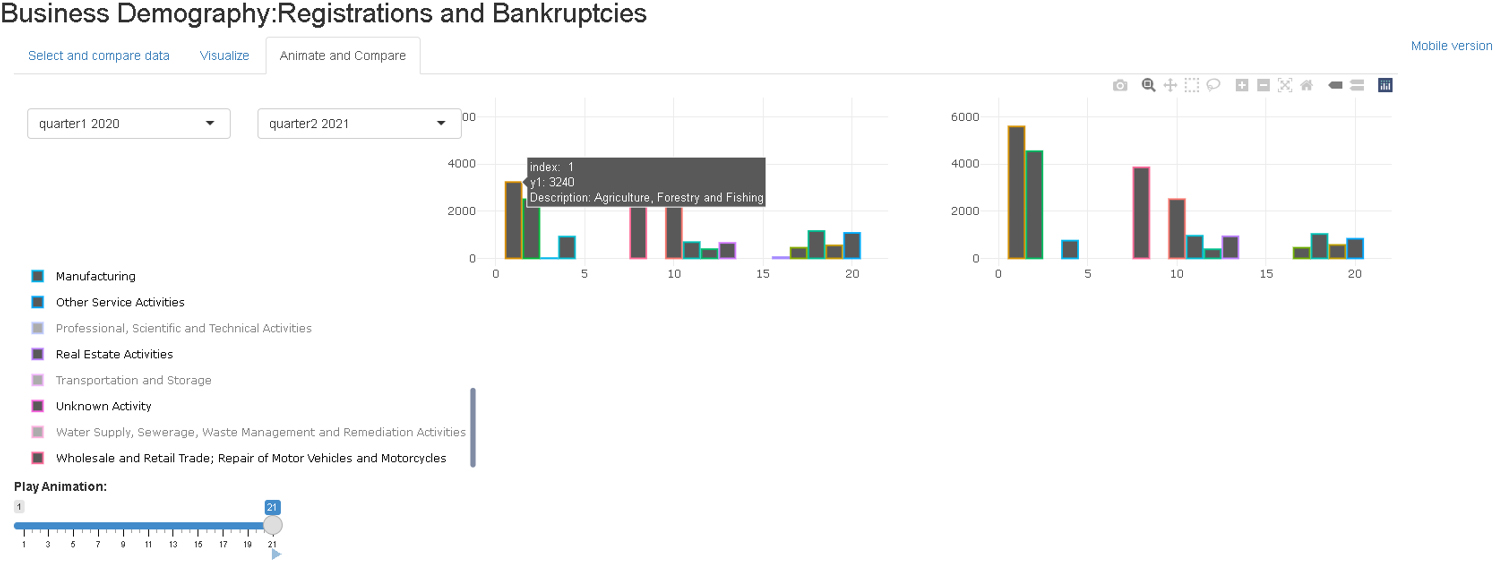
Figure 7.
Selecting specified number of categories.
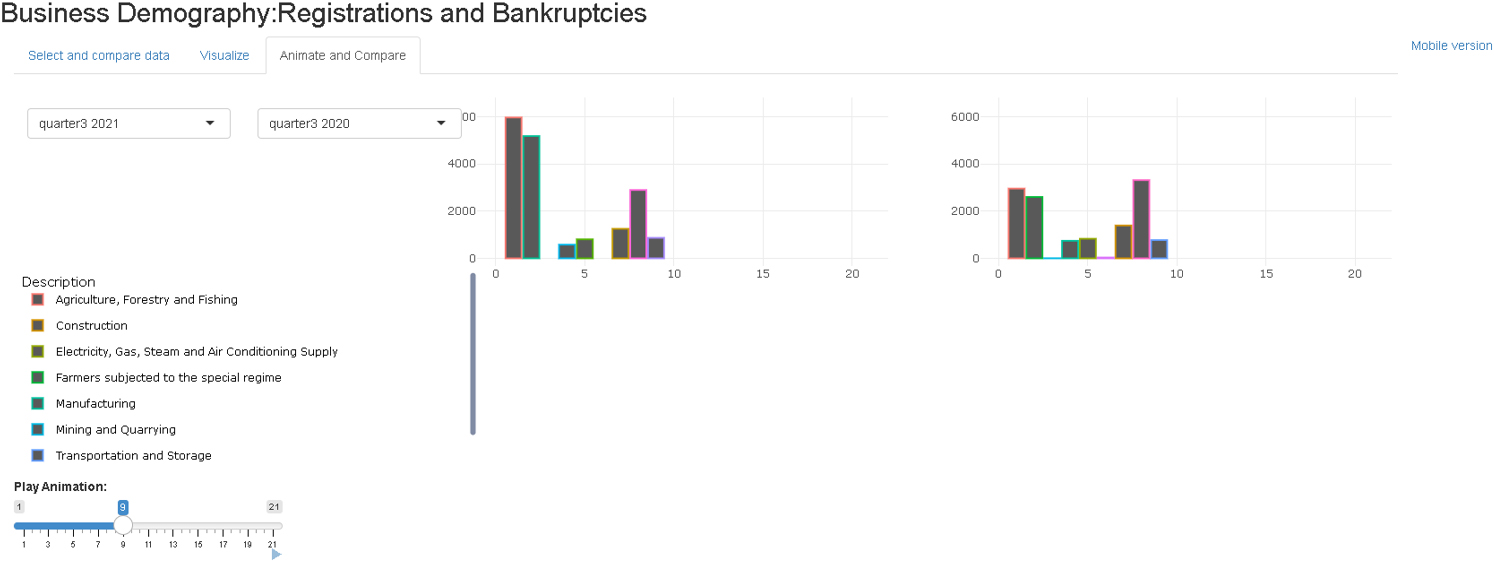
Figure 8.
Selecting specified categories.
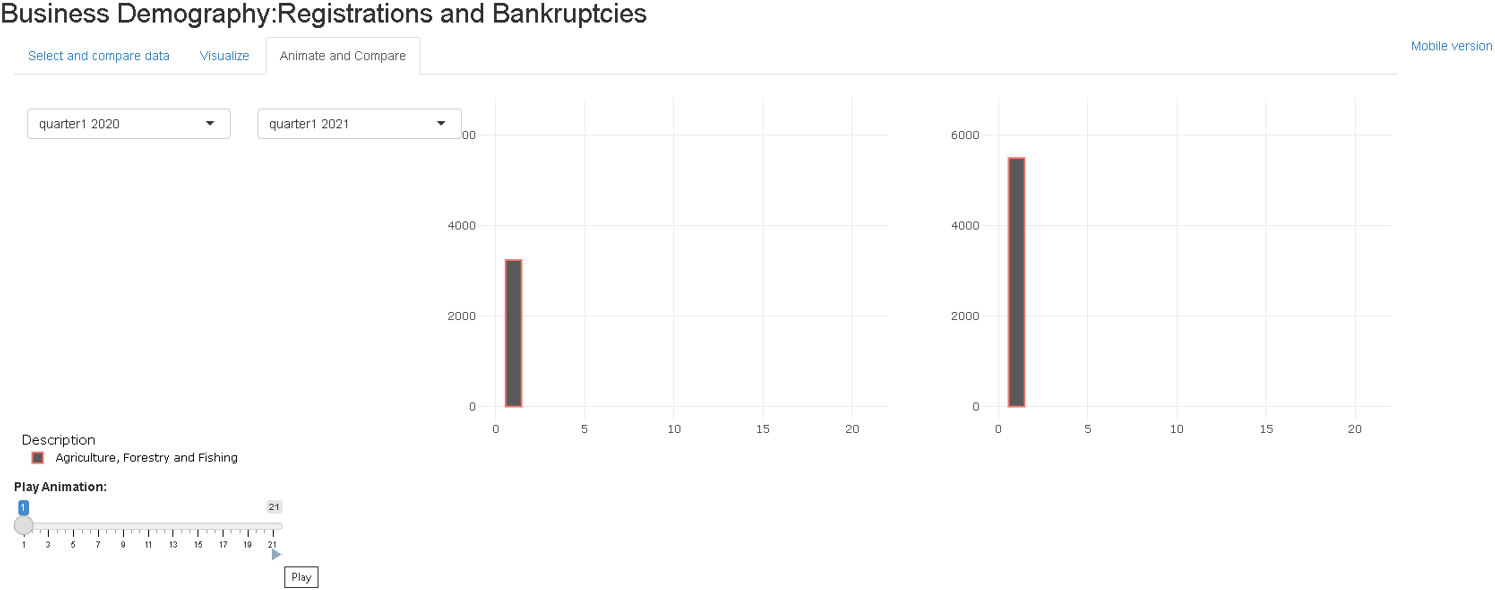
The application concerns business demography data based on the Statistical Business Register and allows the user to track enterprises’ population changes by sector of activity and time period (per quarter). The app has the predefined layout of a Shiny app with panels and tabsets. There is also a link “for mobile version” because shinyproxy, even though shiny app is build on bootstrap framework that is already in responsive mode, puts apps in frames that eliminates at first place the existence of bootstrap CSS framework. The application contains pre-installed data that the user can process. After the initial connection to the system the user can choose between 3 different options. The first is located in the “select and compare” tab and enables the user to select one or more quarters to dynamically create a table to compare the results. The panel can be filtered so that the user can focus on the information desired for him. These are shown in Figs 1 and 2. The second option of the application is for the user to select the “visualize” tab. In this tab, the user can select a specific quarter from the available quarters of the example and receive an interactive graph in which by moving the pointer of his cursor he can see additional information about each point, such as the coordinates of the point in the scatter chart that is dynamically generated on the screen. The same diagram allows the user to use his cursor to select subareas of the chart and enlarge the information corresponding to them. Also through the options of the chart he can take a snapshot and save it to his computer as an image file. This diagram as well as the rest of the application’s visualizations are implemented with the plotly library [20]. The above are presented in Figs 3–5. Finally, the user can select the “animate and compare” tab in which the user can select quarters from the corresponding dropdown menus to compare them in an animated way. To launch the animation, it is enough for the user to press the relevant “play” icon located on the “play animation” slider. In this way, it will launch the animation which in each frame adds the number of businesses of a new category of businesses. The animation can be discontinued at any time and act as a selector to display a certain number of categories and view the corresponding data for their businesses. In addition, the user by clicking with his mouse pointer on one or more categories can isolate the subset of the categories for which he wishes to receive the corresponding data for their businesses. These can be seen in Figs 6–8.
So with the three different options, the application presents our data at the same time as either a dynamic interactive whiteboard, or as a dynamic interactive graph, or as a dynamic interactive animation.
For the creation of the app we used a number of R libraries [24, 28, 37, 38, 39, 40].
You can also find a working version of the above app using the Docker and Shinyproxy approach at: https://experimental.statistics.gr.
5.Conclusions
Web apps in R programming through the “Shiny” package has gained over the recent years strong popularity while also attention on how production level apps could be generated from it has been paid.
The use of web applications that allow a user to have tailor-made access on statistics with an interactive dashboard containing the results of a statistical survey can be a disseminating complement and increase public awareness of National Statistical Institutes’ (NSIs) surveys. Consequently, improving communication and dissemination of statistical data can improve the relevance of services provided to citizens/stakeholders. In this paper, we reviewed specific aspects of the literature concerning “Shiny” apps and demonstrated how to create and host applications with the R programming language. We presented how a non-expert in web application programming can create an original application that displays the results of a survey by defining the basic features and functions of this library. We then researched and compared various methods for hosting such an application depending on the factors expenses, security, hosting type, authentication and authorization. All the above used the most updated sources at the time this paper was written. We also implemented an opensource pipeline based on Linux Ubuntu server, Docker software and Shinyproxy software to host our containerized application according to what we have mentioned on “hosting a shiny app” section. Shiny however has its own limitations in software engineering since R is not a fast language by nature but on other hand users can be extremely benefited from the R’s versatile environment with loads of sophisticated statistical analysis methods. In our next research steps, we will investigate how this pipeline can be enriched with the addition of an API functionality so that users can ask for data from a set of different data formats (e.g spreadsheets, JSON etc.). Finally, we will keep evolving our apps in a packaged environment though packages such as golem [41] and rhino [42].
References
[1] | Wang L, Whitman Z, Olmsted-Hawala E, Chestnut R. Integrating Usability Testing into the Designand Development of Data Dissemination Platform for US Official Statistics. In: Extended Abstracts of the 2021 CHI Conference on Human Factors in Computing Systems. (2021) . pp. 1–6. |
[2] | Hudec M, Bednárová E, Holzinger A. Augmenting statistical data dissemination by short quantified sentences of natural language. Journal of Official Statistics [Internet]. (2018) Dec 1 [cited 2022 Apr 11]; 34: (4): 981–1010. Available from: https://sciendo.com/article/10.2478/jos-2018-0048. |
[3] | Dissemination and communication |
[4] | Radermacher WJ. Official statistics in the era of big data opportunities and threats. International Journal of Data Science and Analytics. (2018) ; 6: (3): 225–31. |
[5] | Sæbø HV, Holmberg A. Beyond code of practice: New quality challenges in official statistics. Statistical Journal of the IAOS [Internet]. (2019) Jan 1 [cited 2022 Jul 28]; 35: (2): 171–8. Available from: https://content.iospress.com/articles/statistical-journal-of-the-iaos/sji180463. |
[6] | Glavan IR, Mirica A, Firtescu BN. The use of social media for communication in official statistics at european level. Romanian Statistical Review [Internet]. (2016) [cited 2022 Apr 11]; 64: (4): 37–48. Available from: https://ideas.repec.org/a/rsr/journl/v64y2016i4p37-48.html. |
[7] | De Broe S, ten Bosch O, Daas P, Buiten G, Laevens B, Kroese B. The need for timely official statistics. The COVID-19 pandemic as a driver for innovation. Statistical Journal of the IAOS. (2021) ; (Preprint): 1–7. |
[8] | Tebé C, Valls J, Satorra P, Tobías A. COVID19-world: A shiny application to perform comprehensive country-specific data visualization for SARS-CoV-2 epidemic. BMC Med Res Methodol [Internet]. (2020) Sep 21 [cited 2022 Aug 7]; 20: (1): 235. Available from: doi: 10.1186/s12874-020-01121-9. |
[9] | Elvers E, Lindén H. Quality concept for official statistics. Wiley StatsRef: Statistics Reference Online. (2014) ; 1–13. |
[10] | Potter G, Wong J, Alcaraz I, Chi P, others. Web application teaching tools for statistics using R and shiny. Technology Innovations in Statistics Education. (2016) ; 9: (1). |
[11] | Wang SL, Zhang AY, Messer S, Wiesner A, Pearl DK. Student-developed shiny applications for teaching statistics. Journal of Statistics and Data Science Education [Internet]. (2021) Sep 2 [cited 2022 Jul 27]; 29: (3): 218–27. Available from: doi: 10.1080/26939169.2021.1995545. |
[12] | González JA, López M, Cobo E, Cortés J. Assessing Shiny apps through student feedback: Recommendations from a qualitative study. Computer Applications in Engineering Education [Internet]. (2018) [cited 2022 Jul 27]; 26: (5): 1813–24. Available from: doi: 10.1002/cae.21932. |
[13] | Forbes S, Harraway J. From face-to-face teaching of official statistics to e-learning for the Sustainable Development Goals. Statistical Journal of the IAOS [Internet]. (2021) Jan 1 [cited 2022 Jul 27]; 37: (3): 853–72. Available from: https://content.iospress.com/articles/statistical-journal-of-the-iaos/sji210811. |
[14] | Siregar E, Prawisudatama A. LiteRate: A Shiny R app for improving data literacy in Indonesia. Statistical Journal of the IAOS [Internet]. (2020) Jan 1 [cited 2022 Aug 5]; 36: (4): 905–13. Available from: https://content.iospress.com/articles/statistical-journal-of-the-iaos/sji200755. |
[15] | Fawcett L. Using interactive shiny applications to facilitate research-informed learning and teaching. Journal of Statistics Education [Internet]. (2018) Jan 2 [cited 2022 Jul 27]; 26: (1): 2–16. Available from: doi: 10.1080/10691898.2018.1436999. |
[16] | Porciani L, Rondinella T. Teaching official statistics in universities. Recommendations from a direct experience. Statistical Journal of the IAOS [Internet]. (2019) Jan 1 [cited 2022 Jul 27]; 35: (3): 425–33. Available from: https://content.iospress.com/articles/statistical-journal-of-the-iaos/sji190494. |
[17] | Kitchin R. The opportunities, challenges and risks of big data for official statistics. Statistical Journal of the IAOS [Internet]. (2015) Jan 1 [cited 2022 Jul 27]; 31: (3): 471–81. Available from: https://content.iospress.com/articles/statistical-journal-of-the-iaos/sji906. |
[18] | Radermacher WJ. Official statistics in the era of big data opportunities and threats. International Journal of Data Science and Analytics. (2018) ; 6: (3): 225–31. |
[19] | Guidotti E, Ardia D. COVID-19 data hub. Journal of Open Source Software. (2020) ; 5: (51): 2376. |
[20] | Li Y. Towards fast prototyping of cloud-based environmental decision support systems for environmental scientists using R Shiny and Docker. Environmental Modelling & Software. (2020) ; 132: : 104797. |
[21] | How to Pick the Right Hosting Option for Your Shiny App [Internet]. Hosting Data Apps. (2021) [cited 2022 Aug 6]. Available from: https://hosting.analythium.io/how-to-pick-the-right-hosting-option-for-your-shiny-app/. |
[22] | Beeley C. Hands-On Dashboard Development with Shiny: A practical guide to building effective web applications and dashboards. Packt Publishing Ltd; (2018) . |
[23] | Stankowski S, Nadeem A, Ravinet M. The speciation survey app: an interactive dashboard for exploring the results of the online survey. Authorea Preprints. (2022) . |
[24] | Chang W, Cheng J, Allaire J, Xie Y, McPherson J. Package ‘shiny.’ See http://citeseerx ist psu edu/viewdoc/download. (2015) . |
[25] | Wickham H. Mastering shiny. O’Reilly Media, Inc.; (2021) . |
[26] | Sievert C. Interactive web-based data visualization with R, plotly, and shiny [Internet]. [cited 2022 Aug 7]. Available from: https://plotly-r.com/. |
[27] | Shiny Dashboard [Internet]. [cited 2022 Aug 6]. Available from: https://rstudio.github.io/shinydashboard/. |
[28] | shinyWidgets [Internet]. [cited 2022 Aug 6]. Available from: http://shinyapps.dreamrs.fr/shinyWidgets/. |
[29] | Baldry A. designer: “Shiny” UI Prototype Builder [Internet]. (2022) [cited 2022 Aug 5]. Available from: https://CRAN.R-project.org/package=designer. |
[30] | Build and Modify your Shiny UI, visually [Internet]. [cited 2022 Aug 5]. Available from: https://rstudio.github.io/shinyuieditor/. |
[31] | Rodriguez JC. ShinyWYSIWYG [Internet]. (2022) [cited 2022 Aug 5]. Available from: https://github.com/jcrodriguez1989/shinyWYSIWYG. |
[32] | Attali [aut D, cre. shinyjs: Easily Improve the User Experience of Your Shiny Apps in Seconds [Internet]. (2021) [cited 2022 Aug 6]. Available from: https://CRAN.R-project.org/package=shinyjs. |
[33] | Using shiny with flexdashboard [Internet]. [cited 2022 Aug 6]. Available from: https://rstudio.github.io/flexdashboard/articles/shiny.html. |
[34] | Santangelo AP, Solovey G. Running Online Behavioral Experiments Using R: Implementation of a Response-Time Decision Making Task as an R-Shiny App. J Cogn [Internet]. [cited 2022 Aug 6]; 5: (1): 9. Available from: https://www.ncbi.nlm.nih.gov/pmc/articles/PMC8740653/. |
[35] | Aravamuthan S, Reyes JFM, Dopfer D. Real-time estimation and forecasting of COVID-19 cases and hospitalizations in wisconsin HERC regions for public health decision making processes. International Journal of Infectious Diseases [Internet]. (2022) Mar 1 [cited 2022 Jul 28]; 116: : S28–9. Available from: https://www.sciencedirect.com/science/article/pii/S1201971221009607. |
[36] | Aas J, Barnes R, Case B, Durumeric Z, Eckersley P, Flores-López A, et al. Let’s Encrypt: an automated certificate authority to encrypt the entire web. In: Proceedings of the 2019 ACM SIGSAC Conference on Computer and Communications Security. (2019) . pp. 2473–87. |
[37] | Chang W, Park T, Dziedzic L, Willis N, McInerney M. shinythemes: Themes for Shiny. R package version. (2018) ; 1: (2). |
[38] | Xie Y, Cheng J, Tan X. DT: a wrapper of the JavaScript library ‘DataTables.’ R package version 04. (2018) . |
[39] | Huntington-Klein N. vtable: Variable Table for Variable Documentation [Internet]. (2022) [cited 2022 Aug 7]. Available from: https://CRAN.R-project.org/package=vtable. |
[40] | Tang Y. Autoplotly: An R package for automatic generation of interactive visualizations for statistical results. Journal of Open Source Software. (2018) ; 3: (24): 657. |
[41] | Fay C, Rochette S, Guyader V, Girard C. Engineering Production-Grade Shiny Apps. Chapman and Hall/CRC; (2021) . |
[42] | rhino: A Framework for Enterprise Shiny Applications [Internet]. Available from: https://cran.r-project.org/web/packages/rhino/index.html. |
[43] | Marathe N, Gandhi A, Shah JM. Docker swarm and kubernetes in cloud computing environment. In: 2019 3rd International Conference on Trends in Electronics and Informatics (ICOEI). IEEE; (2019) . pp. 179–184. |


