
Micro data linking: Addressing new emerging topics without increasing the respondent burden
Abstract
Micro data linking (MDL) has become an important cornerstone in the production of new statistical insights. MDL is now widely acknowledged as a strategic activity to avoid increasing the respondent burden when meeting new user demands on e.g. globalisation. MDL is a strong method in combining micro data on individual entities such as enterprises, people or in a combination of both (Linked Employer-Employee Data). MDL is one of the most powerful methods to answer urgent questions on emerging policy or research topics such as the interconnectedness of the economies and its consequences for jobs, income and growth. Not only for national purposes, where economic behavior and dynamics by enterprises can be expressed in terms of job dynamics, income and welfare for its citizens, but also from an international perspective where consistent and coherent indicators play an important role. Firstly, the article addresses the central role of the Business Register for any MDL approach related to business statistics; secondly the current official statistics based on MDL such as Trade by Enterprise Characteristics (TEC) are described. Thirdly, the most common use of MDL in terms of producing experimental statistics are described, including linked employer-employee data (LEED).
1.Introduction
Micro data linking, also sometimes called data fusion at micro level, has become an important cornerstone in the production of new statistical insights, both for national and international purposes. MDL is now widely acknowledged as a strategic activity for both NSIs and international statistical organisations to avoid increasing the respondent burden when meeting new user demands on e.g. globalisation. Micro Data Linking (in short MDL) is a strong method in combining micro data on individual entities such as enterprises, people or a combination of both (Linked Employer-Employee Data).
MDL has become one of the most powerful methods to respond in a timely manner to urgent questions on emerging policy or research topics such as the interconnectedness of economies and its consequences for jobs, income and growth. MDL provides an opportunity to create new information and to develop new statistics and indicators both with existing data sets and indeed, new data collections. A further advantage of MDL is the possibility of producing tailor-made statistics with a higher degree of granularity than is typically the case in normal statistical production. Not only for national purposes, where economic behavior and dynamics by enterprises can be expressed in terms of job dynamics, income and welfare for its citizens [1, 2], but also from an international perspective where consistent and coherent macroeconomic indicators play an important role in international relations between nations [3].
It all starts with not only having the statistical infrastructure such as a Business or Population Register containing unique identification numbers in place. It also requires the technical means and abilities to link all kinds of data at the level of the entities under study (whether an enterprise, enterprise groups and other legal constructs, or even individuals). Finally, a mandate within society to match detailed information at micro level for statistical purposes is a prerequisite but as privacy issues play an important role in many societies such a mandate is not trivial. Having well defined mandates for NSIs, and at the same time the possibility to work in a centralized manner (not necessarily limited to the central statistical office, but also including co-operation between central banks and the statistical office) is an important precondition for MDL.
A recent Eurostat survey from 2020 among the business statistics departments of the European na-tional statistical institutes showed that 17 institutes out of 24 had MDL in their statistical toolbox for at least 10 years; indicating that the method is relatively well established for specific purposes across the EU [4]. The three most frequently mentioned purposes for utilizing MDL were: no additional respondent burden when producing new statistical evidence; and closely related, the issue of delivering policy relevant data on new emerging areas; and the internal purpose of improving the data quality and consistency across different statistics.
This article addresses the use of MDL as a method for producing statistical output and not the use of MDL for validation purposes as part of the permanent statistical production process, including profiling purposes. Firstly, the article will address the central role of the Business Register for any MDL approach related to business statistics; secondly, the current permanent statistical outputs such as Trade by Enterprise Characteristics (TEC) are described. Thirdly, the most common uses of MDL in terms of producing experimental statistics are described, including linked employer-employee data (LEED), and, finally, the road ahead is addressed.
2.Infrastructure: The importance of the Statistical Business Register
The Eurostat survey focused on the use of business statistics as input for MDL and the five most frequently used statistical registers were: Statistical Business Register, Structural Business Statistics, Business Demography, Foreign Affilliates Statistics (FATS) and International Trade in Goods Statistics (Eurostat, 2020). This list reflects the policy interest in Europe for issues such as globalisation and international trade, including Global Value Chains, entrepreneurship, job creation and productivity as new statistical evidence on these topics requires combining variables from different statistical registers.
The Statistical Business Registers (SBR) are the backbone of the production of business statistics and consequently also for carrying out MDL. Actually, the existence of a SBR can be seen as a precondition for carrying out MDL. In most countries the SBR holds a limited number of variables such as unique id number, industry code, information about location and type of ownership, employment size class and entry and exit dates. The SBR will normally hold this information about enterprises, legal units and local units, as these variables are needed to identify the populations in question and to draw the survey samples needed for the production for specific surveys.
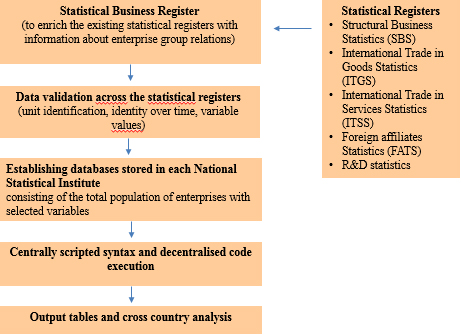
With the SBR holding unique identification numbers for each unit as the focal point, it is possible to link variables from different statistical registers which are not matched in the normal production of statistics, see Fig. 1. In principle, it is possible to match all business statistics at micro level if the units are identified by a unique identification number but in practice, MDL occurs using a variety of linking variables across domains such as structural business stastistics, international trade in goods or services statistics, innovation statistics or statistics on ICT usage by enterprises.
Figure 1.
Database infrastructure: Statistical registers in the harmonised databases stored in each national statistical institute. Source: Nielsen et al. (2019).
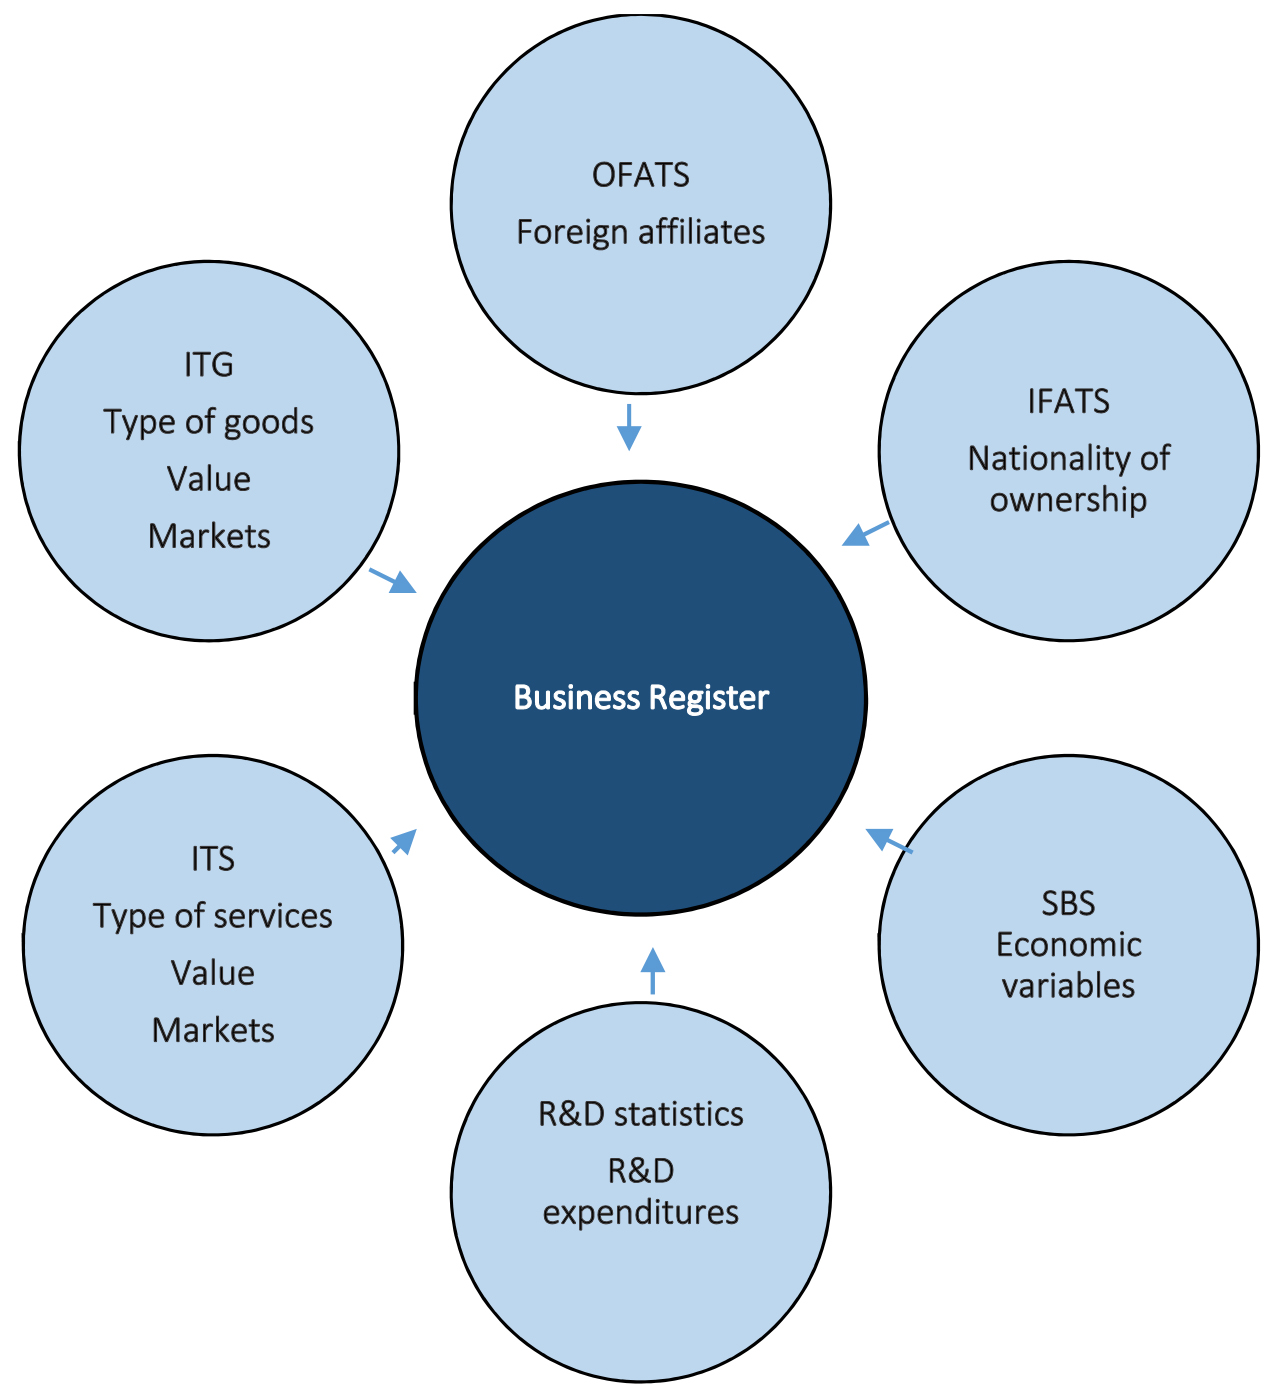
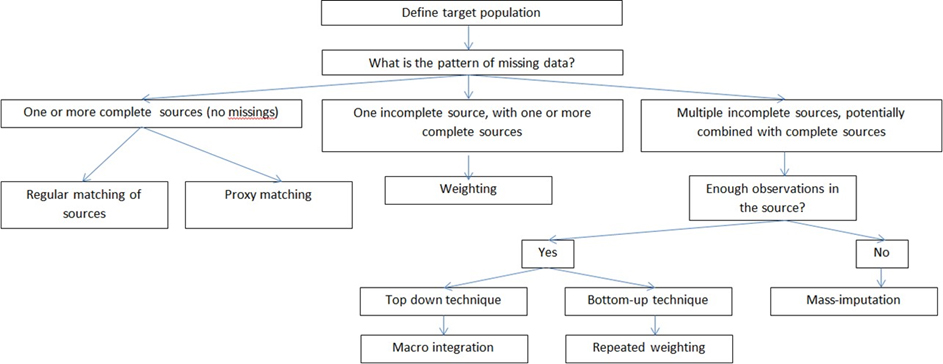
Figure 2.
Decision tree on adjusting and correcting missing data. Source: Boonstra (2015).
3.Validation and imputation
It is important to ensure that linked micro datasets are extrapolated to the total population of enterprises in order to be able to generalize the results at the total population level. Linked datasets miss many observations because some of the linked micro datasets are based on sample surveys. Other reasons for missing data are unit non-response, item non-response, inactive units and under-coverage of an administrative source, e.g. due to ineligibility of certain sub-populations or the use of thresholds. Some variables are completely observed, e.g. activity code and size-class, as they are usually available for all statistical units in the business registers. But for most variables some values are missing, and often a variable is only observed for a small fraction of the total population. This leads to many questions on how to adjust for these issues.
There are different ways of adjusting and correcting for missing data [5] of which weighting, reweighting and imputation are the main strategies [6, 7]. The patterns of missing variables (‘missingness’), availability of auxiliary variables, consistency requirements, level of detail in the analysis versus the amount of data, and the complexity of the method are the main criteria that may be used to discriminate between different methods. See Fig. 2.
De Waal distinguishes between weighting-based approaches, imputation-based approaches and macro-integration. Weighting, repeated weighting, imputation and macro-integration are the most commonly used methods for adjusting and generalizing official statistics. For a comprehensive overview of these techniques [8, 5].
Weighting is a technique to compute population estimates for a set of variables that have been observed in a survey sample. Often an initial imputation step is carried out to fill in (a limited amount of) item non-response. The weighting model contains variables related to the missingness and to the variables of interest in order to reduce bias and variance. These auxiliary variables must be available for all units in the target population. For sample surveys, missingness by design is accounted for by assigning initial weights as inverse sampling probabilities. The same weighting model, and therefore the same weights are applied to all the variables in the rectangular dataset to obtain population estimates. The most popular weighting technique is linear weighting [9].
Repeated weighting (RW) is a technique developed by Statistics Netherlands to solve the problem of inconsistencies among tables of estimates based on multiple data sources [10], and initially developed to estimate tables of cross-classified counts of persons based on multiple social surveys linked to a population registration [11]. When two (or more) survey data sets, based on different sampling schemes are combined and linked with a population register, there will be blocks of data missing and blocks with overlap. Large enterprises are typically completely observed in take-all strata, but this also illustrates that such overlaps can be highly selective, especially with regard to size-class.
Repeated weighing involves three steps. In the first step initial marginal distributions of the separate data sets are estimated using standard weighting procedures. The second step estimates the marginal distribution of the data in the overlap, also using standard weighting procedures. However, the marginals in the resulting table will not agree with those already computed, since the latter are based on more information (more observations). To correct this, the table of initial estimates is re-calibrated to match the previously computed marginals by reweighting the data from the overlap, using the previously computed marginals as control totals. This results in adjusted estimates for the cross table whose marginals agree with those based on the separate data sources.
Both weighting and repeated weighting are relatively simple methods, which maintain micro-data consistency. Where weighting is only applicable for analyses based on a single data source linked to a population frame, reweighting can be expanded to two or more data sets. In both cases the availability of a central population register is necessary. Both methods are generally unsuitable for estimation for small sub-populations.
Imputation is different from weighting approaches. Instead of assigning weights to units for which a set of variables is observed, the unobserved values of the variables are filled in. Imputation is mainly used to fill in item non-response in surveys. Imputing values that are missing by design is called mass-imputation [12]. There are different imputation techniques such as hot deck procedures, which selects from observed values, or prediction procedures based on explicit models that relate the variable of interest to auxiliary variables (predictors) [6].
Multivariate imputation, also known as iterative imputation uses the so-called chained equation approach. One starts with initial imputations of all variables using a hot-deck method, or the incorporation of fully observed variables from the business register. Once initial imputations are available, the imputation models also incorporate imputed variables. Each variable is imputed in turn, conditional on all other variables, by using imputation models that incorporate these other variables only when these variables are related to the variable to be imputed. This sequence of imputations is iterated until the imputations converge [13, 14].
Imputation has undoubtedly benefits in terms of optimal use of information within the linked data, and its flexibility in modelling. It is suitable for estimation for small sub-populations, but on the other hand imputation is complex and time consuming (specifying and checking of models). Especially (mass-)imputed datasets can easily be abused by analyzing relationships that were not specified explicitly in the imputation models.
Macro-integration is a technique to reconcile sets of estimates obtained from separate data sources into a consistent set of estimates [15]. Besides a set of initial point estimates, Macro-integration uses not only an initial set of point estimates but also measures of uncertainty, e.g. standard errors, accompanying the initial point estimates. These uncertainties determine the relative sizes of the adjustments that are made to the initial estimates. Macro-integration is efficient in reconciling large sets of tables simultaneously and less computationally demanding, which may result in a better use of information than is possible with repeated weighting or mass imputation. Unless additional modelling is used, macro-integration is not suitable for estimation of small sub-population.
4.Official business statistics based on MDL
The use of MDL for official statistics in the field of business statistics was triggered by national discussions around the the needs for more detailed and integrated statistics by users that could be met without increasing response burdens. Traditionally, statistics on international trade, for example, focused on partner country and products traded, but did not have any explicit information on the characteristics of the trading enterprises. It was recognised that coherent compilation of trade statistics by enterprise characteristics required micro data linkage, especially between trade registers and business registers. This led, amongst others to the launch of the European Trade by Enterprise Characteristics (TEC) pilots in 2002, 2005 and 2006 in order to obtain information on the profiles of European traders using a harmonised methodology, classification and breakdown [16].
The main objective of the trade in goods statistics by enterprise characteristics (TEC) is to bridge two major statistical domains which have traditionally been compiled and used separately, structural business statistics (SBS) and the international trade in goods statistics (ITGS). Specifically, this new domain was created to answer questions such as:
• What kind of businesses are behind the trade flows of goods?
• What is the contribution of a particular activity sector to trade?
• What is the share of small and medium-sized enterprises to total trade?
• What is the share of enterprises that trade with a certain partner country and the amount of trade value they account for?
Figure 3.
Trade in goods by exporter characteristics, by enterprise employment size and number of partner countries Canada 2010–2019. Source: Statistics Canada. Table 12-10-0091-01 Trade in goods by exporter characteristics, by enterprise employment size and number of partner countries.
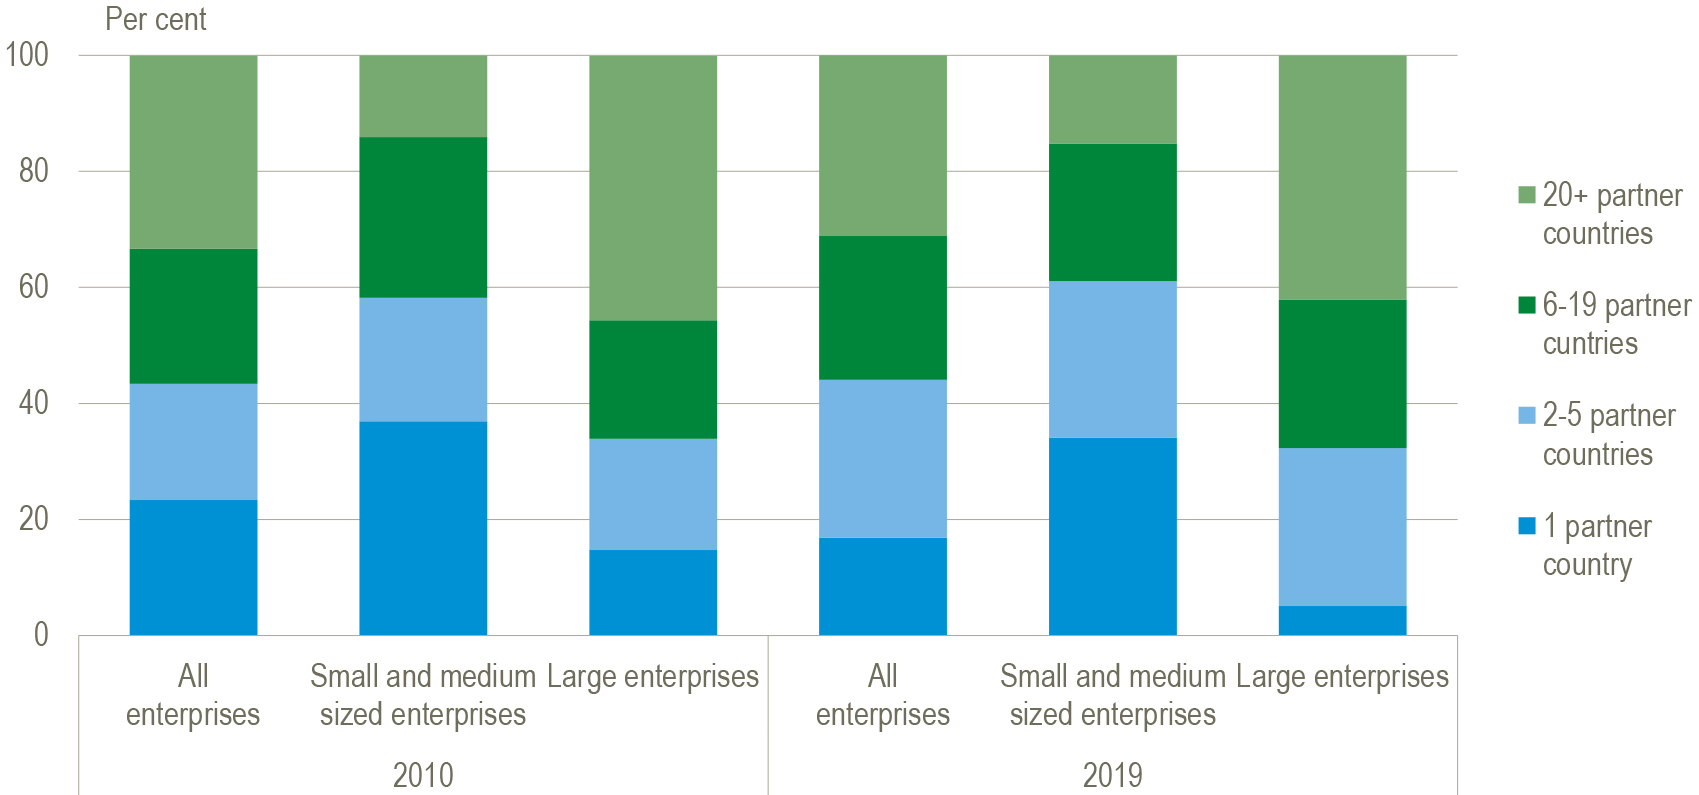
For this purpose, trade in goods between countries is broken down by economic activity, size-class of enterprises, trade concentration, geographical diversification and products traded. Standardised annual information on TEC in the European Union is available from 2009 onwards. The information is used to carry out more sophisticated kinds of analysis, e.g. to evaluate the role of European companies in the context of globalization or to assess the impact of international trade in goods on employment, production and value added (e.g. through the developemnt of Extended Supply-Use Tables that can be integrated into imrproved measures of Trade in Value Added) [17].
Trade by Enterprise Characteristics statistics is not only produced by European countries but also by many other (mainly OECD) economies e.g. Statistics Canada. Figure 3 shows that SMEs mainly export to one or a few export markets while large exporting enterprises are truly global by exporting to 20 or more countries.
5.Experimental statistics based on MDL
As data access and data sharing within countries is organized in very different ways, MDL is more complicated to conduct at an international level. In measuring the structure and impact of cross-border activities of enterprises, business statistics compilers often face a dilemma: on the one hand, international organisations and policy makers demands for additional information on the structure, development and impact of global enterprises. On the other hand, budget constraints, reluctance to increase the burden on survey respondents, and national legislation put tight constraints on data access and data sharing for international statistical purposes.
To overcome the constraints and limitations of cross-border micro data access and micro data ex-change, researchers in close cooperation with international organisations (such as UN, OECD, Euro-stat) have developed several approaches [22]. An approach can vary from sharing micro data in a secured environment under strict legal conditions of access, use and publication, or, when sharing micro data is not an option, using an approach called ‘Distributed Micro Data Research’ (DMDR). This approach, based on harmonised national data sets and using the same set ups for analysis and aggregating data, became quite successful in international research on economic and social issues [23, 24, 25].
Technological change, together with investment liberalisation has significantly changed the nature of global trade and production arrangements as firms slice and dice previously (nationally) integrated production processes into global value chains, and thus made countries and enterprises much more interconnected across borders.
Table 1
MDL of business and international trade and accounts at Statistics Canada
| While microdata linking (MDL) has been in place since the early 2000s at Statistics Canada, the sophistication of the infrastructure and the integration of this practice into mainstream Business and Trade Statistics’ and the Macroeconomic Accounts’ compilation is now much more advanced. In the beginning, there was a profile of Canadian exporters [18] which was released simultaneously to the US Census Bureau’s product on US exporters. This product resulted from considerable collaboration between the two countries to ensure that the business requirements behind the Canada-US exchange of import transaction data, to serve as the other country’s exports, could also serve as a key input for the MDL exercise. |
| More recently, in collaboration with policy partners such as Global Affairs Canada and Export Development Canada, Statistics Canada has produced Trade by Enterprise Characteristics (TEC) less than six months after the close of the reference year. This most recent TEC compilation was completed alongside the creation of a Services Trade by Enterprise Characteristics (STEC) dataset under the umbrella of a larger project on developing Globalization measures, including the Activities of multinationals (MNEs) in Canada [19], both under foreign and Canadian control and by immediate and ultimate owner, showing the share of trade by MNEs. TEC in Canada has proved to be a rich and timely database that can and has been leveraged to provide further insights into various topics such as Canada’s role in global supply chains. As one example of how it informs users with relevant and timely info on details of exporters, Statistics Canada published this exploration of exporters in each Canadian province shipments’ to China by Chinese province [20]. |
| These advances have been part of a larger effort at Statistics Canada to create an infrastructure and process flow for MDL analysts. This translated to improved access to datasets prepared to their specifications, which would be held in a repository. These datasets are re-run for each reference period with minimal turnaround, through the development of IT processes implemented in the subject r area, namely divisions within Canada’s Macroeconomic Accounts Branch, which automated the linkage of high-probability records within set parameters (developed using corporate generalized systems such as G-link [21] in collaboration with Statistics Canada business methodologists) and facilitated the manual elements of the compilation. In addition, there was a two-way information exchange as business register experts adapted to a larger role in facilitating register snapshots for MDL purposes, and also facilitated learning by MDL experts on register norms. Statistics Canada’s Business Register also now integrates new profiling information on businesses resulting from these new MDL programs (on traders and multinationals, for example), information that are valuable for other statistics programs and for data users in general. |
| Finally, Statistics Canada has expanded outreach to highlight its data through The Canadian Centre for Data Development and Economic Research (CDER), as well as Research Data Centres in Canadian universities, and the Centre for Special Business Projects, as well as the the creation and testing of a virtual DataLab (vDL) to provide this country’s researchers with secure access to anonymized Statistics Canada’s administrative, integrated, and social and business data. |
| These efforts highlight Statistics Canada’s repository of MDL-ready microdata files, both those for use internally or anonymized for external researchers. It also serves as a means by which to access economists and methodologists with extensive experience in the various aspects of microdata linking in trade and business statistics at Statistics Canada, preparing Canada for further partnerships in new timely data sources for MDL as well as dissemination through the Government of Canada Open Data Portal. |
Table 2
Joint Nordic-OECD project on linking firm level data with macroeconomic statistics
| The Nordic national statistical offices (NSIs) have been among the first to develop a bottom-up, collaborative re |
| To integrate the output derived from the linked Nordic microdata with OECD’s TiVA Inter-Country Input-Output table (ICIO) [26], a number of consecutive steps were taken, involving further data preparation (industry conversions, aggregations) and the alignment of business data to national accounts concepts. Finally, a series of challenges specific to breaking down international trade flows by firm type were addressed. The SAS program for these calculations has been developed by the OECD, and was subsequently sent, accompanied by the relevant conversion tables and the TIVA ICIO, to the Nordic NSIs to run in combination with their pre-prepared tables based on linked microdata. Only the final results were then sent back to the OECD. This highly coordinated research method not only ensured consistency of the results across countries, but also avoided the need for, on the one hand, the Nor |
| The TiVA ICIO follows the practices of the System of National Accounts (SNA), where imports by firms are included as direct imports even if they pass through resident wholesale and retail industries first. In other words, imports of goods by wholesalers and retailers for subsequent sale without any further processing are recorded as imports in the SNA. The same holds for exports of goods that have not been the subject of any further processing by wholesalers and retailers in the linked microdata used in this study, trade is matched to those enterprises that are immediately responsible for imports and exports, including to wholesale and retail firms. To align with national accounts concepts, the export and import values for the wholesale and retail industry as reported in the linked microdata were constrained to the levels reported in in Nordic SUTs (i.e., the ratio of exports (or imports) in total output). The additional trade (on average about half of what was reported) was subsequently distributed to other sectors in a two-stage procedure by first identifying the products involved (using official national Trade by Enterprise Characteristics data) and then proportionately allocating these products to using (importing) or exporting industries and firm types on the basis of information included in the microdata and national SUTs. One of the implications of this adjustment is that in the breakdown of firms by trading status, certain ‘export only’ firms may in fact still import, from a National Accounts perspective, via wholesalers. |
| The purpose of the project was to overcome some of the shortcomings of the current TiVA database by introducing firm-based characteristics to better reflect the heterogeneous nature of GVC integration – including size, e.g. SMEs (dependent and independent); ownership, (i.e. foreign and domestically owned enterprises) and trading status, (i.e. trading and non-trading companies). The report provides new insights on GVC integration and responds directly to the policy questions raised above and many others. |
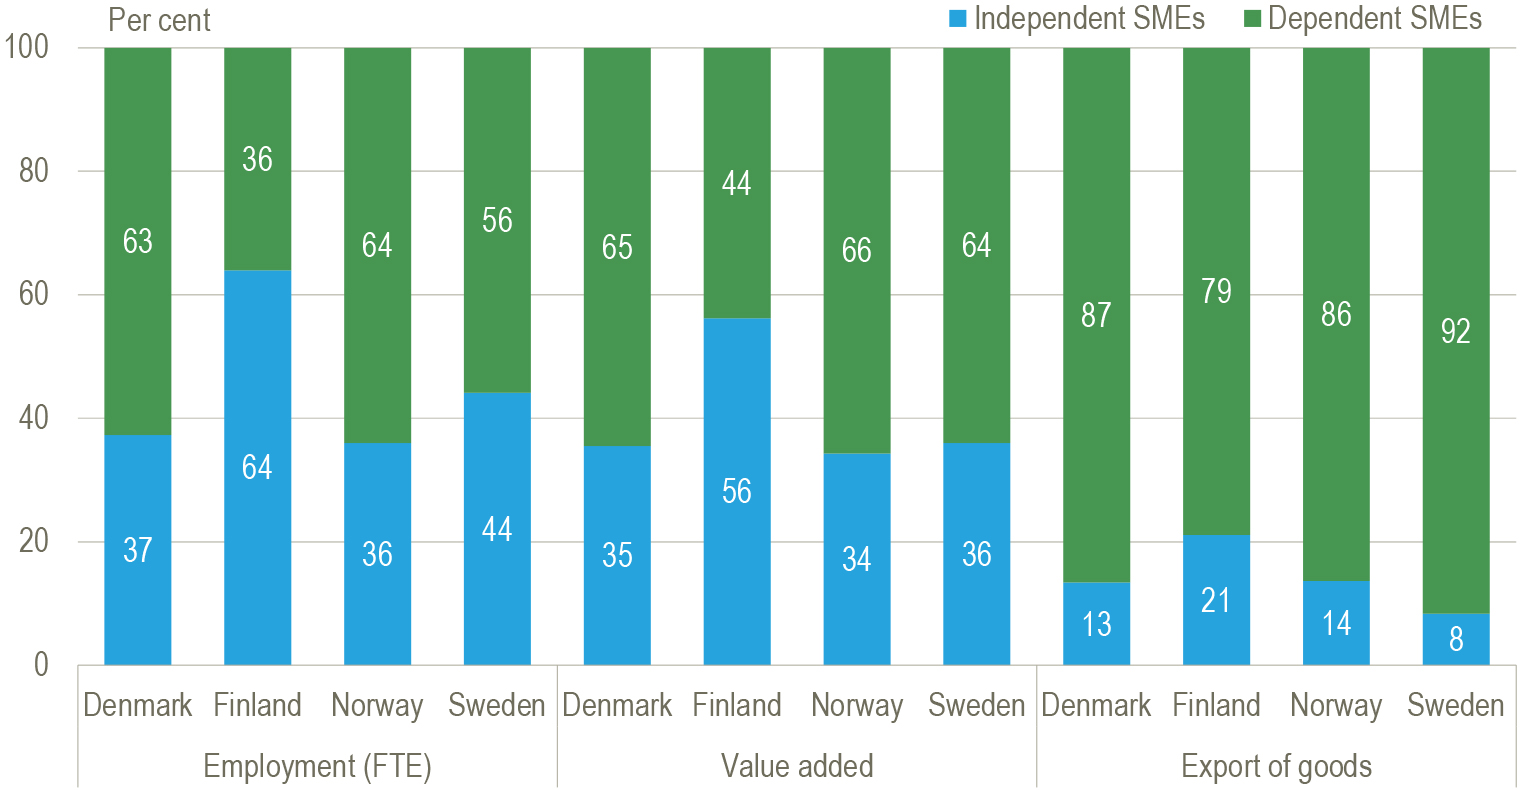
| The analysis focuses both on the economic impact (i.e. the value added produced) as well as the employment consequences of GVCs (how much employment in the Nordics depends on GVC involvement), and further reveals the importance of domestic value chains, and the role of foreign investment in driving domestic supply chains, both upstream and downstream. The report highlights, throughout, the differences across key industries within the Nordic economy. |
| Independent and dependent SMEs, per cent of total employment, gross value added and exports of goods, of SMEs. 2013 |
|
| Source: Statistics Denmark (2017) |
Table 3
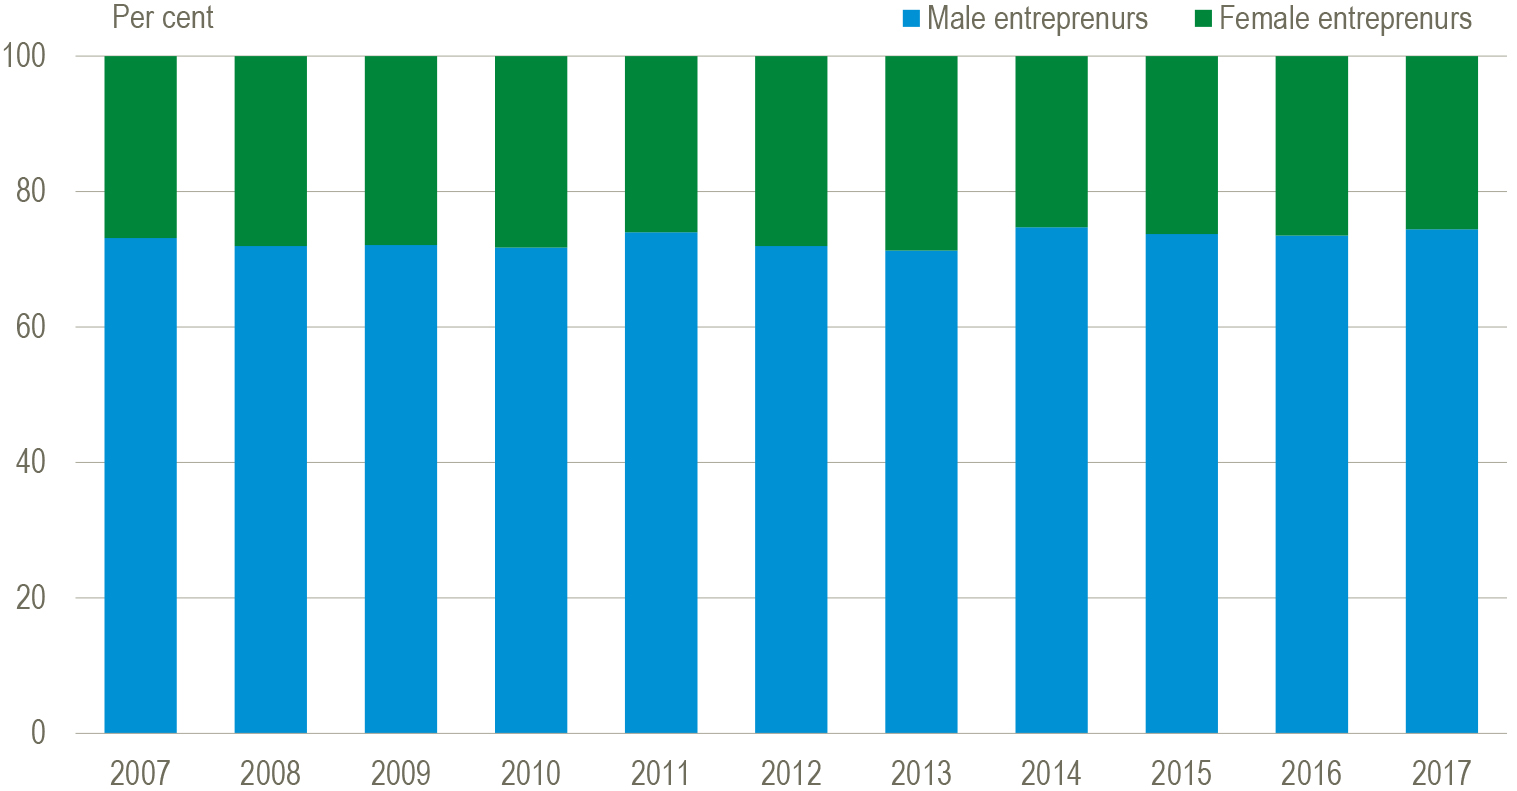
Profiling new entrepreneurs by linking business and social statistics
| In the Business Registers some basic information about the owner of the personally owned enterprises are often stored at individual enterprise level. This is the case for e.g. the Danish Business Register where the unique personal identification number of the owner is linked to the enterprises via the administrative business register. This ID no. automatically holds information about age and gender of the owner. |
| Both types of statistical information are important for policy makers as there is a focus on creating e.g. more women-owned startups, as women entrepreneurs are seen as a source for future growth and innovation in the Danish economy which has yet to be fully tapped. Furthermore, there is also a policy focus on encouraging younger persons to establish their own businesses; to better utilize the digital competences posed especially by these age groups. |
| Although the Danish entrepreneurship policy has been focusing on increasing the share of female entrepreneurs, the share of female entrepreneurs establishing new enterprises has remained almost unchanged in Denmark since 2001 – around 25 per cent; see figure below. |
| Figure Entrepreneurs by gender, 2001–2017 |
|
| Source: Statistics Denmark: Iværksætterdatabasen |
However, with more interconnectedness comes more complexity. Declining trade related costs have increased the distance between producers and final consumers, particularly for economies at the up-stream part of the value chain. It is much harder today, using conventional statistics, to understand how changes in demand in one country impact countries at the beginning of a value chain. Fully understanding the nature of GVCs and global dependencies requires therefore a global view of pro-duction and consumption. But national statistical information systems are on their own not able to provide that view. These systems “… still largely view the ‘Rest of the World’ as an ‘of-which’ ‘catch all’ item to which goods and services are sent or purchased, and, where data on trade with specific countries are included, they are only seen through the prism of trade and not production.” [3].
To bridge the gap between the national statistical information and the global view, the OECD-WTO Trade in Value Added initiative (TiVA) [26] helped countries to better understand the nature of global production, and in particular the direct and indirect interactions between industries across the world and between industries and consumers. The TiVA model provides insights in the relationship between trade and production, especially on the important role played by upstream service providers in driving export growth. These insights helped policy makers and analysts alike to recognise that GVC policy making requires a ‘whole of supply’ approach that is as much about creating the right policy environ
However, the TiVA model in its current form cannot provide all of the necessary insights. The chal-lenges to GVC integration, whether as a direct exporter or indirectly as an upstream supplier within domestic value chains, do not impact all firms equally. This is not (yet) addressed, nor does it provide insights on the role played by MNEs in value chains (and so is silent on the trade-investment-produc
The Nordic project [3], reflecting a close collaboration between the OECD and Nordic Statistical Offices of Denmark, Finland, Norway and Sweden, attempts to provide important new insights on the nature of GVC integration within the Nordic region through the devel
6.Linking business statistics with employment and people (LEED)
Linking micro data is not a new method or panacea for the development of new statistics. In the late eighties and nineties of the last century it was mainly applied in the field of social studies, and spe
There is a strong coincidence between a new enterprise and the owner behind – the entrepreneur; especially as the vast majority of new enterprises start up without employees and often as sole proprietorships. This close linkage between the enterprise and the entrepreneur makes it obvious to consider profiling the new enterprise not only from the business statistics perspective (e.g. activity, location, turnover, employment), but also utilising social data and statistics to describe the entrepreneur (e.g. gender, age, education) by linking data at micro level (enterprise/person) in order to better understand the nature and performance of the new enterprise, see Table 2.
Linking information from the business register with information on jobs enables the analysis of the impact of the (dynamic) structure of the business economy on the labour market. The advent of globalization has been paired with intense debates among policy makers and academia about its consequences for a range of social issues related to employment, labour conditions, income equality and overall human wellbeing. On the one hand, the growing internationalization of production may have led to economic growth, increased employment and higher wages. On the other hand, concerns are often expressed that economic growth may have decoupled from job creation, partly due to increased competition from low-wage countries, or through outsourcing and off-shoring activities of enterprises.
Figure 4.
Changes in employment shares over 2008–2016 by educational attainment and degree of international sourcing in 2009–2011. Denmark. Unskilled: primary or lower secondary education. Vocational: Upper secondary education. Short: Short cycle tertiary education. Me-dium: Bachelor or equivalent. Long: Master, doctor or equivalent. No international sourcing: Enterprises with no international sourcing in the period 2009–2011. Low intensity sourcing: Enterprises having sourced internationally less than 10 per cent of their employment in 2008 in the period 2009–2011. High intensity sourcing: Enterprises having sourced internationally 10 per cent or more of their employment in 2008 in the period 2009–2011. Source: Nielsen (2018b).
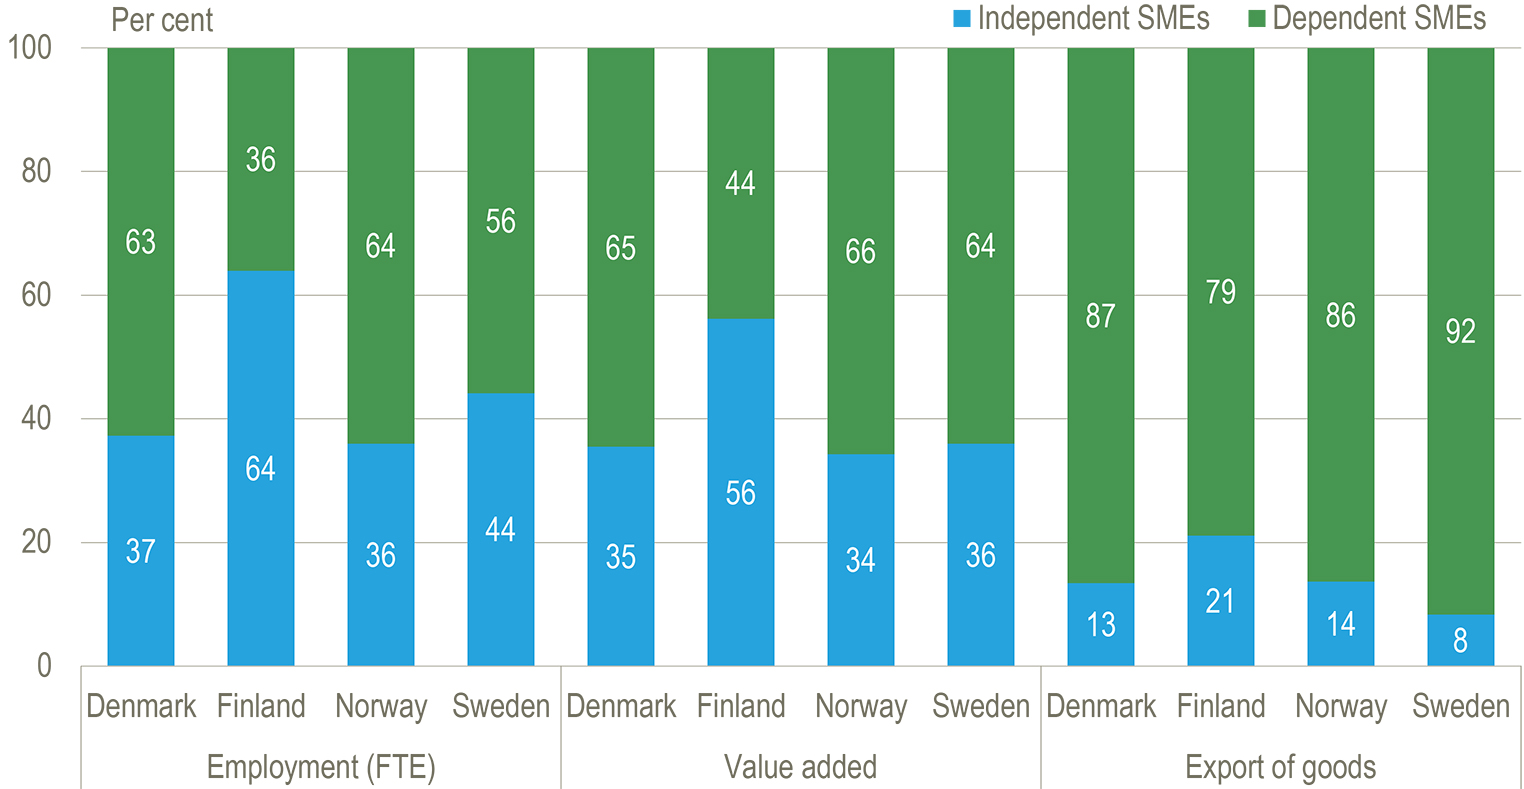
Table 4
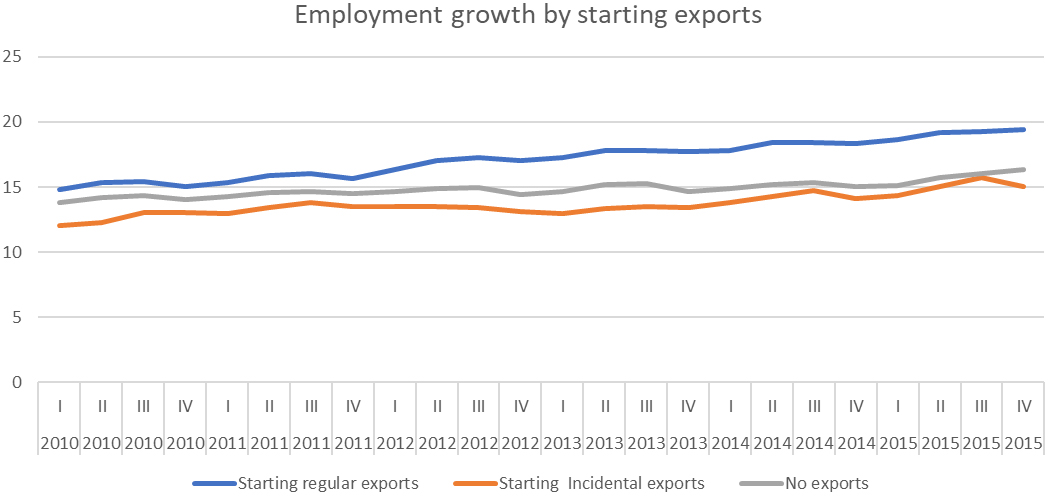
Matching the Business Register with International Trade in Goods and the Social Statistics Database: The relationship between globalization and domestic employment
| In a study on internationalization and its impact on domestic employment (Statistics Netherlands, 2018/2), data from the Business Register, the International Trade in Goods and characteristics of employees from the Social Statistics Database are merged. The policy question was if starting with either import or export on a regular basis would have a positive effect on the composition and number of jobs. Three groups of enterprises are identified in a propensity-score matching (PSM) analysis: starting trade on a regular basis: if the enterprise has no trade in two succesive years (2010–2011), followed by at least two years of trade (2012–2013) and at least two years in the period 2014–2016; starting trade on incidental basis: if the enteprise has no trade in two successive years (2010–2011), followed by trade in 2012 and no trade in 2013, and with trade in one of the years in the period 2014–2016; no trader: enterprises with no trade in the period 2010–2016. |
| The analysis showed that starting with export on a regular basis leads to an initial increase of employment with 1 to 2 percentage points in the starting year. There is no additional growth in the years following the starting year. Starting with imports leads also to an increase of employment in the starting year with 1 percentage point. These findings are in line with other studies [35, 36]. Nevertheless essential issues such as dynamics of the labor market and processes of sourcing require a more indepth analysis. |
|
| Source: Statistics Netherlands, Internationaliserinsmonitor 2018/II |
Figure 5.
Data model of linked business and social micro data (Statistics Netherlands).
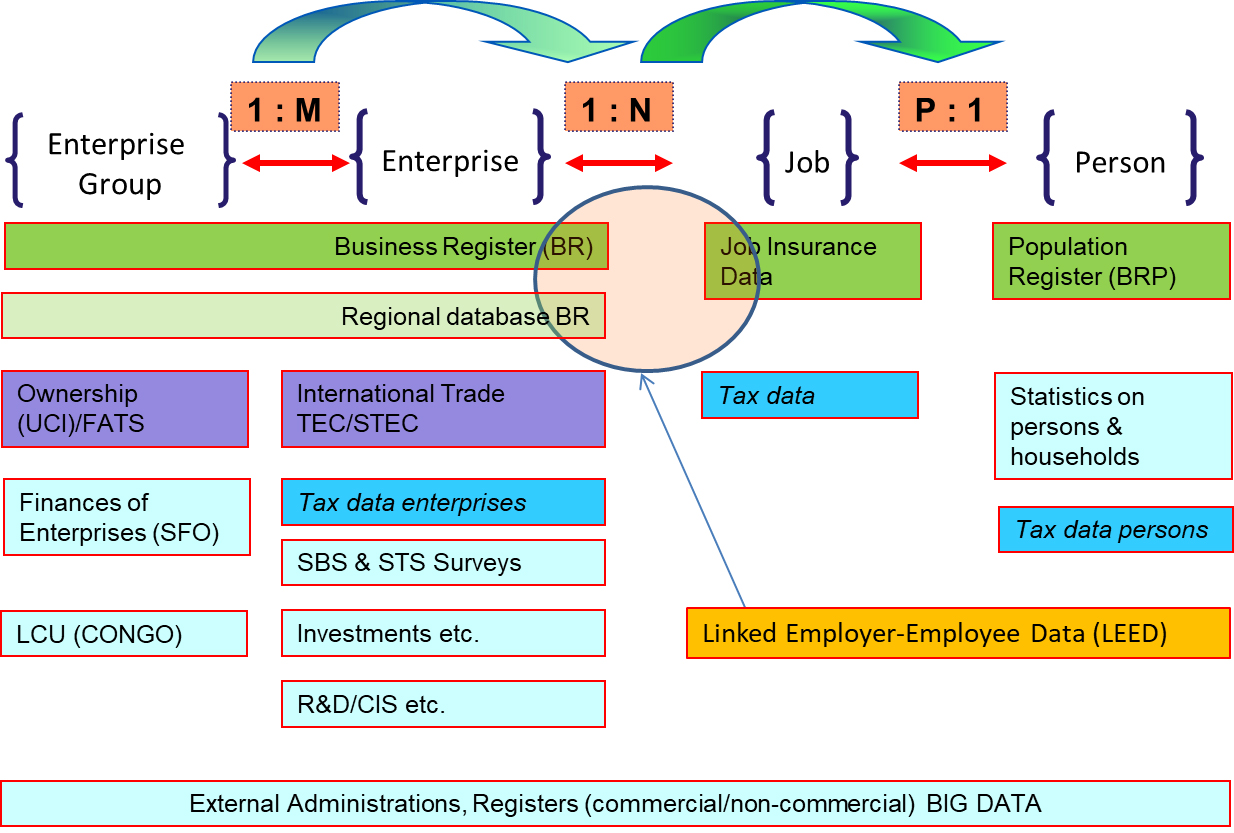
Table 5
Matching the National Survey on Labor Conditions with tax information and the Business Register
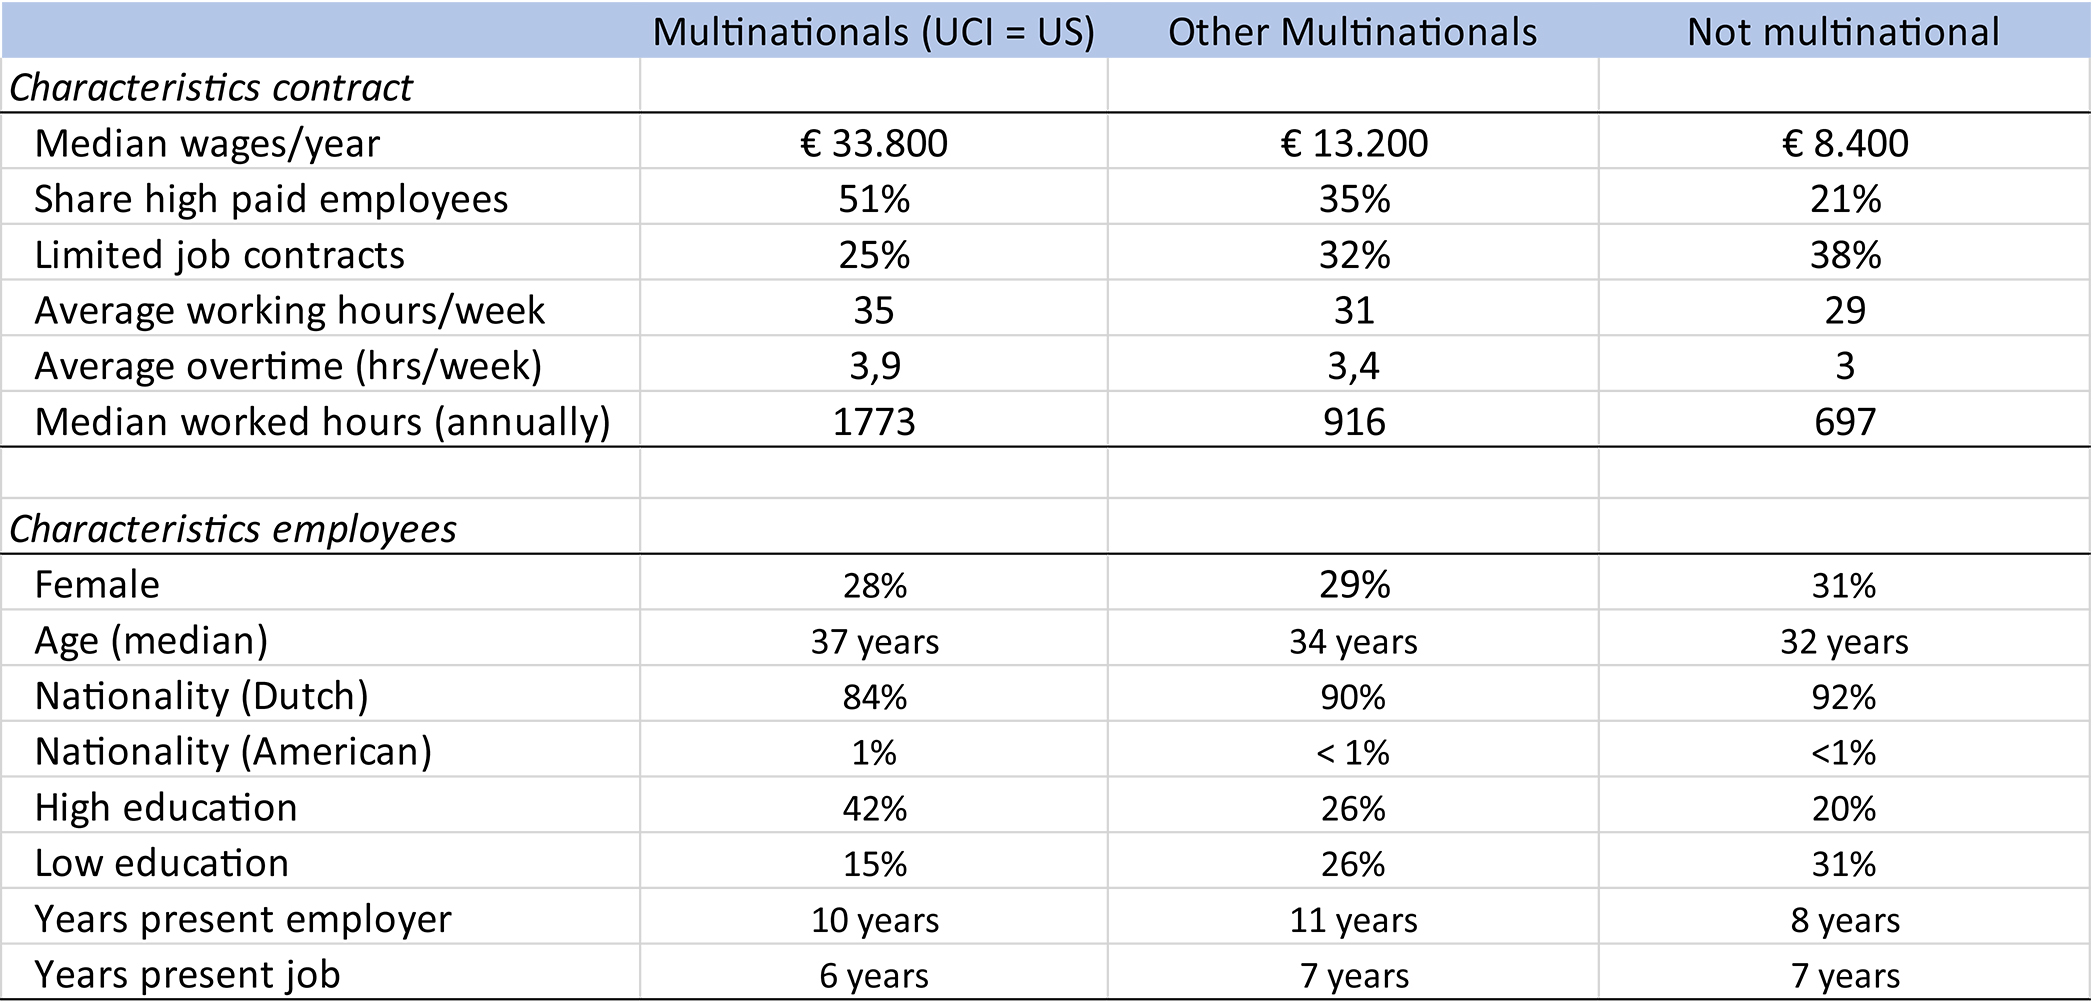
| A typical approach in LEED analysis is matching information on enterprises with information on persons which allows for the analysis of characteristics of both enterprises and persons. In a comprehensive study on American enterprises in the Netherlands information on the Ultimate Controlling Institutional Unit (UCI) from the Business Register, tax information on jobs, both in terms of number of jobs and volume in FTE, and the results from the National Survey on Labor Conditions were combined into a LEED dataset [37]. The dataset allows for a comparison of variables on wages, working hours and other characteristics on persons in different types of enterprises. In this example three types of enterprises, US controlled enterprises in the Netherlands, other multinationals in the Netherlands and domestic enterprises are illustrated. See figure below. |
| In US multinationals on average more men, more people with high education and less people with low education are at work. This pattern of gender and education differs between industry and trade. In US multinationals relatively more men at work both in industry (85 per cent vs. 82 per cent) and trade (67 per cent vs. 61 per cent). Looking at education these relative differences are even larger: in industry (36 per cent vs. 22 per cent) and in trade (46 per cent vs. 16 per cent). |
| Based on these LEED data in-depth analysis shows that job mobility is a function of both the job contract and the composition of the organization workforce. On average, employees in US multinationals work less long in their specific job, but in combination with the higher number of years of service suggests higher internal mobility. |
| Figure. Characteristics of job contract and employees by type of enterprises. |
|
| Source: Statistics Netherlands: Internationaliseringsmonitor, 2019, No. 1 |
The question regarding the employment consequences of globalization has however not yet been extensively addressed in studies based on LEED data. However, an analysis of both firm and em-ployee characteristics at a detailed level should improve our understanding of the social implication of e.g. increased international trade (exports and imports), outsourcing and off-shoring, and the grow
Figure 5 shows a simplified model of the role and position of the LEED database. The heart of the model is based on three central registers. Firstly, the business register which includes the total population of enterprise groups and enterprises. Secondly the Jobs Insurance Database from the insurance administration (which is integrated with data on jobs from the tax administration and data from Statistics Netherlands’ survey on jobs and wages), which also includes information on job characteristics. The third register, the Population Register, is then used to add information on characteristics of the persons occupying those jobs. The population register also contains information on persons working in the Netherlands or receiving a Dutch benefit or pension while resident abroad.
For every job, there is a key in the business register with the enterprise, and a key identifier for the job or persons occupying that job (a number of the Industrial Insurance Board and the Income Tax number respectively). Subsequently, within the domain of business registers and surveys there is additional information on the structure of an enterprise (group), as there is additional information within the domain of social registers (for example social security, pensions, self-employed) and surveys on persons and households.
The LEED plays a pivotal role between the business register and the population register and connects four different types of statistical units, i.e. enterprise group, enterprise, job within the enterprise and person occupying that job. These units form the demographic backbone of the databases. Consequently, different types of analysis are possible, using these statistical units. Basically, one can define causal models on how economic dynamics affects job dynamics, but also the other way around, i.e. how population dynamics are related to job dynamics.
7.Distributed micro data research – MDL involving several countries
One of the key targets of statistics of economic globalisation is to respond to user needs for more detailed, relevant and integrated business statistics at international level i.e. information on the international dimension of the performance, organisation and demography of the enterprise population. This would be a relatively simple task if all micro data on global enterprises were combined and centralized in one database. However, direct access and data sharing of micro data at international level is not (yet) feasible due to legal, organisational and technical barriers. Instead, the so-called coordinated micro data linking or distributed microdata linking/research approach has been used in most business statistics related MDL projects to compile internationally comparable statistics on economic globalisation. Comparative micro data linking projects require central coordination of the data base construction, the analysis and publication respecting subsidiarity and national legislation. A typical co-ordinated microdata linking is carried out in three separate phases, see Fig. 6:
Figure 6.
Setup MDL database for DMDR purposes. Source: Nielsen et al. (2019).
The first phase involves the construction of the linked micro dataset. The project coordinators produce standardised guidelines explaining in detail how the datasets in each participating country are to be structured and provide a common code to ensure that identical tables are produced in all countries. Each country records information from all the data sources used in the project into its own national database. These linked micro datasets are stored locally at the national statistical institutes throughout the project and are not shared with third parties. In the second phase the dataset is tested for consistency. Although each data source used in the project has already been carefully edited as part of the production process, it is necessary to carry out further consistency checks to ensure, for example, that enterprises are represented by the same statistical units across different data sources and over time, as the reporting units used for specific enterprises can, and often do, differ across the data sources in each project. Tests used in this phase of the project are devised by the project coordinators and implemented locally by the national statistical institutes. In the third phase standardised statistical output is created in each country consisting of descriptive and longitudinal analysis. A general description of the methodology used can be found on the Eurostat website [38].
8.Road ahead
As mentioned above, even if NSIs have used MDL as a method for several years, MDL has mainly been used for experimental statistics. But the survey amongst European NSIs shows that the large majority of NSIs expect MDL to become a priority area of strategic importance in the years to come. MDL allows NSIs to respond in an agile and timely way to emerging policy needs and, in this way, underline the importance of official statistics for evidence based policy making in a time where fake news play an increasing role in the public debate.
It is our expectation that MDL will not keep the status as a tool in the statistical toolbox for experimental statistics only but will be further developed in different dimensions:
An increasing number of NSIs are expected to establish permanent data warehouses holding several statistical registers at the enterprise level for longer time series, allowing them to swiftly establish new statistical evidence on emerging topics from GVCs to productivity to sustainability. Furthermore, the increasing need for up-to-date information will enlarge the statistical coverage from (mainly) annual business statistics to also include short-term statistics. As an example, due to the current Covid-19 crisis governments across the world will urgently require information about the impact of the crisis on sustainability of the businesses. These questions can only be answered by linking short term statistics on turnover, employment or bankruptcies with annual statistics on, for instance, ICT use or global dependency in terms of involvement in GVCs. Furthermore, NSIs will have to develop methods to utilise the increasing amount of available big data as sources to be linked with official statistics, even at micro level. For instance, providing the necessary statistical evidence on topics such as sustainability or climate change cannot be solved only by using traditional statistical sources and methods. When MDL becomes a more prominent tool, it will also be necessary for NSIs to reconsider the policy of negative co-ordination of samples due to the respondent burden. In order to have a critical mass of matching enterprises in the analysis, the approach of positive co-ordination of samples across several statistical domains needs to be further scrutinised in terms of advantages and disadvantages and possible implemented in the future.
References
[1] | Statistics Netherlands. ((2009) ). Internationaliseringsmonitor Den Haag/Heerlen/Bonaire: Statistics Netherlands. |
[2] | Söllner, R., & Jung, S. ((2017) ). The Impact of Foreign Trade and Ownership on Enterprise Exits: New Insights through Micro Data Linking. AStA Wirtschafts-Un Sozialstatistisches Archiv. doi: 10.1007/s11943-017-0200-1. |
[3] | Statistics Denmark, et al. ((2017) ). Nordic Countries in Global Value Chains. Copenhagen: Statistics Denmark. |
[4] | Eurostat. ((2020) ). Micro Data Linking in the EU. (BSDG-SDG 202003 4.1) Luxembourg: Eurostat. |
[5] | Eurostat. ((2017) , August 2). Handbook on Methodology of Modern Business Statistics. CROS (Collaboration in Research and Methodology for Official Statistics): https://ec.europa.eu/eurostat/cros/content/handbook-methodology-modern-business-statistics_en. |
[6] | De Waal, T., Pannekoek, J., & Scholtus, S. ((2011) ). Handbook of Statistical Data Editing and Imputation. New Jersey: Wiley. |
[7] | Boonstra, H.L. ((2015) ). Estimation Methods for Linked Data Sources: A Review for the Micro Data Linking Project. Den Haag/Heerlen/Bonaire: Statistics Netherlands. |
[8] | De Waal, T. ((2015) ). General Approaches for Consistent Estimation based on Administrative Data and Surveys, Discusssion Paper No. 11. Den Haag/Heerlen/Bonaire: Statistics Netherlands. |
[9] | Särndal, C.-E., Swenson, B., & Wretman, J. ((1992) ). Model Assisted Survey Sampling. Springer. |
[10] | Kroese, A., & Renssen, R. ((2000) ). New Applications of Old Weighting Techniques; Constructing a Consistent Set of Estimates based on Data from Different Surveys. Proceedings of ICES II. pp. 831–840. American Statistical Association. |
[11] | Houbiers, M. ((2004) ). Towards a Social Statistical Database and Unified Estimates at Statistics Netherlands. Journal of Official Statistics. 55–75. |
[12] | Kovar, J., & Whitridge, P. ((1995) ). Imputation of Business Survey Data. In Cox, B., Binder, D., Chinappa, B., Christianson, A., Kott, P., et al., (eds), Business Survey Methods. pp. 403–423. Wiley. |
[13] | Raghunathan, T., Lepkowski, J., Van Hoewyk, J., & Solenberger, P. ((2000) ). A Multivariate Technique for Multiply imputing Missing Values using a Sequence of Regeression Models. Survey Methodology. (Nr. 27), 85–95. |
[14] | Liu, J., Gelman, A., Hill, J., Su, Y.-S., & Kropko, J. ((2014) ). On the stationary distribution of iterative imputations. Biometrika. 101: (Nr. 1), 155–173. |
[15] | Magnus, J., Van Tongeren, J., & De Vos, A. ((2000) ). National accounts estimation using indicator ratios. Review of Income and Wealth. 46: (Nr. 3), 329–350. |
[16] | Eurostat. ((2007) ). External Trade by Enterprise Characteristics. Luxembourg: Eurostat. |
[17] | OECD Expert Group on Extended Supply-Use Tables, Terms of Reference: https://www.oecd.org/sti/ind/tiva/eSUTs_TOR.pdf. |
[18] | Statistics Canada. ((2001) ). A Profile of Canadian Exporters, http://publications.gc.ca/Collection-R/Statcan/65-506-XIE/0010165-506-XIE.pdf. |
[19] | Statistics Canada. ((2017) ). Activities of multinationals (MNEs) in Canada, https://www150.statcan.gc.ca/n1/daily-quotidien/191118/dq191118a-eng.htm. |
[20] | Statistics Canada. ((2020) ). Canadian exports of goods to China by Canadian and Chinese provinces, 2016 to 2018, https://www150.statcan.gc.ca/n1/daily-quotidien/200218/dq200218b-eng.htm. |
[21] | Oyarzun, J., & Wile, L. ((2016) ). An Overview of Business Record Linkage at Statistics Canada: How to link the “Unlinkable”, Proceedings of Statistics Canada Symposium 2016, Growth in Statistical Information: Challenges and Benefits, Statistics Canada. |
[22] | Eurostat. ((2019) ). Micro data linking |
[23] | Bartelsman, E., Hagsten, E., & Polder, M. ((2017) ). Micro Moments Database for Cross-Country Analysis of ICT, Innovation, and Economic Outcomes. Amsterdam: Tinbergen Institute. |
[24] | Nielsen, P.B. ((2018) a). The puzzle of measuring global value chains – The business statistics perspective. International Economics. 153: , 69–79. |
[25] | Nielsen, P.B., et al. ((2019) ). Establishing Harmonised Business Statistics Databases in the Nordic NSIs – challenges and achievements, Helsinki (Finland). Nordic Statistical Meeting, Statistics Finland. |
[26] | OECD. Trade in Value Added, http://www.oecd.org/sti/ind/measuring-trade-in-value-added.htm. |
[27] | Alda, H., Bender, S., & Garnter, H. ((2005) ). The linked employer-employee data-set of the IAB (LIAB), IAB Discussion Paper 6/2005. Nürnberg: IAB. |
[28] | Luppes, M., & De Winden, P. ((2007) ). Open Economy and its relation to Employment and Welfare. Paris: OECD. |
[29] | Fortanier, F., Korvorst, M., & Luppes, M. ((2012) ). The employment Consequences of Globalization: linking data on employers and Employees in the Netherlands. In Dicaccio, A., Coli, M., & Ibanez, J., Advanced Statistical Methods for the Analysis of Large Data-Sets. pp. 101–111. Berlin Heidelberg: Springer Verlag. |
[30] | Desai, T. ((2008) ). A Guide to Linked Employer-Employee Data Sources in the EU and Beyond (1st Edition). London: London School of Economics. |
[31] | Nielsen, P.B. ((2018) b). Industrivirksomheder med høj outsourcingsaktivitet har næsten halveret antallet af ufaglærte siden 2008. Copenhagen (Denmark): Statistics Denmark. |
[32] | Nielsen, P.B. ed. ((2008) ). International Sourcing – Moving Business Functions Abroad. Copenhagen (Denmark): Statistics Denmark. |
[33] | Bongard, R. ((2011) ). International Sourcing and Employment Effects – A Micro Data Linking Approach. In Statistics Netherlands, Internationalisation Monitor 2011. The Hague: Statistics Netherlands. |
[34] | Statistics Netherlands. ((2018) , nr. 2). Internationaliseringsmonitor (theme Internationalisation and Employment). Den Haag/Heerlen/Bonaire: Statistics Netherlands. |
[35] | Wagner, J. ((2005) ). Exports and Productivity: a Survey of the Evidence from Firm Level Data. Lüneburg (Germany): University of Lüneburg. doi: 10.2139/ssrn.740252. |
[36] | Girma, S., Greenaway, D., & Kneller, R. ((2004) ). Does exporting increase productivity? A microeconometric analysis of matched firms. Review of International Economics. 12: (5), 855–866. February 2004. doi: 10.1111/j.1467-9396.2004.00486.x. |
[37] | Statistics Netherlands. ((2019) , Nr. 1). Internationaliseringsmonitor (theme United States of America). Den Haag/Heerlen/ Bonaire: Statistics Netherlands. |
[38] | Eurostat. https://ec.europa.eu/eurostat/web/digital-economy-and-society/methodology. |


