
Exploring a knowledge-based approach to predicting NACE codes of enterprises based on web page texts
Abstract
Classification of enterprises by main economic activity according to NACE codes is a challenging but important task for national statistical institutes. Since manual editing is time-consuming, we investigated the automatic prediction from dedicated website texts using a knowledge-based approach. To that end, concept features were derived from a set of domain-specific keywords. Furthermore, we compared flat classification to a specific two-level hierarchy which was based on an approach used by manual editors. We limited ourselves to Naïve Bayes and Support Vector Machines models and only used texts from the main web pages. As a first step, we trained a filter model that classifies whether websites contain information about economic activity. The resulting filtered data set was subsequently used to predict 111 NACE classes. We found that using concept features did not improve the model performance compared to a model with character n-grams, i.e. non-informative features. Neither did the two-level hierarchy improve the performance relative to a flat classification. Nonetheless, prediction of the best three NACE classes clearly improved the overall prediction performance compared to a top-one prediction. We conclude that more effort is needed in order to achieve good results with a knowledge-based approach and discuss ideas for improvement.
1.Introduction
Classifying businesses by their main economic activity is an important task for national statistical institutes because the economic outcomes are often partitioned into industries. Since manual classification is very time-consuming, we explore the use of text mining, using texts from dedicated websites as input. More specifically, we are interested to explore whether the use of content knowledge from manual classifiers aids this text mining activity. We first give some background information to better understand the problem of classifying economic activity (Section 1.1) and then we further introduce our approach (Section 1.2).
1.1Background
In the European Statistical System for official statistics, the classification system for economic activity is the NACE code. Within this statistical system, enterprises are one of the core statistical unit types for business statistics. The enterprise is composed of one or more legal units each having its own economic activity. In the Netherlands, the economic activity of a legal unit is determined upon the obligatory registration at the Chamber of Commerce (a public service provider that maintains the Dutch Register of legal units). This information, together with the relation between enterprises and their underlying legal units is held within the statistical business register (SBR).
There are well-defined rules that describe how the main activity of a statistical unit should be derived from the economic activity of its underlying legal units. At Statistics Netherlands the main economic activity of most of the enterprises is derived by an algorithm that automatically applies those rules. Only for the largest and most complex enterprises this main activity is determined manually by profilers, often in consultation with a representative of the enterprise. The main activity of those largest enterprises are therefore very reliable. However, the main economic activity of most of the other enterprises is prone to errors since limited manual editing is done to keep the economic activity codes up to date. Unfortunately, classification errors in small and medium-size enterprises may not cancel out: statistical estimates may be biased due to those misclassifications, see van Delden et al.[1] for an example.
There is a limited number of published studies that report rates of NACE code misclassification. In a Swedish study, one-fourth of the codes were found to be misclassified in some economic sectors [2]. A Finnish study reported that misclassification rates at 5-digit NACE level for small enterprises decreased from 10% in 2003 to 4% in 2013 [3]. In the Netherlands, serious classification errors for small enterprises in the car trade sector were found by Van Delden et al.[4].
There are multiple reasons for these NACE classification errors. Enterprises often have a variety of activities [2] and their main activity is not always derived correctly. Additionally, the NACE code of the underlying legal units may be wrong at the time of registration. Furthermore, economic activities may have changed over time, but those changes are often not reported to the Chamber of Commerce [1, 2]. Van Delden et al.[1] estimated for the car trade sector that only 15.9% of all true changes in the main activity of small enterprises resulted in a corresponding NACE code change in the SBR.
When a NACE code is checked manually, it often occurs that the editor searches for information on economic activity on dedicated website(s) of the enterprise. Website addresses (URLs) are registered per legal unit at the Chamber of Commerce, and made available to Statistics Netherlands. An enterprise may have multiple websites, for instance the enterprise may sell different product types and each product type may have a different website. Time spend on manual editing may be reduced somewhat when automatically predicted NACE codes from websites are directly available to the editors. This requires linkage between website addresses and the enterprises in the SBR and it requires that the most likely NACE codes based on the website information are estimated.
An example of how to find URLs of enterprises is shown in Barcaroli and Scannapieco[5]. In the current paper, we focus on the prediction of NACE codes given that a set of URLs has been found. We use a supervised approach, that is we use models that are trained on a set of labelled data. Published studies of supervised learning of economic activity codes from websites can be found in Berardi et al. [6] and Du et al.[7]. Berardi et al. [6] use a support vector machine (SVM) model using both endogenous and exogenous features. Endogenous features are words derived from different places of the website and exogenous features are based on links to the websites and from searches to the websites. They predict a set of 27 (depth-1) and 216 (depth-2) classes. Du et al. [7] use individual words from the websites to train a neural network. They have a data set with 15 categories related to economic activity.
In the current case study, we limit ourselves to Naïve Bayes (NB) and SVM models rather than using ensemble methods (random forest, XGBoost) or neural networks. One reason is that we focus on the effects of using a knowledge-based approach rather than on comparing algorithms. An advantage of NB models is their easy interpretability and computability. SVMs have shown to produce satisfactory results in text mining tasks (as an example, see Berardi et al. [6]). Furthermore, an advantage of both NB and SVM models is that one can ‘directly’ combine the features with the model parameters to derive the decision. Neural networks have the disadvantage that running them requires an IT infrastructure that is currently not available at many National Statistical Institutes (NSIs).
Figure 1.
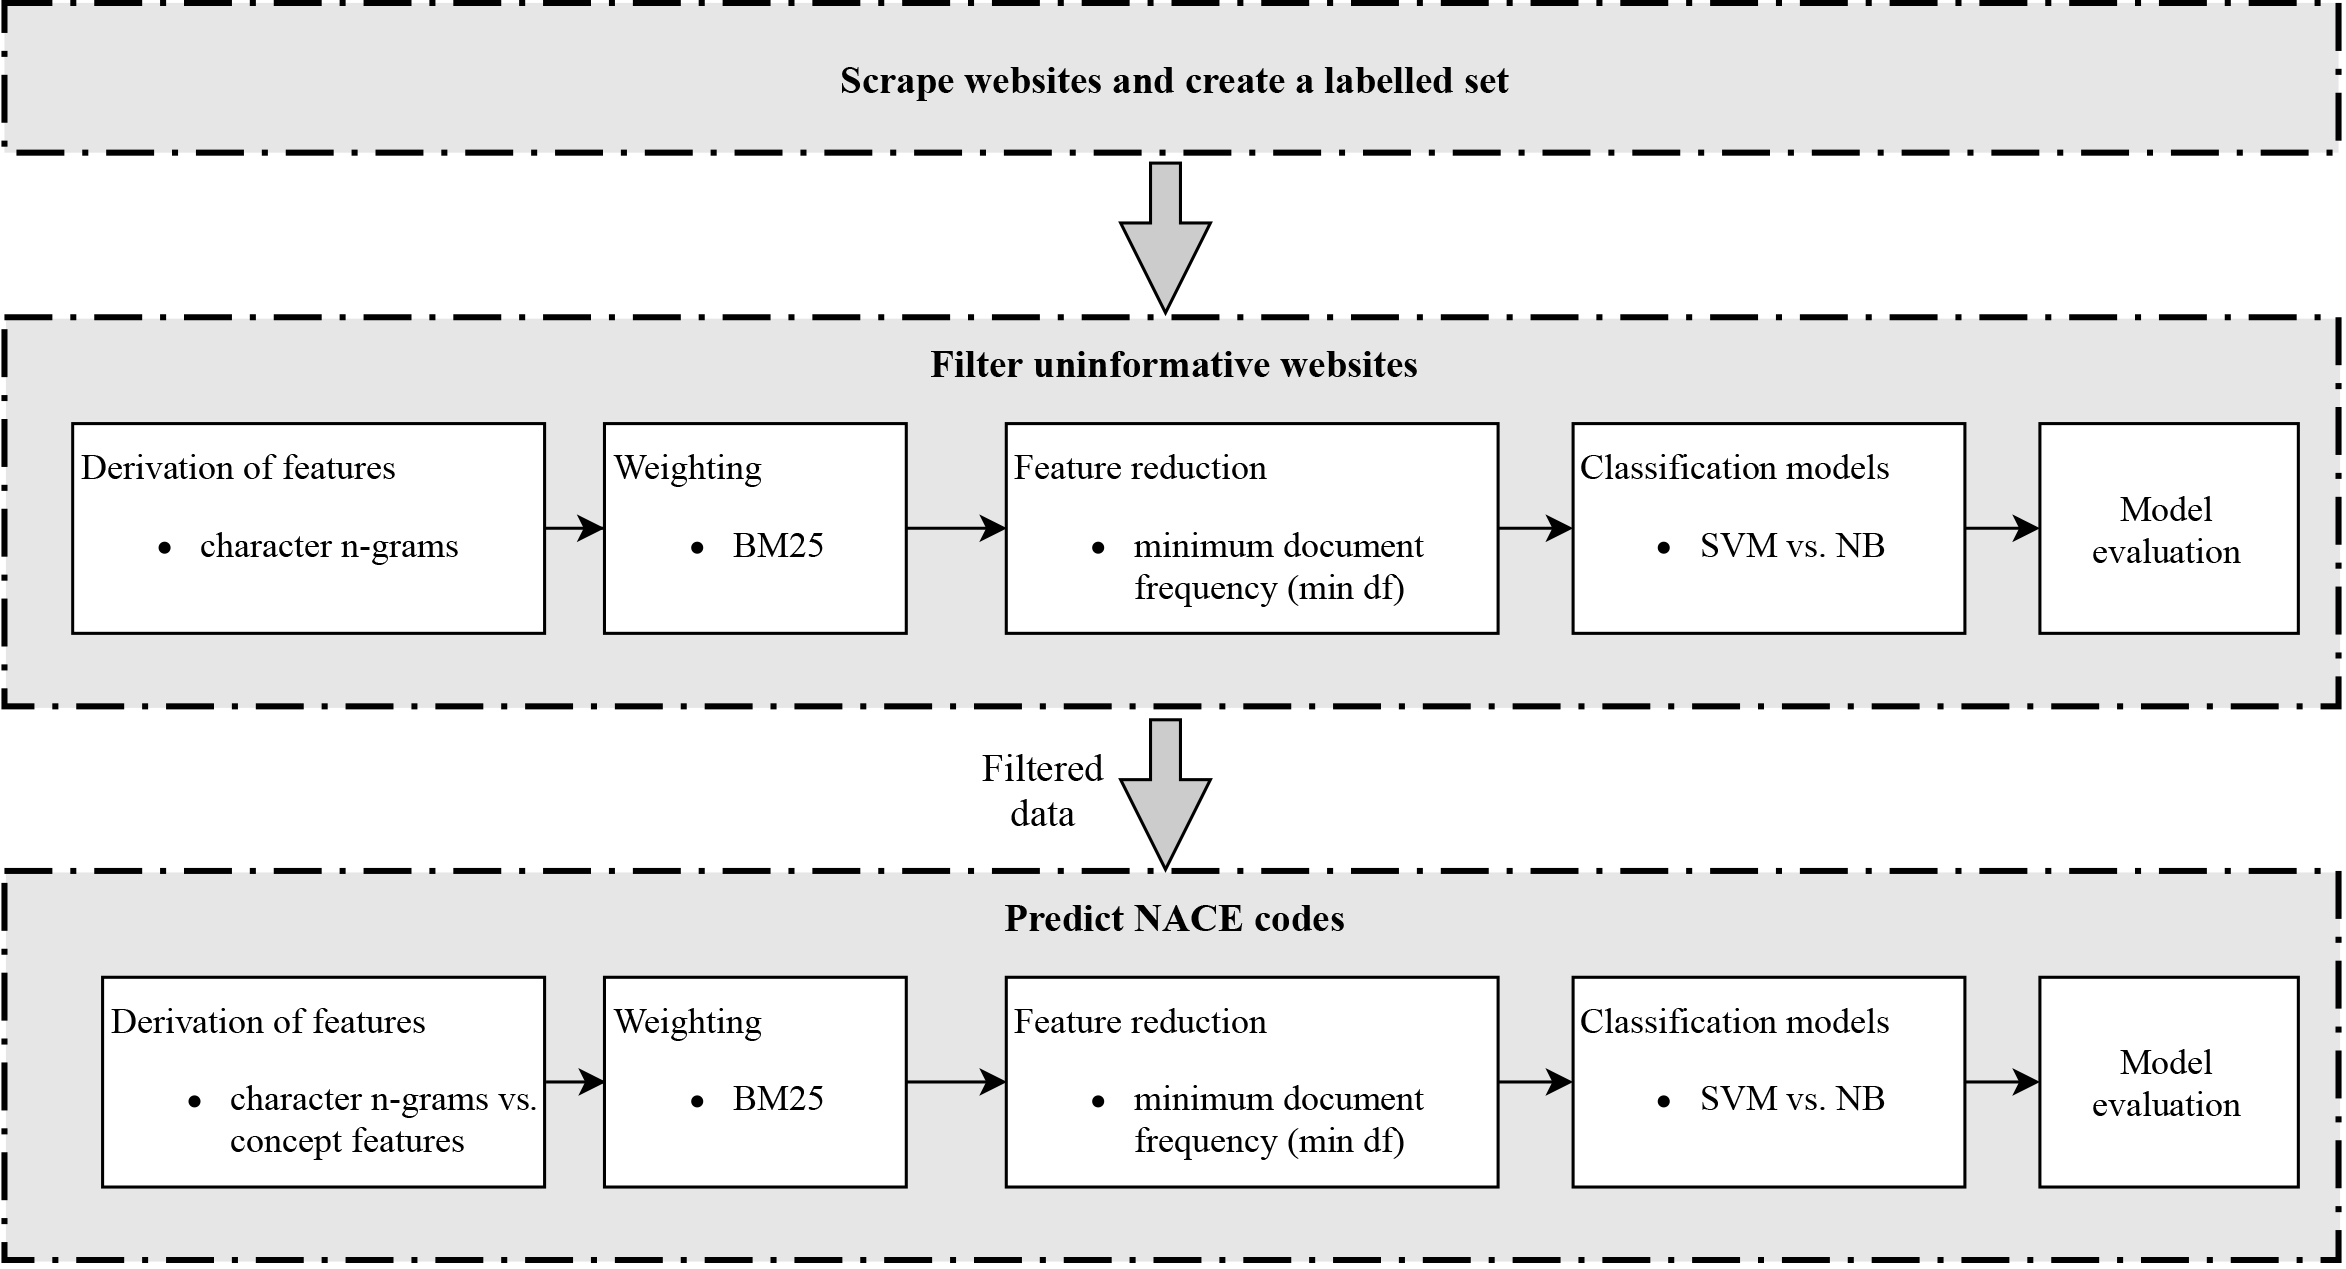
Approach for classifying NACE codes with website data.
1.2Approach
We want to explore whether a selection of knowledge-based features can help to accurately predict NACE codes. Every NACE code has a clear definition. We are interested to test whether the concepts underlying these definitions can be used to predict NACE codes. Therefore we restrict ourselves to text-based features. Such an approach might also be interesting for other classifications in official statistics that are well-defined. The reason why we want to test the use of knowledge-based features is that in official statistics one really wants to avoid that machine learning model gives weight to features that are not causally related to the output variables. In situations with a relatively small training set, as is the case with our case study, that risk is more pronounced: accidental, non-causal relations may be trained.
Note that a classical, well-know approach to the use of knowledge-based features is the use of rule-based methods. An example is the use of the tool CASCOT [8] to classify occupational and industry codes. An example of the combination of rule-based and supervised learning can be found in Gweon et al. [9] who classified occupations based on open-ended questions. A disadvantage of rule-based methods is that they require in-depth knowledge about the specific language and task; therefore rule-based methods are not easily generalisable [10, 11].
In addition to the use of knowledge-based features, we are interested to test whether the prediction accuracy improves when we make use of the approach taken by human annotators at Statistics Netherlands in the classification process. These annotators explained that when the economic activity concerns goods, then it is crucial for the correct classification to know in which part of the business chain the enterprise is active: does it concern manufacturing, selling to another businesses, selling to customers, repair and so on. We will compare the effect of the use of a two-layer hierarchical classification that accounts for the business chain versus a flat classification on the model performance.
The aim of the present study is to explore whether knowledge-based features and a knowledge-based hierarchy can be used to reliably predict the main economic activity of enterprises from texts of dedicated websites. The remainder of this paper is structured as follows. In Section 2, we give an overview of the text classification method that was used. In Section 3 we explain a step to filter out non-informative URLs. The knowledge-based model approach is worked out in Section 4 and applied to our case study. Finally, our findings are discussed in Section 5.
2.Methodology
The approach starts by scraping text from dedicated websites and creating training and test data. Thereafter, it consists of two parts: ‘filter uninformative websites’ and ‘predict NACE codes’. The first part aims to create a data set with only those websites that contain enough information about the economic activity of an enterprise to determine its NACE code. The resulting dataset is then used to predict the economic activity of enterprises. An overview of the classification approach is displayed in Fig. 1.
Within both parts, the following steps are distinguished: derivation of features, weighting, feature reduction, classification using a classification algorithm and model evaluation. Commonalities in the two parts are presented in the next subsections. Specific elements are explained in Section 3 for the filtering and in Section 4 for the prediction of NACE codes. All analyses were carried out in Python 3.6, using the package Scrapy [12] to scrape the websites, the package Langdetect [13] to identify the language of a websites and the package scikit-learn [14] for the statistical learning models.
2.1Obtaining scraped, labelled websites
As the starting point for a labelled set, we used enterprises that were sampled for the Dutch Structural Business Statistics survey [15] in 2017. This survey concerns a wide set of economic sectors: manufacturing, construction, distributive trades and services [15]. Although not perfect, the NACE codes for the main activity of the enterprises in the survey are of a better quality than other enterprises in the SBR since respondents have been checked and influential NACE code errors have been corrected. Furthermore, enterprises whose NACE code is (largely) incorrect, generally tend not to return their survey form. In 2017, 79,501 enterprises were included in the Structural Business Statistics survey.
For enterprises with more than one URL, we combined the text information found on the different URLs. Furthermore, by exception, some websites (386) were shared by different enterprises. For instance, a health care centre may have a website shared by a general practice doctor, a midwife, a dietician and a speech therapist. When enterprises shared the same website, we used the same text information for each of those enterprises. In total we obtained 49,903 enterprises with at least one URL according to the SBR, with a total of 62,221 unique URLs.
We scraped only the main page of a website because it is a relatively simple and fast procedure that can easily be used by other NSIs. Preliminary results by Roelands et al. [16] showed that for many enterprises the main page already contains the most relevant text with respect to NACE classification. In the scraping process, 50,654 websites were retrieved. Some URLs could not be retrieved due to unreachable sites (‘404’ errors) or due to unknown addresses. Furthermore, 70 websites were dropped because they contained a text with less than two characters. Next, we restricted ourselves to websites written in Dutch, corresponding to 40,796 websites. This latter set is referred to as the complete labelled set.
2.2Derivation of features
Words were extracted from the main page as follows. After downcasing, special symbols (with the exception of sentence markers), HTML separators as well as numbers were deleted and multiple sequential white spaces were removed. Sentence markers were kept because they identify the beginning and ending of a sentence and therefore add information. We chose not to use a stemmer, because current Dutch stemmers have several shortcomings [17] such as their inability to stem Dutch compound words in a sensible way. Instead, for the concept words we used complete words, to be explained in Section 4.2. Non-textual information was not used as a feature.
To judge the effectiveness of the use of concept words, we compared it with the use of character n-grams [17]. Character n-grams consist of all possible sequences of
2.3Weighting
We compared two well-known ways to weigh the tokens (n-grams or concept words): tf-idf weighting [19, pp. 126–130] and BM25 [20]. For most of the settings, model performance with BM25 was somewhat better than with tf-idf weighting. In the remainder of this document only results with BM25 weighting are shown. Note that the inverse-document frequency of a term
2.4Feature reduction
We reduced the number of features to decrease model complexity and computational time, and to reduce the risk for overfitting [11]. For the general features as well as the concept features we reduced the number of features by applying a minimum value for the number of documents in the training set in which a term should occur. Terms below that threshold were also excluded from the test set. We used a minimum value, as an alternative to removing a set of stop words, which is an often used approach [21].
Furthermore, for the character n-grams we investigated the suitability of the use of Latent Semantic Analysis to reduce the number of features. Since this resulted in a lower model performance than using the original character n-grams we decided to use the character n-grams in the remainder of this paper.
2.5Classification algorithms
In the current study, we compare the performance of two classifiers: NB and SVM. NB is a common algorithm for text classification because of its efficiency and accuracy for that particular type of data [22, chap. 6]. It uses the assumption that conditional on the true class the probability of a feature to have a certain value is independent of the value of other features. This assumption is often violated in practice, especially when using character n-grams. However, even with violated model assumptions, NB often performs surprisingly well [23].
SVMs are very versatile algorithms that are frequently used in text analysis, see James et al. [24, chap. 9] for an introduction. They were shown to perform well for NACE code prediction in Berardi et al. [6]. SVMs are not inherently multi-class classifiers. We used the one-versus-one approach, where pairwise classifiers for all combinations of classes are created [25, p. 658] and the class that is predicted most often is selected. One-versus-one was chosen because it is less sensitive to class imbalance than the one-versus-all classifier, which fits one classifier for every label and uses all examples that do not belong to the label of interest as negative examples.
Classification was done both with hard classification – only predicting the most likely label of a website – as well as with soft classification. Soft classification was used to evaluate the model performance of the
2.6Tuning parameters
Statistical learning algorithms generally have a number of tuning parameters to optimise their performance. For the NB algorithm, no tuning is needed to optimise model fit. The SVM algorithm has several tuning parameters to optimise training error versus model complexity [24, chap. 9]. In the current study, the parameters
Additionally, for SVM in combination with concept features, a grid search was applied to find the optimal tuning parameters, using a five-fold cross-validation on the training set. We tested a linear kernel with
2.7Evaluation metrics
Model performance was evaluated on the independent test set. Evaluation metrics used were the well-known
Additionally to the more traditionally used
The reciprocal rank
3.Filter uninformative websites
Unfortunately, not all scraped web pages contained information about the economic activity. We refer here to situations were one cannot determine the economic activity from manual inspection of the text, let alone derive it automatically. Maybe, in some of the cases it would be possible to derive the NACE code in another way, such as from pictures, from links to the website or from underlying pages. We come back to this point in the discussion. In this section we describe a filtering step using supervised learning to identify those uninformative texts.
3.1Creation of a labelled set
A labelled set to filter uninformative websites was created manually in the following way. Starting point was the full set of 40,796 enterprises for which we have a scraped web page. This set is referred to as set N (of NACE code), because for all of those enterprises we know the NACE code within the SBR. For a subset consisting of 997 enterprises from set N, we labelled the web page texts into three classes: ‘informative’, ‘maybe informative’ and ‘uninformative’. This subset is referred to as set F. For set F, first of all, we selected a small set of web pages with text such as ’domain does not exist’ and labelled those as ’uninformative’. Additionally, based on preliminary models, we took a random sample of enterprises whose NACE code was either always predicted correctly and a random sample of enterprises whose NACE code was always predicted incorrectly, such that approximately 50% of the labelled set would be informative. The selected units were labelled manually by two independent raters of which one was an expert for business statistics. To obtain an inter-rater agreement, the MCC was computed for the answers of both raters (on the basis of the three classes). This inter-rater agreement was 0.866. For the final labelled set, the labels created by the expert were used. Of the 997 websites, 456 were classified as informative, 391 as not uninformative and 150 as maybe informative. This final set F was split randomly in 80% training and 20% test set. The evaluation scores are computed on the test set.
3.2Deriving features
Two different sets of character n-grams were used: cleaned or full. The cleaned n-grams were created as explained in Section 2.2. For the full n-grams, the text was downcased and tokenised but all numbers and special symbols were kept. In addition, we included separators, denoted by ‘_SEP_’, for the different HTML sequences in the websites. We compared clean with full n-grams, because exploration of uninformative texts showed that they have a larger proportion of numbers, symbols and separators. N-grams occuring in less than two documents were deleted from the vocabulary.
3.2.1Experimental design
We considered two filters: ‘strict’ and ‘lax’. ‘Strict’ considered both ‘maybe informative’ as well as ‘uninformative’ as containing no information on economic activity, while ‘lax’ only considered ‘uninformative’ as containing no relevant information. Therefore it is expected that lax filtering models are going to label more websites as useful than strict filtering models. In total we evaluated eight models: two statistical learning algorithms (NB, SVM) times two n-gram sets (cleaned, full) times two filters (strict, lax).
We evaluated these filter models by their micro-
3.2.2Results of the filtering algorithm
The scores per setting are given in Table 1. Values for the MCC ranged from 0.563 to 0.721 and for micro
Table 1
Results of models trained with the labeled set F
| Model | n-grams | Filter | MCC | Micro |
|---|---|---|---|---|
| NB | Cleaned | Lax | 0.703 | 0.891 |
| SVM | Cleaned | Lax | 0.587 | 0.804 |
| NB | Full | Lax | 0.721 | 0.897 |
| SVM | Full | Lax | 0.620 | 0.825 |
| NB | Cleaned | Strict | 0.563 | 0.766 |
| SVM | Cleaned | Strict | 0.705 | 0.818 |
| NB | Full | Strict | 0.611 | 0.790 |
| SVM | Full | Strict | 0.703 | 0.824 |
Notes. Models with bold numbers were retrained (
The number of websites selected by the four models to be useful are found in the final column of Table 2. Subsequently, the NACE prediction model was trained and tested for the different filtered websites. The first row in Table 2 shows the result for a model that was trained without using a filter. We found that both the MCC as well as the micro
Table 2
Results of NACE prediction model with filtered data
| Model | Weighting | n-grams | Filter | MCC | Micro | # useful websites |
|---|---|---|---|---|---|---|
| No filter applied | 0.452 | 0.462 | 40796 | |||
| NB | BM25 | Full | Lax | 0.478 | 0.486 | 38950 |
| NB | BM25 | Cleaned | Lax | 0.472 | 0.481 | 38886 |
| SVM | BM25 | Cleaned | Strict | 0.499 | 0.508 | 32870 |
| SVM | BM25 | Full | Strict | 0.503 | 0.511 | 32793 |
4.Knowledge-based approach to predicting NACE codes
4.1URL features
Berardi et al. [6] found that the URL contains information about economic activity. In line with their approach, we created URL features. First, the URL was split in its components using the symbols ‘.’, ‘/’, ‘_’ and ‘-’ as separators. Every split part is assumed to be a word. If these words are longer than three characters, character n-grams (with
4.2Concept features
The concept features were derived from a dictionary of keywords that were extracted from a semantic network that has especially been designed to determine the NACE code of businesses that register at the Chamber of Commerce [30, sec. 2]. In this dictionary, each NACE code has its own set of identifying keywords. We expanded the set of keywords per NACE code to be able to account for word variations. An additional reason for expanding the word set was that the words in the NACE dictionary were sometimes quite technical and did not necessarily coincide with the terminology used in website texts. We termed the resulting word set concept features, because they represent words related to the concepts underlying the definitions of the NACE categories and therefore those words have a theoretical association with our classification system of interest.
We used pre-trained Dutch word embeddings to find words that were similar to those in the dictionary (for an introduction to word embeddings, see Goodfellow et al.[31, p. 464]). The word embeddings were trained on multiple document sets with a vector length of 320 [32]. The following procedure was used to identify words similar to the NACE dictionary. First, compound words in the NACE dictionary were split by using the SECOS compound word splitter [33]. Split words were manually checked and corrected; they were eliminated if they did not refer to an economic activity (such as the word ‘bedrijf’, Dutch for company). For every word in the dictionary, the top 40 most similar website words were automatically added. Word similarity was estimated according to the cosine similarity of the embedding vector of a NACE dictionary word with a web page word. For example, the word embedding of the word ‘fiets’ (Dutch for bike) was compared to the word embedding of the words in all web pages with a label ‘bike shops’, yielding for instance ‘racefiets’ and ‘fietsketting’(racing bike; bicyle chain).
One disadvantage when finding similar words with word embeddings is that hierarchical and other semantic relations are not taken into account. As a consequence, not all automatically retrieved words were really related to the economic activity at hand. Therefore, a cosine similarity threshold of 0.4 was defined and words that appeared in an extensive Dutch stopword list were excluded. In total 21,333 words were selected in this way for the final knowledge-based feature set.
4.3Knowledge-based NACE hierarchy
The hierarchy levels of the NACE classification system are not consistent in the sense that they do not represent the same level of detail. Manufacturing of goods is spread over the two-digit NACE codes 10–33 while the sale of those goods are classified at three-digit levels and deeper (within 46 for sales to businesses and within 45 and 47 for sales to customers). This complicates efficient learning of statistical models. As explained in the introduction, instead of using the original NACE classification scheme, we decided to apply the same strategy as manual annotators at Statistics Netherlands.
An expert in business statistics created a two-level NACE code hierarchy. The first level contained the service sector and the production chain level (in case of goods). The production chain was further split up into manufacturing, sale to businesses, sale to customers, repair and so on. The groups at second level were delimited such that group sizes were aimed to be approximately balanced while keeping the activities per group as homogeneous as possible. (All NACE codes are mapped uniquely upon those groups, to ensure that the result can be used to assist manual editing.) The resulting classification system is given in the Appendix NACE classification system. The originally 649 different NACE codes were grouped into 22 first level and 111 second level classes. As a consequence, groups of four or five digit NACE codes are predicted, instead of individual codes. The result was still clearly imbalanced with 46 examples for the smallest and 1389 examples for the largest class.
4.4Classification algorithm
4.4.1Hierarchical classification model
We compared the use of the hierarchical classification, according to the knowledge-based hierarchy, with flat classification. Flat classification means to classify all labels in the classification system at once. Hierarchical classification takes relations between first and second level classes into account and thus reduces the number of labels that a classifier needs to discriminate [34]. The hierarchical algorithm that we implemented uses a local classifier for each parent node [34]. In the training phase, first a classifier for the first hierarchy level was trained using all training examples. Subsequently, for every node in the first level (called parent node) a new classifier was trained for the underlying classes (child nodes) with only those websites as training examples that were labelled as belonging to the parent node. To simplify the approach, all used classifiers within the hierarchy were of the same type (so one learning algorithm and one type of features).
Table 3
Comparison of filtered and unfiltered model results using NB
| Hierarchical | Features | Set U | Set N | ||
|---|---|---|---|---|---|
| MCC | Micro | MCC | Micro | ||
| No | Char. n-grams | 0.503 | 0.511 | 0.475 | 0.484 |
| Yes | Char. n-grams | 0.470 | 0.480 | 0.442 | 0.452 |
| No | Concept feat. | 0.448 | 0.457 | 0.414 | 0.423 |
| Yes | Concept feat. | 0.419 | 0.428 | 0.385 | 0.394 |
Table 4
Results of NACE prediction models for different experimental setups
| Hierarchical | Features | Model | MCC | Micro | Macro | Micro | Macro |
|---|---|---|---|---|---|---|---|
| Yes | Concept feat. | SVM | 0.481 | 0.490 | 0.419 | 0.580 | 0.494 |
| No | Concept feat. | SVM | 0.478 | 0.488 | 0.424 | 0.589 | 0.512 |
| Yes | Concept feat. | NB | 0.419 | 0.428 | 0.358 | 0.518 | 0.443 |
| No | Concept feat. | NB | 0.448 | 0.457 | 0.390 | 0.548 | 0.480 |
| Yes | Char. n-grams | SVM | 0.520 | 0.528 | 0.457 | 0.617 | 0.536 |
| No | Char. n-grams | SVM | 0.500 | 0.509 | 0.464 | 0.625 | 0.556 |
| Yes | Char. n-grams | NB | 0.470 | 0.480 | 0.384 | 0.540 | 0.432 |
| No | Char. n-grams | NB | 0.503 | 0.511 | 0.420 | 0.566 | 0.458 |
4.4.2Estimating classification probabilities
When the model performance was tested, a posterior probability for each predicted NACE class (given the web page text) was estimated. These posterior probabilities are directly available for the NB classifier because it is a probabilistic model, but this does not hold for the SVM classifier. Instead, SVM estimates a decision boundary between two classes and computes for each point a distance to this boundary. With SVM, one can estimate a posterior probability by using Platt scaling, see Platt [35]. With Platt scaling, a logistic model is trained with the class labels as dependent variable and the distance to the decision boundary as independent variable. These approximated posterior probabilities are often referred to as confidence scores. These (approximated) posterior probabilities were subsequently used to determine the overall first, second and third prediction, over the two levels of the hierarchical classification. Note that in case of flat classification with a SVM, Platt scaling is not needed, since only the most likely class is needed, which saves computational time.
In case of hierarchical classification, the probabilities are estimated for each level separately, and the final probability is obtained as the product of first level (parent node) and second level (child node) probabilities. Thus,
4.5Experimental settings
In total, we evaluated four types of settings: two labelled sets (N and U), two algorithms (NB, SVM), two feature types (concept features and n-grams) and two strategies for handling hierarchy (hierarchical versus flat classification). Furthermore, we can evaluate results at three prediction levels (most likely
4.6Results for predicting NACE codes
Figure 2.
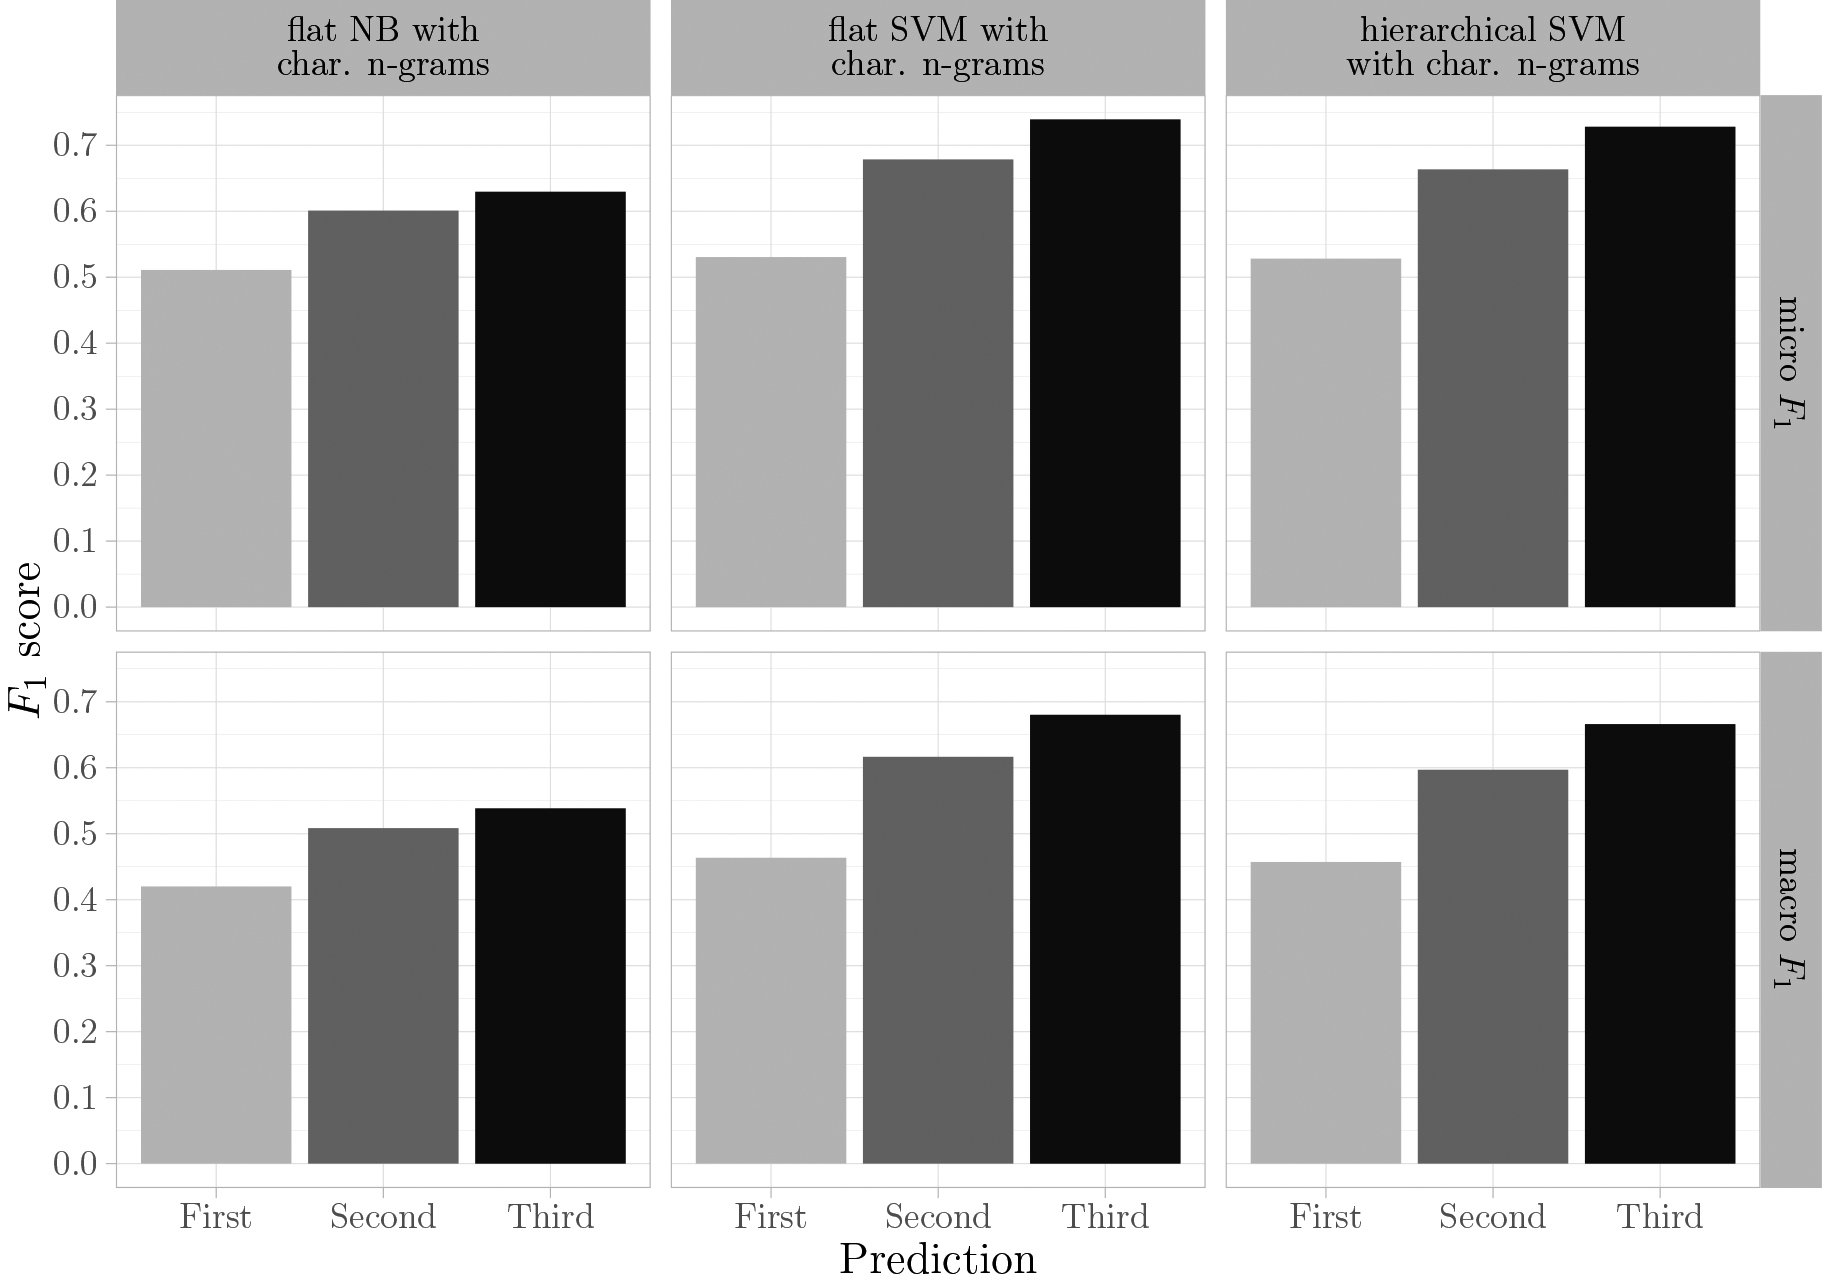
Model
This section is divided into two parts. In the first part, the filtering algorithm is evaluated by comparing NB models trained on the labelled sets N and U. Subsequently, only the labelled set U is used to compare all other different experimental settings.
4.6.1Evaluating the quality of the filter
Table 3 shows the results of all NB models trained on set U (filtered labelled NACE data) and set N (full labelled NACE data). All models showed a higher micro-averaged
4.6.2Evaluation of different experimental settings
The effect of classification strategy, feature type and algorithm on NACE prediction is evaluated on the labelled set U, see Table 4. Both MCC and micro-averaged
For editing purposes, the predicted NACE class with the second or third highest probability is also interesting. As explained in the introduction, it may well be that the main activity can be found on the web page but its presence might be less pronounced than another activity. As an example, the text on the web page may focus on selling furniture whereas the correct main activity is manufacturing of furniture. Therefore, we recomputed the
Finally, the distribution of the performance of the classification algorithms over different classes was examined. Figure 3 shows the micro
Figure 3.
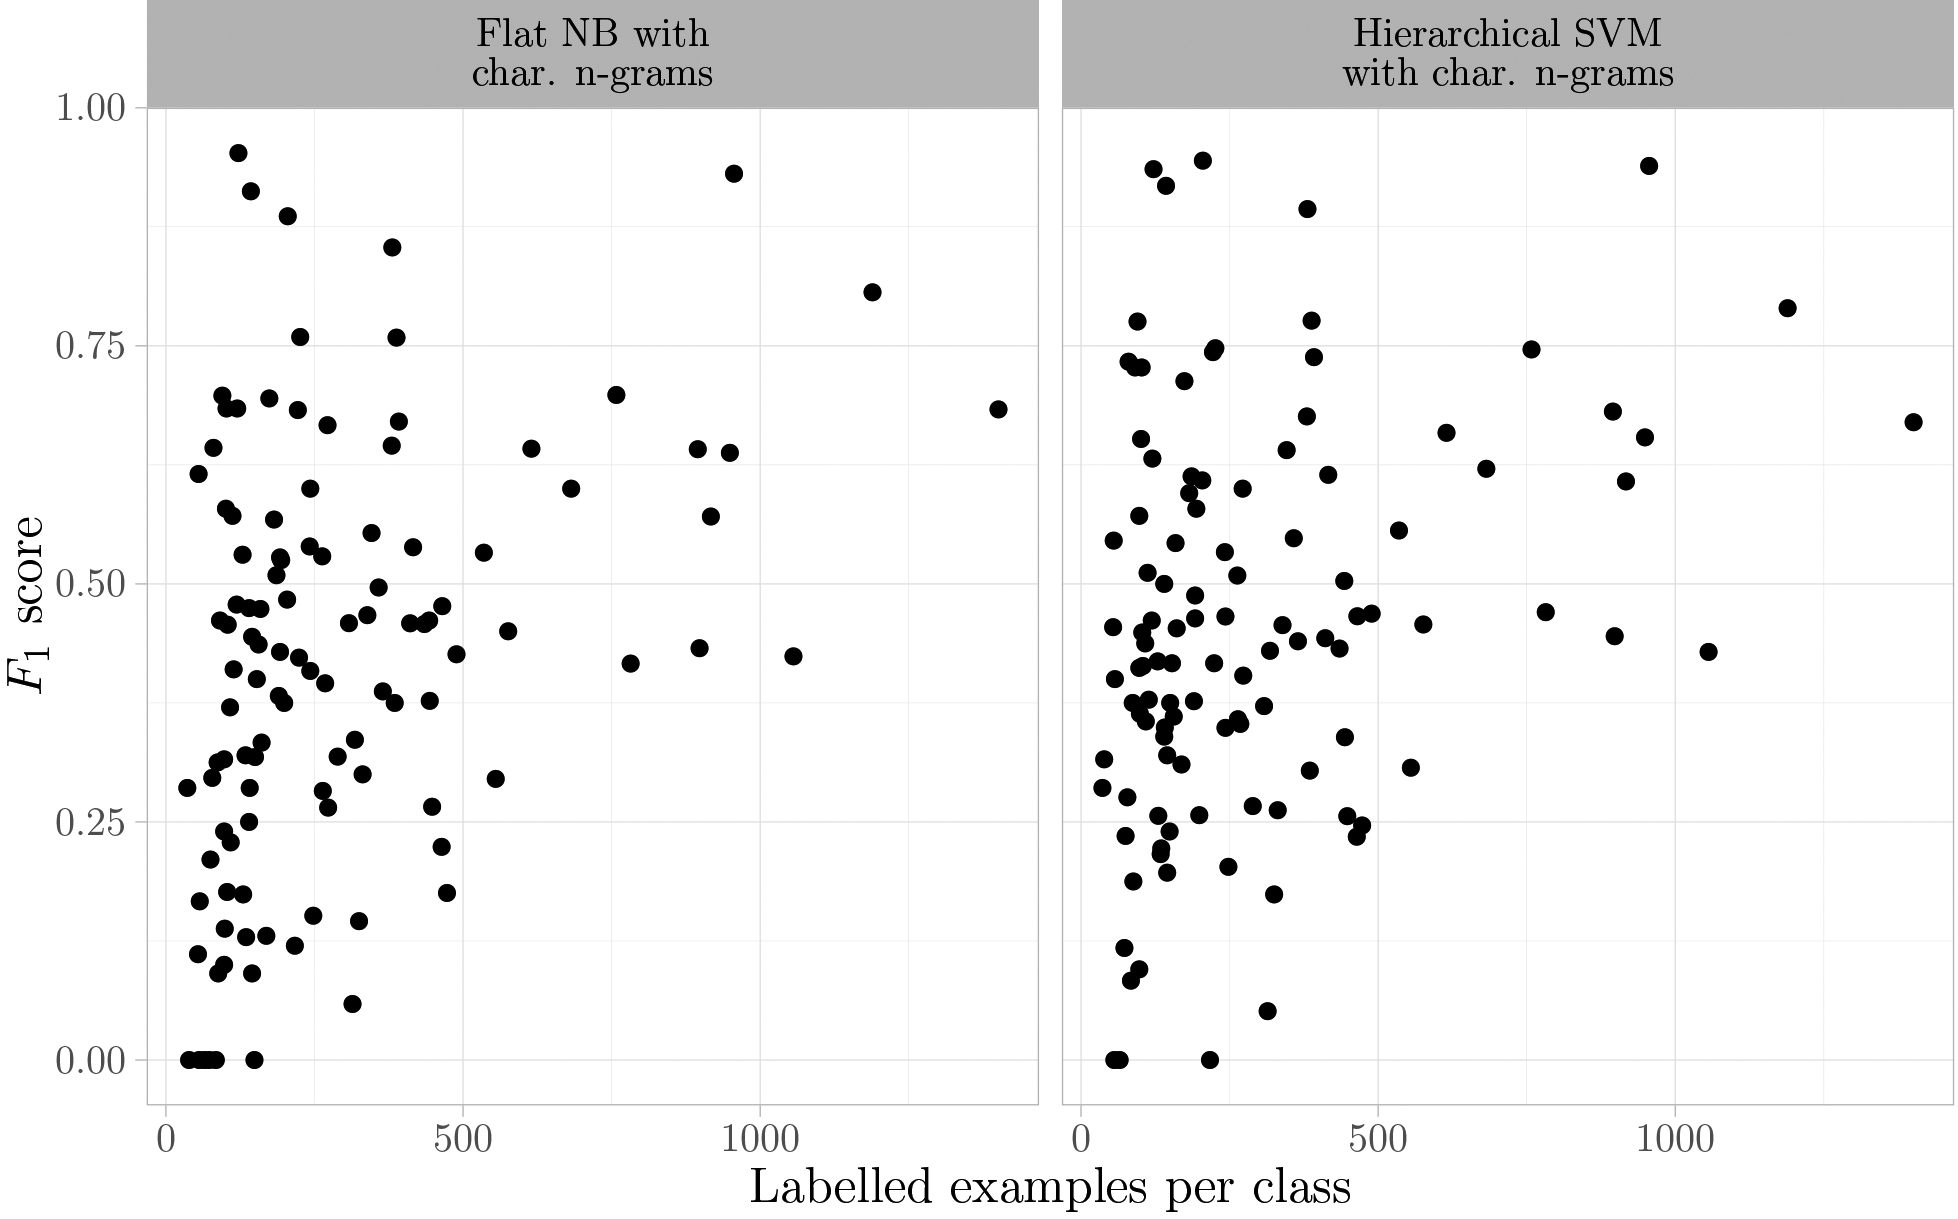
Two possible factors affecting model prediction performance are the number of training examples and the heterogeneity of the economic activities within a class. Heterogeneity can be expressed by the number of different economic activities included within one class but also in the size of enterprises that are represented by that class. As a result, the data does not only have between-class imbalance but also within-class imbalance [36]. We looked into these aspects using the hierarchical SVM model with n-gram features. Classes with a small number of training examples (less than 200) and an
5.Discussion
The first aim of the present study was to explore whether knowledge-based features can be used to reliably predict the main economic activity of enterprises from texts of dedicated websites, to support manual editing. We found that just using keywords extracted from a semantic network designed by Hacking [30] did not result in an improved model performance compared to the best performing models with character n-grams. However, we believe that it is worthwhile to try to improve the effectiveness of knowledge-based features, considering that 1) the number of concept features was much smaller than the number of n-grams whereas model performance was only slightly worse and 2) the advantage for official statistics of having features that are interpretable and logically related to the output label. A next step with the use of knowledge-based features could be to make use of word relations that can be found in a semantic network, for an overview see Sinoara et al. [37]. A simple approach could be that every NACE code is represented by a limited set of core words that are features of the machine learning model. The core words are related to the actual words used in the (web page) texts, referred to as descriptive words. A key challenge is to automatically expand the concept words with descriptive words. Perhaps semantic networks like WordNet or neural nets like BERT [38] can be used for this. When successful, such a generic approach is potentially also interesting for other well-defined classification variables in official statistics such as ‘highest attainable education level’, ‘type of occupation’, ‘cause of death’ and so on.
Since classification of enterprises is an ongoing task, it is important to avoid that the model performance deteriorates because concepts have changed (concept drift). Examples of economic activities prone to concept drift are codes related to clothing and codes related to IT-services. Lu et al. [39] provide a framework for learning under concept drift. One task is to regularly adapt the text mining model using an updated training set. Furthermore, one should maintain the knowledge-based features. We envisage a semi-automated system in which potentially new knowledge-based features are automatically found from new website texts; they are manually added as new features if useful.
The second aim of the present study was to explore whether the use of a knowledge-based hierarchy designed by an expert would be helpful to reliably predict main economic activity of enterprises. The use of the two-level hierarchy did not improve the classifier performance relative to a flat classification. A possible explanation for this finding is that some classes are too heterogeneous to benefit from the hierarchical strategy. The way to deal with heterogeneous classes needs to be investigated further. For instance one might split some of the classes into more homogeneous ones. However, if the remaining classes then have a small number of enterprises, automatic text mining might simply not be feasible for those classes.
The overall performance for the top-one predictions of the best model(s) measured with both micro-averaged
In the present study, we applied a filtering step to identify websites that do not contain information on economic activity. We tested this by first applying the filter model and then splitting the resulting part into a training and test set, independent of the test set for not applying a filter. Therefore the test sets had a limited overlap, which is less efficient for detecting differences. In next studies, it is more efficient to first split the complete labelled set into a training and test set, and then apply the filter model to both sets. Nonetheless, for all NACE prediction models the performance was better for the filtered set compared to the full set, which clearly indicated that the filtering step was effective.
Of course, the drawback of filtering uninformative websites is that for this portion of enterprises (20%) we were unable to predict a NACE code. Part of those websites certainly do not contain any information about economic activity, such as domains that are no longer active. It is therefore useful to filter those websites. Nonetheless, it is also interesting to investigate whether it is possible to predict economic activity for a part of the websites that were currently filtered. A possible approach would be to predict economic activity based on the texts of pages underlying the main page and/or based on texts obtained from social media profiles, for which links on the business websites can be found.
We foresee a number of future research activities. Firstly, instead of predicting the NACE code for every unit, we could also take the registered codes as the starting point and limit ourselves to identifying which of those codes are likely to be incorrect. That supports selective editing by manual editors. Secondly, besides dedicated website texts one could explore the suitability of other sources to learn about enterprise activities, such as pictures, website links, social media activities, news articles, yearly reports and (publicly available) membership lists. Thirdly, instead of mapping available information to a fixed activity classification it would also be very useful to group similar activities without using a prescribed classification. For this task, unsupervised methods could be used. Finally, there is public interest in all kinds of new (binary) classifications, such as whether enterprises are innovative, have environmentally-friendly activities, can deliver products at home and whether they have a family business. An interesting research topic is whether it is feasible to use a pre-trained machine learning model which generically picks up different enterprise activities and that could subsequently be adapted for a specific classification after additional training; see Du et al.[7] for an example.
Acknowledgments
We thank Arjan van Loon for designing the custom NACE classification system and for annotating nearly 1000 websites for the filtering step. Furthermore, we thank Mark van der Loo for his valuable advice and feedback. Finally, we thank the anonymous referees whose remarks considerably helped to improve earlier versions of the manuscript.
References
[1] | Van Delden A, Scholtus S, Burger J. Exploring the Effect of Time-Related Classification Errors on the Accuracy of Growth Rates in Business Statistics. In: Proceedings of the ICES V conference. Geneva, (2016) . |
[2] | Christensen JL. Questioning the precision of statistical classification of industries. In: Proceedings of the 25th DRUID Conference on Entrepreneurship and Innovation. Copenhagen, (2008) . |
[3] | Heljala H. Methods and Challenges of Quality Measurement – Finland’s Experiences. In: Measurement of the Quality of Statistical Business Registers – Practical Experiences. Statistics Austria. Vienna, 2014. Available from: http//www.statistik.at/ web_en/about_us/events/wiesbaden_group_meeting_2014/ agenda. |
[4] | Van Delden A, Scholtus S, Burger J. Accuracy of mixed-source statistics as affected by classification errors. Journal of Official Statistics. (2016) ; 32: (3): 619-642. |
[5] | Barcaroli G, Scannapieco M. Integration of ICT survey data and Internet data from enterprises websites at the Italian National Institute of Statistics. Statistical Journal of the IAOS. (2019) ; 35: : 643-656. |
[6] | Berardi G, Esuli A, Fagni T, Sebastiani F. Classifying websites by industry sector: a study in feature design. In: Proceedings of the 30th Annual ACM Symposium on Applied Computing. ACM, (2015) , pp. 1053-1059. |
[7] | Du M, Han Y, Zhao L. A Heuristic Approach for Website Classification with Mixed Feature Extractors. In: Proceedings of the IEEE 24th International Conference on Parallel and Distributed Systems (ICPADS). (2018) . pp. 134-141. |
[8] | Jones R, Elias P. Cascot: Computer Assisted Structured Coding Tool. Coventry: Warwick Institute for Employment Research, (2004) . Available from: https//warwick.ac.uk/fac/soc/ier/software/cascot/. |
[9] | Gweon H, Schonlau M, Kaczmirek L, Blohm M, Steiner S. Three methods for occupation coding based on statistical learning. Journal of Official Statistics. (2017) ; 33: (1): 101-122. |
[10] | Giorgetti D, Sebastiani F. Automating survey coding by multiclass text categorization techniques. Journal of the American Society for Information Science and Technology. (2003) ; 54: (14): 1269-1277. |
[11] | Sebastiani, F. Machine learning in automated text categorization. ACM Computing Surveys. (2002) ; 34: (1): 1-47. |
[12] | Scrapy 15. documentation. 2016. Available from: https://doc.scrapy.org/en/latest/index.html. |
[13] | Nakatani S. Language Detection Library. (2010) ; Available from: https//github.com/Mimino666/langdetect. |
[14] | Pedregosa F, Varoquaux G, Gramfort A, Michel V, Thirion B, Grisel O, Blondel M, Prettenhofer P, Weiss R, Dubourg V. Scikit-learn: Machine learning in Python. Journal of Machine Learning Research. (2011) ; 12: : 2825-2830. |
[15] | Eurostat. Structural business statistics introduced. In: Statistics Explained. (2018) , Available from: https://ec.europa.eu/eurostat/statistics-explained/index.php/Structural%5C_business%5C_statistics%5C_introduced. |
[16] | Roelands M, Van Delden A, Windmeijer D. Classifying businesses by economic activity using web-based text mining. CBS Discussion Paper, (2017) ; Available from: https//pdfs.semanticscholar.org/eff6/d462f1af3923148f8cc69f382a8f63bfef15.pdf. |
[17] | McNamee P, Mayfield J. Character N-Gram tokenization for european language text retrieval. Information Retrieval. (2004) ; 7: (1): 73-97. |
[18] | Damashek M. Gauging Similarity with n-Grams: Language-Independent Categorization of Text. Science. (1995) ; 267: (5199): 843-848. |
[19] | Schütze H, Manning CD, Raghavan P. Introduction to information retrieval. Online edition. Cambridge: Cambridge University Press; (2008) , Available from: https//nlp.stanford.edu/IR-book/. |
[20] | Robertson S, Zaragoza H. The Probabilistic Relevance Framework: BM25 and Beyond. Foundations and Trends R in Information Retrieval. (2010) ; 3: (4): 333-389. |
[21] | Gentzkow M, Kelly BT, Taddy M. Text as data. Journal of Economic Literature. (2019) ; 57: (3): 535-574. |
[22] | Bird S, Klein E, Loper E. Natural language processing with Python: analyzing text with the natural language toolkit. Updated online edition. Sebastopol: O’Reilly Media; (2009) , Available from: http//www.nltk.org/book/. |
[23] | Zhang H. The Optimality of Naive Bayes. In: Proceedings of the Seventeenth International Florida Artificial Intelligence Research Society Conference. Vol. 2, (2004) . Available from: https//www.cs.unb.ca/%5Ctextasciitilde%20hzhang/publications/FLAIRS04ZhangH.pdf. |
[24] | James G, Witten D, Hastie T, Tibshirani R. An introduction to statistical learning: with applications in R. Springer Series in Statistics. New York: Springer, (2013) . |
[25] | Hastie T, Tibshirani R, Friedman J. The elements of statistical learning: data mining, inference, and prediction. Second Edition. Springer Series in Statistics. New York: Springer, (2009) . |
[26] | Powers DM. Evaluation: from precision, recall and F-measure to ROC, informedness, markedness and correlation. Journal of Machine Learning Technologies. (2011) ; 2: (1): 37-63. |
[27] | Jurman G, Riccadonna S, Furlanello CA. Comparison of MCC and CEN error measures in multi-class prediction. PLoS ONE. (2012) ; 7: (8): e41882. |
[28] | Gorodkin J. Comparing two K-category assignments by a K-category correlation coefficient. Computational Biology and Chemistry. (2004) ; 28: (5): 367-374. |
[29] | Radev DR, Qi H, Wu H, Fan W. Evaluating web-based question answering systems. In: Proceedings of the Third International Conference on Language Resources and Evaluation (LREC’02); Las Palmas: European Language Resources Association (ELRA), (2002) , pp. 1153-1156. |
[30] | Hacking W. Method module: Automatic coding based on semantic networks. In: Memobust Handbook on Methodology of Modern Business Statistics. Eurostat, (2014) ; Available from: https//ec.europa.eu/eurostat/cros/content/coding%5C_en. |
[31] | Goodfellow I, Bengio Y, Courville A. Deep Learning. Cambridge: MIT Press; (2016) , Available from: http//www.deeplearningbook.org. |
[32] | Tulkens S, Emmery C, Daelemans W. Evaluating Unsupervised Dutch Word Embeddings as a Linguistic Resource. In: Proceedings of the Tenth International Conference on Language Resources and Evaluation (LREC 2016), Portorož: European Language Resources Association (ELRA), (2016) , pp. 4130-4136. |
[33] | Riedl M, Biemann C. Unsupervised Compound Splitting With Distributional Semantics Rivals Supervised Methods. In: Proceedings of The 15th Annual Conference of the North American Chapter of the Association for Computational Linguistics, Human Language Technologie. San Diego, (2016) , pp. 617-622. |
[34] | Silla CN, Freitas AA. A survey of hierarchical classification across different application domains. Data Mining and Knowledge Discovery. (2011) ; 22: (1): 31-72. |
[35] | Platt JC. Probabilistic Outputs for Support Vector Machines and Comparisons to Regularized Likelihood Methods. In: A.J. Smola, P. Bartlett, B. Schölkopf, D. Schuurmans, eds, Advances in Large Margin Classifiers. Vol. 10. Neural Information Processing series. Cambridge: The MIT press, (1999) , pp. 61-74. |
[36] | He H, Garcia EA. Learning from imbalanced data. IEEE Transactions on Knowledge Data Engineering. (2008) ; 21: (9): 1263-1284. doi: 10.1109/TKDE.2008.239. |
[37] | Sinoara RA, Antunes J, Rezende SO. Text mining and semantics: a systematic mapping study. J Braz Comput Soc. (2017) ; 23: (1): 9. |
[38] | Devlin J, Chang MW, Lee K, Toutanova K. BERT: Pre-training of Deep Bidirectional Transformers for Language Understanding. In: Proceedings of the 2019 Conference of the North American Chapter of the Association for Computational Linguistics: Human Language Technologies, Volume 1 (Long and Short Papers). Minneapolis, Minnesota: Association for Computational Linguistics, (2019) , pp. 4171-4186. |
[39] | Lu J, Liu A, Dong F, Gu F, Gama J, Zhang G. Learning under concept drift: A review. IEEE Transactions on knowledge and data engineering. (2019) ; 31: (12): 2346-2363. |
[40] | Frénay B, Verleysen M. Classification in the presence of label noise: a survey. IEEE Transactions on Neural Networks and Learning Systems. (2014) ; 25: (5): 845-869. |
Appendices
Appendix
NACE classification system
Table 5
The custom NACE classification system used for prediction
| First hierarchy level | Second hierarchy level (NACE) |
|---|---|
| Cleaning activities | General cleaning of buildings (8121); other cleaning activities (8122, 8129) |
| Manufacturing | Machinery and equipment (26–28); oil-based and chemical products (19–22); wood and construction materials (16, 23); food, beverages and tobacco products (10–12); furniture (31); motor vehicles and motor cycles (29, 3091); other transport equipment (301, 302, 303, 3092, 3099); other manufacturing (32); paper and printing (17, 18); metal (24, 25); Clothing, shoes, leather, textile (13-15) |
| Car trade | Motor vehicles and motor cycles (451, 453, 454) |
| Other real estate activities | Other real estate activities (6810, 6832) |
| Employment activities | Loan desks (78202); temporary employment agencies (78201); payroll service bureaus (7830); employment placement agencies (7810) |
| Travel sector | Tour operator and reservation service activities (7912, 7990); travel agency activities (7911) |
| Other service activities | Agricultural support activities (016); funeral and related activities (9603); washing and dry-cleaning, physical well-being (9601, 9604); hear dressing and beauty treatment (9602) |
| Energy, water and waste | Water, sewerage, waste management (36-39); energy (35) |
| Repair | Machinery and equipment (3312, 3313, 3314, 951); other repair (3311, 3315-3319, 952); motor vehicles and motor cycles (452) |
| Renting and leasing | Machinery and equipment (773); motor vehicles and motor cycles (771); lease (7740); real estates (682); personal and household goods (772) |
| Professional services | Legal and accounting activities (69); market research and opinion polling (7320); specialised design activities (741); scientific research and development (72); architectural activities (7111); facilities support activities (8110); engineering, technical consulting (7112, 712); landscape service activities (8130); other professional, scientific, technical activities (7490); photographic activities (742); office support activities (82); advertising (731); management consultancy activities (702); translation activities (7430); security and investigation activities (80); activities of head offices (701); veterinary activities (7500) |
| Retail trade | Automotive fuel (4730); food, beverages and tobacco products (4711, 472); other retail trade (4719, 4752, 47597, 476, 47741, 4775-4777, 47782, 47789, 4779, 47911, 47913, 47916, 47918, 47919, 4799); electrical household appliances (474, 4754, 47781, 47912); pharmaceutical and medical goods (4773, 47742); furniture and home accessories (47591-47596, 47915); clothing, shoes, leather, textile (4751, 4753, 4771, 4772, 47914) |
| Activities on fee or contract basis | Machinery and equipment (4614); other activities on a fee or contract basis (4611-4613, 4615-4619); real estates (6831) |
| Construction | Other specialised construction activities (439); electrical installation (4321); plumbing, fitting, piping systems (43221); floor and wall covering (433); development of building projects (4110); other construction installation (4329); demolition and site preparation (431); civil engineering (42); installation of heating systems (43222); buildings (4120) |
| Transport | Other transport (4910, 4920, 4931, 4939, 4950, 51); water transport (50); postal and courier activities (53); taxi operation (4932); support activities for transportation (522); warehousing and storage (521); freight transport by road (494) |
| Installation | Machinery and equipment (332) |
| Accomodation and food service | Short-stay accomodation (552); fast-food and ice cream vendors (56102); hotels (551); restaurants (56101); beverage serving activities (5630); canteens and event catering (562) |
| Whole sale trade | Machinery and equipment (466); whole sale of other consumer products (46436, 4645, 4648, 4649); oil-based and chemical products (46711, 46712, 4675); informa tion and communication equipment (465); wood and construction materials (4673); food, beverages and tobacco products (463); electrical household appliances (46431–46435); pharmaceutical and medical goods (4646); metal (4674); agricultural raw materials and live animals (462); furniture and home accessories (4644, 4647); other whole sale (46713, 4672, 4676, 4677, 469); clothing, shoes, leather, textile (4641, 4642) |
|
Table 5, continued | |
|---|---|
| First hierarchy level | Second hierarchy level (NACE) |
| Information and communication | Information service activities (63); publishing activities (581); production and distribution of movies, television, radio (59, 60); telecommunications (61) |
| Computer-related services | Software publishing and computer programming (582, 6201); other computer service activities (6203, 6209); computer consultancy activities (6202) |
| Care | Social work activities for elderly (88102); child day-care activities (8891); other social work activities without accomodation (8899); company doctor and medical laboratory (86922, 86924) |
| Mining and quarrying | Mining and quarrying (06, 08, 09) |


