
Conversation with Monica Dashen and Rachel Green: Haitian Aid/Hurricane Matthew Aftermath Survey Project1

|
| Monica Dashen Rachel Green |
Interviewer: Before we get to the specifics of the project, can you talk about the circumstances and background of Hurricane Matthew.
On October, 2016, Hurricane Matthew (category 4)33 pummeled the southern and northwestern portions of Haiti, a Caribbean island, with 140 mph winds and torrential rain storms. Rivers flooded nearby homes, sweeping away personal belongings, crops, animals, and homes, leaving people with little food and shelter. People sought shelter in nearby schools, churches, or with other family members. The winds turned nails, tin roofs, and tree branches into daggers. Such injuries are prone to tetanus if left untreated. Unclean water is the source of cholera and other diseases. Matthew swept away sources of clean water and latrines, thereby increasing the chances that people will drink unclean water. Cholera outbreaks occurred. Medical facilities were destroyed.
On October 7, three days later, the Dominicans arrived with 5,000 trucks filled with food and sanitation supplies. (Haiti and the Dominican Republic share Hispaniola, a Caribbean island.) The Dominicans repaired roads along the way and unloaded the aid at a distribution site located in Port-au-Prince, the Haitian capital. (Port-au-Prince was largely spared from Matthew’s wrath.) Other aid organizations followed suit. USAID’s Office of U.S. Foreign Disaster Assistance had pre-positioned supplies in certain areas prior to Matthew. The UN offered food and mapped out Matthew’s path, including the location of closed cholera clinics. The Salvation Army deployed their troops to assess and repair damage to the schools in the hardest hit areas of the South. Dutch volunteer doctors stitched up injuries. Help was available.
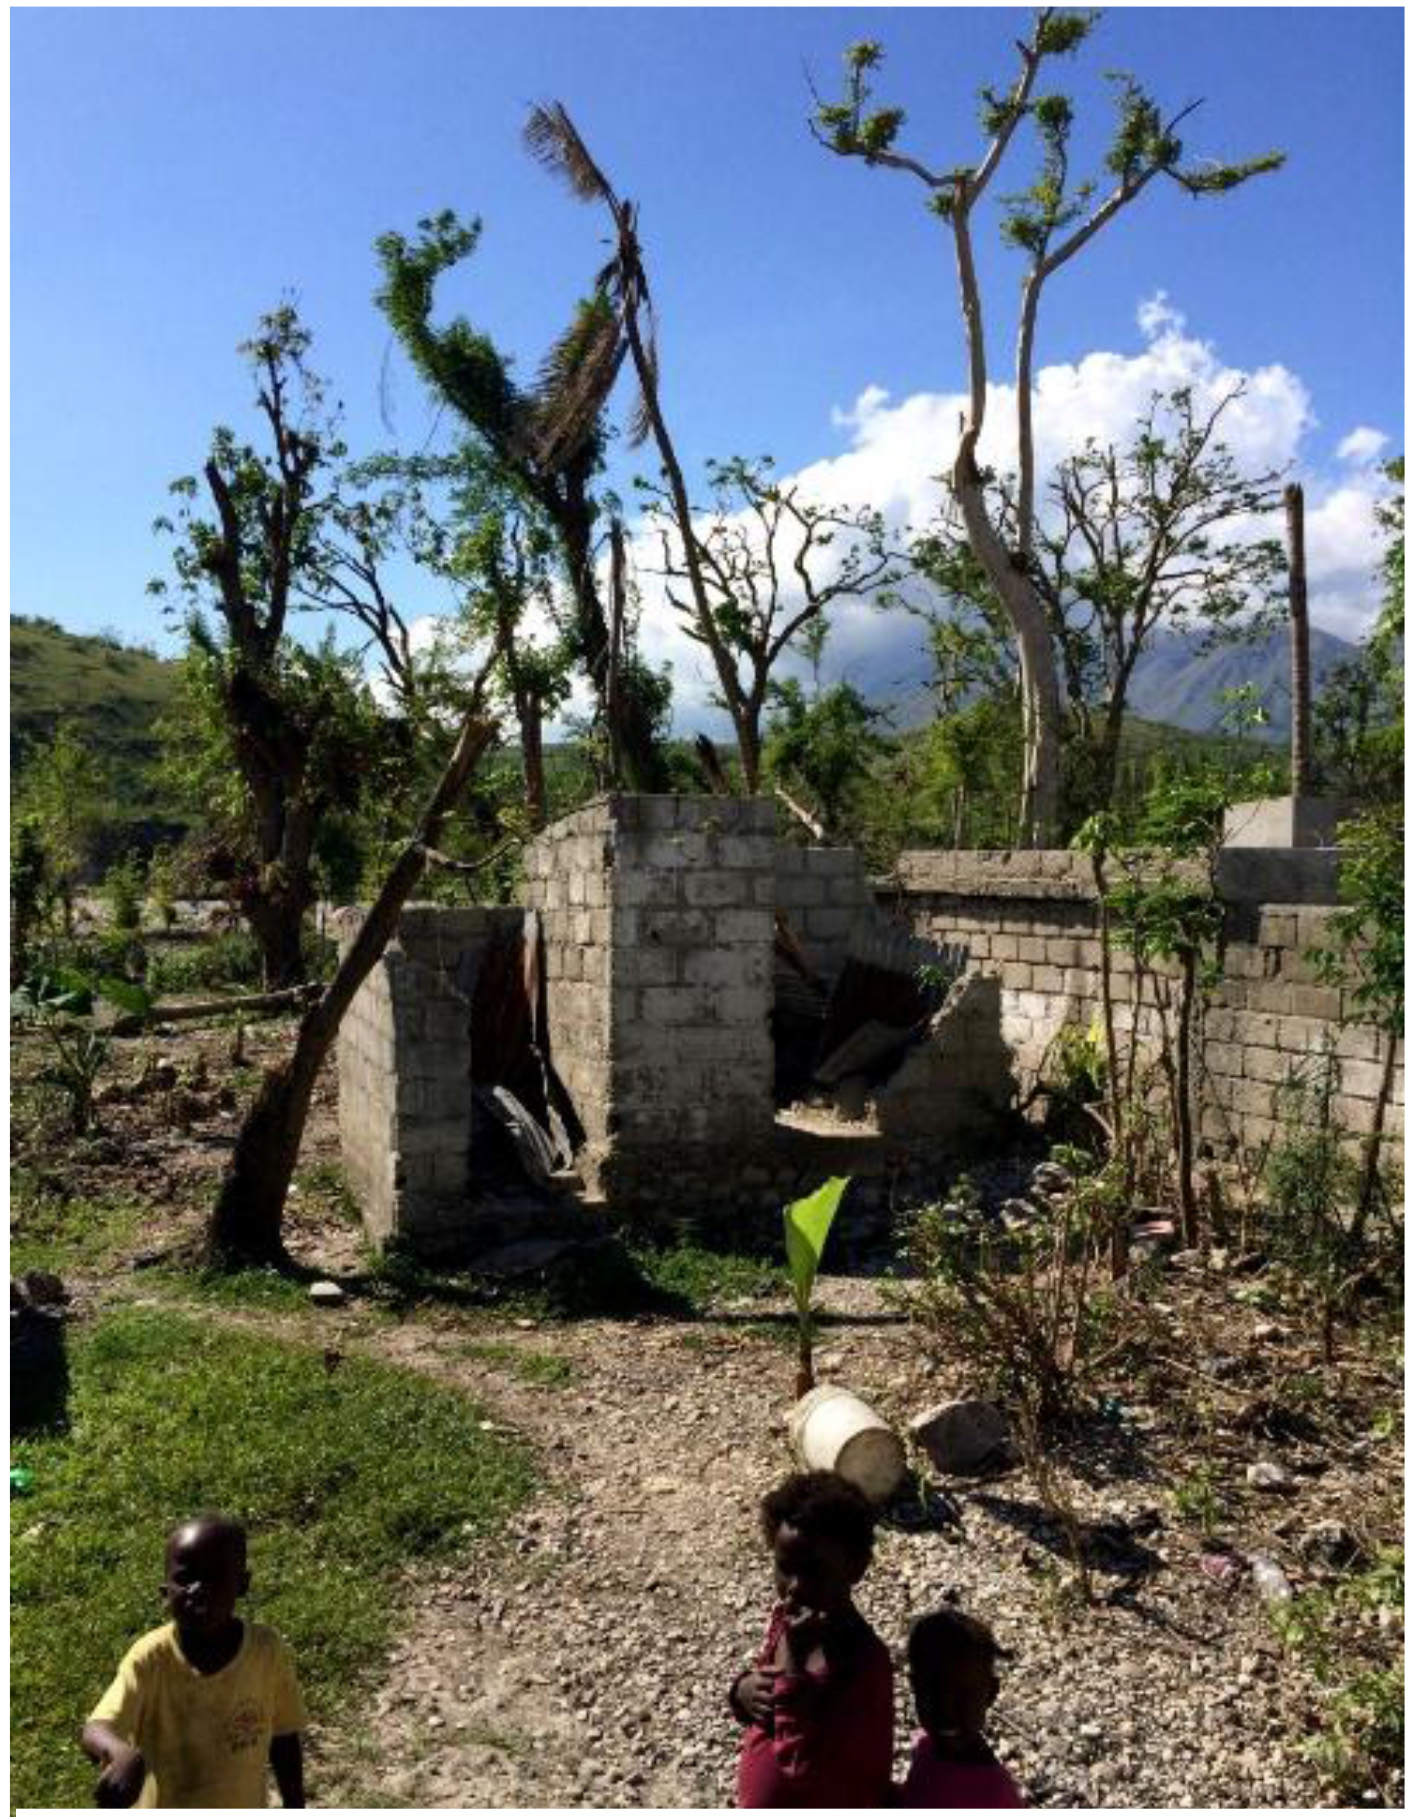
Figure 1.
Damage from Hurricane Mathew in the South.
Typically, aid distribution from large organizations is coordinated through the Haitian government. For example, USAID’s Hurricane Matthew Disaster Assistance Response Team worked directly with the Haitian Directorate of Civil Protection to tailor aid distribution to the specific needs of the affected locations.44 Aid is typically dropped off at a school or another public facility in a commune center. The people residing in the nearby sub-communes must find a way to obtain the aid from the center.
Disasters bring chaos and confusion. Data can clarify the situation. Aid organizations can readily report the “what,” “where,” and the “how” of the distribution. The UN’s Office for the Coordination of Humanitarian Affairs (OCHA) provides weekly updates of aid delivered, and assessments.66 For example, OCHA provides a count each week of food delivered by the World Food Programme to each department and commune distribution site, along with any security incidents. To the best of our knowledge, this food count is based on the amount of food unloaded from the truck at the distribution site in each commune center.
However, it is the “who” of the distribution that is more difficult to identify or even may remain unknown. There are fairly rural parts of Haiti in the South. Are only those people closest to the distribution site receiving the aid? Are only those people, who can afford this supposedly free aid, receiving it? Here is where SwB stepped in. SwB is a pro-bono Outreach Group of the American Statistical Association (ASA).77
SwB conducted a survey of the “who.” Specifically, SwB sought to find out:
(1) who received the aid,
(2) who did not receive aid,
(3) who lost the most after Matthew (e.g., job, home, possessions, and crops),
(4) who was aware of disease danger signs,
(5) who used the prescribed diarrhea treatments, and
(6) who was aware of the availability of health care?
To answer these questions, SwB conducted a nationwide household survey. This survey represents a “snapshot” of the aid distribution and aftermath just five weeks after Hurricane Matthew.
This household survey approach differs from OCHA’s counts in that it includes a representative sample of everyone eligible for aid – those who received it and those who did not.88 In contrast, the OCHA’s counts are more inventory like.99 To the best of our knowledge, this count is based on aid handed out from the truck or distribution site. If SwB only interviewed those people at the truck obtaining aid, we would just learn about those people who received it.
Using household survey data to validate aid distribution is not new. In conjunction with the government, UNICEF distributes five childhood lifesaving vaccines to health care providers. The data collected in the vaccination module of the Multi Indicator Cluster Survey (sponsored by UNICEF), for example, provides insights into whether the healthcare workers did in fact give the children these lifesaving vaccines.1010
What is new is the usage of household surveys to confirm aid distribution from more than one source shortly after an immediate crisis. This work provides just such a measure. In fact, this household aid distribution survey can be readily applied to an immediate crisis situation like Matthew or more prolonged ones like famines in Ethiopia. This survey was sponsored by the American Statistical Association.
Interviewer: Specifically, can you tell us what kind of damage happened in Haiti with respect to Hurricane Matthew.
Hurricane Matthew damaged many crops, homes, schools, and roads in the South, Grande’ Anse and Nippes departments; it killed over 1,000 people in the immediate aftermath. OCHA has provided weekly accounts of the humanitarian needs and response.
According to OCHA’s January 17, 2017 Situational Report:1111
Safe water
An estimated 750,000 people require safe water for drinking, cooking and personal hygiene. UNICEF has delivered safe water to 281,000 people more than one time. And 38,923 hygiene kits have been distributed since the beginning of the response.
Food
An estimated 1.4 million people are in need of urgent food aid because there was a widespread loss of crops, livestock and seeds. In response, the World Food Programme has delivered 14,096 metric tons of food. To offset the inevitable acute malnutrition, UNICEF has provided 23,193 children under age five with micronutrients.
Shelter/Personal Belongings
An estimated 1,579,900 persons have lost or damaged shelter and non-food times. As of December 21, 2016, and since the beginning of the response 37,233 blankets, 18,166 jerry cans, 29,913 kitchen kits, and 92,030 tarpaulins have been distributed.
The long distances and poor road infrastructure can limit the storage, division, and delivery of aid. For example, Hurricane Matthew swept away the only bridge leading into the south department from Port-au-Prince, thereby making it difficult for trucks filled with aid to enter into the south quickly right after the crisis. In preparation of Matthew’s wrath, USAID and their partners pre-positioned supplies in the most affected departments (or states), thereby making the distribution of aid more efficient
The damage was certainly greater after the 2010 earthquake than after Hurricane Matthew. The earthquake of January 2010 destroyed homes, schools, government buildings, and roads around Port-au-Prince.1212 In a nationally representative phone survey, two groups of SwB researchers found that 49% of the households experienced changes of members and about 18% reported that at least one child left the household or died. Employment rates were still affected five months later.1313,1414
The assessment of damage after a crisis is not new. The Salvation Army officials, for example, are assessing school damage after Matthew in the Grand’ Anse department. What is new is the more general assessment of damage that is not just specialized to a particular program. Like Kim et al. (2014)1515 and Orelien et al. (2013),1616 the present work looks at the type of home damage – total or partial and where people are currently residing as well as household membership change and items lost. The present work compliments that of OCHA’s updates on home displacement (the number of people living in shelters) by providing more detail about the type of home damage and loss.
Interviewer: Wow! That’s amazing. How did each of you learn about this project? And how did you prepare for going into the field?
Monica Dashen
I first thought of the aid distribution survey idea after talking to an UN official in Ethiopia. Right now, the northern and eastern areas of Ethiopia are experiencing a long term drought and aid is delivered to the schools. Gary Shapiro, Rachel Green and I helped this UN official set up a pilot survey where school officials were asked to report the number of student absences and aid deliveries on a monthly basis. I was reminded of this aid project after Hurricane Matthew struck Haiti and thought of an earlier SwB project on the Haitian Earthquake. I spoke to Fritz Scheuren about the scope and implementation of this project and am grateful to the other earthquake authors who took the time to share their materials, insights and contacts in Haiti. Likewise, I am appreciative of the American Statistical Association’s financial support.
Rachel Green
I first heard about this project in an email from Monica, which was something like “Hey, I’m about to go to Haiti for a SwB project, can you help out with some survey design?” (Monica and I met when we worked on a SwB project together involving the Humanitarian ID software.)
When I first saw the survey aims it seemed a little bit optimistic to collect a range of information on many sensitive topics while maintaining short interview times. There is something of a challenge in designing survey questions for an environment that can seem far from where you live. For example when looking at the questions on awareness of cholera treatments and symptoms, I wondered how I and others would have done at identifying cholera.
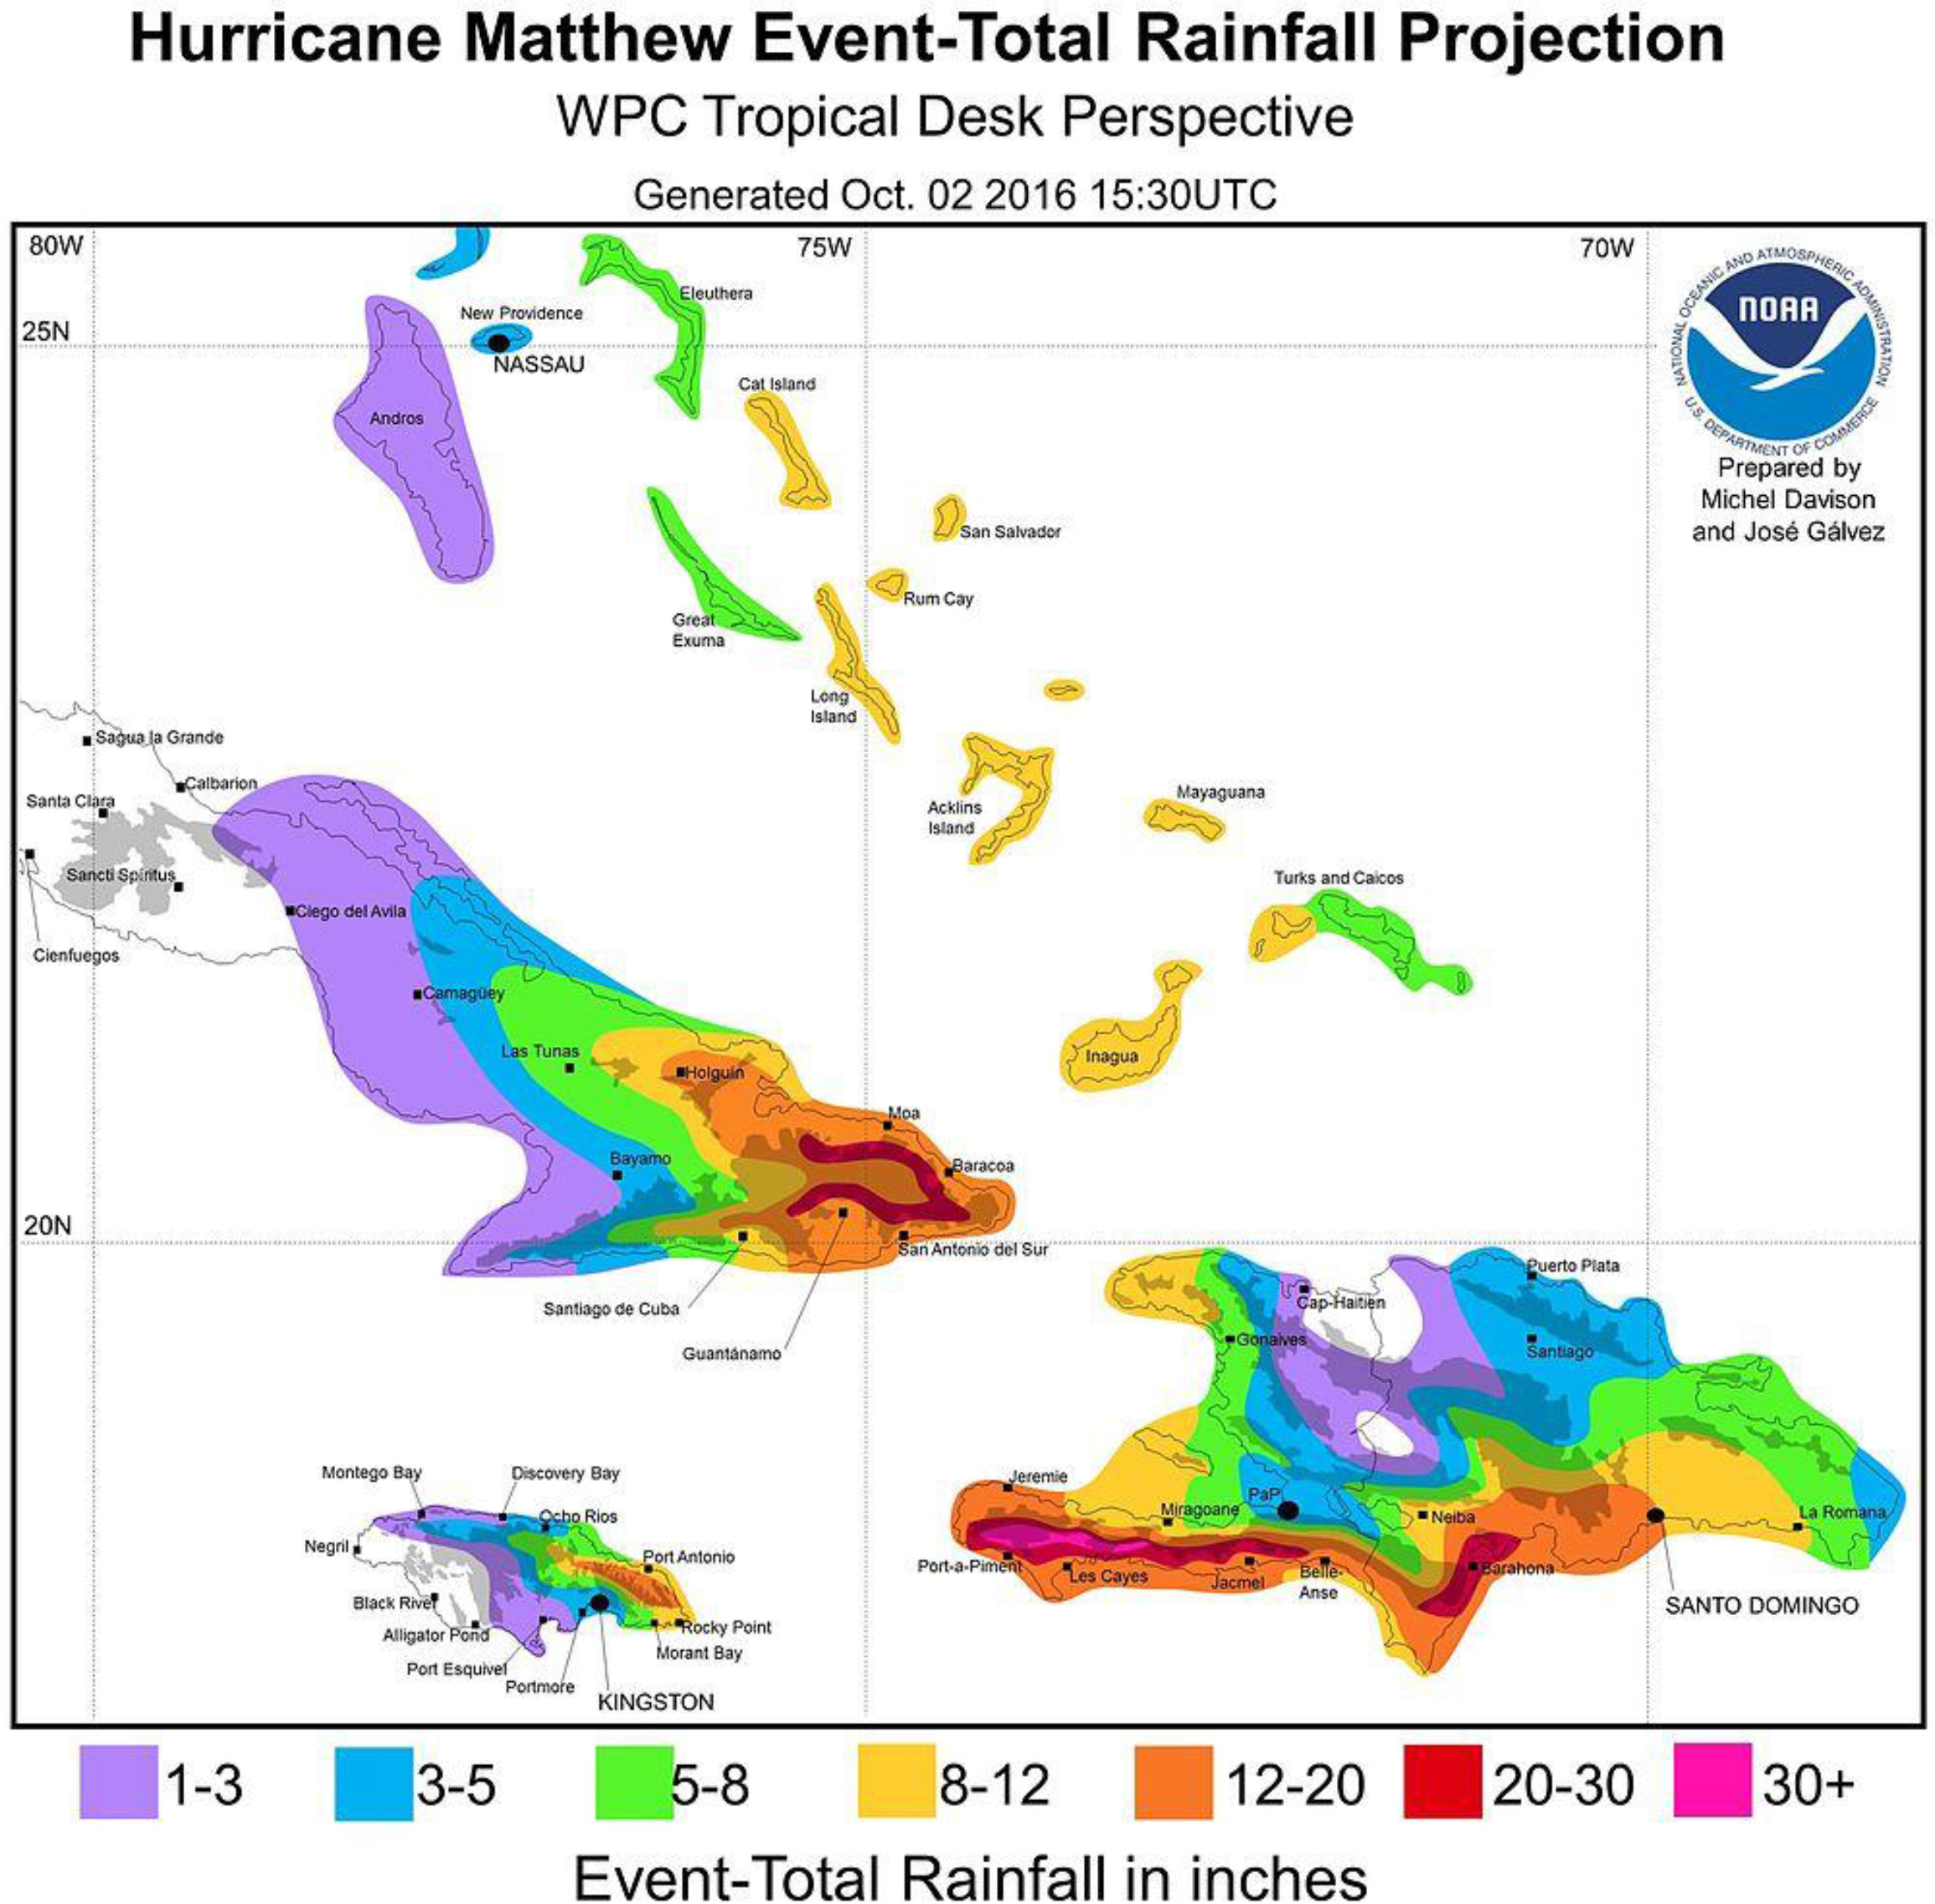
Chatr 1 shows the total rainfall projected across Haiti from NOAA. It was projected that the greatest rainfall totals from Hurricane Matthew would be localized in the southeastern Haiti.1717
Interviewer: What intrigued each of you most about this project?
Monica Dashen
I had some interesting discussions with the interviewers in the field about the complications of delivering aid. The team and I agreed that these people were on the border line of survival prior to Matthew. These people grew their own food (e.g., plantains and corn) and rarely bought food. Matthew swept their crops away and sometimes their food stashes. The team and I agreed that handouts were a short term solution. Seeds and animals are a long term solution. Frankly, I wonder whether the survey participants (of November 2016) are still alive.
Rachel Green
One of the challenges in this project was in deciding how to ask about sensitive topics in a way that provided people an opportunity to share their stories without adding to (or causing) distress for participants. Balanced with this we needed data that was useful for discussions on health, aid, and the impact of Matthew. After doing some of the data analysis, I appreciate even more the people who translated the results into English.
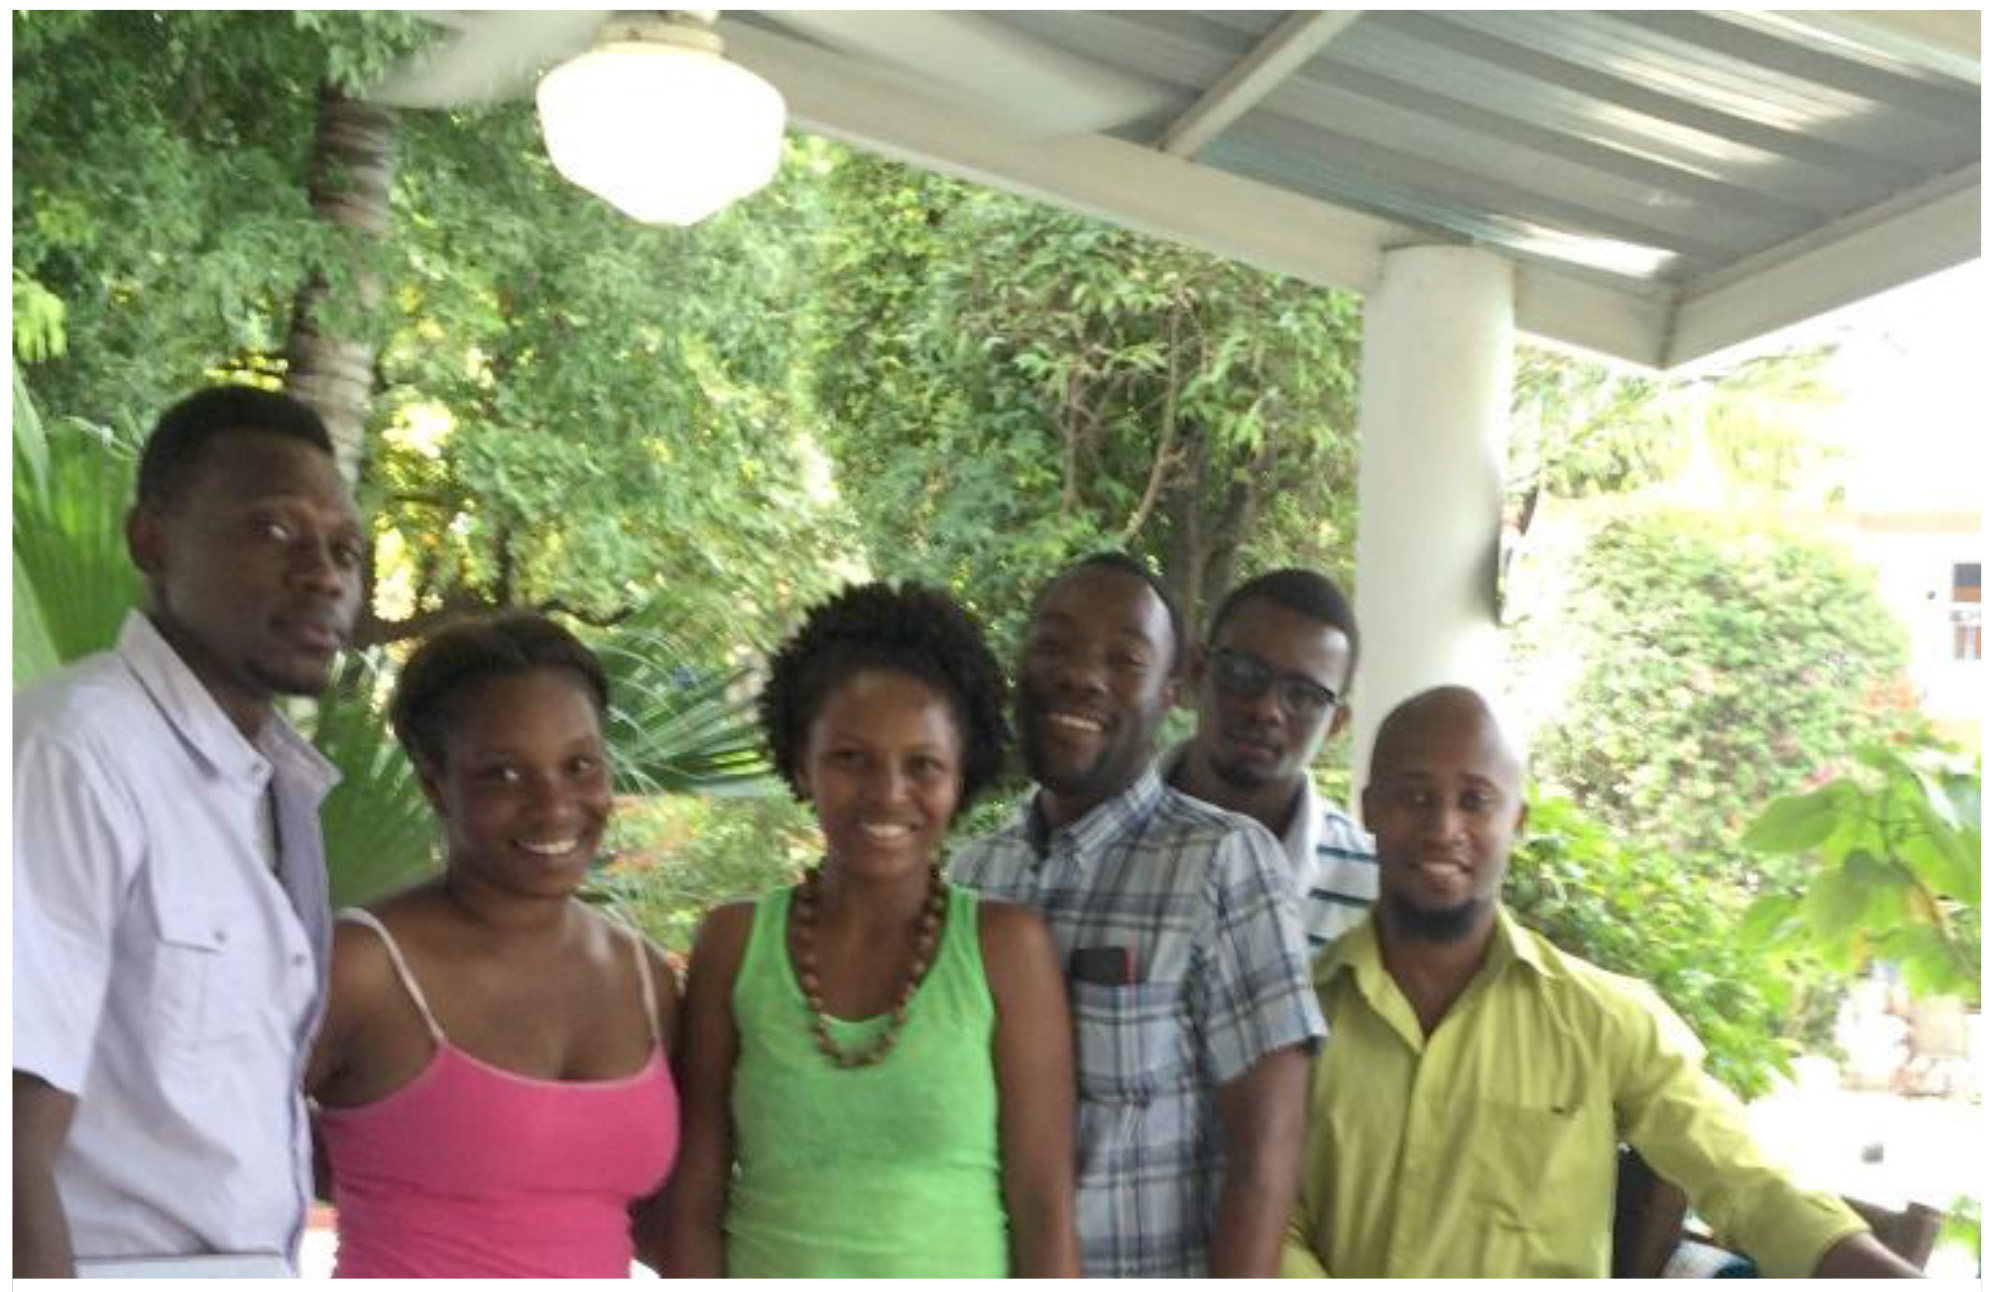
Fig. 2.
The team from left to right – Chauncy, Franzlande, Ginny, Emilio, Mackenson and Antoine.
Interviewer: Can you tell us a little more about the development and methodology of the study project?
To backtrack a little, SwB is a pro-bono outreach group of the American Statistical Association where the members are experienced in questionnaire design, survey implementation, and data analyses. In this work, SwB members designed a survey to determine the “who” in a crisis situation that compliments the OCHA counts of “what,” “where,” and “how.” In doing so, a more detailed picture of the crisis is available.
After examining several options, SwB decided to employ both phone and face-to-face interviews. Mobile phone surveys were possible because phone penetration is high in Haiti 65% [5] and respondents do not have to pay for incoming calls. Interviewers called people residing in all ten departments (or states). The downside of a mobile phone survey is lower phone penetration in the rural areas than urban areas, and much of Matthew’s damage occurred in the rural areas. Likewise, Haiti does not have area codes; thereby making it difficult to target certain regions such as the most affected areas. As a result, SwB conducted 100 face-to-face interviews in the South Department, along with 154 phone interviews in the entire country (all ten departments). Virtually, the same questionnaire was used in the phone and face-to-face interviews.
Questionnaires
Two questionnaires were designed. The first questionnaire, i.e., the Household Questionnaire, pertained to people who resided in their homes. People were asked about (1) aid received after Matthew, (2) damaged homes and lost possessions after Matthew, (3) job status before and after Matthew, (4) family members who moved in after Matthew, (5) danger signs of diseases, (6) clinic accessibility before and after Matthew, (7) injuries after Matthew and (8) change in dietary habits before and after Matthew.
The second questionnaire, i.e., the Health Worker Questionnaire (HW), pertained to those people who worked in a clinic or hospital. Health workers were asked about (1) supplies, (2) patient diseases, (3) injuries, (4) patient accessibility, and (5) staffing and hours.
Both the Health Worker and Household questionnaires originally written in English were translated into Creole and back into English for review. The same Household questionnaire was used in the face-to-face and phone survey. In contrast, the Health Worker questionnaire was only used in the face-to-face interviews.
Training
Interviewers underwent a fairly standard training program where, topics such as questionnaire conventions and interview protocols were covered. All questions were asked and recorded in Creole. Consent was obtained verbally after an explanation of the survey goals and use of the data. A screener was set up so that only people 15 years or older were interviewed.
Data Collection
The data was collected in two modes (1) face-to-face interviews and (2) phone surveys. Each mode is discussed in more detail below.
Face-to-face interview data collection in the south department was November 6–8, 2016. Data collection was carried out over three days. The data collection was preceded by four hours of training the day before. The team visited five communes: (1) Camp-Perrin, (2) Torbeck, (3) Chantal, (4) Port Salut, and (5) Arniquet. Two to six sub communes were visited per commune including the center. (The selection of the communes and sub communes was based on road accessibility and lodging.) To travel to those “out of the way” sub communes, an official from the Civil Protection Service familiar with the back roads assisted the team.
Upon arrival at a commune or sub commune, the team coordinated household interview routes at the truck. Afterwards, each interviewer headed out to adjacent houses by foot. A supervisor monitored the team. No two interviewers went to the same house or in the same direction. Interviewers were instructed to interview (1) any household member 15 years old or older and (2) only one member per household. Upon completion of each household interview, the interviewer walked to the adjacent home and conducted the next interview. Anti-bacterial bars of soap were provided as incentives. A debriefing was offered at the end of the day where interviewers discussed problems.
Repeated face-to-face interviews (re-interviews) were conducted before leaving each commune or sub-commune. A total of eight repeat interviews were conducted. Comparisons between the repeat and original interviews did not reveal many discrepancies. There were no respondent refusals.
As a part of this face-to-face portion of the survey, four health workers were interviewed about the aftermath of Matthew. The skilled healthcare workers resided in each commune center and either worked at a clinic, dispensary, or hospital. (The team did not find unskilled health workers to interview.)
Phone interview data collection for all ten departments was November 9–12, 2016. Data collection was carried out over three and half days. The interviewers worked from a randomly generated set of phone numbers. (A list of working phone numbers provided by the phone companies was unavailable.) Originally, 250 completed interviews were expected. However, only 150 completed interviews were obtained due to interviewer fatigue and time limitations. Every 8
Keying and data processing started immediately after the face-to-face interviews and during the phone interviews. Data processors were trained to translate and clean data (e.g., typos and misspellings). Thirty-two cases were later verified by two data processors. Comparisons between the original and re-keyed interviews did not reveal many discrepancies.
There were no outright refusals (failure to answer any questions). Rather, there were 19 incomplete cases (in the phone survey). And there were three call backs, where the respondent did not have time to talk at the moment, but did later that day.
To ensure that the interviewers reached all ten departments by phone, the geo-spread or the number of calls per department were calculated Forty-three percent of the phone interviews reached people in the West department where most of the Haitians reside. The remaining 57% of the calls reached people in the remaining nine departments.
Interviewer: What are your results, so far from your initial field research?
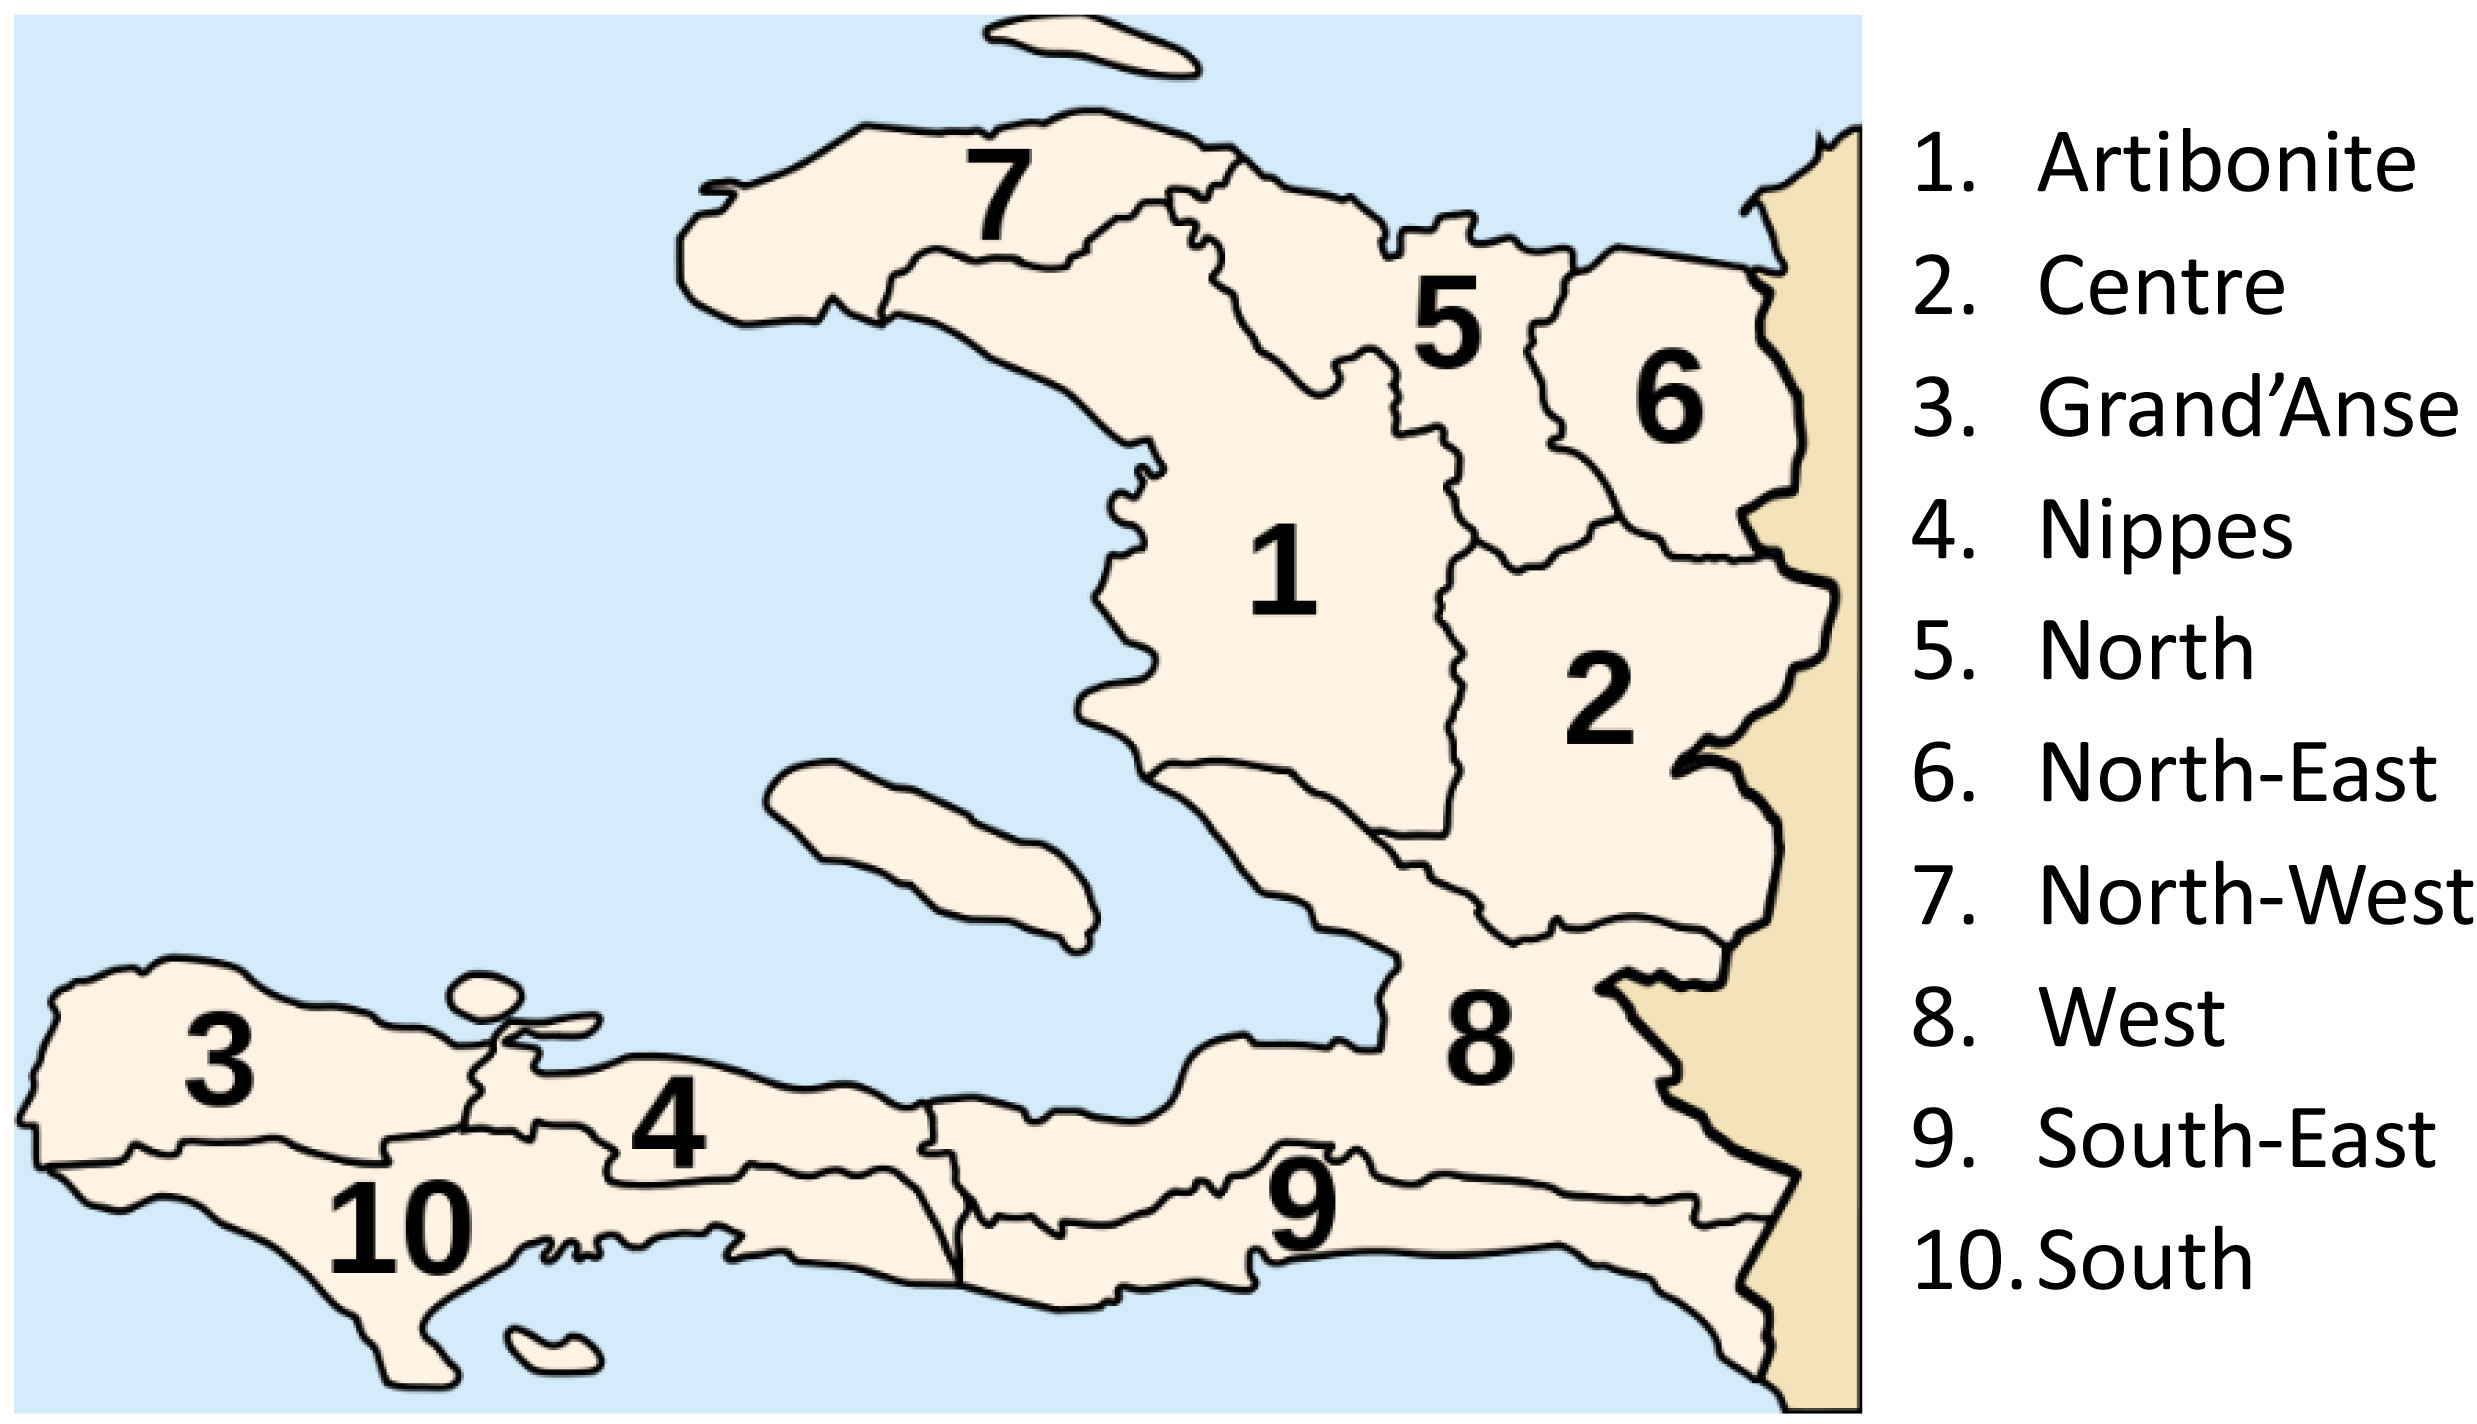
The results of our initial field research focused the analysis on comparisons between highly affected areas and less affected areas. Chart 2 shows a map of Haiti and its 10 departments. Of the ten departments, the three departments in the south (i.e., Nippes, Grand’Anse and South), are in the “highly-affected” group and the remaining seven departments are in the “Less-affected” group.
Overall, the survey reached 230 adults whose primary residence is in Haiti at the time of Hurricane Matthew. Among the people, 54% were male and the remaining 46% were female. The average age was 38.5 with a range from 15 to 80 years old. Typically, six people reside in a house (or share the same cooking pot).
With respect to aid distribution after Hurricane Matthew, a minority of people, 18% reported receiving aid. Here aid is food, sanitation supplies and tarp/tin roofs. Table 1 describes the aid distribution by area below.
Table 1
Distribution of survey participants who reported receiving aid after Hurricane Matthew by affected area type
| Areas | No-Aid | Yes-Aid | Totals |
|---|---|---|---|
| Highly-affected areas | 72 | 29 | 101 |
| Less-affected areas | 96 | 8 | 104 |
| Totals | 168 | 37 | 205 |
Note: Although asked about aid, some survey participant in the less-affected areas chose not to answer the aid questions.
Chart 2.
Departments of Haiti.
There are three points to be made about this table. The first point is that little aid went to the less-affected area 8% (8/104). The second point is that what aid was given, went to the highly-affected areas more so than the less-affected area (78% (29/37) vs 22% (8/37)). These two points confirm the expectation that more aid is distributed to those people residing in the highly-affected areas than those in the less-affected areas.
The third and final point is that still only 29% (29/101) of the people in the highly-affected areas received aid. (These people resided in either the commune center or the surrounding sub communes.) The remaining people did not receive aid. When asked “why,” the leading answer was “cronyism/sell” (42%), followed by “don’t know” (36%) and the remaining answers were “too far away, not enough, or fight for it” (22%).
Taking a deeper dive into types of damage experienced during Hurricane Matthew and its aftermath, we found the following:
Home damage/Change in Household Membership. Matthew tore off tin roofs and knocked down walls. A little over half (52%–117/221) of the people reported their homes were destroyed or partially damaged (still livable).1818 Broken down by affected area types, it was found that 74% were in the highly-affected areas and 26% in the less-affected areas. Of those 117 people who reported that their home was destroyed or partially damaged, only 46 people were currently living in a tent or shelter. (The sample size was too small to look at gender or who was in charge of the household.) Furthermore, more people in the highly-affected area (62% or 28/45) reported a change in household membership than those people in less-affected areas 38% (17/45).
Lost: Crops, Animals and Personal Belongings. Hurricane Matthew swept away more animals, crops, and personal belongings in the highly affected areas compared to the less-affected areas. Most of the people are farmers and grow local foods such as plantains, beans, corn and potatoes and/or raise animals After Hurricane Matthew, people reported that the winds and rain destroyed their crops and animals. Every one reported eating less food. Many of the people reported eating rice. Rice is a non-locally grown food and was reportedly hard to obtain. Housing and particularly roofing was another key area of loss.
Health Issues – Disease Prevention. Hurricane Matthew swept away latrines; and clean water sources thereby increasing the chances that people will drink unclean water. Unclean water is often the source of cholera as well as other diseases (See Appendix A-2 for a history). People in the highly affected areas rely on water purification tablets (73%), more so than any methods (13% bleach; 4% filtering and 3% buying drinking water). This reliance on aqua tabs (water purification tablets) is problematic, as few people are receiving such aid. In both highly- and less-affected areas, people are more aware of the danger signs for cholera (62%) than for tetanus (13%) or pneumonia (7%). Interestingly, people in the highly-affected areas are less aware of cholera dangers signs (40%) than those in less-affected areas (60%). (If the respondent reported knowing the danger signs, he/she was then asked to share them. This recital served as check as to how well people knew the danger signs.) This finding is worrisome, as there is an uptick in cholera cases after Matthew.
In the highly-affected areas, 78% people said they would return to the same health care worker as before Matthew. (Only 12% of the people said they did not know whether their regular health care worker was still there.) These people reported walking 15 minutes to three hours to their nearest health care worker and paying up to 45 USD per visit. SwB was able to verify the open status of four clinics in the south department.
Mosquitos can transmit malaria and dengue fever. To deter mosquito bites, people used nets (36%) more so than long sleeves and pants (27%) or cream/smoke (20%). Flies are attracted to garbage and human waste and can transmit such diseases as diarrhea and typhoid. To deter disease fly transmission, people were asked what kind of toilets they use and learned that 67% people used latrines, 19% water closets, 5% both latrines and water closets, and 7% nothing at all.
Health Issues – Usage of Diarrhea Treatments. Diarrhea, a symptom of cholera, can cause dehydration and is treatable. The trick here is to drink Oral Rehydrated Salts (ORS) or zinc tablets with clean water and to seek treatment if the diarrhea continues. People used ORS (67%) more so than zinc tablets (15%). Thirty-three percent of the people reported drinking a home remedy such as coconut tea and guava tea and/or juice.
Health Issues – Injuries during Matthew. People were injured by nails, tin sheets, or falling. Of the 27 reported injuries, 26 occurred in the highly affected areas. Of those 27 injured, only nine people sought treatment.
Health Issues – Aftermath of Matthew: Health care worker perspectives. As a part of this survey, four health workers were interviewed about the aftermath of Matthew. The skilled healthcare workers resided in each commune center and either worked at a clinic, dispensary, or hospital. (The team did not find unskilled health workers to interview.)
All four healthcare workers reported an increased number of diarrhea (or fever) cases after Matthew, while only one health care worker reported an uptick of skin infections and accidents. All four health workers reported having cholera educational materials and saw 10 to 30 patients per a day. According to the healthcare workers, patients are often unable to visit them due to lack of money, transportation, long distances, and poor road conditions.
Healthcare workers reported the need for aqua-tabs to purify the water along with antibiotics and bandages to treat infections. Healthcare workers also reported the lack of tetanus and cholera vaccines. In one clinic, Matthew swept away blood pressure cuffs and scales, which are useful in measuring of dehydration and malnutrition.
Interviewer: What were your conclusions and recommendations?
Aid distribution is a tough issue. Clean water, food, seeds, and tarps are sorely needed in the Hurricane Matthew affected areas. Several respondents recommended providing free aid in an orderly manner rather than simply thrown off the truck where people have to fight for it. Others recommended that the aid be distributed from home to home with an armed guard. Neither recommendation is perfect.
Health care workers are spreading the word about cholera and other diseases, and still more work needs to be done. For example, health care workers could ensure that (1) people can readily obtain water purification treatments in their sub-commune (e.g., bleach or aqua tabs) (2) people recognize the danger signs of cholera, pneumonia, and tetanus, and (3) people use ORS as a treatment for diarrhea.
Interviewer: Now that the survey project has been completed, what did you find most fascinating about this project? In your article in AmstatNews (Jan 1, 2017),1919 Monica, you stated that the survey was sponsored by the American Statistical Association to “find out who received aid, who did not receive aid, and how Matthew affected them.” Are there any other areas of the project development that you would like to comment on? Or would you like to elaborate further on these two areas?
Monica Dashen
I spent a lot of time thinking about the “who” in the aid distribution, as this survey can be readily applied to an immediate or prolonged crisis situation. To “fine tune” this survey, I thought about what the “who” can say. Here the “who” can certainly tell us whether they received aid and the steps needed to obtain it. In contrast, the “who” cannot tell us who delivered the aid, as many people reported that the truck was unmarked. (If the truck was marked, many of the people could not read the logo/words.) Likewise, the “who” cannot tell us how much was pilfered prior to distribution.
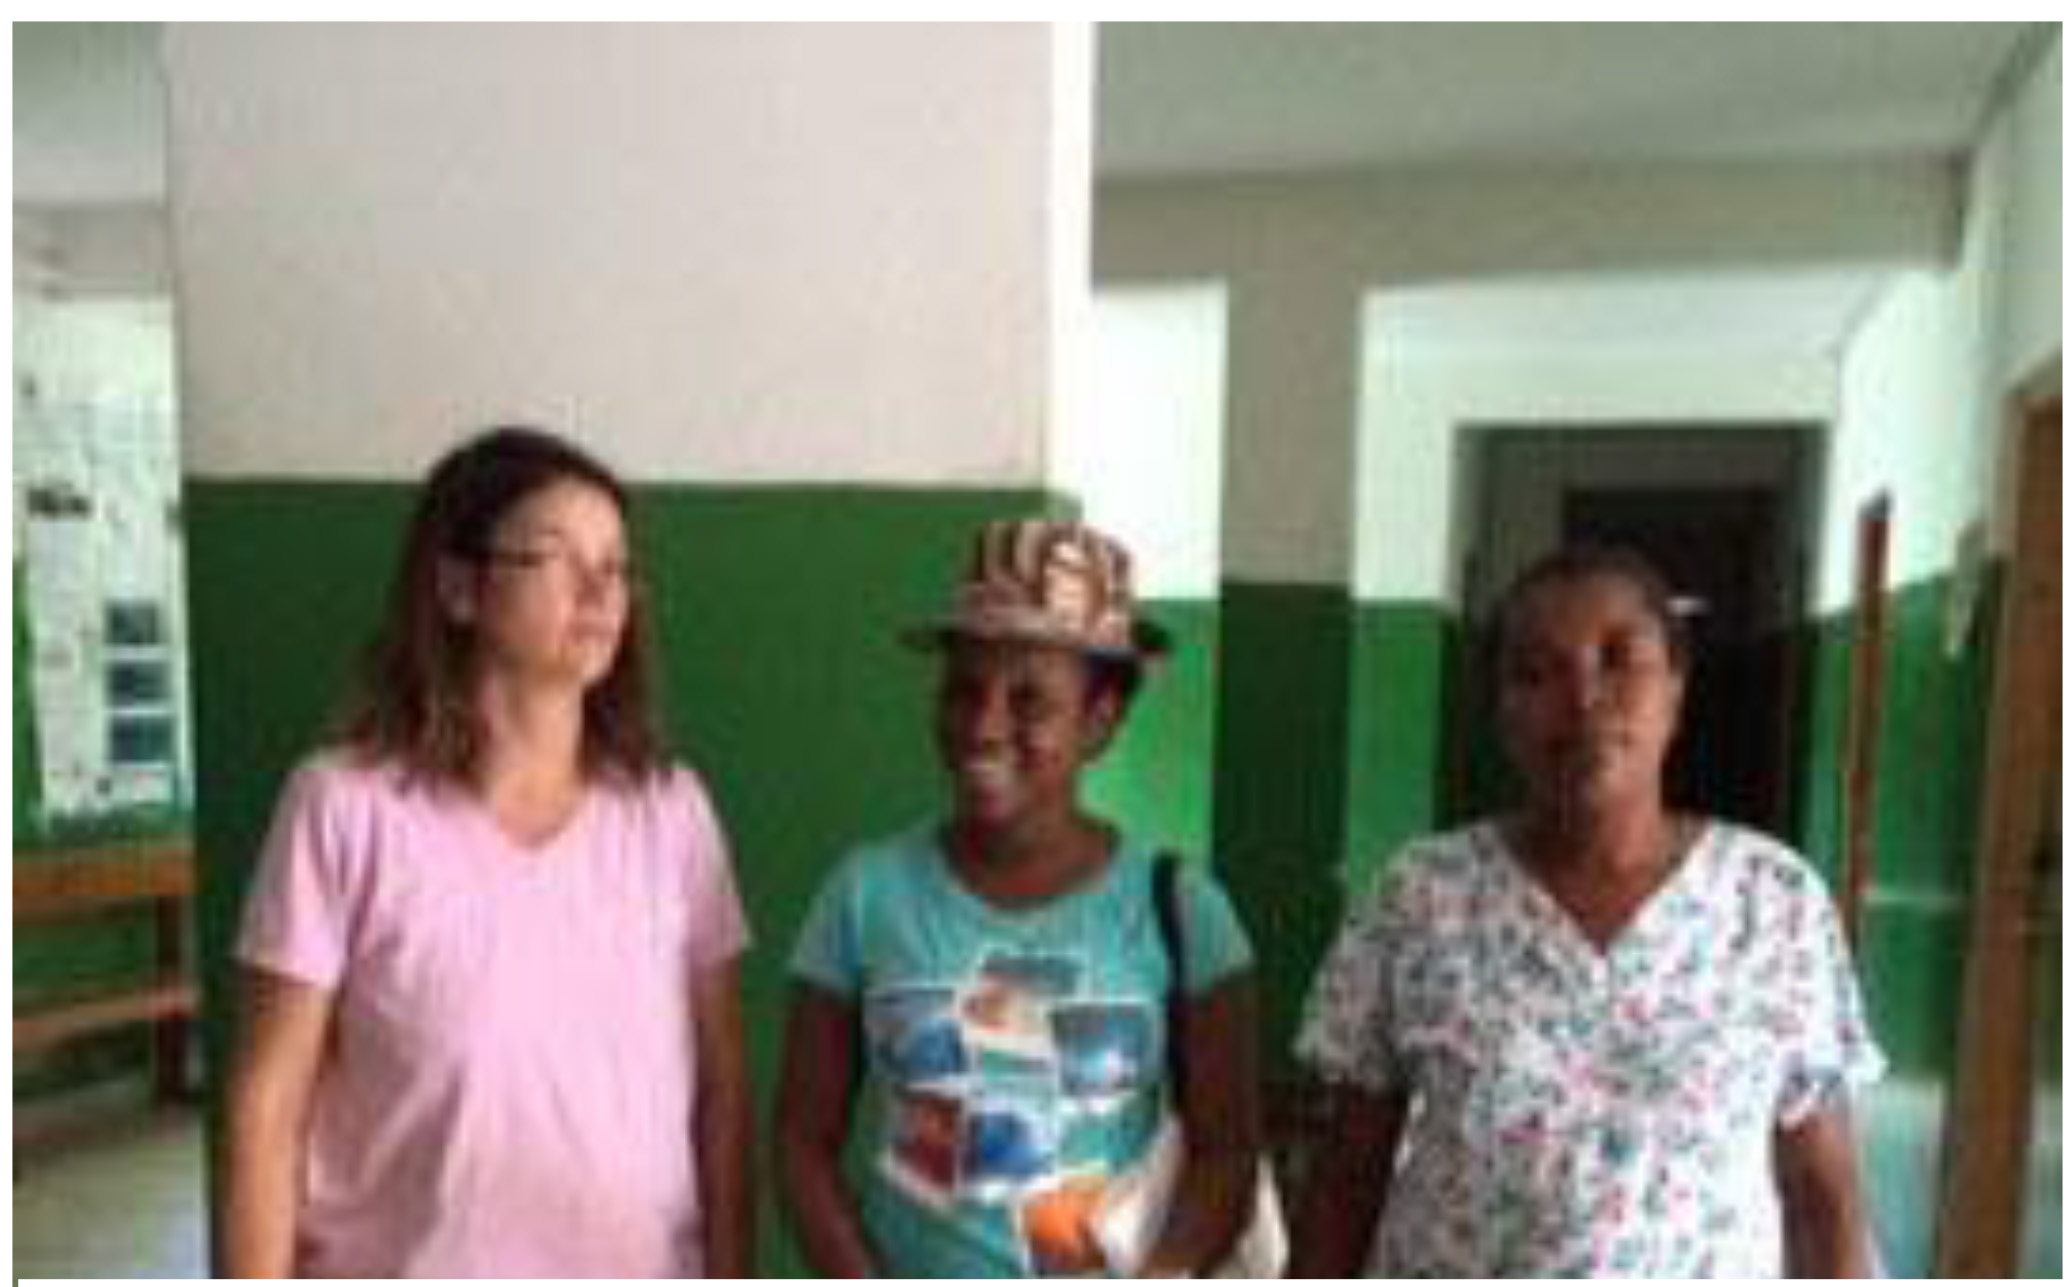
Fig. 3.
Monica, Frantzlande and nurse in a hospital.
Besides thinking about those “who” who received aid, I thought about the other “who.” That is, those “who” who were involved in the actual distribution of aid. This idea came from a conversation I had with Dr. Holguin-Veras about his work on the relief efforts after the Haitian earthquake where he found that socially integrated relief agencies were better able to distribute aid than those less integrated.2020 Typically, the “who” involved in aid distribution must have (1) a fleet of trucks able to navigate the narrow and rocky roads of the south, (2) drivers familiar with the areas and (3) people willing to load, unload and parse the vast amount of aid. To find out more about these “who,” I asked an interviewer to call four people involved in the aid distribution and ask them about the availability of aid, trucks, drivers and guides. Unfortunately, these aid distribution people were reluctant to provide any information, as they “do not want to throw stones that may fall back on [their] heads.” (This is a Creole proverb.)
Interviewer: Do you have any lessons learned that you would like to share?
Monica Dashen
As in any project, there are lessons learned. The most obvious lesson is that phone coverage in a crisis situation can be lower than a non-crisis situation. Only 37% of the known phone numbers collected in the south during face-to-face interviews worked. (Phone calls were made immediately after the team left the south to ask a follow-up question.) The most likely reason is that people simply cannot pay their bills. (Mobile tower damage was ruled out as an option due to the interview team mobile phone usage in the field.) Face-to-Face interviews are the best option here. When planning such a survey, the designer should allot more time for face-to-face interviews than phone interviews, as the respondents are upset and talkative (Private interviews are difficult to obtain.) Likewise, the survey designer should allot additional money to hire a guide to provide security and help the field team navigate the backroads. Another lesson learned is that developing questions to assess the situation is difficult. Survey designers should expect to finalize a questionnaire in the field. The authors devised three versions of questions related to a dietary change in habit before hitting the right one.
The final lesson learned is a broader assessment of the sanitation situation (e.g., availability of bleach to treat water) is always needed. Although not directly related to the survey goals, such information paints a boarder picture of the sanitation and disease prevention For instance, in rural areas, cholera is difficult to treat, as it requires truckloads of Intravenous fluid (IV) for those patients who suffer from serve dehydration. Rural clinics simply do not have a ready supply of IV fluid for a large number of patients. Likewise, the roads leading to these clinics are in poor condition, thereby limiting access to large trucks. Such roads and distances make prevention all the more critical. Clean water and good sanitation habits are critical preventative methods. The Center for Disease Control recommends that bleach, a water treatment, should be available in every village, as bleach is easy and cheap to produce in any country.2121
Rachel Green
My key observation is of the benefit of continually refining questions and adjusting to the local situation. While acknowledging the ongoing challenge of how to ask questions on sensitive topics to illicit ongoing participation while collecting useful data and not causing distress for participants.”
Interviewer: Do either of you have anything further that we haven’t discussed so far?
Monica Dashen
I wrote in a field note piece in AmstatNews2222 that “looks can be deceiving” regarding the rebuilding process occurring in Haiti after Hurricane Matthew. I now read the OCHA reports with a skeptical eye. I agree that aid is brought into Haiti However, I wonder who actually received the aid.
After talking to some aid officials about our findings, I learned that the aid distribution had some hiccups in the beginning (October, 2016) and that the distribution is more systematic now (February, 2017). To find out if the distribution indeed had changed, Rachel and I designed a follow-up phone survey where the same respondents (interviewed in November, 2016 and again in February, 2017) were asked about (1) aid received, (2) cholera prevention habits and (3) food eaten.
Unfortunately, we had difficulties returning to the field to conduct face-to-face interviews. As a result, we resorted to conducting phone survey interviews. Two interviewers were asked to call 119 known numbers; these numbers were culled from the highly-affected areas only. Of the 119 known numbers, only 32 numbers worked (27%).
There are three findings of interest here. First, when people were asked about aid, only one person (out of 24) received aid. This person received aid right after Hurricane Matthew.
Second, when people were asked about their cholera prevention habits, 17 survey participants (out of 24) relied on aqua tabs and/or bleach to clean their drinking water. Here water can be dirty at its origin (e.g., spring or well) and must be treated at the household level. Only six survey participants could tell us with certainty whether bleach was readily available in their sub commune. Other cholera prevention methods reported by eight people included washing hands, cleaning surfaces and washing food Third, when people were asked about their dietary habits after Matthew, everyone still reported eating a lot of rice Some people reported eating beans, corn and/or pasta too. (We did not ask whether the rice was obtained from a neighbor/friend, grocery store or food stash.)
These pilot survey findings indicate that the aid distribution has not changed. This project reminds me of the potato famine where over a million Irish died of starvation or immigrated even though wheat and other grains were grown on Irish soil and exported to Europe.2323
Rachel Green
As we’ve said earlier, this project relates to some highly complex topics where important work is ongoing. It was interesting to contribute in a small way to these ongoing discussions and thanks again to all those who helped out in the project and thanks especially to those who shared their experiences and stories.
Interviewer: Thank you so very much for talking with me.
Appendix A:
A-1: History of Poverty and Poor Health.
According to UNICEF’s 2015 State of the World’s Children report,2424 only 58% of Haiti’s population had access to an improved drinking water source (water from a well or pipe) and 28% had access to a latrine. Many people resided in poorly constructed concrete homes. Haiti has poor health indices. The life expectancy at birth is 63 years and the infant mortality rate is 52 per 1, 000 live births. An estimated 69 of every 1,000 children born die by the age of 5 years,2525 and 12% of the surviving children are undernourished. Furthermore, Haiti is ranked 163 out of 183 countries in the UN Human Development Index.2626 This development index is based on life expectancy, years of schooling, and standard of living.
A-2: The Cholera Outbreak after the Earthquake in 2010
In October, 2010, the public health ministries were first alerted to a cholera outbreak ten months after the earthquake. Cholera is a water borne bacteria that is highly contagious and deadly at times. The outbreak spread rapidly throughout Haiti and reached portions of the Dominican Republic and Florida (USA).
Unclean drinking water was identified by Center for Disease Control (CDC) officials as the primary source of cholera. Poor medical training and limited medical facilities also contributed to the problem, as some patients were discharged too quickly and died later. Cholera produces serve dehydration due to a sudden onset of vomiting and diarrhea. Training programs for the health care professionals and the general population were designed. The training materials discussed how to treat water, how to make use of ORS for dehydrated patients, and how to make use of bleach to disinfect homes. USAID provided cholera treatment supplies.2727
The number of suspected cholera cases increased after Matthew. A month prior to Matthew, the number of suspected cases was 2,236. A month after Matthew the number increased to 5,100 cases.2828
Notes
3 Hurricanes are measured by their sustained wind speed and the Saffir-Simpson Hurricane Wind Scale. “This scale estimates potential property damage. Hurricanes reaching Category 3 and higher are considered major hurricanes because of their potential for significant loss of life and damage. Category 1 and 2 storms are still dangerous, however, and require preventative measures. In the western North Pacific, the term “super typhoon” is used for tropical cyclones with sustained winds exceeding 150 mph.” (Source: http://www.nhc.noaa.gov/aboutsshws.php). A category 4 hurricane has sustained wind speeds between 130 to 156 mph (or 209–251 km/hr).
4 Harding, A. January 19, 2017. Personal communication.
6 Office of Coordination and Humanitarian Affairs in Haiti. [Home page on the Internet] New York, USA. https://www.humanitarianresponse.info/en/operations/haiti.,55.
5 OCHA Report Specifically for Cholera – https://www.humanitar ianresponse.info/system/files/documents/files/hti_cholera_figures_ nov_2016_en.pdf
7 Statistics without Borders [homepage on the Internet]. Virginia, USA. http://community.amstat.org/statisticswithoutborders/home.
8 Op. cit.
9 Ibid.
10 Multiple Indicator Cluster Survey [home page on the Internet]. http://www.unicef.org/statistics/index_24302.html.
11 Haiti: Hurricane Matthew Situational Report Number 32 (January 17, 2017). Office of Coordination and Humanitarian Affairs. [home page on the Internet] New York, USA https://www.humanitarianresponse.info/en/operations/haiti/document/haiti-hurricane-matthew-situation-report-no-32-17-january-2017-en.
12 For more information, see: https://en.wikipedia.org/wiki/2010_Haiti_earthquake.
13 Orelien, J., Philippe, R., Wesner, A., Ashley, J., Fisher, J. and Scheuren, F., “Haiti after the earthquake: Statistics Without Borders.” Significance. 2013, 10: 29–32.
14 Kim R, Ashley J, and Corcoran M. “A Nationally Representative Economic Survey Five Months after the Haitian Earthquake.” Statistical Journal of the IAOS. 2014; 30: 341–346.
15 Ibid.
16 Op. cit.
17 For more information on Hurricane Matthew impacts see:https://weather.com/storms/hurricane/news/hurricane-matthew-bahamas-florida-georgia-carolinas-forecast.
18 A “partially damaged” home is one in which a portion of a wall or a roof was torn off.
19 Dashen, M. 2017. “Haitian Aid Survey: Field Notes from a Statistician.” AmstatNews. Jan 1, 2017. http://magazine.amstat.org/blog/2017/01/01/haitian-aid-survey/.
20 Holguín-Veras, J., Jaller, M. and Wachtendorf, T. “Comparative performance of alternative humanitarian logistic structures after the Port-au-Prince earthquake: ACEs, PIEs, and CANs.” Transportation research part A: policy and practice. 2012; 46: 1623–1640.
21 Op. cit.
22 Op. cit.
23 For more information about the Irish potato famine history and trade, see American University (Washington DC.) document of 1996. http://www1.american.edu/TED/POTATO.HTM.
24 United Nations Children’s Fund. State of the world’s children, 2016 [cited 2017 January 26]. https://www.unicef.org/publications/files/UNICEF_SOWC_2016.pdf
25 Ibid.
26 UN Human Development Index: Haiti. New York, USA. [homepage on the Internet] http://hdr.undp.org/en/countries/profiles/HTI.
27 Tappero, J., and Tauxe, R. “Lessons Learned during Public Health Response to Cholera Epidemic in Haiti and the Dominican Republic”. Emerging Infectious Disease journal-CDC. 2011; 17(11). http://dx.doi.org/10.3201/eid1711.110827.
28 Office of Coordination and Humanitarian Affairs in Haiti. Cholera [home page on the Internet] New York, USA https://www.humanitarianresponse.info/system/files/documents/files/hti_cholera_figures_nov_2016_en.pdf.


