
Retinal ganglion cell and microvascular density loss in hereditary spastic paraplegia
Abstract
Background:
Hereditary spastic paraplegia (HSP) is characterized by progressive degeneration of distal axons in the long corticospinal tracts. Loss of retinal cells and microvascular networks has neither been suspected nor investigated. We concurrently examined the retinal microvasculature and retinal layer morphology in patients with HSP to assess whether retinal features may portray disease and its progression.
Methods:
Fifteen patients with HSP and 30 healthy controls were included in this cross-sectional case-control study. Disease severity was assessed with the Spastic Paraplegia Rating Scale (SPRS). Severity of ataxia was determined by the Scale for the Assessment and Rating of Ataxia (SARA). Retinal microvasculature was measured by means of optical coherence tomography angiography (OCT-A) and morphology of retinal layers using structural OCT. Mixed-effects models were applied for data analysis.
Results:
HSP patients showed significantly reduced vessel density of the superficial vascular plexus (SVP), reduced ganglion cell layer (GCL) volume, reduced inner plexiform layer (IPL) volume and reduced temporal-inferior peripapillary retinal nerve fiber layer (pRNFL) thickness versus healthy controls. GCL volume reduction correlated significantly with the worsening of visual acuity and higher SARA scores.
Conclusions:
These findings demonstrate that, in HSP both cells and vascular networks of the retina are compromised. Assessment of the retinal GCL, IPL and SVP may aid in diagnosis and monitoring of disease progression as well as provide novel structural outcome measures for clinical trials.
1Introduction
Hereditary spastic paraplegia (HSP) is an inherited progressive neurodegenerative disorder characterized by lower limb spasticity and weakness with degeneration of distal axons in the long corticospinal tracts (Blackstone et al., 2011; Mackay-Sim, 2021; De Souza et al., 2017). The prevalence of HSP is estimated to be between 1 and 10 per 100,000 (Schüle et al., 2016). HSP is genetically heterogenous with autosomal dominant, autosomal recessive, X-linked recessive and mitochondrial inheritance, with a large variability in age of onset (Tesson et al., 2015). To date, up to 79 causative spastic paraplegia genes have been identified with SPG4 being the most common subtype (Shribman et al., 2019).
Clinically, HSP is classified into a “pure” (uncomplicated) form, which is limited to symptoms arising from degeneration of corticospinal tracts. The “complex” (complicated) form on the other hand, may present with additional clinical signs such as cerebellar ataxia, peripheral neuropathy, dementia, seizures, amyotrophy, psychiatric disorders and extrapyramidal disturbances (Fink, 2013; Salinas et al., 2008; Schüle et al., 2016).
In addition, rare instances of ophthalmological manifestations including congenital cataracts, optic atrophy and retinal dystrophy have been reported (Carelli et al., 2009; de Freitas et al., 2020).
Structural retinal changes in patients with HSP have been studied with optical coherence tomography (OCT), revealing thinning of the retinal nerve fiber layer (RNFL) and reduction of total retinal thickness (Vavla et al., 2019; Wiethoff et al., 2012). Reduction of retinal ganglion cells has been described in a subsequent case report (Marcotulli et al., 2014). However, this finding has not been followed or confirmed in OCT studies by individual retinal layer analysis in HSP cohorts. In addition, the retinal microvasculature has not yet been examined in HSP.
We recently discovered a reduction of retinal microvascular density in patients with degenerative ataxias, including autosomal dominantly inherited spinocerebellar ataxias (SCAs) (Turski et al., 2022). This is intriguing due to the fact that a concept of clinical overlap between HSP and hereditary ataxias has recently been postulated, suggesting a shared vulnerability of cerebellar and corticospinal neurons to common pathophysiological processes (Synofzik & Schüle, 2017). It could therefore be suspected that structural and microvascular retinal changes may also be detectable in HSP by a concurrent OCT- and optical coherence tomography angiography (OCT-A) imaging approach. OCT-A allows non-invasive, dye-free, high-resolution and three-dimensional imaging of the retinal and optic nerve head (ONH) vasculature. Visualization of the retinal vasculature is achieved by using the movement of red blood cells as a contrast to delineate blood vessels from static tissues (Spaide et al., 2018). In this cross-sectional study we assessed, by means of concurrent OCT and OCT-A imaging, whether structural and microvascular retinal changes occur in HSP and, if present, whether a relationship between such alterations may be deduced, potentially guiding us towards a novel approach for characterization and monitoring of these disorders.
2Material and methods
2.1Study participants
Study participants were recruited and data collected from September 2018 through March 2021 from the German Center for Neurodegenerative Diseases (DZNE) in Bonn, Germany. The study design was approved by the Ethics Committee of the University of Bonn (approval ID: 366/17) and adhered to the tenets of the Declaration of Helsinki. Risks and benefits were discussed with each individual, and written informed consent was obtained before beginning the examinations.
Inclusion as a HSP case required the following clinical (Harding, 1983) and German Network of Hereditary Movement Disorders (GeNeMove) (Schüle et al., 2006) criteria: 1) pure spastic paraplegia, 2) spastic tetraparesis with greater severity in the lower limbs, or 3) spastic paraplegia as an early sign of a degenerative disease affecting several parts of the nervous system.
Ocular inclusion criteria comprised spherical ametropia of ≤±5 diopters and best-corrected visual acuity (BCVA) of < 0.3 logarithm of the minimum angle of resolution (logMAR). Individuals with ocular disease, ocular surgery in the past three months, uncontrolled arterial hypertension and uncontrolled diabetes mellitus were excluded from the study.
After applying inclusion and exclusion criteria, we recruited 15 individuals with HSP. This cohort consisted of 2 patients with SPG4 mutations (one with clinically pure and one with complex phenotype), 5 with SPG7 mutations (all clinically complex), one with SPG8 mutation (clinically pure), one with SPG17 mutation (clinically complex), one with SPG36 mutation (clinically complex), one with POLR3A mutation (clinically complex) and 4 genetically unclassified forms. The control group consisted of 30 healthy subjects matched for age (±3 years) without ocular or neurological comorbidities.
2.2Study procedures
Severity of HSP was evaluated by means of the Spastic Paraplegia Rating Scale (SPRS) ranging from 0–52 (Schüle et al., 2006). Severity of complicating symptoms of ataxia was assessed by means of the Scale for the Assessment and Rating of Ataxia (SARA) ranging from 0–40 (Schmitz-Hübsch et al., 2006). Age of onset was defined as the age when first HSP-related signs and symptoms were detected. Disease duration was defined as the time elapsed between the age at onset and the age at the timepoint of retinal imaging.
BCVA was assessed using retro-illuminated Early Treatment Diabetic Retinopathy Study (ETDRS) charts at 4-meter distance (Precision Vision, Woodstock, IL).
Retinal imaging was conducted on both eyes of each study participant without pupil dilation. The examination room was kept dark during all imaging sessions to ensure higher quality images. OCT-A was performed using the Avanti Optovue OCT-A system (AngioVue, RTVue XR Avanti SD-OCT, Optovue, Fremont, CA, USA). Automated measurements of the macula {6 × 6 mm macula-centered scan) and optic nerve head (4.5 × 4.5 mm optic disc-centered scan) were recorded using the manufacturer’s software. Data outcomes collected included parafoveal and perifoveal vessel density of the superficial and deep capillary plexuses; vessel density of the peripapillary capillary region (RPC) and of the area inside the optic nerve head (cdONH); and foveal avascular zone (FAZ). Vessel density was defined as the proportion of blood flow signal detected by OCT-A to the corresponding area. To be included in the final analysis, images needed to have sufficient signal strength (≥60), scan quality (≥6/10) and absence of motion artifacts (no or only minimal banding/quilting) (Lauermann et al., 2017; 2018).
OCT imaging was performed with a spectral domain OCT device (Spectralis, Heidelberg Engineering, Heidelberg, Germany). Macular volume scans (20×20°, 1024 scans and 97 sections) were recorded to assess added-up foveal and parafoveal volumes of the RNFL, ganglion cell layer (GCL), inner plexiform layer (IPL), inner nuclear layer (INL), outer plexiform layer (OPL) and outer nuclear layer (ONL). In order to evaluate the peripapillary RNFL (pRNFL) thickness with all its subdivisions (global, nasal, nasal-inferior, temporal-inferior, temporal, temporal-superior, nasal-superior), circumferential peripapillary scans were captured.
OCT-A and OCT images were checked for segmentation errors by one examiner, and were manually corrected if needed. Images of HSP subjects and controls were randomly selected during this process in no particular order with the same examiner blinded to the diagnosis.
2.3Data analysis
Mixed-effects model analyses were performed with right and left eye variables as repeated measures outcome, and diagnosis and hemisphere (right eye/left eye) as well as the interaction between diagnosis and hemisphere as independent variables with the effects blocked within subjects.
Initially, the entire HSP cohort was compared with the age-matched (±3 years; 1 case to 2 controls) control group. Subsequently, the spastic paraplegia type 7 (SPG7) subgroup was compared with an age-matched control group (±3 years; 1 case to 2 controls).
Pearson and Spearman’s partial correlation analyses were applied to assess relationships between OCT-A/OCT parameters and clinical characteristics among HSP subjects. Correlation analyses were performed for right eyes only.
Statistical significance was established at p < 0.05 for all HSP cohorts. Statistical analyses and graphics were performed with GraphPad Prism version 9.5.0 (GraphPad Software, San Diego, California, USA), R software with the library “lmer Test” version 4.2.2 (R Foundation for Statistical Computing, Vienna, Austria) and SPSS software version 28.0.0.0 (SPSS Inc., Chicago, Illinois, USA).
3Results
3.1Demographic and clinical characteristics of the study subjects
Fifteen HSP subjects were enrolled, 6 with pure and 9 with complex phenotype. The mean age was 56.6±10.3 (range 28–79) years; 8 (53.3%) were male. Mean age of disease onset and duration were 31.1±15.4 (range 6–54) and 25.5±14.3 (range 6–53) years respectively. Severity of symptoms assessed with the SPRS was 17.5±6.5 (range 7–26) and with SARA 10.1±5.7 (range 1–19.5). Mean BCVA of patients with HSP and healthy controls was logMAR 0.06±0.13 (Snellen equivalent, 20/23) and –0.009±0.09 (Snellen equivalent, 20/20) respectively (p = 0.02). Clinical and demographic data are presented in Table 1.
Table 1
Demographic and clinical characteristics of the HSP cohort and healthy controls
| HSP (n = 15) | Pure HSP (n = 6) | Complex HSP (n = 9) | Controls (n = 30) | |
| Age, mean (SD), y | 56.6 (10.29) | 58.00 (4.9) | 55.67 (12.96) | 56.00 (10.99) |
| Gender (M/F) | 8 : 7 | 4 : 2 | 4 : 5 | 10 : 20 |
| BCVA, mean (SD), logMAR | 0.06 (0.13) | 0.08 (0.13) | 0.06 (0.13) | –0.009 (0.09) |
| Age of onset, mean (SD), y | 31.07 (15.37) | 39.83 (10.21) | 25.22 (15.89) | NA |
| Disease Duration, mean (SD), y | 25.53 (14.26) | 18.17 (12.37) | 30.44 (13.87) | NA |
| SPRS score, mean (SD) | 17.53 (6.49) | 15.5 (8.02) | 18.89 (5.33) | NA |
| SARA score, mean (SD) | 10.13 (5.67) | 6.5 (3.52) | 12.56 (5.66) | NA |
| Genotype (n) | SPG4 (2) | SPG4 (1) | SPG4 (1) | NA |
| SPG7 (5) | SPG8 (1) | SPG7 (5) | ||
| SPG8 (1) | Unclassified (4) | SPG17 (1) | ||
| SPG17 (1) | SPG36 (1) | |||
| SPG36 (1) | POLR3A (1) | |||
| POLR3A (1) | ||||
| Unclassified (4) |
Abbreviations: BCVA, best-corrected visual acuity; HSP, hereditary spastic paraplegia; logMAR, logarithm of the minimum angle of resolution; NA, not applicable; SARA, Scale for the Assessment and Rating of Ataxia (range 0–40); SPRS, Spastic Paraplegia Rating Scale (range 0–52).
In the SPG7 subgroup, all five subjects had complex phenotypes. The mean SPRS score was 17.8±3.03 and the mean SARA score 14.8±3.82. Complicating symptoms included ataxia, gaze-evoked nystagmus and dysarthria.
3.2Retinal imaging
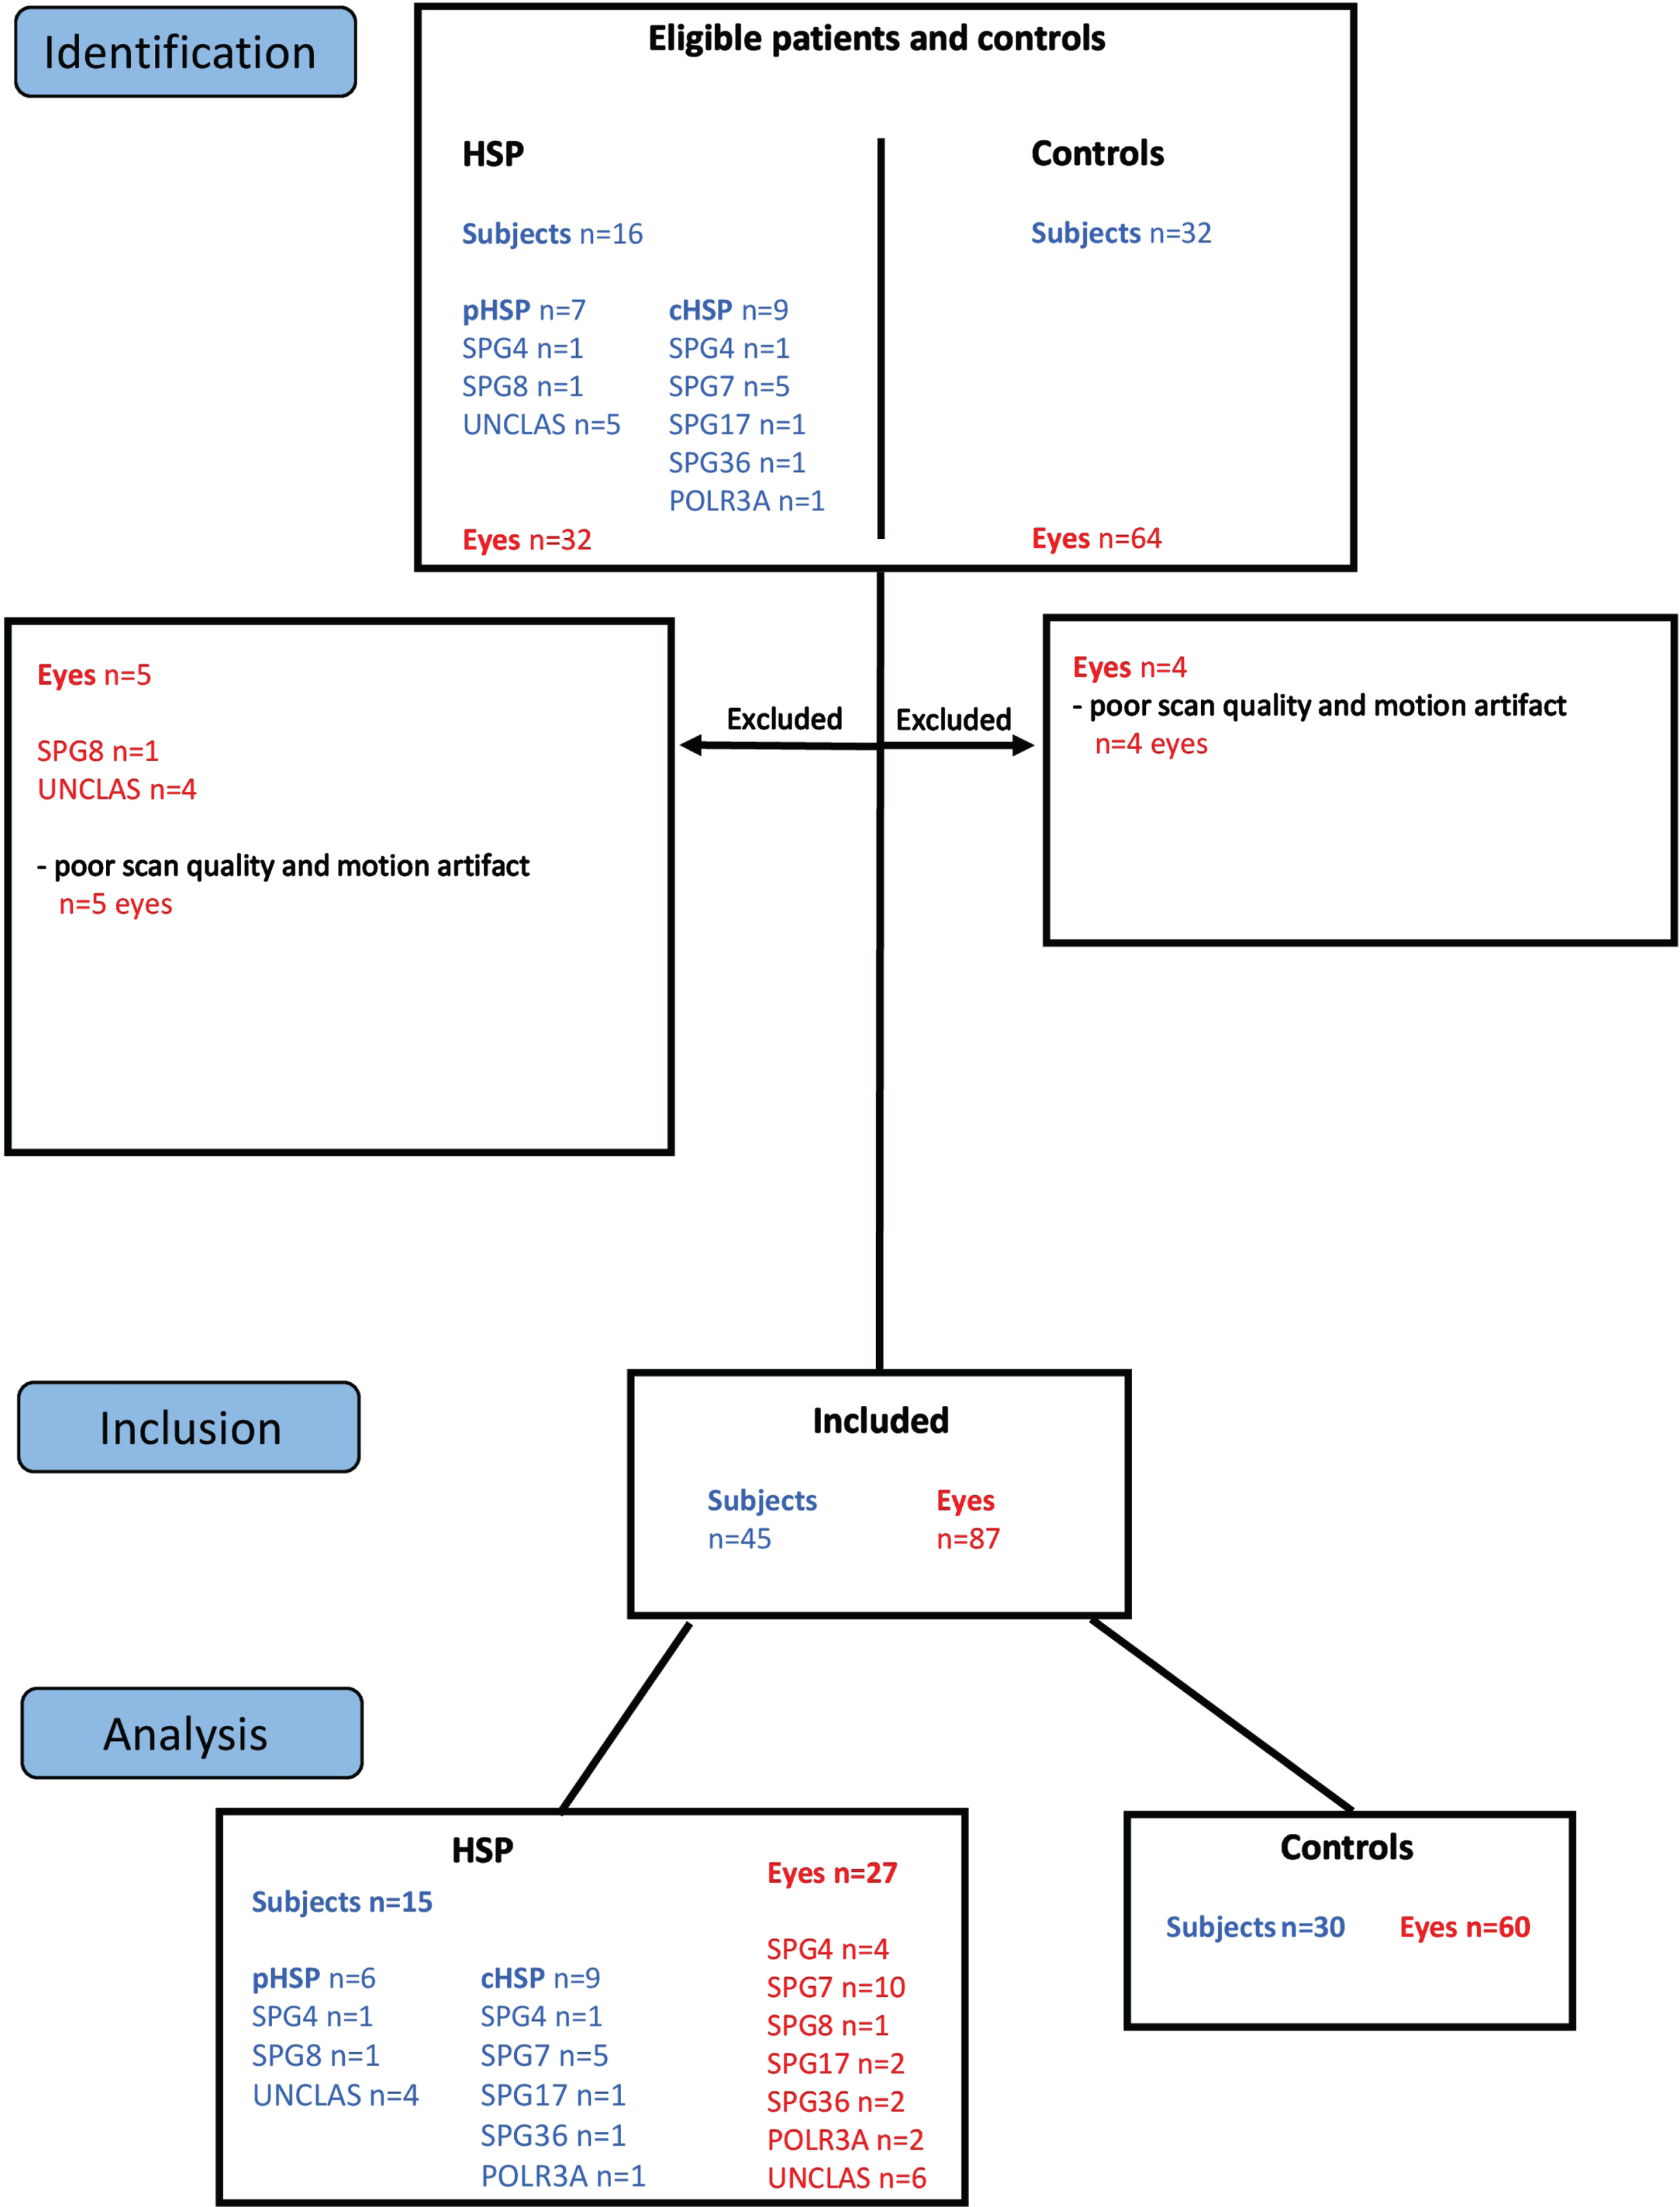
In total, 32 eyes of 16 HSP subjects and 64 eyes of 32 healthy control subjects underwent retinal imaging (Fig. 1). Five eyes of 4 HSP subjects and 4 eyes of 2 healthy control subjects were excluded due to insufficient scan quality and motion artifact. Subsequently, a total of 27 eyes of 15 HSP subjects and 60 eyes of 30 control subjects were included in analyses.
Fig. 1
Study Flow Chart. Sixteen subjects diagnosed with HSP and 32 healthy controls were enrolled in the study. Five eyes of HSP patients and 4 eyes of control subjects were excluded from the study due to poor scan quality and motion artifacts. For analyses, 27 eyes from 15 included subjects diagnosed with HSP, and 60 eyes from 30 included healthy controls were used.
When comparing the entire HSP cohort (n = 15) with the healthy control group (n = 30) by mixed-effects model analysis, HSP patients showed significantly reduced vessel density in the parafoveal superficial vascular plexus (p = 0.04), nasal superficial vascular plexus (nSVP, combined nasal parafovea and nasal perifovea average) (p = 0.04), reduced GCL volume (p < 0.001), reduced IPL volume (p < 0.001) and reduced temporal-inferior pRNFL thickness (p = 0.04) (Table 2, Fig. 2 and 3). A significant effect was detected for diagnosis for these five outcomes and no interaction between hemisphere and diagnosis on the outcome measures (Fig. 4).
Table 2
Differences in OCT-A and OCT parameters between HSP and control cohorts
| HSP vs. Controls | |||||
| Parameter | HSP (n = 15) | Controls (n = 30) | Estimate | SE | p-value |
| OCT-A Macula | Mean (SD) | Mean (SD) | |||
| Parafoveal VD, superficial (%) | 51.34 (3.02) | 53.14 (2.75) | 1.988 | 0.954 | 0.04 |
| Perifoveal VD, superficial (%) | 49.66 (3.3) | 50.84 (2.56) | 0.871 | 0.92 | 0.35 |
| Superficial nasal VD (nSVP) (%) | 52.35 (3.21) | 54.35 (2.3) | 1.832 | 0.888 | 0.04 |
| Parafoveal VD, deep (%) | 56.60 (3.86) | 55.56 (4.23) | –1.403 | 1.368 | 0.31 |
| Perifoveal VD, deep (%) | 55.20 (4.34) | 53.78 (6.44) | –1.888 | 1.89 | 0.32 |
| Foveal avascular zone (mm2) | 0.237 (0.08) | 0.235 (0.08) | –0.006 | 0.027 | 0.82 |
| OCT-A Optic nerve head | |||||
| Peripapillary VD (%) | 50.94 (3.35) | 52.33 (2.5) | 1.426 | 0.925 | 0.13 |
| Capillary VD optic nerve head (%) | 51.44 (2.96) | 52.00 (3.66) | –0.217 | 1.154 | 0.85 |
| OCT Macula | |||||
| Retinal nerve fiber layer (mm3) | 0.143 (0.01) | 0.144 (0.01) | 0.002 | 0.004 | 0.55 |
| Ganglion cell layer (mm3) | 0.297 (0.05) | 0.341 (0.02) | 0.047 | 0.011 | < 0.001 |
| Inner plexiform layer (mm3) | 0.264 (0.03) | 0.292 (0.01) | 0.032 | 0.007 | < 0.001 |
| Inner nuclear layer (mm3) | 0.258 (0.03) | 0.269 (0.02) | 0.012 | 0.008 | 0.15 |
| Outer plexiform layer (mm3) | 0.225 (0.02) | 0.218 (0.03) | –0.003 | 0.009 | 0.76 |
| Outer nuclear layer (mm3) | 0.532 (0.04) | 0.544 (0.05) | 0.01 | 0.015 | 0.5 |
| OCT Optic nerve head | |||||
| RNFL global (μm) | 98.24 (9.23) | 99.72 (8.91) | 1.913 | 3.017 | 0.53 |
| RNFL nasal (μm) | 76.81 (17.15) | 82.25 (11.63) | 5.922 | 4.441 | 0.19 |
| RNFL nasal-superior (μm) | 115.13 (19.35) | 114.16 (23.65) | –1.795 | 7.743 | 0.82 |
| RNFL nasal-inferior (μm) | 102.15 (16.62) | 115.27 (24.74) | 11.689 | 7.354 | 0.12 |
| RNFL temporal (μm) | 64.31 (15.49) | 68.88 (9.31) | 7.47 | 3.961 | 0.07 |
| RNFL temporal-superior (μm) | 138.16 (18.16) | 132.42 (16.85) | –3.235 | 5.902 | 0.59 |
| RNFL temporal-inferior (μm) | 142.04 (15.44) | 152.36 (18.71) | 12.569 | 6.039 | 0.04 |
Results are reported from linear mixed-effects model analysis with left- and right-eye variables as repeated measures outcome and diagnosis and hemisphere (left/right) as well as the interaction between diagnosis and hemisphere as independent variables, with the effects blocked within subjects. Abbreviations: HSP, hereditary spastic paraplegia; nSVP, combined nasal parafovea and nasal perifovea vessel density average; OCT-A, optical coherence tomography angiography; OCT, optical coherence tomography; RNFL, retinal nerve fiber layer; SE, standard error; VD, vessel density. Significant at p < 0.05.
Fig. 2
OCT angiography of the macular regions affected in hereditary spastic paraplegia. Superficial parafoveal (inner circular area outside of foveal avascular zone highlighted in blue, upper en face image) and perifoveal (outer circular area, upper en face image) capillary network extending from the internal limiting membrane (red line, lower B-scan image) to the outer boundary of the inner plexiform layer (green line, lower B-scan image). Nasal region (combined parafoveal and perifoveal average) of the nasal superficial vascular plexus (nSVP) highlighted in yellow.
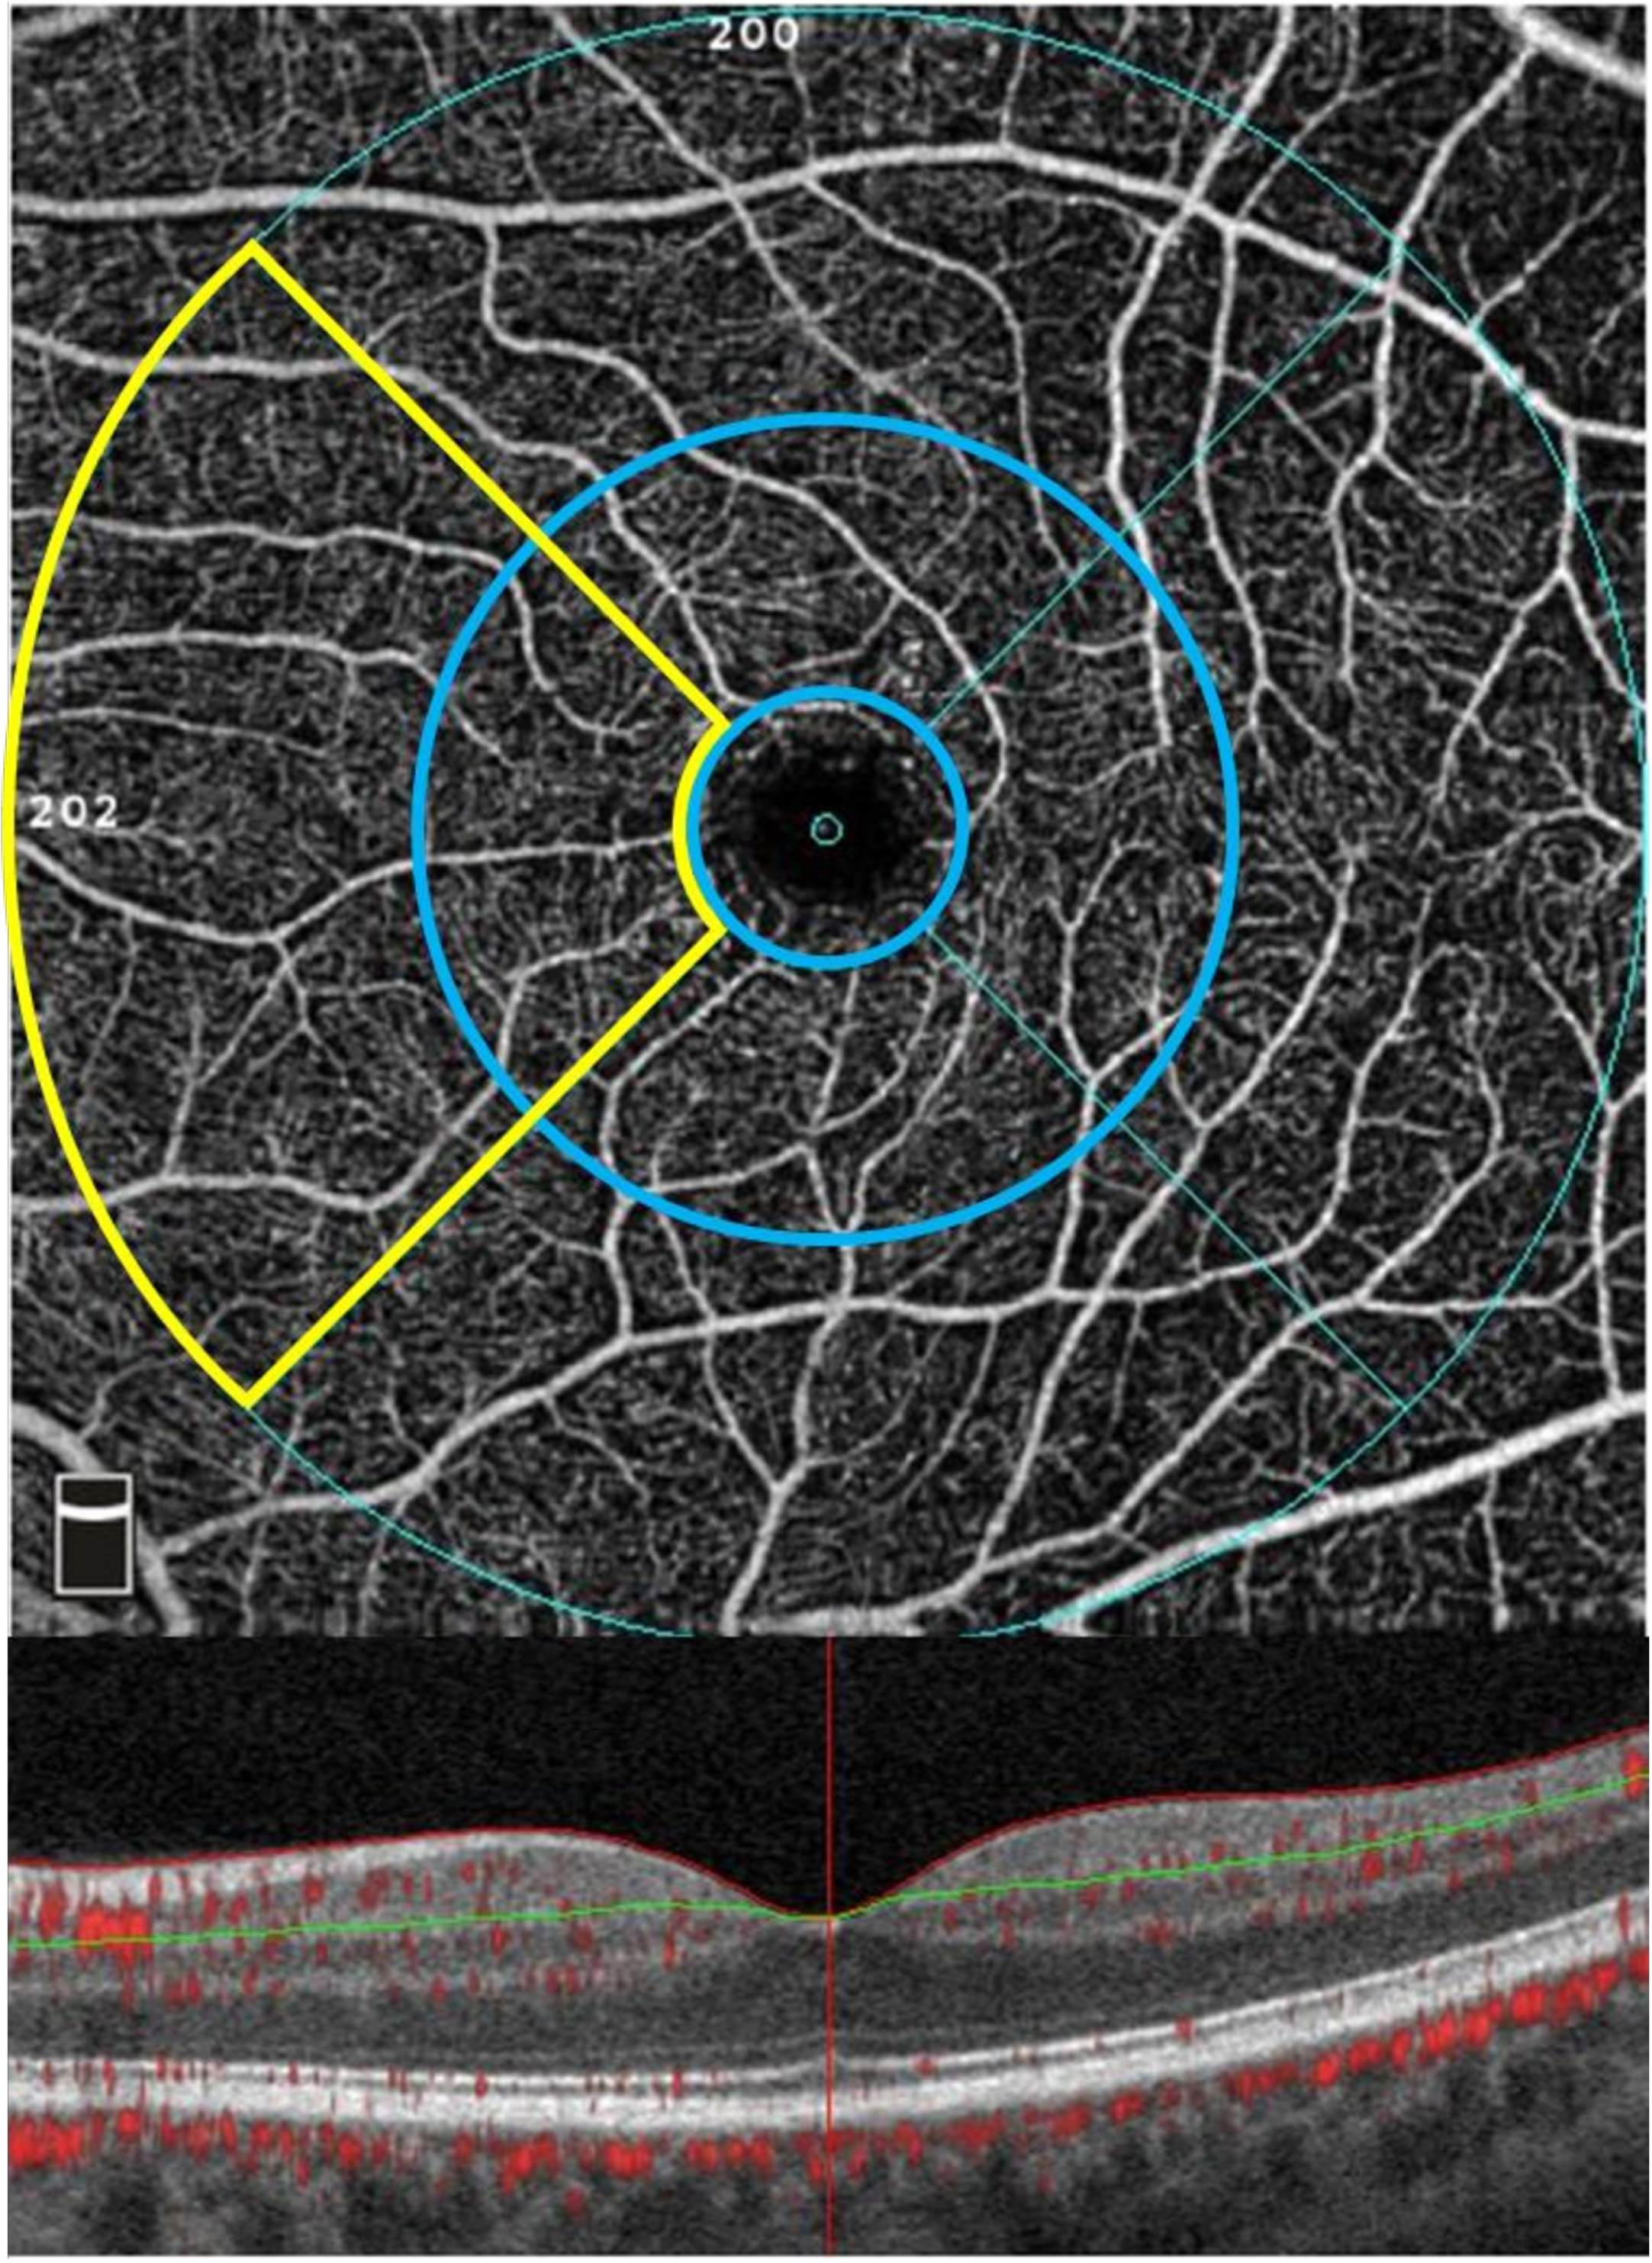
Fig. 3
Scatterplots of OCT-A and OCT data in hereditary spastic paraplegia and healthy control cohorts. Mixed-effects model analyses were conducted on 21 parameters. Significant parameters included the parafoveal superficial vessel density, the nasal superficial vascular plexus vessel density (nSVP), the ganglion cell layer volume (GCL), the inner plexiform layer volume (IPL) and the temporal-inferior peripapillary retinal nerve fiber layer thickness (pRNFL TI). Abbreviations: HSP, hereditary spastic paraplegia. Significant at p < 0.05.
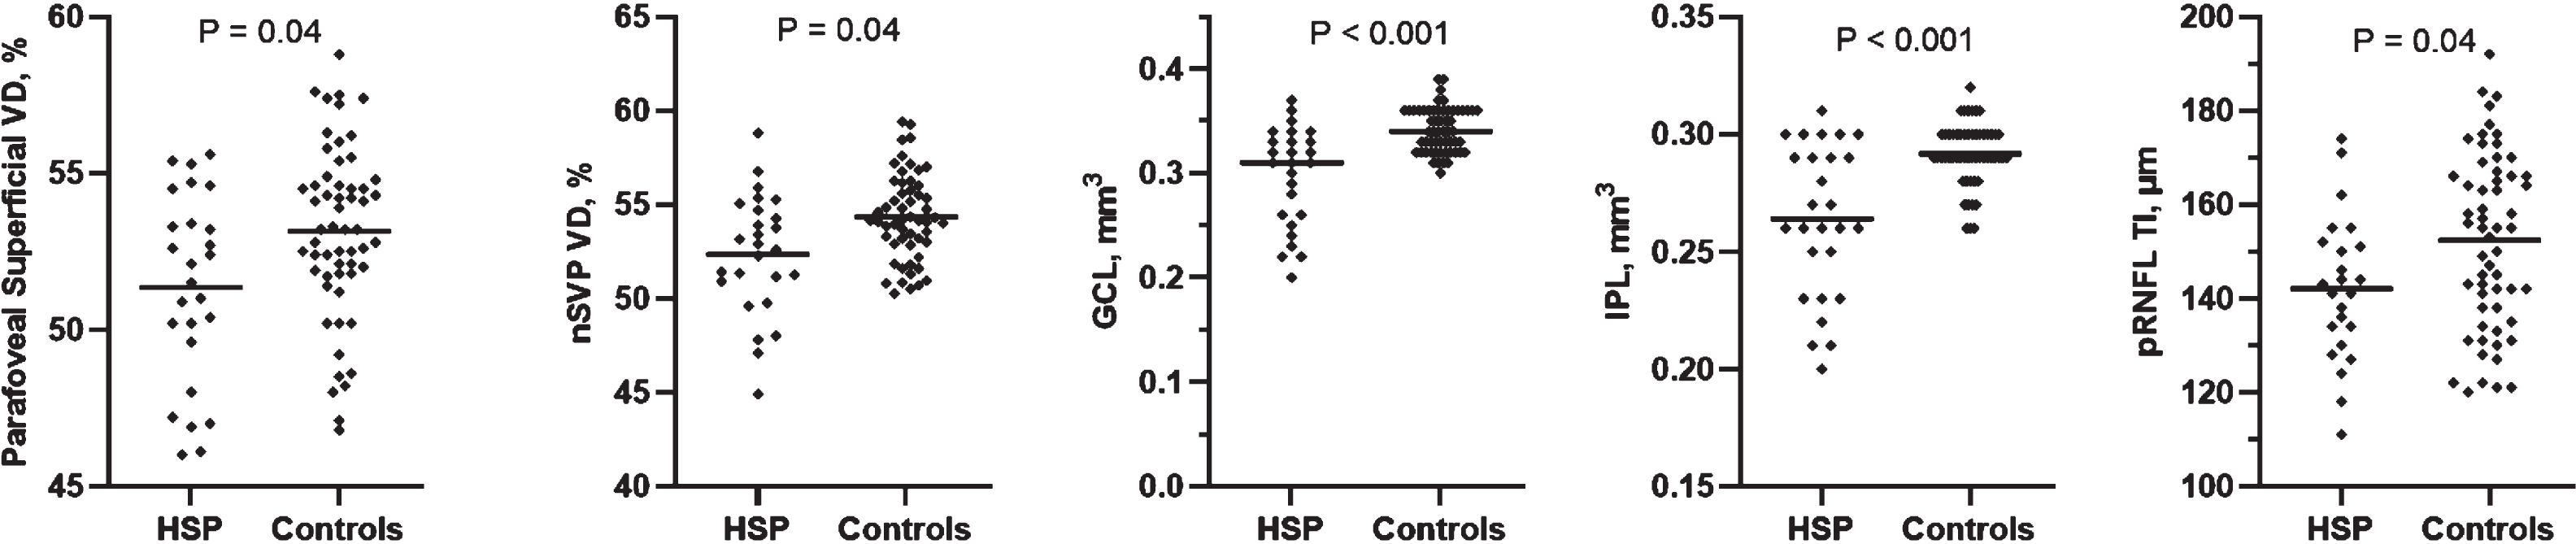
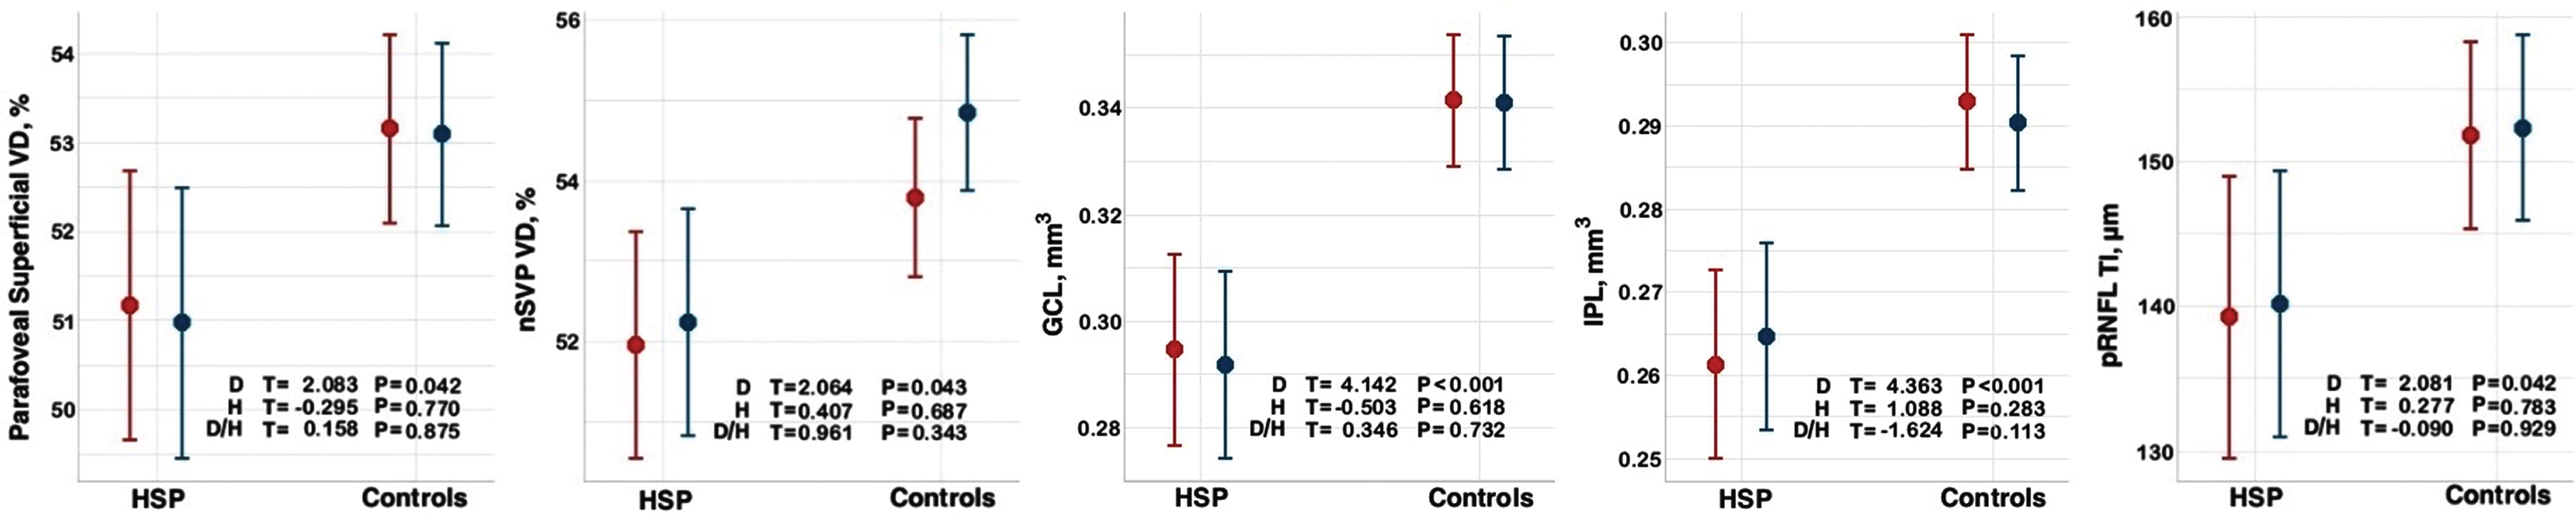
Fig. 4
Graphical representation of mixed models for OCT-A and OCT parameters in HSP and control cohorts. Mixed-effects model analysis in R using library “lmerTest” with left- and right-eye variables as repeated measures outcome and diagnosis and hemisphere (left/right) as well as the interaction between diagnosis and hemisphere as independent variables, with the effects blocked within subjects. Left eye is marked in red and right eye in blue. Abbreviations: D, diagnosis; GCL, ganglion cell layer; H, hemisphere; IPL, inner plexiform layer; nSVP, vessel density superficial nasal (combined nasal parafovea and nasal perifovea average); pRNFL TI, temporal-inferior peripapillary retinal nerve fiber layer thickness; VD, vessel density. Significant at p < 0.05.
When performing subgroup analysis, SPG7 subjects showed significantly reduced GCL volume (p = 0.006), reduced IPL volume (p = 0.007) and reduced temporal pRNFL thickness (p = 0.04) (Table 3).
Table 3
Differences in OCT-A and OCT parameters between SPG7 and control cohorts
| SPG7 vs. Controls | |||||
| Parameter | SPG7 (n = 5) | Controls (n = 10) | Estimate | SE | p-value |
| OCT-A Macula | Mean±SD | Mean±SD | |||
| Parafoveal VD, superficial (%) | 50.36±3.03 | 52.87±3.10 | 2.185 | 1.764 | 0.23 |
| Superficial nasal VD (nSVP) (%) | 51.09±2.55 | 53.55±3.10 | 2.065 | 1.538 | 0.2 |
| OCT Macula | |||||
| Ganglion cell layer (mm3) | 0.261±0.05 | 0.329±0.03 | 0.075 | 0.023 | 0.005 |
| Inner plexiform layer (mm3) | 0.241±0.03 | 0.283±0.02 | 0.047 | 0.015 | 0.007 |
| OCT Optic nerve head | |||||
| RNFL temporal-inferior (μm) | 140.25±9.38 | 154.05±18.00 | 16.996 | 9.478 | 0.09 |
| RNFL temporal (μm) | 57.67±14.49 | 71.84±7.84 | 14.121 | 6.047 | 0.04 |
Results are reported from linear mixed-effects model analysis with left- and right-eye variables as repeated measures outcome and diagnosis and hemisphere (left/right) as well as the interaction between diagnosis and hemisphere as independent variables, with the effects blocked within subjects. Abbreviations: nSVP, combined nasal parafovea and nasal perifovea vessel density average; OCT-A, optical coherence tomography angiography; OCT, optical coherence tomography; RNFL, retinal nerve fiber layer; SE, standard error; SPG7, spastic paraplegia type 7; VD, vessel density. Significant at p < 0.05.
In SPG7 subjects, reduction of temporal pRNFL thickness correlated significantly with decline of BCVA (r = –0.9; p = 0.02), while in the entire HSP cohort decrease of the GCL volume correlated significantly with decline of BCVA (rs = –0.7; p = 0.007). In the entire HSP cohort, a significant correlation was also detected between reduced IPL volume and decline of BCVA (rs = –0.7; p = 0.01) (Table 4).
Table 4
Correlation between OCT parameters and clinical findings in the HSP cohort (n = 15)
| Parameter | BCVA | SARA Score | SPRS Score | Disease duration (y) |
| Ganglion cell layer, mm3 | rs = –0.7 | r = –0.58 | r = –0.3 | r = –0.14 |
| p = 0.007 | p = 0.03 | p = 0.3 | p = 0.63 | |
| Inner plexiform layer, mm3 | rs = –0.66 | r = –0.4 | r = –0.26 | r = –0.09 |
| p = 0.01 | p = 0.15 | p = 0.37 | p = 0.78 |
Correlation analyses performed for OCT/OCT-A parameters significantly different from controls as revealed by means of linear mixed-effects model analysis. No significant correlations were found for OCT-A findings (not included in table). Presented are Pearson and Spearman’s partial correlation analyses performed for right eyes. Abbreviations: BCVA, Best-corrected visual acuity; OCT, optical coherence tomography; SARA, Scale for the Assessment and Rating of Ataxia; SPRS, Spastic Paraplegia Rating Scale. Significant at p < 0.05.
In addition, in SPG7, reduction of GCL volume correlated significantly with increase of the SPRS score (rs = –0.9; p = 0.04), while in the entire HSP cohort loss of GCL volume correlated significantly with increase in the SARA score (r = –0.58; p = 0.03) (Table 4).
4Discussion
In this study, we discovered that in HSP vessel density in the macular superficial vascular plexus (SVP) is reduced. Furthermore, a considerable reduction in GCL and IPL volumes was detected along with RNFL thinning in the temporal-inferior ONH region.
These results are both surprising and intriguing since microvascular changes have neither been documented nor suspected in HSP previously. The main focus of prior retinal imaging studies in HSP had been placed on the RNFL as it mirrors the degeneration of axons (Vavla et al., 2019; Wiethoff et al., 2012). The fact that involvement of the retinal vasculature has now been detected in addition to distinct alterations of the inner retinal layers, may provide us with new insights into retinal neurodegeneration in HSP.
The SVP provides the most important means of blood supply to the inner retinal layers (Campbell et al., 2017). This plexus is located inferior to the radial peripapillary capillary plexus (RPCP) and superior to the intermediate capillary plexus (ICP) and deep retinal capillary plexus (DCP), with all plexuses originating from the central retinal artery (Campbell et al., 2017; Fouquet et al., 2017). In our cohort, the parafoveal region with extension into the nasal perifoveal area of the superficial plexus (nSVP) showed reduced vessel density. Considering that viability of the GCL and IPL is highly dependent on this vascular network, thinning of these layers would be expected to be a consequence of reduced vessel density of this plexus (Linsenmeier & Zhang, 2017). However, the fact, that reduction of the inner retinal layer volumes was very pronounced in our cohort, more profoundly so than the impairment of the microvascular component, leads us to hypothesize that neurodegenerative processes set in first, followed by reduction in metabolic demand in these regions. Retinal ganglion cells and their synapses with bipolar cells in the IPL may suffer a decrease in size, number and function, ultimately resulting in regression of their supplying vascular networks (Aly et al., 2022). Furthermore, the decline of vascular density of the nSVP might also indicate involvement of the papillomacular bundle in its vicinity. These observations may point towards a possible predilection of neurodegenerative processes in the retina of HSP patients occurring primarily in the inner retinal layers of the macula and extending towards the papillomacular bundle. Interestingly, similar findings in regards to the GCL and the nSVP have been described by us in degenerative ataxias (Turski et al., 2022).
On the other hand, even though less likely based on our findings, it cannot be ruled out that microvascular rarefication involving the retinal SVP may set in first, resulting in a diminished metabolic supply in this particular region, subsequently leading to degeneration of retinal ganglion cells and their synapses.
Our data also document thinning of the RNFL involving the temporal-inferior ONH region. Similar findings have been reported in a previous study in HSP (Wiethoff et al., 2012). However, we could only identify a tendency to reduced vascular density of the RPC network in our cohort. This is in contrast to our findings in degenerative ataxias, where changes in this vascular network were particularly pronounced (Turski et al., 2022). This could further indicate that retinal neurodegenerative processes likely set in first in HSP, but may still be followed by a significant vascular compromise at a later stage of the disease.
The largest HSP subtype in the entire cohort was SPG7. SPG7 is a complex primarily recessively inherited form that causes a spastic ataxia phenotype (Lallemant-Dudek & Durr, 2021). Mitochondrial defects involving the protein paraplegin, an adenosine triphosphate (ATP)-dependent zinc metalloproteinase localized in the inner mitochondrial membrane, are suspected to play a decisive role in the pathogenesis of SPG7 (Lallemant-Dudek & Durr, 2021). A reduction in GCL and IPL volumes was detected along with RNFL thinning in the temporal ONH region in subjects suffering from SPG7, which is in agreement with findings in the entire cohort despite the genetic variability of the latter. Loss of retinal ganglion cells as well as optic nerve atrophy are common features of mitochondriopathies (Carelle et al., 2009). Intriguingly, our findings indicate that similar distinct retinal changes may exist in other HSP subtypes, which needs to be confirmed in large cohorts.
Since the first clinical and pathological description of HSP by Adolf von Strümpell and Maurice Laurrain in 1886 and 1888, the disorder has been widely understood and accepted as a distal axonopathy of the longest large myelinated fibers of the spinal tract (Faber et al., 2017). By following this morphological and diagnostic tenet, research emphasis has been directed towards a suspected compromise of the RNFL (Vavla et al., 2019; Wiethoff et al., 2012). Impairment of the retinal GCL along with its synapses in the IPL, however, has not been reported or suggested as a possible disease characterizing feature. In support of this novel hypothesis, our study revealed neurodegenerative changes involving primarily the retinal GCL and IPL. This finding may further enhance our understanding of this rare group of disorders. Furthermore, loss of GCL volume correlated significantly with decline in visual acuity and severity of ataxia, and BCVA was significantly reduced in the HSP cohort, further highlighting the importance of the GCL volume as a potential biomarker for disease monitoring. Although peripapillary RNFL thickness correlated with BCVA in SPG7 subjects, no correlation with BCVA or clinical severity of disease was detected in the entire HSP cohort. This would support the notion that HSP is characterized as an axonal degeneration of only the longest neuronal projection fibers, such as corticospinal tracts (Wiethoff et al., 2012). Significant correlations were not found for vascular parameters, possibly also indicating that vascular compromise may be a result of neurodegeneration rather than its culprit in HSP.
The comparison of retinal microvascular and structural findings in HSP with those recently discovered in degenerative ataxias is warranted since both conditions share not only overlapping phenotypes and underlying genes, but possibly also common cellular pathways and disease mechanisms (Synofzik & Schüle, 2017). Neurons and their axons may therefore be exposed to common pathophysiological processes in both disorders. Subsequently, the concept of a continuous ataxia-spasticity disease spectrum has been suggested to highlight this clinical and pathophysiological overlap (Synofzik & Schüle, 2017).
Strengths of the study include the comprehensive assessment of both subjects with HSP and healthy controls with the exclusion of ocular pathology. Extensive retinal imaging was performed by employing both structural high-resolution OCT and OCT-A. The quality of collected data was enhanced by correcting automated segmentation manually if needed. Limitations of the study are the small sample size, the genetic heterogeneity of the subjects and the lack of longitudinal data. Since the study was designed as an exploratory study and subjects were included based on a clinical diagnosis of HSP (Harding, 1983; Schüle et al., 2006), further confirmatory longitudinal studies with larger sample sizes with a focus on defining specific retinal microvascular changes in addition to morphological findings in single genetically determined HSP subtypes are warranted.
In conclusion, microvascular and structural retinal changes can be detected with OCT-A and OCT imaging in HSP, indicating that both cells and vascular networks in the retina are compromised. In addition, our findings support the concept of a clinical overlap between HSP and degenerative ataxias (Synofzik & Schüle, 2017). The future focus should be placed not solely on axonal degeneration but also particularly on the status of the retinal GCL, IPL and SVP for disease monitoring, and even as novel structural outcome measures for future clinical trials.
Acknowledgments
None.
Data availability statement
The data that support the findings of this study are available from the corresponding author upon reasonable institutional request.
Competing interests
No sponsor or funding agency had any involvement in the design or conduct of the study.
Gabrielle N. Turski and Christopher A. Turski report non-financial support from Heidelberg Engineering, Carl Zeiss Meditec, Optos and CenterVue, outside the submitted work.
Frank G. Holz reports research grant support from Acucela, Allergan, Apellis, Bayer, Bioeq/Formycon, CenterVue, Ellex, Roche/Genentech, Geuder, Kanghong, NightStarx, Novartis, Optos, and Zeiss, and consultant fees from Alexion, Acucela, Allergan, Apellis, Bayer, Boehringer Ingelheim, Roche/Genentech, Geuder, Grayburg Vision, LinBioscience, Kanghong, Novartis, Pixium Vision, Oxurion, Stealth BioTherapeutics, and Zeiss, outside the submitted work.
Robert P. Finger reports consulting fees from Bayer Healthcare, Novartis, Genentech/Roche, Allergan, Alimera, Boehringer Ingelheim, and research support from Zeiss Meditec, Heidelberg Engineering, Novartis and Biogen, outside the submitted work.
Thomas Klockgether reports consultation fees from Roche, UBC, Biogen, and Vico Therapeutics, outside the submitted work.
Marcus Grobe-Einsler, Xenia Kobeleva and Jennifer S. Turski have no disclosures to report.
References
1 | Aly, L. , Noll, C. , Wicklein, R. , Wolf, E. , Romahn, E.F. , Wauschkuhn, J. , Hosari, S. , Mardin, C. , Berthele, A. , Hemmer, B. , Korn, T. , Knier, B. ((2022) ). Dynamics of retinal vessel loss after acute optic neuritis in patients with relapsing multiple sclerosis. Neurology Neuroimmunology Neuroinflammation 9: (3), e1159. doi: 10.1212/NXI.0000000000001159. |
2 | Blackstone, C. , O’Kane C, J. , Reid, E. ((2011) ). Hereditary spastic paraplegias: Membrane Traffic and the motor pathway. Nature Reviews Neuroscience 12: (1), 31–42. doi: 10.1038/nrn2946. |
3 | Campbell, J.P. , Zhang, M. , Hwang, T.S. , Bailey, S.T. , Wilson, D.J. , Jia, Y. , Huang, D. ((2017) ). Detailed vascular anatomy of the human retina by projection-resolved optical coherence tomography angiography. Scientific Reports 7: (2), 42201. doi: 10.1038/srep42201. |
4 | Carelli, V. , La Morgia, C. , Valentino, M.L. , Barboni, P. , Ross-Cisneros, F.N. , Sadun, A.A. ((2009) ). Retinal ganglion cell neurodegeneration in mitochondrial inherited disorders. Biochimica et Biophysica Acta 1787: (5), 518–528. doi: 10.1016/j.bbabio.2009.02.024. |
5 | de Freitas, J.L. , Rezende Filho, F.M. , Sallum, J.M.F. , Franca, M.C. Jr. , Pedroso, J.L. , Barsottini, O.G.P. ((2020) ). Ophthalmological changes in hereditary spastic paraplegia and other genetic diseases with spastic paraplegia. Journal of Neurological Sciences 409: (2), 116620. doi: 10.1016/j.jns.2019.116620. |
6 | De Souza, P.V.S. , de Rezende Pinto, W.B.V. , de Rezende Batistella, G.N. , Bortholin, T. , Oliveira, A.S.B. ((2017) ). Hereditary spastic paraplegia: Clinical and genetic hallmarks. Cerebellum 16: (2), 525–551. doi: 10.1007/s12311-016-0803-z. |
7 | Faber, I. , Pereira, E.R. , Martinez, A.R.M. , Franca, M. Jr. , Teive, H.A.G. ((2017) ). Hereditary spastic paraplegia from 1880 to 2017: an historical review. Arquivos de Neuro-Psiquiatria 75: (11), 813–818. doi: 10.1590/0004-282X20170160. |
8 | Fink, J.K. ((2013) ). Hereditary spastic paraplegia: Clinico-pathologic features and emerging molecular mechanisms. Acta Neuropathologica 126: (3), 307–328. doi: 10.1007/s00401-013-1115-8. |
9 | Fouquet, S. , Vacca, O. , Sennlaub, F. , Paques, M. ((2017) ). The 3D retinal capillary circulation in pigs reveals a predominant serial organization. Investigational Ophthalmolmology Visual Sciences 58: (13), 5754–5763. doi: 10.1167/iovs.17-22097. |
10 | Harding, A.E. ((1983) ). Classification of the hereditary ataxias and paraplegias. Lancet 1: (8334), 1151–1155. doi: 10.1016/s0140-6736(83)92879-9. |
11 | Lallemant-Dudek, P. , Durr, A. ((2021) ). Clinical and genetic update of hereditary spastic paraparesis. Revue Neurologique (Paris) 177: (5), 550–556. doi: 10.1016/j.neurol.2020.07.001. |
12 | Lauermann, J.L. , Treder, M. , Heiduschka, P. , Clemens, C.R. , Eter, N. , Alten, F. ((2017) ). Impact of eye-tracking technology on OCT-angiography imaging quality in age-related macular degeneration. Graefes Archives of Clinical and Experimental Ophthalmology 255: (8), 1535–1542 10.1007/s00417-017-3684-z. |
13 | Lauermann, J.L. , Woetzel, A.K. , Treder, M. , Alnawaiseh, M. , Clemens, C.R. , Eter, N. , Alten, F. ((2018) ). Prevalences of segmentation errors and motion artifacts in OCT-angiography differ among retinal diseases. Graefes Archives of Clinical and Experimental Ophthalmology 256: (10), 1807–1816. doi: 10.1007/s00417-018-4053-2. |
14 | Linsenmeier, R.A. , Zhang, H.F. ((2017) ). Retinal oxygen: from animals to humans. Progress in Retina and Eye Research 58: (5), 115–151. doi: 10.1016/j.preteyeres.2017.01.003. |
15 | Mackay-Sim, A. ((2021) ). Hereditary spastic paraplegia: From genes, cells and networks to novel pathways for drug discovery. Brain Sciences 11: (3), 403. doi: 10.3390/brainsci11030403. |
16 | Marcotulli, C. , Leonardi, L. , Tessa, A. , De Negris, A.M. , Cornia, R. , Pierallini, A. , Haggiag, S. , Pierelli, F. , Santorelli, F.M. , Casali, C. ((2014) ). Early-onset optic neuropathy as initial clinical presentation in SPG7. Journal of Neurology 261: (9), 1820–1821. doi: 10.1007/s00415-014-7432-6. |
17 | Salinas, S. , Proukakis, C. , Crosby, A. , Warner, T.T. ((2008) ). Hereditary spastic paraplegia: Clinical features and pathogenetic mechanisms. Lancet Neurology 7: (12), 1127–1138. doi: 10.1016/S1474-4422(08)70258-8. |
18 | Schmitz-Hübsch, T. , du Montcel, S.T. , Baliko, L. , Berciano, J. , Boesch, S. , Depondt, C. , Giunti, P. , Globas, C. , Infante, J. , Kang, J.S. , Kremer, B. , Mariotti, C. , Melegh, B. , Pandolfo, M. , Rakowicz, M. , Ribai, P. , Rola, R. , Schöls, L. , Szymanski, S. , van de Warrenburg, B.P. , Dürr, A. , Klockgether, T. , Fancellu, R. ((2006) ). Scale for the assessment and rating of ataxia: development of a new clinical scale. Neurology 66: (11), 1717–1720 10.1212/01.wnl.0000219042.60538.92. |
19 | Schüle, R. , Holland-Letz, T. , Klimpe, S. , Kassubek, J. , Klopstock, T. , Mall, V. , Otto, S. , Winner, B. , Schöls, L. ((2006) ). The Spastic Paraplegia Rating Scale (SPRS): A reliable and valid measure of disease severity. Neurology 67: (3), 430–434. doi: 10.1212/01.wnl.0000228242.53336.90. |
20 | Schüle, R. , Wiethoff, S. , Martus, P. , Karle, K.N. , Otto, S. , Klebe, S. , Klimpe, S. , Gallenmüller, C. , Kurzwelly, D. , Henkel, D. , Rimmele, F. , Stolze, H. , Kohl, Z. , Kassubek, J. , Klockgether, T. , Vielhaber, S. , Kamm, C. , Klopstock, T. , Bauer, P. , Züchner, S. , Liepelt-Scarfone, I. , Schöls, L. ((2016) ). Hereditary spastic paraplegia: Clinicogenetic lessons from 608 patients. Annals of Neurology 79: (4), 646–658. doi: 10.1002/ana.24611. |
21 | Shribman, S. , Reid, E. , Crosby, A.H. , Houlden, H. , Warner, T.T. ((2019) ). Hereditary spastic paraplegia: From diagnosis to emerging therapeutic approaches. Lancet Neurology 18: (12), 1136–1146. doi: 10.1016/S1474-4422(19)30235-2. |
22 | Spaide, R.F. , Fujimoto, J.G. , Waheed, N.K. , Sadda, S.R. , Staurenghi, G. ((2018) ). Optical coherence tomography angiography. Progress in Retina and Eye Research 64: (5), 1–55. doi: 10.1016/j.preteyeres.2017.11.003. |
23 | Synofzik, M. , Schüle, R. ((2017) ). Overcoming the divide between ataxias and spastic paraplegias: Shared phenotypes, genes, and pathways. Movement Disorders 32: (3), 332–345. doi: 10.1002/mds.26944. |
24 | Tesson, C. , Koht, J. , Stevanin, G. ((2015) ). Delving into the complexity of hereditary spastic paraplegias: How unexpected phenotypes and inheritance modes are revolutionizing their nosology. Human Geneics 134: (6), 511–538. doi: 10.1007/s00439-015-1536-7. |
25 | Turski, C.A. , Turski, G.N. , Faber, J. , Teipel, S.J. , Holz, F.G. , Klockgether, T. , Finger, R.P. ((2022) ). Microvascular breakdown due to retinal neurodegeneration in ataxias. Movement Disorders 37: (1), 162–170. doi: 10.1002/mds.28791. |
26 | Vavla, M. , Paparella, G. , Papayannis, A. , Pascuzzo, R. , Girardi, G. , Pellegrini, F. , Capello, G. , Prosdocimo, G. , Martinuzzi, A. ((2019) ). Optical Coherence tomography in a cohort of genetically defined hereditary spastic paraplegia: A brief research report. Frontiers in Neurology 10: (11), 1193. doi: 10.3389/fneur.2019.01193. |
27 | Wiethoff, S. , Zhour, A. , Schöls, L. , Fischer, M.D. ((2012) ). Retinal nerve fibre layer loss in hereditary spastic paraplegias is restricted to complex phenotypes. BMC Neurology 12: (11), 143. doi: 10.1186/1471-2377-12-143. |


