
Z-score neurofeedback, heart rate variability biofeedback, and brain coaching for older adults with memory concerns
Abstract
Background:
The three-month, multi-domain Memory Boot Camp program incorporates z-score neurofeedback (NFB), heart rate variability (HRV) biofeedback, and one-on-one coaching to teach memory skills and encourage behavior change in diet, sleep, physical fitness, and stress reduction.
Objective:
This prospective trial evaluates the Memory Boot Camp program for adults ages 55 to 85 with symptoms of Mild Cognitive Impairment (MCI) and subjective memory complaints.
Methods:
Participants were evaluated via the Montreal Cognitive Assessment (MoCA), NeuroTrax Global Cognitive Score, measures of anxiety, depression, sleep, quality of life, quantitative electroencephalography (QEEG), and HRV parameters at four timepoints: baseline, pre-program, post-program, and follow-up. The trial included a three-month waiting period between baseline and pre-program, such that each participant acted as their own control, and follow-up took place six months after completion of the program.
Results:
Participants’ MoCA scores and self-reported measures of anxiety, depression, sleep quality, and quality of life improved after treatment, and these changes were maintained at follow-up. Physiological changes in HRV parameters after treatment were not significant, however, breathing rate and QEEG parameters were improved at post-program and maintained at follow-up. Finally, participants’ improvement in MoCA score over the treatment period was correlated with their improvement in two brain oscillation parameters targeted by the z-score NFB protocol: relative power of delta and relative power of theta.
Conclusions:
Trial results suggest that the Memory Boot Camp program is a promising treatment strategy for older adults with symptoms of MCI and subjective memory complaints.
1Introduction
Most individuals experience a decline in cognition and memory during older adulthood (Petersen, 2011). For the majority, this decline is relatively minor and does not prevent them from carrying out normal functions. However, approximately 10–20% of adults over 65 in the United States develop Mild Cognitive Impairment (MCI), a greater degree of cognitive decline that causes difficulty with daily life (Langa & Levine, 2014; Petersen, 2011). Individuals with MCI are at an increased risk of conversion to dementia, compared to older adults with no cognitive concerns (Mitchell & Shiri-Feshki, 2009). The criteria for MCI, or for the DSM-5 classification Mild Neurocognitive Disorder, include lack of dementia, objective impairment in one or more cognitive domains, subjective cognitive concerns (reported by the patient or a knowledgeable informant), and the ability to maintain functional independence (often by performing compensatory strategies to offset the decline) (American Psychiatric Association, 2013; Petersen et al., 2014). The amnestic MCI subtype involves memory decline, which might or might not be accompanied by decline in other cognitive domains (Petersen, 2011; Petersen et al., 2014). MCI is a heterogeneous disorder; individuals who have received this diagnosis may have neuropathology consistent with many different diseases, including Alzheimer’s disease, other dementia subtypes (or a combination of subtypes), cerebrovascular disease, or others (Abner et al., 2017).
Subjective Cognitive Decline (SCD), an earlier st-age of cognitive impairment, has recently been recognized (Buckley et al., 2015). SCD is characterized by concern about memory loss and other cognitive concerns that may or may not be associated with objective changes in cognition. Older adults with SCD have twice the risk of developing dementia than do those without SCD (Mitchell et al., 2014), and they have reduced quality of life (Pusswald et al., 2015).
1.1Promising non-pharmaceutical treatment strategies: Addressing modifiable risk factors
There are no medications currently approved by the United States Food and Drug Administration to treat MCI or to prevent dementia. However, several health and lifestyle risk factors associated with age-related cognitive decline, MCI, or dementia are considered modifiable, including lack of physical activity, lack of cognitive stimulation, and a diet high in refined sugars and saturated fats and low in whole grains, fiber, fruits, and vegetables (Licher et al., 2019; Livingston et al., 2017; Lourida et al., 2019; Wahl et al., 2019).
Further, it is known that exposure to chronic stress and elevated levels of the stress hormone, cortisol, lead to cognitive impairment and increased risk for dementia (Lupien et al., 1999; Ouanes & Popp, 2019). Patients with MCI (Nicolini et al., 2014) and dementia (da Silva et al., 2018) are more likely to show autonomic dysfunction and alterations in the stress response. A number of chronic stress-related mental health conditions have been linked to hippocampal atrophy, cognitive decline, and/or increased risk of dementia, including post-traumatic stress (Jatzko et al., 2006), major depressive disorder (Sheline et al., 2003), anxiety (Gimson et al., 2018), and insomnia (Neylan et al., 2010; Noh et al., 2012). Sleep deprivation disrupts emotions and cognition in multiple ways, including causing memory problems (Krause et al., 2017). Insufficient sleep may also increase the risk of Alzheimer’s disease. It has been theorized that sleep deprivation leads to increased levels of amyloid-β in the brain and accelerates amyloid-β deposition into the amyloid plaques characteristic of Alzheimer’s disease (Ju et al., 2014). Depression is likewise tightly linked with memory and cognitive deficits, and depressed individuals are likely to experience impairments in working memory, executive function, and processing speed domains (LeMoult & Gotlib, 2019). Older adults with MCI, compared to those in the general population, are at increased risk for depression and anxiety (Mirza et al., 2017), and a recent meta-analysis found a depression prevalence of 34% among MCI patients with the amnestic subtype (Ismail et al., 2017).
There is evidence that intervention to reduce some of these risk factors can delay or decrease the risk of age-related cognitive impairment or MCI (McEvoy et al., 2019; Ngandu et al., 2015; Petersen et al., 2014; Williamson et al., 2019). Physical activity is associated with protection from cognitive decline and dementia, and high-intensity exercise is associated with even greater protection (Livingston et al., 2017). Six months of aerobic exercise training has been shown to increase brain volume in older adults (Colcombe et al., 2006), and exercise in combination with cognitive training has been shown to improve cognitive function in older adults (with or without dementia) (Karssemeijer et al., 2017; Law et al., 2014). The Mediterranean diet is associated with longer life (Trichopoulou et al., 2003), reduced cardiovascular disease risk (Grosso et al., 2017), reduced Alzheimer’s disease risk, and a lower rate of conversion from MCI to Alzheimer’s disease (Scarmeas, Stern, Mayeux, et al., 2006; Scarmeas et al., 2009; Scarmeas, Stern, Tang, et al., 2006). Even diet changes made late in life may provide benefit. Older adults at high risk for cardiovascular disease who were placed on the Mediterranean Diet for four years experienced improvements in cognitive function, while those in the control group experienced cognitive decline (Valls-Pedret et al., 2015). Further, epidemiological studies suggest that the status of specific vitamins and other nutrients is associated with reduced risk of cognitive impairment, MCI, and/or dementia (Mohajeri et al., 2015; Smith & Refsum, 2016). These include (but are not limited to) vitamin D (Annweiler et al., 2013; Annweiler et al., 2012; Buell & Dawson-Hughes, 2008), the vitamin B family (Cooper et al., 2015; Douaud et al., 2013; Mohajeri et al., 2015; Smith & Refsum, 2016), and omega-3 fatty acids (Bourre, 2006; Cole et al., 2009; Su, 2010; Yurko-Mauro et al., 2010).
Cognitive stimulation and learning new skills are promising strategies as well. Completing high school during early life is associated with a reduction in dementia risk in old age; for older adults, continuing education, learning complex new skills, and engaging in cognitively stimulating activities are likely to produce cognitive improvements, even if begun late in life (Livingston et al., 2017). Older adults who learned how to use an iPad or digital photography software experienced improvements in memory (Chan et al., 2014; Park et al., 2014). Certain computer brain games have been shown to enhance cognitive function in older adults (Anguera et al., 2013), and a recent Cochrane review of computerized cognitive training in healthy older adults suggests small, but measurable, improvements in cognitive function and memory at the end of training (Gates et al., 2020). Further, there is evidence that older adults with working memory concerns are more likely than other groups to benefit from computerized training (Diamond & Ling, 2019). Computerized cognitive training is known to improve skills that are very similar to those trained, although the extent to which it improves performance on untrained tasks or extends to other domains of life is currently under debate in the field (Simons et al., 2016; Smid et al., 2020). Improvements in cognitive skills after non-computerized cognitive training have been shown to transfer to long-lasting improvements in daily life (Tennstedt & Unverzagt, 2014) and may be especially effective when training is performed with an enthusiastic coach (Diamond & Ling, 2019).
In addition to the more extensively researched modifiable risk factors described above, there is emerging evidence to suggest that managing stress and improving mental health may likewise contribute to improved cognitive health in older adults (Fotuhi et al., 2016; Young et al., 2017). The severity of memory complaints is associated with symptoms of depression (Ponds et al., 1997), anxiety (Rabin et al., 2017), and reduced quality of life (Mol et al., 2007). The current study focuses on three techniques in particular to improve stress management and mental health: neurofeedback (NFB), heart rate variability (HRV) biofeedback, and mindfulness meditation. These techniques are also associated with improvements in cognition (discussed below).
Electroencephalography (EEG) -based NFB is a biofeedback protocol in which information about the participant’s brain oscillation patterns is fed back via auditory and/or visual cues in real time; operant conditioning is then used to modify these brain oscillations (Niv, 2013; Sitaram et al., 2017; Thatcher, 1998). NFB has been shown to improve function in a variety of behavioral, psychiatric (Schoenberg & David, 2014) and neurological conditions, including depression (Dias & van Deusen, 2011; Fernández-Álvarez et al., 2020; White et al., 2017), anxiety (Hammond, 2005), traumatic brain injury (Thornton & Carmody, 2009), chronic pain (Patel et al., 2020), post-traumatic stress disorder (Steingrimsson et al., 2020), obsessive compulsive disorder (Ferreira et al., 2019), epilepsy (Egner & Sterman, 2006), and attention-deficit/hyperactivity disorder (ADHD) ((Arns et al., 2009; Bussalb et al., 2019; Groeneveld et al., 2019; Lubar et al., 1995; Mi-coulaud-Franchi et al., 2014; Pigott & Cannon, 2014; Riesco-Matías et al., 2019; Van Doren et al., 2018), but see (Cortese et al., 2016; Sonuga-Barke et al., 2013)). It has also been shown to improve cognitive performance in healthy individuals (Dessy et al., 2017; Gruzelier, 2014; Reiner et al., 2014; Rozengurt et al., 2016). In several studies, older adults experienced improvements in attention, working memory, and executive function after NFB training (Angelakis et al., 2007; Becerra et al., 2012; Reis et al., 2016; Wang & Hsieh, 2013), and adults with dementia experienced improvements in memory, efficiency of cognitive processing, and some aspects of executive function (Berman & Frederick, 2009; Luijmes et al., 2016; Surmeli et al., 2015). Further, NFB for individuals with MCI was associated with improved memory performance maintained at least thirty days beyond training (Lavy et al., 2019).
Z-score NFB is a more recent protocol in which multiple QEEG parameters are typically trained simultaneously, and only those for which the participant de-viates from the average values in an age-matched normative database (Collura et al., 2010; Thatcher & Lubar, 2009). The z-score for a particular QEEG parameter represents the number of standard deviations from the age-normed mean, and participants are trained to approach z = 0. Although few high-quality studies currently exist for the use of z-score NFB (R. Coben et al., 2019), a number of published studies show promising results of z-score NFB for a variety of conditions (Thatcher et al., 2020), including ADHD (Groeneveld et al., 2019; Wigton & Krigbaum, 2015), pain perception (Prinsloo et al., 2018), and cognitive dysfunction (Koberda, 2014).
HRV refers to the variability in timing between heart beats (De Jong & Randall, 2005), and it is gov-erned by both the sympathetic and parasympathetic nervous systems. Low HRV is associated with reduced ability to adapt to stressful environments and increased incidence of disease and stress-related illness, whereas high HRV is associated with increased resilience, adaptability, and autonomic flexibility (Baevsky et al., 2007; Baevsky & Chernikova, 2017; Lehrer & Gevirtz, 2014; Shaffer & Ginsberg, 2017; Shaffer et al., 2014; Thayer & Friedman, 2002). Further, high HRV is associated with greater cognitive performance, especially for executive control, in both young and older adults (de Oliveira Matos et al., 2020; Forte et al., 2019). HRV biofeedback trains individuals to control their respiration by producing a smooth, diaphragmatic breath at approximately six breaths per minute, thereby maximizing the amplitude of their respiratory sinus arrhythmia (Lehrer & Gevirtz, 2014). As an adjunct treatment to traditional therapies, HRV biofeedback has been used to treat individuals with depression, stress, anxiety, and other conditions (Gevirtz, 2013). A recent study has provided evidence that HRV biofeedback can directly improve measures of attention, while also ameliorating symptoms of depression and anxiety in an older adult population (Jester et al., 2019).
Approximately 8% of Americans practice some form of meditation. Expert meditators perform better on cognitive tasks (including attention and executive function) and may also have increased cognitive processing speed (Clarke et al., 2015). Meditation may result in physical changes in the brain; MRIs of expert meditators show greater gray matter in regions involved in attention and memory (Christie et al., 2017; Tang et al., 2015). Mindfulness meditation has been shown to reduce stress (Tang et al., 2015) and improve executive function (Diamond & Ling, 2019). Mindfulness meditation training in individuals with MCI resulted in enhanced brain connectivity (Wells et al., 2013). Further, a mindfulness meditation intervention for older adults with MCI demonstrated improved cognitive function, and those who meditated the longest experienced the largest improvements (Wong et al., 2017).
1.2Benefits of combining multiple strategies to prevent cognitive decline
Several programs that combine multiple strategies for older adults have demonstrated improvements in cognition (Barnes et al., 2013; Bredesen, 2014; Fotuhi et al., 2016). Studies have also suggested that combining multiple strategies is more effective than a single strategy for cognitive decline/MCI (Sherman et al., 2017). For instance, cognitive stimulation is likely to be more effective when combined with exercise (Karssemeijer et al., 2017; Law et al., 2014). The Finnish Geriatric Intervention Study to Prevent Cognitive Impairment and Disability (FINGER) trial, which combined cognitive stimulation, exercise, diet changes, and management of vascular problems in older adults with dementia risk factors, demonstrated an 80% improvement in executive function and a 150% increase in cognitive speed (Ngandu et al., 2015; Rosenberg et al., 2018).
Despite the promising data for interventions to modify risk factors, making long-lasting behavior change is difficult. For instance, as of 2006, only 10% of adults in the United States exercised for at least the minimum amount of time each week re-commended by the US Department of Health and Human Services (Office of Disease Prevention and Health Promotion, 2017; Tucker et al., 2011). A com-prehensive health program that includes an accountability partner/coach improves participants’ motivation, adherence to the program, and physiological and psychological well-being (Kivelä et al., 2014; Kreitzer et al., 2008; Prince et al., 2017). Including coaching combined with additional strategies is likely to improve adherence to, and therefore any effectiveness of, the intervention program.
1.3Intervention and objectives
Our center has developed a multi-domain Memory Boot Camp program to incorporate the factors described above that are known or believed to protect against cognitive decline, based on a similar published program (Fotuhi et al., 2016). Z-score NFB and HRV biofeedback is combined with in-person meetings with ‘brain coaches’, who encourage participants to improve diet and add supplements, practice memory training, exercise, get quality sleep, make time for relaxation and mindfulness meditation, learn new things that are cognitively challenging, and increase social interaction. The present study is a prospective trial to evaluate the three-month Memory Boot Camp program for older adults (age 55 to 85) with subjective and objective memory deficits. Participants were evaluated via neurocognitive assessments, self-report questionnaires, quantitative electroencephalography parameters, and HRV parameters at four timepoints: baseline, pre-program, post-program, and follow-up. The trial included a three-month waiting period be-tween baseline and pre-program, such that each participant acted as their own control, and follow-up took place six months after completion of the program. The primary objective of the trial was to determine whether the three-month Memory Boot Camp program improved cognitive function when compared to changes that occurred over the equivalent control period. Secondary objectives included testing for changes in stress-related measures of anxiety, depression, sleep, and quality of life, as well as heart rate, breathing rate, HRV, and QEEG variables. A six-month post-program follow-up assessment was included to determine the longevity of any changes observed upon program completion.
2Methods
2.1Study design
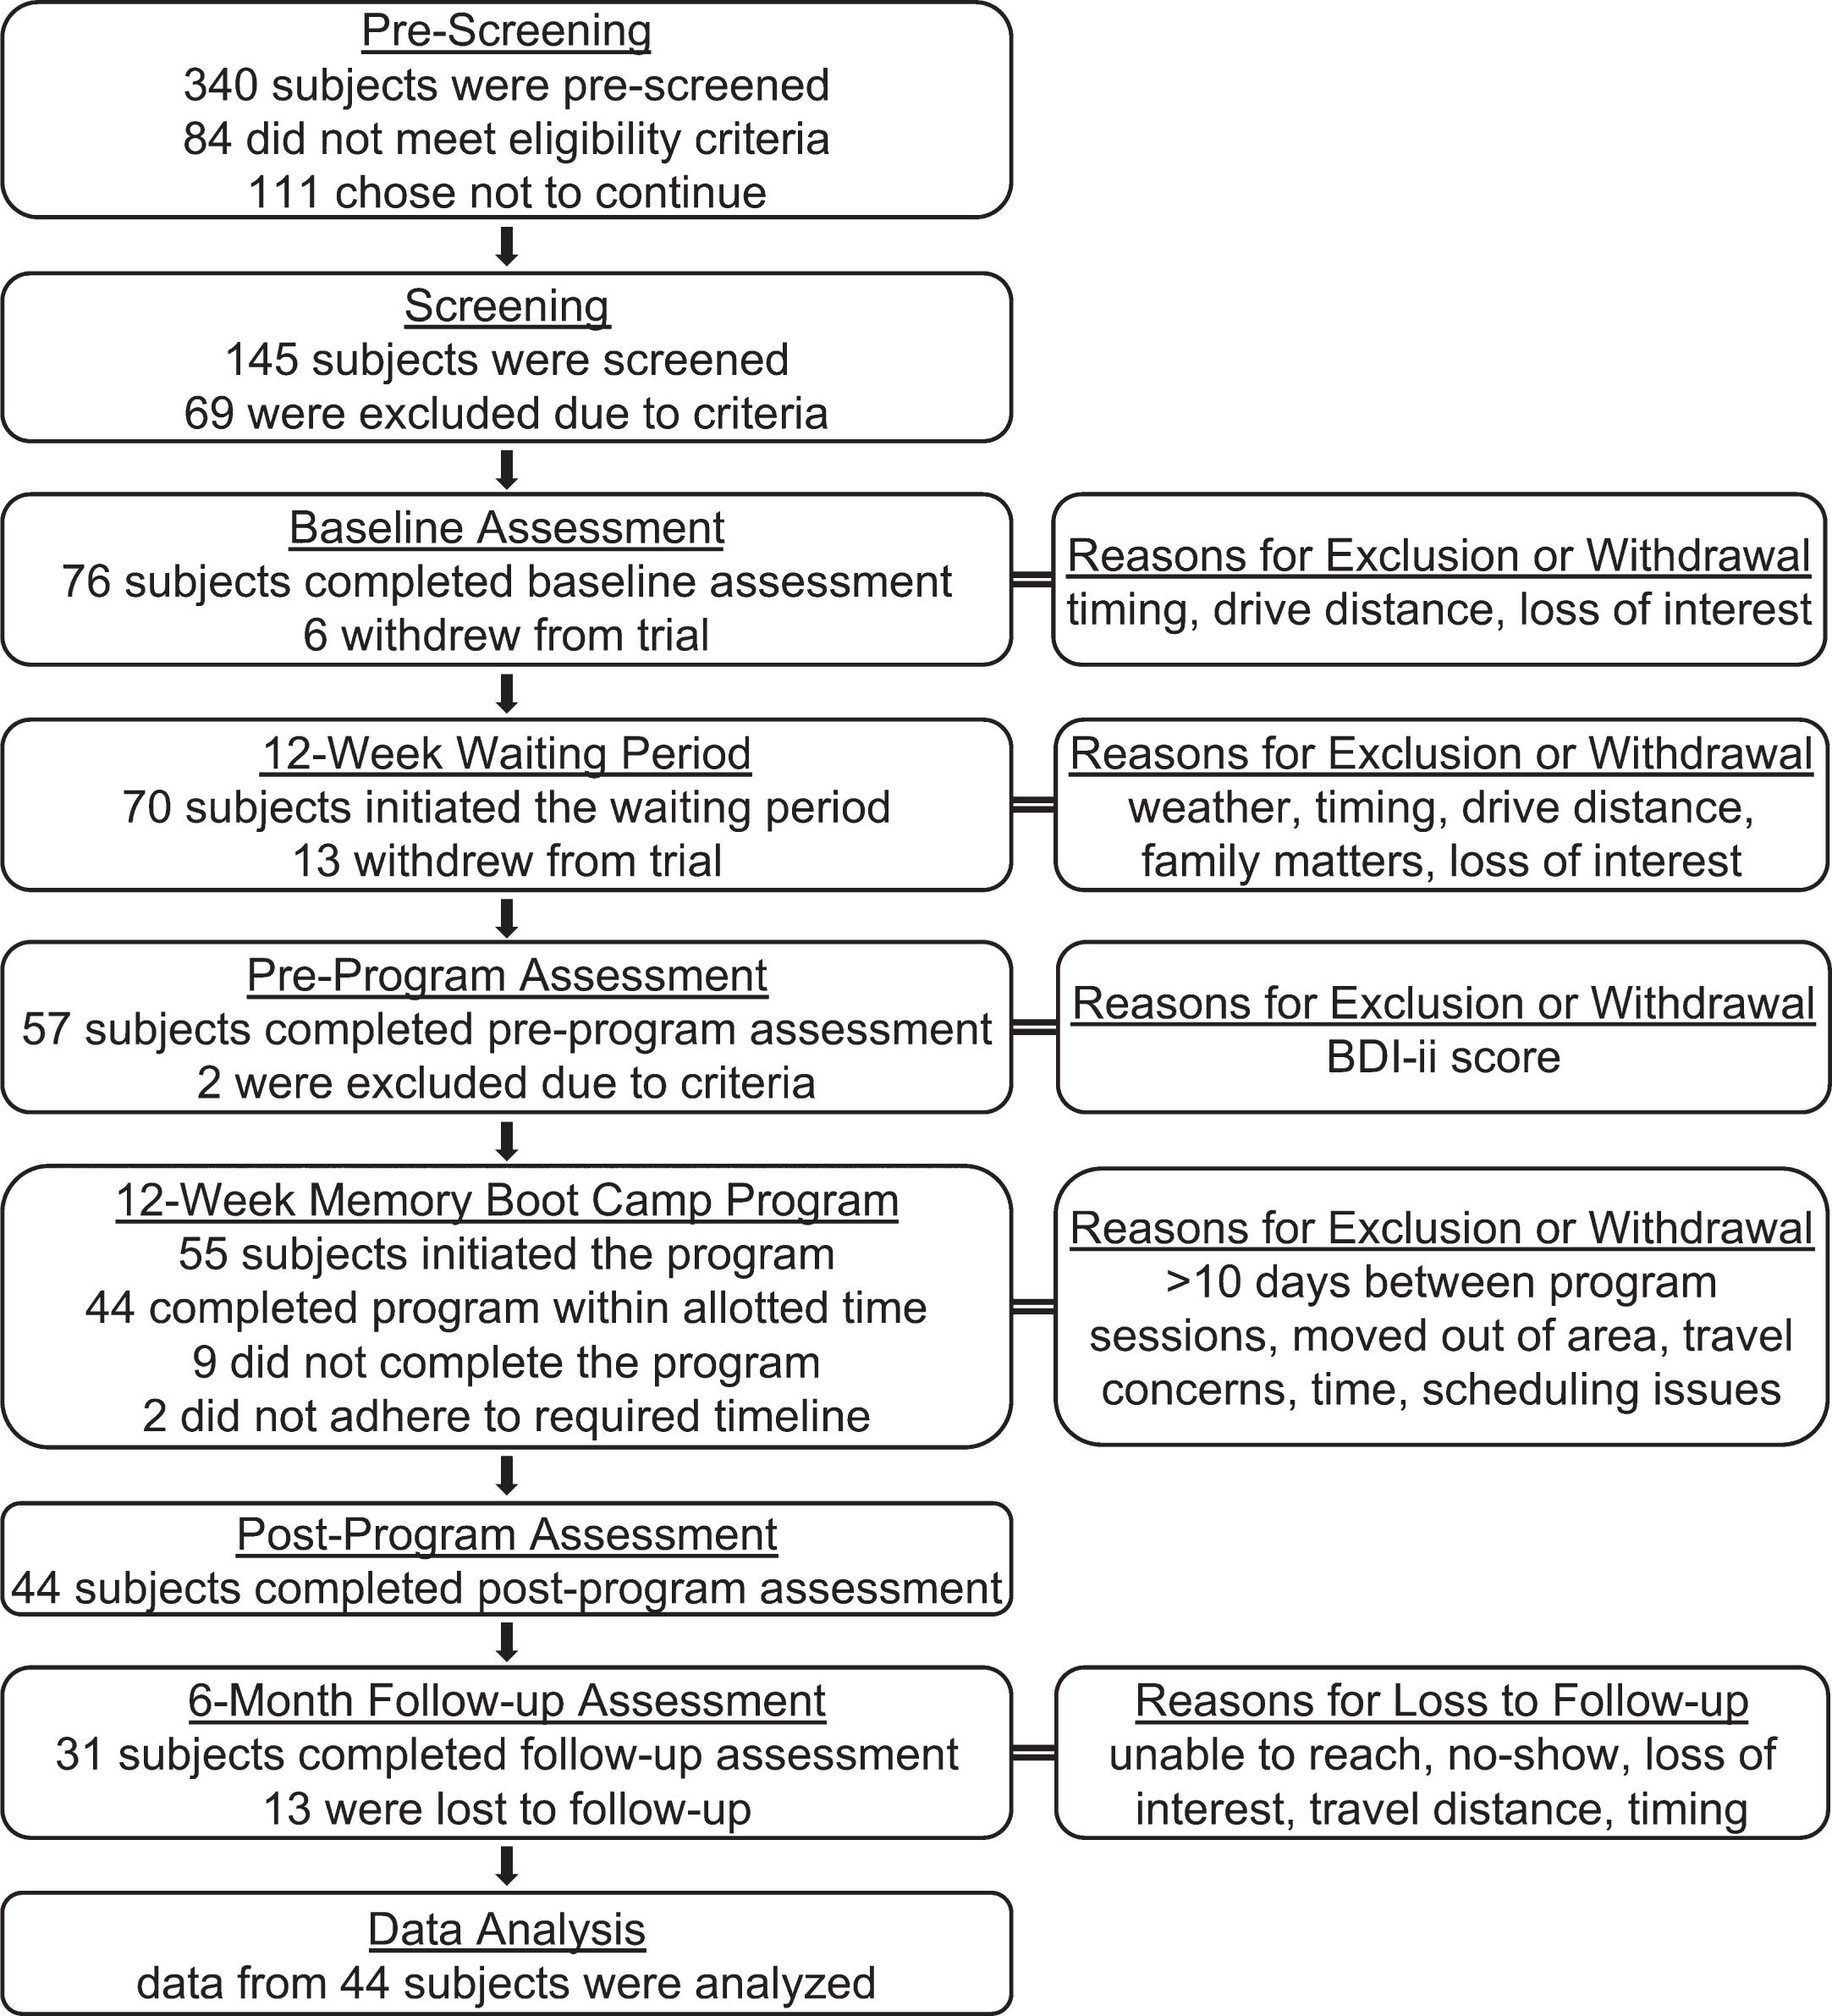
This study (ClinicalTrials.gov ID: NCT04426162) was performed by a private center that provides EEG-NFB and HRV biofeedback therapy in Michigan and Florida, USA. This prospective, multi-site trial took place in five locations in the cities of Grandville, Grand Rapids, and Holland, Michigan, and Palm Beach Gardens and Boca Raton, Florida. Seventy-six participants were enrolled, and 44 completed the specified intervention (Fig. 1). The study design was repeated measures with a three-month waiting period between the initial baseline assessment and the start of the Memory Boot Camp program, such that each participant served as their own control. Nineteen enrolled individuals withdrew from the study before or during this waiting period. Assessments took place at baseline (t = –3 months), pre-program (t = 0 months), post-program (t = 3 months), and 6-month post-program follow-up (t = 9 months). Participants paid nothing to take part in the program; after completion of each assessment, participants were given a gift card of value between $50 and $100, depending on which assessment milestone was completed. Licensed clinical social workers oversaw the testing and program, and brain coaches met with subjects during the Memory Boot Camp intervention. This study was approved by the New England Independent Review Board.
Fig. 1
Study Participants Flowchart. Number of participants is shown for each phase and assessment point of the trial. Reasons for exclusion of participants and summaries of the most common reasons for withdrawal/loss to follow-up are shown on the right.
2.2Selection of participants: Inclusion and exclusion criteria
A flow chart diagram of study participation at ea-ch phase is shown in Fig. 1. Inclusion criteria were: age 55–85 at the start of the trial, subjective memory concerns, at least a high school education, having a current primary care doctor (or agreement to acquire a primary care doctor), ability to read and write English, time availability of 4-5 hours/week, and good general health (e.g., no active fevers, no recent heart transplants, etc.). Exclusion criteria included: major depression, known neurological illness (e.g., Alzheimer’s or other dementia, Parkinson’s, epilepsy, multiple sclerosis), serious psychiatric diagnosis, substance abuse, complete blindness or deafness, plans to be out of town for more than 10 days during the active phase of the trial, current or past client of our centers, and employee or their family member. Participants were recruited from the community surrounding participating center locations through digital and print ads via radio, newspaper, Facebook, and paid search ads. Ads were targeted to individuals with memory concerns, offered a free memory assessment, and directed potential participants to contact our center by telephone or online for pre-screening.
2.3Pre-screening
Pre-screening surveys (over the phone or online) were used to gather information on inclusion and exclusion criteria. Five questions were selected from a subjective cognitive decline assessment (Gifford et al., 2015) to confirm the presence of subjective memory concern. Individuals who identified with two or more memory concerns were invited to come to the center for in-person screening.
2.4Screening
Potential participants were given the Patient Health Questionnaire (PHQ-9), a brief measure of depression severity (Kroenke et al., 2001). Those who scored in the severe range (20–27) or indicated suicidal ideation on question nine were not eligible for the study; they were given a safety evaluation before being dismissed. Individuals who completed some or all of the screening procedures but were not invited to enroll in the study were given gift cards of a nominal amount.
Remaining individuals were given the Montreal Cognitive Assessment (MoCA). A summary figure that describes the protocol from this point in screening through the final follow-up assessment is shown in Fig. 2. The MoCA is a screening instrument developed specifically to detect MCI in older adults that can be administered in 10 minutes or less (Nasreddine et al., 2005). Individuals are scored on seven different domains: visuospatial/executive, naming, attention, language, abstraction, delayed recall, and orientation, and resultant scores range from 0–30. The MoCA is considered to be the most sensitive population-based cognitive screening tool (De Roeck et al., 2019). A cut-off of 25/26 is recommended by the test manufacturer to differentiate individuals in the MCI category (Nasreddine et al., 2005). This cutoff is likely to be inappropriate for some sub-populations (Milani et al., 2018), and alternative cutoffs have been suggested, including 23/24 for a cardiovascular population (McLennan et al., 2011), and 26/27 for a population with Parkinson’s disease (Hoops et al., 2009). For screening purposes in the present study, individuals who scored 18–26 on the MoCA were invited to enroll. For potential participants who were ultimately enrolled in the study, MoCA scores from this timepoint (baseline) and the other three timepoints were the primary outcome measure for this study. Individuals also took the NeuroTrax BrainCare Testing Suite (NeuroTrax) during this screening session. The NeuroTrax is described in the Assessments section below.
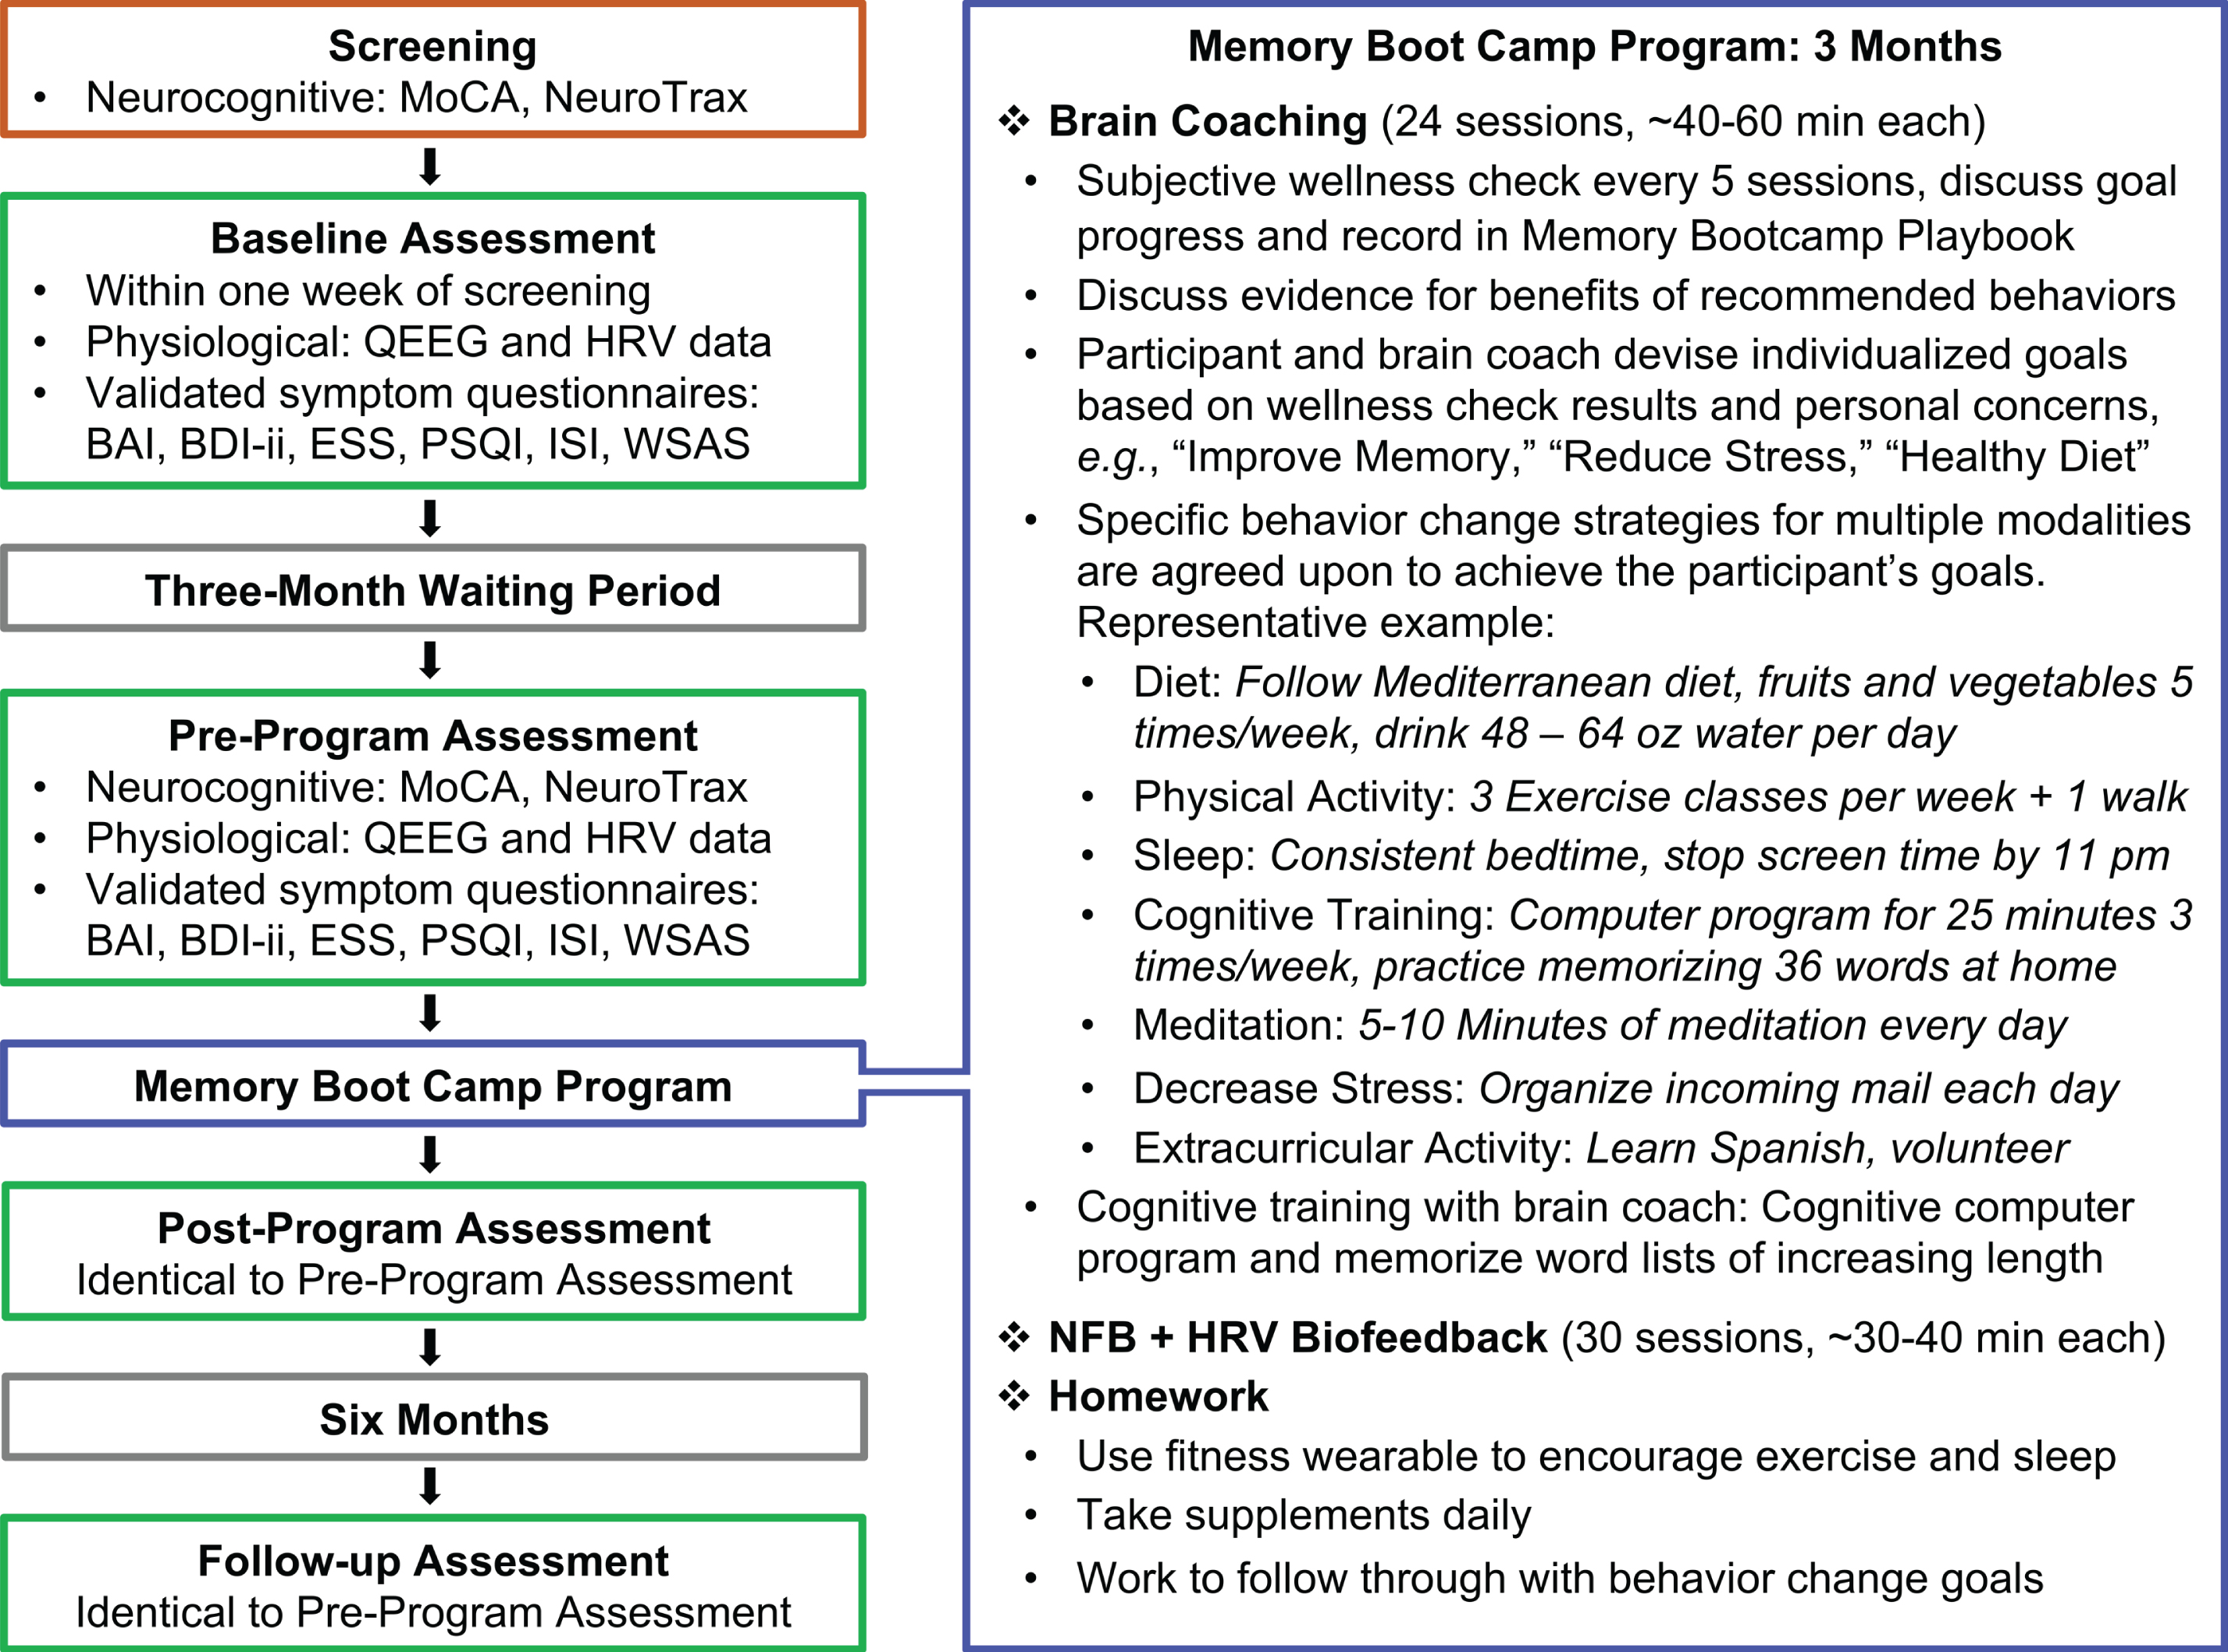
Fig. 2
Summary of the Study and the Memory Boot Camp Program. A summary of each phase of the study is displayed on the left. The right panel is a summarized description of the intervention phase of this trial: The Memory Boot Camp program. MoCA: Montreal Cognitive Assessment; BAI: Beck Anxiety Inventory; BDI-ii: Beck Depression Inventory-II; ESS: Epworth Sleepiness Scale; ISI: Insomnia Severity Index; PSQI: Pittsburgh Sleep Quality Index; WSAS: Work and Social Adjustment Scale.
2.5Assessments
Individuals who enrolled in the study returned to a center location within one week of screening to complete the baseline timepoint assessment (Fig. 2). After the baseline assessment, the protocols for the following three timepoint assessments (pre-program, post-program, and follow-up) were identical.
2.5.1Neurocognitive assessments and self-report questionnaires
The MoCA, described in section 2.4, was used for screening and as the primary outcome assessment for the study. The NeuroTrax was originally developed and validated for the diagnosis of MCI in clinical practice and in research (Dwolatzky et al., 2004); it has been validated in both demented (Dwolatzky et al., 2010) and normally aging populations (Lampit et al., 2015). The NeuroTrax covers seven cognitive domains, consisting of memory, executive function, attention, visual spatial, verbal function, problem solving, and working memory. Overall performance incorporates these domains into one age-normed Global Cognitive Score.
The Beck Depression Inventory-II (BDI-ii) (Beck et al., 1996) is a self-report inventory and screening tool for depression. If a participant scored 31 or higher on the BDI-ii at any assessment, a safety check was performed, and the subject was dismissed from the trial. The Beck Anxiety Inventory (BAI) (Beck & Steer, 1993) is a self-report inventory for measuring subjective, somatic, or panic-related symptoms of anxiety. The Insomnia Severity Index (ISI) (Bastien et al., 2001) is a self-report inventory designed to assess sleep patterns and presence/severity of insomnia during a 14-day period. The Pittsburgh Sleep Quality Index (PSQI) (Buysse et al., 1989; Mollayeva et al., 2016) is a self-report inventory to measure sleep quality and disturbances over a one-month interval. The Epworth Sleepiness Scale (ESS) (Johns, 1992) is a self-report inventory designed to assess level of daytime sleepiness. ESS scores ≥11 are considered indicative of above-normal sleepiness that requires further evaluation; any participants with a score in this range were advised to discuss possible sleep apnea with their physician. The Work and Social Adjustment Scale (WSAS) (Mundt et al., 2002) is a self-report inventory used to provide a measure of global functional impairment, due to a specific issue, in this case, memory concerns.
2.5.2Physiological assessments
Quantitative electroencephalography (QEEG) and cardio-respiratory measurement (to evaluate HRV and respiration rate) were performed at each assessment; QEEG was additionally performed at a mid- program timepoint to confirm progress and adjust the NFB protocol, if needed. QEEG, HRV, heart rate, and breathing rate collection protocols were performed as described in a previous publication by our group (Groeneveld et al., 2019). Succinctly, one 5-minute eyes closed and one 5-minute eyes open QEEG recording was collected at each assessment using 19 electrode locations: O1, O2, P3, PZ, P4, T3, T4, T5, T6, C3, CZ, C4, F3, FZ, F4, F7, F8, FP1, and FP2, with a Neuron-Spectrum-3 amplifier (Neurosoft, Ivanovo, Russia) and Neuroguide software (Applied Neuroscience, Inc., Largo, FL)(Thatcher, 2012), using a sampling rate of 500 Hz. HRV data were collected for seven minutes using a blood volume pulse finger sensor using a sampling rate of 128 Hz with a ProComp5 or ProComp Infiniti amplifier (both from Thought Technology, Montreal, Canada) with Biograph software version 6.0.4. This seven-minute interval was also used to measure breathing rate, using a strain gauge respiration belt (Resp-Flex/Pro, Thought Technology). Seven minutes of HRV data were collected to increase the likelihood of selecting a five-minute artifact-free segment; if no artifact-free five-minute segment could be identified, the participant was excluded from HRV analysis. In a departure from the method of Groeneveld et al., 2019, during the HRV/breathing rate collection, participants were shown a screen displaying a random order of blue and yellow squares and instructed to silently count the blue squares (Eddie et al., 2014; Jennings et al., 1992). Because some HRV measurements are sensitive to breathing rate, this ‘plain vanilla’ task was intended to distract participants from focusing on their breathing, to prevent against exaggerated breathing, and to more accurately capture a normal breath pattern.
2.6Study intervention: Memory boot camp
Following screening and the baseline assessment, all subjects began a three-month waiting period to serve as a control, during which they were instructed not to make any major lifestyle changes (Fig. 2). Before beginning Memory Boot Camp, participants met with a brain coach at an orientation appointment to go over the details of the program and re-ceived the following: (1) a wrist-wearable sleep and activity tracker (MisFit, Burlingame, California) used to motivate participants for physical activity and sleep behavior change; (2) Metagenics brand supplements (Aliso Viejo, CA, USA): Omega-3 fatty acid containing eicosapentaenoic acid and docosahexaenoic acid (1000 mg, two pills/day; participants taking anticoagulant medications were advised not to take this supplement), Ceralin Forte (B-complex, three pills/day), and vitamin D3 (1000 IU/day); (3) Memory Playbook (an in-house educational resource to track progress) and (4) an instructional document on memorization techniques. Participants then started the active program phase of the trial, which consisted of sessions two to three times per week for three months. For sessions that included both brain coaching and NFB + HRV biofeedback brain coaching took place first.
2.6.1Brain coaching sessions
Participants met with their brain coach approximately two times per week, for a total of 24 meetings of 40–60 minutes each. A summary is given in the diagram in Fig. 2. Brain coaches served as instructors as well as accountability partners to encourage participants to fulfill goals set during brain coaching sessions. These goals were based on improving diet (work toward Mediterranean diet (defined in Fig. 2), taking supplements, and increasing water intake due to the susceptibility for dehydration in older adults (Wotton et al., 2008)), increasing sleep to eight hours using sleep hygiene recommendations (Irish et al., 2015; Souman et al., 2018; Stepanski & Wyatt, 2003), increasing exercise to 150 minutes per week, reducing stress (using daily mindfulness meditation and specific strategies based on individual stressors in the participant’s life), cognitive training (Happy Neuron Pro: a computer-based program (www.happyneuronpro.com), memorization of word lists with various techniques), and increasing social interaction with peers via group activities and/or volunteer activities based on the participants’ interests.
2.6.2NFB + HRV biofeedback sessions
Each session began with HRV biofeedback tra-ining, which was performed as described in (Groeneveld et al., 2019). In brief, participants were trained using respiratory and cardiorespiratory biofeedback while wearing a volume pulse sensor on a finger and respiration belt around the waist. For respiratory biofeedback, participants had to slow their breaths to approximately six breaths per minute and practice smooth, consistent breath patterns, and for cardio-respiratory biofeedback, participants were coached to move into slow, smooth, consistent breath patterns so that the peak of their inhalation matched the peak of their respiratory sinus arrhythmia (the rising and falling of the heart rate as a result of inhalation and exhalation). Increasing the amplitude of respiration and slowing it in turn increases the amplitude of the RSA and slows the oscillatory rhythm to approximately 0.1 Hz, moving it into the low frequency range when RSA is processed via spectral analysis (Lehrer & Gevirtz, 2014). The respiratory biofeedback portion of this protocol was continued throughout NFB training. Feedback for NFB training was conducted for 20 to 30 minutes using a Procomp Infiniti device (sampling rate 256 Hz), Biograph software, and Neuroguide’s Dynamic Link Library (DLL; Applied Neuroscience Inc.) utilizing a joint time-frequency analysis algorithm, by trained EEG technicians and overseen by Biofeedback Certification International Alliance-certified clinicians. Each participant’s pre-program QEEG assessment was analyzed and visually examined to determine the most appropriate NFB protocol, given the findings unique to each individual. Most participants received 30 sessions of multi-lead z-score NFB at four sites (based on the region of maximal dysfunction in their QEEG assessment, and subject to change at the mid-program assessment if needed), which was performed as described in detail in (Groeneveld et al., 2019). Participants with attenuated alpha amplitudes on their QEEG assessment (n = 3) were given ten sessions of alpha amplitude training intended to increase alpha band power, followed by 20 sessions of multi-lead z-score NFB (as described above).
2.7Follow-up and outcomes
During the active treatment period, participants were encouraged by their brain coach to continue with behavior changes on their own after the completion of the program. After the active treatment period, there was no contact with participants to determine whether, or the extent to which, participants continued with these modified behaviors. Six months after completing the Memory Boot Camp program, participants were invited back for a six-month follow-up assessment (which was identical to the pre- and post- program assessments in format). Seventy percent of participants (31 of 44) completed this assessment. Descriptive statistics are used to compare the follow-up subgroup to the total participants who completed the first three assessments (Table 1); there were no notable discrepancies between the groups.
Table 1
Demographics
| Baseline | Follow-up | ||
| Number of Subjects | 44 | 31 | |
| Sex Female (% (n)) | 79.6% (35) | 83.9% (26) | |
| Age at Baseline (M (SD)) | 70.1 (8.8) | 69.0 (9) | |
| Diabetic (% (n)) | 4.5% (2) | 6.5% (2) | |
| Hypertensive (130/80) (% (n)) | 65.9% (29) | 64.5% (20) | |
| Occasional Tobacco Use (% (n)) | 4.5% (2) | 6.5% (2) | |
| Ethnicity | Ethnicity: Hispanic or Latino/a (% (n)) | 4.6% (2) | 6.5% (2) |
| Race | Race: Black or African (% (n)) | 6.8% (3) | 6.5% (2) |
| Race: Hispanic or Latino/a (% (n)) | 2.3% (1) | 3.2% (1) | |
| Race: White (% (n)) | 90.9% (40) | 90.3% (28) | |
| Years of Education (M (SD)) | 14.8 (2.2) | 14.8 (2.3) | |
| Body Mass Index (M (SD)) | 28.8 (5.8) | 29.7 (5.7) | |
| Center Region | West Michigan (% (n)) | 54.5% (24) | 54.8% (17) |
| Southeast Florida (% (n)) | 45.5% (20) | 45.2% (14) | |
| Self-Reported Medication Use | Anticonvulsants (% (n)) | 6.8% (3) | 6.5% (2) |
| Central Acetylcholinesterase Inhibitors (% (n)) | 4.5% (2) | 0% (0) | |
| Circulatory or Cardiovascular (% (n)) | 54.5% (24) | 51.6% (16) | |
| Psychoactive (% (n)) | 34.1% (15) | 32.3% (10) | |
| Prescription Pain Medication (Excludes NSAIDs) (% (n)) | 6.8% (3) | 9.7% (3) | |
| Other Medications (% (n)) | 38.6% (17) | 35.5% (11) | |
| No Medications (% (n)) | 18.2% (8) | 6.5% (2) |
2.8Blinding
The clinical trial coordinator applied a code, using state names, to each record to blind the data processing researcher and the statistician. Blinding was used for the first three timepoints but was not used for the follow-up records, as these records were identifiable due to change in sample size.
2.9Data analysis
2.9.1HRV data analysis
HRV data files were exported to CardioPro software (version 1.2.1, Thought Technologies) for nor-malization of missed heartbeats and visually in-spected for validity. Data were then exported and processed in Kubios (version 3.2.0; (Tarvainen et al., 2014)). Using Kubios, an artifact-free five-minute segment was selected for analysis, as described in (Williams et al., 2015). This study utilized short-term HRV metrics, for which five-minute recordings are considered appropriate (Shaffer & Ginsberg, 2017; The Task Force Report, 1996). Respiration rate was retrieved from the original Thought Technology HRV files. HRV parameters analyzed included mean heart rate, the power of the following frequency-domain measures: high-frequency, 0.15–0.4 Hz (HF); low-frequency, 0.04–0.15 Hz (LF); and very-low-frequency, 0.016–0.04 Hz (VLF), and the two most common time-domain measures used to calculate HRV: the standard deviation of normal to normal beat intervals (SDNN) and the root mean square of successive normal to normal beat interval differences (RMSSD) (Baevsky & Chernikova, 2017; Laborde et al., 2017; Shaffer & Ginsberg, 2017; The Task Force Report, 1996; van den Berg et al., 2018).
2.9.2QEEG data analysis
All records used in analysis were in the eyes open condition with an average reference montage. Artifact was manually removed from these records by a blinded researcher (blinding was applied for the first three timepoints only; it was necessary to unblind for the fourth timepoint). A minimum of 30 seconds of artifact-free data was required for inclusion of a record in the final analysis; the overall average length of included records was 69 seconds. Assessed across the 4 timepoints were eight z-score measurements, including absolute power and relative power for the frequency bands delta (1–4 Hz), theta (4–8 Hz), beta (12–25 Hz), and high beta (25–30 Hz). The alpha frequency band was not assessed, due to small sample size (fewer than five records per timepoint that met inclusion criteria, outlined below). The data analysis protocol developed by Wigton and Krigbaum (Krigbaum & Wigton, 2015; Wigton & Krigbaum, 2015) was used as the model for our method to determine whether QEEG parameters had changed after treatment in accordance with the specific z-score protocol. Similar to the deviations from Wigton and Krigbaum used in (Groeneveld et al., 2019), the method utilized in the present study separately calculated average |z-score| values for each of the eight listed measurements and used 1.5 as the absolute value threshold for transformed z-scores to identify sites of interest (SOIs). For each site trained for each individual, absolute values of pre-program timepoint z-scores for each of these 8 measurements were used to define SOIs.
2.9.3Statistical analysis
All statistical analyses were performed with SAS® Enterprise Guide, Version 7.1. Copyright, SAS® In-stitute Inc. The graphs were made using Graphpad Prism (Version 8), except for scatter plot graphs, which were made using SAS. Proc Mixed was used to perform a repeated measures analysis for all statistical tests. To account for the variation among the time intervals, the spatial power covariance structure was utilized. The models for the neurocognitive and self-report assessments controlled for covariates gender, age, and the interaction between gender and age. The models for the HRV measurements all controlled for respiration rate, age, gender, and the interaction between age and gender. Backward selection was used to drop or keep covariates. Although respiration rate was a significant predictor for only heart rate, respiration rate was kept in the model due to its inherent relation to HRV. Respiration rate was not used in the model predicting respiration rate. To satisfy repeated measures assumptions including normality, the natural log transformation was used on SDNN, RMSSD, VLF power, LF power, and HF power. The models for QEEG did not control for covariates as sample sizes were not large enough to support a model with multiple parameters. For absolute power of delta, within the QEEG analysis, empty cells within the R correlation matrix were present, in this instance, the ANTE(1) covariance structure was used to correct this. Post-hoc analyses were performed to compare the least squares mean (LS mean) changes from timepoints. The resultant p-values were compared to appropriate Bonferroni-corrected significance levels for four multiple comparisons (αB = 0.0125. After re-viewing results, an unplanned exploratory analysis was conducted to assess the relationship among pre- to post-changes in MoCA with the pre- to post-changes in the HRV parameters and QEEG parameters. A scatter plot with jitter was created for each association. To aid in the visualization of the relationship, a 90% prediction ellipse was applied to each scatter plot.
3Results
3.1Improvement in score for most neurocognitive and self-report measures over treatment period
Three months before the start of the Memory Boot Camp intervention, participants took all neurocognitive and self-report measures for the first time (baseline assessment). Participants took each measure again at pre-program, post-program, and follow-up assessment timepoints. These study measures included the MoCA (the primary outcome measure for this study), NeuroTrax, BAI, BDI-ii, ESS, ISI, PSQI, and WSAS. Statistical models were significant for the effect of time on score for all eight of these measures (p≤0.0013). This suggests the measurements changed across the different periods (control, treatment, and follow-up). Pairwise LS mean change values for these measures are shown in Table 2, and LS mean values for each timepoint are shown in Fig. 3 along with p-values for LS mean change between the relevant timepoints. For the MoCA, both the baseline and pre-program score LS mean values were within the “Mild Cognitive Impairment” range (Fig. 3). Baseline LS mean values for the BAI were within the “mild anxiety” range, those for the ESS were within the “higher normal daytime sleepiness” range, and those for the PSQI were within the “poor sleep quality” range. Baseline LS mean values for all other neurocognitive and self-report measures were within normal/subclinical ranges.
Table 2
LS Mean Changes for Neurocognitive and Self-Report Measures throughout the Study
| Measure | Comparison | n | LS Mean Change | 95% CI LL | 95% CI UL | t | dz | p |
| MoCA | Baseline to Pre | 44 | 0.39 | –0.31 | 1.09 | 1.09 | . | 0.2761 |
| Pre to Post | 44 | 1.57 | 0.87 | 2.27 | 4.44 | 0.67 | <.0001* | |
| Post to Follow-up | 31 | 0.55 | –0.47 | 1.58 | 1.07 | . | 0.2872 | |
| Pre to Follow-up | 31 | 2.12 | 1.00 | 3.24 | 3.76 | 0.67 | 0.0003* | |
| Neurotrax | Baseline to Pre | 41 | 2.89 | 1.42 | 4.37 | 3.88 | 0.61 | 0.0002* |
| GCS | Pre to Post | 40 | 1.49 | 0.00 | 2.98 | 1.99 | 0.31 | 0.0493 |
| Post to Follow-up | 30 | 2.53 | 0.21 | 4.85 | 2.16 | 0.39 | 0.0327 | |
| Pre to Follow-up | 29 | 4.03 | 1.39 | 6.66 | 3.03 | 0.56 | 0.0031* | |
| BAI | Baseline to Pre | 42 | –0.72 | –2.30 | 0.85 | –0.91 | . | 0.3630 |
| Pre to Post | 44 | –3.11 | –4.66 | –1.57 | –4.00 | –0.6 | 0.0001* | |
| Post to Follow-up | 31 | –0.07 | –2.33 | 2.18 | –0.06 | . | 0.9490 | |
| Pre to Follow-up | 31 | –3.19 | –5.65 | –0.73 | –2.57 | –0.46 | 0.0116* | |
| BDI-ii | Baseline to Pre | 42 | 0.16 | –1.29 | 1.60 | 0.22 | . | 0.8290 |
| Pre to Post | 44 | –4.64 | –6.06 | –3.22 | –6.47 | –0.98 | <.0001* | |
| Post to Follow-up | 31 | 0.81 | –1.20 | 2.82 | 0.80 | . | 0.4276 | |
| Pre to Follow-up | 31 | –3.83 | –5.99 | –1.66 | –3.50 | –0.63 | 0.0007* | |
| ESS | Baseline to Pre | 42 | 0.17 | –0.67 | 1.00 | 0.39 | . | 0.6959 |
| Pre to Post | 44 | –1.64 | –2.46 | –0.81 | –3.94 | –0.59 | 0.0001* | |
| Post to Follow-up | 31 | –0.16 | –1.37 | 1.06 | –0.25 | . | 0.7992 | |
| Pre to Follow-up | 31 | –1.79 | –3.12 | –0.46 | –2.67 | –0.48 | 0.0086* | |
| ISI | Baseline to Pre | 42 | –0.13 | –1.25 | 1.00 | –0.22 | . | 0.8228 |
| Pre to Post | 44 | –3.07 | –4.17 | –1.97 | –5.52 | –0.83 | <.0001* | |
| Post to Follow-up | 31 | –0.38 | –1.99 | 1.23 | –0.47 | . | 0.6422 | |
| Pre to Follow-up | 31 | –3.45 | –5.20 | –1.69 | –3.89 | –0.7 | 0.0002* | |
| PSQI | Baseline to Pre | 42 | –0.11 | –1.05 | 0.83 | –0.23 | . | 0.8190 |
| Pre to Post | 44 | –1.93 | –2.85 | –1.01 | –4.16 | –0.63 | <.0001* | |
| Post to Follow-up | 31 | 0.26 | –1.03 | 1.56 | 0.40 | . | 0.6886 | |
| Pre to Follow-up | 31 | –1.67 | –3.06 | –0.28 | –2.37 | –0.43 | 0.0193 | |
| WSAS | Baseline to Pre | 42 | 0.47 | –0.47 | 1.42 | 0.99 | . | 0.3239 |
| Pre to Post | 44 | –3.02 | –3.95 | –2.09 | –6.45 | –0.97 | <.0001* | |
| Post to Follow-up | 31 | –0.43 | –1.81 | 0.95 | –0.62 | . | 0.5387 | |
| Pre to Follow-up | 31 | –3.45 | –4.97 | –1.93 | –4.50 | –0.81 | <.0001* |
MoCA: Montreal Cognitive Assessment; NeuroTrax GCS: Global Cognitive Score; BAI: Beck Anxiety Inventory; BDI-ii: Beck Depression Inventory-II; ESS: Epworth Sleepiness Scale; ISI: Insomnia Severity Index; PSQI: Pittsburgh Sleep Quality Index; WSAS: Work and Social Adjustment Scale; LS Mean: pairwise least squares mean change values; 95% CI LL: 95% confidence interval lower limit; 95% CI UL: 95% confidence interval upper limit; dz: Cohen’s d for effect size of paired differences; t: test statistic; p: p-value for post-hoc pairwise comparisons. *Bonferroni-corrected significance level αB = 0.0125.
Fig. 3
Change in Neurocognitive and Self-Report Measures across Timepoints. LS mean values for neurocognitive and self-report questionnaire scores at each timepoint: -3 months (baseline assessment), 0 months (pre-treatment assessment), 3 months (post-treatment assessment) and 9 months (follow-up assessment). Pairwise LS mean change values between timepoints are summarized in the top of each graph (values from Table 2). For all neurocognitive and self-report measures except for the NeuroTrax, there was a score change observed after the active treatment period (gray shading) in a direction indicating improvement. Error bars represent the standard error. MoCA: Montreal Cognitive Assessment; NeuroTrax GCS: Global Cognitive Score; BAI: Beck Anxiety Inventory; BDI-ii: Beck Depression Inventory-II; ESS: Epworth Sleepiness Scale; ISI: Insomnia Severity Index; PSQI: Pittsburgh Sleep Quality Index; WSAS: Work and Social Adjustment Scale. ns: p > 0.0125, change not significant at the Bonferroni-corrected significance level. * p≤0.0125. ** p≤0.008. *** p≤0.001. **** p≤0.0001.
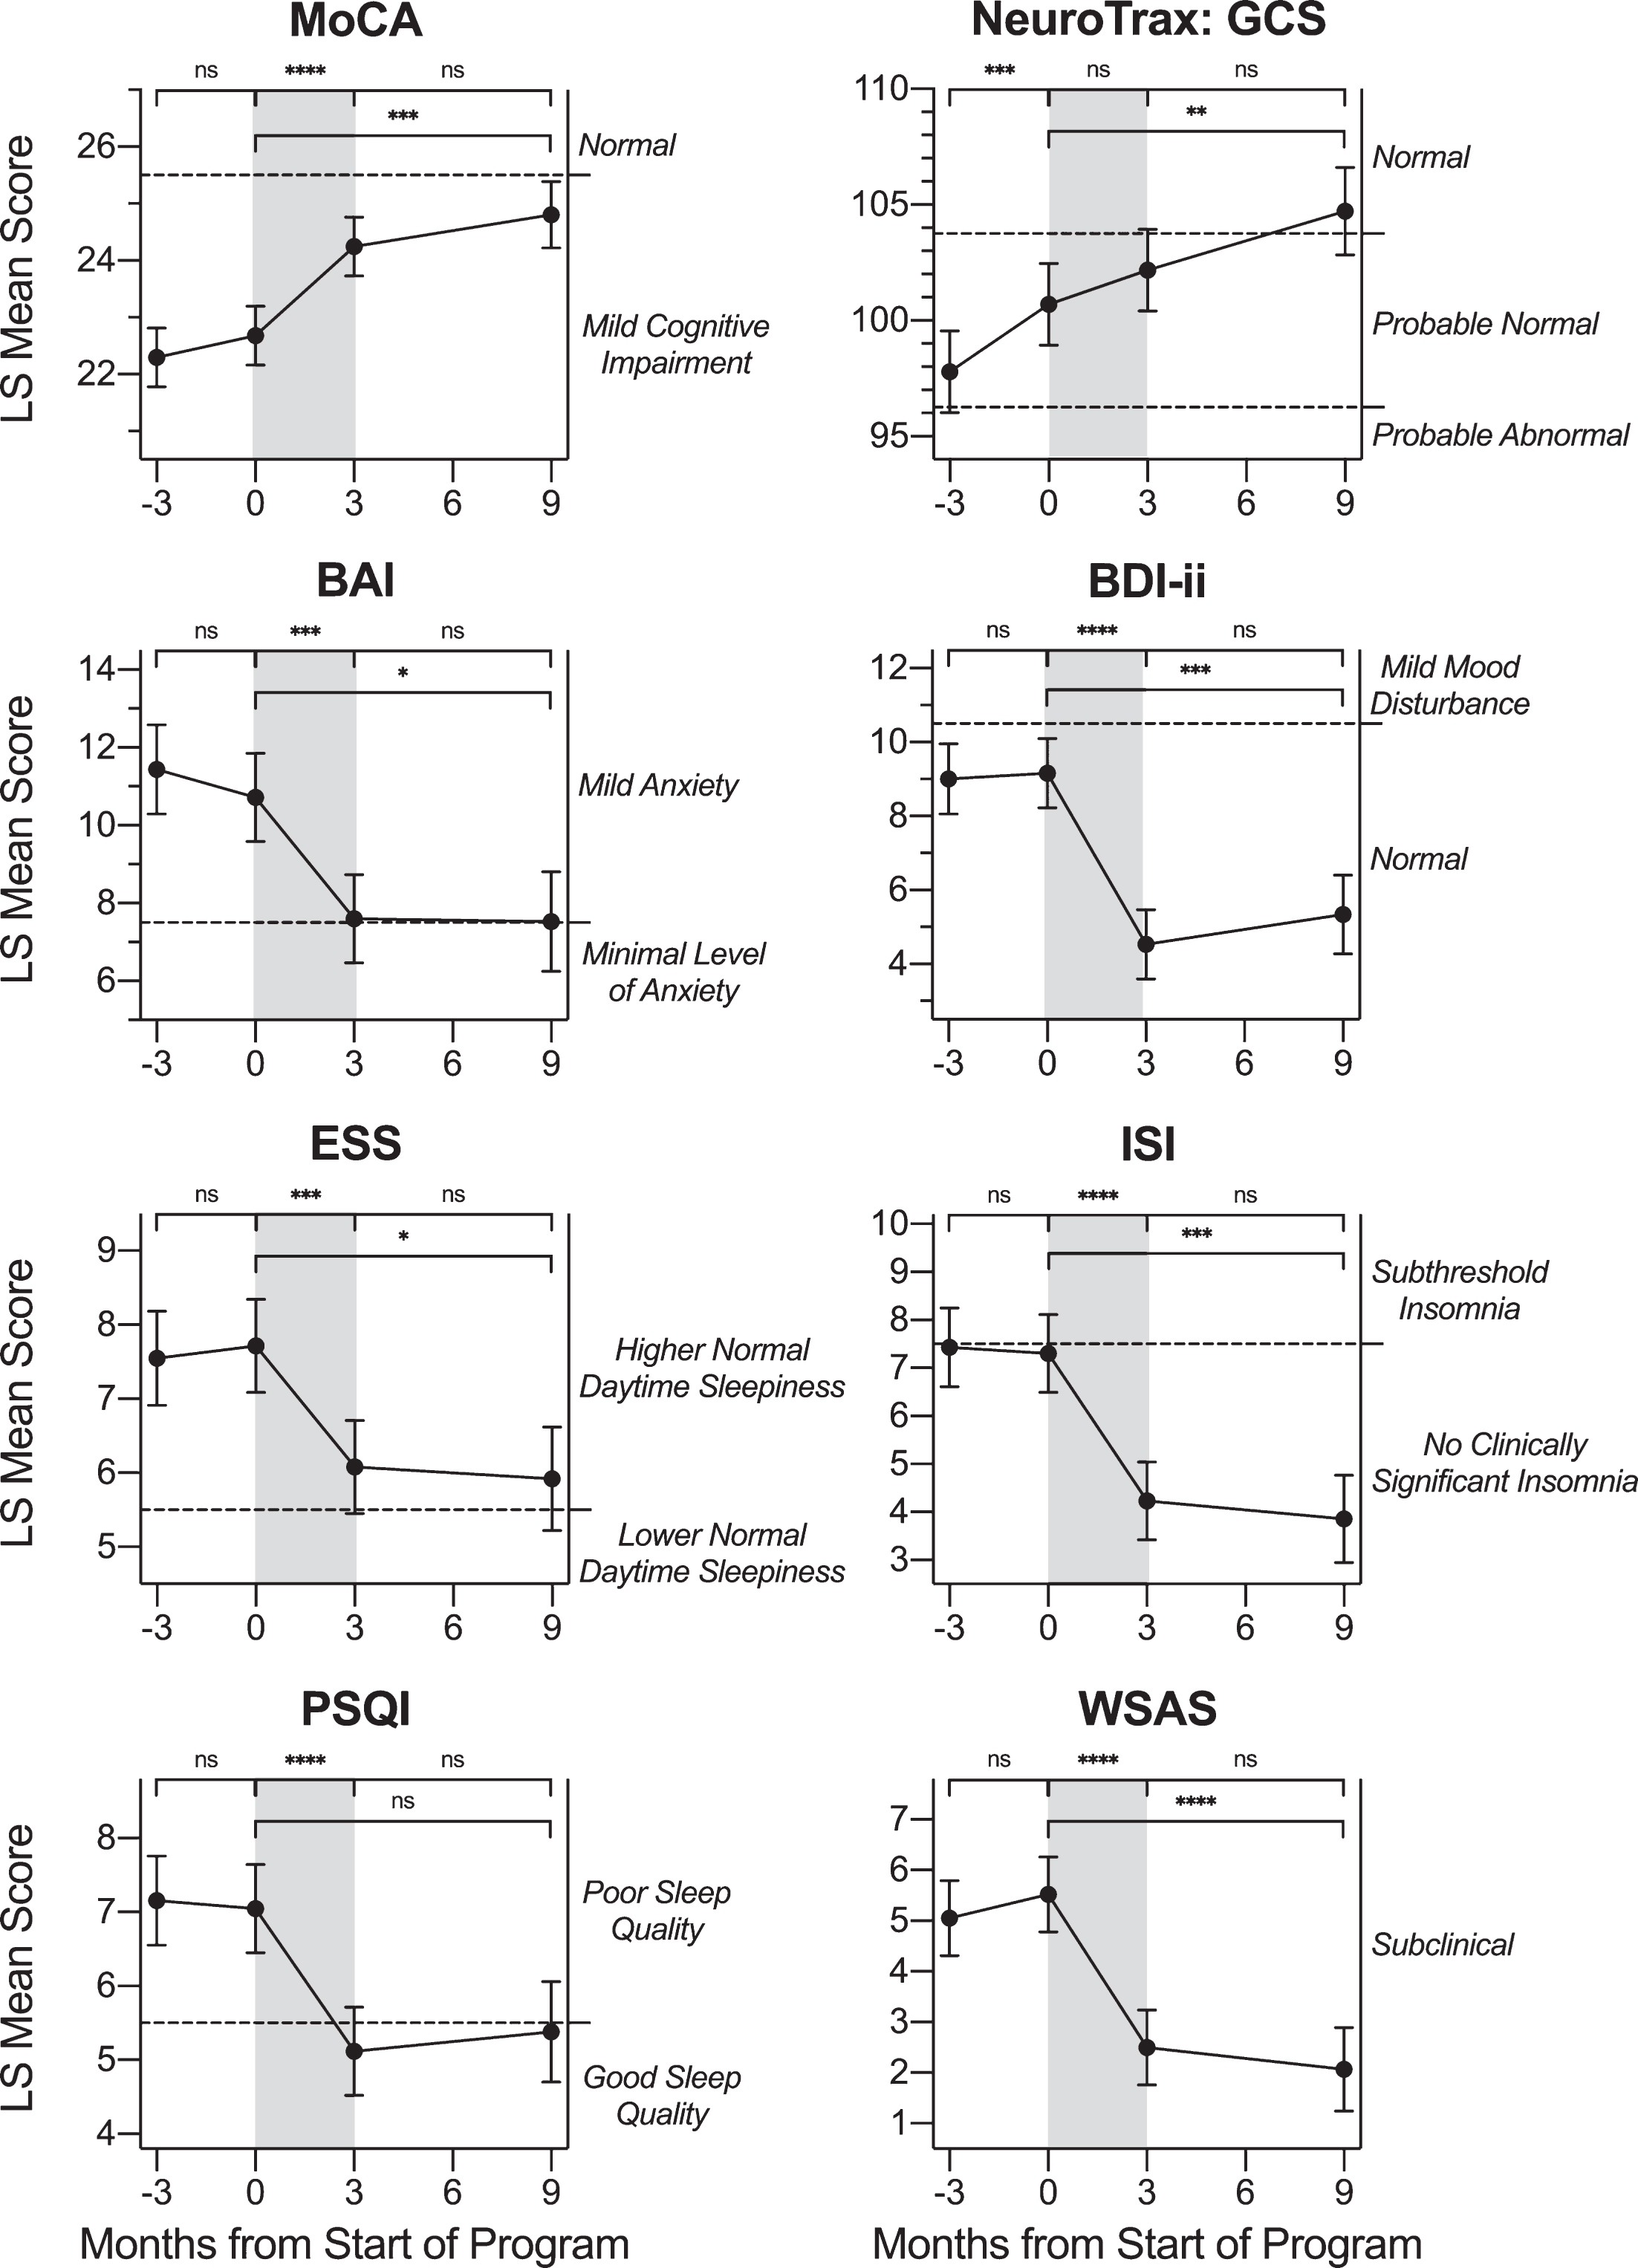
There was no evidence to support a change in MoCA score during the control waiting period (p = 0.2761; Table 2). Further, there was no evidence to support a change in score for any other neuroco-gnitive or self-report measure during the waiting period (p≥0.276) except for the NeuroTrax, for which the LS mean increased (improved) from 97.79 to 100.69, for an LS mean change of 2.89 points (p = 0.0002). For the NeuroTrax, both the baseline and pre-program score LS mean values were within the “Probable Normal” range. For the treatment per-iod from pre- to post-program, LS mean values on the MoCA increased (improved) from 22.68 to 24.25, for an LS mean change value of 1.57 points (p < 0.0001; dz = 0.67). Participants also experienced improvement in score on the BAI over the treatment period (p = 0.0001; dz = –0.60), with the pre- and post-treatment LS mean scores both within the “mild anxiety” range. On the BDI-ii depression measure, participants experienced improvement in score over the treatment period (p < 0.0001; dz = –0.98), with the pre- and post-treatment LS mean scores both within the “normal” range. On all three measures of sleep, the ESS, ISI, and PSQI, participants experienced improvement in score (p≤0.0001; dz≤–0.59) over the treatment period. On the WSAS measure of degree of functional impairment due to memory concerns, participants experienced an improvement in score over the treatment period (p < 0.0001; dz =–0.97), with pre- and post-treatment LS mean scores both within the “subclinical” range. There was not statistically significant evidence to support a change in NeuroTrax score (p = 0.0493) over the treatment period after Bonferroni correction for multiple testing.
For all tested neurocognitive and self-report measures, LS mean change values during the six-month follow-up period after the conclusion of treatment were not significant. For the MoCA, BAI, BDI-ii, ESS, ISI, PSQI, and WSAS, p≥0.2872 for the follow-up period. For the NeuroTrax, the LS mean change value for the follow-up period was not significant after Bonferroni correction (p = 0.0327). Although there was no significant change in NeuroTrax score during the treatment period or follow-up period, both periods showed a trend in the positive direction (improvement). Likewise, there was a significant increase in NeuroTrax score between pre-treatment and 6-month follow-up, indicating, perhaps, that the cumulative increase over this longer time period represented a meaningful improvement in the Global Cognitive Score.
3.2HRV parameters and respiration rate
In order to produce approximately normal distributions, SDNN, RMSSD, VLF power, LF power, and HF power were transformed to natural log values for statistical analysis. Statistical models were significant for the effect of time on the HRV parameters ln(SDNN) (p = 0.0031), ln(RMSSD) (p = 0.0018), and for respiration rate (p < 0.0001), but not for heart rate (p = 0.0140), ln(VLF power) (p = 0.1199), ln(LF power) (p = 0.0250), or ln(HF power) (p = 0.0111) after Bonferroni correction for multiple testing (αB = 0.0071). For HF, SDNN, and RMSSD, a higher value is considered an improvement (Baevsky & Chernikova, 2017). Pairwise LS mean change comparisons were calculated for HRV parameters and respiration rate between the four assessment timepoints of this study (Table 3). LS mean values at each timepoint are graphed in Fig. 4, with significant LS mean changes indicated.
Table 3
LS Mean Changes for HRV and Physiological Parameters
| Measure | Comparison | n | LS Mean Change | 95% CI LL | 95% CI UL | t | dz | p |
| Mean Heart Rate | Baseline to Pre | 32 | –3.44 | –6.32 | –0.56 | –2.38 | –0.42 | 0.0198 |
| (beats/min) | Pre to Post | 27 | –2.73 | –6.02 | 0.56 | –1.65 | . | 0.1027 |
| Post to Follow-up | 17 | 3.23 | –1.50 | 7.97 | 1.36 | . | 0.1781 | |
| Pre to Follow-up | 17 | 0.50 | –4.86 | 5.87 | 0.19 | . | 0.8520 | |
| Respiration Rate | Baseline to Pre | 35 | 0.21 | –0.73 | 1.14 | 0.43 | . | 0.6650 |
| (breaths/min) | Pre to Post | 32 | –2.19 | –3.15 | –1.22 | –4.48 | –0.79 | <.0001* |
| Post to Follow-up | 25 | –1.06 | –2.34 | 0.22 | –1.64 | . | 0.1040 | |
| Pre to Follow-up | 24 | –3.24 | –4.60 | –1.89 | –4.76 | –0.97 | <.0001* | |
| ln(SDNN) | Baseline to Pre | 32 | 0.31 | 0.08 | 0.54 | 2.67 | 0.47 | 0.0092* |
| Pre to Post | 27 | 0.14 | –0.12 | 0.40 | 1.09 | . | 0.2781 | |
| Post to Follow-up | 17 | 0.14 | –0.20 | 0.47 | 0.80 | . | 0.4234 | |
| Pre to Follow-up | 17 | 0.28 | –0.09 | 0.64 | 1.50 | . | 0.1381 | |
| ln(RMSSD) | Baseline to Pre | 32 | 0.38 | 0.11 | 0.65 | 2.77 | 0.49 | 0.0069* |
| Pre to Post | 27 | 0.18 | –0.13 | 0.49 | 1.16 | . | 0.2490 | |
| Post to Follow-up | 17 | 0.16 | –0.23 | 0.56 | 0.83 | . | 0.4109 | |
| Pre to Follow-up | 17 | 0.34 | –0.09 | 0.78 | 1.57 | . | 0.1203 | |
| ln(VLF Power) | Baseline to Pre | 32 | 0.20 | –0.32 | 0.72 | 0.75 | . | 0.4527 |
| Pre to Post | 27 | 0.22 | –0.35 | 0.79 | 0.78 | . | 0.4399 | |
| Post to Follow-up | 17 | 0.39 | –0.27 | 1.04 | 1.18 | . | 0.2433 | |
| Pre to Follow-up | 17 | 0.61 | –0.09 | 1.31 | 1.74 | . | 0.0858 | |
| ln(LF Power) | Baseline to Pre | 32 | 0.26 | –0.19 | 0.72 | 1.14 | . | 0.2570 |
| Pre to Post | 27 | 0.39 | –0.12 | 0.89 | 1.53 | . | 0.1298 | |
| Post to Follow-up | 17 | 0.35 | –0.29 | 0.99 | 1.08 | . | 0.2831 | |
| Pre to Follow-up | 17 | 0.74 | 0.04 | 1.43 | 2.10 | 0.51 | 0.0387 | |
| ln(HF Power) | Baseline to Pre | 32 | 0.69 | 0.16 | 1.21 | 2.59 | 0.46 | 0.0114* |
| Pre to Post | 27 | 0.23 | –0.36 | 0.82 | 0.78 | . | 0.4355 | |
| Post to Follow-up | 17 | 0.25 | –0.53 | 1.03 | 0.63 | . | 0.5285 | |
| Pre to Follow-up | 17 | 0.48 | –0.38 | 1.34 | 1.11 | . | 0.2691 |
SDNN: standard deviation normal to normal beat intervals; RMSSD: root mean square of successive normal to normal beat interval differences; LS Mean: pairwise least squares mean change values; 95% CI LL: 95% confidence interval lower limit; 95% CI UL: 95% confidence interval upper limit; dz: Cohen’s d for effect size of paired differences; t: test statistic; p: p-value for post-hoc pairwise comparisons. *Bonferroni-corrected significance level αB = 0.0125.
Fig. 4
Change in HRV Physiological Measures across Timepoints. LS mean values for HRV parameters and breathing rate at each timepoint: -3 months (baseline assessment), 0 months (pre-treatment assessment), 3 months (post-treatment assessment) and 9 months (follow-up assessment). Pairwise LS mean change values between timepoints are summarized in the top of each graph (values from Table 3). Respiration rate decreased during the active treatment period (gray shading). Ln(SDNN), ln(RMSSD), and ln(HF) LS mean values increased over the control waiting period. Although not specifically labeled, there was no change over the waiting period for ln(VLF) or ln(LF). Error bars represent the standard error. VLF: power in the very low frequency domain; LF: power in the low frequency domain; HF: power in the high frequency domain. SDNN: standard deviation normal to normal beat intervals; RMSSD: root mean square of successive normal to normal beat interval differences. aThese LS mean values have been back-transformed from the natural log values displayed in the top graph. Error bars are not included because they are not appropriate for back-transformed data. Significance markers are not included on back-transformed data graphs because they appear on the ln-transformed graphs. ns: p > 0.0125, change not significant at the Bonferroni-corrected significance level. * p≤0.0125. **** p≤0.0001.
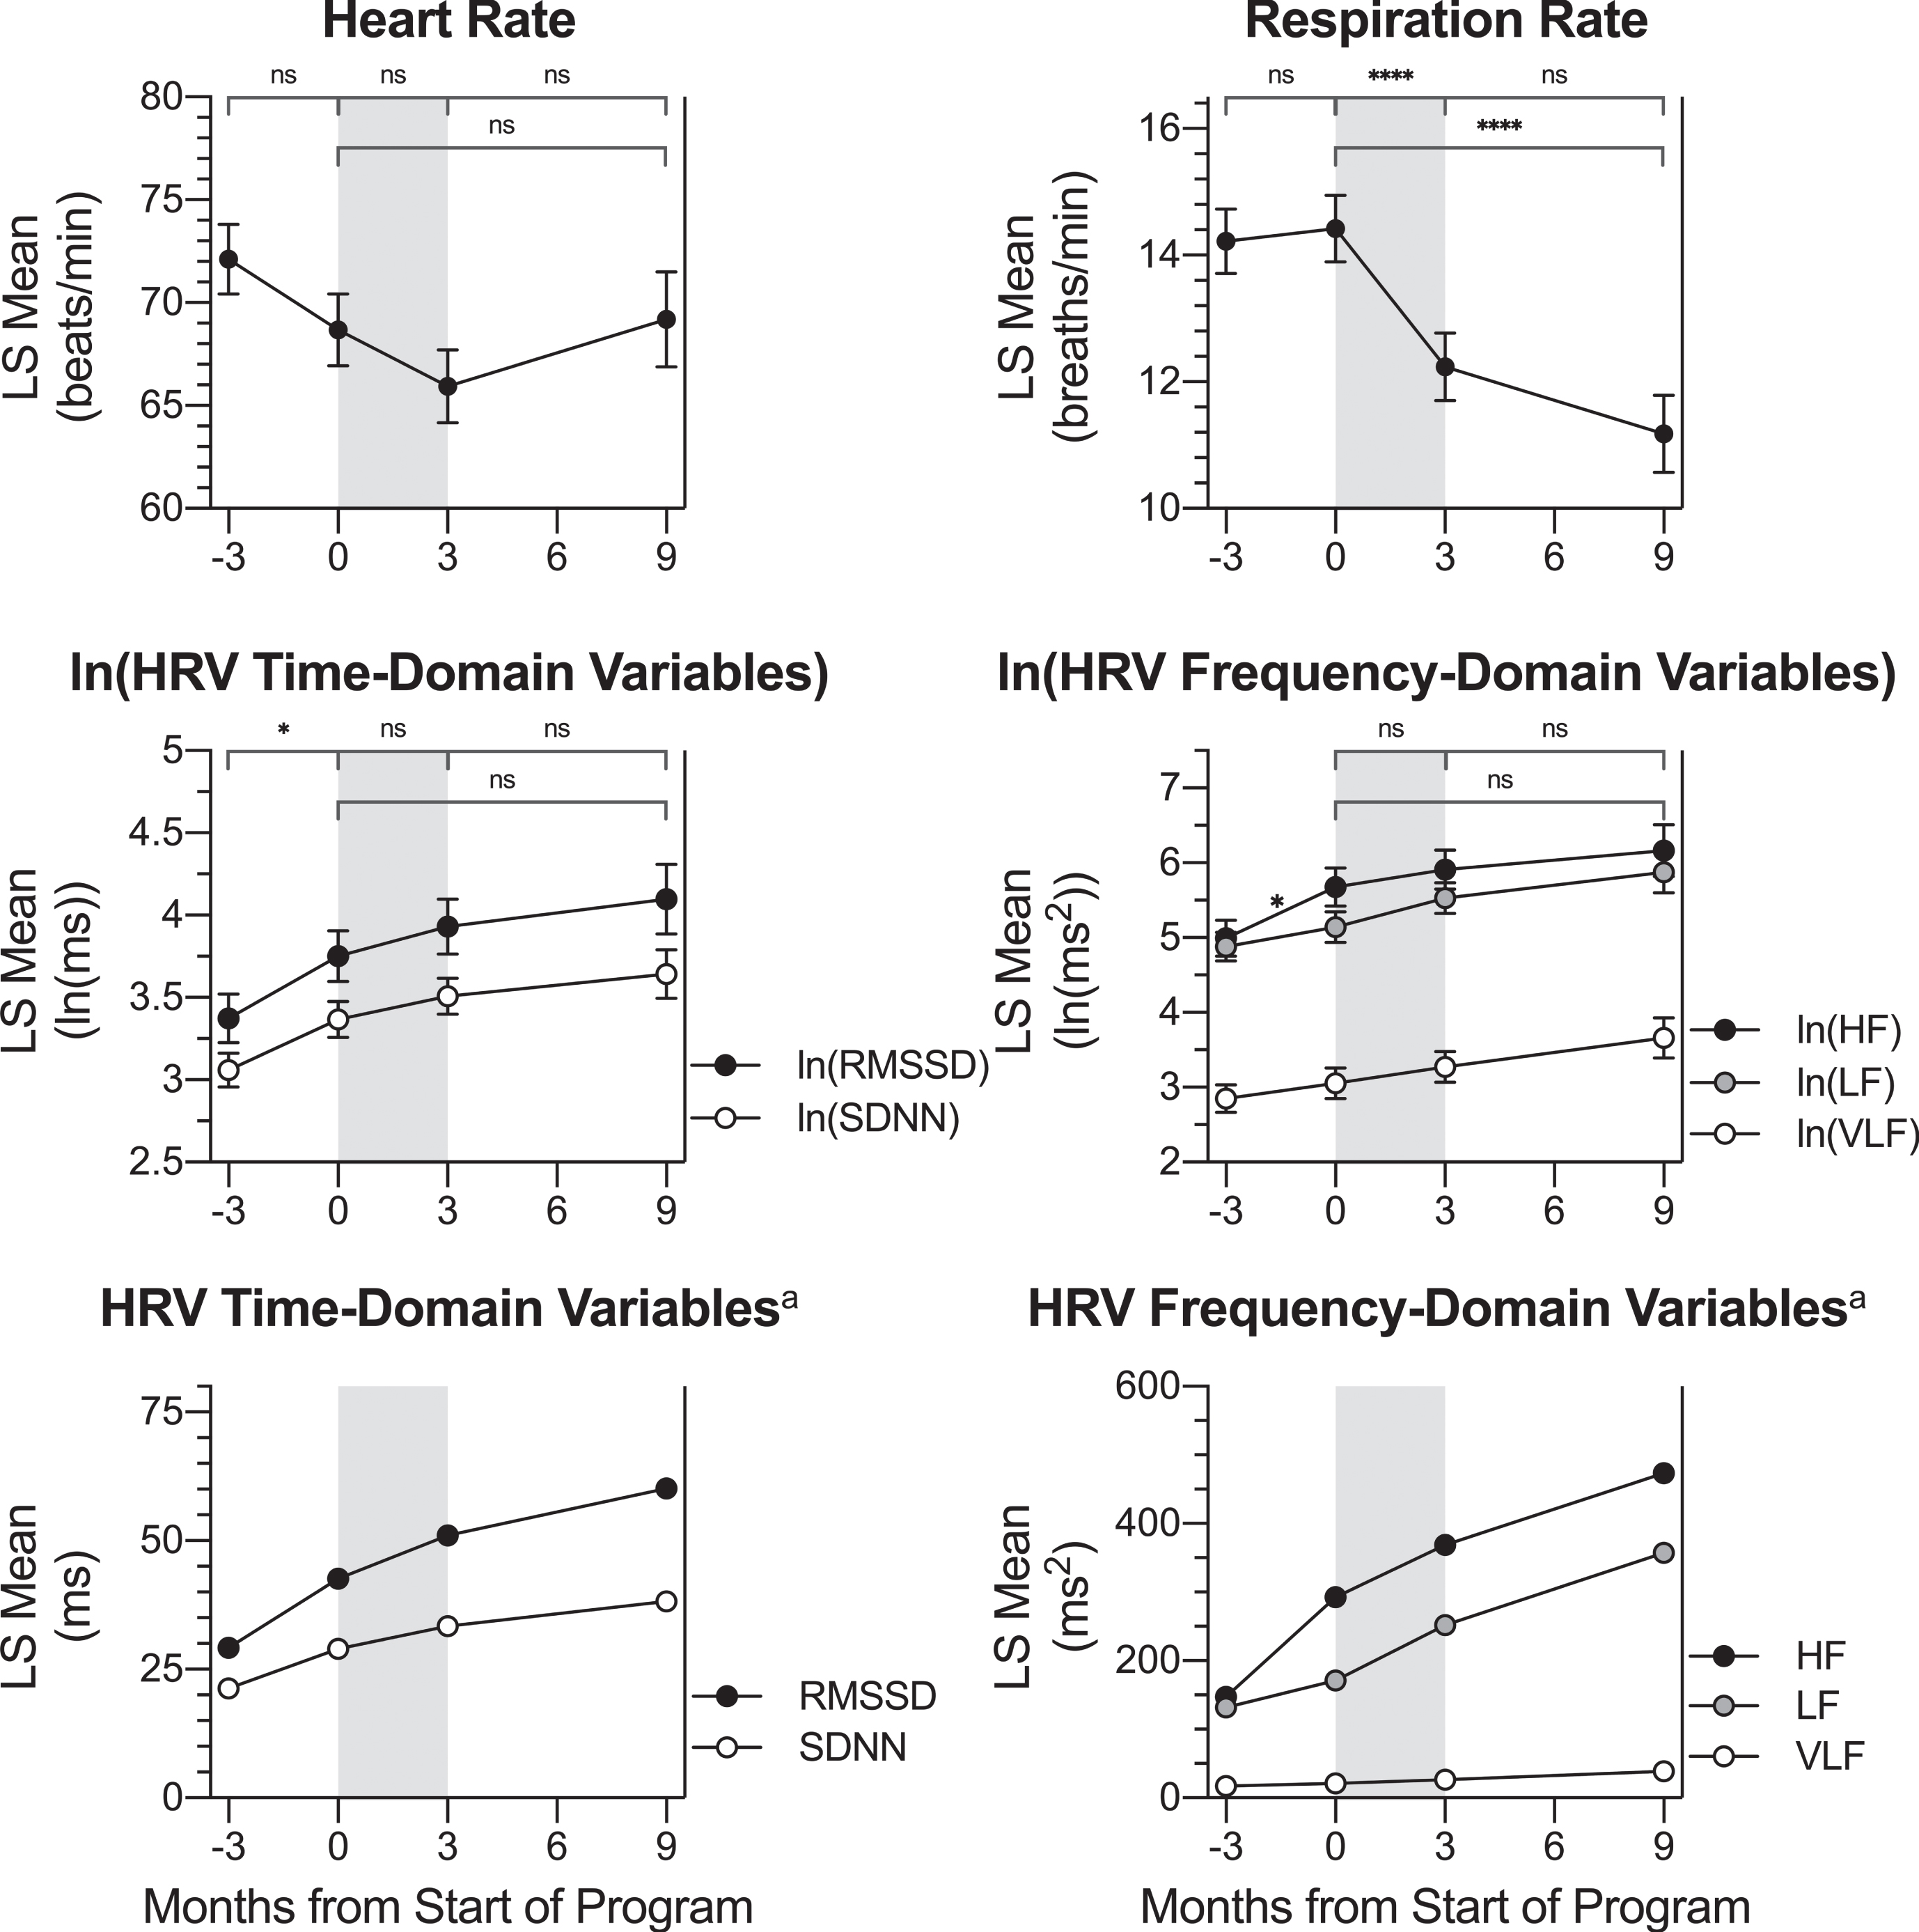
Over the control period, there was a significant LS mean increase for ln(HF Power), ln(SDNN), and ln(RMSSD). After back-transforming from natural log, HF power increased from a baseline value of 147.19 ms2 to 292.56 ms2 at the pre-program timepoint. SDNN increased from a baseline value of 21.31 ms to 28.99 ms at the pre-program timepoint, and RMSSD increased from a baseline value of 29.15 ms to 42.63 ms at the pre-program timepoint. Nunan and colleagues (Nunan et al., 2010) have suggested that a normal range for SDNN is between 32 and 93 ms, while the normal range for RMSSD is between 19 and 75 ms. Therefore, SDNN values for participants in the present study were diminished at both the baseline and pre-treatment timepoints; RMSSD values were consistent with the normal range at those timepoints. There was no significant change over the treatment period or follow-up period for ln(HF power), ln(SDNN), or ln(RMSSD). Although there was no significant change, SDNN mean values were within the normal range at post-treatment (33.35 ms) and at 6-month follow-up (38.19 ms).
There was no evidence to support a change in respiration rate during either the waiting period or the follow-up period; however, over the treatment period, LS mean breaths per minute decreased from 14.42 to 12.24, for an LS mean change value of –2.19 breaths per minute (p < 0.0001; dz = –1.79). A decrease in respiration rate after the Memory Boot Camp program would be expected in accordance with the HRV biofeedback protocol utilized, which rewarded a rate of 6–8 breaths/minute. There was no evidence to support a change in mean heart rate, ln(VLF power), or ln(LF power) over any period analyzed in the study.
3.3QEEG parameters
All participants in this study received at least 20 sessions of z-score NFB, the goal of which is to sim-ultaneously train 248 different QEEG metrics toward their mean value (based on each participants’ age-matched normal distribution) (Collura et al., 2010; Thatcher & Lubar, 2009). During each z-score NFB session, the only QEEG metrics trained are those that diverge from the normative mean by a quantity greater than the z-score threshold set by the technician. In effective z-score NFB, therefore, one would expect that all of a participant’s QEEG metrics that diverged beyond this threshold from the normative mean before training would be significantly closer to the mean after training (approaching z = 0).
For the present study, data analysis was performed on within-subject change in QEEG parameters col-lected during the eyes open full-cap QEEG assessments. The parameters absolute power and relative power for the frequency bands delta, theta, beta, and high beta were compared between the four timepoints already described: baseline, pre-program, post-program, and follow-up. Because the z-score NFB protocol only trains QEEG metrics that are divergent from the mean, not all participants would be expected to receive z-score training for all eight of these QEEG metrics. Using our previously published statistical analysis protocol (Groeneveld et al., 2019), based on (Krigbaum & Wigton, 2015; Wigton & Krigbaum, 2015), a participant’s data for a particular metric were considered if the pre-program QEEG |z-score| was ≥1.5 at a trained site (an SOI, see Methods). For alpha frequency bands, statistical analysis was not possible because the number of participants with SOIs of |z-score|≥1.5 at trained sites was fewer than five. Data for the remaining eight parameter/frequency band combinations are shown in Table 4, and LS mean values at each timepoint are graphed in Fig. 5, with significant LS mean changes indicated.
Table 4
LS Mean Changes in |z-score| QEEG Parameters for Averaged SOIs at Sites Trained
| QEEG Parameter: Frequency Band | Comparison | n | LS Mean Change | 95% CI LL | 95% CI UL | t | dz | p |
| Absolute Power: Delta | Baseline to Pre | 11 | 0.27 | 0.03 | 0.52 | 2.27 | 0.69 | 0.0315 |
| Pre to Post | 11 | –0.61 | –0.95 | –0.28 | –3.80 | –1.15 | 0.0008* | |
| Post to Follow-up | 7 | –0.11 | –0.55 | 0.33 | –0.51 | . | 0.6129 | |
| Pre to Follow-up | 7 | –0.73 | –1.32 | –0.13 | –2.49 | –0.94 | 0.0196 | |
| Relative Power: Delta | Baseline to Pre | 12 | 0.29 | –0.13 | 0.72 | 1.42 | . | 0.1681 |
| Pre to Post | 10 | –0.51 | –0.96 | –0.06 | –2.33 | –0.74 | 0.0281 | |
| Post to Follow-up | 5 | –0.22 | –0.83 | 0.39 | –0.75 | . | 0.4625 | |
| Pre to Follow-up | 6 | –0.73 | –1.32 | –0.15 | –2.58 | –1.06 | 0.0160 | |
| Absolute Power: Theta | Baseline to Pre | 6 | 0.53 | –0.07 | 1.13 | 1.87 | . | 0.0811 |
| Pre to Post | 7 | –1.01 | –1.58 | –0.44 | –3.78 | –1.43 | 0.0018* | |
| Post to Follow-up | 5 | 0.01 | –0.76 | 0.78 | 0.02 | . | 0.9812 | |
| Pre to Follow-up | 5 | –1.00 | –1.81 | –0.19 | –2.64 | –1.18 | 0.0185 | |
| Relative Power: Theta | Baseline to Pre | 18 | 0.15 | –0.19 | 0.49 | 0.90 | . | 0.3712 |
| Pre to Post | 16 | –0.68 | –1.03 | –0.33 | –3.87 | –0.97 | 0.0004* | |
| Post to Follow-up | 10 | 0.00 | –0.49 | 0.49 | 0.00 | . | 0.9968 | |
| Pre to Follow-up | 12 | –0.68 | –1.17 | –0.18 | –2.76 | –0.80 | 0.0085* | |
| Absolute Power: Beta | Baseline to Pre | 14 | 0.27 | 0.03 | 0.52 | 2.27 | 0.61 | 0.0293 |
| Pre to Post | 13 | –0.56 | –0.81 | –0.31 | –4.51 | –1.25 | <.0001* | |
| Post to Follow-up | 9 | –0.02 | –0.38 | 0.35 | –0.10 | . | 0.9228 | |
| Pre to Follow-up | 10 | –0.58 | –0.96 | –0.19 | –3.03 | –0.96 | 0.0047* | |
| Relative Power: Beta | Baseline to Pre | 16 | 0.06 | –0.10 | 0.21 | 0.73 | . | 0.4699 |
| Pre to Post | 12 | –0.10 | –0.27 | 0.08 | –1.14 | . | 0.2619 | |
| Post to Follow-up | 9 | –0.21 | –0.44 | 0.02 | –1.83 | . | 0.0748 | |
| Pre to Follow-up | 11 | –0.31 | –0.54 | –0.08 | –2.69 | –0.81 | 0.0108* | |
| Absolute Power: High Beta | Baseline to Pre | 12 | 0.14 | –0.36 | 0.64 | 0.56 | . | 0.5770 |
| Pre to Post | 12 | –0.66 | –1.17 | –0.16 | –2.69 | –0.78 | 0.0116* | |
| Post to Follow-up | 7 | –0.09 | –0.77 | 0.59 | –0.28 | . | 0.7835 | |
| Pre to Follow-up | 9 | –0.76 | –1.43 | –0.08 | –2.27 | –0.76 | 0.0303 | |
| Relative Power: High Beta | Baseline to Pre | 5 | 0.05 | –0.42 | 0.53 | 0.25 | . | 0.8077 |
| Pre to Post | 7 | –0.56 | –0.97 | –0.15 | –2.90 | –1.09 | 0.0111* | |
| Post to Follow-up | 5 | –0.21 | –0.75 | 0.34 | –0.81 | . | 0.4318 | |
| Pre to Follow-up | 6 | –0.77 | –1.32 | –0.21 | –2.93 | –1.20 | 0.0104* |
SOI: sites of interest (within each metric for each frequency band, |z-score| of baseline values that are farther than 1.5 standard deviations from zero for the sites trained, selected at pre-treatment timepoint); n: number of participants who had at least one SOI for the given frequency band/parameter; LS Mean: pairwise least squares mean change values in average distance from zero for SOIs; 95% CI LL: 95% confidence interval lower limit; 95% CI UL: 95% confidence interval upper limit; dz: Cohen’s d for effect size of paired differences; t: test statistic; p: p-value for post-hoc pairwise comparisons. *Bonferroni-corrected significance level αB = 0.0125.
With the exception of relative power of beta (p =0.0826), the effect of time on all QEEG parameters considered was significant at the α= 0.05 level. Post-hoc analyses were performed on all eight measures for investigational purposes. For all eight QEEG parameters examined, there was a trend toward the normative mean (decrease in |z-score|) over the treatment period. For six out of these eight parameters: absolute power of delta, absolute power of theta, relative power of theta, absolute power of beta, absolute power of high beta, and relative po-wer of high beta, there was a significant decrease (improvement) in |z-score| after the treatment period at the Bonferroni-corrected significance level of αB = 0.0125. Effect sizes were medium to large for all of these LS mean changes. There was no evidence to support an LS mean change over the follow-up period. These results are consistent with effective z-score NFB training of participants’ brain oscillation parameters that was maintained at least six months after the conclusion of treatment.
Although not significant for any parameter at the Bonferroni-adjusted level, there was a trend for LS mean increase in |z-score| over the control period for all QEEG parameters examined. Despite the lack of statistical significance, this could represent an actual small increase in |z-score| from the baseline to pre-program timepoint, or it could indicate regression to the mean due to the data analysis protocol. The authors acknowledge that by selecting the sites and parameters for which absolute z-score values are larger than 1.5 at a single timepoint (the pre-program timepoint), the data analysis will inherently capture any regression to the mean at other timepoints. The fact that none of these changes are significant and that the slope gradients differ between the control and treatment time periods suggest that the changes in |z-score| over the treatment period were greater than any regression to the mean. In further support of this, all |effect sizes| for the control periods, which range from |dz| = 0.11 to 0.76; mean = 0.39, are smaller than (<60% of) the effect sizes for the corresponding treatment periods.
3.4Correlation between change in MoCA score and physiological metrics
As an exploratory analysis, we determined the association between participants’ change in MoCA score over the treatment period (the primary outcome measure) and the change in their physiological HRV and QEEG metrics over the same period. Due to the exploratory nature of this analysis, clinical significance was set at |r| ≥ 0.5. To determine these changes over the treatment period, each participant’s value at pre-treatment was subtracted from their value at post-treatment. Data points for change on the MoCA versus each physiological metric are graphed in Fig. 6 along with 90% prediction ellipses to assist with visualization. Data points that demonstrate improvement are in black, and those with no change or decline are in gray. As an example, a representative participant in the present study had a MoCA score of 24 at pre-treatment and 26 at post-treatment, for a change from pre- to post-treatment of 2 (26 –24 = 2), indicating an improvement in MoCA. The participant also had a pre-treatment relative power of theta |z-score| of 1.664 (1.664 standard deviations from the normative mean, z = 0) and a post-treatment relative power of theta |z-score| of 0.898, for a change in |z-score| over the treatment period of –0.766. This indicates improvement, because the participant’s z-score was closer to the normative mean of z = 0 after the program. On the graph representing change in relative power of theta in Fig. 6, this participant’s datapoint is represented as a black dot in the top left quadrant because they experienced improvement for change in MoCA score (Y-axis) and for change in relative power of theta |z-score| (X-axis).
Fig. 5
Change in QEEG Metrics across Timepoints. For participants with SOIs at trained sites, LS mean |z-score| values at each timepoint: -3 months (baseline assessment), 0 months (pre-treatment assessment), 3 months (post-treatment assessment) and 9 months (follow-up assessment) are shown for the QEEG parameters absolute power and relative power percent for the frequency bands delta, theta, beta, and high beta. Pairwise LS mean change values between timepoints are summarized in the top of each graph (values from Table 4). There was no change in |z-score| over the control or follow-up period for any parameter. For absolute power of delta, absolute power of theta, relative power of theta, absolute power of beta, absolute power of high beta, and relative power of high beta, there was a significant decrease (improvement) in |z-score| over the treatment period (gray shading). Error bars represent the standard error. ns: p > 0.0125, change not significant at the Bonferroni-corrected significance level. * p≤0.0125. ** p≤0.008. *** p≤0.001. **** p≤0.0001.
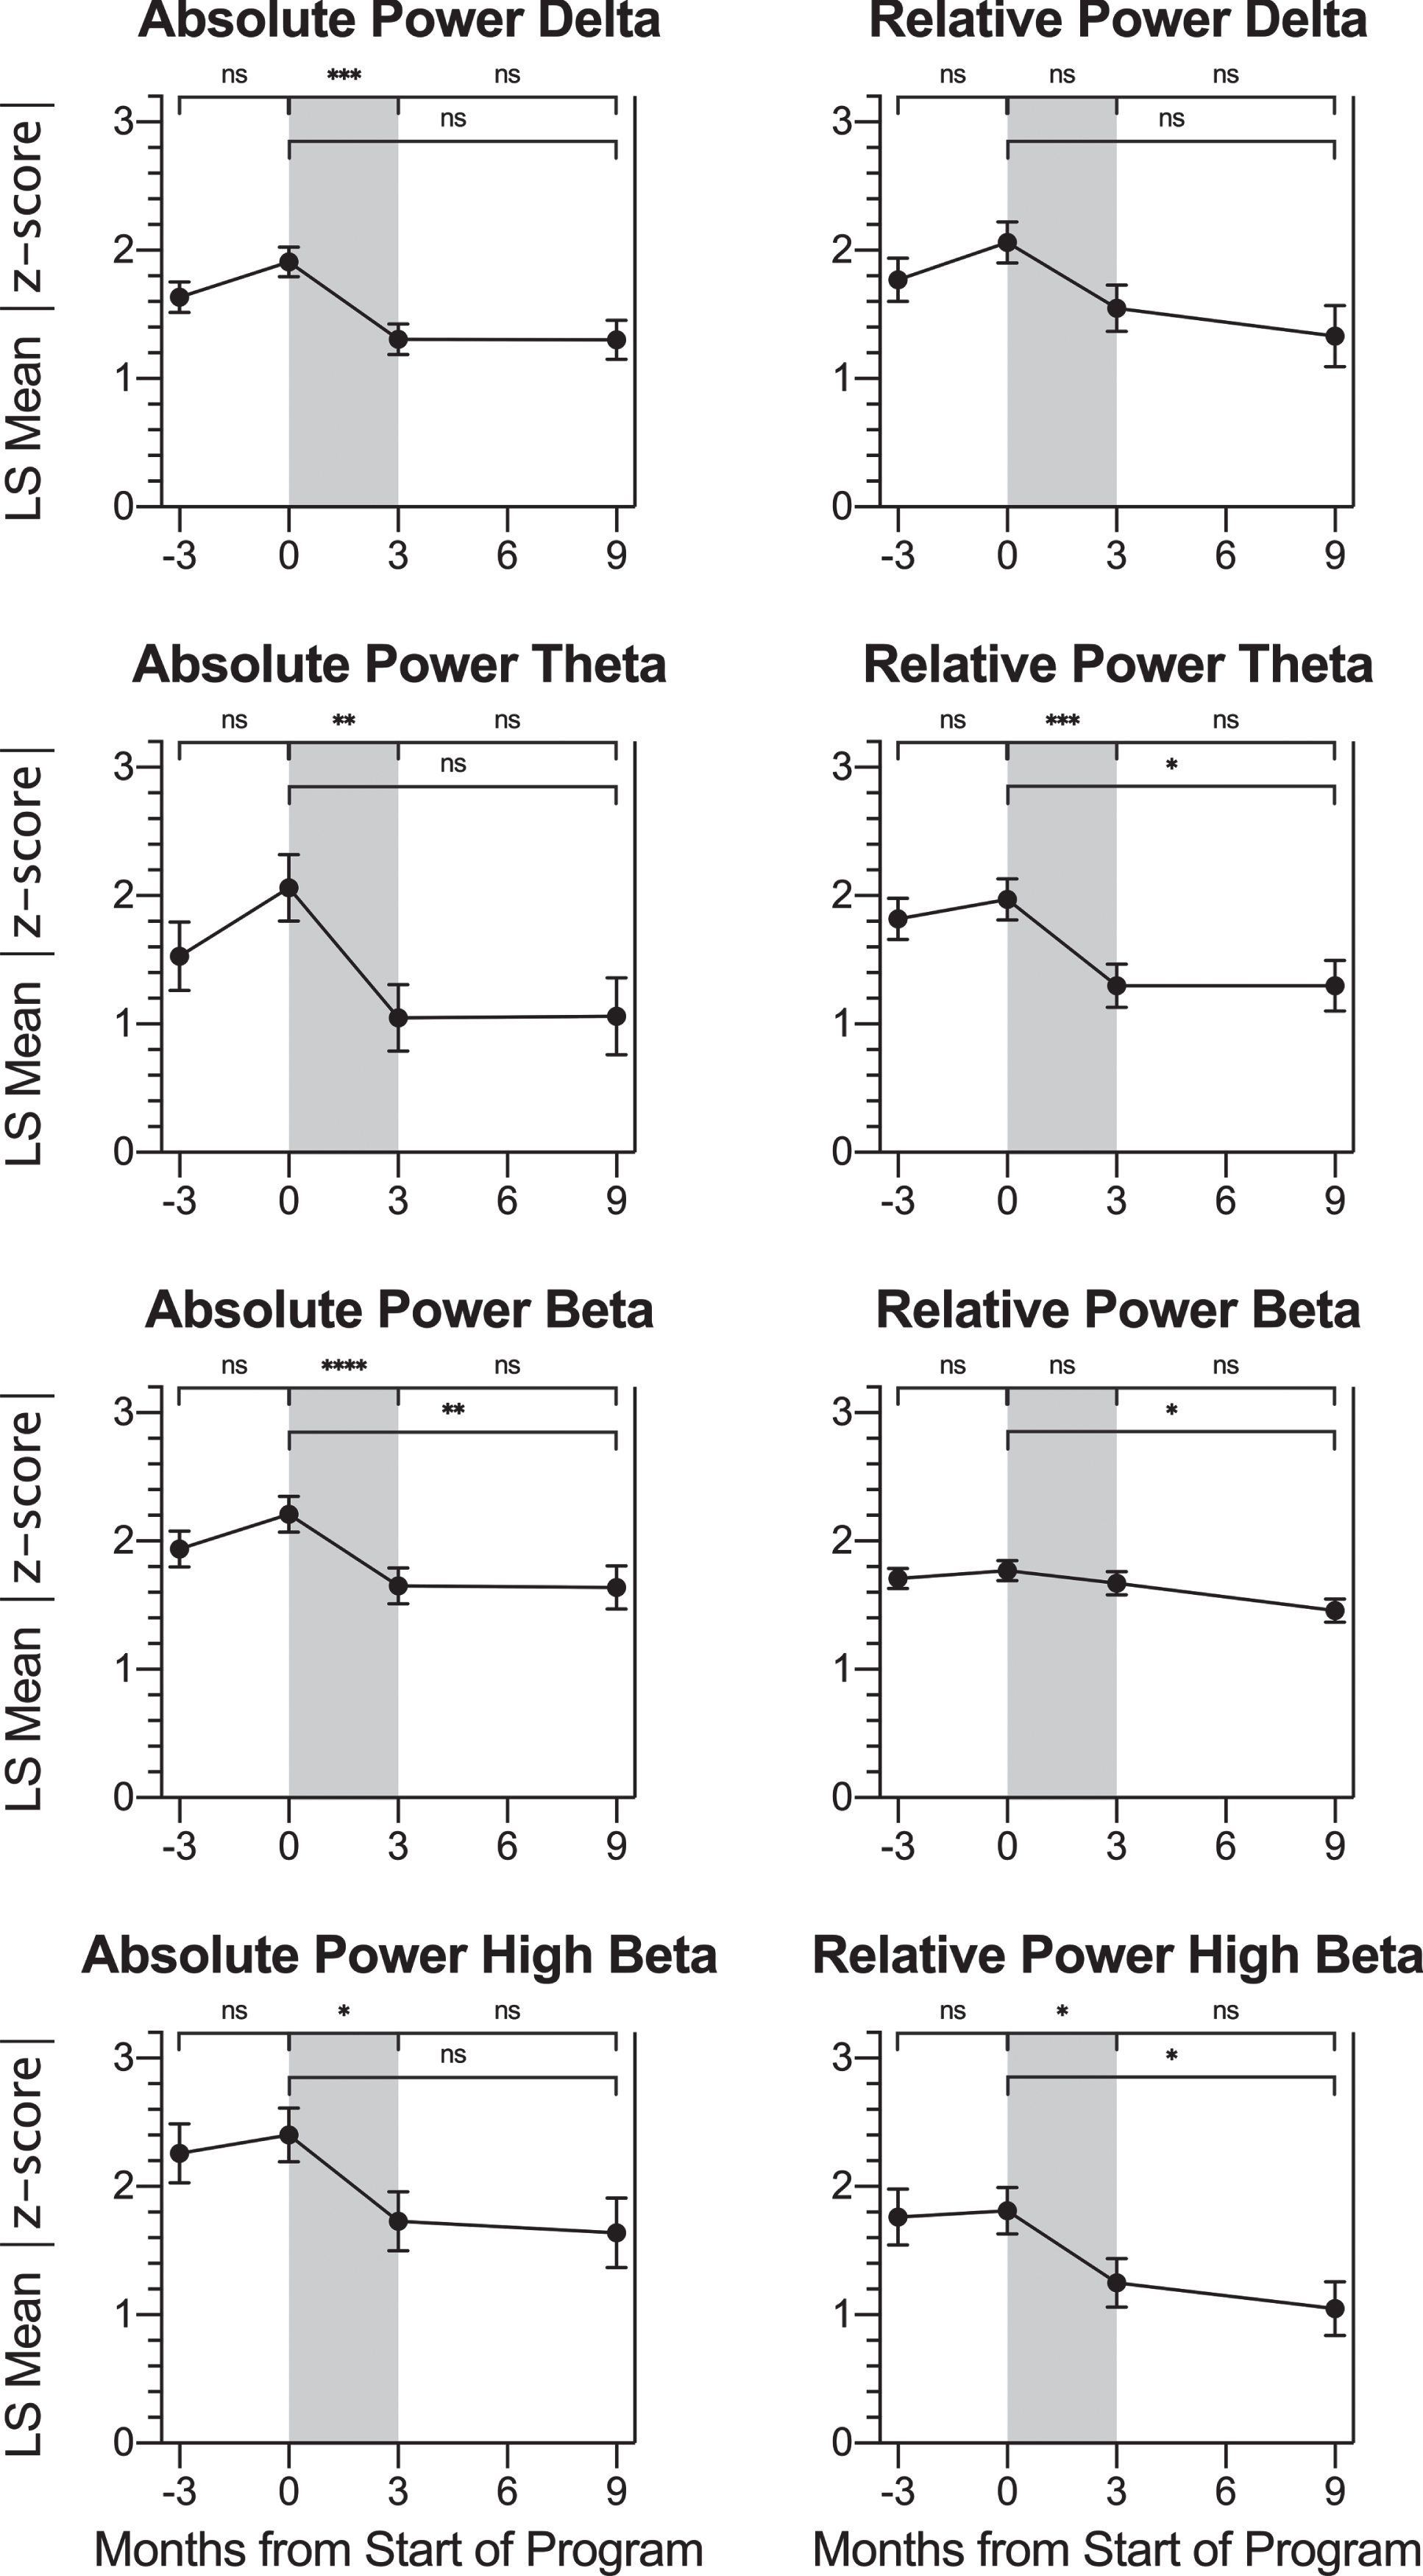
Fig. 6
Correlation between Changes in MoCA Score and Physiological Metrics over the Treatment Period. Data points for participants’ change from pre-treatment to post-treatment (post minus pre) on MoCA score (Y-axis) versus each physiological metric (X-axis) are graphed. Reference lines are drawn at X = 0 and Y = 0, which divide the graph into quadrants. Points that demonstrate improvement in both graphed measures (where possible) are shown in black, while those that demonstrate no change or decline are shown in gray. For 12 of the 15 graphs, points in a single quadrant are black and points in the other three quadrants are gray, because an improvement was defined for both the X-axis and Y-axis measures. For change in MoCA score, an improvement was an increase in score. For change in heart rate, respiration rate, and all eight QEEG metrics, an improvement was a decrease. For the HRV metrics ln(SDNN) and ln(RMSSD), an improvement was an increase. For the three graphs representing change in ln(VLF power), ln(LF power), and ln(HF power), two quadrants (top left and top right) contain black points and two quadrants (bottom left and bottom right) contain gray dots because an improvement in the X-axis measure was not specifically defined during normal breathing conditions. 90% prediction ellipses are also graphed to aid in relationship visualization. The two graphs representing change in relative power of delta and relative power of theta (the bottom left panels) are indicated with an * symbol because there was a significant linear correlation found between change in MoCA score over the treatment period and change in the physiological metric (values from Table 5). In both cases, the association between these variables was a negative linear correlation. This indicates that the increase (improvement) in participants’ MoCA scores over the treatment period was associated with a decrease (improvement; closer to z = 0) in these QEEG |z-scores|.
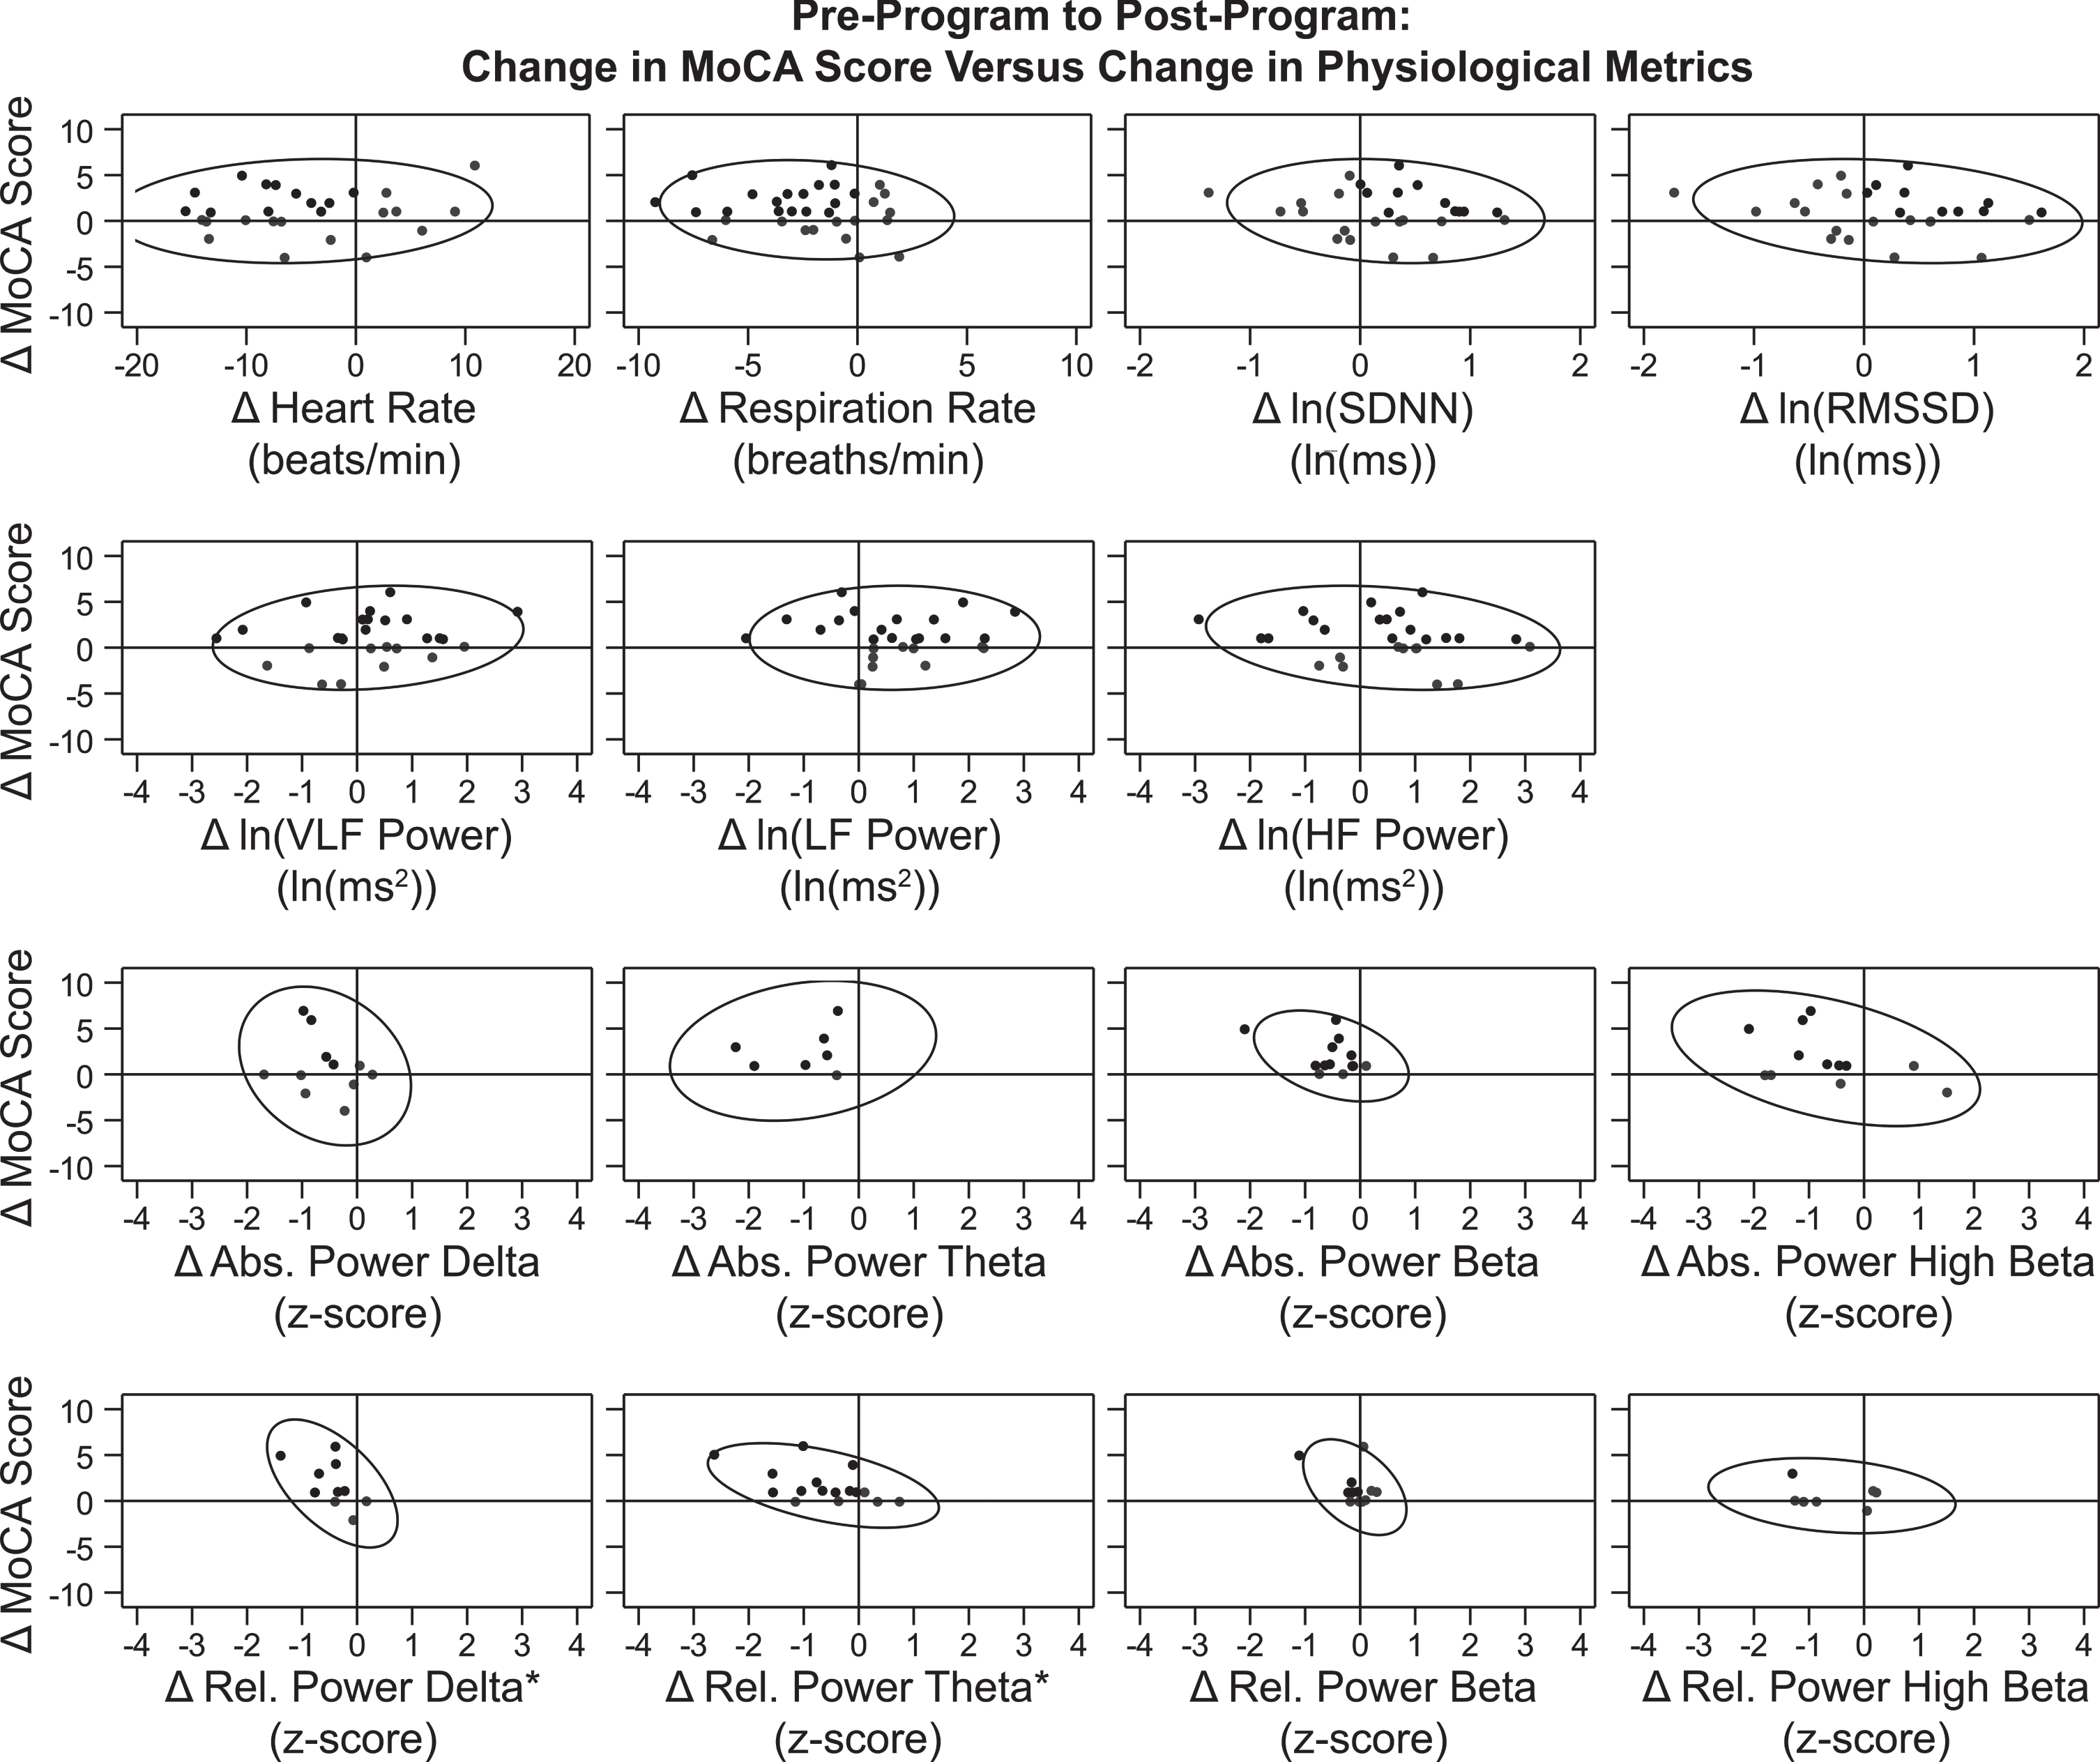
Correlation coefficients (r) for the change in MoCA score versus the change in individual physiological metrics are shown in Table 5. A significant correlation was found between change in MoCA score over the treatment period with change in two physiological metrics: relative power of delta (r = –0.576; p = 0.0813) and relative power of theta (r = –0.524; p = 0.0371). In both cases, the association between these variables was a negative linear correlation. This indicates that the increase (improvement) in participants’ MoCA scores over the treatment period was associated with a decrease (improvement; closer to z = 0) in these QEEG |z-scores|.
Table 5
Correlation between Change in MoCA Score and Change in Physiological Metrics over the Treatment Period
| Change in MoCA | |||
| Change in [Metric] | n | r | p |
| MoCA | 44 | 1.000 | — |
| Mean Heart Rate | 27 | 0.105 | 0.6024 |
| (beats/minute) | |||
| Respiration Rate | 32 | –0.130 | 0.4767 |
| (breaths/minute) | |||
| ln(SDNN) | 27 | –0.158 | 0.4306 |
| ln(RMSSD) | 27 | –0.226 | 0.2577 |
| ln(VLF Power) | 27 | 0.165 | 0.4106 |
| ln(LF Power) | 27 | 0.025 | 0.9032 |
| ln(HF Power) | 27 | –0.223 | 0.2625 |
| Absolute Power: Delta | 11 | –0.249 | 0.4601 |
| Relative Power: Delta | 10 | –0.576* | 0.0813 |
| Absolute Power: Theta | 7 | 0.218 | 0.6381 |
| Relative Power: Theta | 16 | –0.524* | 0.0371 |
| Absolute Power: Beta | 13 | –0.406 | 0.1690 |
| Relative Power: Beta | 12 | –0.469 | 0.1237 |
| Absolute Power: High Beta | 12 | –0.457 | 0.1355 |
| Relative Power: High Beta | 7 | –0.233 | 0.6146 |
Note: Due to the exploratory post-hoc nature of this analysis, p-values in this table may not be an accurate representation of statistical significance. n: number of participants in the analysis; r: correlation coefficient; p: p-value. * |r| ≥ 0.5.
4Discussion
This study evaluated the Memory Boot Camp program for older adults with both subjective and objective memory deficits. The baseline LS mean MoCA score for participants in this study was 22.29, 95% CI [21.26, 23.32], a value well below the standard cutoff for MCI cited by the test developer (25/26, (Nasreddine et al., 2005)), which suggests that many participants experienced symptoms of MCI before the program. The Memory Boot Camp program combines NFB and HRV biofeedback with brain coaching to support behavior change on modifiable risk factors known to be associated with age-related cognitive decline, MCI, and dementia. Cognitive skills and relevant symptoms for participants in this study were evaluated via neurocognitive tests and self-report questionnaires. LS mean change in scores for these measures over the treatment period were compared to an equivalent pre-testing control waiting period and to a follow-up period six months after program completion. For the majority of neurocognitive tests and self-report questionnaires, participants experienced significant improvement in score over the treatment period, with little evidence of change in score during the waiting or follow-up time periods. On the primary outcome measure, the MoCA, participants experienced an LS mean change of 1.57 points (p < 0.0001) over the treatment period. Although not directly relevant to our study population, a recent study estimated (using an anchor-based method) a Minimal Clinically Important Difference (MCID) value of 1.22 for the MoCA in survivors of stroke who were undergoing rehabilitation (Wu et al., 2019).This suggests that the change in MoCA score during the treatment period experienced by participants in the present study could have clinical relevance in addition to statistical significance.
Participants in this study did not experience a significant score increase over the treatment period on the NeuroTrax cognitive test. There was, however, a significant NeuroTrax score increase recorded for participants during the waiting/control period, when participants were instructed not to make any major lifestyle changes (and during which we did not observe a significant score change in any other neurocognitive or self-report test). An obvious difference between MoCA and NeuroTrax is that MoCA is administered via “pencil and paper” whereas NeuroTrax is computerized. Older adults’ attitudes toward technology have been shown to vary widely, based on factors such as increased age, gender and socioeconomic status (Werner & Korczyn, 2012). It is possible that the increase in NeuroTrax score over the control period represented an increase in comfort with the technology. Unlike the MoCA, for which participants’ baseline LS mean score was within the “Mild Cognitive Impairment” range (22.29), the baseline LS mean score for the NeuroTrax was within the “Probable Normal” range (97.79). Rather than reflecting a discrepancy between severity of underlying symptoms measured by the two instruments, this may instead represent differences in the sensitivity and specificity of the tests. MoCA, in particular, has demonstrated superior sensitivity to earlier/milder stages of cognitive decline, compared to tools like the Mini Mental State Examination (Freitas et al., 2013). A cross validation study of MoCA in a community-based population showed high sensitivity (97%) at the recommended MCI cutoff of 26, but only fair specificity (35%) at that point (Luis et al., 2009). When the cutoff score was lowered to 23, it showed both high sensitivity (96%) and specificity (95%). In contrast, NeuroTrax put forth a cutoff score of 96.25 (25% of one standard deviation below the normed mean) “as a best-balance normal/abnormal cutoff, with equivalent severity” of false positive and false negative (Doniger et al., 2004). It is therefore likely that the “Normal” NeuroTrax cutoff score of 103.75 (25% of one standard deviation above the normed mean) is similar to the MoCA cutoff score of 26. Importantly, by the time of 6-month follow-up, participants either approached or exceeded this Normal cutoff on both instruments, indicating a meaningful improvement in overall cognitive performance as a result of participating in the Memory Bootcamp Program.
In addition to targeting known risk factors, such as diet and exercise, the Memory Boot Camp program aimed to improve stress management and overall mental health. Participants experienced improvement in self-reported measures of mental health and quality of life upon completion of the program. On average, participants reported lower levels of depressive symptoms (BDI-ii), anxious symptoms (BAI), and improvements in sleep quality (PSQI), insomnia severity (ISI), and excessive daytime sleepiness (ESS). These improvements were accompanied by an average increase in perceived ability to function in daily life (WSAS). It is plausible that participants’ perceived improvements in memory and cognition (as measured by the MoCA) preceded their improvements in mood, or vice versa. In the dementia field, the cause-effect relationship between depression and dementia, which are tightly correlated, has been difficult to tease apart (Livingston et al., 2017). Regardless of the specific cause, participants significantly improved on average in mental health profile, and these improvements were maintained for at least six months after treatment.
The current protocol utilized a combination of NFB and HRV biofeedback; our center has previously shown that 30 sessions of similar “NFB + HRV biofeedback” protocols are associated with significant improvements in attention (Groeneveld et al., 2019) as well as anxiety and depression (White et al., 2017). The HRV biofeedback protocol utilized in this study was intended to normalize sympathetic and parasympathetic processes and facilitate stress recovery (Lehrer & Gevirtz, 2014; Lehrer & Vaschillo, 2008; Vaschillo et al., 2002). Although no changes were observed in HRV variables over the active treatment period, there was a significant decrease in breaths per minute during that time that was maintained six months after the completion of the program, which may indicate that participants learned to modulate their breathing in accordance with the Memory Boot Camp HRV biofeedback protocol. Participants began the study with reduced SDNN, a condition associated with elevated cardiovascular risk (The Task Force Report, 1996) and dysfunctional sympathetic activity that may inhibit autonomic function (Baevsky & Chernikova, 2017). It has previously been shown that older adults have lower values for many HRV parameters than do younger adults, and older adults experience smaller changes in HRV after biofeedback (Lehrer et al., 2006). Over the course of the present study, the only significant change in HRV metrics was an increase in HF power, SDNN, and RMSSD that took place over the control waiting period. Although increases in HF power, SDNN, and RMSSD are thought to be associated with improved autonomic regulation (Shaffer & Ginsberg, 2017) and increased vagal activity and resilience to stress (Carnevali et al., 2018), there is no evidence from the present study to suggest that the HRV biofeedback portion of the Memory Boot Camp program contributed to cognitive changes experienced by participants over the active treatment period.
The current study demonstrated significant im-provements in six out of eight QEEG variables following four-channel z-score NFB. The variables changed in the direction of the Neuroguide database normative mean, which is the goal of z-score NFB (Thatcher & Lubar, 2009). Disregarding statistical significance, all QEEG LS mean changes from pre-treatment to post-treatment were in the direction of the database normative mean, as were all LS mean changes from the pre-treatment to follow-up timepoints. This indicates that the z-score NFB treatment normalized brain oscillation parameters for participants in this study in a lasting manner, and this was maintained at least six months after training.
In an exploratory post-hoc analysis, we observed a moderately strong linear association between normalized QEEG variables and improved cognition. Specifically, improvements in relative power of theta and relative power of delta were linearly correlated with improvements in the MoCA over the active treatment period. “Slowing” of the EEG has long been recognized as an indicator of progression from normal brain activity patterns to brain activity patterns associated with cognitive decline and dementia ((Berger, 1933), as described in (Johannesson et al., 1979); (Gianotti et al., 2007; Malek et al., 2017)). Increased relative power of theta, in particular, has been associated with increased incidence of conversion from MCI to dementia (Jelic et al., 2000), increased severity of dementia (L. A. Coben et al., 1985), and increased abnormalities in neuropsychological measures as well as presence of the pathological protein tau (Musaeus et al., 2018).
The linear correlation of improvements in QEEG metrics with improvement in MoCA score in the present study is consistent with a role for z-score NFB in improving cognition in subjects with symptoms of MCI. The specific NFB protocol utilized in this study, z-score NFB, was selected due to our clinical experience with the protocol for treatment of ADHD (Groeneveld et al., 2019) and other clinical conditions (unpublished data). Several recent studies have demonstrated improved cognitive function in subjects with MCI following more traditional NFB training methods (Jang et al., 2019; Jirayucharoensak et al., 2019; Lavy et al., 2019). As discussed in the Introduction, there are a multitude of supportive studies of NFB in the published literature for a variety of conditions, with the strongest support level existing for its use in ADHD ((Van Doren et al., 2018), for example). A recently published consensus paper authored by more than 80 researchers both supportive of, and skeptical of, NFB (Ros et al., 2020) acknowledges the promise of NFB and provides guidance for the appro-priate design of future basic and clinical studies to ad-vance the field of NFB in a more definitive direction.
It is known that health programs with a coach/ accountability partner improve participants’ motivation and adherence to the program, along with their physiological and psychological well-being (Kivelä et al., 2014; Kreitzer et al., 2008; Prince et al., 2017). Furthermore, the Memory Boot Camp program combines multiple strategies, which is likely to be more effective than a single strategy for cognitive decline/MCI (Sherman et al., 2017). The FINGER trial, which combined two years of intervention for some of the risk factors described above (cognitive stimulation, exercise, and diet changes) with management of vascular problems in older adults dem-onstrated an 80% improvement in executive function and a 150% increase in cognitive speed (Ngandu et al., 2015; Rosenberg et al., 2018). The success of this program may be due to the fact that it incorporated multiple strategies rather than a single strategy for cognitive decline/MCI (Sherman et al., 2017). A clinical trial to test this strategy on a United States population at risk for developing Alzheimer’s disease, US-POINTER, is currently ongoing, with an estimated study completion date of November 2023 (ClinicalTrials.gov ID: NCT03688126).
4.1Limitations
The present study was a prospective trial of the Memory Boot Camp program, with a waitlist control period of three months and 6-month post-program follow-up. Statistical analysis was utilized such that participants acted as their own control. The limitation of this type of experimental design is the lack of a sham-control placebo group. Further, a single treatment condition prevented comparison of the different elements of the Memory Boot Camp program protocol. Although we found no evidence of a change in HRV metrics over the treatment period, it is possible that a change was missed due to the protocol utilized. For convenience, photoplethysmography was utilized rather than electrocardiography. Though it is more accurate, electrocardiography is more invasive as it requires increased direct contact with participants to apply adhesive sensors to the chest or wrist areas (Schäfer & Vagedes, 2013). Also for convenience, we utilized short-duration rather than long-duration (twenty-four hour) recordings of HRV, and we therefore did not evaluate the aspects of HRV that are only captured by long-duration recordings. Further, the ‘plain vanilla’ task given to participants during HRV recording sessions to prevent them from consciously modifying their breathing rate involved keeping track of the number of blue boxes on the screen. Although it was intended to produce a more consistent breathing environment to evaluate changes in HRV over time, this specific task might have been inappropriate for individuals with memory concerns because it may have introduced an unnecessary stressor (especially during the first baseline recording session), which can affect HRV metrics. Finally, participants in this study did not necessarily have a medical diagnosis of MCI. Their inclusion in the study was based on their baseline MoCA score and subjective memory concerns.
Despite these limitations, the study utilized multiple neurocognitive and self-report questionnaire assessment tools, and it assessed concomitant physiological change in HRV and QEEG parameters. Further, to our knowledge, this is the first study to report the use of z-score NFB with HRV biofeedback for subjective and objective memory concerns and symptoms of MCI.
5Conclusions
After the Memory Boot Camp program, participants experienced improvements in mean score on memory/cognition (MoCA), and measures of depression (BDI-ii), anxiety (BAI), and sleep (ESS, ISI, PSQI), and these improvements were maintained at the six-month follow-up assessment. Participants also experienced mean score improvement over the treatment period on the WSAS, a measure of functional impairment due to memory concerns, which indicates that participants felt more able to deal with their memory symptoms after the Memory Boot Camp. There was no change in HRV parameters. However, participants experienced physiological improvements in breathing rate and brain oscillation parameters that were consistent with the specific protocols utilized, suggesting that the Memory Boot Camp program effected lasting physiological change. Finally, participants’ change in MoCA score over the treatment period was correlated with change in two brain oscillation parameters utilized in the NFB portion of the Memory Boot Camp program. As there is currently no approved pharmaceutical treatment for MCI, our results for this multifactorial treatment strategy are particularly encouraging, including a significant change on the MoCA, which is known to be particularly sensitive to early changes in cognition. Given the fact that each participant served as his/her own control, these trial results suggest that a fairly short three-month program incorporating z-score NFB, HRV biofeedback, memory and cognitive training, and one-on-one coaching to encourage behavior change in diet, sleep, physical fitness, and stress reduction is a promising treatment strategy for adults age 55 to 85 with subjective and objective memory deficits and symptoms of MCI.
Conflicts of interest
All authors were employed by, or consultants with, Neurocore Brain Performance Centers (Grand Rapids, MI, USA) at the time of their participation in the study. LAW operates an NFB and biofeedback therapy private practice in Fife Lake, MI (Inland Seas Neurotherapy and Counseling (InSyNC)). LAW has previously worked as an instructor for Thought Technology, and she served on the Association for Applied Psychophysiology and Biofeedback Practice Standards Committee in 2013.
Acknowledgments
The authors thank Robert Heidelberg, Rachel Martin, Rochelle Fintelman, Bethany Rocha, Dr. Majid Fotuhi, as well as all center staff for their contributions to the project. SAS and all other SAS Institute Inc. product or service names are registered trademarks or trademarks of SAS Institute Inc. in the USA and other countries. ® indicates USA registration. This research was not funded by any specific grant from a public, commercial, or not-for-profit funding agency.
References
1 | Abner, E. L. , Kryscio, R. J. , Schmitt, F. A. , Fardo, D. W. , Moga, D. C. , Ighodaro, E. T. ,... Nelson, P. T. ((2017) ) Outcomes after diagnosis of mild cognitive impairment in a large autopsy series. Annals of Neurology, 81: (4), 549–559. |
2 | American Psychiatric Association. ((2013) ). Diagnostic and Statistical Manual of Mental Disorders (DSM-5) (5 ed.): American Psychiatric Publishing. |
3 | Angelakis, E. , Stathopoulou, S. , Frymiare, J. L. , Green, D. L. , Lubar, J. F. , & Kounios, J. ((2007) ) EEG neurofeedback: A brief overview and an example of peak alpha frequency training for cognitive enhancement in the elderly. The Clinical Neuropsychologist, 21: (1), 110–129. |
4 | Anguera, J. A. , Boccanfuso, J. , Rintoul, J. L. , Al-Hashimi, O. , Faraji, F. , Janowich, J. ,... Gazzaley, A. ((2013) ) Video game training enhances cognitive control in older adults. Nature, 501: (7465), 97–101. |
5 | Annweiler, C. , Llewellyn, D. J. , & Beauchet, O. ((2013) ) Low serum vitamin D concentrations in Alzheimer’s disease: A systematic review and meta-analysis. Journal of Alzheimer’s Disease, 33: (3), 659–674. |
6 | Annweiler, C. , Rolland, Y. , Schott, A. M. , Blain, H. , Vellas, B. , Herrmann, F. R. , & Beauchet, O. ((2012) ) Higher vitamin D dietary intake is associated with lower risk of Alzheimer’s disease: A 7-year follow-up. Journals of Gerontology Series A: Biomedical Sciences and Medical Sciences, 67: (11), 1205–1211. |
7 | Arns, M. , de Ridder, S. , Strehl, U. , Breteler, M. , & Coenen, A. ((2009) ) Efficacy of neurofeedback treatment in ADHD: The effects on inattention, impulsivity and hyperactivity: A meta-analysis. Clinical EEG and Neuroscience, 40: (3), 180–189. |
8 | Baevsky, R. M. , Baranov, V. M. , Funtova, II. , Diedrich, A. , Pashenko, A. V. , Chernikova, A. G. ,... Tank, J. ((2007) ) Autonomic cardiovascular and respiratory control during prolonged spaceflights aboard the International Space Station. Journal of Applied Physiology (Bethesda, Md. : 1985),, 103: (1), 156–161. |
9 | Baevsky, R. M. , & Chernikova, A. G. ((2017) ) Heart rate variability analysis: Physiological foundations and main methods. Cardiometry, 10: 66–76. |
10 | Barnes, D. E. , Santos-Modesitt, W. , Poelke, G. , Kramer, A. F. , Castro, C. , Middleton, L. E. , & Yaffe, K. ((2013) ) The Mental Activity and eXercise (MAX) trial: A randomized controlled trial to enhance cognitive function in older adults. JAMA Internal Medicine, 173: (9), 797–804. |
11 | Bastien, C. H. , Vallieres, A. , & Morin, C. M. ((2001) ) Validation of the Insomnia Severity Index as an outcome measure for insomnia research. Sleep Medicine, 2: 297–307. |
12 | Becerra, J. , Fernandez, T. , Roca-Stappung, M. , Diaz-Comas, L. , Galán, L. , Bosch, J. ,... Harmony, T. ((2012) ) Neurofeedback in healthy elderly human subjects with electroencephalographic risk for cognitive disorder. Journal of Alzheimer’s Disease, 28: (2), 357–367. |
13 | Beck, A. T. , & Steer, R. A. ((1993) ) Beck Anxiety Inventory Manual. San Antonio, TX: Psychological Corporation. |
14 | Beck, A. T. , Steer, R. A. , & Brown, G. K. ((1996) ) Manual for the Beck Depression Inventory-II. San Antonio, TX: Psychological Corporation. |
15 | Berger, H. ((1933) ) Über das elektrenkephalogramm des menschen. für Psychiatrie und Nervenkrankheiten, 99: (1), 555–574. |
16 | Berman, M. , & Frederick, J. ((2009) ) Efficacy of neurofeed-back for executive and memory function in dementia. Paper presented at the International Conference on Alzheimer’s Disease (ICAD), Vienna, Austria. |
17 | Bourre, J. M. ((2006) ) Effects of nutrients (in food) on the structure and function of the nervous system: Update on dietary requirements for brain. Part 2: Macronutrients. The Journal of Nutrition, Health & Aging, 10: (5), 386–399. |
18 | Bredesen, D. E. ((2014) ) Reversal of cognitive decline: A novel therapeutic program. Aging, 6: (9), 707–717. |
19 | Buckley, R. F. , Saling, M. M. , Frommann, I. , Wolfsgruber, S. , & Wagner, M. ((2015) ) Subjective cognitive decline from a phenomenological perspective: A review of the qualitative literature. Journal of Alzheimer’s Disease, Suppl, 48: (Suppl 1), S125–140. |
20 | Buell, J. S. , & Dawson-Hughes, B. ((2008) ) Vitamin D and neurocognitive dysfunction: Preventing “D” ecline? Molecular Aspects of Medicine, 29: (6), 415–422. |
21 | Bussalb, A. , Congedo, M. , Barthélemy, Q. , Ojeda, D. , Acquaviva, E. , Delorme, R. , & Mayaud, L. ((2019) ) Clinical and experimental factors influencing the efficacy of neurofeedback in ADHD: A meta-analysis. Frontiers in Psychiatry, 10: . |
22 | Buysse, D. J. , Reynolds, C. F., 3rd, Monk, T. H. , Berman, S. R. , & Kupfer, D. J. ((1989) ) The Pittsburgh Sleep Quality Index: A new instrument for psychiatric practice and research. Psychiatry Research, 28: (2), 193–213. |
23 | Carnevali, L. , Koenig, J. , Sgoifo, A. , & Ottaviani, C. ((2018) ) Autonomic and brain morphological predictors of stress resilience. Frontiers in Neuroscience, 12: 228. |
24 | Chan, M. Y. , Haber, S. , Drew, L. M. , & Park, D. C. ((2014) ) Training older adults to use tablet computers: Does it enhance cognitive function? The Gerontologist, 56: (3), 475–484. |
25 | Christie, G. J. , Hamilton, T. , Manor, B. D. , Farb, N. A. S. , Farzan, F. , Sixsmith, A. ,... Moreno, S. ((2017) ) Do lifestyle activities protect against cognitive decline in aging? A review. Frontiers in Aging Neuroscience, 9: (381). |
26 | Clarke, T. C. , Black, L. I. , Stussman, B. J. , Barnes, P. M. , & Nahin, R. L. ((2015) ) Trends in the use of complementary health approaches among adults: United States, 2002-2012. National Health Statistics Reports, (79), 1-16. |
27 | ClinicalTrials.gov ID: NCT03688126. U.S. study to protect brain health through lifestyle intervention to reduce risk (POINTER). Retrieved May 22, 2020 |
28 | ClinicalTrials.gov ID: NCT04426162. Effects of Memory Boot Camp on brain function in adults with symptoms of Mild Cognitive Impairment (MCI). Retrieved June 16, 2020 |
29 | Coben, L. A. , Danziger, W. , & Storandt, M. ((1985) ) A longitudinal EEG study of mild senile dementia of Alzheimer type: Changes at 1 year and at 2.5 years. Electroencephalography and Clinical Neurophysiology, 61: (2), 101–112. |
30 | Coben, R. , Hammond, D. C. , & Arns, M. ((2019) ) 19 channel z-score and LORETA neurofeedback: Does the evidence support the hype? Applied Psychophysiology and Biofeedback, 44: (1), 1–8. |
31 | Colcombe, S. J. , Erickson, K. I. , Scalf, P. E. , Kim, J. S. , Prakash, R. , McAuley, E. ,... Kramer, A. F. ((2006) ) Aerobic exercise training increases brain volume in aging humans. The Journals of Gerontology. Series A, Biological Sciences and Medical Sciences, 61: (11), 1166–1170. |
32 | Cole, G. M. , Ma, Q.-L. , & Frautschy, S. A. ((2009) ) Omega-3 fatty acids and dementia. Prostaglandins, Leukotrienes and Essential Fatty Acids, 81: (2), 213–221. |
33 | Collura, T. F. , Guan, J. , Tarrant, J. , Bailey, J. , & Starr, F. ((2010) ) EEG biofeedback case studies using live z-score training and a normative database. Journal of Neurotherapy, 14: (1), 22–46. |
34 | Cooper, C. , Sommerlad, A. , Lyketsos, C. G. , & Livingston, G. ((2015) ) Modifiable predictors of dementia in mild cognitive impairment: A systematic review and meta-analysis. American Journal of Psychiatry, 172: (4), 323–334. |
35 | Cortese, S. , Ferrin, M. , Brandeis, D. , Holtmann, M. , Aggensteiner, P. , Daley, D. ,... Zuddas, A. ((2016) ) Neurofeedback for Attention-Deficit/Hyperactivity Disorder: Meta-analysis of clinical and neuropsychological outcomes from randomized controlled trials. Journal of the American Academy of Child and Adolescent Psychiatry, 55: (6), 444–455. |
36 | da Silva, V. P. , Ramalho Oliveira, B. R. , Tavares Mello, R. G. , Moraes, H. , Deslandes, A. C. , & Laks, J. ((2018) ) Heart rate variability indexes in dementia: A systematic review with a quantitative analysis. Current Alzheimer Research, 15: (1), 80–88. |
37 | De Jong, M. J. , & Randall, D. C. ((2005) ) Heart rate variability analysis in the assessment of autonomic function in heart failure. Journal of Cardiovascular Nursing, 20: (3), 186-195; quiz 196–187. |
38 | de Oliveira Matos, F. , Vido, A. , Garcia, W. F. , Lopes, W. A. , & Pereira, A. ((2020) ) A neurovisceral integrative study on cognition, heart rate variability, and fitness in the elderly. Frontiers in Aging Neuroscience, 12: 51. |
39 | De Roeck, E. E. , De Deyn, P. P. , Dierckx, E. , & Engelborghs, S. ((2019) ) Brief cognitive screening instruments for early detection of Alzheimer’s disease: A systematic review. Alzheimer’s Research & Therapy, 11: (1), 21. |
40 | Dessy, E. , Van Puyvelde, M. , Mairesse, O. , Neyt, X. , & Pattyn, N. ((2017) ) Cognitive performance enhancement: Do biofeedback and neurofeedback work? Journal of Cognitive Enhancement, 1-31. |
41 | Diamond, A. , & Ling, D. S. ((2019) ) Review of the evidence on, and fundamental questions about, efforts to improve executive functions, including working memory. In J. B. Novick, M. F. Bunting, M. R. Dougherty, & R. W. Engle (Eds.), Cognitive and Working Memory Training (pp. 143-431). United States of America: Oxford University Press. |
42 | Dias, Á.M. , & van Deusen, A. ((2011) ) A new neurofeedback protocol for depression. The Spanish Journal of Psychology, 14: (01), 374–384. |
43 | Doniger, G. M. , Schweiger, A. , Simon, E. S. , the Neurocognitive Study Group ((2004) ) Defining ‘normal’ performance on mindstreams tests: A comprehensive analysis of NeuroTrax research data. NeuroTrax Science Letters. Retrieved from https://www.mindstreamshealth.com/docs/ScienceNewsletter_01-10-04.pdf |
44 | Douaud, G. , Refsum, H. , de Jager, C. A. , Jacoby, R. , Nichols, T. E. , Smith, S. M. , & Smith, A. D. ((2013) ) Preventing Alzheimer’s disease-related gray matter atrophy by B-vitamin treatment. Proceedings of the National Academy of Sciences, 110: (23), 9523–9528. |
45 | Dwolatzky, T. , Dimant, L. , Simon, E. S. , & Doniger, G. M. ((2010) ) Validity of a short computerized assessment battery for moderate cognitive impairment and dementia. International Psychogeriatrics, 22: (5), 795–803. |
46 | Dwolatzky, T. , Whitehead, V. , Doniger, G. M. , Simon, E. S. , Schweiger, A. , Jaffe, D. , & Chertkow, H. ((2004) ) Validity of the Mindstreams computerized cognitive battery for mild cognitive impairment. Journal of Molecular Neuroscience, 24: (1), 33–44. |
47 | Eddie, D. , Kim, C. , Lehrer, P. , Deneke, E. , & Bates, M. ((2014) ) A pilot study of brief heart rate variability biofeedback to reduce craving in young adult men receiving inpatient treatment for substance use disorders. Applied Psychophysiology and Biofeedback, 39: (3-4), 181–192. |
48 | Egner, T. , & Sterman, M. B. ((2006) ) Neurofeedback treatment of epilepsy: From basic rationale to practical application. Expert Review of Neurotherapeutics, 6: (2), 247–257. |
49 | Fernández-Álvarez, J. , Grassi, M. , Colombo, D. , Colombo, D. , Botella, C. , Cipresso, P. ,... Riva, G. ((2020) ) The efficacy of bio-and neurofeedback for depression: A meta-analysis. PsyArXiv. |
50 | Ferreira, S. , Pêgo, J. M. , & Morgado, P. ((2019) ) The efficacy of biofeedback approaches for obsessive-compulsive and related disorders: A systematic review and meta-analysis. Psychiatry Research, 272: 237–245. |
51 | Forte, G. , Favieri, F. , & Casagrande, M. ((2019) ) Heart rate variability and cognitive function: A systematic review. Frontiers in Neuroscience, 13: 710. |
52 | Fotuhi, M. , Lubinski, B. , Trullinger, M. , Hausterman, N. , Riloff, T. , Hadadi, M. , & Raji, C. ((2016) ) A personalized 12-week” Brain Fitness Program” for improving cognitive function and increasing the volume of hippocampus in elderly with mild cognitive impairement. The Journal of Prevention of Alzheimer’s Disease, 3: (3), 133–137. |
53 | Freitas, S. , Simoes, M. R. , Alves, L. , & Santana, I. ((2013) ) Montreal cognitive assessment: Validation study for mild cognitive impairment and Alzheimer disease. Alzheimer Disease and Associated Disorders, 27: (1), 37–43. |
54 | Gates, N. J. , Rutjes, A. W. S. , Di Nisio, M. , Karim, S. , Chong, L.-Y. , March, E. ,... Vernooij, R. W. M. ((2020) ) Computerised cognitive training for 12 or more weeks for maintaining cognitive function in cognitively healthy people in late life. Cochrane Database of Systematic Reviews, 2: (2), Cd012277. |
55 | Gevirtz, R. ((2013) ) The promise of heart rate variability biofeedback: Evidence-based applications. Biofeedback, 41: 110–120. |
56 | Gianotti, L. R. R. , Künig, G. , Lehmann, D. , Faber, P. L. , Pascual-Marqui, R. D. , Kochi, K. , & Schreiter-Gasser, U. ((2007) ) Correlation between disease severity and brain electric LORETA tomography in Alzheimer’s disease. Clinical Neurophysiology, 118: (1), 186–196. |
57 | Gifford, K. A. , Liu, D. , Romano, R. 3rd, , Jones, R. N. , & Jefferson, A. L. ((2015) ) Development of a subjective cognitive decline questionnaire using item response theory: A pilot study. Alzheimer’s & Dementia (Amsterdam, Netherlands), 1: (4), 429–439. |
58 | Gimson, A. , Schlosser, M. , Huntley, J. D. , & Marchant, N. L. ((2018) ) Support for midlife anxiety diagnosis as an independent risk factor for dementia: A systematic review. BMJ Open, 8: (4), e019399. |
59 | Groeneveld, K. M. , Mennenga, A. M. , Heidelberg, R. C. , Martin, R. E. , Tittle, R. K. , Meeuwsen, K. D. ,... White, E. K. ((2019) ) Z-Score Neurofeedback and Heart Rate Variability Training for Adults and Children with Symptoms of Attention-Deficit/Hyperactivity Disorder: A Retrospective Study. Applied Psychophysiology and Biofeedback, 44: (4), 291–308. |
60 | Grosso, G. , Marventano, S. , Yang, J. , Micek, A. , Pajak, A. , Scalfi, L. ,... Kales, S. N. ((2017) ) A comprehensive meta-analysis on evidence of Mediterranean diet and cardiovascular disease: Are individual components equal? Critical Reviews in Food Science and Nutrition, 57: (15), 3218–3232. |
61 | Gruzelier, J. H. ((2014) ) EEG-neurofeedback for optimising performance. I: A review of cognitive and affective outcome in healthy participants. Neuroscience and Biobehavioral Reviews, 44: 124–141. |
62 | Hammond, D. C. ((2005) ) Neurofeedback with anxiety and affective disorders. Child and Adolescent Psychiatric Clinics of North America, 14: (1), 105–123. |
63 | Hoops, S. , Nazem, S. , Siderowf, A. D. , Duda, J. E. , Xie, S. X. , Stern, M. B. , & Weintraub, D. ((2009) ) Validity of the MoCA and MMSE in the detection of MCI and dementia in Parkinson disease. Neurology, 73: (21), 1738–1745. |
64 | Irish, L. A. , Kline, C. E. , Gunn, H. E. , Buysse, D. J. , & Hall, M. H. ((2015) ) The role of sleep hygiene in promoting public health: A review of empirical evidence. Sleep Medicine Reviews, 22: 23–36. |
65 | Ismail, Z. , Elbayoumi, H. , Fischer, C. E. , Hogan, D. B. , Millikin, C. P. , Schweizer, T. ,... Fiest, K. M. ((2017) ) Prevalence of depression in patients with mild cognitive impairment: A systematic review and meta-analysis. JAMA Psychiatry, 74: (1), 58–67. |
66 | Jang, J.-H. , Kim, J. , Park, G. , Kim, H. , Jung, E.-S. , Cha, J.-y. ,... Yoo, H. ((2019) ) Beta wave enhancement neurofeedback improves cognitive functions in patients with mild cognitive impairment. Medicine, 98: (50). |
67 | Jatzko, A. , Rothenhofer, S. , Schmitt, A. , Gaser, C. , Demirakca, T. , Weber-Fahr, W. ,... Braus, D. F. ((2006) ) Hippocampal volume in chronic posttraumatic stress disorder (PTSD): MRI study using two different evaluation methods. Journal of Affective Disorders, 94: (1-3), 121–126. |
68 | Jelic, V. , Johansson, S. E. , Almkvist, O. , Shigeta, M. , Julin, P. , Nordberg, A. ,... Wahlund, L. O. ((2000) ) Quantitative electroencephalography in mild cognitive impairment: Longitudinal changes and possible prediction of Alzheimer’s disease. Neurobiology of Aging, 21: (4), 533–540. |
69 | Jennings, J. R. , Kamarck, T. , Stewart, C. , Eddy, M. , & Johnson, P. ((1992) ) Alternate cardiovascular baseline assessment techniques: Vanilla or resting ine. Psychophysiology, 29: (6), 742–750. |
70 | Jester, D. J. , Rozek, E. K. , & McKelley, R. A. ((2019) ) Heart rate variability biofeedback: Implications for cognitive and psychiatric effects in older adults. Aging & Mental Health, 23: (5), 574–580. |
71 | Jirayucharoensak, S. , Israsena, P. , Pan-ngum, S. , Hemrungrojn, S. , & Maes, M. ((2019) ) A game-based neurofeedback training system to enhance cognitive performance in healthy elderly subjects and in patients with amnestic mild cognitive impairment. Clinical Interventions in Aging, 14: 347–360. |
72 | Johannesson, G. , Hagberg, B. , Gustafson, L. , & Ingvar, D. H. ((1979) ) EEG and cognitive impairment in presenile dementia. Acta Neurologica Scandinavica, 59: (5), 225–240. |
73 | Johns, M. W. ((1992) ) Reliability and factor analysis of the Epworth Sleepiness Scale. Sleep, 15: (4), 376–381. |
74 | Ju, Y.-E. S. , Lucey, B. P. , & Holtzman, D. M. ((2014) ) Sleep and Alzheimer disease pathology—A bidirectional relationship. Nature Reviews. Neurology, 10: (2), 115–119. |
75 | Karssemeijer, E. E. , Aaronson, J. J. , Bossers, W. W. , Smits, T. T. , Rikkert, M. M. O. , & Kessels, R. R. ((2017) ) Positive effects of combined cognitive and physical exercise training on cognitive function in older adults with mild cognitive impairment or dementia: A meta-analysis. Ageing Research Reviews, 40: 75–83. |
76 | Kivelä, K. , Elo, S. , Kyngäs, H. , & Kääriäinen, M. ((2014) ) The effects of health coaching on adult patients with chronic diseases: A systematic review. Patient Education and Counseling, 97: (2), 147–157. |
77 | Koberda, J. L. ((2014) ) Z-score LORETA neurofeedback as a potential therapy in cognitive dysfunction and dementia. Journal of Psychology & Clinical Psychiatry, 1: (6). |
78 | Krause, A. J. , Simon, E. B. , Mander, B. A. , Greer, S. M. , Saletin, J. M. , Goldstein-Piekarski, A. N. , & Walker, M. P. ((2017) ) The sleep-deprived human brain. Nature Reviews. Neuroscience, 18: (7), 404–418. |
79 | Kreitzer, M. J. , Sierpina, V. S. , & Lawson, K. ((2008) ) Health coaching: Innovative education and clinical programs emerging. Explore: the Journal of Science and Healing, 4: (2), 154–155. |
80 | Krigbaum, G. , & Wigton, N. L. ((2015) ) A methodology of analysis for monitoring treatment progression with 19-channel z-score neurofeedback (19ZNF) in a single-subject design. Applied Psychophysiology and Biofeedback, 40: (3), 139–149. |
81 | Kroenke, K. , Spitzer, R. L. , & Williams, J. B. ((2001) ) The PHQ-: Validity of a brief depression severity measure. Journal of General Internal Medicine, 16: (9), 606–613. |
82 | Laborde, S. , Mosley, E. , & Thayer, J. F. ((2017) ) Heart rate variability and cardiac vagal tone in psychophysiological research - Recommendations for experiment planning, data analysis, and data reporting. Frontiers in Psychology, 8: 213. |
83 | Lampit, A. , Hallock, H. , Suo, C. , Naismith, S. L. , & Valenzuela, M. ((2015) ) Cognitive training-induced short-term functional and long-term structural plastic change is related to gains in global cognition in healthy older adults: A pilot study. Frontiers in Aging Neuroscience, 7: 14. |
84 | Langa, K. M. , & Levine, D. A. ((2014) ) The diagnosis and management of mild cognitive impairment: A clinical review. JAMA, 312: (23), 2551–2561. |
85 | Lavy, Y. , Dwolatzky, T. , Kaplan, Z. , Guez, J. , & Todder, D. ((2019) ) Neurofeedback improves memory and peak alpha frequency in individuals with Mild Cognitive Impairment. Applied Psychophysiology and Biofeedback, 44: (1), 41–49. |
86 | Law, L. L. , Barnett, F. , Yau, M. K. , & Gray, M. A. ((2014) ) Effects of combined cognitive and exercise interventions on cognition in older adults with and without cognitive impairment: A systematic review. Ageing Research Reviews, 15: 61–75. |
87 | Lehrer, P. , & Gevirtz, R. ((2014) ) Heart rate variability biofeedback: How and why does it work? Frontiers in Psychology, 5: . |
88 | Lehrer, P. , & Vaschillo, E. ((2008) ) The future of heart rate variability biofeedback. Biofeedback, 36: (1). |
89 | Lehrer, P. , Vaschillo, E. , Lu, S.-E. , Eckberg, D. , Vaschillo, B. , Scardella, A. , & Habib, R. ((2006) ) Heart rate variability biofeedback. Chest, 129: (2), 278–284. |
90 | LeMoult, J. , & Gotlib, I. H. ((2019) ) Depression: A cognitive perspective. Clinical Psychology Review, 69: 51–66. |
91 | Licher, S. , Ahmad, S. , Karamujic-Comic, H. , Voortman, T. , Leening, M. J. G. , Ikram, M. A. , & Ikram, M. K. ((2019) ) Genetic predisposition, modifiable-risk-factor profile and long-term dementia risk in the general population. Nature Medicine, 25: (9), 1364–1369. |
92 | Livingston, G. , Sommerlad, A. , Orgeta, V. , Costafreda, S. G. , Huntley, J. , Ames, D. ,... Cohen-Mansfield, J. ((2017) ) Dementia prevention, intervention, and care. Lancet, 390: (10113), 2673–2734. |
93 | Lourida, I. , Hannon, E. , Littlejohns, T. J. , Langa, K. M. , Hypponen, E. , Kuzma, E. , & Llewellyn, D. J. ((2019) ) Association of lifestyle and genetic risk with incidence of dementia. JAMA, 322: (5), 430–437. |
94 | Lubar, J. F. , Swartwood, M. O. , Swartwood, J. N. , & O’Donnell, P. H. ((1995) ) Evaluation of the effectiveness of EEG neurofeedback training for ADHD in a clinical setting as measured by changes in T.O.V.A. scores, behavioral ratings, and WISC-R performance. Biofeedback and Self Regulation, 20: (1), 83–99. |
95 | Luijmes, R. E. , Pouwels, S. , & Boonman, J. ((2016) ) The effectiveness of neurofeedback on cognitive functioning in patients with Alzheimer’s disease: Preliminary results. Neurophysiologie Clinique/Clinical Neurophysiology, 46: (3), 179–187. |
96 | Luis, C. A. , Keegan, A. P. , & Mullan, M. ((2009) ) Cross validation of the Montreal Cognitive Assessment in community dwelling older adults residing in the Southeastern US. International Journal of Geriatric Psychiatry, 24: (2), 197–201. |
97 | Lupien, S. J. , Nair, N. P. , Briere, S. , Maheu, F. , Tu, M. T. , Lemay, M. ,... Meaney, M. J. ((1999) ) Increased cortisol levels and impaired cognition in human aging: Implication for depression and dementia in later life. Reviews in the Neurosciences, 10: (2), 117–139. |
98 | Malek, N. , Baker, M. R. , Mann, C. , & Greene, J. ((2017) ) Electroencephalographic markers in dementia. Acta Neurologica Scandinavica, 135: (4), 388–393. |
99 | McEvoy, C. T. , Leng, Y. , Peeters, G. M. , Kaup, A. R. , Allen, I. E. , & Yaffe, K. ((2019) ) Interventions involving a major dietary component improve cognitive function in cognitively healthy adults: A systematic review and meta-analysis. Nutrition Research, 66: 1–12. |
100 | McLennan, S. N. , Mathias, J. L. , Brennan, L. C. , & Stewart, S. ((2011) ) Validity of the montreal cognitive assessment (MoCA) as a screening test for mild cognitive impairment (MCI) in a cardiovascular population. Journal of Geriatric Psychiatry and Neurology, 24: (1), 33–38. |
101 | Micoulaud-Franchi, J.-A. , Geoffroy, P. A. , Fond, G. , Lopez, R. , Bioulac, S. , & Philip, P. ((2014) ) EEG neurofeedback treatments in children with ADHD: An updated meta-analysis of randomized controlled trials. Frontiers in Human Neuroscience, 8: 906. |
102 | Milani, S. A. , Marsiske, M. , Cottler, L. B. , Chen, X. , & Striley, C. W. ((2018) ) Optimal cutoffs for the Montreal Cognitive Assessment vary by race and ethnicity. Alzheimer’s & Dementia (Amsterdam, Netherlands), 10: 773–781. |
103 | Mirza, S. S. , Ikram, M. A. , Bos, D. , Mihaescu, R. , Hofman, A. , & Tiemeier, H. ((2017) ) Mild cognitive impairment and risk of depression and anxiety: A population-based study. Alzheimer’s & Dementia: The Journal of the Alzheimer’s Association, 13: (2), 130–139. |
104 | Mitchell, A. J. , Beaumont, H. , Ferguson, D. , Yadegarfar, M. , & Stubbs, B. ((2014) ) Risk of dementia and mild cognitive impairment in older people with subjective memory complaints: Meta-analysis. Acta Psychiatrica Scandinavica, 130: (6), 439–451. |
105 | Mitchell, A. J. , & Shiri-Feshki, M. ((2009) ) Rate of progression of mild cognitive impairment to dementia—Meta-analysis of robust inception cohort studies. Acta Psychiatrica Scandinavica, 119: (4), 252–265. |
106 | Mohajeri, M. H. , Troesch, B. , & Weber, P. ((2015) ) Inadequate supply of vitamins and DHA in the elderly: Implications for brain aging and Alzheimer-type dementia. Nutrition, 31: (2), 261–275. |
107 | Mol, M. , Carpay, M. , Ramakers, I. , Rozendaal, N. , Verhey, F. , & Jolles, J. ((2007) ) The effect of perceived forgetfulness on quality of life in older adults; a qualitative review. International Journal of Geriatric Psychiatry, 22: (5), 393–400. |
108 | Mollayeva, T. , Thurairajah, P. , Burton, K. , Mollayeva, S. , Shapiro, C. M. , & Colantonio, A. ((2016) ) The Pittsburgh sleep quality index as a screening tool for sleep dysfunction in clinical and non-clinical samples: A systematic review and meta-analysis. Sleep Medicine Reviews, 25: 52–73. |
109 | Mundt, J. C. , Marks, I. M. , Shear, M. K. , & Greist, J. H. ((2002) ) The Work and Social Adjustment Scale: A simple measure of impairment in functioning. British Journal of Psychiatry, 180: 461–464. |
110 | Musaeus, C. S. , Engedal, K. , Høgh, P. , Jelic, V. , Mørup, M. , Naik, M. ,... Andersen, B. B. ((2018) ) EEG theta power is an early marker of cognitive decline in dementia due to Alzheimer’s disease. Journal of Alzheimer’s Disease, 64: (4), 1359–1371. |
111 | Nasreddine, Z. S. , Phillips, N. A. , Bedirian, V. , Charbonneau, S. , Whitehead, V. , Collin, I. , &... Chertkow, H. ((2005) ) The Montreal Cognitive Assessment, MoCA: A brief screening tool for mild cognitive impairment. Journal of the American Geriatrics Society, 53: (4), 695–699. |
112 | Neylan, T. C. , Mueller, S. G. , Wang, Z. , Metzler, T. J. , Lenoci, M. , Truran, D. ,... Schuff, N. ((2010) ) Insomnia severity is associated with a decreased volume of the CA3/dentate gyrus hippocampal subfield. Biological Psychiatry, 68: (5), 494–496. |
113 | Ngandu, T. , Lehtisalo, J. , Solomon, A. , Levalahti, E. , Ahtiluoto, S. , Antikainen, R. ,... Kivipelto, M. ((2015) ) A 2 year multidomain intervention of diet, exercise, cognitive training, and vascular risk monitoring versus control to prevent cognitive decline in at-risk elderly people (FINGER): A randomised controlled trial. Lancet, 385: (9984), 2255–2263. |
114 | Nicolini, P. , Ciulla, M. M. , Malfatto, G. , Abbate, C. , Mari, D. , Rossi, P. D. ,... Lombardi, F. ((2014) ) Autonomic dysfunction in mild cognitive impairment: Evidence from power spectral analysis of heart rate variability in a cross-sectional case-control study. e. PloS One, 9: (5), 96656. |
115 | Niv, S. ((2013) ) Clinical efficacy and potential mechanisms of neurofeedback. Personality and Individual Differences, 54: 676–686. |
116 | Noh, H. J. , Joo, E. Y. , Kim, S. T. , Yoon, S. M. , Koo, D. L. , Kim, D. ,... Hong, S. B. ((2012) ) The relationship between hippocampal volume and cognition in patients with chronic primary insomnia. Journal of Clinical Neurology (Seoul, Korea), 8: (2), 130–138. |
117 | Nunan, D. , Sandercock, G. R. , & Brodie, D. A. ((2010) ) A quantitative systematic review of normal values for short-term heart rate variability in healthy adults. Pacing and Clinical Electrophysiology, 33: (11), 1407–1417. |
118 | Office of Disease Prevention and Health Promotion. (2017). 2008 Physical activity guidelines for Americans summary. Retrieved from https://health.gov/paguidelines/guidelines/summary.aspx |
119 | Ouanes, S. , & Popp, J. ((2019) ) High cortisol and the risk of dementia and Alzheimer’s disease: A review of the literature. Frontiers in Aging Neuroscience, 11: 43. |
120 | Park, D. C. , Lodi-Smith, J. , Drew, L. , Haber, S. , Hebrank, A. , Bischof, G. N. , & Aamodt, W. ((2014) ) The impact of sustained engagement on cognitive function in older adults. Psychological Science, 25: 103–112. |
121 | Patel, K. , Sutherland, H. , Henshaw, J. , Taylor, J. R. , Brown, C. A. , Casson, A. J. ,... Sivan, M. ((2020) ) Effects of neurofeedback in the management of chronic pain: A systematic review and meta-analysis of clinical trials. European Journal of Pain (London, England), 24: (8), 1440–1457. |
122 | Petersen, R. C. ((2011) ) Clinical practice. Mild cognitive impairment. New England Journal of Medicine, 364: (23), 2227–2234. |
123 | Petersen, R. C. , Caracciolo, B. , Brayne, C. , Gauthier, S. , Jelic, V. , & Fratiglioni, L. ((2014) ) Mild cognitive impairment: A concept in evolution. Journal of Internal Medicine, 275: (3), 214–228. |
124 | Pigott, H. E. , & Cannon, R. ((2014) ) Neurofeedback is the best available first-line treatment for ADHD: What is the evidence for this claim? NeuroRegulation, 1: (1), 4–23. |
125 | Ponds, R. W. , Commissaris, K. J. , & Jolles, J. ((1997) ) Prevalence and covariates of subjective forgetfulness in a normal population in The Netherlands. International Journal of Aging and Human Development, 45: (3), 207–221. |
126 | Prince, S. A. , Reid, R. D. , Pipe, A. L. , & McDonnell, L. A. ((2017) ) An evaluation of CardioPrevent: A technology-enabled, health-behavior change program for the global reduction of cardiovascular risk. Current Opinion in Cardiology, 32: (5), 580–589. |
127 | Prinsloo, S. , Rosenthal, D. I. , Lyle, R. , Garcia, S. M. , Gabel-Zepeda, S. , Cannon, R. ,... Cohen, L. ((2018) ) Exploratory study of Low Resolution Electromagnetic Tomography (LORETA) real-time z-score feedback in the treatment of pain in patients with head and neck cancer. Brain Topography, 32: (2), 283–285. |
128 | Pusswald, G. , Tropper, E. , Kryspin-Exner, I. , Moser, D. , Klug, S. , Auff, E. ,... Lehrner, J. ((2015) ) Health-related quality of life in patients with subjective cognitive decline and mild cognitive impairment and its relation to activities of daily living. Journal of Alzheimer’s Disease, 47: (2), 479–486. |
129 | Rabin, L. A. , Smart, C. M. , & Amariglio, R. E. ((2017) ) Subjective cognitive decline in preclinical Alzheimer’s disease. Annual Review of Clinical Psychology, 13: 369–396. |
130 | Reiner, M. , Rozengurt, R. , & Barnea, A. ((2014) ) Better than sleep: Theta neurofeedback training accelerates memory consolidation. Biological Psychology, 95: 45–53. |
131 | Reis, J. , Portugal, A. M. , Fernandes, L. , Afonso, N. , Pereira, M. , Sousa, N. , & Dias, N. S. ((2016) ) An alpha and theta intensive and short neurofeedback protocol for healthy aging working-memory training. Frontiers in Aging Neuroscience, 8: (157). |
132 | Riesco-Matías, P. , Yela-Bernabé, J. R. , Crego, A. , & Sánchez-Zaballos, E. ((2019) ) What do meta-analyses have to say about the efficacy of neurofeedback applied to children with ADHD? Review of previous meta-analyses and a new meta-analysis. Journal of attention disorders. Advance online publication. |
133 | Ros, T. , Enriquez-Geppert, S. , Zotev, V. , Young, K. D. , Wood, G. , Whitfield-Gabrieli, S. ,... Thibault, R. T. ((2020) ) Consensus on the reporting and experimental design of clinical and cognitive-behavioural neurofeedback studies (CRED-nf checklist. Brain, 143: (6), 1674–1685. |
134 | Rosenberg, A. , Ngandu, T. , Rusanen, M. , Antikainen, R. , Backman, L. , Havulinna, S. ,... Kivipelto, M. ((2018) ) Multidomain lifestyle intervention benefits a large elderly population at risk for cognitive decline and dementia regardless of baseline characteristics: The FINGER trial. Alzheimers Dement, 14: (3), 263–270. |
135 | Rozengurt, R. , Barnea, A. , Uchida, S. , & Levy, D. A. ((2016) ) Theta EEG neurofeedback benefits early consolidation of motor sequence learning. Psychophysiology, 53: (7), 965–973. |
136 | Scarmeas, N. , Stern, Y. , Mayeux, R. , & Luchsinger, J. A. ((2006) ) Mediterranean diet, Alzheimer disease, and vascular mediation. Archives of Neurology, 63: (12), 1709–1717. |
137 | Scarmeas, N. , Stern, Y. , Mayeux, R. , Manly, J. J. , Schupf, N. , & Luchsinger, J. A. ((2009) ) Mediterranean diet and mild cognitive impairment. Archives of Neurology, 66: (2), 216–225. |
138 | Scarmeas, N. , Stern, Y. , Tang, M. X. , Mayeux, R. , & Luchsinger, J. A. ((2006) ) Mediterranean diet and risk for Alzheimer’s disease. Annals of Neurology, 59: (6), 912–921. |
139 | Schäfer, A. , & Vagedes, J. ((2013) ) How accurate is pulse rate variability as an estimate of heart rate variability? International Journal of Cardiology, 166: (1), 15–29. |
140 | Schoenberg, P. L. A. , & David, A. S. ((2014) ) Biofeedback for psychiatric disorders: A systematic review. Applied Psychophysiology and Biofeedback, 39: (2), 109–135. |
141 | Shaffer, F. , & Ginsberg, J. P. ((2017) ) An overview of heart rate variability metrics and norms. Frontiers in Public Health, 5: 258. |
142 | Shaffer, F. , McCraty, R. , & Zerr, C. L. ((2014) ) A healthy heart is not a metronome: An integrative review of the heart’s anatomy and heart rate variability. Frontiers in Psychology, 5: 1040. |
143 | Sheline, Y. I. , Gado, M. H. , & Kraemer, H. C. ((2003) ) Untreated depression and hippocampal volume loss. American Journal of Psychiatry, 160: (8), 1516–1518. |
144 | Sherman, D. S. , Mauser, J. , Nuno, M. , & Sherzai, D. ((2017) ) The efficacy of cognitive intervention in mild cognitive impairment (MCI): A meta-analysis of outcomes on neuropsychological measures. Neuropsychology Review, 27: (4), 440–484. |
145 | Simons, D. J. , Boot, W. R. , Charness, N. , Gathercole, S. E. , Chabris, C. F. , Hambrick, D. Z. , & Stine-Morrow, E. A. ((2016) ) Do “brain-training” programs work? Psychological Science in the Public Interest, 17: (3), 103–186. |
146 | Sitaram, R. , Ros, T. , Stoeckel, L. , Haller, S. , Scharnowski, F. , Lewis-Peacock, J. ,... Sulzer, J. ((2017) ) Closed-loop brain training: The science of neurofeedback. Nature Reviews: Neuroscience, 18: (2), 86–100. |
147 | Smid, C. R. , Karbach, J. , & Steinbeis, N. ((2020) ) Toward a science of effective cognitive training. Current Directions in Psychological Science. Advance online publication. |
148 | Smith, A. D. , & Refsum, H. ((2016) ) Homocysteine, B vitamins, and cognitive impairment. Annual Review of Nutrition, 36: 211–239. |
149 | Sonuga-Barke, E. J. S. , Brandeis, D. , Cortese, S. , Daley, D. , Ferrin, M. , Holtmann, M. ,... Sergeant, J. ((2013) ) Nonpharmacological interventions for ADHD: Systematic review and meta-analyses of randomized controlled trials of dietary and psychological treatments. American Journal of Psychiatry, 170: (3), 275–289. |
150 | Souman, J. L. , Tinga, A. M. , Te Pas, S. F. , van Ee, R. , & Vlaskamp, B. N. S. ((2018) ) Acute alerting effects of light: A systematic literature review. Behavioural Brain Research, 337: 228–239. |
151 | Steingrimsson, S. , Bilonic, G. , Ekelund, A.-C. , Larson, T. , Stadig, I. , Svensson, M. ,... Bernhardsson, S. ((2020) ) Electroencephalography-based neurofeedback as treatment for post-traumatic stress disorder: A systematic review and meta-analysis. European Psychiatry, 63: (1). |
152 | Stepanski, E. J. , & Wyatt, J. K. ((2003) ) Use of sleep hygiene in the treatment of insomnia. Sleep Medicine Reviews, 7: (3), 215–225. |
153 | Su, H. M. ((2010) ) Mechanisms of n-3 fatty acid-mediated development and maintenance of learning memory performance. The Journal of Nutritional Biochemistry, 21: (5), 364–373. |
154 | Surmeli, T. , Eralp, E. , Mustafazade, I. , Kos, H. , Ozer, G. E. , & Surmeli, O. H. ((2015) ) Quantitative EEG neurometric analysis-guided neurofeedback treatment in dementia: 20 cases. How neurometric analysis is important for the treatment of dementia and as a biomarker? Clinical EEG and Neuroscience, 47: (2), 118–133. |
155 | Tang, Y.-Y. , Hölzel, B. K. , & Posner, M. I. ((2015) ) The neuroscience of mindfulness meditation. Nature Reviews. Neuroscience, 16: (4), 213–225. |
156 | Tarvainen, M. P. , Niskanen, J. P. , Lipponen, J. A. , Ranta-Aho, P. O. , & Karjalainen, P. A. ((2014) ) Kubios HRV—Heart rate variability analysis software. Computer Methods and Programs in Biomedicine, 113: (1), 210–220. |
157 | Tennstedt, S. L. , & Unverzagt, F. W. ((2014) ) The ACTIVE Study. Journal of Aging and Health, 25: (8_suppl), 3S–20S. |
158 | Thatcher, R. W. ((1998) ) Normative EEG databases and EEG biofeedback. Journal of Neurotherapy, 2: (4), 8–39. |
159 | Thatcher, R. W. ((2012) ) Handbook of quantitative electroencephalography and EEG biofeedback (Second ed.). St. Petersburg, FL: ANI Publishing. |
160 | Thatcher, R. W. , Biver, C. J. , Soler, E. P. , Lubar, J. F. , & Koberda, J. I. ((2020) ) New Advances in Electrical Neuroimaging, Brain Networks and Neurofeedback Protocols. Journal of Neurology and Neurobiology, 6: (3). |
161 | Thatcher, R. W. , & Lubar, J. F. ((2009) ) History of the scientific standards of qEEG normative databases. In T. H. Budzynski, H. K. Budzynski, J. R. Evans, & A. A. Abarbanel (Eds.), Introduction to quantitative EEG and neurofeedback: Advanced theory and applications (2nd ed., pp. 29-59). Burlington, MA: Academic Press, Elsevier. |
162 | Thayer, J. F. , & Friedman, B. H. ((2002) ) Stop that! Inhibition, sensitization, and their neurovisceral concomitants. Scandinavian Journal of Psychology, 43: (2), 123–130. |
163 | The Task Force Report. ((1996) ) Heart rate variability: Standards of measurement, physiological interpretation and clinical use. Task Force of the European Society of Cardiology and the North American Society of Pacing and Electrophysiology. Circulation, 93: (5), 1043–1065. |
164 | Thornton, K. E. , & Carmody, D. P. ((2009) ) Traumatic brain injury rehabilitation: QEEG biofeedback treatment protocols. Applied Psychophysiology and Biofeedback, 34: (1), 59–68. |
165 | Trichopoulou, A. , Costacou, T. , Bamia, C. , & Trichopoulos, D. ((2003) ) Adherence to a Mediterranean diet and survival in a Greek population. New England Journal of Medicine, 2003: (348), 2599–2608. |
166 | Tucker, J. M. , Welk, G. J. , & Beyler, N. K. ((2011) ) Physical activity in US adults: Compliance with the physical activity guidelines for Americans. American Journal of Preventive Medicine, 40: (4), 454–461. |
167 | Valls-Pedret, C. , Sala-Vila, A. , Serra-Mir, M. , Corella, D. , de la Torre, R. , Martíez-González, M. Á. ,... Salas-Salvadó, J. ((2015) ) Mediterranean diet and age-related cognitive decline: A randomized clinical trial. JAMA Internal Medicine, 175: (7), 1094–1103. |
168 | van den Berg, M. E. , Rijnbeek, P. R. , Niemeijer, M. N. , Hofman, A. , van Herpen, G. , Bots, M. L. ,... Kors, J. A. ((2018) ) Normal values of corrected heart-rate variability in 10-second electrocardiograms for all ages. Frontiers in Physiology, 9: 424. |
169 | Van Doren, J. , Arns, M. , Heinrich, H. , Vollebregt, M. A. , Strehl, U. , & K. Loo, S. ((2018) ) Sustained effects of neurofeedback in ADHD: A systematic review and meta-analysis. European Child and Adolescent Psychiatry, 28: (3), 293–305. |
170 | Vaschillo, E. , Lehrer, P. , Rishe, N. , & Konstantinov, M. ((2002) ) Heart rate variability biofeedback as a method for assessing baroreflex function: A preliminary study of resonance in the cardiovascular system. Applied Psychophysiology and Biofeedback, 27: (1), 1–27. |
171 | Wahl, D. , Solon-Biet, S. M. , Cogger, V. C. , Fontana, L. , Simpson, S. J. , Le Couteur, D. G. , & Ribeiro, R. V. ((2019) ) Aging, lifestyle and dementia. Neurobiology of Disease, 130: 104481. |
172 | Wang, J. R. , & Hsieh, S. ((2013) ) Neurofeedback training improves attention and working memory performance. Clinical Neurophysiology, 124: (12), 2406–2420. |
173 | Wells, R. E. , Yeh, G. Y. , Kerr, C. E. , Wolkin, J. , Davis, R. B. , Tan, Y. ,... Kaptchuk, T. J. ((2013) ) Meditation’s impact on default mode network and hippocampus in mild cognitive impairment: A pilot study. Neuroscience Letters, 556: 15–19. |
174 | Werner, P. , & Korczyn, A. D. ((2012) ) Willingness to use computerized systems for the diagnosis of dementia: Testing a theoretical model in an Israeli sample. Alzheimer Disease and Associated Disorders, 26: (2), 171–178. |
175 | White, E. K. , Groeneveld, K. M. , Tittle, R. K. , Bolhuis, N. A. , Martin, R. E. , Royer, T. G. , & Fotuhi, M. ((2017) ) Combined neurofeedback and heart rate variability training for individuals with symptoms of anxiety and depression: A retrospective study. NeuroRegulation, 4: (1), 37–55. |
176 | Wigton, N. L. , & Krigbaum, G. ((2015) ) Attention, executive function, behavior, and electrocortical function, significantly improved with 19-channel z-score neurofeedback in a clinical setting: A pilot study. Journal of attention disorders, 23: (4), 398–408. |
177 | Williams, D. P. , Cash, C. , Rankin, C. , Bernardi, A. , Koenig, J. , & Thayer, J. F. ((2015) ) Resting heart rate variability predicts self-reported difficulties in emotion regulation: A focus on different facets of emotion regulation. Frontiers in Psychology, 6: 261. |
178 | Williamson, J. D. , Pajewski, N. M. , Auchus, A. P. , Bryan, R. N. , Chelune, G. , Cheung, A. K. ,... Wright, C. B. ((2019) ) Effect of intensive vs standard blood pressure control on probable dementia: A randomized clinical trial. JAMA: The Journal of the American Medical Association, 321: (6), 553–561. |
179 | Wong, W. P. , Coles, J. , Chambers, R. , Wu, D. B. , & Hassed, C. ((2017) ) The effects of mindfulness on older adults with mild cognitive impairment. Journal of Alzheimer’s Disease Reports, 1: (1), 181–193. |
180 | Wotton, K. , Crannitch, K. , & Munt, R. ((2008) ) Prevalence, risk factors and strategies to prevent dehydration in older adults. Contemporary Nurse, 31: (1), 44–56. |
181 | Wu, C. Y. , Hung, S. J. , Lin, K. C. , Chen, K. H. , Chen, P. , & Tsay, P. K. ((2019) ) Responsiveness, minimal clinically important difference, and validity of the MoCA in stroke rehabilitation. Occupational Therapy International, 2019: 2517658. |
182 | Young, K. W. , Ng, P. , Kwok, T. , & Cheng, D. ((2017) ) The effects of holistic health group interventions on improving the cognitive ability of persons with mild cognitive impairment: A randomized controlled trial. Clinical Interventions in Aging, 12: , 1543–1552. |
183 | Yurko-Mauro, K. , McCarthy, D. , Rom, D. , Nelson, E. B. , Ryan, A. S. , Blackwell, A. ,... MIDAS Investigators. ((2010) ) Beneficial effects of docosahexaenoic acid on cognition in age-related cognitive decline. Alzheimer’s & Dementia, 6: (6), 456–464. |


