
Improvement in upper-limb UPDRS motor scores following fast-paced arm exercise: A pilot study
Abstract
Background:
The symptoms of patients with Parkinson’s disease (PD) have been shown to improve when they perform fast-paced rhythmic cycling movements with their lower limbs.
Objective:
Our goal in this pilot experiment was to test the feasibility and the benefits of a short exercise program involving fast-paced rhythmic movements of the upper limb for patients with PD.
Methods:
We used an experimental procedure that elicits large, fast-paced movements by the participants without the direct instructions to do so by the experimenter. Ten participants with PD (71.0±6.5 years old) performed a 50-min fast-paced rhythmic exercise of the upper limb after withdrawal from PD medication for at least 12 hours.
Results:
Participants improved their kinematic performance, in terms of accuracy and combined speed and amplitude (p < 0.02), as well as their upper-limb MDS-UPDRS motor scores (p = 0.023).
Conclusions:
The results demonstrate the feasibility of using the described apparatus to perform an exercise session of approximately 50 min with both arms, and give a preliminary indication of the potential benefit of such an exercise program.
1Introduction
1.1Background
Parkinson’s disease (PD) is a neurodegenerative disease that currently does not have a cure (Goetz & Pal, 2014). A variety of pharmacological (Goetz & Pal, 2014) and behavioral (e.g., Carpinella et al., 2017; Herman et al., 2007; Millage et al., 2017; Vergara-Diaz et al., 2017) approaches have been developed to mitigate its symptoms. Among the latter is an approach termed “Forced Exercise” (Alberts et al., 2011; Ridgel et al., 2009; Stuckenschneider et al., 2015). In Forced Exercise, the participants perform exercise (specifically, cycling (Ridgel et al., 2009; Stuckenschneider et al., 2015)) at a rate that is greater than their preferred voluntary rate of exercise. It has been demonstrated to lead to a global improvement in PD symptoms (Alberts et al., 2011; Ridgel et al., 2009; Stuckenschneider et al., 2015), and has been suggested to alter brain activation patterns in patients with PD (Alberts et al., 2016; Hirsch et al., 2016). Here, we tested whether a similar improvement in PD symptoms can be achieved by high-pace rhythmic exercise of the upper limb. Similarities between the effects of upper- and lower-limb exercises can inform therapy approaches. Our study was further motivated by studies demonstrating, with different body parts, that making larger, or accentuated movements can improve PD symptoms (e.g., the LSVT Loud (Miles et al., 2017) and the LSVT BIG (Millage et al., 2017) approaches).
We previously reported that PD patients make larger and faster movements when they perform repetitive movements of the forearm, and no visual feedback is available, compared to when visual feedback is available (Levy-Tzedek et al., 2011). This phenomenon has also been demonstrated in young and old healthy participants (Levy-Tzedek, 2017b; Levy-Tzedek et al., 2011b). In that series of experiments, it was demonstrated that the phenomenon did not diminish with awareness of it. That is, even though participants were aware that they were making larger and faster movements when no visual feedback was available, the participants continued to do so every time visual feedback was removed (Levy-Tzedek, 2017b; Levy-Tzedek et al., 2011b). That is contrary to the expectation that they would consciously reduce the size and speed of their movement as a result of this knowledge.
Here, we tested the applicability of this experimental paradigm as a rehabilitative tool, by inducing PD patients to produce large-amplitude fast movements of the upper limb.
We tested: (1) the effects of high-pace arm movements on the participants’ clinical scores; (2) the effects of changes in availability of visual feedback during the task on motor performance.
We hypothesized that: (1) the patients’ clinical scores would improve following the exercise program and that (2) movement kinematics will improve during the performance of the task. This improvement will be manifest by an increase in the amplitude, the speed, and the accuracy of their movement.
2Methods
2.1Participants
Eleven participants with PD, without orthopedic problems of the shoulder and elbow joints, or uncorrected vision impairment, were recruited to this study, and arrived at the clinic after an overnight withdrawal from dopaminergic treatment (participants abstained from taking their PD medication for at least 12 hours prior to the experiment). One of the participants reported not feeling well early on upon arrival to the clinic, and the session was subsequently terminated approximately 20 minutes after the start of the exercise session. This patient’s data were therefore not included in the following statistics. The average age of the participants (seven women and three men) was 71.0±6.5 years. All participants were right-hand dominant (self-reported), and gave their written informed consent to participate.
2.2Baseline & end-of-experiment tests
2.2.1Questionnaires
Upon arrival, patients were administered a custom-made questionnaire, in which they were asked about their medical history and the medications they take. Immediately after the end of the exercise session (detailed below) patients were administered a second custom-made questionnaire, in which they were asked how they felt during and after the exercise session, and whether they felt any different than before the exercise. Six-to-twelve hours following the exercise session, the participants were contacted by phone, and asked whether they experienced any change in symptoms compared to their usual state.
2.2.2Clinical scores
The MDS-UPRDS (Goetz et al., 2008) part III (Motor section) clinical score was recorded immediately before and immediately after the exercise session by one of two experimenters who were blinded to the procedure and to the goals of this study. These blinded experimenters were only present in the experiment room before and after the exercise session for the purpose of recording the UPDRS score, and were not aware that an exercise session took place.
The full MDS-UPRDS scale has four parts: (1) non-motor experiences of daily living; (2) motor experiences of daily living; (3) motor examination; and (4) motor complications. Here, we recorded only part III, which includes 33 score values on items relating to motor function. Each item can be assigned a value between 0–4, for maximal possible score of 132 on all items combined (the higher the score, the worse are the symptoms).
We anticipated that the coarse MDS-UPDRS part III scale would not be sufficiently sensitive in demonstrating changes following the brief intervention. We therefore calculated the scores for the upper limb, the lower limb, and the total score separately. The upper-limb score included upper-limb rigidity, finger tapping, hand movement, pronation-supination movement, postural and kinetic tremor of the hands and resting-tremor amplitude (items 3.3–3.6, and 3.15–3.17 of the MDS-UPDRS, with a maximal score of 56). The lower-limb score included lower-limb rigidity, toe tapping, leg agility, rising from chair, gait, freezing of gait and resting tremor of the lower limb (items 3.3, 3.7–3.11 and 3.17 of the MDS-UPDRS, with a maximal score of 40). The total score included all items in part 3 of the MDS-UPDRS, with a maximal score of 132.
Participants’ Mini-Mental State Examination (MMSE) score was recorded at the beginning of the session. MMSE is used for the evaluation of cognitive function. The Hebrew version of the test is clinically validated and evaluated at sensitivity rate of 88.9% and specificity rate of 68.4% (Werner et al., 1999).
2.2.3Kinematic reach test
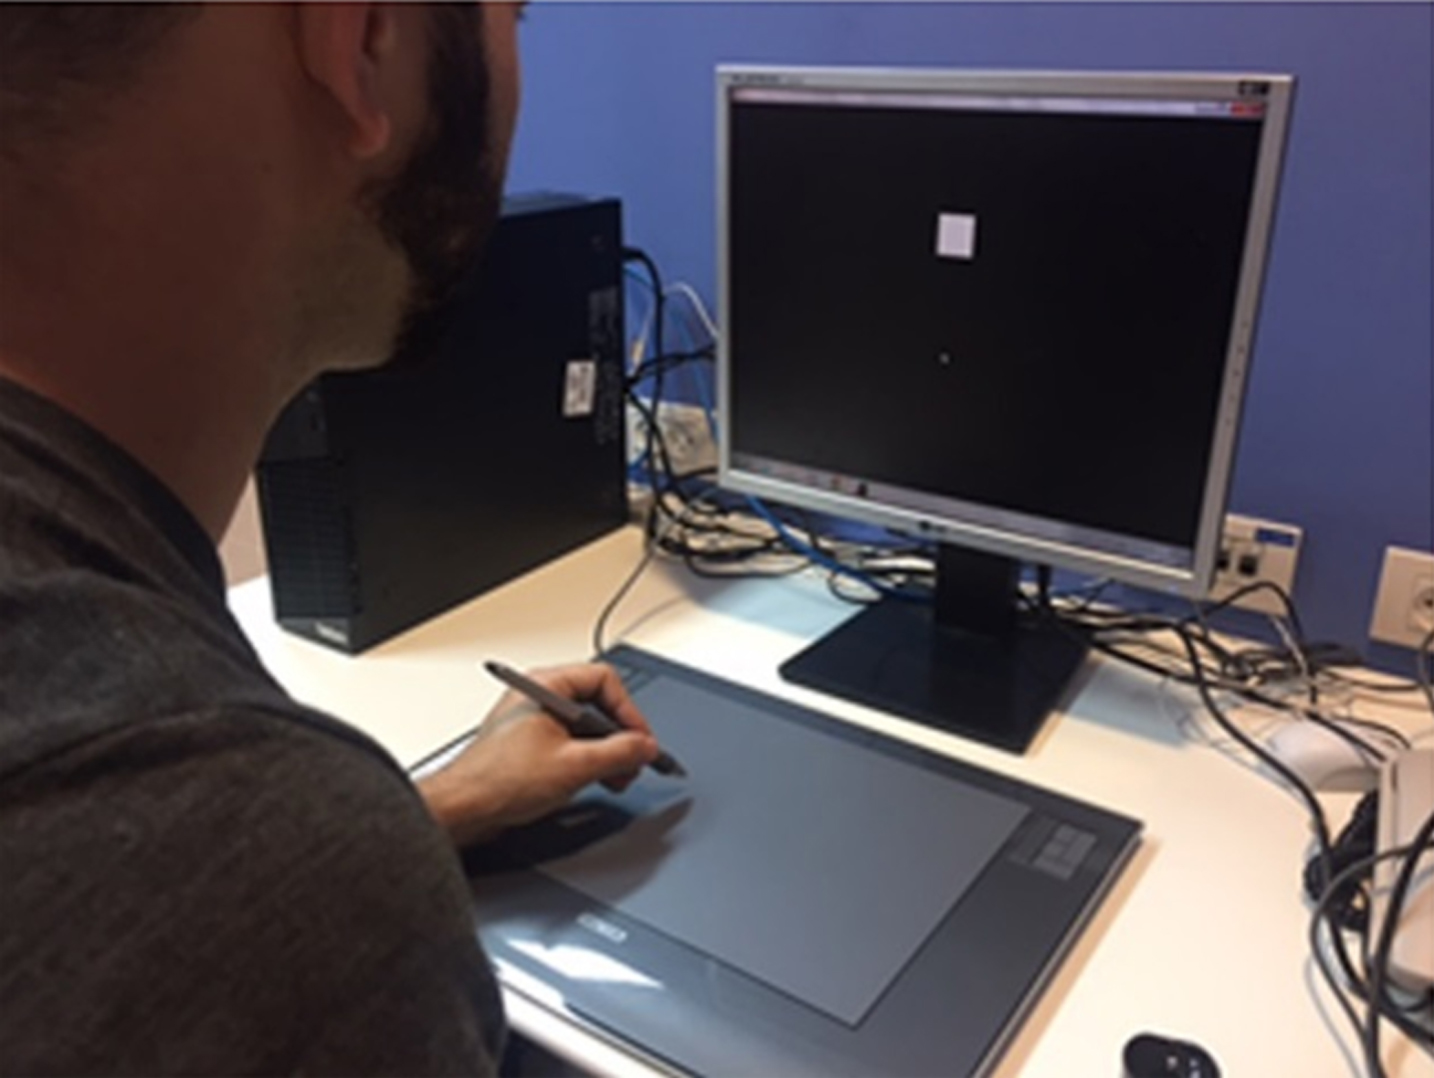
A simple reaching movement of the arm was recorded at the beginning and at the end of the session. Participants were asked to move a cursor between two points shown on the screen by moving a digital pen over a digitizing tablet (see Fig. 1). The distance between the beginning and end point on the tablet was 10 centimeters. Three reach movements with each arm (dominant and non-dominant) were recorded at the beginning and at the end of the session. For each reaching movement, we calculated the time it took to complete the movement, the path length (Levy-Tzedek et al., 2012; Levy-Tzedek et al., 2007; Levy-Tzedek et al., 2016) of the hand, the average and the peak speed in the direction of the movement.
Fig.1
The Reach Test. Shown here is an illustration of the experimental setup during the reach test, administered before and after the exercise set. The participant is holding a stylus above a digitizing tablet. He hovers the stylus at a small distance above the tablet from a starting position to a target shown on the screen as a white square. At the end of the reaching movement, the trace of the movement is shown on the screen. Written approval for use of these pictures for publication was obtained from the person photographed.
2.3Experimental setup
We used the experimental apparatus described in (Ben-Tov et al., 2012; Levy-Tzedek, 2017a, 2017b; Levy-Tzedek et al., 2011a; Levy-Tzedek et al., 2011b; Levy-Tzedek et al., 2010; Levy-Tzedek, Krebs, et al., 2011). It comprises an arm rest, connected to an encoder that records the rotation of the arm about the elbow with an accuracy of 0.002 degrees at 200 Hz. The arm rest was designed to be as light as possible, to minimize its effect on the natural movement of the arm. The arm rest was free to rotate around its axis, with no imposed limits on the range of motion. Participants placed their arm on the arm rest, situated parallel to the table on which it was mounted, and moved their forearm towards and away from their body in a movement similar to that of a windshield wiper. A cover was placed on the table, above the experimental apparatus, such that no direct visual information about the arm’s position was available throughout the exercise session. The forearm flexion/extension movements were one-dimensional, in the horizontal plane. No explicit timing cues were given. Participants wore a wrist brace on their arm, to avoid unintentional movements of the wrist. They received real-time feedback on their arm’s location and speed via a cursor that appeared on a computer screen placed on the table in front of them (see Fig. 2).
Fig.2
The experimental setup. The participant places her forearm on the armrest, below an opaque cover. She uses the movements of her forearm to control a cursor on a phase plane, displayed on a computer screen. The target zone in which the participant is instructed to keep the cursor is shown in gray. The red trace shows the amplitude (on the horizontal axis) and the speed (on the vertical axis) of the participant’s actual movement. Inset: the arm rest. Written approval for use of this picture for publication was obtained from the person photographed.
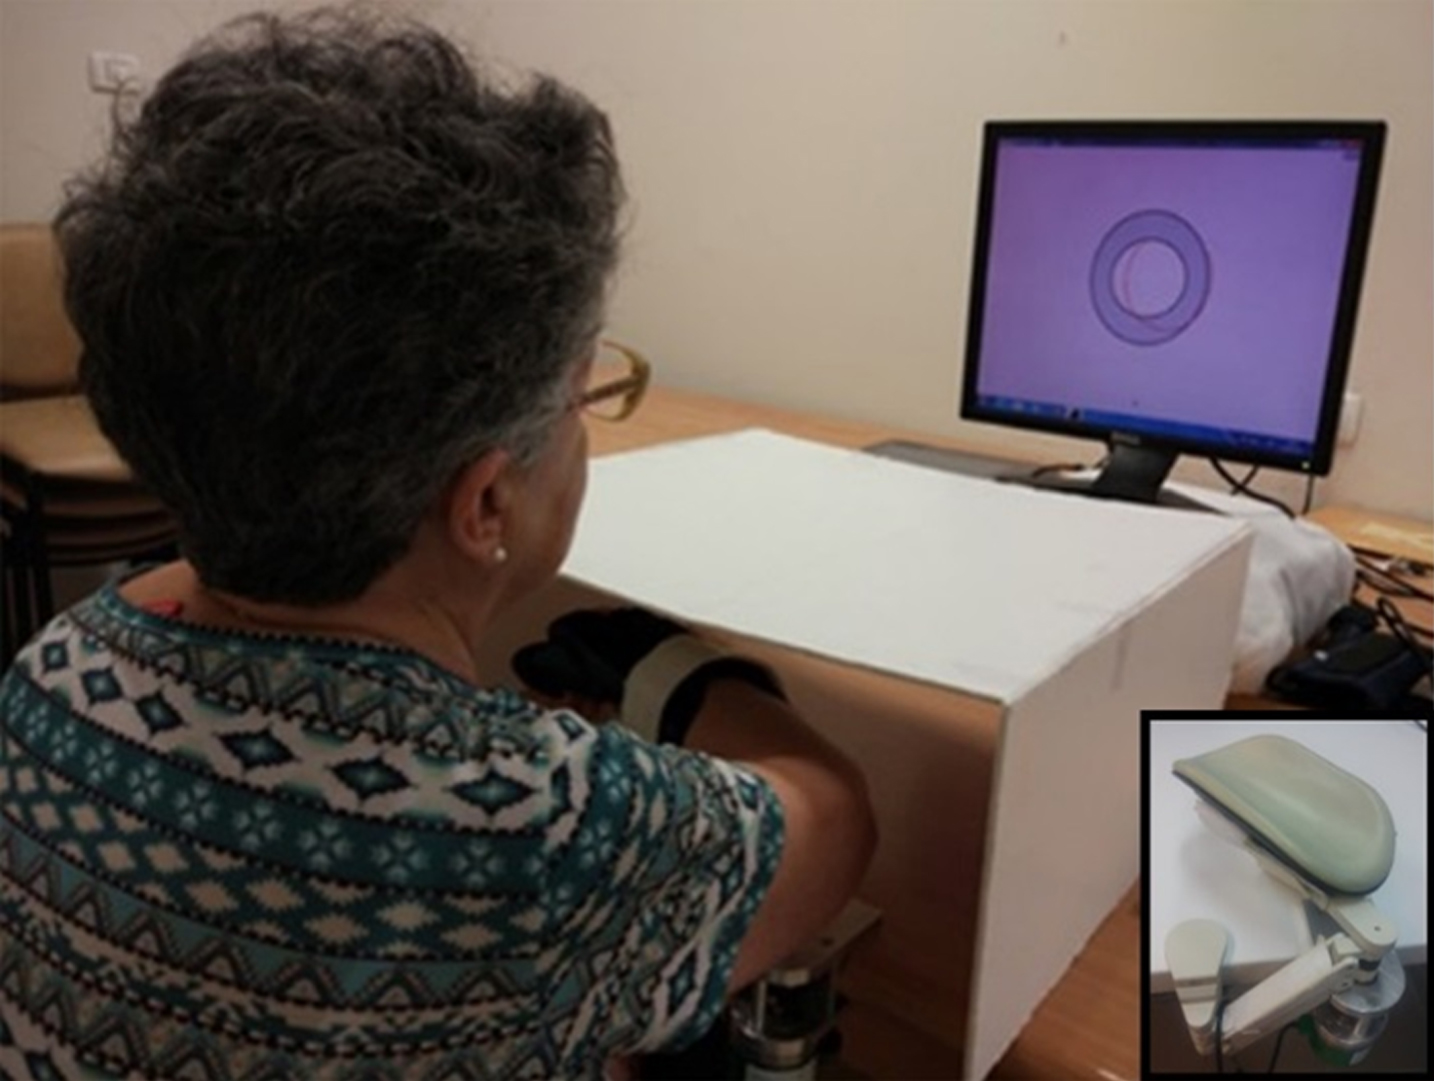
The computer screen displayed a phase plane: position was displayed on the horizontal axis, and velocity on the vertical axis. On that phase plane, a pair of concentric ellipses created an enclosed doughnut-shaped area, that defined the lower and the upper bounds of the amplitude (on the X axis) and speed (on the Y axis) allowed on the task (marked in gray in Fig. 2). The participants controlled a cursor on the phase plane with their arm movements. The speed of their movements was represented by the height of the cursor, and the displacement of their movement was represented by the horizontal location of the cursor. They were asked to maintain the cursor within the doughnut-shaped area at all times. Thus, the amplitude, speed and frequency of the movement were prescribed.
2.3.1Procedure
Overview: The experimental session was comprised of six parts: (1) Training for the dominant arm, followed by (2) six exercise trials with the dominant arm, then (3) training for the non-dominant arm, followed by (4) six exercise trials with the non-dominant arm, then (5) six exercise trials with the dominant arm, and (6) six exercise trials with the non-dominant arm.
Training. There were two training sessions: one for each arm (dominant and non-dominant). All participants started with a training session for the dominant arm, followed by six exercise trials with the dominant arm. Then the second training session was given, for the non-dominant arm.
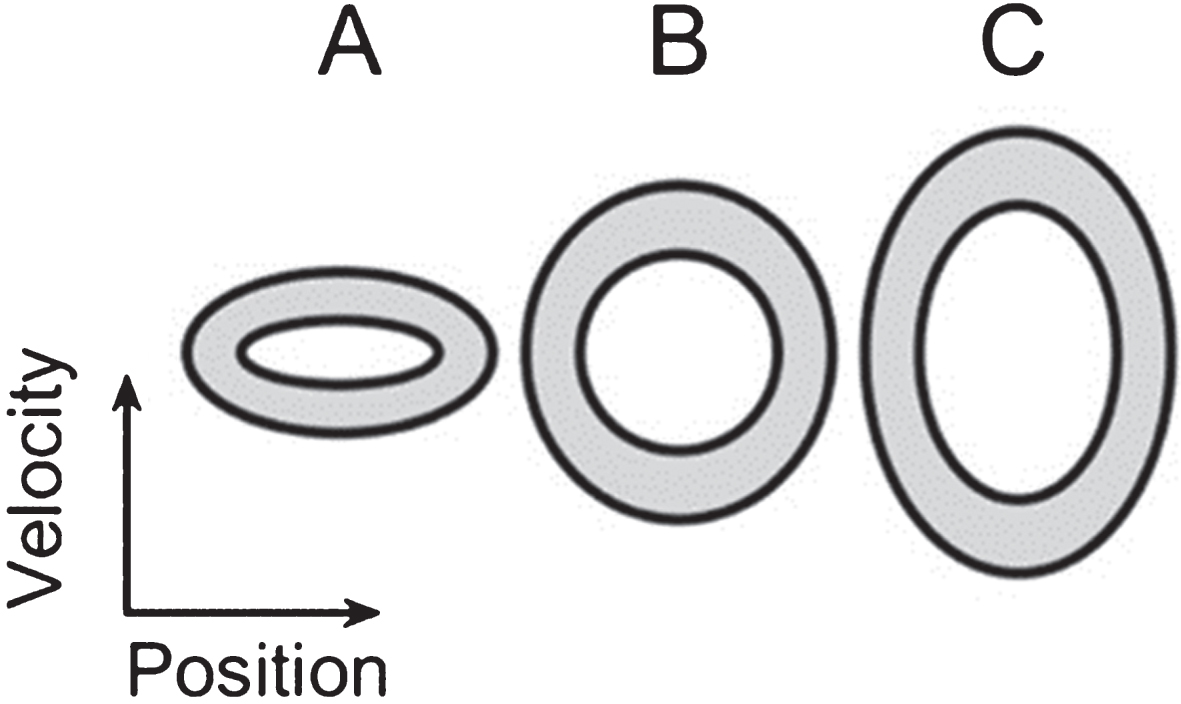
During the training phase participants practiced controlling their arm movements such that the cursor on the phase plane stays within the prescribed ellipse at three different “doughnut” sizes on the phase plane. These practice ellipses had central frequencies of 0.4 Hz, 1.1 Hz and 1.6 Hz, corresponding to ellipses A, B and C in Fig. 3, respectively. The participants were given the option to repeat these practice trials, each lasting 40 seconds, until they felt comfortable with the task. The order in which these practice ellipses was presented across participants was counterbalanced.
Fig.3
Target ellipses. An illustration of the relative size of the three ellipses shown on the phase plane during both the training session and the exercise session (A, B, and C, from left to right). The zone within which participants were instructed to keep the cursor is marked in gray. The vertical axis denotes velocity and the horizontal one denotes position.
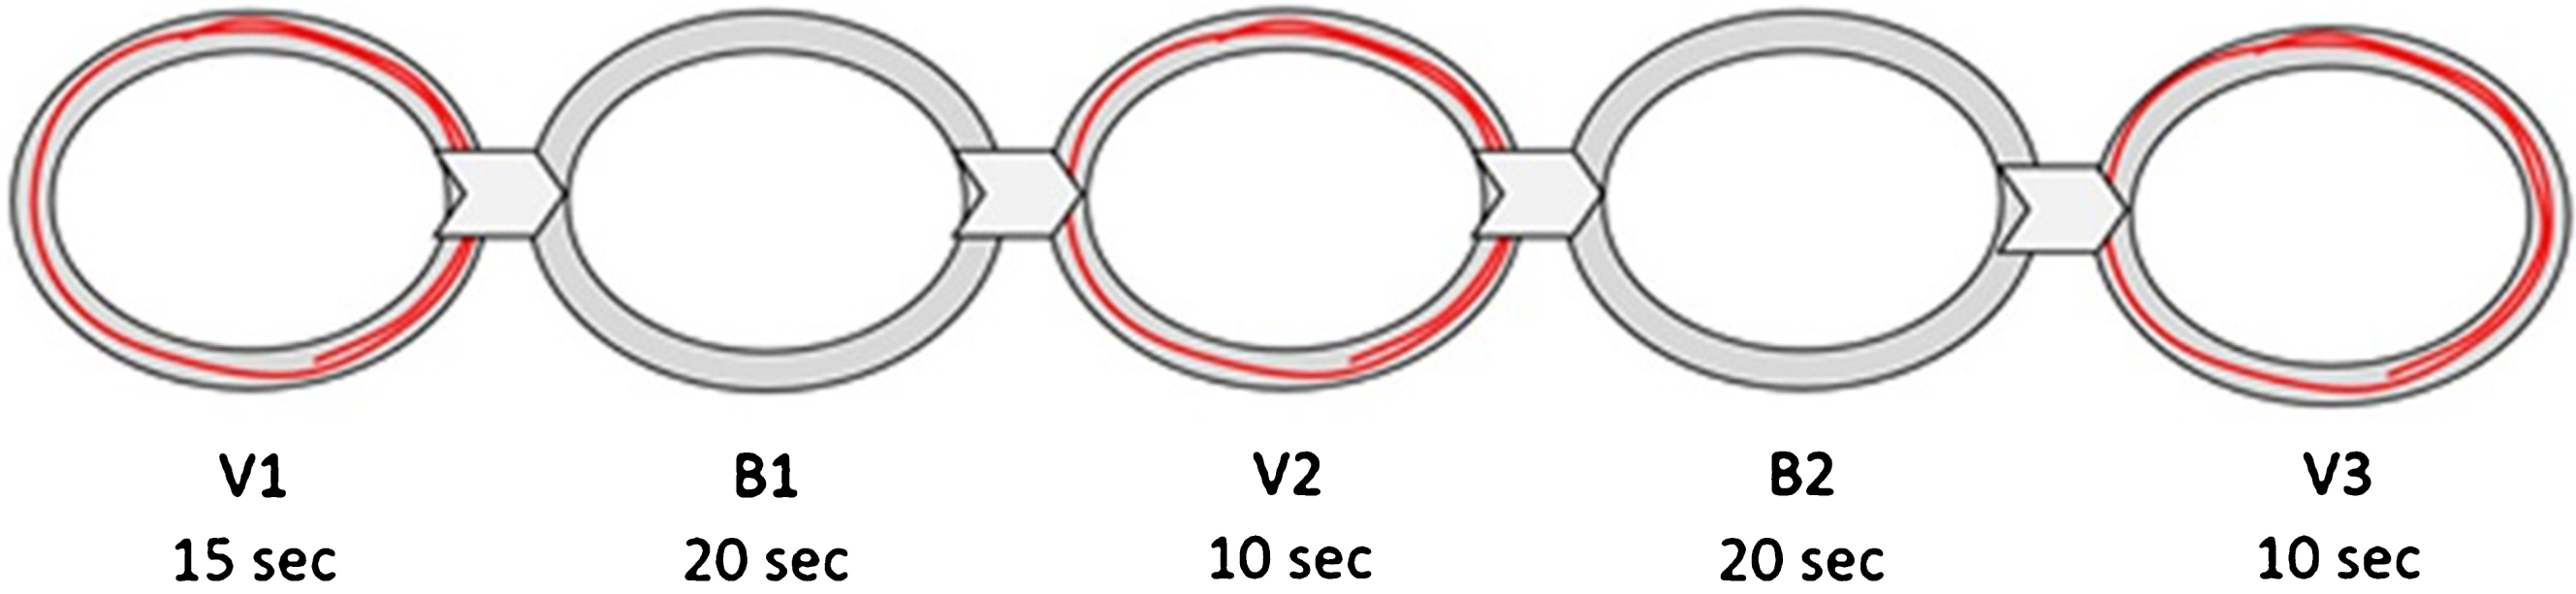
Exercise session. The exercise session comprised a total of 24 trials, 12 performed with each arm. Each trial lasted 75 seconds. The same ellipses that were used in the training session were used in the exercise session. However, during the exercise session, the cursor denoting the amplitude and the speed of the movement was available only during parts of each trial (the “visual” segments), and not during others (the “blind” segments; see Protocol below and Fig. 4). Each 75-sec trial consisted of five continuous segments, alternating between providing visual feedback (V), or withholding it (B). During the blind (no visual feedback) segments of each trial, participants were instructed to continue to perform exactly the same movement as they did when visual feedback was available. The segments with no visual feedback were identical to the segments with visual feedback, except the trace of the participants’ movement did not appear on the screen; they could see the target zone on the screen in front of them, but had no visual indication of their actual movement amplitude or speed. Each trial started and ended with visual feedback. The first visual segment (V1) lasted 15 sec. V1 was followed by a 20-sec blind segment (B1), a 10-sec visual segment (V2), another 20-sec blind segment (B2), and a final 10-sec visual segment (V3). An additional second was added at the beginning of V1 and another at the end of V3, and these were not included in the analysis, to avoid edge-effects.
Fig.4
An illustration of the five segments of each exercise trial. A gray area bounded by two concentric black ellipses mark the target area on the phase plane, within which participants are asked to maintain the cursor. During V1, V2 and V3, a red trace representing the forearm movement is displayed on the screen. During B1 and B2, the trace of the movement is not displayed on the screen. The time span for each segment is marked below the segment name.
2.3.2Target speeds
All three ellipses (A, B and C, shown in Fig. 3) had the same width on the x axis, with a target arm amplitude of 20±3°, corresponding to a visual angle of ∼6 degrees. The difference in the height of the three ellipses corresponded to a difference in target peak speed: 24 deg/sec for ellipse A (central frequency = 0.4 Hz), 68 deg/sec for ellipse B (central frequency = 1.1 Hz) and 98 deg/sec for ellipse C (central frequency = 1.6 Hz).
Three semi-random sequences of the three target ellipses were generated, and each participant performed one of these three sequences.
Ethical approval for this study was obtained from the Helsinki Committee at the Soroka hospital where the study was conducted. All experimental procedures were performed in accordance with this ethical approval.
2.4Kinematic outcome measures
The following outcome measures were calculated separately for each of the five trial segments (V1, B1, V2, B2, V3).
Phase-plane area: We calculated the area taken up on the phase plane by the movements of the participants, thereby capturing the concurrent changes in both amplitude and speed (Levy-Tzedek, 2017b; Levy-Tzedek, Ben Tov, et al., 2011b). The area was calculated per movement cycle, and averaged across each segment.
To facilitate comparison across ellipse sizes, and across participants, the values from each segment were normalized by the values obtained in the first visually guided segment (V1) (Levy-Tzedek, 2017a; Levy-Tzedek, Ben Tov, et al., 2011b) (the normalization was performed per individual). In this manner, it is possible to capture the overall relative changes over the five trial segments, despite individual differences in initial values.
Accuracy: Each trial segment was given a numerical score that represented the percent of the total trial time that was spent inside the target zone on the phase plane (Levy-Tzedek, 2017b; Levy-Tzedek et al., 2010) (marked in gray in Figs 2–4). The values were normalized to the first visual segment, as detailed above.
Peak speed: The maximum absolute angular velocity in each half cycle was calculated, and averaged across each trial.
Both kinematic and clinical outcomes were recorded and averaged across both the right and the left sides, despite the nature of PD, which is often primarily dominant on one side of the body. We took this conservative approach, rather than restricting the analysis to the dominant side for two main reasons: (1) while one side is often more affected, it is common to suffer some impairment on the non-dominant side as well; (2) we are interested in the implications of using this exercise for everyday life, where patients engage both sides of the body, and so the combined ability – as manifest in both kinematic data and MDS-UPDRS scores – was chosen to reflect that.
2.5Statistical analysis
To test the hypothesis that movement kinematics will improve between the first and the last visual segments of each trial (V1 and V3, respectively), we used a two-sided Wilcoxon signed rank test. We tested whether the difference in phase-plane area and accuracy between these two visual segments has a distribution whose median is different from zero. The same statistical test was used to compare the MDS-UPDRS motor scores before and after the exercise. We separately compared the results of the upper limb, the lower limb, and the total MDS-UPDRS motor score. To account for multiple comparisons, the conservative Bonferroni correction was applied, and the significance threshold was set at p = 0.025. A non-parametric test was chosen for the hypothesis testing to eliminate the need for assumptions regarding population distributions required in parametric tests.
3Results
The participants’ baseline data are shown in Table 1. All participants had normal or corrected-to-normal vision. None had deep-brain stimulators (DBS).
Table 1
Baseline and training data for the study participants
| Participant | age | gender | PD dominance | years since diagnosis | Other neurological problems? | MMSE score | PD medication | Number of training trials |
| 1 | 77 | F | L | 7 | No | 30 | Rasagiline, Levodopa-Carbidopa | 6 |
| 2 | 59 | M | R | 2 | No | 30 | Rasagiline, Ropinirole | 8 |
| 3 | 78 | F | L | 5 | No | 30 | Rasagiline, Levodopa-Carbidopa | 7 |
| 4 | 66 | F | L | 14 | No | 30 | Rasagiline, Levodopa-Carbidopa | 7 |
| 5 | 76 | M | / | 2 | No | 24 | Rasagiline | 5 |
| 6 | 68 | F | L | 1 | No | 28 | Levodopa-Carbidopa | 7 |
| 7 | 69 | F | L | 15 | No | 27 | Rasagiline, Stalevo, Amantadine | 8 |
| 8 | 81 | M | / | 5 | memory loss | 19 | Levodopa-Carbidopa, Amantadine | 6 |
| 9 | 66 | F | L | 1 | No | 30 | Amantadine | 7 |
| 10 | 70 | F | R | 3 | No | 27 | Rasagiline, Amantadine | 6 |
All information in the table (except for MMSE score and number of training trials) is self-reported. Marked in bold are MMSE scores which are lower than normal for the patient’s age and years of education.
3.1Reach test
None of the parameters tested showed a statistically significant difference between the pre-exercise and the post-exercise reach movements, despite an encouraging trend in the average values, which show a faster, longer movement following the exercise (see Table 2). It should be noted that many participants had a hard time following the instruction of how to hover the digital pen over the digitizing tablet at a set distance, potentially leading to some of the movement data not being recorded in full.
Table 2
Reach test kinematics
| Pre-exercise | Post-exercise | Effect size | p-value | |
| Path length (cm) | 8.4±2.1 | 9.4±2.2 | 0.4 | 0.275 |
| Average speed (cm/sec) | 5.7±2.9 | 7.5±4.8 | 0.5 | 0.375 |
| Peak speed | 11.6±5.3 | 14.0±8.3 | 0.3 | 0.432 |
| Time to complete reach (sec) | 1.6±0.6 | 1.7±0.9 | 0 | 1.0 |
3.2Exercise session
A total of 237 trials were recorded and analyzed across the 10 patients. On average, it took participants 49.1±3.1 minutes to complete the exercise session, following the initial practice session. Participants performed between 5–8 practice trials (see Table 1).
3.3Kinematics
3.3.1Phase-plane area
The average normalized phase plane area increased by 31% from the first visual segment (V1) to the last visual segment (V3; p = 0.014). That is, when averaging across all three ellipse sizes (A, B, C), and across both arms (dominant and non-dominant), participants ended each trial with a combined increase in amplitude and speed of 31% compared to the start of the trial (see Fig. 5, left panel). Such a sizable increase, despite clearly delineated target amplitudes and speeds (in the form of a target zone on the screen), was possible since patients often did not stay within the required target zone even when visual feedback was available (see, for example, Fig. 6, and (Levy-Tzedek, Krebs, et al., 2011)). The change in accuracy during a trial, reported below, suggests that this increase in phase-plane area led to an overall improvement in accuracy.
Fig.5
Performance across the five trial segments. For clarity, all segment values are normalized by the first segment of each trial (V1). Left: Normalized phase-plane area values; Right: normalized accuracy scores. Error bars represent standard error.
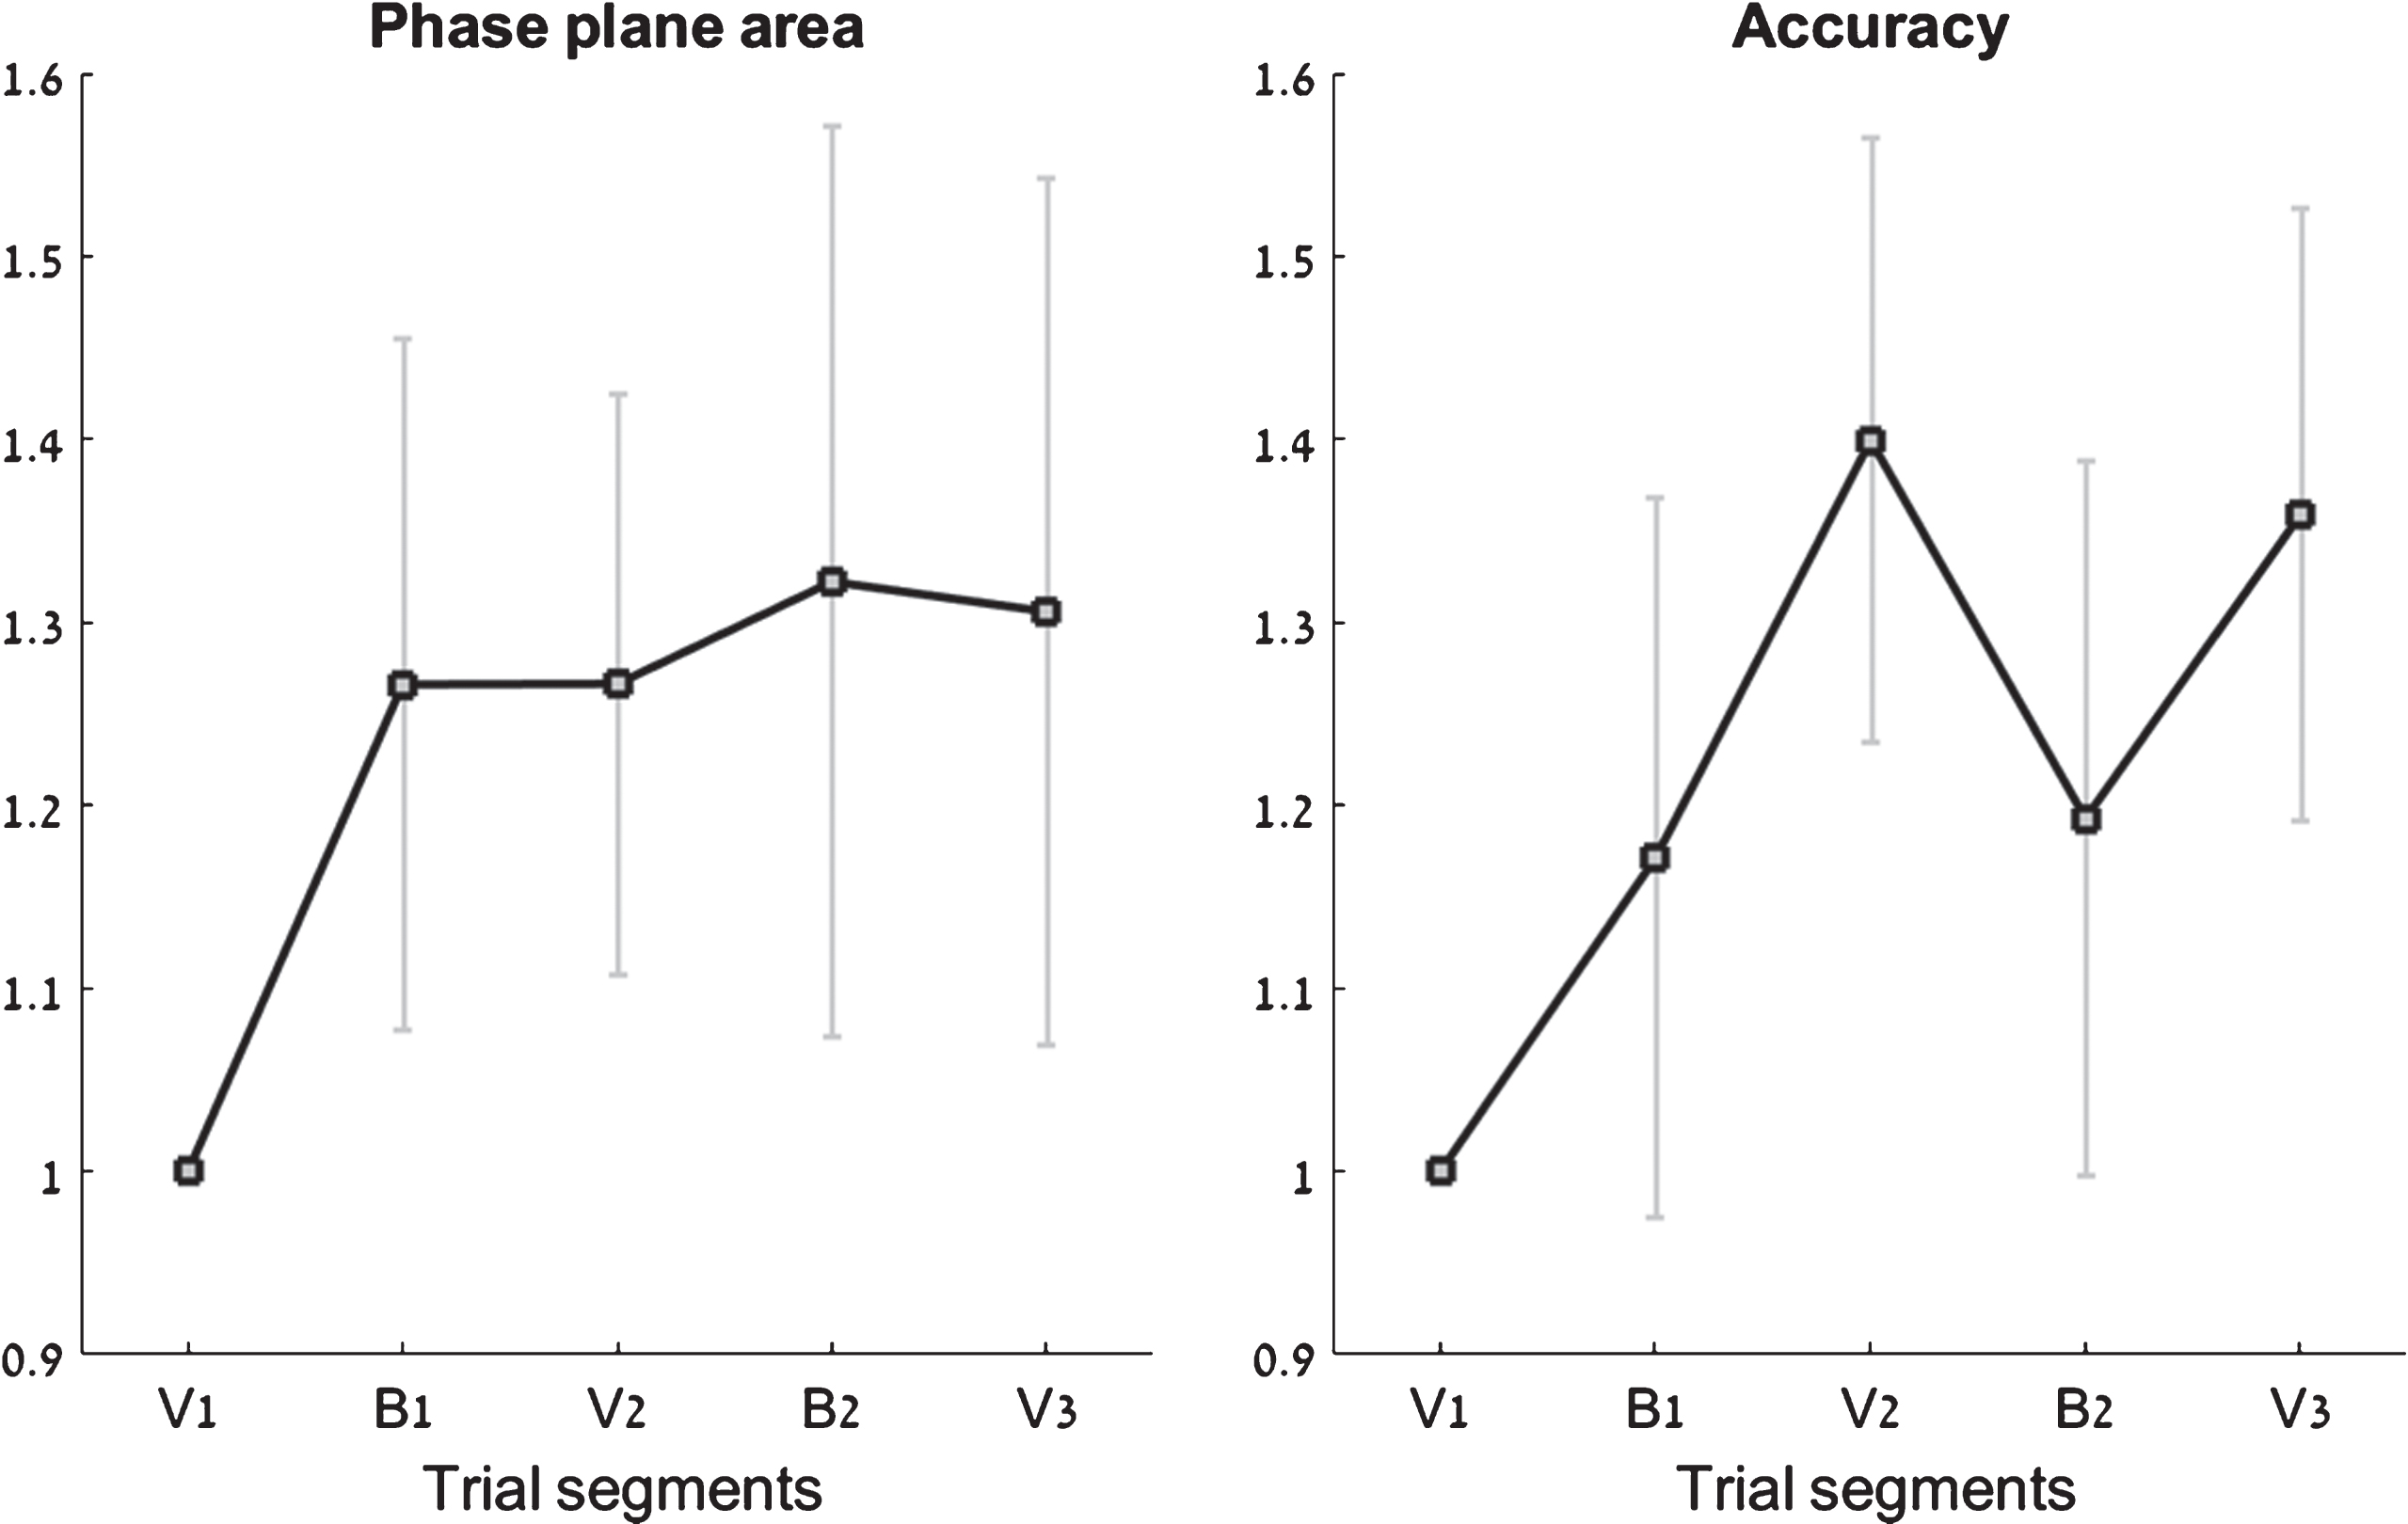
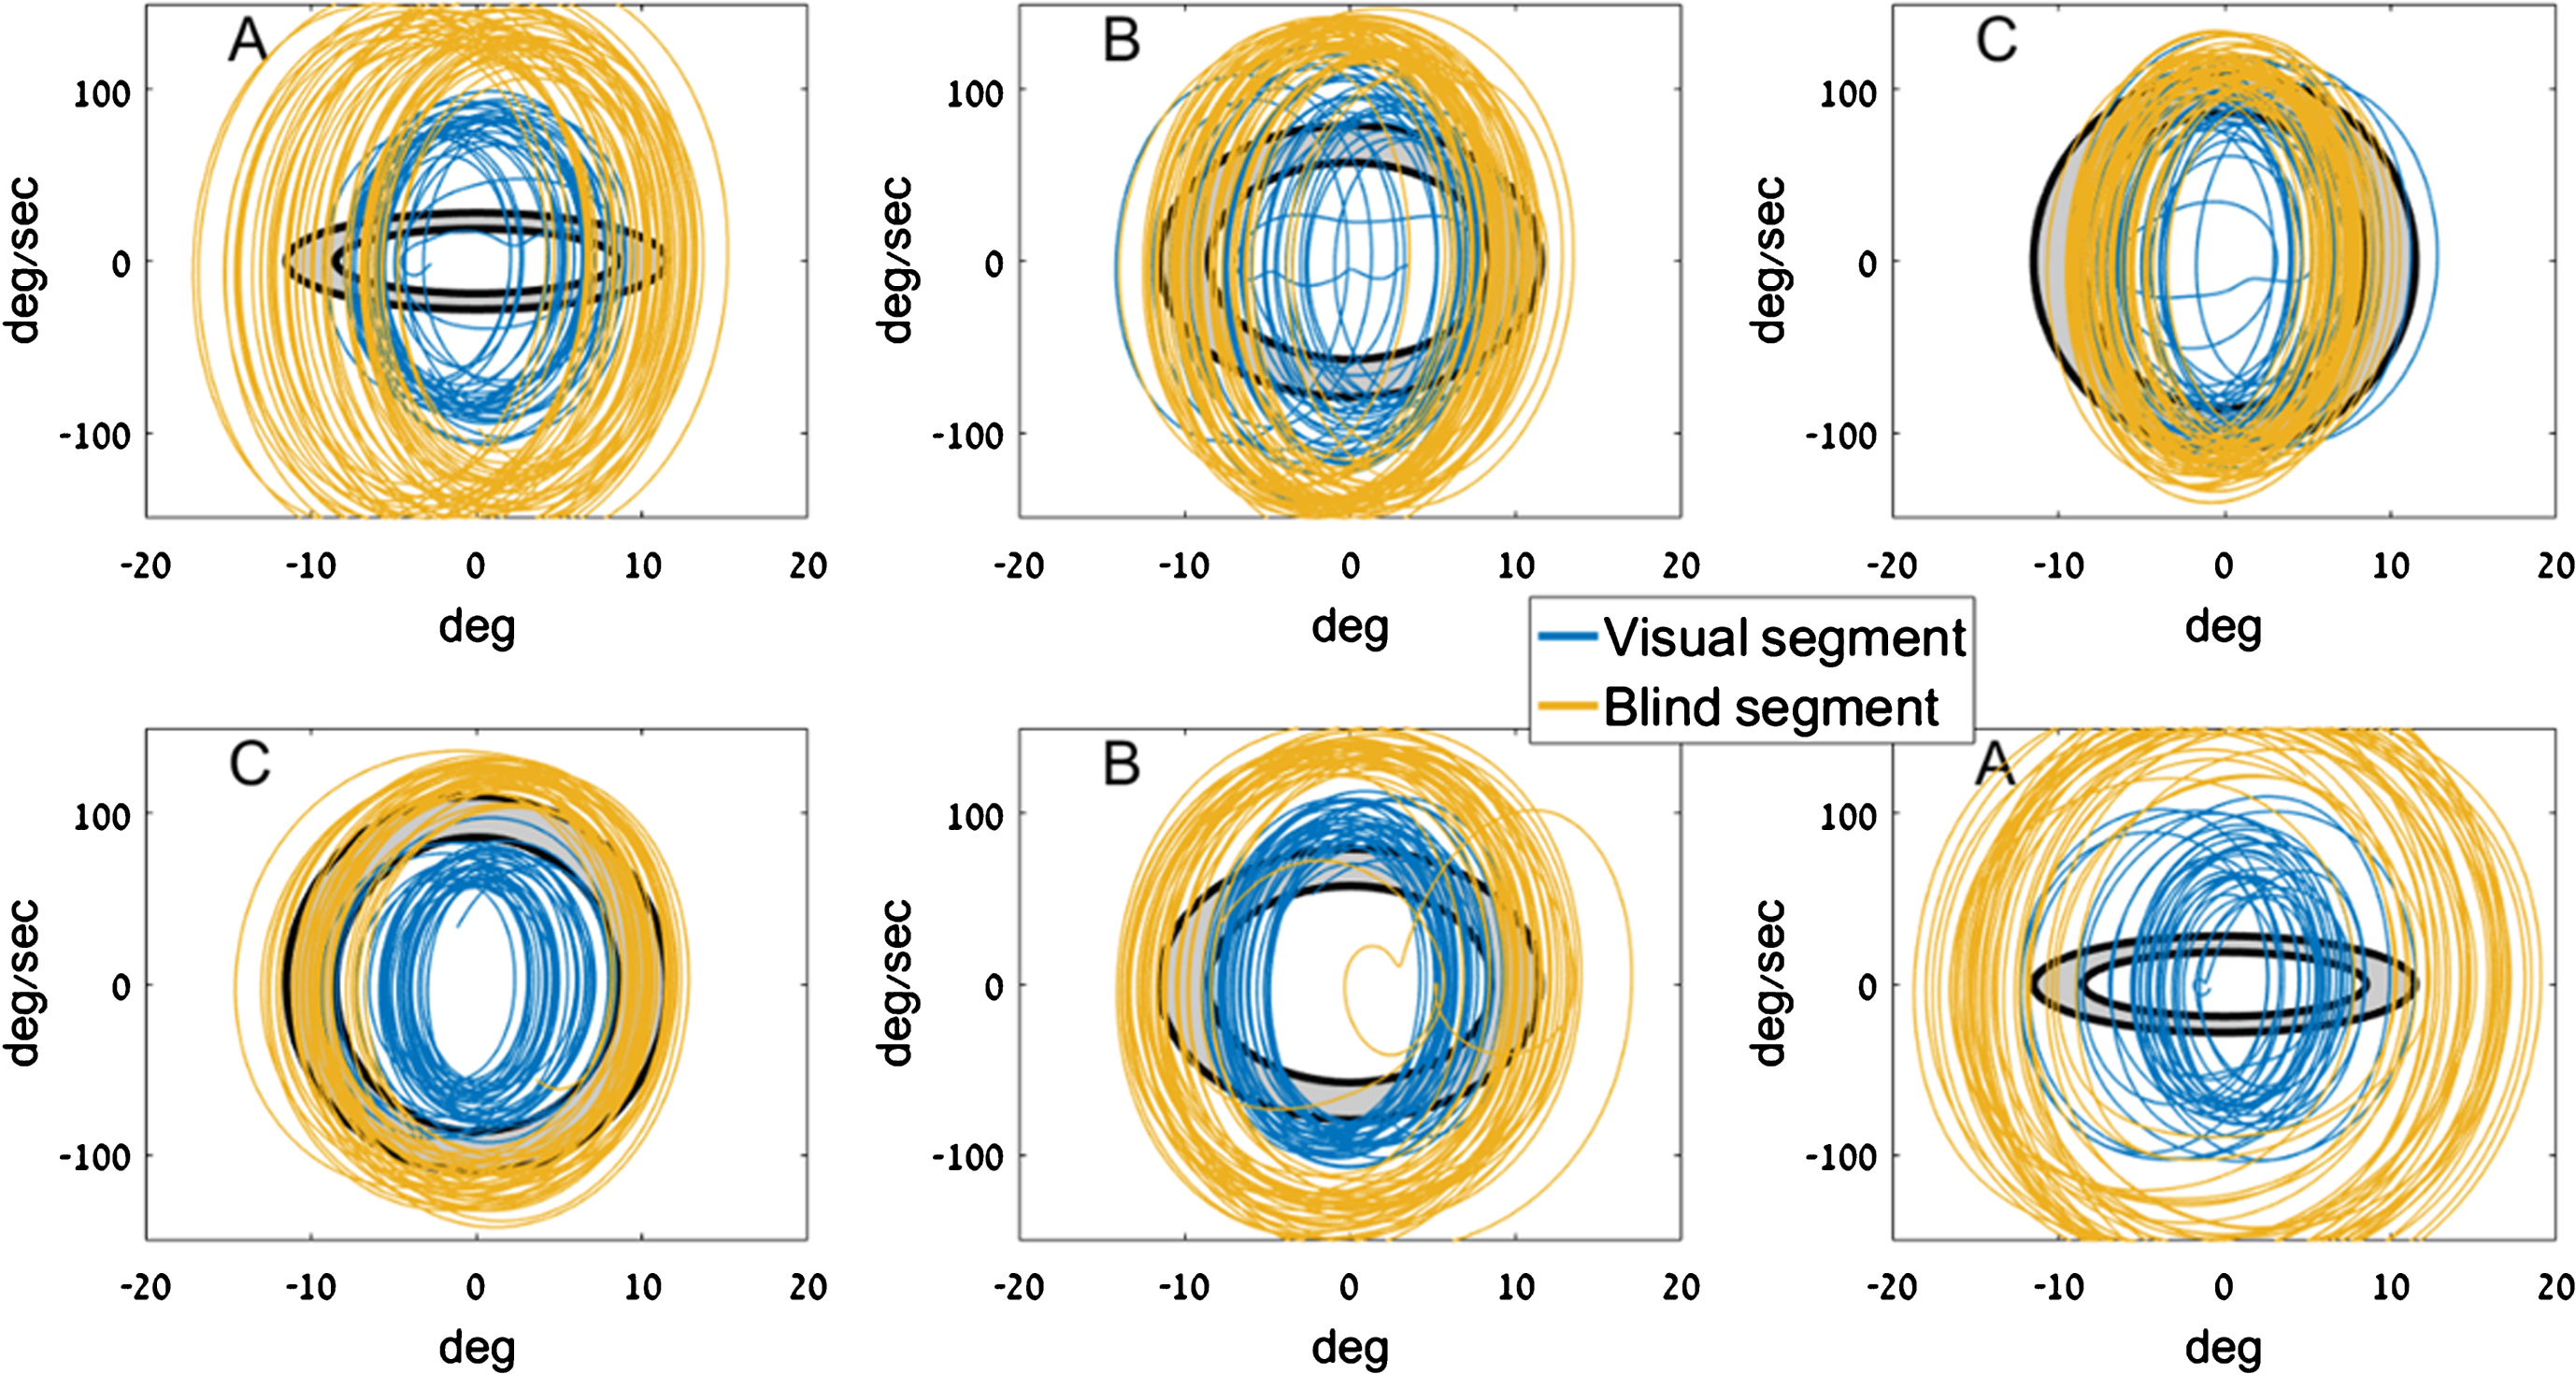
Fig.6
Sample traces from two participants. Each row shows three consecutive trials by a single participant. The letter at the top left denotes the target ellipse size. The target zone on the phase plane is marked in gray, bounded by two concentric black ellipses. Shown in blue are traces from the V1(visual) segment, and in mustard are traces from B2 (no visual feedback). Movements in B2 are consistently larger and faster than movements in V1.
As expected from previous studies (Levy-Tzedek, 2017b; Levy-Tzedek et al., 2011b; Levy-Tzedek, Krebs, et al., 2011), there was an increase in phase-plane area upon the first removal of visual feedback (from V1 to B1). Unlike results in healthy young and old individuals (Levy-Tzedek, 2017b; Levy-Tzedek et al., 2011b), who show a “zigzag” pattern in phase-plane area when alternating between visual feedback and no visual feedback, the phase-plane area in the current experiment roughly plateaued after B1.
3.3.2Accuracy
The average normalized accuracy increased by 36% from the first visual segment (V1) to the last visual segment (V3; p = 0.002). That is, when averaging across all three ellipse sizes (A, B, C), and across both arms (dominant and non-dominant), participants ended each trial with an accuracy score that is 36% better than at the start of the trial (see Fig. 5, right panel).
3.3.3Peak speed
Interestingly, the average peak speed was similar across all three ellipses, despite the requirement for very different target peak speeds. The average peak speed was 81 deg/sec, 78 deg/sec, and 81 deg/sec for ellipses A, B and C, respectively. It appears that the participants either did not aim, or were not able to adjust their movement speed based on the visual display (see, for example, Fig. 6, (c.f., Levy-Tzedek, Krebs, et al., 2011)).
3.4Clinical scores
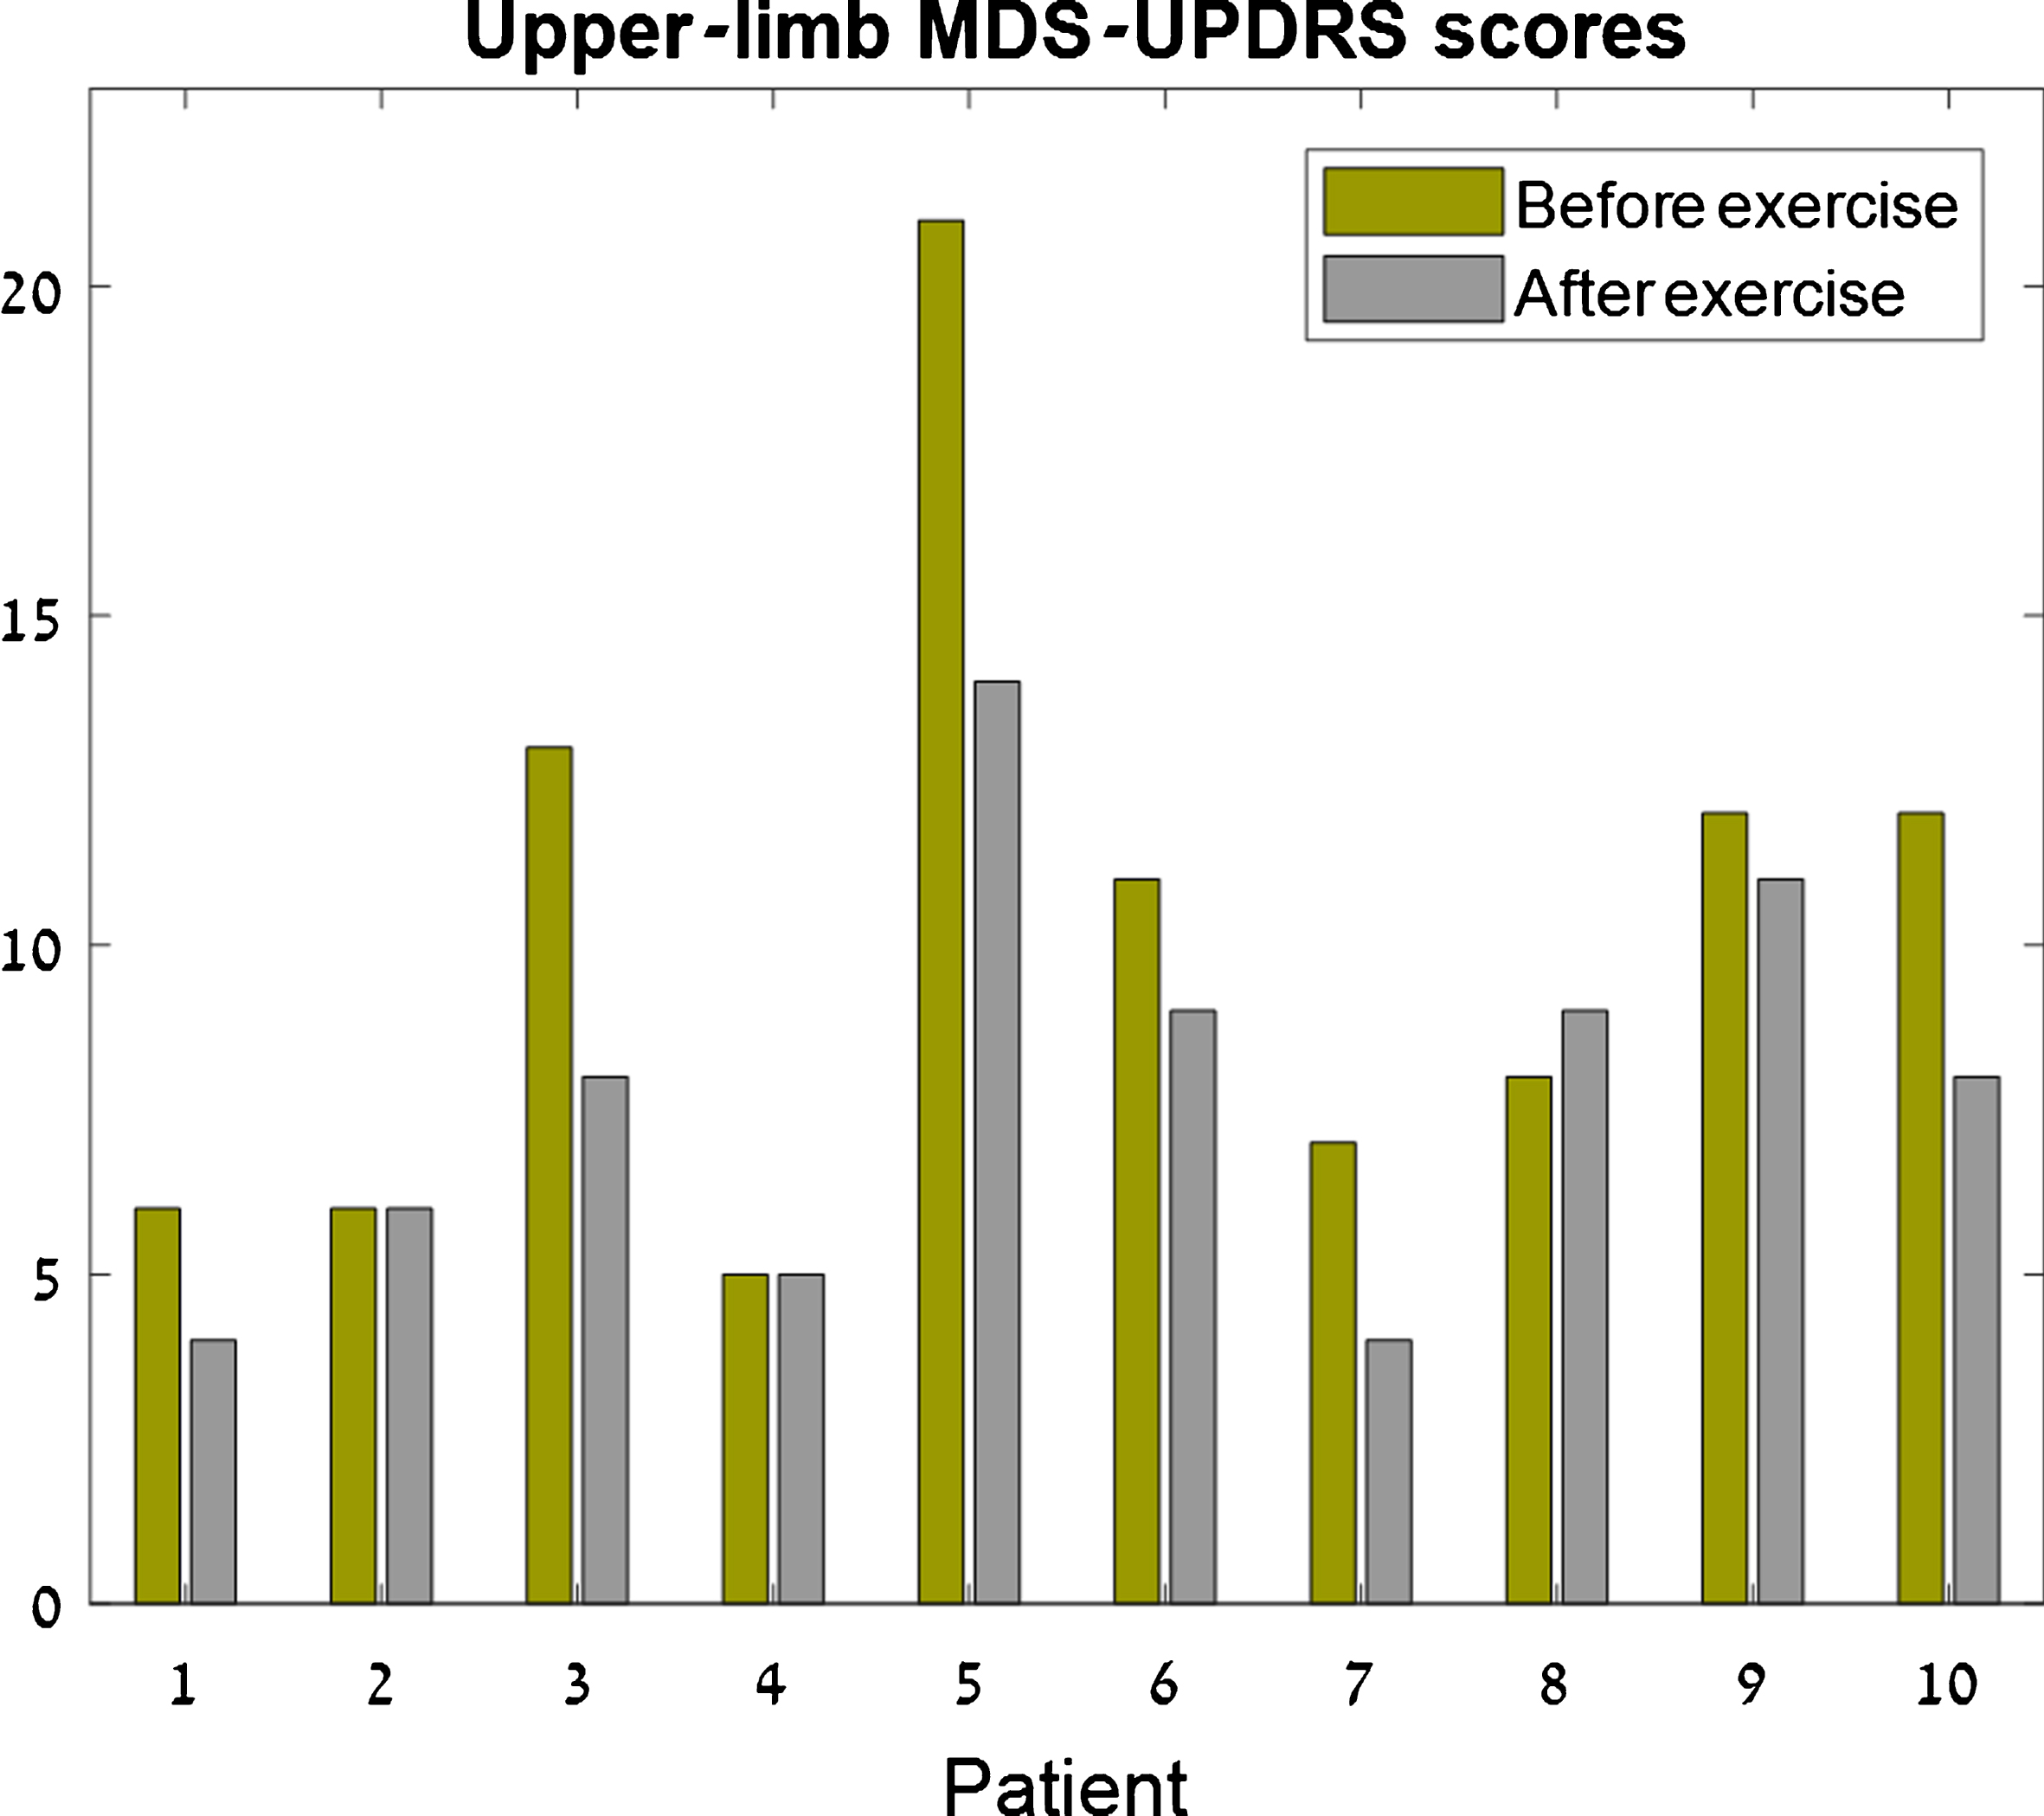
The upper-limb MDS-UPDRS scores were significantly better (lower) after the exercise program (p = 0.023; pre-exercise score = 10.1±4.8, post-exercise score = 7.8±3.2). These scores were improved in seven of the 10 participants (an improvement of between 1–7 points), and remained unchanged in two participants. A single participant had a 1-point worsening on the upper-limb MDS-UPDRS score, out of a maximal possible score of 56 (see Fig. 7).
Fig.7
Upper-limb MDS-UPDRS scores. For each patient, the left bar (green) represents the clinical score before the exercise and the right bar (gray) represents the clinical score after the exercise. Seven patients had improved (lower) scores following the exercise, two maintained the same score, and one patient had a 1-point worsening of the score.
There was no significant difference in the lower-limb scores (p = 0.64; pre-exercise score = 4.8±3.4, post-exercise score = 3.6±3.1), or the total MDS-UPDRS motor score (p = 0.15; pre-exercise score = 19.9±9.2, post-exercise score = 16.2±5.5). Seven of the 10 participants showed an improvement in total score (of 1–21 points), one participant’s score remained unchanged, and two had a worse score following the exercise (of 1 and 8 points, out of 132 maximal possible score).
3.4.1Post-experimental questionnaires
At the end of the experiment, when asked how they feel, five of the 10 participants reported feeling fatigued and that their movements were slower, and the other five reported no change. In the phone interview that was conducted 6–12 hours following the exercise, one participant reported feeling nauseated, while all others reported no change from normal.
4Discussion
In this pilot study, 10 PD patients off medication performed fast-paced rhythmic movements of the upper limb for approximately 50 minutes. We found a significant improvement in upper-limb MDS-UPDRS score, along with an improvement in accuracy, and a combined increase in amplitude and speed of the movement. We thus corroborated both our hypotheses.
These improvements are consistent with the results of previous studies (Alberts et al., 2011; Alberts et al., 2016; Ridgel et al., 2009; Stuckenschneider et al., 2015), where a rhythmic movement of the lower limb led to an improvement in UPDRS score. The lack of improvement in participants’ lower limb and global scores in the current experiment might be explained by the difference in the protocols between those previous studies and the current one: The previous studies had participants cycle on a bicycle, which involves the whole body, over multiple sessions, whereas in the current study, participants moved a single arm at a time, during a single session.
The results reported here add to the large body of literature indicating that larger or faster movement is possible in PD, given the appropriate cues (e.g., Farley & Koshland, 2005; Ridgel et al., 2009; Schlesinger et al., 2007). Importantly, the apparatus used here is one that enables the patient to exercise in the absence of another person who prompts the larger or faster movement, offering the possibility to self-train. The improvement in amplitude and speed of the movement, upon removal of visual feedback, also reported in the case of handwriting (Ondo & Satija, 2007; Potgieser et al., 2015), suggests that the ability to produce sufficiently large and fast movements in a feed-forward manner is not impaired in PD, while the ability to do it based on visual feedback is impaired.
When visual feedback was available, the PD patients were not able to maintain the cursor inside the target zone (see Fig. 6 and Levy-Tzedek et al., 2011). These findings support the hypothesis that PD impairs the ability to accurately control the sensorimotor loop (Fling et al., 2018). It also suggests that the availability of visual feedback is not uniformly helpful (as in, e.g., Jo et al., 2016), and depends on the specifics of the task.
If the exercise session had no effect on their symptoms, a deterioration in MDS-UPDRS motor score could be expected due to elapsed time since taking their last PD medication, and due to fatigue, as a result of the exercise. The improvement in symptoms in the upper limb is thus counter to expectation, and is encouraging. It is worth noting that the improvement in the score was in contrast to the participants’ self report of fatigue, slowness of movement, or no change, at the end of the experiment.
While these results are encouraging, a longer-term study with a larger group of patients should examine the long-term effects of such an intervention.
It should be stressed that, as noted in the Introduction section, the performance of larger and faster movements in the absence of visual feedback is not unique to patients with PD, but is a robust finding, recorded in both young and old healthy adults, in a variety of initial speeds and amplitudes (Doeringer & Hogan, 1998; Levy-Tzedek, 2017b; Levy-Tzedek et al., 2011b; Levy-Tzedek, Krebs, et al., 2011), and does not diminish with awareness of this tendency (Levy-Tzedek, 2017b; Levy-Tzedek et al., 2011b). For patients with PD, it offers an opportunity to increase the amplitude and the speed of the movement without the need for another person to serve as a partner in the exercise, and to set a higher pace than baseline (compare with Alberts et al., 2011).
5Study limitations
This pilot study was conducted on a relatively small group of patients, who were off medication, and participated in a single session. While these results are encouraging, a longer-term study with a larger group of patients on medication should examine the long-term effects of such an intervention. Testing patients that take their normal medication regimen would be valuable in determining whether the exercise and the medication effects are additive. Furthermore, future experiments should include a control condition in which there is no removal of visual feedback to test whether the resultant increase in amplitude and speed underlies the improvement in symptoms.
6Conclusions
Fast-paced rhythmic movement of the arm was demonstrated to lead to an improvement in upper-limb MDS-UPDRS scores, as well as kinematic measures of the movement (accuracy and combined amplitude and speed of the movement). A longer intervention period is needed to determine the long-term effects of such an exercise program.
Acknowledgments
The authors wish to thank Avital Elishay for technical assistance. The research was partially supported by the Helmsley Charitable Trust through the Agricultural, Biological and Cognitive Robotics Initiative and by the Marcus Endowment Fund, both at the Ben-Gurion University of the Negev. Financial support was provided by the Brandeis Leir Foundation, the Brandeis Bronfman Foundation, the Promobilia Foundation and the Borten Family Foundation grants. This research was also supported by the Israel Science Foundation (grants No. 535/16 and 2166/16).
References
1 | Alberts J.L , Linder S.M , Penko A.L , Lowe M.J , Phillips M. ((2011) ). It is not about the bike, it is about the pedaling:Forced exercise and Parkinson’s disease. Exercise and SportSciences Reviews, 39: (4), 177–186. |
2 | Alberts J.L , Phillips M , Lowe M.J , Frankemolle A , Thota A , Beall E.B , … Ridgel A.L. ((2016) ). Cortical and motorresponses to acute forced exercise in Parkinson’s disease. Parkinsonism & Related Disorders, 24: , 56–62. |
3 | Ben-Tov M , Levy-Tzedek S , & Karniel A. ((2012) ). The effects ofrhythmicity and amplitude on transfer of motor learning.. PLoSOne, 7: (10), e46983. |
4 | Carpinella I , Cattaneo D , Bonora G , Bowman T , Martina L , Montesano A , & Ferrarin M. ((2017) ). Wearable sensor-basedbiofeedback training for balance and gait in Parkinson disease: Apilot randomized controlled trial. Archives of Physical Medicine and Rehabilitation, 98: (4), e623. |
5 | Doeringer J , & Hogan N. ((1998) ). Intermittency in preplannedelbow movements persists in the absence of visual feedback. Journal of Neurophysiology, 80: (4), 1787. |
6 | Farley B.G , & Koshland G.F. ((2005) ). Training BIG to move faster:The application of the speed– amplitude relation as arehabilitation strategy for people with Parkinson’s disease. Experimental Brain Research, 167: (3), 462–467. |
7 | Fling B.W , Curtze C , & Horak F.B. ((2018) ). Gait asymmetry inpeople with Parkinson’s disease is linked to reduced integrity ofcallosal sensorimotor regions. Frontiers in Neurology, 9: , 215. |
8 | Goetz C.G , & Pal G. ((2014) ). Initial management of Parkinson’s disease. women, 9: , 11. |
9 | Goetz C.G , Tilley B.C , Shaftman S.R , Stebbins G.T , Fahn S , Martinez-Martin P , … Dodel R. ((2008) ). Movement DisorderSociety-sponsored revision of the Unified Parkinson’s Disease RatingScale (MDS-UPDRS): Scale presentation and clinimetric testingresults. Movement Disorders, 23: (15), 2129–2170. |
10 | Herman T , Giladi N , Gruendlinger L , & Hausdorff J.M. ((2007) ). Six weeks of intensive treadmill training improves gait and qualityof life in patients with Parkinson’s disease: A pilot study. Archives of Physical Medicine and Rehabilitation, 88: (9), 1154–1158. |
11 | Hirsch M.A , Iyer S.S , & Sanjak M. ((2016) ). Exercise-inducedneuroplasticity in human Parkinson’s disease: What is the evidence telling us?. Parkinsonism & Related Disorders, 22: , S78–81. |
12 | Jo H.J , Ambike S , Lewis M.M , Huang X , & Latash M.L. ((2016) ). Finger force changes in the absence of visual feedback inpatients with Parkinson’s disease. Clinical Neurophysiology, 127: (1), 684–692. |
13 | Levy-Tzedek, S. (a). Changes in predictive task switching withage and with cognitive load. Frontiers in Aging Neuroscience, 9: , 375. |
14 | Levy-Tzedek, S. (b). Motor errors lead to enhanced performancein older adults. Scientific Reports, 7: , (2017) . |
15 | Levy-Tzedek, S., Ben Tov, M., & Karniel, A. (a). Earlyswitching between movement types: Indication of predictive control?. Brain Research Bulletin, 85: (5), 283–288. doi:10.1016/j.brainresbull.2010.11.010 |
16 | Levy-Tzedek, S., Ben Tov, M., & Karniel, A. (b). Rhythmicmovements are larger, faster but with the same frequency uponremoval of visual feedback. Journal of Neurophysiology, 106: (5), 2120–2126. |
17 | Levy-Tzedek S , Hanassy S , Abboud S , Shachar M , & Amedi A. ((2012) ). Fast, accurate reaching movements with a visual-to-auditorysensory substitution device. Restorative Neurology andNeuroscience, 30: (4), 313–323. |
18 | Levy-Tzedek S , Krebs H , Song D , Hogan N , & Poizner H. ((2010) ). Non-monotonicity on a spatio-temporally defined cyclic task:Evidence of two movement types?. Experimental Brain Research, 202: (4), 733–746. |
19 | Levy-Tzedek S , Krebs H.I , Arle J.E , Shils J.L , Poizner H. ((2011) ). Rhythmic movement in Parkinson’s disease: Effects ofvisual feedback and medication state. Exp Brain Res, 211: (2), 277–286. |
20 | Levy-Tzedek S , Krebs H.I , Shils J.L , Apetauerova D , Arle J.E. ((2007) ). Parkinson’s disease: A motor control study using awrist robot. Advanced Robotics, 21: (10), 1201–1213. |
21 | Levy-Tzedek S , Maidenbaum S , Amedi A , & Lackner J. ((2016) ). Aging and Sensory Substitution in a Virtual Navigation Task.. PLoS One, 11: (3), e0151593. |
22 | Miles A , Jardine M , Johnston F , de Lisle M , Friary P , & Allen J. ((2017) ). Effect of Lee Silverman Voice Treatment (LSVTLOUD®) on swallowing and cough in Parkinson’s disease: Apilot study. Journal of the Neurological Sciences, 383: , 180–187. |
23 | Millage B , Vesey E , Finkelstein M , & Anheluk M. ((2017) ). Effect on Gait Speed, Balance, Motor Symptom Rating, and Quality ofLife in Those with Stage I Parkinson’s Disease Utilizing LSVTBIG®. Rehabilitation Research and Practice, 2017: . |
24 | Ondo W.G , & Satija P. ((2007) ). Withdrawal of visual feedbackimproves micrographia in Parkinson’s disease. MovementDisorders, 22: (14), 2130–2131. |
25 | Potgieser A.R , Roosma E , Beudel M , & de Jong B.M. ((2015) ). The effect of visual feedback on writing size in Parkinson’s disease. Parkinson’s Disease, 2015: . |
26 | Ridgel A.L , Vitek J.L , & Alberts J.L. ((2009) ). Forced, notvoluntary, exercise improves motor function in Parkinson’s disease patients. Neurorehabilitation and Neural Repair. |
27 | Schlesinger I , Erikh I , & Yarnitsky D. ((2007) ). Paradoxicalkinesia at war. Mov Disord. |
28 | Stuckenschneider T , Helmich I , Raabe-Oetker A , Froböse I , & Feodoroff B. ((2015) ). Active assistive forced exerciseprovides long-term improvement to gait velocity and stride length inpatients bilaterally affected by Parkinson’s disease. Gait &Posture, 42: (4), 485–490. |
29 | Vergara-Diaz G , Osypiuk K , Gow B , Fabara E , Sapienza S , Hausdorff J , … Bonato P. ((2017) ). Dual task assessment ofthe impact of tai chi on postural control in Parkinson’s disease.. Archives of Physical Medicine and Rehabilitation, 98: (10), e55. |
30 | Werner P , Heinik J , Mendel A , Reicher B , & Bleich A. ((1999) ). Examining the reliability and validity of the Hebrew version of the Mini Mental State Examination. Aging Clinical and Experimental Research, 11: (5), 329–334. |


