Transplantation of choroid plexus epithelial cells into contusion-injured spinal cord of rats
Abstract
Purpose: The effect of the transplantation of choroid plexus epithelial cells (CPECs) on locomotor improvement and tissue repair including axonal extension in spinal cord lesions was examined in rats with spinal cord injury (SCI).
Methods: CPECs were cultured from the choroid plexus of green fluorescent protein (GFP)-transgenic rats, and transplanted directly into the contusion-injured spinal cord lesions of rats of the same strain. Locomotor behaviors were evaluated based on BBB scores every week after transplantation until 4 weeks after transplantation. Histological and immunohistochemical examinations were performed at 2 days, and every week until 5 weeks after transplantation.
Results: Locomotor behaviors evaluated by the BBB score were significantly improved in cell-transplanted rats. Numerous axons grew, with occasional interactions with CPECs, through the astrocyte-devoid areas. These axons exhibited structural characteristics of peripheral nerves. GAP-43-positive axons were found at the border of the lesion 2 days after transplantation. Cavity formation was more reduced in cell-transplanted than control spinal cords. CPECs were found within the spinal cord lesion, and sometimes in association with astrocytes at the border of the lesion until 2 weeks after transplantation.
Conclusion: The transplantation of CPECs enhanced locomotor improvement and tissue recovery, including axonal regeneration, in rats with SCI.
Abbreviations
bFGF | basic fibroblast growth factor |
BMSC | bone marrow stromal cell |
CP | choroid plexus |
CPEC | choroid plexus epithelial cell |
CNS | central nervous system |
CSF | cerebrospinal fluid |
DAB | 3, 3-diaminobenzidine |
DAPI | 4′, 6-diamino-2-phenylindole |
GAP | growth-associated protein |
GFAP | glial fibrillary acidic protein |
GFP | green fluorescent protein |
HE | hematoxylin and eosin |
HGF | hepatocyte growth factor |
HRP | horse-radish peroxidase |
IGF | insulin-like growth factor |
PBS | phosphate-buffered saline |
TGF | transforming growth factor |
w-TP | week after transplantation |
1Introduction
The transplantation of somatic cells for the treatment of spinal cord injury has been studied by using mesenchymal-derived cells such as bone marrow stromal cells (Ohta et al., 2004), dental pulp-derived cells (Sakai et al., 2012), epidermal neural crest stem cells (Sieber-Blum et al., 2006), adipose-derived stromal cells (Arboleda et al., 2011), and skin-derived precursor cells (Biernaskie et al., 2007), and neural-derived cells such as Schwann cells (Williams & Bunge, 2012), olfactory ensheathing cells (Li et al., 2003; Iwatsuki et al., 2008), and choroid plexus epithelial cells (Ide et al., 2001).
The choroid plexus (CP), located in the cerebral ventricles, consists of epithelial cells and underlying vascular-rich connective tissue. Choroid plexus epithelial cells (CPECs) are the continuation of ependymal cells of the ventricular wall, and the underlying connective tissue corresponds to the pia mater covering the brain surface. CPECs are developmentally the same as the ependymal cells. However, unlike ependymal cells, CPECs are directly attached via basal laminae to the connective tissue, a feature characteristic of general epithelial cells.
CPECs are involved in the production of cerebrospinal fluid (CSF), and secrete many trophic factors such as HGF, bFGF, IGF-II, NGF, and TGF (Chodobski & Szmydynger-Chodobska, 2001; Watanabe et al., 2005). The CP has been studied in relation to aging of the brain and Alzheimer’s disease. CPECs became atrophic, and their basal laminae were irregular and thickened with immunoglobulin deposition in Alzheimer’s disease (Serot et al., 2003).
Our previous study showed that transplantation of the CP enhanced nerve regeneration in the spinal cord (Ide et al., 2001). In this experiment, the CP was minced into small pieces, and implanted as clusters of fragments into the spinal cord. Numerous regenerating axons grew toward the implanted CP tissues. This was the first study of the CP demonstrating that it facilitated nerve regeneration in the spinal cord. The promising results of this study opened up a new research field of CP transplantation for the treatment of CNS disorders. Subsequently, CPECs were shown to promote neurite extension as well as neuronal survival in vitro: in coculture with CPECs, neurons derived from the dorsal root ganglia or hippocampus showed extensions of many long neurites with elaborate branches on the surface of CPECs (Chakrabortty et al., 2000; Kimura et al., 2004). Although these studies indicated that neurite extension was enhanced by contact with CPECs, other studies showed that the conditioned medium of CPEC culture promoted neuronal survival and neurite extension of hippocampal neurons (Watanabe et al., 2005).
It is recognized that CPECs have a wide range of functions, including development, aging, neurodegenerative diseases, neurogenesis, and nerve regeneration of the CNS (Emerich, et al., 2005). Matsumoto (Matsumoto et al., 2003) demonstrated that CPECs produce molecules involved in processes such as prevention of the fibrillization of amyloid β-protein, lipid metabolism, and detoxication. In addition, ischemic lesions were markedly reduced by the transplantation of CPECs (Matsumoto et al., 2010). In this study, cultured CPECs were injected into the CSF via the 4th ventricle. Transplanted CPECs were not found at the site of ischemic injury. This suggested that transplanted CPECs did not replace the infarcted tissue, but exerted their effects by releasing diffusible neurotrophic factors that reached the lesion through the CSF. CPECs encapsulated in alginate- and poly-ornithine-coated materials exerted neuroprotection in a rodent model of Huntington’s disease (Borlongan et al., 2008). Recently, it was reported that CPECs secrete augurin, which is involved in the regulation of progenitor cell proliferation at the ependymal-subependymal interface (Gonzalez et al., 2011). Although, as described above, the effects of the CP or CPECs on nerve regeneration have been studied both in vivo and in vitro, there has been no study examining the effect of the transplantation of isolated CPECs on the treatment of SCI.
On the other hand, the transplantation of bone marrow stromal cells (BMSCs) promotes the improvement of locomotor functions and axonal outgrowth (Ohta et al., 2004; Ide et al., 2010; Nakano et al., 2013; Tamura et al., 2015). BMSCs have been applied for patients with SCI (Saito et al., 2012; Suzuki et al., 2014). However, BMSCs survived for only 1-2 weeks after injection into the spinal cord lesion, regardless of whether they were transplanted directly into the lesion or indirectly through the CSF in rats. BMSCs and CPECs have a different origin: BMSCs are derived from mesenchymal tissues, while CPECs are neural in nature. It is conceivable that the fates of CPECs after transplantation and the patterns of tissue repair are different from those in the case of BMSC transplantation.
In the present study, CPECs were cultured from GFP-transgenic rats, and transplanted into the contusion-injured spinal cord of rats of the same strain to explore the following: 1. whether CPEC transplantation promotes locomotor improvements, 2. whether transplanted CPECs survive for long enough to be integrated into the host spinal cord tissue, 3. whether axonal regeneration is accelerated in the spinal cord lesion, and 4. whether CPECs serve as scaffolds or paracrine of trophic factors to promote the outgrowth of regenerating axons. The present study indicated that CPECs are effective for the histological and functional recoveries of an injured spinal cord, possibly by releasing certain neurotrophic factors after transplantation.
2Materials and methods
2.1Surgery
Thirty two Sprague-Dawley (SD) rats (6 weeks old, female) were used in the present study. The study was carried out with the approval of the Animal Experiment Committee of Aino University, and all animal experiments were performed in accordance with the Guidelines for Animal Experiments of Aino University based on the Guidelines for Proper Conduct of Animal Experiments and Related Activities formulated by Ministry of Education, Culture, Sports, Science and Technology. The methods were basically the same as those described in a previous paper (Ide et al., 2010). Briefly, rats were anesthetized by the inhalation of isoflurane (1-2% Escain®, Mylan, Osaka, Japan) administered at a flow rate of 2 L/min. Laminectomy was performed at the Th 8-9 vertebrates to expose the spinal cord. The spinal cord with the dura mater was exposed, and damaged by letting a metal weight (10 g) drop from a height of 7.5 cm using an NYU impactor. Bleeding was seen under the dura mater at the crushed spinal cord. Following the injury, the spinal cord lesion was covered with a GOR-TEX® (expanded polytetrafluoroethylene sheet, W. L. Gore & Associates, USA), and the layered muscles and skin were sutured to close the lesion. A GOR-TEX was used to reduce connective tissue proliferation on the spinal cord lesion, and, at the same time, to serve as a marker of the site of the spinal cord lesion in the second surgery. The animals were given 3 mL of saline subcutaneously immediately after surgery to avoid dehydration, and an antibiotic (gentacin 3 mg/kg, Schering Plough, Osaka) daily for 3 days to prevent infection. In addition, rats were given lepetan (0.02 mL/kg, Otsuka, Tokyo) on the first day of surgery. Small amounts of food were placed on the floor of the cage to enable the rats to access the food easily on the first postoperative day. Later, food and water were provided as usual from the top of the cage. Rats were housed in an atmosphere of 55% humidity at a temperature of 23°C.
2.2Cell culture
CPECs were cultured as described by Watanabe et al. in 2005. Briefly, CP tissues were dissected out from both the lateral and fourth ventricles of 3- to4-week-old SD rats expressing green fluorescent protein (GFP). Four GFP-transgenic rats were purchased from a local dealer (SLC, Osaka, Japan). The tissues were minced and digested in 0.2% pronase for 15 min at 37°C. Dissociated cells were suspended in Dulbecco’s Modified Eagle’s Medium (DMEM)-high glucose (Nacalai Tesque, Osaka) containing 10% fetal bovine serum (FBS), and cultured in poly-L-lysine-coated dishes. Confluent cells were passaged 2 times to obtain a sufficient number of cells.
2.3Transplantation of CPECs
Cell transplantation was performed 1 week post-injury. The rats were anesthetized by the inhalation of isoflurane, the site of the first operation was opened, and the GOR-TEX was removed. Thus, the lesion site of the spinal cord was exposed. A cell suspension was injected into the spinal cord. The cell suspension contained 5×10⁵ cells in 30 μL of phosphate-buffered saline (PBS). Injections were performed using an insulin syringe with a 29-gauge needle at three points (epicenter, and rostral and caudal borders of the lesion), with 10 μL at each point on the coordinate instrument. The injection time was 2 min, and the needle was retained for 2 min after injection. For the control, PBS without CPECs was injected in the same manner as above. After injection, the skin was sutured. Twenty rats were used for cell transplantation, and twelve rats were used for PBS injection (control).
2.4Locomotor assessment
The locomotor behaviors were assessed based on the BBB (Basso, Beattie, and Bresnahan) scale (Basso et al., 1995) before cell transplantation (i.e., 1 week after surgery), and every week until 4 weeks after transplantation (w-TP) (Fig. 1). Rats were observed walking in an open area (ca. 1.0 m2) for 5 min. Locomotion was recorded by video camera, and analyzed by two researchers who were not aware of the experiment. For BBB scoring, 10 rats were used for the assessment of CPEC transplantation (n = 10) and 10 rats were used for the control (n = 10) throughout the experiment until 4 w-TP. Two rats died during the experiment, and these were excluded from the assessment.
2.5Fixation of rats
Rats were initially anesthetized by the inhalation of isoflurane, followed by the injection of 0.1 mL of Somnopentyl® (pentobarbital sodium, Sankyo, Tokyo, Japan). PBS (50 mL) was first perfused into the heart, followed by the fixative (100 mL) containing 4% paraformaldehyde in PBS (0.1 M, pH 7.5). The injured spinal cord was exposed, excised from the spinal bone, and stored in the same fixative. Two rats each at 2 days, and 1, 2, 3 and 4 weeks after transplantation were fixed for immunohistochemistry. Twenty rats (10 rats each from the CPEC-transplanted and control groups) were fixed at the end of the experiment (5 w-TP): 2 rats from each group were fixed for conventional electron microscopy, and the remaining 8 rats were fixed with the fixative containing 4% paraformaldehyde in the same manner as above. The method of fixation for conventional electron microscopy is described below (Chapter 2.7).
2.6Immunohistochemistry
The spinal cord was embedded in OCT compound, and frozen sections of the spinal cord were cut horizontally at 10 μm thick, and attached to glass slides. Sections were washed with PBS, and immuno-blocked with 3% BSA in PBS for 30 min at room temperature. For the detection of intracellular proteins, the sections were permeated with 0.3% Triton X-100 in 1% BSA-PBS for 30 min prior to incubation with primary antibodies. The sections were then incubated overnight with a solution containing the primary antibodies as follows: mouse anti-β-III-tubulin monoclonal antibody (1:1,000; Covance) for axons, mouse anti-phosphorylated growth-associated protein 43 (pGAP-43, S96) monoclonal antibody (1:1,000; Wako) for regenerating axons, and mouse anti-glial fibrillary acidic protein (GFAP) monoclonal antibody (1:500; Sigma) or rabbit anti-GFAP polyclonal (1:2,000; Novus Biologicals) antibodies for astrocytes. After being washed with PBS, the sections were incubated overnight with CF488A-labeled goat anti-mouse IgG, CF488A-labeled anti-rabbit IgG, CF555-labeled goat anti-mouse IgG (1:200; Biotium), or Alexa Fluor 555 goat anti-rabbit IgG (1:200; Thermo Fisher Scientific) antibodies.
2.7Conventional electron and immuno-electron microscopy
Two rats each from the CPEC-transplanted and control experiments were fixed for conventional electron microscopy at 5 w-TP. Rats were fixed by perfusion of the fixative containing 2% paraformaldehyde and 2% glutaraldehyde in phosphate buffer (pH 7.4, 0.1 M). The spinal cord was excised from the vertebral column, and stored in the same fixative for 2-3 days. The spinal cord specimens were transversely cut into ca. 1-mm-thick sections. The sections were washed, and post-fixed in osmium tetroxide solution (1% in phosphate buffer) for 1 hour on ice. After osmication, sections were washed, dehydrated through a series of alcohol, and embedded in Epon 812. Thin Epon sections (600– 800 nm) were produced with a diamond knife on an ultramicrotome. The thin sections were stained with uranyl acetate and lead citrate, and observed under an electron microscope (Hitachi 7600, Hitachi, Japan).
For immuno-electron microscopy, frozen sections of the spinal cord of rats fixed with the fixative containing 4% paraformaldehyde as above (Chapter 2.5) were selected, and immunostained with the mouse anti-GFP monoclonal antibody (1:200; Nacalai Tesque), followed by the horseradish peroxidase (HRP)-conjugated goat anti-mouse IgG (1:50; Medical and Biological Laboratory). Sections were then reacted with a solution containing 0.04% 3,3-diaminobenzidine (DAB) and 0.005% H202 for 5 min to visualize the HRP. Immunostained specimens were immersed in the 1% osmium solution for 10 min, dehydrated through the alcohol solutions, and embedded in Epon 812. Embedding was performed using a small gelatin capsule filled with Epon, which was put on the specimen top-side down to embed the sections attached on the slide glass. In this condition, slide glasses with sections covered with an inverted gelatin capsule containing Epon were kept in an oven at 60, 70, and 80°C each for 1 day. For sectioning, the gelatin capsule was removed from the slide glass by heating the slide, and thin sections of specimens embedded at the base of the gelatin capsule were made. The sections were observed without any metal staining under an electron microscope (Hitachi-7600, Hitachi, Japan).
2.8Measurement of cavity volume
The cavity volume was measured and calculated as described previously (Nakano et al., 2013). In brief, three rats each from CPEC-transplanted and PBS-injected groups were used at 5 w-TP. Horizontal cryostat sections of the spinal cord were stained by hematoxylin and eosin (HE) on the slide glass. After staining, the sections were embedded in Canada balsam (Wako, Osaka), and used for measurement of the volume of cavities. The border of cavities was traced to measure the areas of the cavities using the Image Filing System (Flovel, Tokyo, Japan) equipped on a microscope (Olympus, CKX41, Tokyo, Japan). The areas of the cavities were measured in every third section. Since the sections were ca. 10 μm thick, the total volume of the cavities was calculated by multiplying the average area of the cavities by the depth of the sections examined. The relative volume of the cavities was obtained by dividing the values of the total cavity volume by those of the whole spinal cord volume at the corresponding level.
2.9Axon density
The density of axons extending through the astrocyte-devoid areas was compared between CPEC-transplanted and control spinal cord. Three spinal cords each from CPEC-transplanted and control groups were used for assessment. Three sections at different levels were selected from each spinal cord, and optimal fields were analyzed for the axon density. The β-tubulin-positive area in the spinal cord lesion was quantified as a percentage using Image-J software version 1.48v.
2.10Statistics
Values of BBB scores were evaluated by Student’s t-test at each time point. Relative volumes of cavities and axon densities were also evaluated with the same test.
3Results
Cultured CPECs were all green-fluorescent (Fig. 1, B-1). They were flattened with fine cytoplasmic processes at the cell periphery (Fig. 1, B-2).
3.1Two days after transplantation
Transplanted CPECs were found as green-fluorescent cell clusters in the spinal cord lesion by fluorescence microscopy at 2 days after transplantation (Fig. 2A). The spinal cord lesion is not vacant, but filled with tissues as shown in Fig. 2B prepared by merging the fluorescent micrograph in an unstained transmitted-light micrograph of the same section. Engrafted CPECs were located in the astrocyte-devoid areas of the spinal cord lesion, as shown by immunostaining for astrocytes (Fig. 2C). Such CPEC clusters were partly associated with astrocytes at the border of the spinal cord lesion (Fig. 2a-c). There were many DAPI (4′, 6-diamino-2-phenylindole)-stained nuclei, the cell bodies of which were not immunostained for astrocytes or axons, around the CPEC clusters, suggesting that tissues around CPEC clusters were composed of non-nervous cells. There was no finding suggesting that CPECs were actively migrating into the host spinal cord tissue.
Figure 3 shows the presence of GAP-43-positive axons around CPEC-clusters. Although GAP-43-positive axons were not clearly seen at low-power magnification (Fig. 3A), they were found around the CPEC cluster located at the border of the lesion at high-power magnification (Fig. 3a). Axons residing in the host spinal cord white matter (asterisk in Fig. 3a) adjacent to the border of the lesion were not stained. A few GAP-43-positive axons extending into the lesion were found in the vicinity of another CPEC cluster located at the border of the spinal cord lesion (Fig. 3b).
3.2One week after transplantation
Numerous axons were found extending through the astrocyte-devoid areas at 1 w-TP (Fig. 4A). A fluorescent micrograph showing CPEC clusters (Fig. 4B) was taken of a section near to that of Fig. 4A. This micrograph was merged in an unstained transmitted-light micrograph (Fig. 4C) to show the localization of CPEC clusters in the astrocyte-devoid areas that were not vacant, but filled with tissues. CPEC clusters of varying sizes were distributed within the astrocyte-devoid areas or located at the border of the lesion (Fig. 4B). Although CPECs were situated among axons in the astrocyte-devoid areas, they were not necessarily intimately interacting with axons (Fig. 4a-c). Some CPECs were only occasionally in contact with axons (Fig. 4a). It appeared that axons could not extend into the stacked CPECs (Fig. 4b). Axons extending through the astrocyte-devoid areas showed various diameters and irregular directions (Fig. 4c).
Figure 5A shows immunostaining for axons. The section near to that shown in Fig. 4 was immunostained for axons. The fluorescent micrograph (Fig. 5B) showing the distribution of CPEC clusters was taken from a section adjacent to that of Fig. 5A. This fluorescent micrograph was merged in an unstained transmitted-light micrograph (Fig. 5C). The CPEC clusters were situated within the astrocyte-devoid areas. The merged micrograph showed that axons extending through the astrocyte-devoid areas and engrafted CPECs resided in tissue matrices. Axons extended with no relationship with engrafted CPECs. Only occasionally did CPECs show associations with axons (Fig. 5a). As described above, axons did not penetrate CPEC stacks. There was no finding indicating the extension of axons toward CPEC stacks (Fig. 5b).
Figure 6A shows immunostaining for astrocytes taken from the section near to that shown in Fig. 5. The CPEC distribution in the spinal cord lesion was shown by fluorescence microscopy (Fig. 6B) at the level adjacent to the section of Fig. 6A. This image of fluorescence microscopy was merged in the unstained transmitted-light micrograph (Fig. 6C). It was clear that CPEC clusters were situated within the astrocyte-devoid areas. The merged micrograph showed that there were tissue matrices in the astrocyte-devoid areas. CPECs were sometimes associated with astrocytes at the border of the lesion (Fig. 6a), but usually had no relationship with astrocytes in the astrocyte-devoid areas (Fig. 6b). There were many DAPI-stained nuclei around CPEC clusters, indicating that CPECs were in the tissue matrices composed of non-nervous tissue (Fig. 6a,b).
3.3Two weeks after transplantation
The findings at 2 w-TP were basically the same as those at 1 w-TP. The double immunostaining for axons and astrocytes showed that numerous axons extended through astrocyte-devoid areas (Fig. 7A). CPECs were not found in this section. Axons extending through the astrocyte-devoid areas varied in diameter and were irregularly oriented (Fig. 7a). Axons in the astrocyte-devoid areas extended smoothly through the border of the lesion (Fig. 7b). There was no finding suggesting an astrocyte scar at the border of the lesion. The relationship of engrafted CPECs with axons or astrocytes is shown in Fig. 7B and C. These micrographs were taken from spinal cord sections of other rats. Usually, engrafted CPECs were not directly associated with axons (Fig. 7B) or astrocytes (Fig. 7C). There were numerous cell nuclei around engrafted CPECs, the cell bodies of which were neither immunostained for neurons (β-III-tubulin) nor astrocytes (GFAP), suggesting that the tissue matrices around CPECs were different from nervous tissues.
3.4Immuno-electron microscopy
CPECs were grouped into cell clusters (Fig. 8A) at 1 w-TP. Immuno-electron microscopy showed that GFP-labeled CPECs were stained lightly dark by DAB reaction. CPECs were in contact with each other, and directly exposed to the surrounding tissue matrices (Fig. 8B). At 2 w-TP, CPEC clusters exhibited hole-like spaces containing no CPECs (Fig. 8C). Electron microscopy demonstrated that CPECs interacted with cells with no DAB staining (Fig. 8D). The nature of these cells interacting with CPECs was unknown. Regarding the interaction of CPECs with axons, the contact of CPECs with axons was sometimes found in every stage (Fig. 8E). Electron microscopy of such interactions showed that CPECs were in direct contact with axons (Fig. 8F).
3.5Over 3 weeks after transplantation
CPECs were no longer found in the spinal cord lesion at 3 w-TP or thereafter. However, numerous axons extended through the astrocyte-devoid areas at 5 w-TP (Fig. 9). The axonal extension through the astrocyte-devoid areas was demonstrated in Figs. 4A, 7A and 9A. Numerous thick axons with varying diameters and irregular directions were found to extend through the astrocyte-devoid areas of the longitudinally sectioned spinal cord at 1, 2 and 5 w-TP (Figs. 4c, 7a and 9a). There was no finding indicating that extending axons were blocked from extending through the border of the lesion beyond the astrocyte-devoid areas (Fig. 9A). Axons extending the astrocyte-devoid areas had varying diameters and irregular directions (Fig. 9a), whereas axons in the astrocyte area of the host spinal cord were fine and densely arranged in the longitudinal directions (Fig. 9b). These axons in the astrocyte areas were regarded as those spared in the white matter adjacent to the spinal cord lesion.
Electron microscopy showed that axons seen in the astrocyte-devoid areas were grouped into small bundles of 2 or several myelinated and unmyelinated fibers, which were surrounded by thin cytoplasmic processes like perineural sheaths. All of these cellular components were embedded in tissue matrices containing collagen fibrils (Fig. 10). These characteristics indicated that axons extending through the astrocyte-devoid areas were a type of peripheral nerve. This finding is consistent with those of our previous studies (Ide et al., 2001; Nakano et al., 2013).
3.6Control spinal cord
In the PBS-injected control spinal cord, astrocyte-devoid areas were formed, and small numbers of axons extended through astrocyte-devoid areas (Fig. 11). The patterns of axonal extension were basically the same in the PBS-injected and CPEC-transplanted spinal cords (Figs. 9, 11). The difference was the density of axons in astrocyte-devoid areas of the control spinal cord: numerous axons were present in the CPEC-transplanted spinal cord, whereas a small number of axons were found in the PBS-injected spinal cord. Regarding the density of axons, the axon areas comprised 50% in the CPEC-transplanted spinal cord, and 20% in the PBS-injected spinal cord(Fig. 11C).
3.7Cavity formation
HE staining showed that various types of cavity were formed at the lesion of the cell-transplanted as well as control spinal cord. The measurement of the cavities indicated that the cavity volume was smaller (7-8% of the original spinal cord) in the CPEC-grafted spinal cord than in the control (20% of the original spinal cord). This indicted that the spinal cord lesion was more efficiently improved in cell-transplanted than in control rats. Relative volumes of cavities were significantly different between the CPEC-transplantation and control groups (Fig. 12).
3.8BBB scores
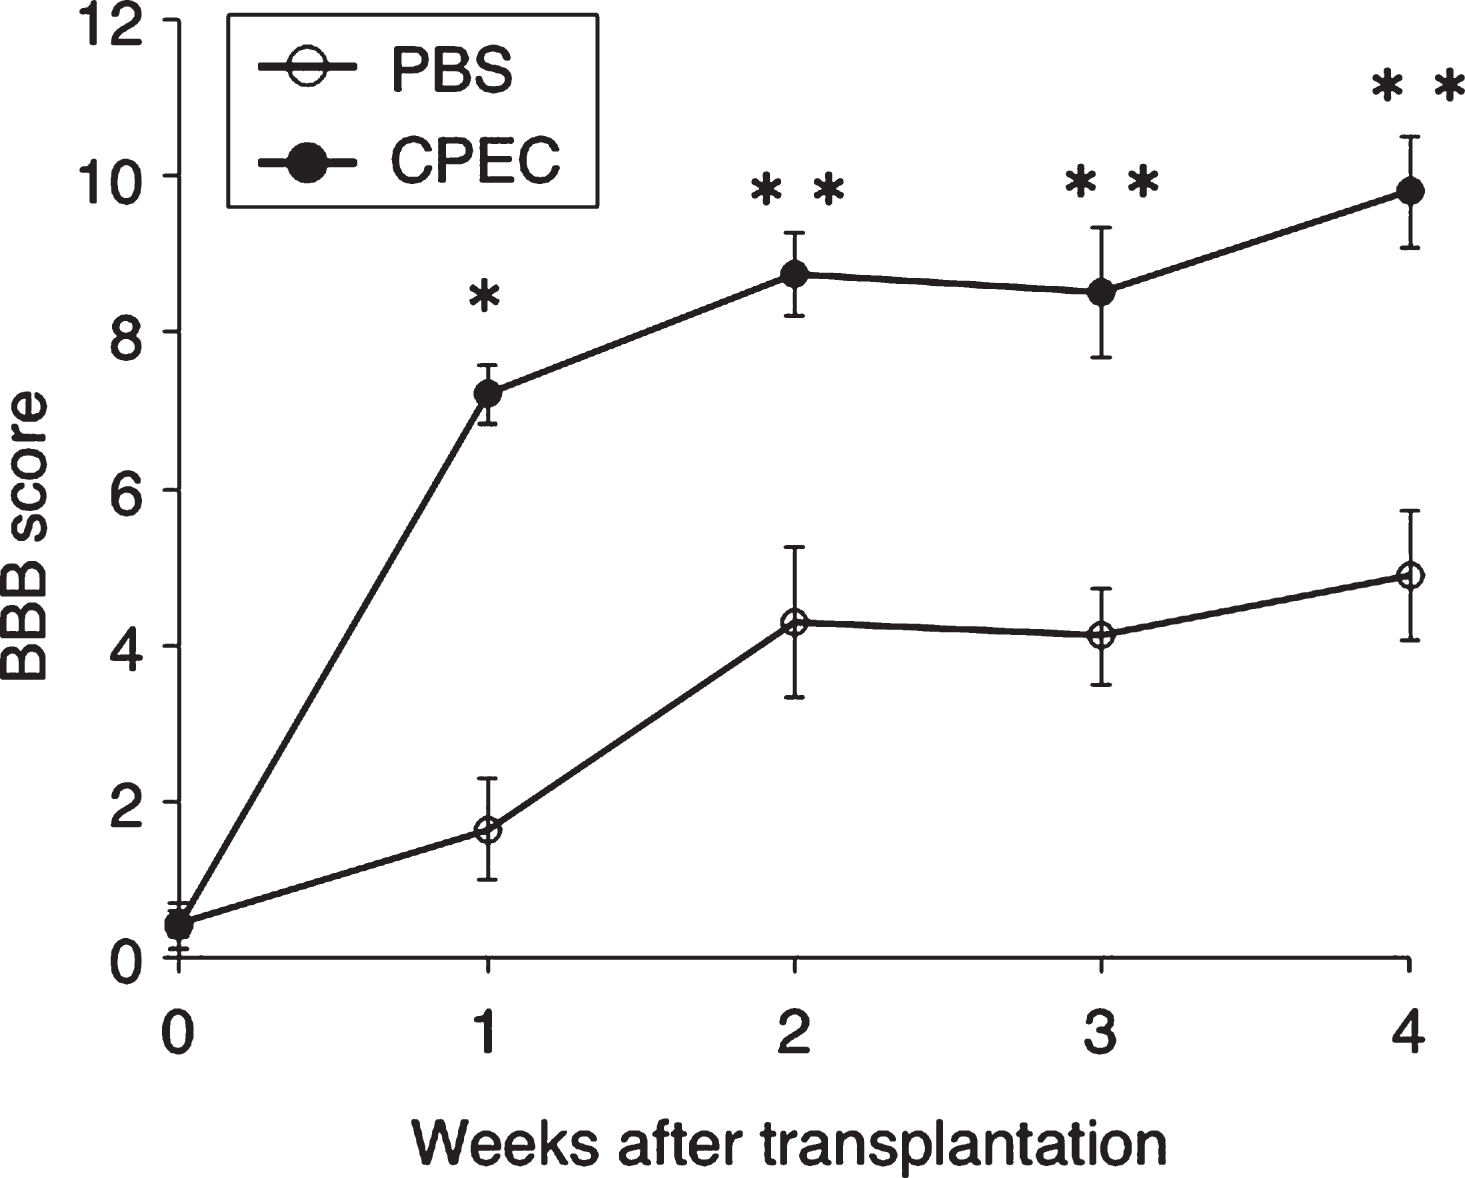
BBB scores at 1, 2, 3 and 4 w-TP, respectively, were 0.43±0.47, 1.64±1.94, 4.29±2.87, 4.11±1.86, and 4.89±2.50 in the control group, and 0.40±0.65, 7.20±0.64, 8.75±1.20, 8.56±1.87, and 9.80±1.60 (Mean±SEM) in the cell-transplanted group. There were significant differences (P < 0.0005∼0.005) at each corresponding time point between the two groups. It is notable that there was a steep rise in the line graph at 1 w-TP (Fig. 13).
4Discussion
The present study demonstrated that the transplantation of cultured CPECs promotes axonal extension and tissue repair in the spinal cord lesion of rats. Prominent axonal extension occurred in the astrocyte-devoid areas in the CPEC-transplanted spinal cord. This is the first study to demonstrate the beneficial effects of transplantation of cultured CPECs on functional and histological improvements in injured spinal cord with promising results.
4.1Fate of CPECs
Since CPECs are from the same lineage as ependymal cells, it was expected that CPECs might be integrated into the host spinal cord tissue to survive long-term after transplantation. However, CPECs did not survive in the spinal cord beyond 3 w-TP in the present study.
In our previous study, BMSCs survived for only 1-2 weeks after transplantation (Ohta et al., 2004; Ide et al., 2010; Nakano et al., 2013). It was proposed that mesenchymal cell-derived BMSCs have no affinity for nervous tissue to be integrated into the spinal cord tissue. This leads to the idea that ependymal cell-derived CPECs might survive long-term to be integrated into the host spinal cord. However, CPECs survived for only 2-3 w-TP, only a little longer than BMSCs. One explanation for this might be that transplanted CPECs were not matched immunologically in the closed colony SD rats. BMSCs can survive for longer but with a gradual decrease in number in the spinal cord of inbred rats (Fisher 344 strain) or SD rats treated with high doses of immunosuppressants (Swanger et al., 2005). Our previous study showed that BMSCs disappeared with a conventional dose of immunosuppressants (Ohta et al., 2004). In addition, it is probable that the environment of the injured spinal cord might be so harsh that CPECs, although they have a CNS origin, could not survive long-term in the spinal cord lesion.
There was no finding suggesting that transplanted CPECs differentiated into other types of cell such as astrocytes or neurons to be integrated into the spinal cord tissue. Our previous study showed that some CPECs differentiated into astrocytes after transplantation in the spinal cord (Kitada et al., 2001). Similarly, ependymal cells of the 3rd ventricle differentiated into neurons in the hypothalamus (Xu et al., 2007). It is probable that the environment of the normal spinal cord might be more amenable for CPECs to survive and differentiate into astrocytes. On the other hand, an in vitro study revealed that CPECs contained stem cells that were able to differentiate into glial and neuronal cells (Itokazu et al., 2006). As far as examined in the present study, there was no finding suggesting the differentiation of CPECs into glial or neural cells. This might be due partly to the harsh environment in the spinal cord lesion and/or partly to the short survival time of transplanted CPECs in the present study. Muse (multilineage-differentiating stress-endeavoring) cells have been identified as mesenchymal-derived stem cells that can survive in a harsh environment (Kuroda et al., 2013). It is interesting to look at the fate of Muse cells in spinal cord injury after transplantation.
4.2Patterns of axonal extension in the SCI
The present study demonstrated that axons extended through the astrocyte-devoid areas in the spinal cord lesion. Axons in astrocyte-devoid areas were thick with varying diameters, and irregularly oriented in various directions. In contrast, axons spared in the surrounding astrocyte areas were thin, and uniformly distributed in the same direction. Electron microscopy demonstrated that axons in the astrocyte-devoid areas had the characteristics of peripheral nerves: myelinated and unmyelinated axons are bundled and surrounded by perineural sheaths. They are associated with Schwann cells, and embedded in collagen fibril matrices. Schwann cell transplantation studies showed that axonal outgrowth is promoted by Schwann cells in the spinal cord (Deng et al., 2014). The origin of Schwann cells surrounding axons in the astrocyte-devoid areas was not clarified in the present study. It is probable that Schwann cells came from root nerve fibers and/or nerve fibers in the pia mater.
The possibility should be taken into considerationthat axons in the astrocyte-devoid areas were demyelinated ones that had survived the spinal cord injury. Demyelinated axons are subsequently remyelinated mostly by oligodendrocytes, or occasionally by Schwann cells. Schwann cells surrounding such demyelinated axons only have a limited amount of extracellular matrices around them (Sasaki et al., 1989; Nakai et al., 2008). These features are different from those seen in the astrocyte-devoid areas of the present study.
Steward (Steward et al., 2003) proposed several criteria for identifying regenerated axons in an injured spinal cord. Axons extending through connective tissue matrices in the astrocyte-devoid areas of the present study satisfy their first criterion.
The findings of GAP-43 immunohistochemistry indicate that regenerating axons emanated from the rostral/caudal borders of the spinal cord lesion.
These considerations led to the conclusion that axons extending through the astrocyte-devoid area of the present study are regenerating ones in the spinal cord injury. The same pattern of axonal extension in the astrocyte-devoid areas occurred, although at a much lower density, in the PBS-injected control group. This suggests that axonal extensions in the astrocyte-devoid areas might be the inherent patterns of axonal regeneration in the spinal cord injury.
It is generally believed that collagen fibril matrices are not desirable for tissue repair in the CNS. The patterns of axonal outgrowth through the astrocyte-devoid areas were the same as those in our previous BMSC transplantation studies (Ide et al., 2010; Nakano et al., 2013). Numerous regenerating axons extended through the collagen fibril matrices in the astrocyte-devoid areas. It has been reported that collagen matrices (Klapka & Müller, 2006) or collagen IV (Joosten et al., 2000; Menezes et al., 2014) facilitate axonal regeneration. There was no finding in the present study, suggesting that regenerating axonal growth was blocked at the border of the astrocyte-devoid areas. It appears that regenerating axons from the rostral or caudal borders grew, after traversing the astrocyte-devoid areas, into the astrocyte-areas on the other side. Inman and Steward (2003) showed that ascending sensory axons regenerate into the connective tissue matrix at the site of spinal cord injury in mice. It was not determined in the present study whether axons extending through the astrocyte-devoid areas are ascending or descending fibers.
As stated above, axonal outgrowth through the collagen fibril matrices is regarded as an inherent and basic pattern of axonal regeneration in spinal cord lesions. This pattern of axonal regeneration is observed in both BMSC and CPEC transplantations. CPECs facilitate this inherent ability of axons to regenerate in spinal cord lesions, while suppressing astrocyte scar formation at the lesion border.
The premise of cell transplantation is that transplanted cells can be integrated into the host tissue to serve as the scaffold for the growth of axons, and/or differentiate into neural cells to replace the injured tissue in the spinal cord lesion. This premise is not necessarily applicable to spinal cord injury. The basic pattern of nerve regeneration in the spinal cord lesion as shown in the present study should be taken into consideration in the treatment of SCI.
4.3The role of CPECs in axonal regeneration
There was no finding indicating that CPECs might mechanically support axonal extension over a long distance. In the case of the transplantation of BMSCs, it has been proposed that certain trophic factors released from BMSCs might promote axonal regeneration in the spinal cord lesion (Wu et al., 2003; Ankeny et al., 2004; Ohta et al., 2004; Yoshihara et al., 2007; Nakano et al, 2010; Nishida et al., 2011). The intrathecal infusion of conditioned medium of BMSC culture promotes axonal regeneration in the rat spinal cord (Cantinieaux et al., 2013).
With regard to CPECs, neurons placed on CPECs extend many neurites rigorously in vitro, supporting the report that CPECs may promote axonal elongation by making contact with axons (Chakrabortty et al., 2000; Kimura et al., 2004). On the other hand, axonal outgrowth was also accelerated by the conditioned medium of CPEC culture (Watanabe et al., 2005). CPEC infusion into the CSF rescued an ischemic brain induced by MCA occlusion (Matsumoto et al., 2010). There was no finding indicating that infused CPECs accumulated in or infiltrated into the ischemic lesions in this study. They disappeared from the brain within 1 week after infusion. In keeping with these studies, the present study indicates that CPECs might secrete some effective molecules into the CSF, promoting axonal regeneration in spinal cord lesions.
Effective molecules from transplanted CPECs might work not only for facilitating axonal regeneration, but also for rescuing axons from degeneration that occurs following the spinal cord injury. Our previous study (Ohta et al., 2004) showed that axons in the white matter adjacent to the spinal cord lesion were spared in BMSC-transplanted rats, whereas no surviving axons were found in the corresponding region of the spinal cord in the control rats. It is conceivable that some effective molecules secreted from transplanted CPECs promoted rescue effects on injured axons and/or neurons in the brain and spinal cord to recover normal functions in early stages of the injury. This hypothesis partly explains the locomotor improvement of BBB scores in as short a time as 1 week following the CPEC transplantation.
Acknowledgments
This study was supported by grants from the Japanese Ministry of Education, Culture, Sports, Science and Technology (number 26870744 to KK, number 19590598 to NN, and number 23300125 to CI).
References
1 | Ankeny D.P. , McTigue D.M. , & Takeman L.B. ((2004) ). Bone marrow transplants provide tissue protection and directional guidance for axons after contusive spinal cord injury in rats. Experimental Neurology, 190: , 17–31. |
2 | Arboleda D. , Forostyak S. , Jendelova P. , Marekova D. , Amemori T. , Pivonkova H. , Masinova K. , & Sykova E. ((2011) ). Transplantation of predifferentiated adipose-derived stromal cells for the treatment of spinal cord injury. Cellular and Molecular Neurobiology, 31: , 1113–1122. |
3 | Basso D.M. , Beattie M.S. , & Bresnahan J.C. ((1995) ). A sensitive and reliable locomotor rating scale for open field testing in rats. Journal of Neurotrauma, 12: , 1–21. |
4 | Biernaskie J. , Sparling J.S. , Liu J. , Shannon C.P. , Plemel J.R. , Xie Y. , Miller F.D. , & Tetzlaff W. ((2007) ). Skin-derived precursors generate myelinating Schwann cells that promote remyelinaton and functional recovery after contusion spinal cord injury. The Journal of Neuroscience, 27: , 9545–9559. |
5 | Borlongan C.V. , Thanos C.G. , Skinner S.J.M. , Geaney M. , & Emmerich D.F. ((2008) ). Transplants of encapsulated rat choroid plexus cells exert neuroprotection in a rodent model of Huntington’s disease. Cell Tranplantation, 16: , 987–992. |
6 | Cantinieaux D. , Quertainmont R. , Blacker S. , Rossi L. , Wanet T. , Noel A. , Brook G. , Shoenen J. , & Franzen R. ((2013) ). Conditioned medium from bone marrow-derived mesenchymal stem ells improves recovery after spinal cord injury in rats: An original strategy to avoid cell transplantatione. PloS One, 8: , e69515. doi: 10.1371/journal.pone.0069515 |
7 | Chakrabortty S.I. , Kitada M. , Matsumoto N. , Taketomi M. , Kimura K. , & Ide C. ((2000) ). Choroid plexus ependymal cells enhance neurite outgrowth from dorsal root ganglion neurons in vitro. Journal Neurocytology, 29: , 707–717. |
8 | Chodobski A. , & Szmydynger-Chodobska J. ((2001) ). Choroid plexus: Target for polypeptide and site of their synthesis. Microscopy Research Technique, 52: , 65–82. |
9 | Deng L.X. , Walker C. , & Xu X.M. ((2014) ). Schwann cell transplantation and descending propriospinal regeneration after spinal cord injury. Brain Research, 1619: , 104–114. |
10 | Emerich D.F. , Skinner S.J.M. , Borlongan C.V. , Vasconcellos A.V. , & Thanos C.G. ((2005) ). The choroid plexus in the rise, fall and repair of the brain. Bio Essays, 27: , 262–274. |
11 | Gonzalez A.M. , Podvin S. , Lin S.Y. , Miller M.C. , Botfield H. , Leadbeater W.E. , Roberton A. , Dang X. , Knowling S.E. , Cardenas-Galindo E. , Donahue J.E. , Stopa E.G. , Johanson C.E. , Coimbra R. , Eliceiri B.P. , & Baird A. ((2011) ). Ecrg expression and its product augurin in the choroid plexus: Impact on fetal brain development, cerebral fluid homeostasis and neuroprogenitor cell response to CNS injury. Fluids and Barriers of the CNS, 8: , 6. |
12 | Ide C. , Kitada M. , Chakrabortty S. , Taketomi M. , Matsumoto N. , Kikukawa S. , Mizoguchi A. , Kawaguchi S. , Endoh K. , & Suzuki Y. ((2001) ). Grafting of choroid plexus ependymal cells promotes the growth of regenerating axons in the dorsal funiculus of rat spinal cord: A preliminary report. Experimental Neurology, 167: , 242–251. |
13 | Ide C. , Nakai Y. , Nakano N. , Seo T.-B. , Yamada Y. , Endo K. , Noda T. , Saito F. , Suzuki Y. , Fukushima M. , & Nakatani T. ((2010) ). Bone marrow stromal cell transplantation for treatment of sub-acute spinal cord injury in the rat. Brain Research, 1332: , 32–47. |
14 | Inman D.M. , & Steward O. ((2003) ). Ascending but not other long-tract axons, regenerate into the connective tissue matrix that forms at the site of a spinal cord injury in mice. The Journal of Comparative Neurology, 462: , 431–449. |
15 | Itokazu Y. , Kitada M. , Dezawa M. , Mizoguchi A. , Matsumoto N. , Shimizu A. , & Ide C. ((2006) ). Choroid plexus ependymal cells host neural progenitor cells in the rat. Glia, 53: , 32–42. |
16 | Iwatsuki K. , Yoshimine T. , Kishima H. , Aoki M. , Yoshimura K. , Ishihara M. , Ohnishi Y. , & Lima C. ((2008) ). Transplantation of olfactory mucosa following spinal cord injury promotes recovery in rats. Neuroreport, 19: , 1249–1259. |
17 | Joosten E.A. , Dijkstra S. , Brook G.A. , Veldman H. , & Bar P.R. ((2000) ). Collagen IV deposits do not prevent regrowing axons from penetrating the lesion site in spinal cord injury. Journal of Neuroscience Research, 62: , 686–691. |
18 | Kimura K. , Matsumoto N. , Kitada M. , Mizoguchi A. , & Ide C. ((2004) ). Neurite outgrowth from hippocampal neurons is promoted by choroid plexus ependymal cells in vitro. Journal of Neurocytology, 33: , 465–476. |
19 | Kitada M. , Chakrabortty S. , Matsumoto N. , Taketomi M. , & Ide C. ((2001) ). Differentiation of choroid plexus ependymal cells into astrocytes after grafting into the pre-lesioned spinal cord in mice. Glia, 36: , 364–374. |
20 | Klapka N. , & Müller H.W. ((2006) ). Collagen matrix in spinal cord injury. Journal of Neurotrauma, 23: , 422–435. |
21 | Kuroda Y. , Wakao S. , Kitada M. , Murakami T. , Nojima M. , & Dezawa M. ((2013) ). Isolation, culture and evaluation of multilineage-differentiating stress-enduring (Muse) cells. Nature Protocols, 8: , 1391–1415. |
22 | Li Y. , Decherchi G. , & Raisman G. ((2003) ). Transplantation of olfactory ensheathing cells into spinal cord lesions restores breathing and climbing. Journal of Neuroscience, 23: , 727–731. |
23 | Matsumoto N. , Kitayama H. , Kitada M. , Kimura K. , Noda M. , & Ide C. ((2003) ). Isolation of a set of genes expressed in the choroid plexus of the mouse using suppression subtractive hybridization. Neuroscience, 117: , 405–415. |
24 | Matsumoto N. , Taguchi A. , Kitayama H. , Watanabe Y. , Ohta M. , Yoshihara T. , Itokazu Y. , Dezawa M. , Suzuki Y. , Sugimoto H. , Noda M. , & Ide C. ((2010) ). Transplantation of cultured choroid plexus epithelial cells via cerebrospinal fluid shows prominent neuroprotective effects against acute ischemic brain injury in the rat. Neuroscience Letters, 469: , 283–288. |
25 | Menezes K. , Nascimento M.A. , Gonçalves J.P. , Cruz A.S. , Lopes D.V. , Curzio B. , Bonamino M. , de Menezes J.R. , Borojevic R. , Rossi M.I. , & Coelho-Sampaio T. ((2014) ). Human mesenchymal cells from adipose tissue deposit laminin and promote regeneration of injured spinal cord in rats. PloS One, 9: , e96020. doi: 10.1371/journal.pone.0096020 |
26 | Nakai Y. , Nakano N. , Endo K. , Noda T. , Yamada Y. , Suzuki Y. , & Ide C. ((2008) ). Degenerative and regenerative changes in the dorsal funiculus of the cryoinjured spinal cord of rats. Aino Journal, 7: , 33–43. |
27 | Nakano N. , Nakai Y. , Seo T-B. , Yamada Y., Ohno T. , Yamanaka A. , Nagai Y. , Fuskushima M. , Suzuki Y. , Nakatani T. , & Ide C. ((2010) ). Characterization of conditioned medium of cultured bone marrow stromal cells. Neuroscience Letters, 483: , 57–61. |
28 | Nakano N. , Nakai Y. , Seo T-B. , Homma T., Yamada Y. , Ohta M. , Suzuki Y. , Nakatani T. , Fukushima M. , Hayashibe M. , & Ide C. ((2013) ). Effects of bone marrow stromal cell transplantation through CSF on the subacute and chronic spinal cord injury in rats. PLoS ONE, 8: , e73494. doi: 10.1371/journal.pone.0073494 |
29 | Nishida H. , Nakayama M. , Tanaka H. , Kitamura M. , Hatoya S. , Sugiura K. , Suzuki Y. , Ide C. , & Inaba T. ((2011) ). Evaluation of transplantation of autologous bone marrow stromal cells into the cerebrospinal fluid for treatment of chronic spinal cord injury in dogs. American Journal of Veterinary Research, 72: , 1118–1123. |
30 | Ohta M. , Suzuki Y. , Noda T. , Ejiri Y. , Dezawa M. , Kitaoka K. , Chou H. , Ishikawa N. , Matsumoto N. , Iwashita Y. , Mizuta E. , Kubo S. , & Ide C. ((2004) ). Bone marrow stromal cells infused into the cerebrospinal fluid promote functional recovery of the injured rat spinal cord with reduced cavity formation. Experimental Neurology, 187: , 266–278. |
31 | Saito F. , Nakatani T. , Iwase I. , Maeda M. , Murao M. , Suzuki Y. , Fukushima M. , & Ide C. ((2012) ). Administration of cultured autologous bone marrow stromal cells into cerebrospinal fluid in spinal injury patients: A pilot study. Restorative Neurology and Neuroscience, 30: , 127–136. |
32 | Sakai K. , Yamamoto A. , Matsubara K. , Nakamura S. , Naruse M. , Yamagata M. , Sakamoto K. , Tauchi R. , Wakao N. , Imagama S. , Hibi H. , Kadomatsu K. , Ishiguro N. , & Ueda M. ((2012) ). Human dental pulp-derived stem cells promote locomotor recovery after complete transection of the rat spinal cord by multiple neuro-regenerative mechanisms. The Journal of Clinical Investigation, 122: , 80–90. |
33 | Sasaki M. , & Ide C. ((1989) ). Demyelination and remyelination in the dorsal funiculus of the rat spinal cord after heat injury. Journal of Neurocytology, 18: , 225–239. |
34 | Serot J.M. , Béné M.C. , & Faure G.C. ((2003) ). Choroid plexus, aging of the brain and Alzheimer’s disease. Frontiers in Bioscience, 8: , s515–s521. |
35 | Sieber-Blum M. , Schnell L. , Grim M. , Hu T.F. , Schneider R. , & Schwab M.E. ((2006) ). Characterization of epidermal neural crest stem cell (EPI-NCNC) grafts in the lesioned spinal cord. Molecular and Cellular Neuroscience, 32: , 67–81. |
36 | Steward O. , Zheng B. , & Tessier-Lavigne M. ((2003) ). False resurrections: Distinguishing regenerated from spared axons in the injured central nervous system. The Journal of Comparative Neurology, 459: , 1–8. |
37 | Suzuki Y. , Ishikawa N. , Omae K. , Hirai T. , Ohnishi K. , Nakano N. , Nishida H. , Nakatani T. , Fukushima M. , & Ide C. ((2014) ). Bone marrow-derived mononuclear cell transplantation in spinal cord injury patients by lumbar puncture. Restorative Neurology and Neuroscience, 32: , 473–482. |
38 | Swanger S.A. , Neuhuber B. , Himes T. , Bakshi A. , & Fischer I. ((2005) ). Analysis of allogeneic and syngeneic bone marrow stromal cells graft survival in the spinal cord. Cell Transplantation, 14: , 775–786. |
39 | Tamura K. , Harada Y. , Kunimi M. , Takemitsu H. , Hara Y. , Nakamura T. , & Tagawa M. ((2015) ). Autologous bone marrow mononuclear cell transplant and surgical decompression in a dog with chronic spinal cord injury. Experimental and Clinical Transplantation, 13: , 100–105. |
40 | Watanabe Y. , Matsumoto N. , Dezawa M. , Itokazu Y. , Yoshihara T. , & Ide C. ((2005) ). Conditioned medium of the primaryculture of rat choroid plexus epithelial (modified ependymal) cells enhances neurite outgrowth and survival of hippocampal neurons. Neuroscience Letters, 379: , 158–163. |
41 | Williams R.R. , & Bunge M.B. ((2012) ). Schwann cell transplantation: A repair strategy for spinal cord injury? Progress in Brain Research, 201: , 295–312. |
42 | Wu S.F. , Suzuki Y. , Ejiri Y. , Noda T. , Bai H. , Kitada M. , Kataoka K. , Ohta M. , Chou H. , & Ide C. ((2003) ). Bone marrow stromal cells enhance differentiation of co-cultured neurosphere cells and promote regeneration of injured spinal cord. Journal of Neuroscience Research, 72: , 343–351. |
43 | Xu Y. , Tamamaki N. , Noda T. , Kimura K. , Itokazu Y. , Matsumoto N. , Dezawa M. , & Ide C. ((2007) ). Neurogenesis in the ependymal layer of the adult rat 3rd ventricle. Experimental Neurology, 192: , 251–264. |
44 | Yoshihara T. , Ohta M. , Itokazu Y. , Matsumoto N. , Dezawa M. , Suzuki Y. , Taguchi A. , Watanabe Y. , Adachi Y. , Ikehara S. , Sugimoto H. , & Ide C. ((2007) ). Neuroprotective effect of bone marrow-derived mononuclear cells promoting functional recovery from spinal cord injury. Journal of Neurotrauma, 24: , 1026–1036. |
Figures and Tables
Fig.1
A: The time course of surgery and cell transplantation. Cell transplantation (TP) was performed 1 week after spinal cord injury (SCI). BBB scores were evaluated at the time points indicated with arrowheads. B: All CPECs cultured from GFP-transgenic rats are green-fluorescent (B-1). The same region is shown by phase-contrast microscopy (B-2). Scale: 50 μm for B-1 and B-2.
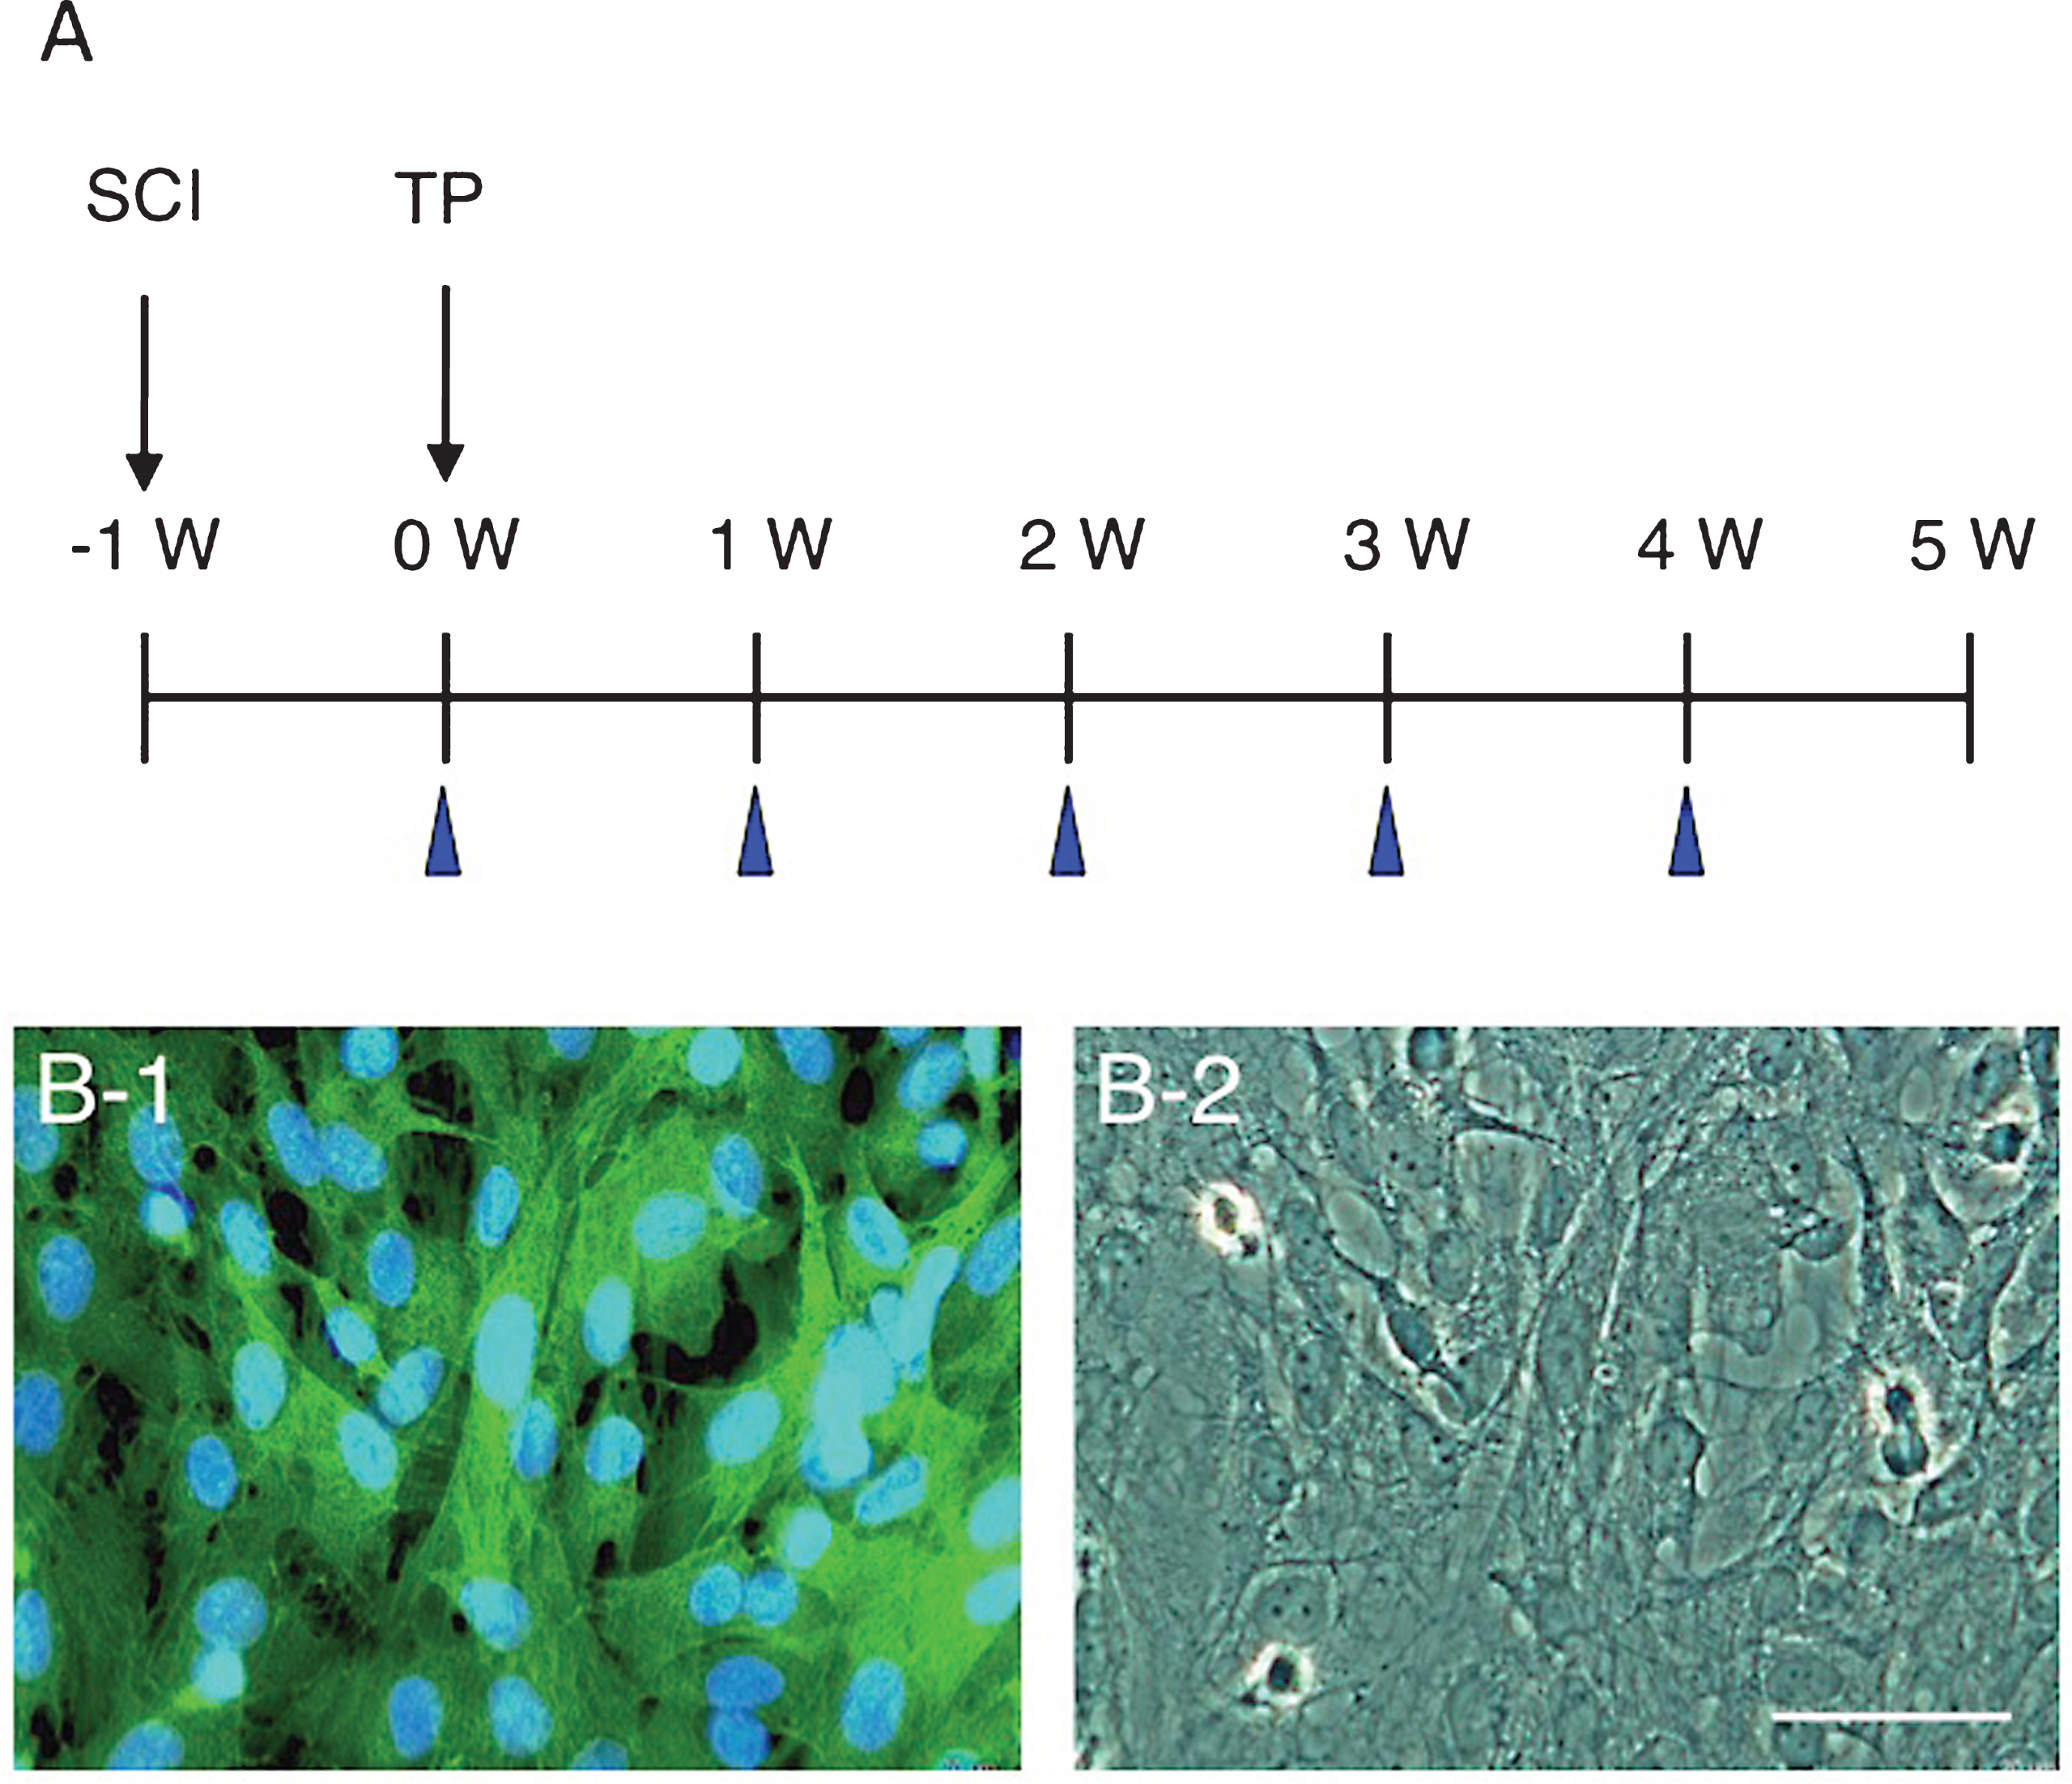
Fig.2
Localization of CPECs in the spinal cord lesion 2 days after transplantation. A: This fluorescent micrograph shows the presence of clusters of CPECs in the spinal cord lesion. Three large CPEC clusters are shown with rectangles (a-c). The dotted lines indicate the contour of the spinal cord. B: An unstained transmitted-light micrograph was merged in the fluorescent micrograph of panel A to show the localization of transplanted CPECs in the spinal cord tissue. Arrows point to clusters of CPECs corresponding to those shown in rectangles in panel A. C: GFAP immunostaining for astrocytes (red). This section was at the level a few sections away from that of panel A. Green-fluorescent CPEC clusters (some of them are pointed out with arrows) are located partly in association with astrocytes at the border of the lesion. No astrocytes can be seen within the lesion. a-c: The clusters of CPECs enclosed with rectangles (a-c) in panel A were enlarged to show the association with astrocytes. CPECs are partly associated with astrocytes at the border of the lesion (red). Cell nuclei were stained blue by DAPI staining. Scale: 500 μm for A- C, and 100 μm for a-c.
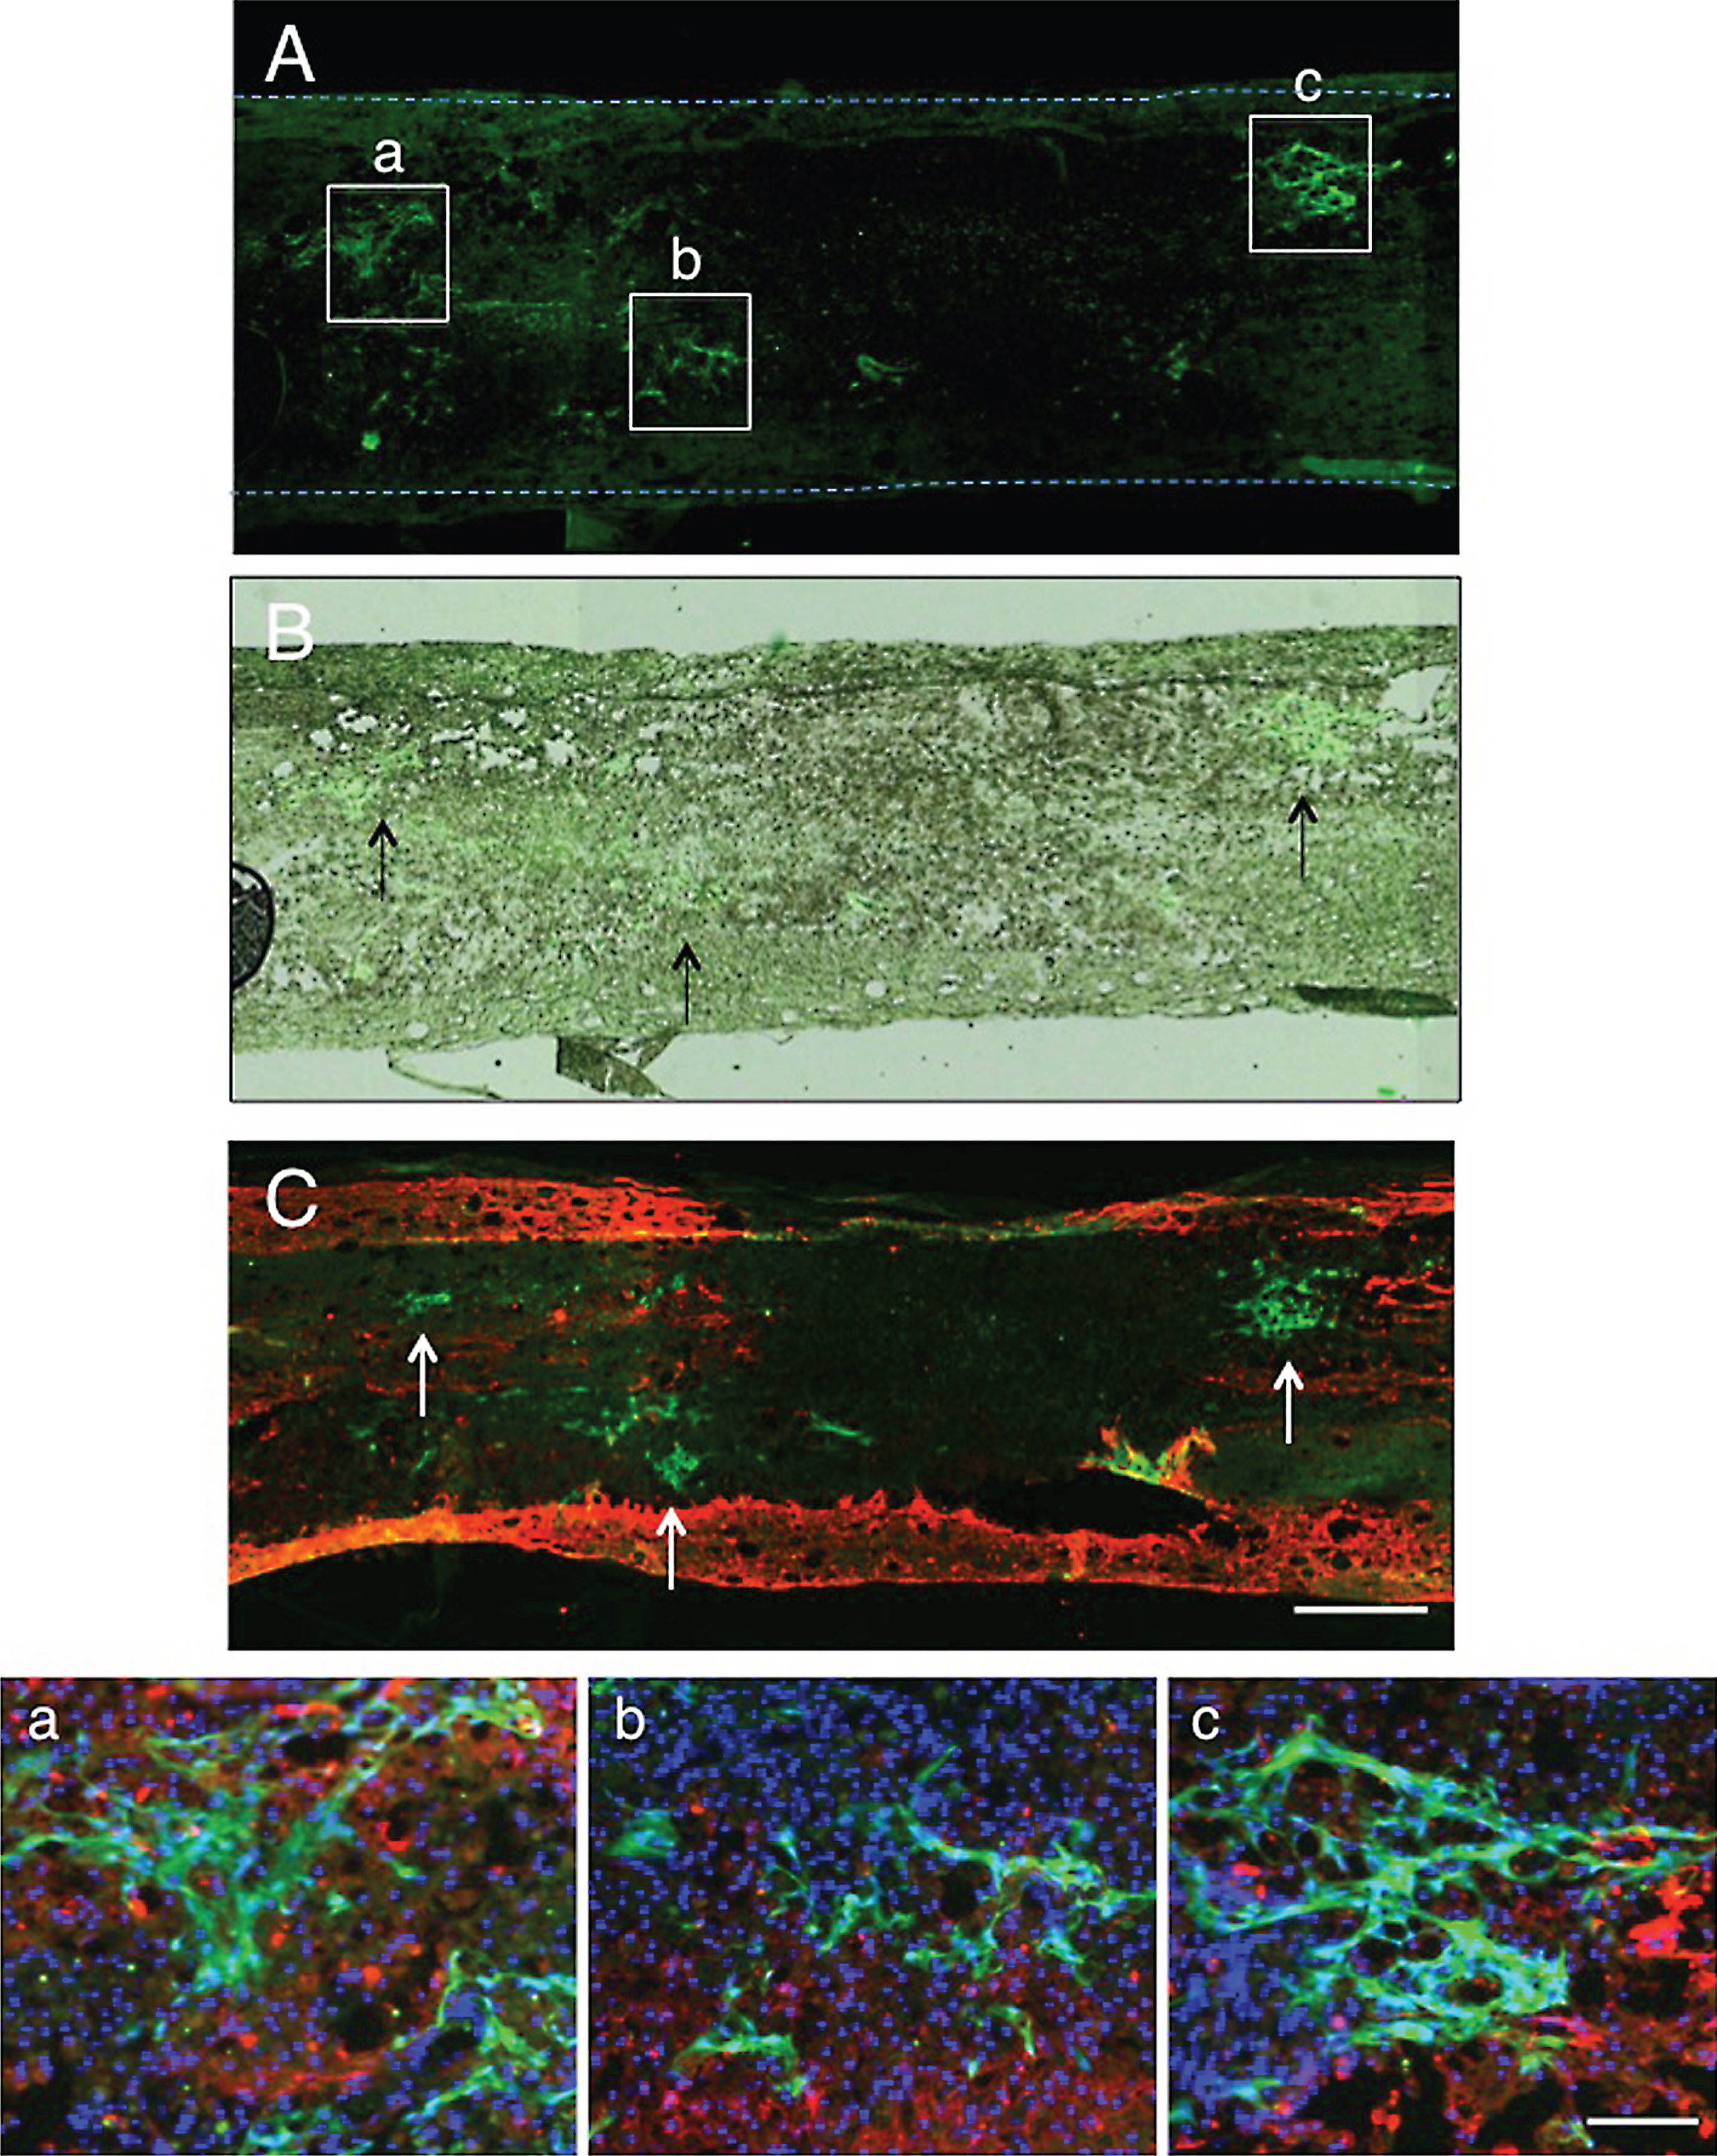
Fig.3
GAP-43 immunohistochemistry 2 days after transplantation. A: A low-powered micrograph showing the localization of CPEC clusters (rectangles a and b). Axons (red) immunostained for GAP-43 are not so distinct at a low magnification. a: Enlargement of the rectangle a in panel A. Many GAP-43-positive axons can be found at the border of the lesion adjacent to the white matter (*), in which no axons are immunostained. b: An enlargement of the rectangle b in panel A. A few GAP-43-positive axons (arrows) can be found in the lesion. Scale: 500 μm for A, and 100 μm for a and b.
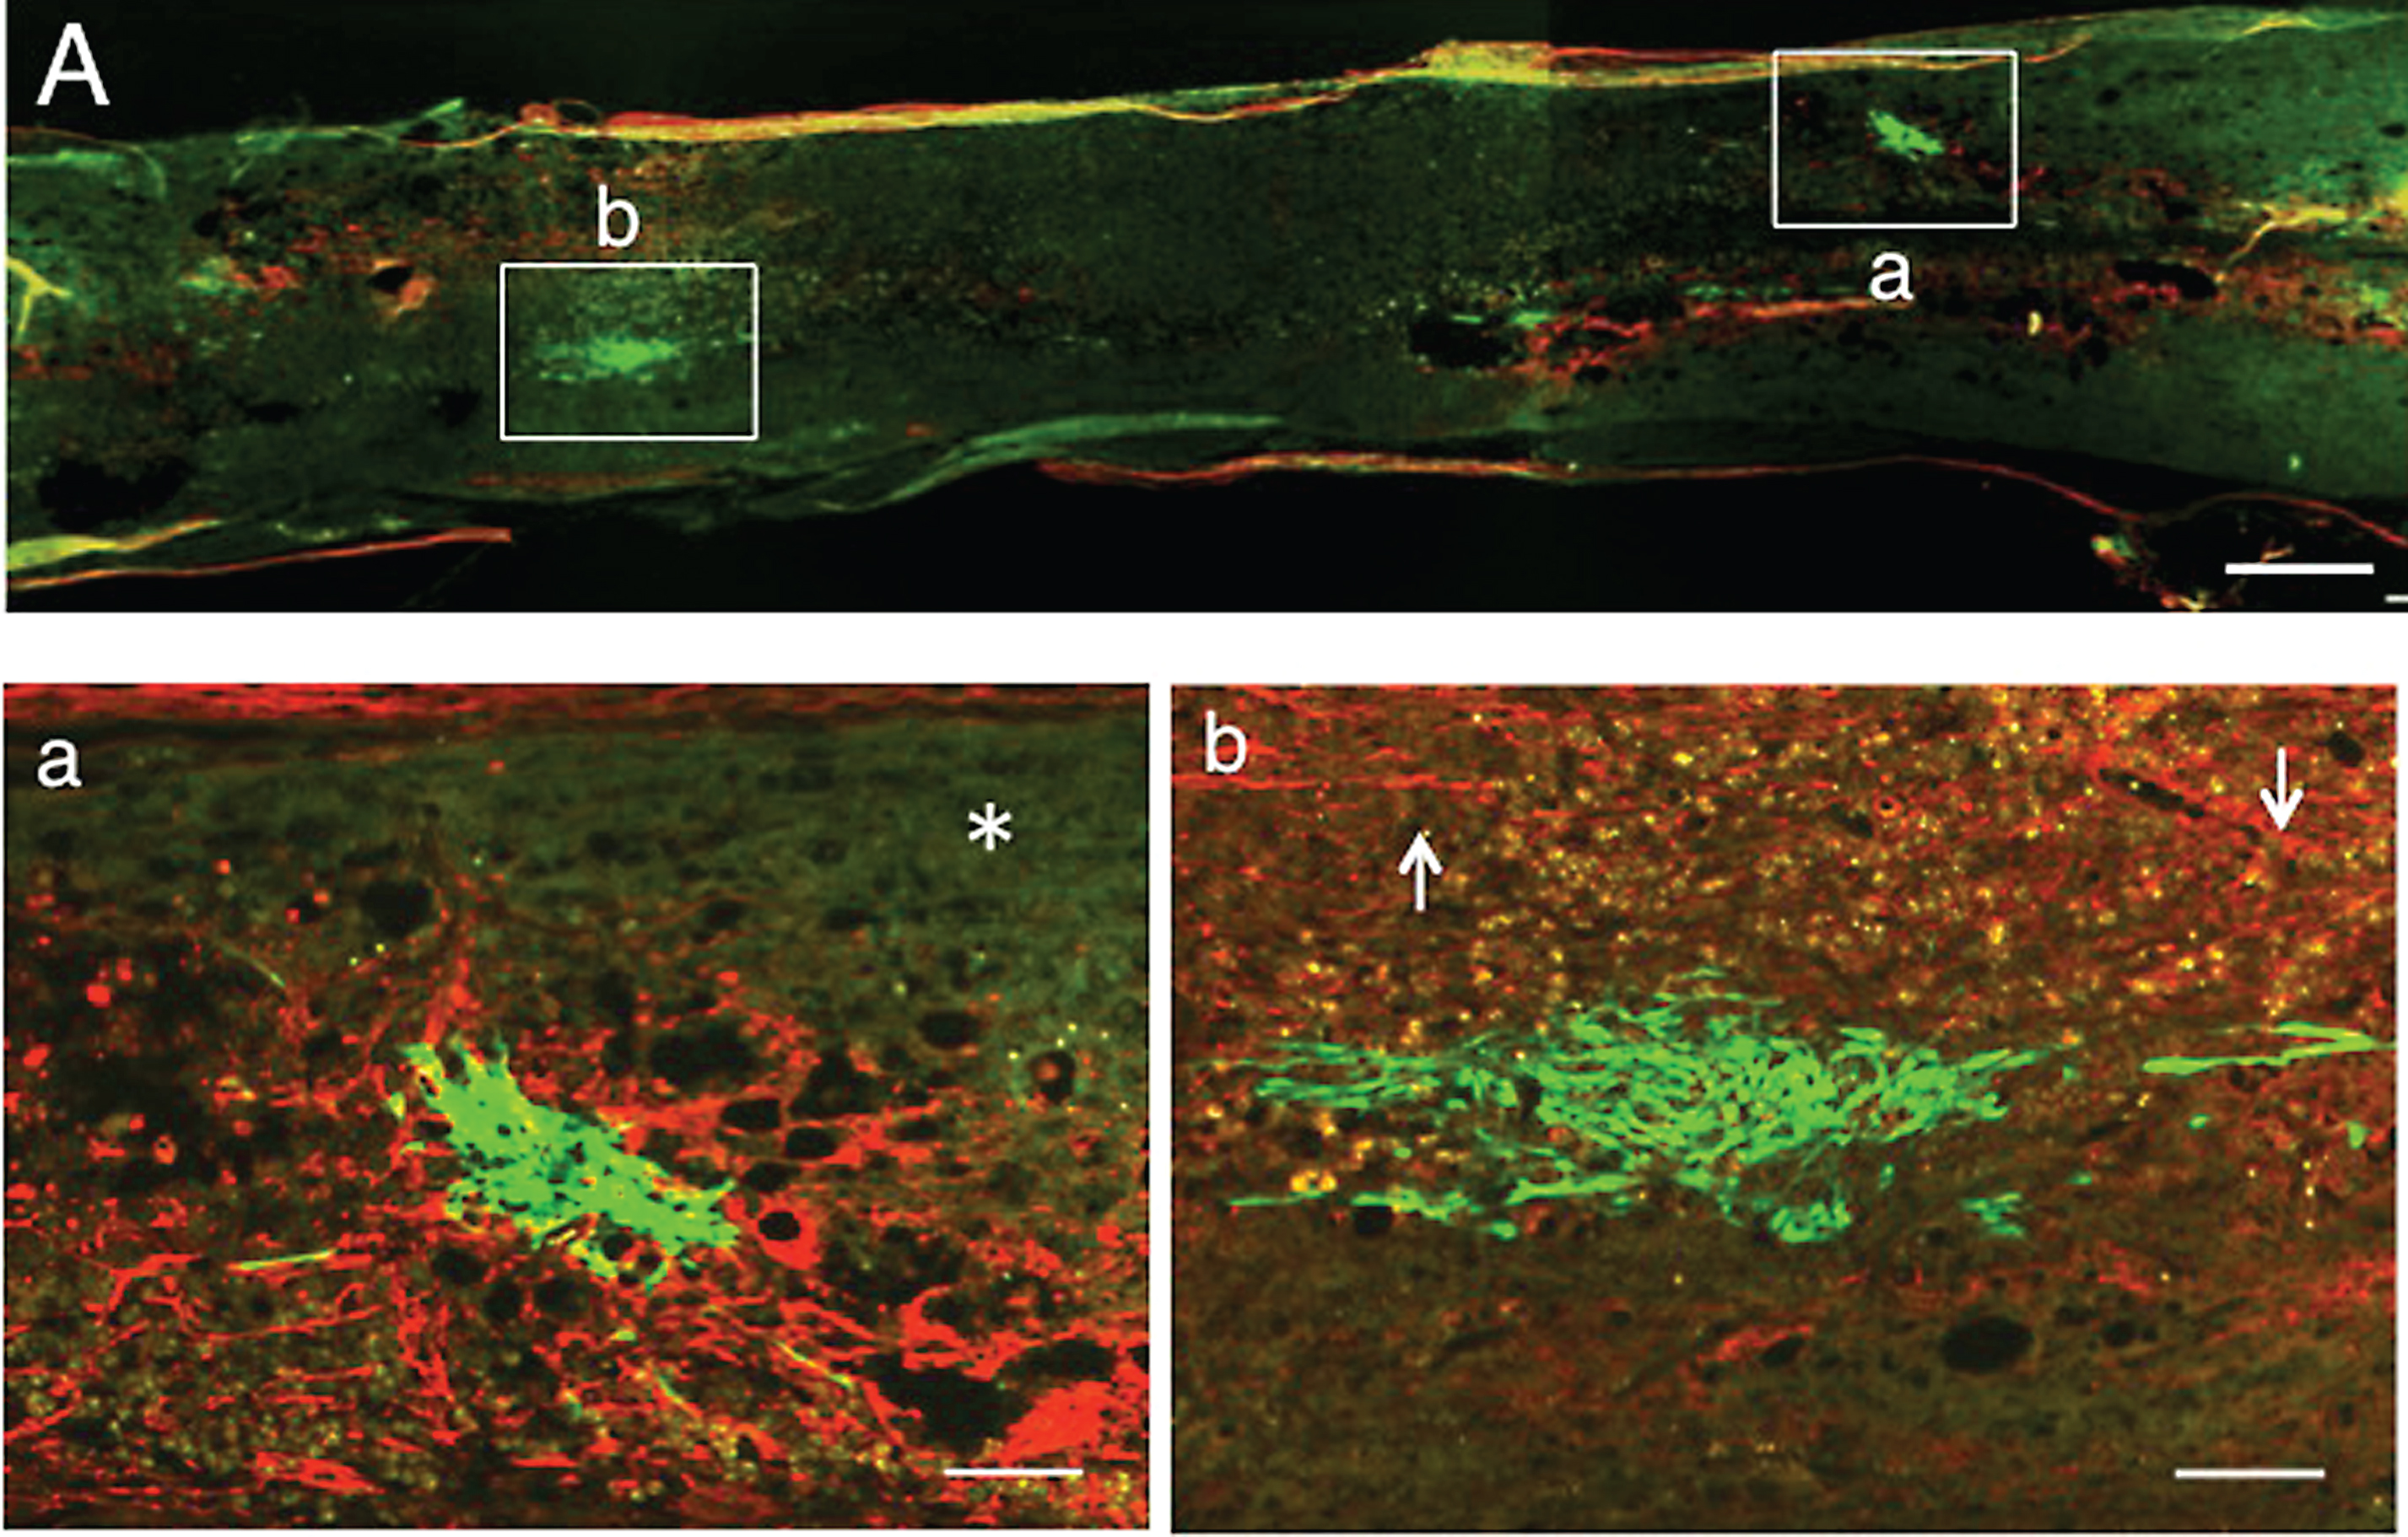
Fig.4
1 w-TP. Double staining for axons and astrocytes. A: The spinal cord was immunostained for axons (red) and astrocytes (green). The dotted line outlines the spinal cord. Numerous axons extend through the astrocyte-devoid areas (upper half of the spinal cord) in the spinal cord lesion. B: This simple fluorescent micrograph was taken from a section adjacent to that of panel A, showing various-sized clusters of engrafted CPECs. C: Panel B was merged in the unstained transmitted-light picture to show the localization of engrafted CPECs in the spinal cord tissue. Arrows point to some CPEC clusters. a: Rectangle a in panel A was enlarged. Some CPECs (arrows) can be seen among axons. b: Rectangle b in panel A was enlarged. Axons are scarce around the stacked CPECs (green, asterisk). c: Rectangle c in panel A was enlarged. Many axons extend without an association with engrafted CPECs. Scale: 500 μm for A-C, and 100 μm for a-c.
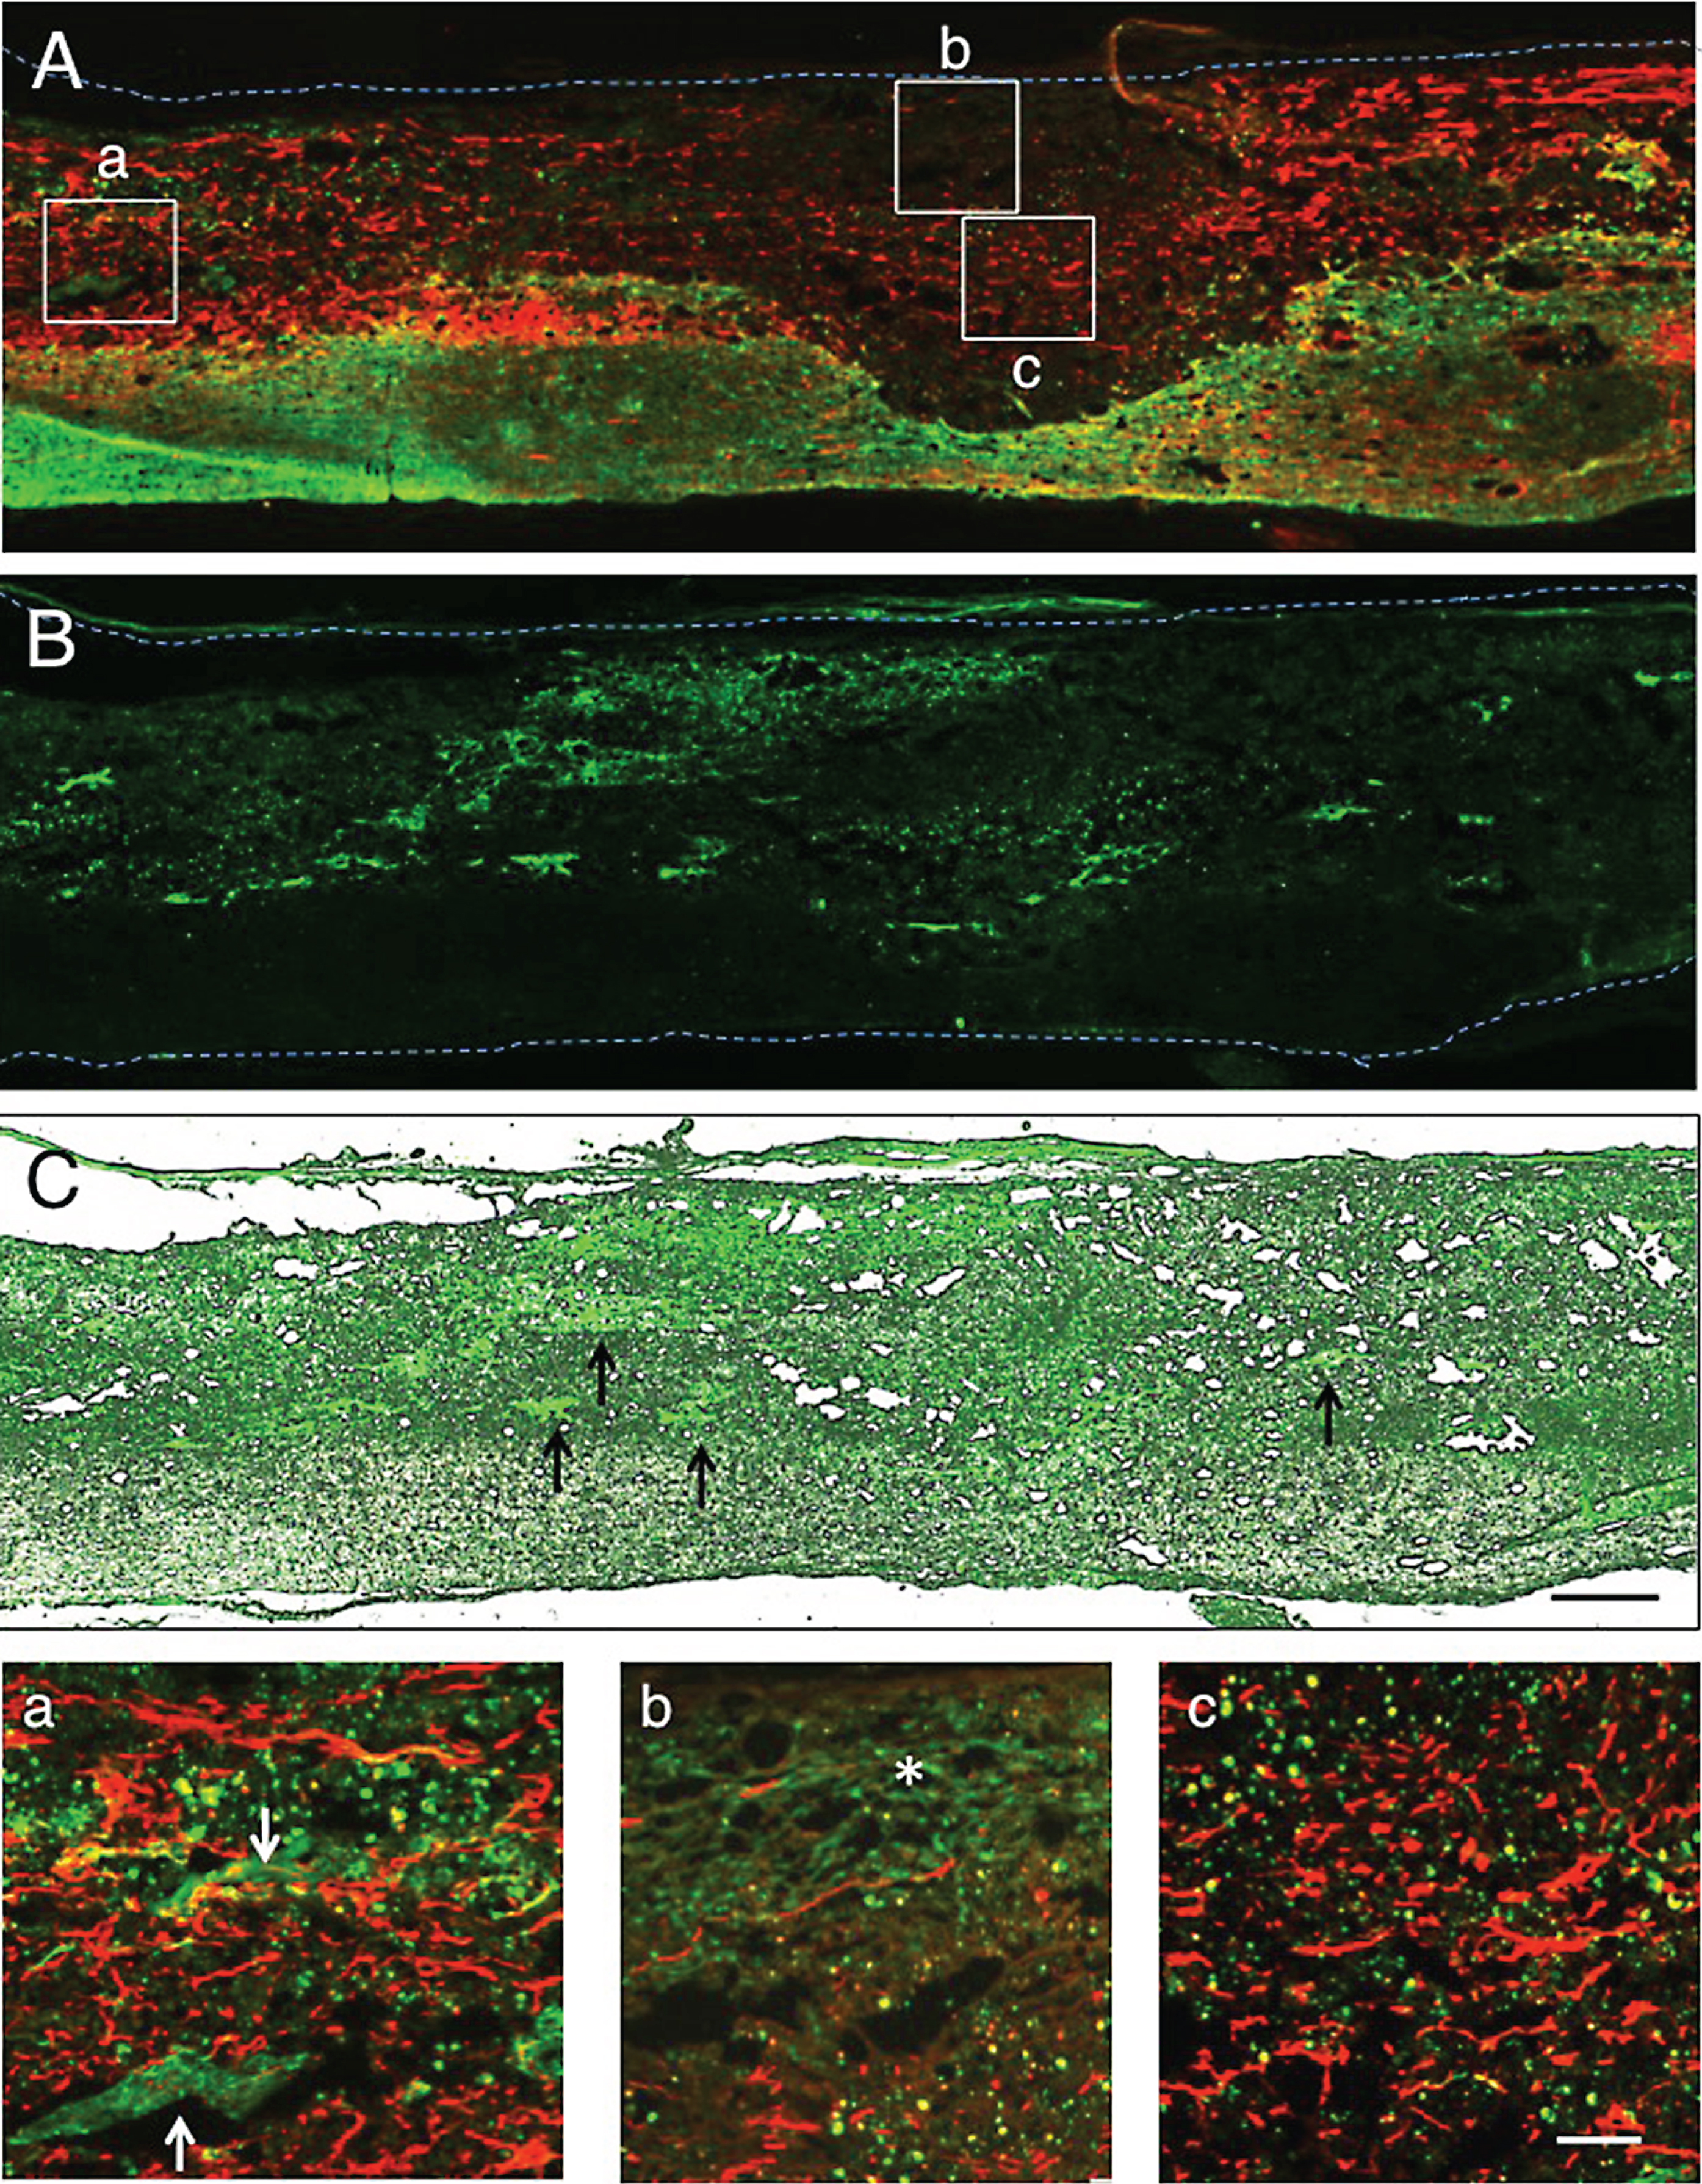
Fig.5
1 w-TP. Immunostaining for axons. The spinal cord was immunostained for axons. This micrograph was at a level several sections away from that of Fig. 4. A: Axons (red) are found in the remaining host spinal cord tissue and the astrocyte-devoid areas shown in Fig. 4A. CPEC clusters of various sizes (green) are located within and at the border of the lesion. B: This simple fluorescent micrograph was taken from a section adjacent to that of panel A, showing clusters of engrafted CPECs. C: Panel B was merged in the unstained transmitted-light picture to show the localization of engrafted CPECs in the spinal cord tissue. Arrows point to some of the clusters. a: Rectangle a in panel A was enlarged. Small clusters of CPECs (green) can be seen among axons that have various diameters and irregular orientations. b: Rectangle b in panel A was enlarged. Axons are scarce around and within the stacked CPECs (green). Scale: 500 μm for A-C, and 100 μm for a and b.
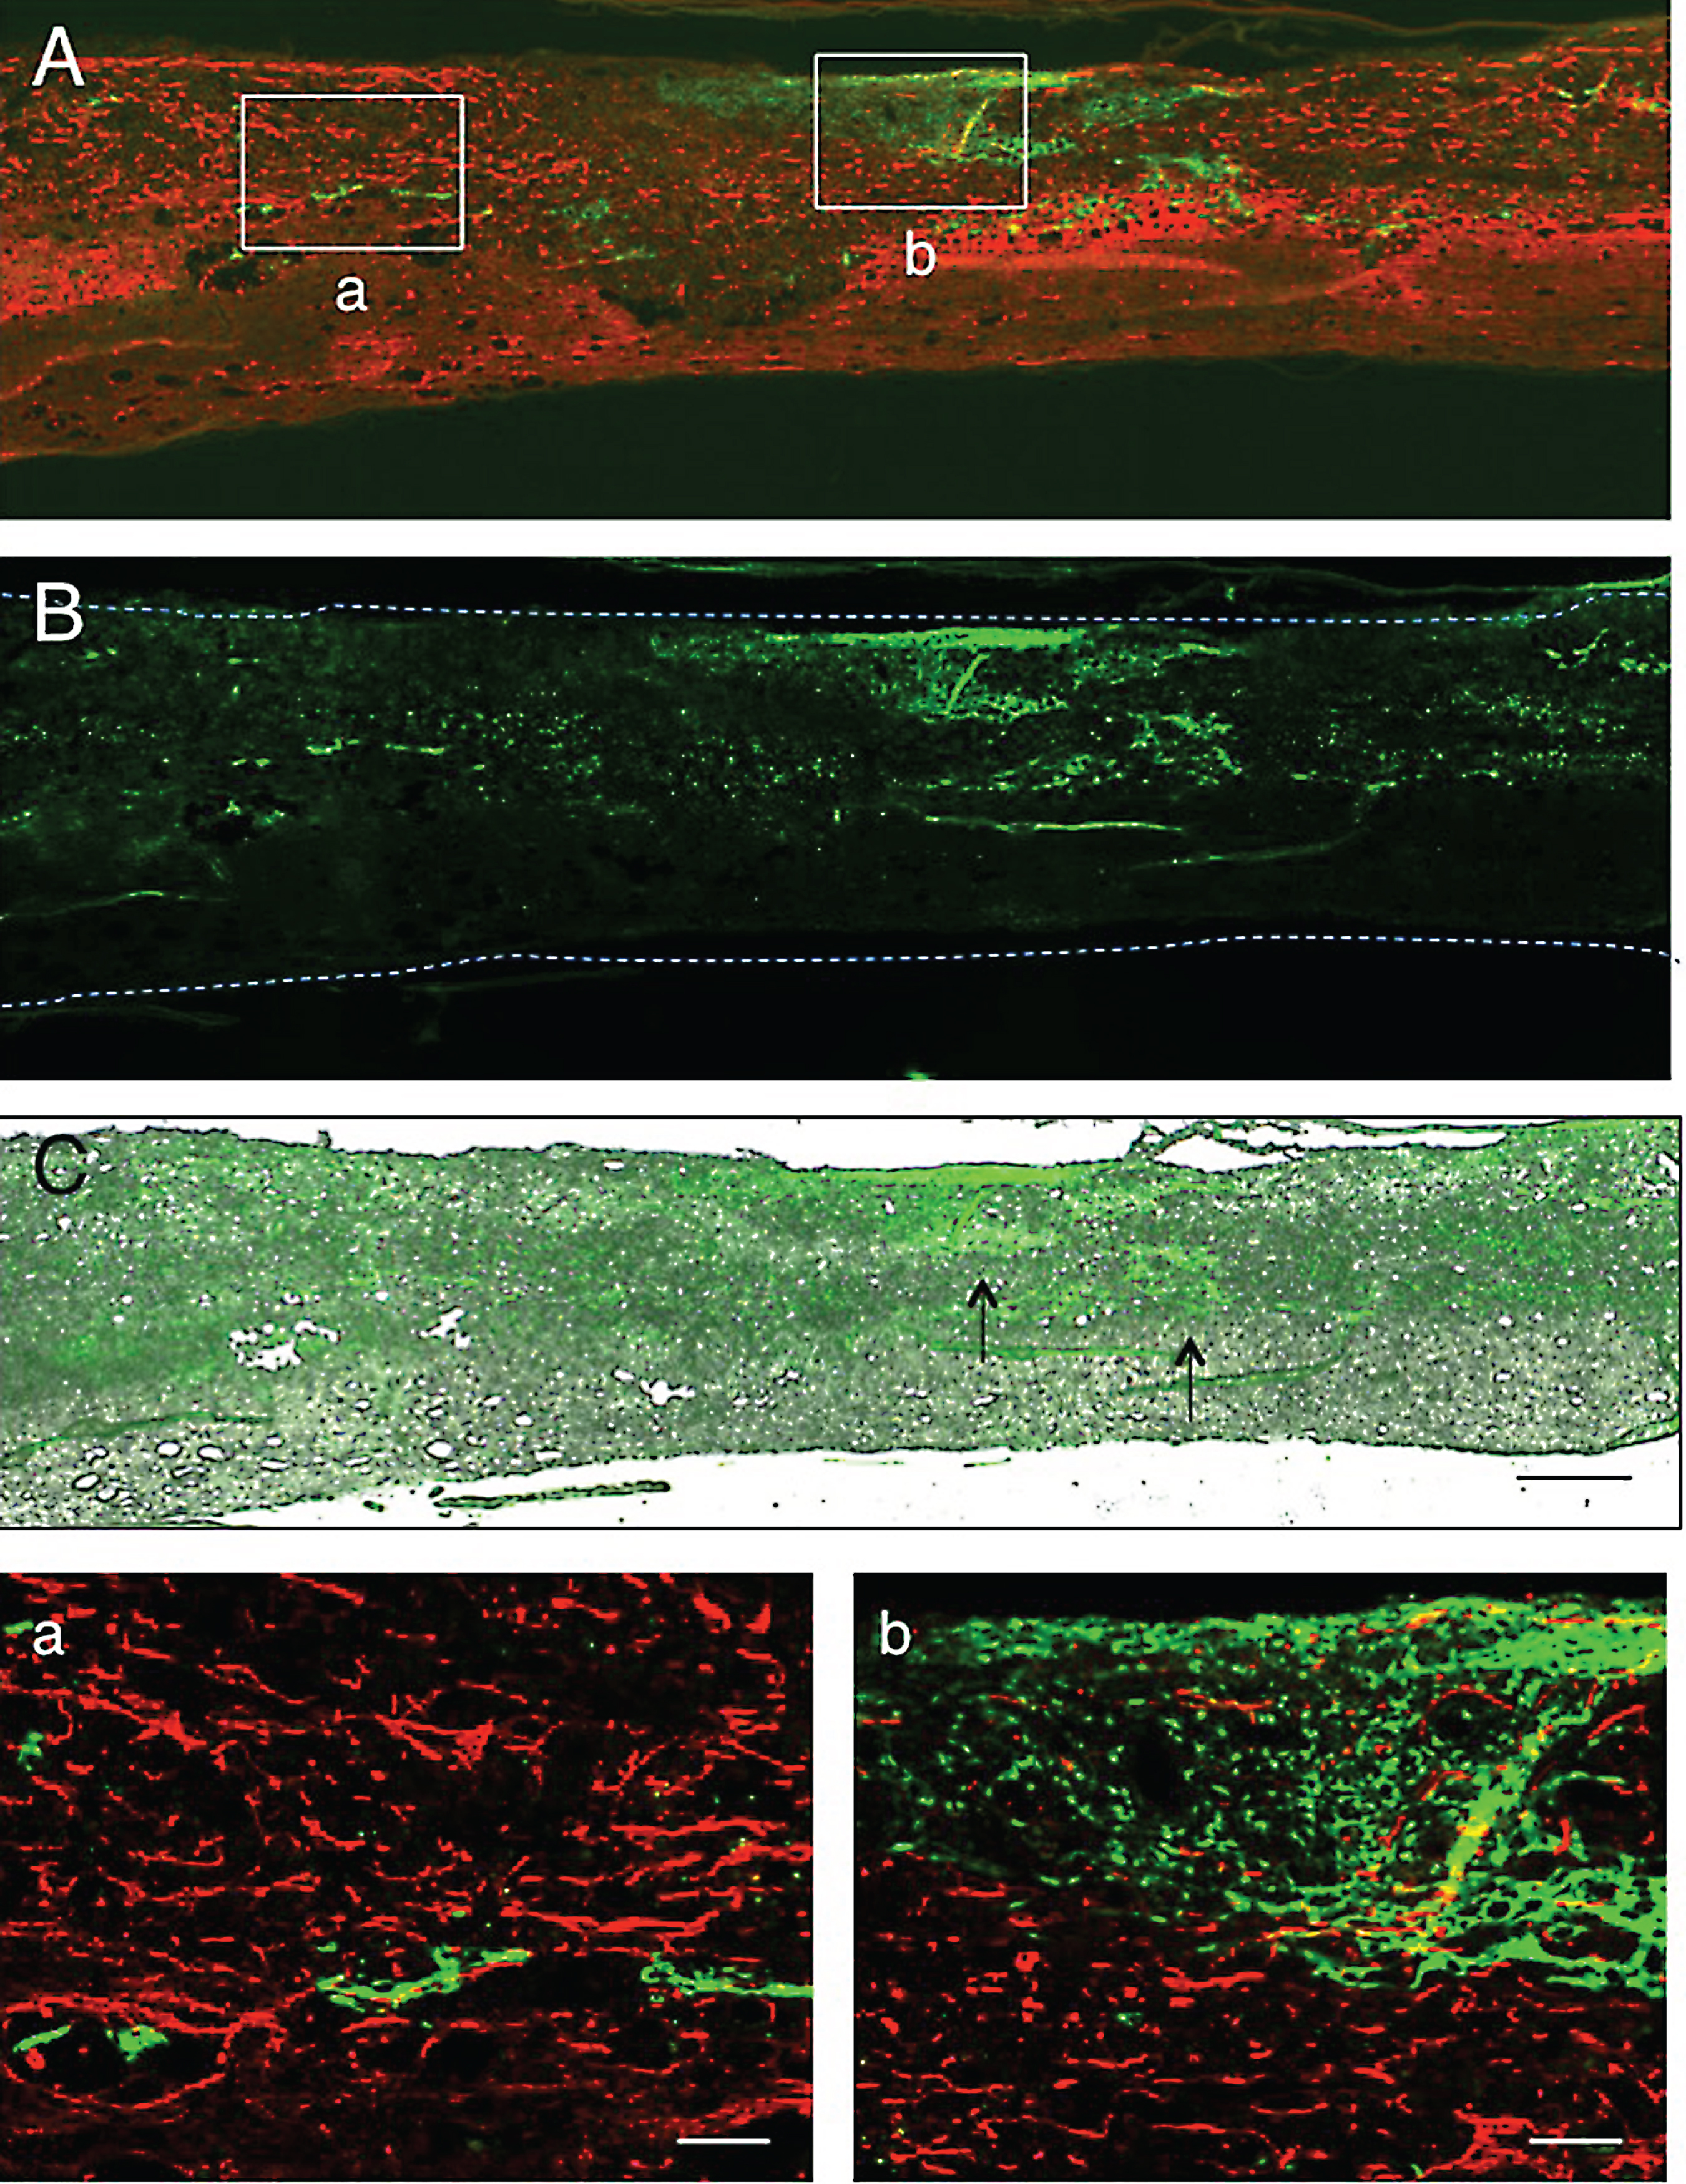
Fig.6
1 w-TP. Immunostaining for astrocytes. A: This micrograph was taken at a level several sections away from that of Fig. 4. Astrocytes in the remaining white matter are immunostained red. Several clusters of engrafted CPECs (green) are located in the astrocyte-devoid area. B: This simple fluorescent micrograph was taken from a section adjacent to that of panel A. This micrograph shows the distribution of CPEC clusters of various sizes. C: Panel B was merged in the unstained transmitted-light picture to show the localization of engrafted CPECs in the spinal cord tissue. The astrocyte-devoid areas are not vacant, but filled with tissues. Arrows point to the CPEC clusters enclosed with rectangles in panel A. a: Rectangle a in panel A was enlarged. Small clusters of CPECs (green) can be seen among astrocytes. b: Rectangle b in panel A was enlarged. A large cluster of CPECs is present in the astrocyte-devoid area. DAPI-staining shows that there are many non-astrocytic cells around the CPEC clusters in a and b. Scale: 500 μm for A-C, and 100 μm for a and b.
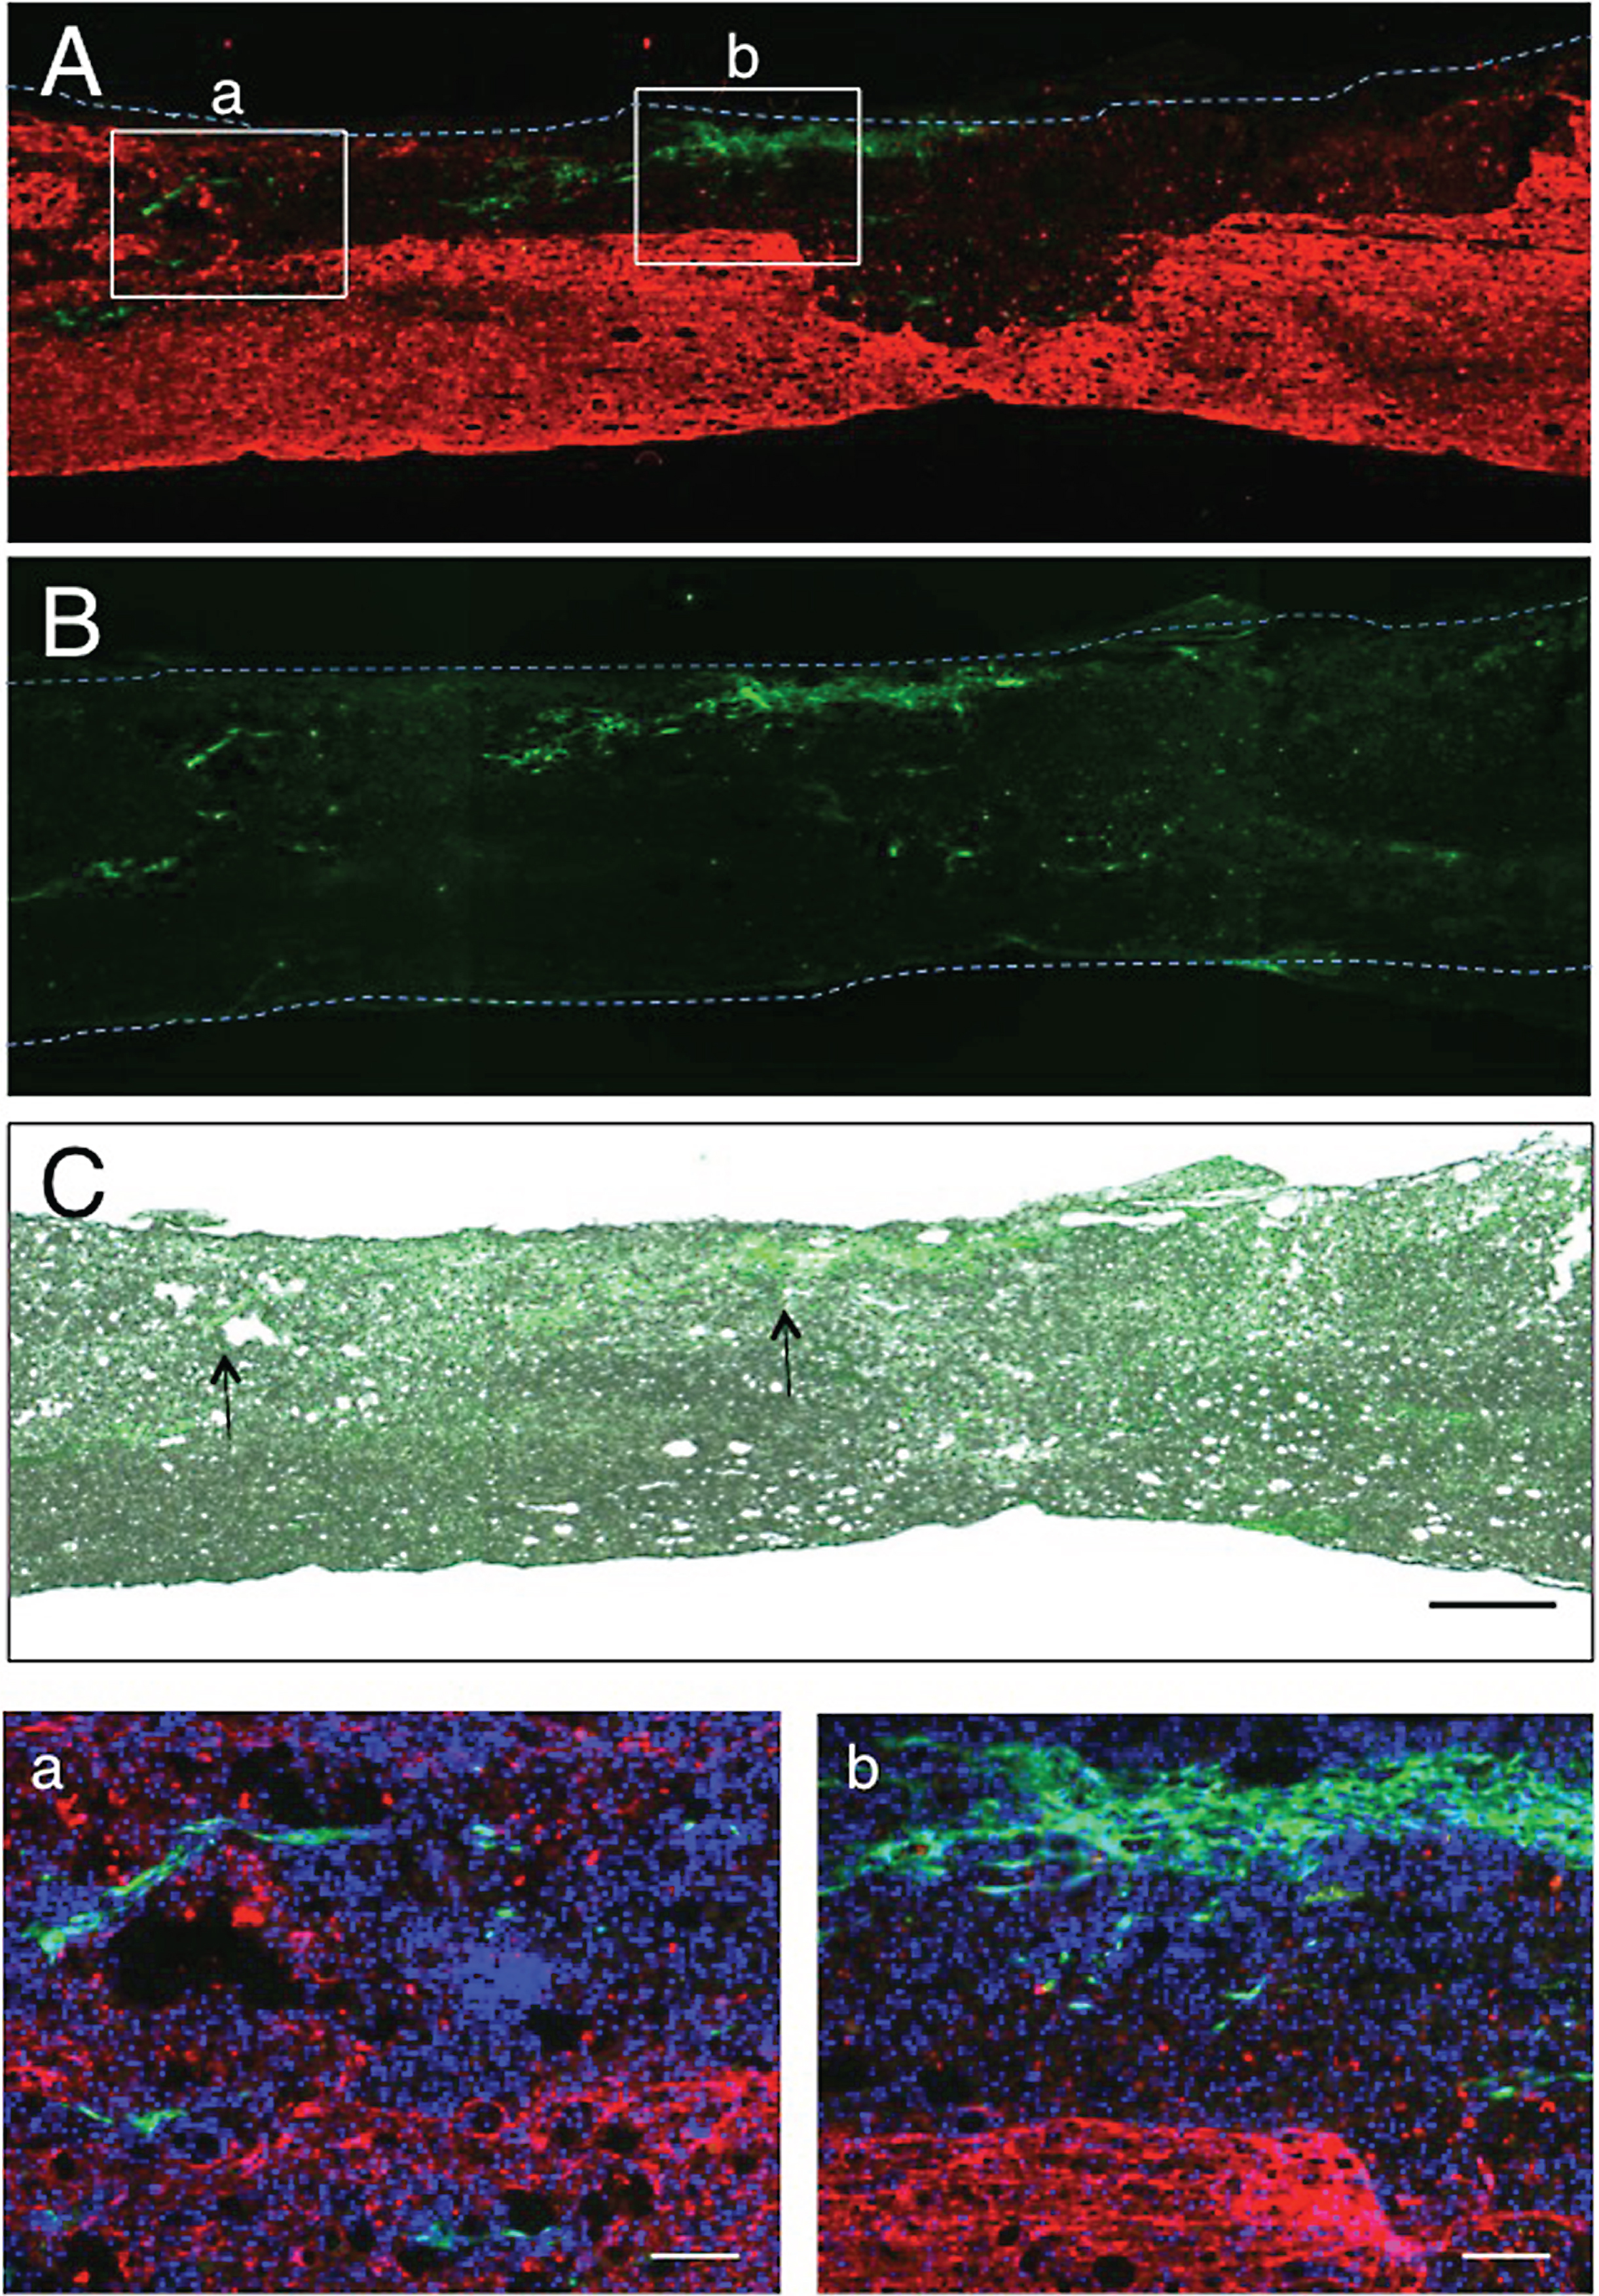
Fig.7
2 w-TP. Double-staining for axons and astrocytes. A: This section was double-stained for axons (red) and astrocytes (green). Numerous axons extend through the astrocyte-devoid areas in the spinal cord lesion. Transplanted CPECs are not found in this section. The areas enclosed with rectangles (a and b) were enlarged in panels a and b. a: Many axons with various diameters extend irregularly through the astrocyte-devoid area. b: The extension of axons is not blocked at the border of the lesion (arrow). B: This micrograph was taken from a spinal cord different from that of panel A to show the relationship between engrafted CPECs (green) and axons (red). The axonal bundles in the upper part are in the remaining white matter of the spinal cord, while those in the lower part are in the astrocyte-devoid area filled with DAPI-stained cells. Clusters of CPECs are not associated with axons. Although a few fine axons are found around the CPEC clusters, the clusters are not in direct association with axonal bundles. C: This micrograph was taken from a spinal cord different from that of panel A to show the relationship between engrafted CPECs (green) and astrocytes (red). The clusters of CPECs are situated in the astrocyte-devoid areas filled with DAPI-stained cells. Scale: 500 μm for A, 100 μm for a and b, and 100 μm for B and C.
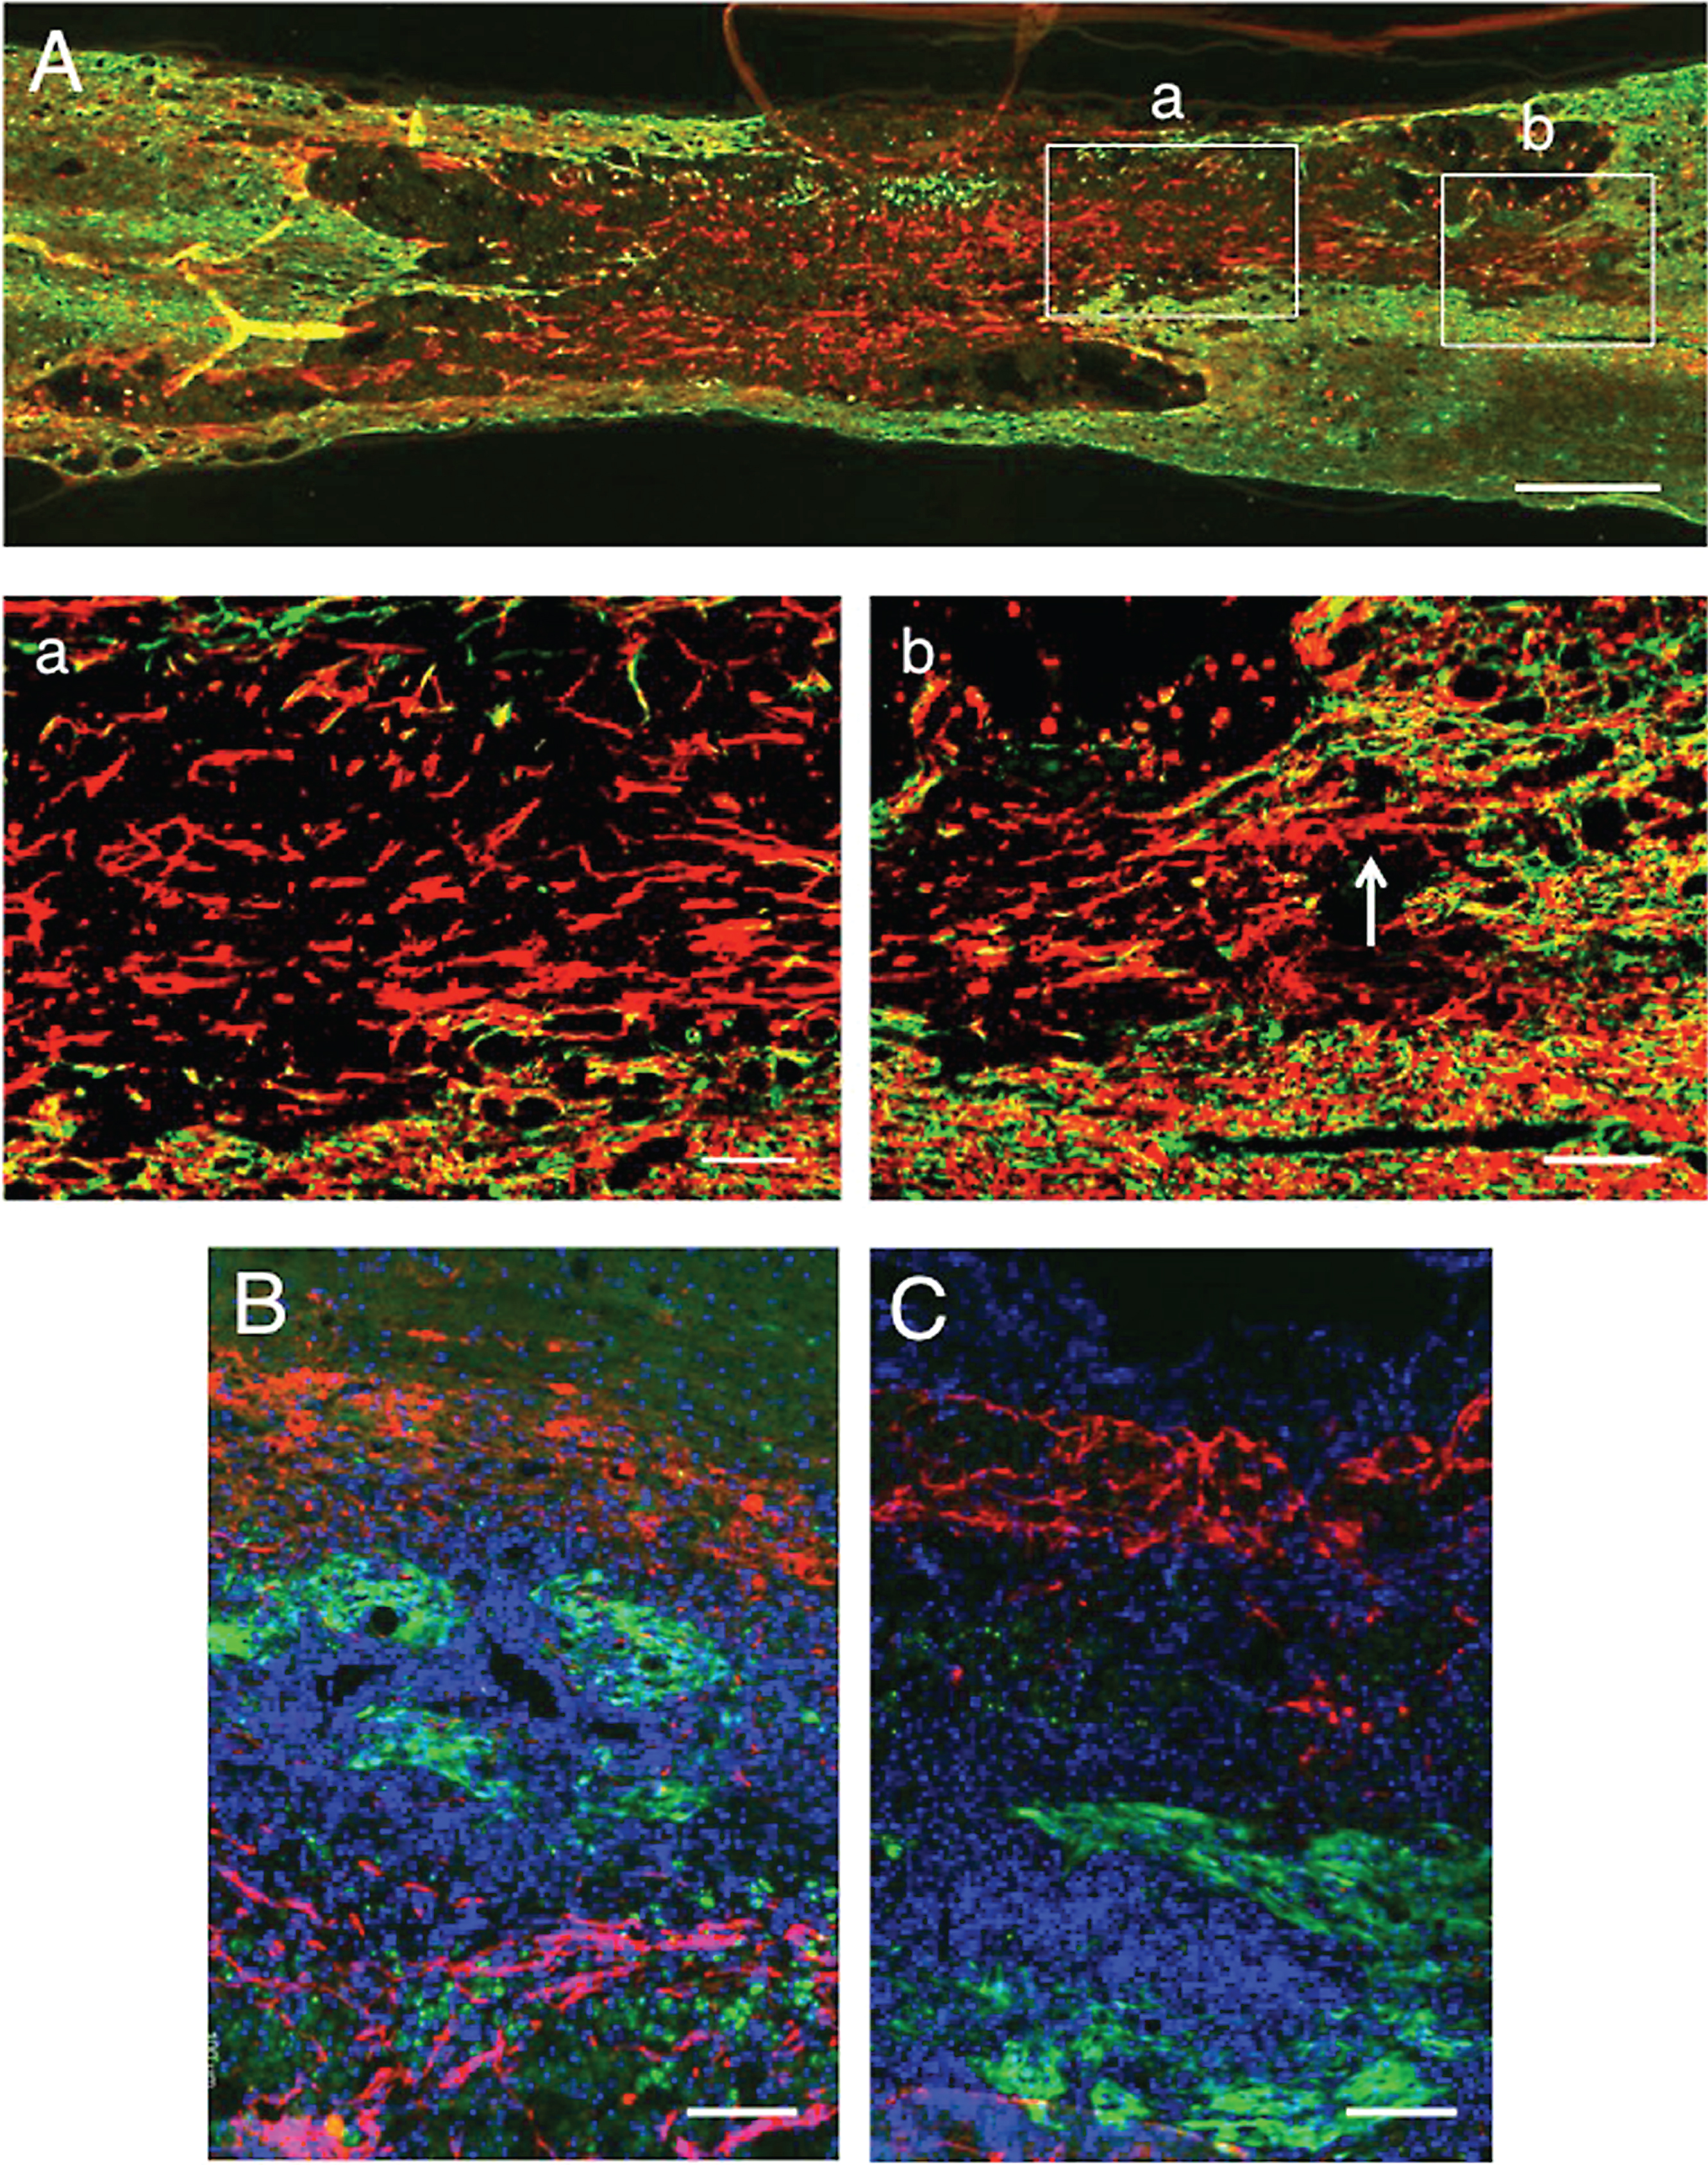
Fig.8
Immunoelectron microscopy of engrafted CPECs. A: 1 w-TP. A cluster of CPECs is shown. B: An immunoelectron micrograph of CPECs 1 w-TP. CPECs stained lightly dark by DAB staining are in direct contact with connective tissue matrices (Co). C: 2 w-TP. A cluster of CPECs is shown. There are hole-like spaces devoid of CPECs within the cluster. D: An immunoelectron micrograph of CPECs 2 weeks after transplantation. CPECs (Cp) stained dark by DAB staining are in close contact with cells of an unknown nature (N). E: 2 w-TP. This micrograph shows an example of the association of CPECs (green) with axons (red). F: An immunoelectron micrograph of CPECs 2 weeks after transplantation. CPECs (Cp) lightly stained dark by DAB staining are in direct contact with an axon (A). Scale: 50 μm for A, C, and 100 μm for E, and 5 μm for B, 5 μm for D, 2 μm for F.
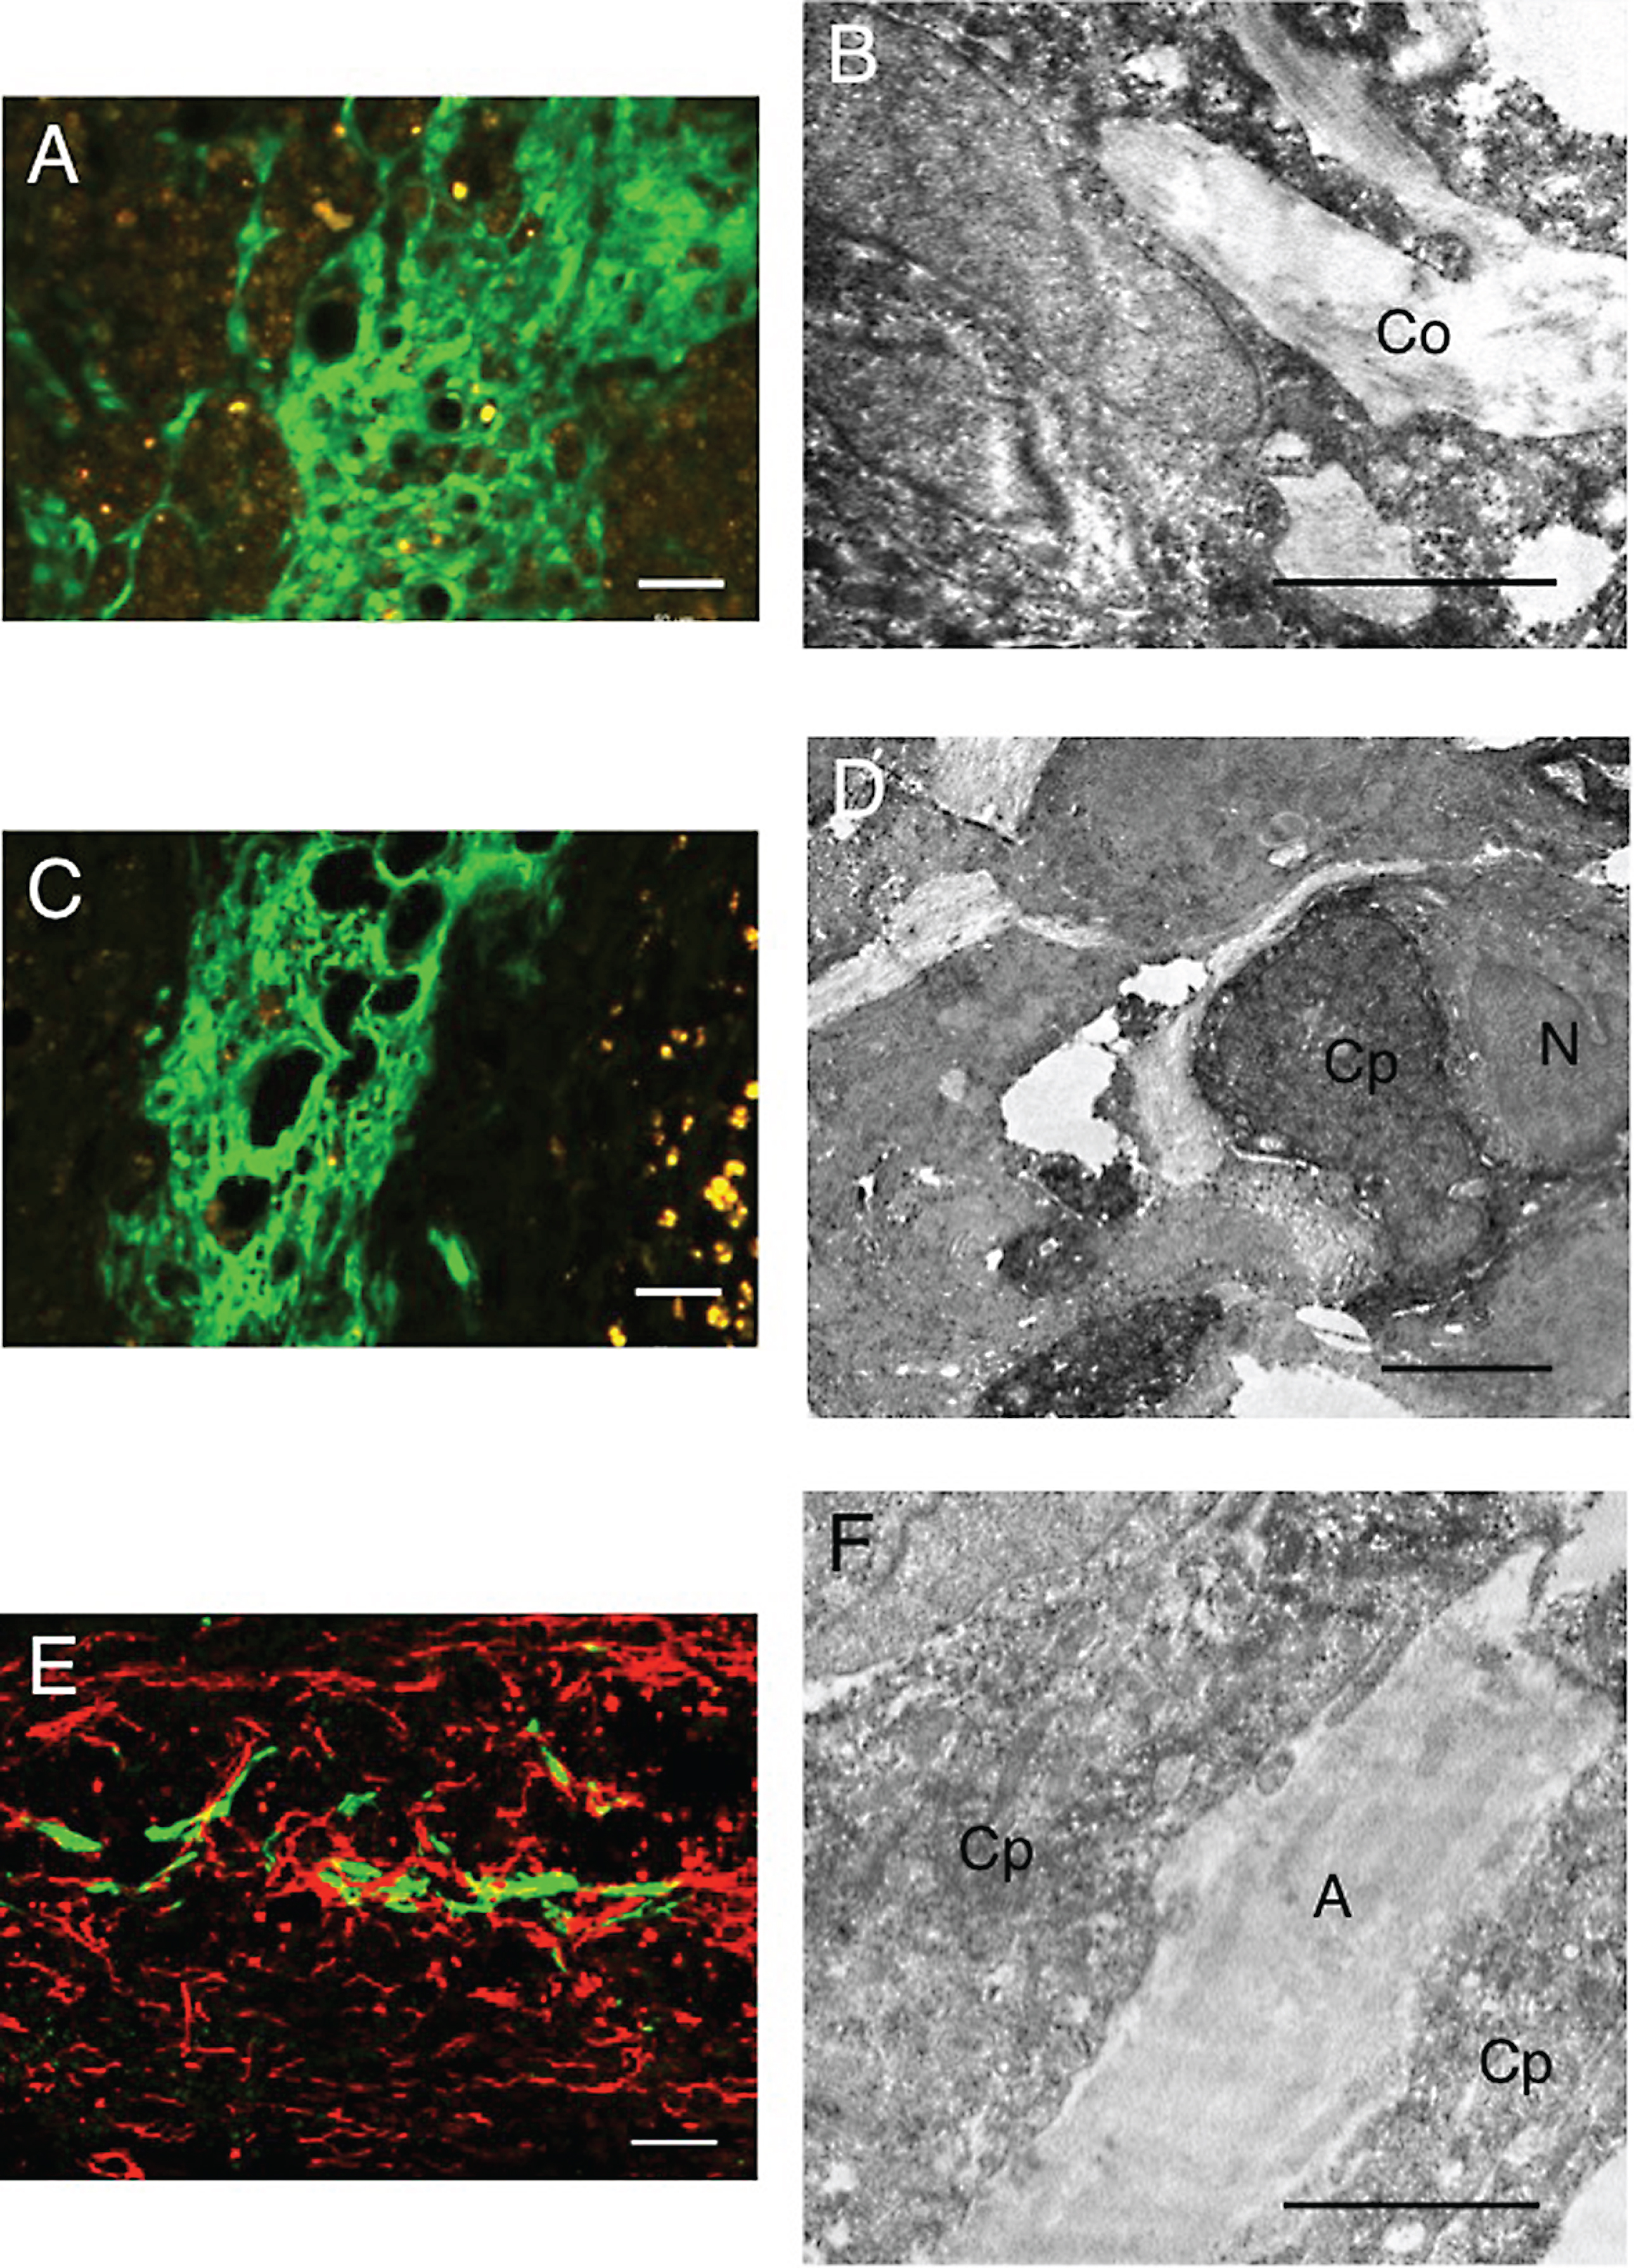
Fig.9
Double staining for axons (red) and astrocytes (green). 5 w-TP. A: There are astrocyte-devoid areas (*) at the lesion. There is no astrocyte scar at the border of the lesion. a: The part enclosed with rectangle a in panel A was enlarged (staining for axons). There are numerous axons with various diameters and irregular orientations in this astrocyte-devoid area. b: The part surrounded with rectangle b in panel A is enlarged (staining for axons). The region (As) corresponds to the astrocyte region (green) in rectangle b. Axons spared in the white matter at the border of the lesion are fine and longitudinally oriented. Scale: 500 μm for A, and 100 μm for a and b.
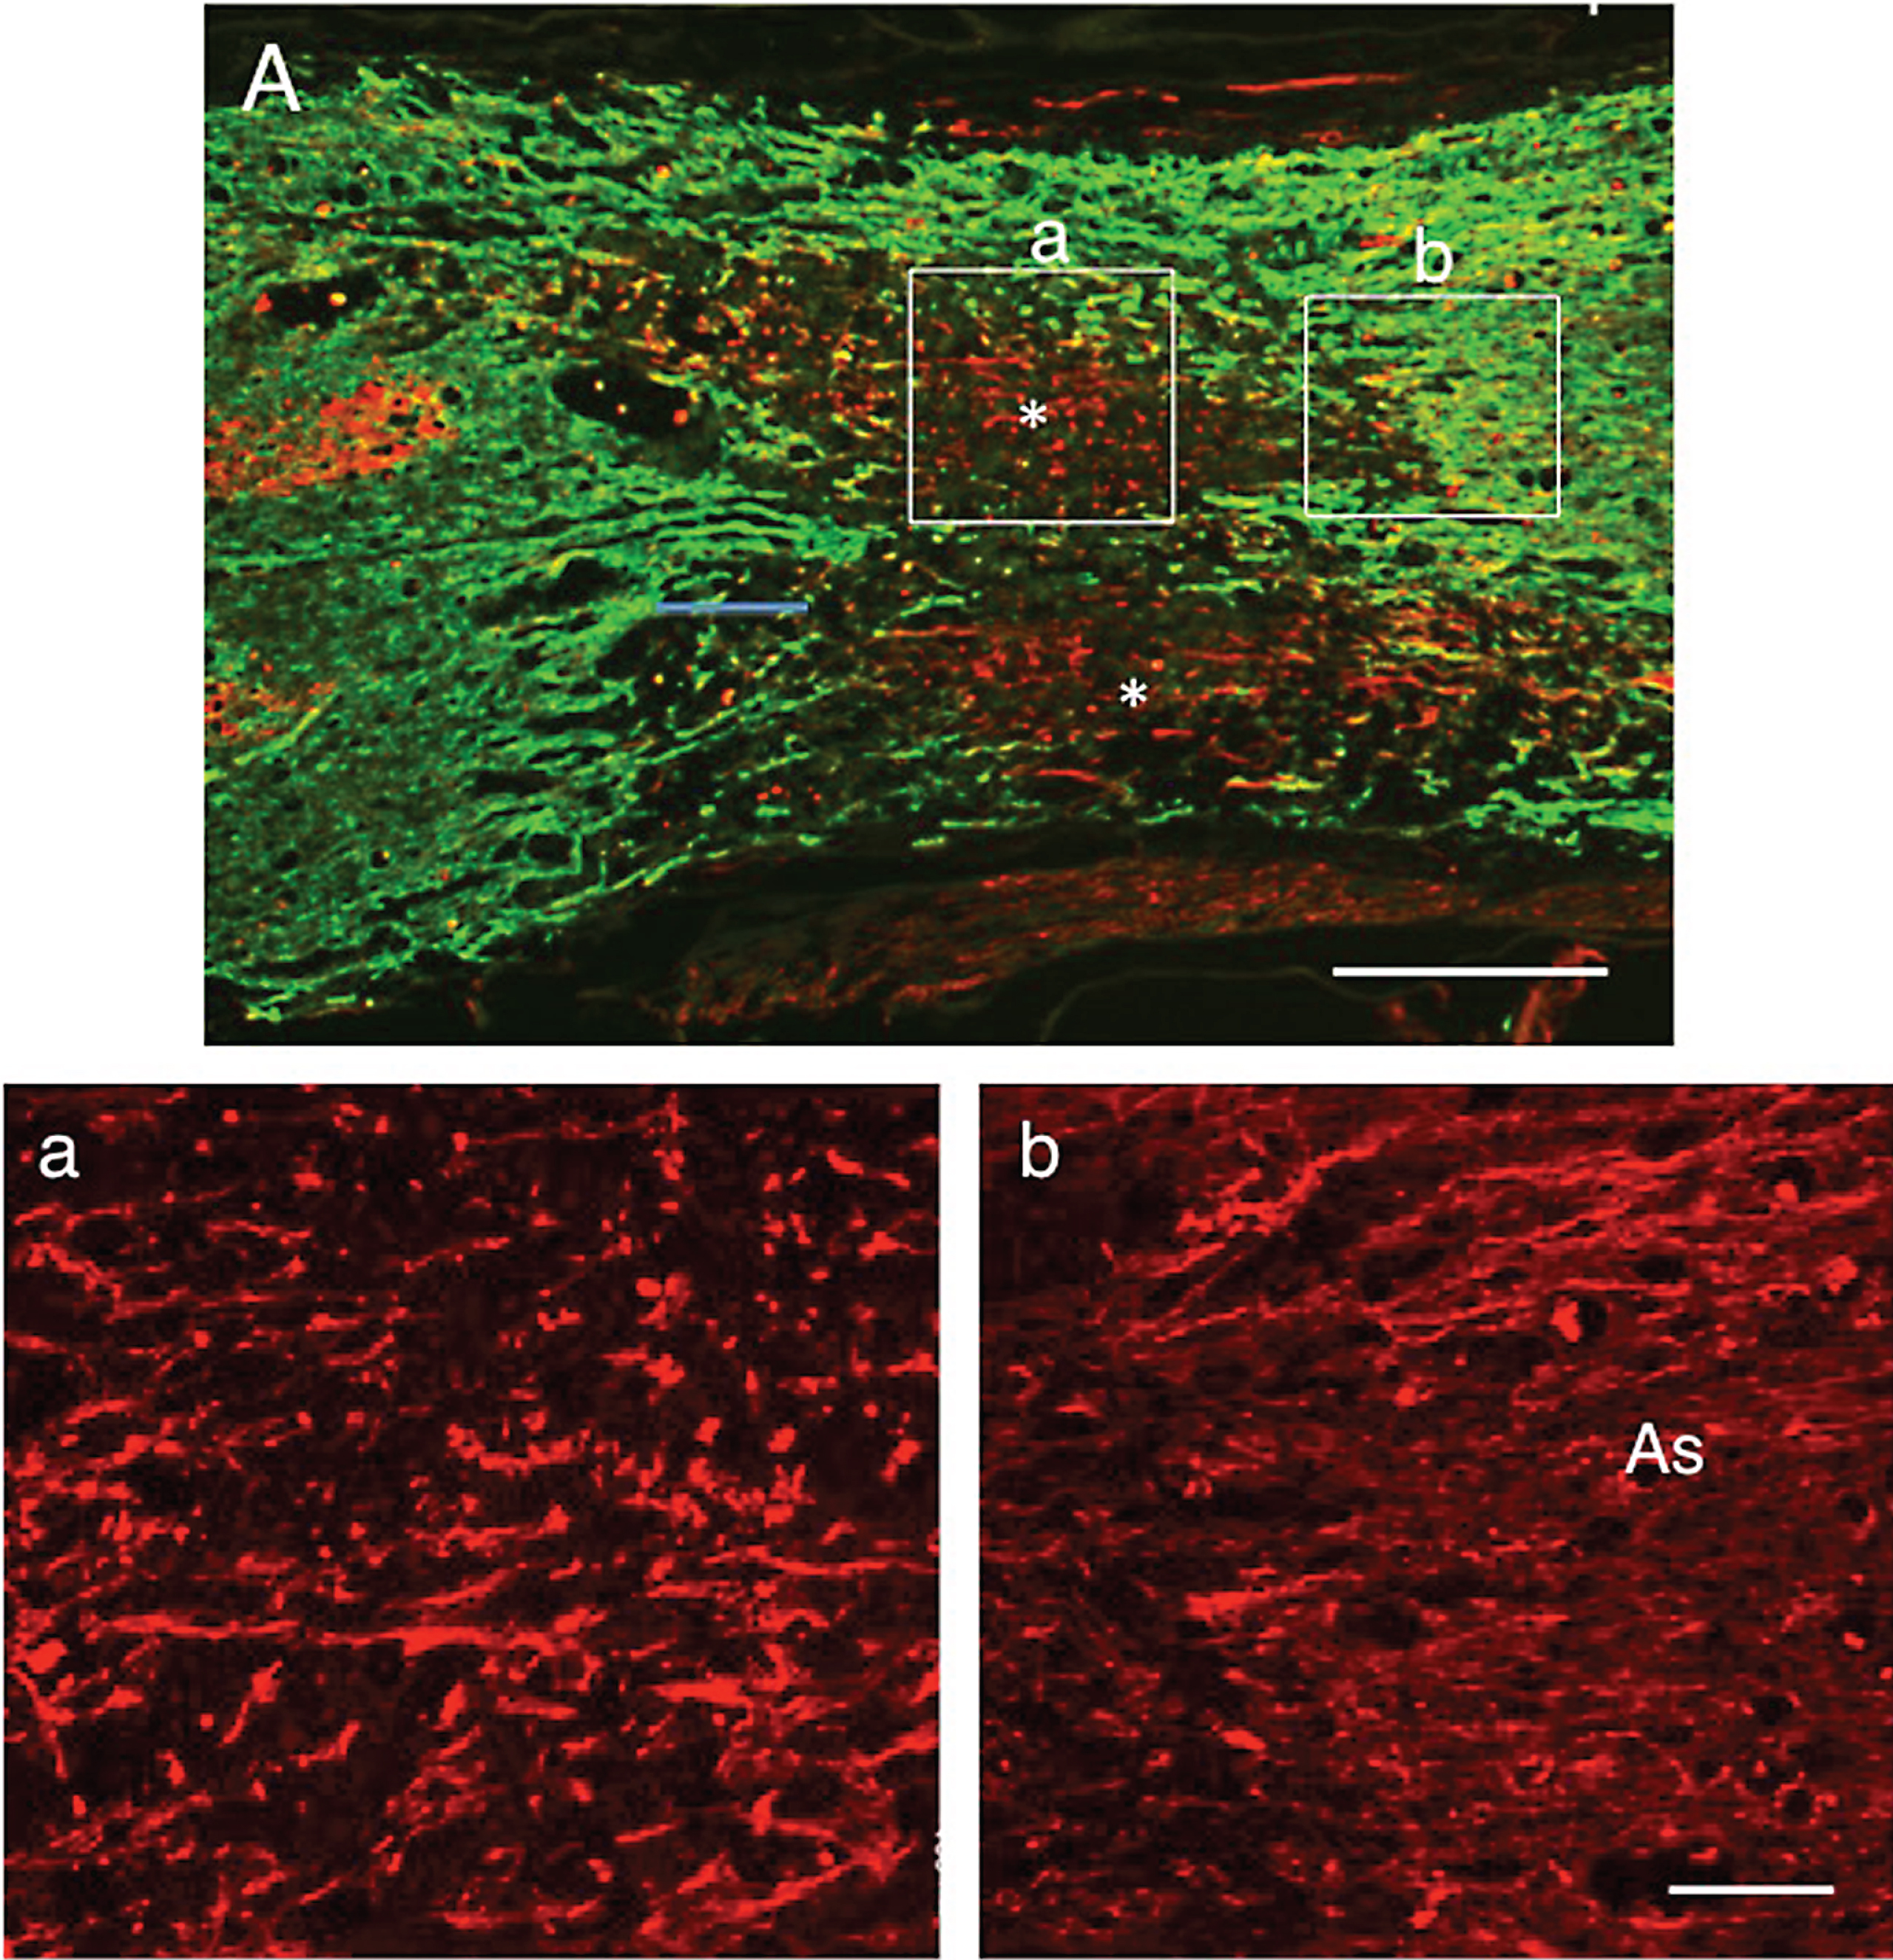
Fig.10
Conventional electron microscopy of axons in the astrocyte-devoid areas. 5 w-TP. This electron micrograph was taken from the astrocyte-devoid area of the spinal cord at 5 w-TP. Myelinated (m) and unmyelinated (u) axons are bundled, and surrounded by perineural sheaths (p). Axons are associated with Schwann cells (S). All these cellular components are embedded in the collagen fibril matrices (C). Scale: 5 μm.
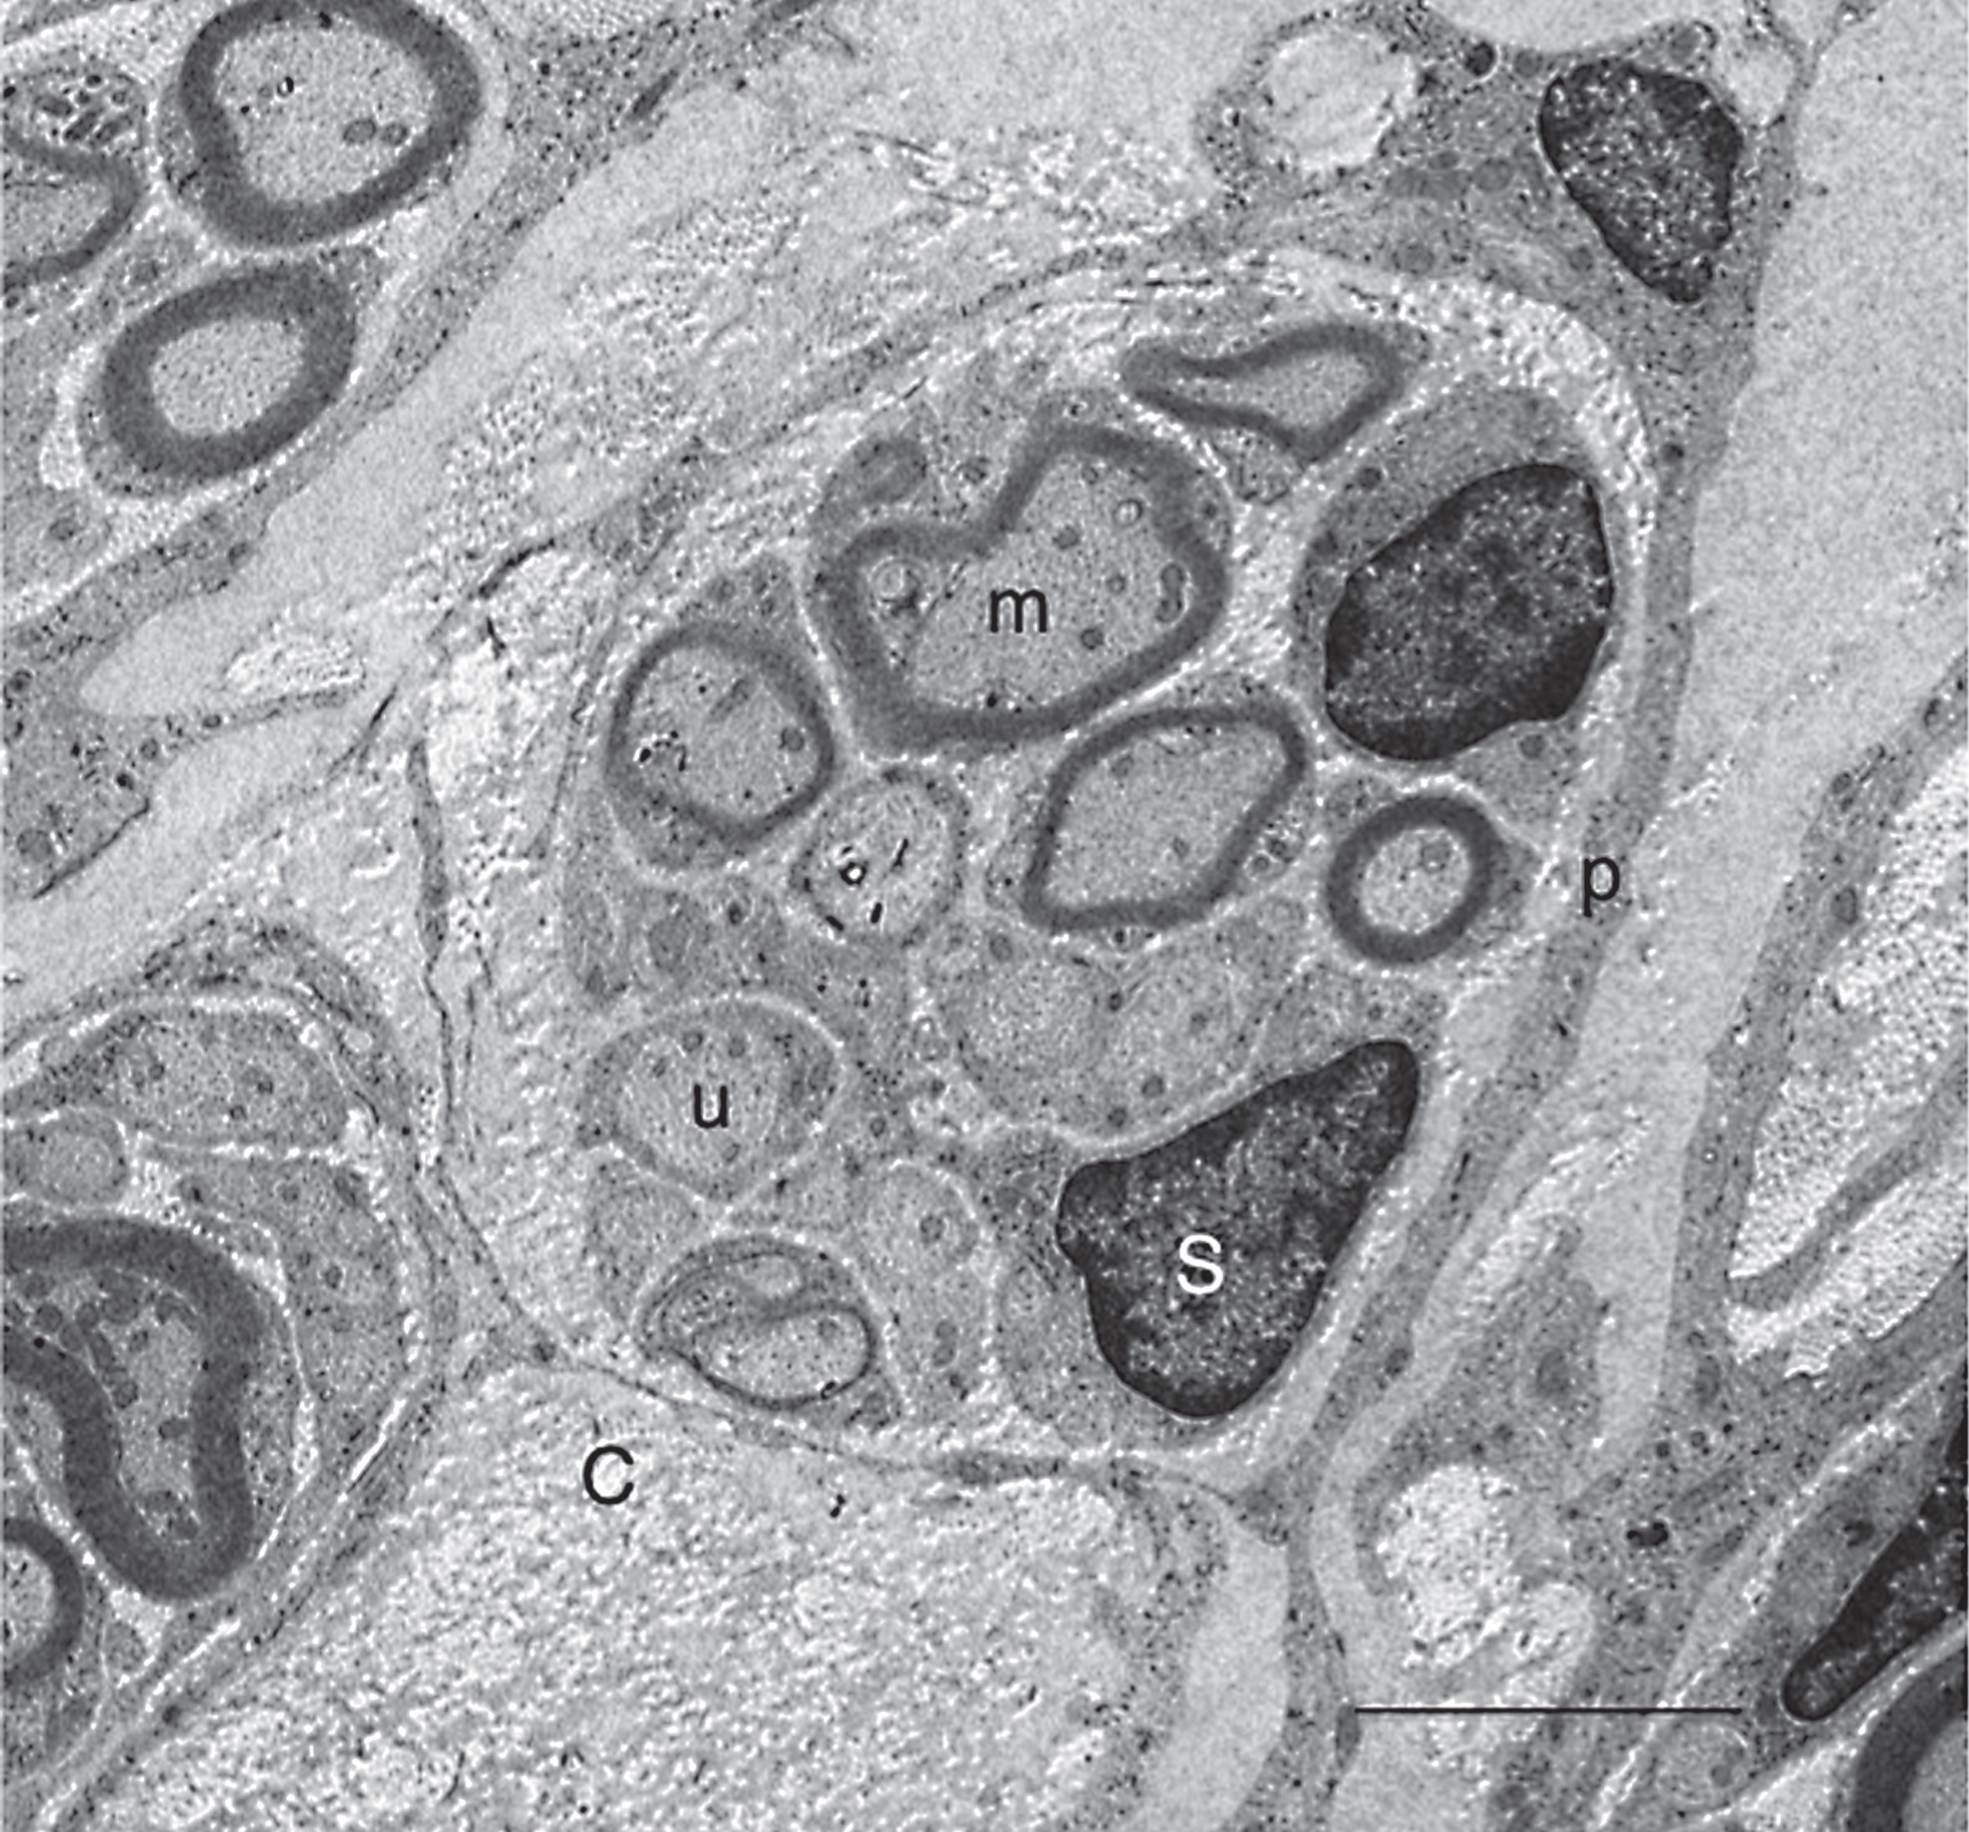
Fig.11
Control spinal cord. 5 w-TP. Double staining for axons (red) and astrocytes (green). A: Low magnification of the spinal cord lesion. There are cavities on both sides of the lesion, and axons extend through the region connecting the cavity areas. B: A part of the rectangle in panel A was enlarged. Axons have various diameters and extend in various directions. C: The density of axons was quantified by measuring β-III-tubulin-positive areas in the astrocyte-devoid areas. The data shown are the mean±SD (n = 3). There was a significant difference between PBS-injected and CPEC-transplanted spinal cords at P < 0.05 (*). Scale: 500 μm for A, and 100 μm for B.
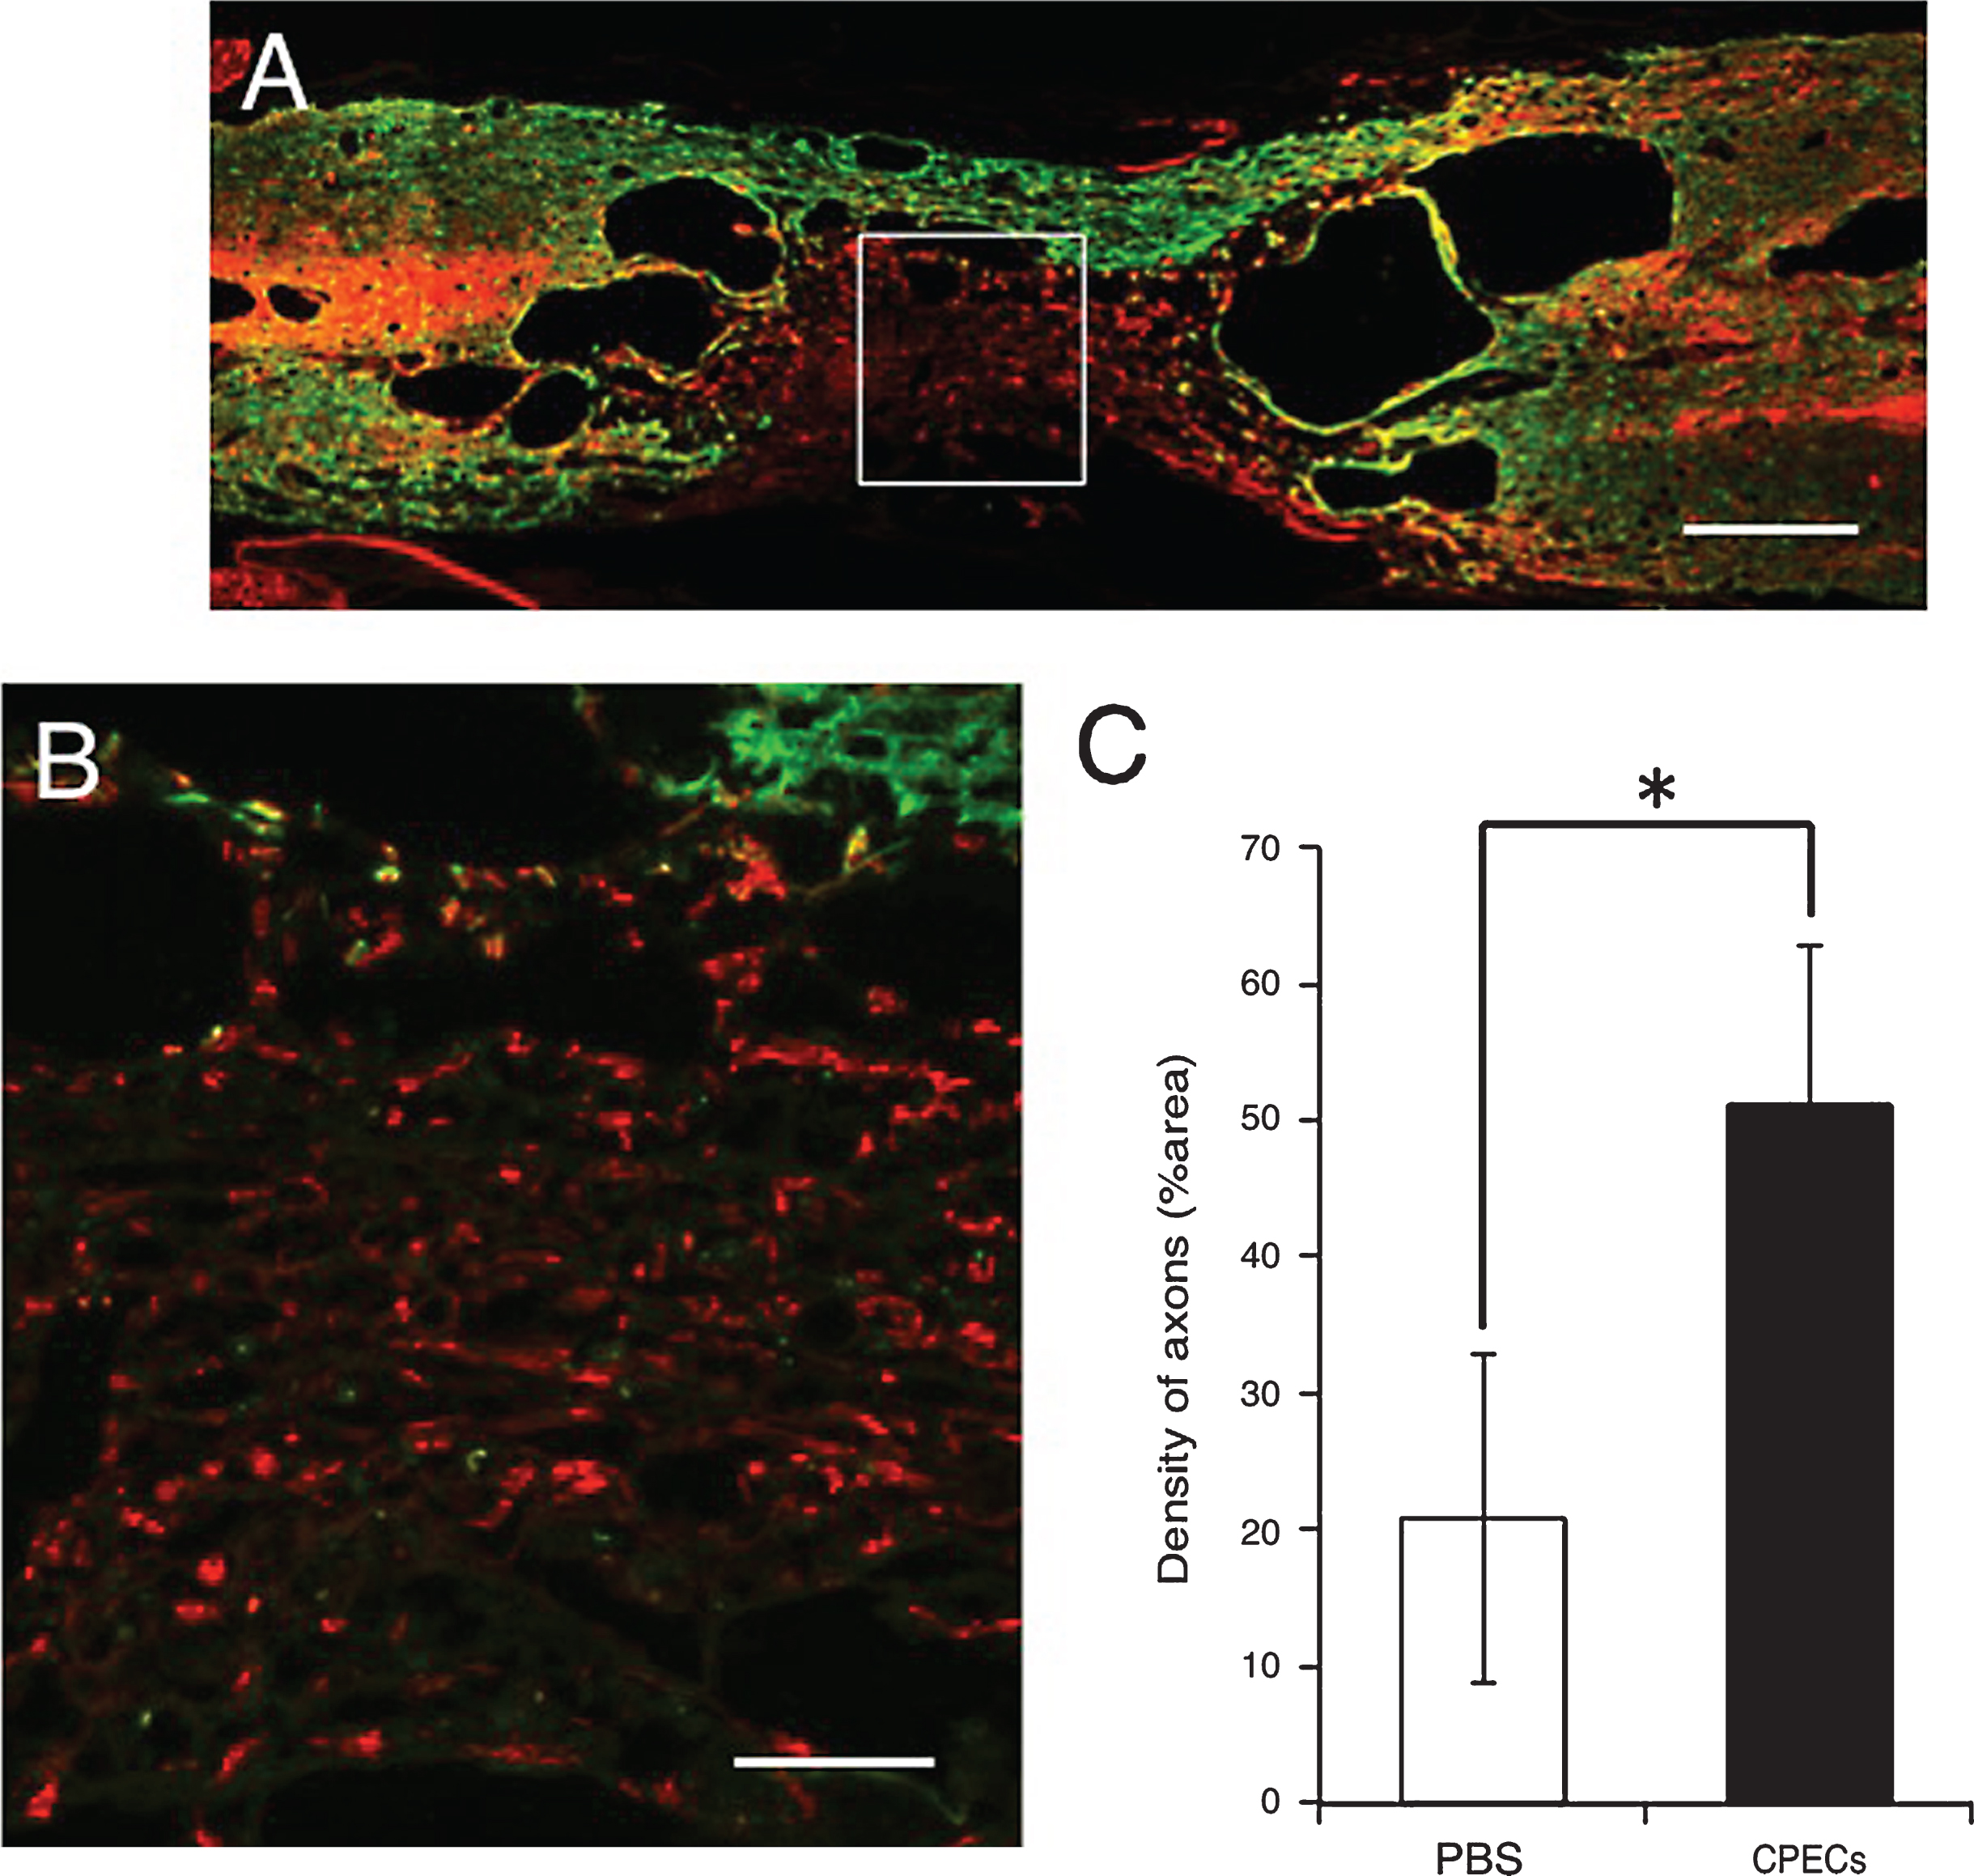
Fig.12
Relative volume of cavities at 5 w-TP. HE staining. A: A longitudinal section of the control spinal cord to which PBS was injected instead of CPECs. B: A longitudinal section of the spinal cord to which CPECs were transplanted. Scale: 500 μm for A and B. C: Estimation of relative volume of cavities in the PBS-injected and CPEC-transplanted spinal cords. There was a significant difference between PBS-injected and CPEC-transplanted spinal cords at P < 0.05 (*).
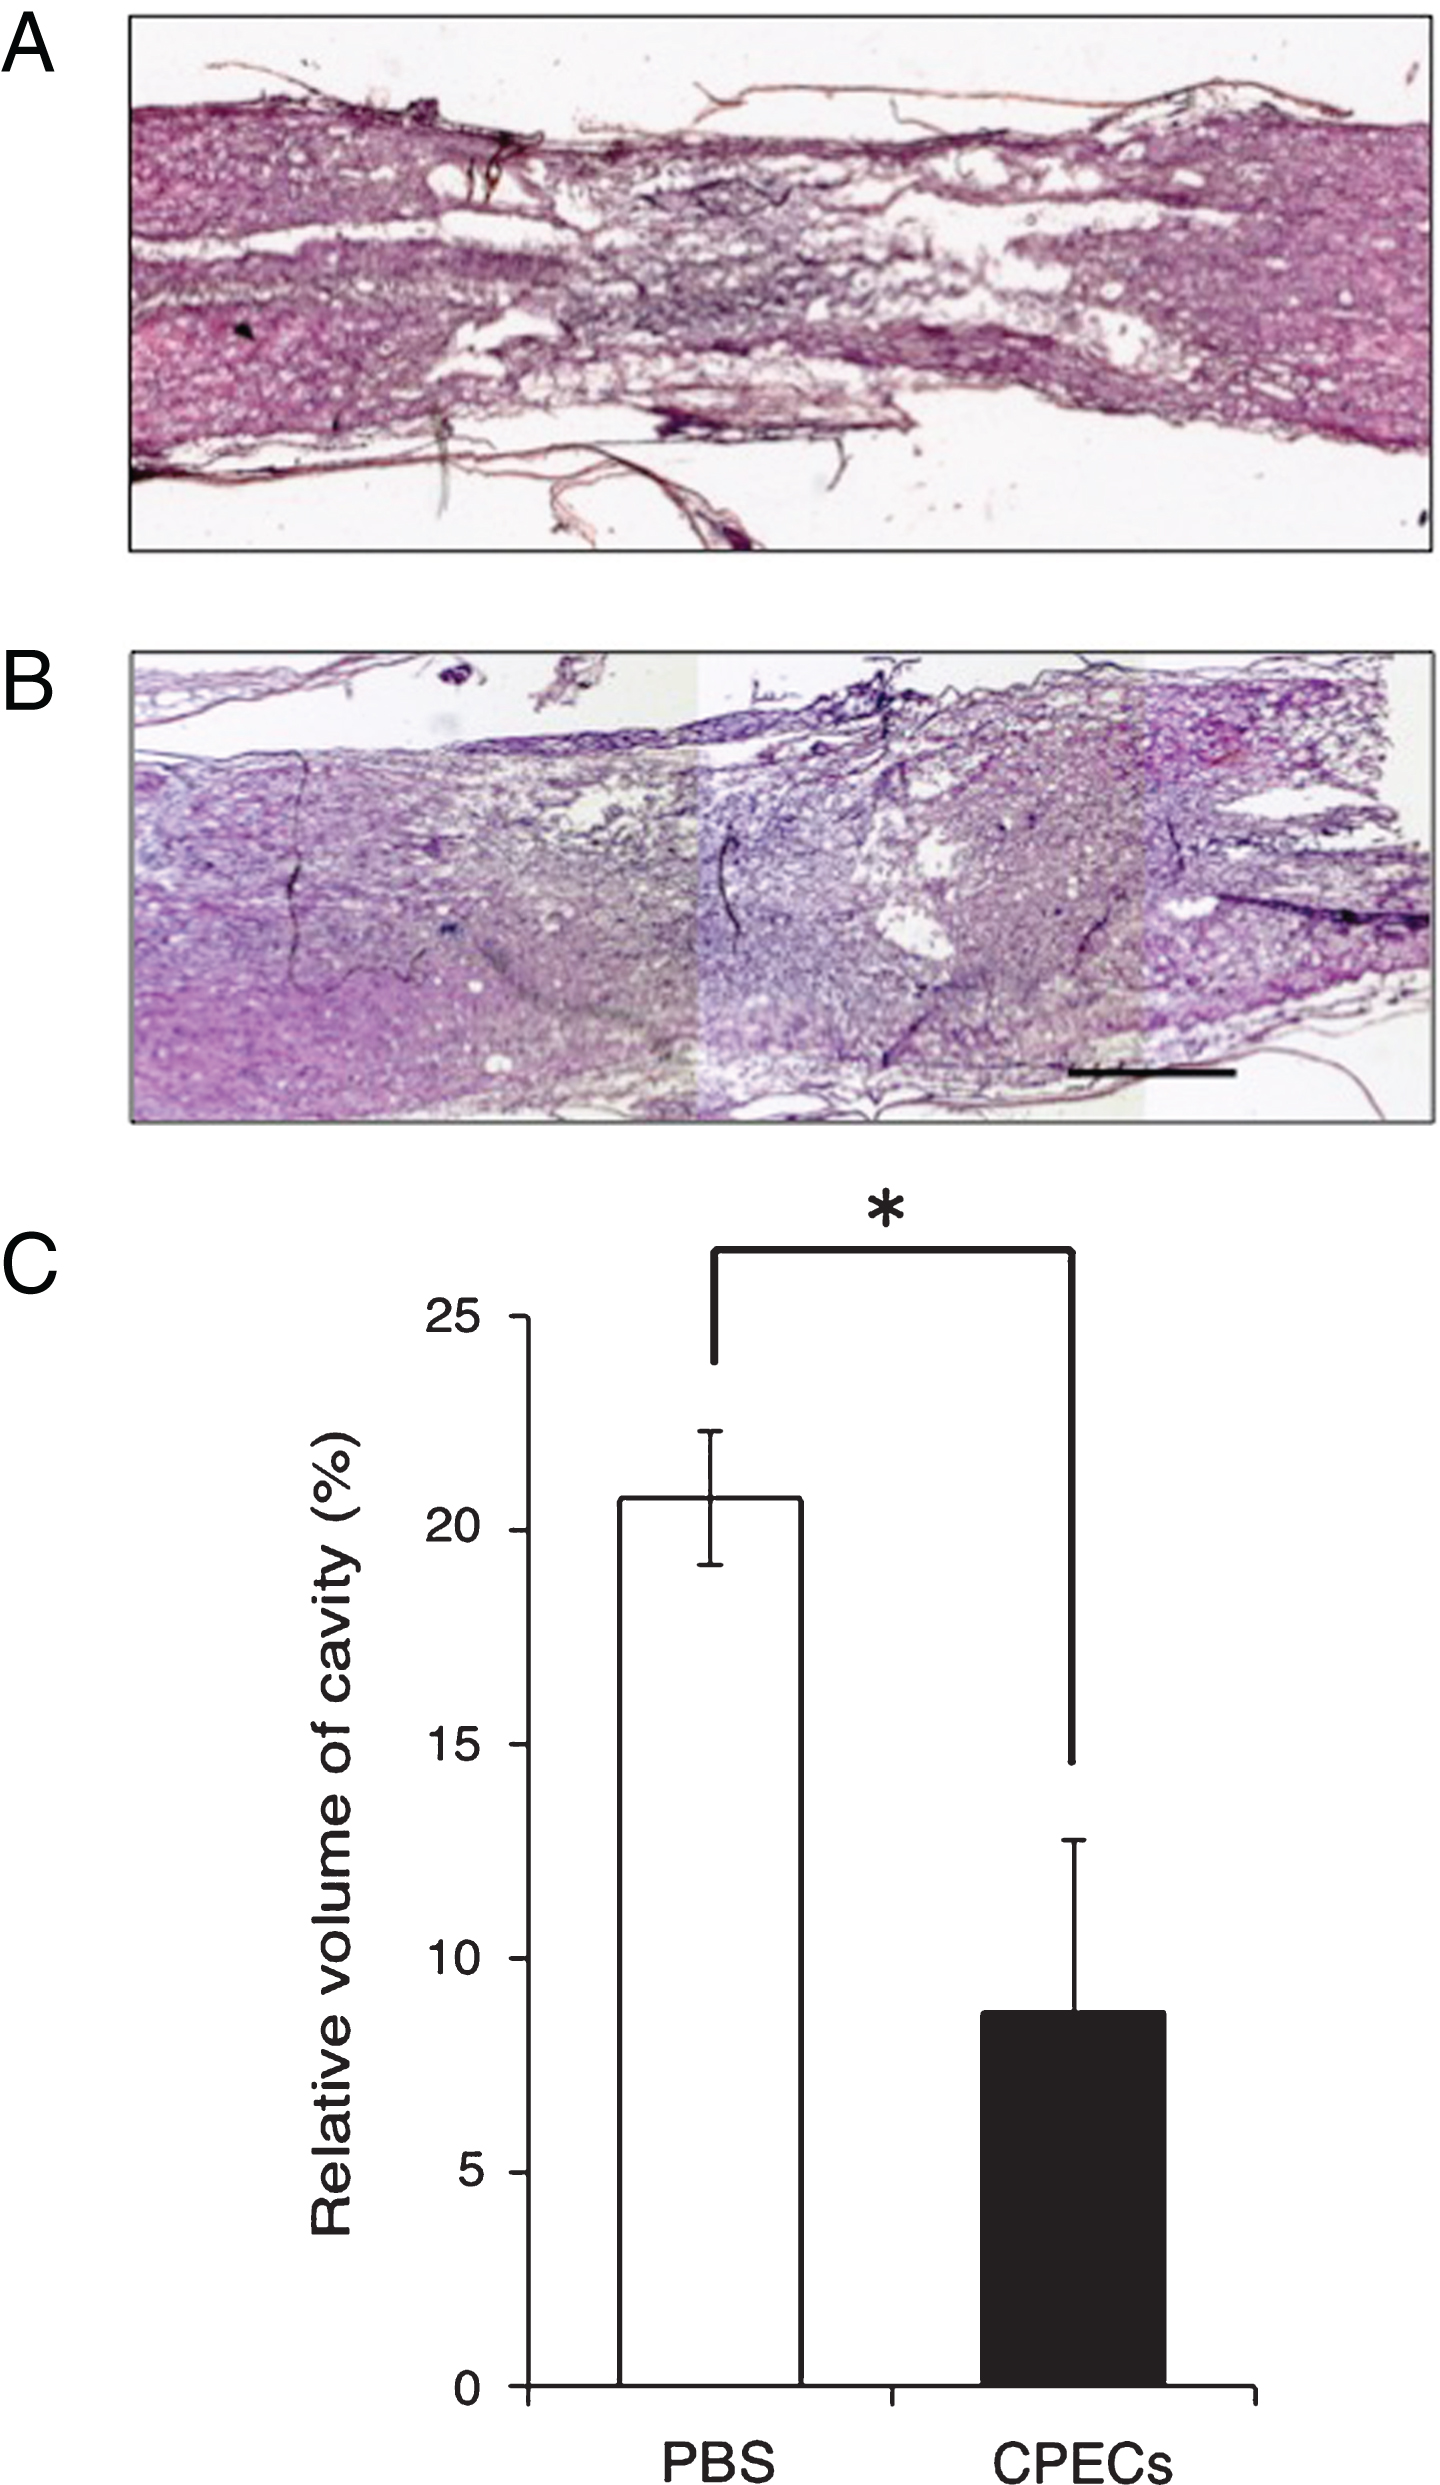
Fig.13
BBB scores. Effect of CPEC transplantation on locomotor behaviors. There are significant differences at 1-4 w-TP between the PBS-injected and CPEC-transplanted rats, at P < 0.0005 (*) and P < 0.005 (**).