
Potential determinants of efficacy of mirror therapy in stroke patients – A pilot study
Abstract
Background: Mirror therapy (MT) was found to improve motor function after stroke. However, there is high variability between patients regarding motor recovery.
Objectives: The following pilot study was designed to identify potential factors determining this variability between patients with severe upper limb paresis, receiving MT.
Methods: Eleven sub-acute stroke patients with severe upper limb paresis participated, receiving in-patient rehabilitation. After a set of pre-assessments (including measurement of brain activity at the primary motor cortex and precuneus during the mirror illusion, using near-infrared spectroscopy as described previously), four weeks of MT were applied, followed by a set of post-assessments. Discriminant group analysis for MT responders and non-responders was performed.
Results: Six out of eleven patients were defined as responders and five as non-responders on the basis of their functional motor improvement. The initial motor function and the activity shift in both precunei (mirror index) were found to discriminate significantly between responders and non-responders.
Conclusions: In line with earlier results, initial motor function was confirmed as crucial determinant of motor recovery. Additionally, activity response to the mirror illusion in both precunei was found to be a candidate for determination of the efficacy of MT.
1Introduction
Today, in the aging society of industrial countries, stroke is the leading cause for disability (Johnston, Mendis, & Mathers, 2009; Murray, 1996). About one third of all stroke patients suffer from a severe arm paresis (Heller et al., 1987; Jorgensen et al., 1995). For these patients, therapy is mostly focused on assisted movements of the affected limb (Broeks et al., 1999). Many therapies requiring active movements, like constraint-induced therapy (Taub, Crago, & Uswatte, 1998) or repetitive active arm training, are not realizable for patients with severe arm paresis. Given that the severely affected paretic arm is mostly accompanied by additional somatosensory deficits, this patient group is furthermore disadvantaged.
An alternative is the application of visual input in the therapy, e.g. by mirror therapy (MT). In MT, a mirror is placed mid-sagittally on a table in front of the sitting patient, with the affected limb placed behind and the non-affected in front of the mirror. When the patient looks into the mirror, the movements of his or her non-affected arm mask the view of the affected arm, eliciting the so called mirror-illusion (Ramachandran, 1994). Especially over the last years, several studies demonstrated the beneficial effects of MT on upper limb motor function, activities of daily living (Thieme et al., 2012) and pain for patients after stroke (Bowering et al., 2013). However, inter-individual variability in the outcome can be high: In randomized clinical trials, some patients took benefit from the application of MT while others did not, so that patients might be classified as MT “responders” and “non-responders” (Dohle et al., 2009). Up to now, it is unknown which factors determine these differences in efficacy of the MT.
The outcome is probably determined by the functional state of the neural mechanisms mediating the effect of MT. However, the underlying neuronal mechanisms of MT are not fully understood. Some researchers assumed the mirror neuron system (MNS) to play an important role in the effect of MT (Hamzei et al., 2012). The MNS is activated during observation of one’s own or another person’s limb movements (Rizzolatti, Fabbri-Destro, & Cattaneo, 2009). Another possible mediating structure identified in fMRI studies is the precuneus (PC). In normal subjects, Wang and colleagues observed differences in the cerebral activation patterns during movement observation and movement mirroring: While the mirrored visual feedback of one’s own hand elicited additional activation in the PC strictly lateralized contralateral to the perceived hand, the observation of a third person’s hand showed no such lateralization (Wang et al., 2013a). These results are in line with previous findings of Dohle and colleagues, who found additional activation of PC due to the mirror strictly contralateral to the perceived hand (Dohle et al., 2004). Results from a study on a single-subject analysis level indicate that this effect seems to be similar when comparing normal subjects and stroke patients with severe arm paresis (Wang et al., 2013b).
This effect of the mirror illusion on activity in PC was confirmed using functional near-infrared-spectroscopy (fNIRS). Just as fMRI, fNIRS measures the blood oxygen level dependent (BOLD) signal, recording oxygenated (HBO) and deoxygenated (HBR) blood in the cerebral cortex (Obrig & Villringer, 2003), but is easier to apply, especially in a clinical setting (Muehlschlegel et al., 2009; Strangman et al., 2006). In their fNIRS study on the mirror illusion in normal subjects, Mehnert and colleagues (2013) confirmed the above mentioned fMRI results that ipsilateral activations in the PC increase due to the mirror illusion. Additionally, they demonstrated that increased activation of the PC ipsilateral to the moved hand was accompanied by decreased activation of the contralateral PC, while no such interaction was found for activation of the primary motor cortex (M1). In other words, the limb specific representation in PC is activated according to the observed limb (Mehnert et al., 2013). Translating this phenomenon observed in normal subjects into patients, this would imply that the mirror illusion changes the inter-hemispheric activation balance towards the affected hemisphere. It is well known that the unaffected hemisphere could further inhibit the affected hemisphere via transcallosal inhibition mechanisms, thus deteriorating motor performance (Calautti et al., 2007). Thus, it is assumed that MT works via this inversion of the inter-hemispheric activationbalance.
Given that the PC mediates the effect of MT and shows a remarkable inter-individual variability, we assumed that the responsiveness of PC might serve as a predictor for the success of MT. Therefore, the following pilot study was designed in order to evaluate whether the inversion of the inter-hemispheric activation balance in PC due to the mirror illusion can be assessed routinely in patients after stroke and whether this activation pattern might be a candidate as predictor variable for therapy success under MT. In order to estimate the contribution of the initial PC activation following stroke, other known factors affecting the motor recovery after stroke, mainly initial motor function, demographic data and neuropsychological status were considered as well. We hypothesized that patients who show an inversed inter-hemispheric activation balance in PC by the mirror illusion will more likely benefit from a therapy program including MT and be classified as responders than patients who do not show such aninversion.
Besides, we aimed to explore whether this inversion of inter-hemispheric activation balance in PC by the mirror illusion changes after the application of MT.
2Materials and methods
2.1Participants - inclusion and exclusion criteria
Stroke patients with severe arm paresis were recruited in the department of inpatient rehabilitation at the MEDIAN Klinik Berlin-Kladow from August 2010 to August 2011. Patients had to suffer from a first-ever unilateral ischemic stroke confirmed by computer tomography (CT) and/or MRI resulting in severe unilateral arm paresis. As a previous study (Dohle et al., 2009) indicated that mirror therapy is of special use for patients that are not suitable for constraint-induced movement therapy (CIMT) as proposed by Taub and colleagues (1998), we employed the inclusion criterion of CIMT as exclusion criterion for MT in this study: Patients were only included with a wrist extension ability of less than 20 degrees and a metacarpophalangeal joint extension ability of less than 10 degrees. Patients had to be able to understand the instructions and to sustain the pre- and post-assessments and the daily 30 minutes of MT as described below. Exclusion criteria were previous experienced strokes or orthopedic, rheumatic or other diseases curtailing their ability to move the non-affected upper limb. The study was approved by the Ethics Committee of the Charité -Universitätsmedizin Berlin. 13 patients (six female, seven male) fulfilled these criteria during the recruitment period and were included in the study. All subjects gave informed consent prior to participation.
2.2Study design
The study was applied in addition to the regular inpatient rehabilitation program. Participants underwent a set of physiological and behavioral pre-assessments, consisting of Fugl-Meyer assessment (FMA), motor and somatosensory evoked potentials (MEPs and SSEPs), Barthel-index (BI), neuropsychological testing and functional near infrared spectroscopy of the mirror illusion (fNIRS), all applied within one week. Afterwards, the participants received four weeks of MT. Post-assessments were the same as the pre-assessments except for the recording of MEPs and SSEPs.
2.3Assessments
2.3.1Fugl-Meyer assessment
Upper extremity motor subscales of the Fugl-Meyer assessment (FMA) were conducted and video-taped (and rated) by trained occupational therapists in order to measure upper limb motor function, consisting of finger, hand, and arm function measurements (Fugl-Meyer et al., 1975). Reflex and coordination items were left out due to their poor psychometric properties (Woodbury et al., 2007). After data acquisition, FMA was rated by another blinded trainedoccupational therapist, who was neither involved in measurements nor in therapy procedure. As a previous study on severe arm paresis after stroke found an effect of MT especially on distal upper limb function (Dohle et al., 2009), only the subscore for finger movements was taken into account for further analysis. In this subscore, a total sum of 14 points could be achieved.
2.3.2MEPs and SSEPs
MEPs were elicited using a (clockwise or counter-clockwise flow-inducing) flat coil positioned at the vertex powered by a MAGSTIM 200 stimulator and recorded at the fist dorsal interosseus muscle via surface electromyography (EMG) recording machine (Medtronic Keypoint V5.06, Medtronic A/S, Skovlunde, Denmark). After determination of resting motor threshold (RMT) in a relaxed muscle, four stimulations were performed with intensity set at 120% of RMT. MEPs were classified as absent when no potentials could be elicited with a stimulation intensity of 100% of maximum stimulator output, even after performing or imaging active squeeze.
SSEPs were recorded after stimulation at the wrist with the above mentioned Medtronic stimulator with stimulus frequency of 2.1 Hz, a pulse duration of 50 ms and a strength of current just above the threshold to cause minimal twitches of the thenar muscles. Two traces of at least 200 averaged responses for each side were recorded. Cerebral responses were registered by needle electrodes at the contralateral C3 or C4 according to the 10– 20 system.
MEPs and SSEPs recorded on both sides - ipsi- and contralesional side - were compared and results from the affected side were rated by a trained neurologist (C.D.). As previous studies indicated that the presence at all, rather than the magnitude, of the evoked potentials was a pivotal prognostic factor (Hendricks, Hageman, & van Limbeek, 1997; Wohrle et al., 2004), both MEPs and SSEPS were dichotomized. MEPs and SSEPS were classified as present if a reproducible potential could be recorded in four (MEP) and two (SSEP) runs respectively, with their latency differing not more than 1 ms.
2.3.3Barthel index
Ability in activities of daily living (ADL) was assessed by the 100 points Barthel index (BI) (Mahoney & Barthel, 1965) recorded by an experienced nurse who knew the patient from daily ward routine.
2.3.4Neuropsychological measurements
For assessment of attention, the trail making test (TMT, German: Zahlenverbindungstest) a subscale of the “Nürnberger Altersinventar”, which is a speed test, was conducted by the patients with their non-affected hand. Mean speed time was recorded and used as index for overall cognitive fluency and neuropsychological status. The “Nürnberger Altersinventar” is an intelligence test also validated for an older inpatients sample and therefore applicable for the patients’ population of the present study (Oswald, 1986). To control for potential advantages for patients that performed the TMT with their dominant hand (right hemisphere lesions), an univariate ANOVA for the mean reaction time with the factor hand (dominant/non-dominant) was conducted, with a significance level of p = 0.05.
2.3.5FNIRS measurement
The paradigm for recording the mirror index (MI) due to the mirror induced illusion with fNIRS is based on an earlier fNIRS study of Mehnert and colleagues in normal subjects (Mehnert et al., 2013).
2.3.5.1Experimental task
Patients had to perform a finger-thumb opposition movement task with their non-affected hand under online visual control. Neither hand could be seen directly, but the non-affected, moving hand could be seen via a video chain on a screen placed in front of the patient. By means of a software package (Logitech Webcam Software v1.1, frame rate: 50 Hertz) the image was displayed in real-time with 0° eccentricity on the screen (Acer, 1280×1024 Pixel, frame rate: 60 Hertz) and could be inverted horizontally in such a way that the subjects’ right hand appeared as if it was their left hand and vice versa (“mirror”). This setup provided two possible conditions: normal visual feedback (NOR) and mirrored visual feedback (MIR). Each trial was initiated by an acoustic cue (“start”) and lasted 10 seconds, followed by a rest period with an average duration of 15 seconds (jittered from 10– 20 seconds) during which a plain grey screen was shown, serving as baseline for the correction in the analysis. Each condition was presented randomly 20 times, resulting in a total measurement time of 20 minutes. The measurement was interrupted after 10 minutes by the investigator, in order to give the patients a small break and ensure their alertness on the task. In contrast to the previous study on normal subjects (Mehnert et al., 2013), no static task with no hand movement was required, in order to reduce the measurement time for the patients and thus make it more convenient. The patients’ adherence to the task was ensured by the investigator who was present during the entireexperiment.
2.3.5.2Data acquisition
During the experiment, the blood oxygenation at the surface of the subjects’ brain was measured with an fNIRS system which offers up to 16 detectors and 8 emitters (NIRScout 8– 16, NIRx Medizintechnik GmbH, Berlin, Germany) at two wavelengths (850 and 760 nm). FNIRS data were continuously sampled at 6.26 Hz, instead of 3.13 Hz as applied by Mehnert and colleagues, due to the lower number of emitters. Based on previous findings on the role of the PC during movement mirroring (Dohle et al., 2004, 2011; Mehnert et al., 2013), we chose optode positions to cover the occipito-parietal and precentral areas of the subject’s head bilaterally, providing a total of 24 useful channels where source and detector were placed at a distance between 2.5 and 3 cm from each other (Fig. 1). Emitters and detectors were integrated into a commercially available EEG cap (www.easycap.de) with 128 possiblepositions.
2.3.5.3Pre-processing of fNIRS data and regions of interest (ROI)
Data analysis was performed using software routines employing the software packet Matlab (Mathworks Inc., USA, student version R2012a, 7.14.0.739). FNIRS data were corrected for movement artifacts by a semi-automated approach, which replaces contaminated data segments by linear interpolation (Koch et al., 2009). Subsequently, attenuation changes of both wavelengths were transformed to concentration changes of oxy- and deoxygenated hemoglobin (HbO and HbR) using a modified Beer-Lambert law (Differential Pathlength Factors: 5.98 (higher wavelength: 850 nm), 7.15 (lower wavelength: 760 nm), extinction coefficients for HbO 2.53/1.49 (higher/lower wavelength) and HbR 1.80/3.84 (higher/lower wavelength), and an inter-optode-distance of 3 cm) (Cope & Delpy, 1988). Data were then band-pass filtered between 0.2 and 0.016 Hz (using a 3rd order Butterworth filter) to attenuate for heartbeat, breathing-related changes and drifts.
A GLM was performed and the resulting beta-values were averaged across the channels of the regions of interest (ROIs). ROIs as shown in Fig. 1 (M1-ROI: red, PC-ROI: green) were defined in line with the identified ROIs of the above-mentioned study (Mehnert et al., 2013). For visual inspection and demonstration, the freeware MATLAB toolbox NFRI (http://www.jichi.ac.jp/brainlab/tools.html) was employed (Singh et al., 2005), which takes EEG 10– 20 positions as references to estimate brain regions underlying the channel locations.
2.3.5.4Calculation of the mirror index
Previous studies indicated that the activation change due to the mirror illusion could not be attributed simply to in increase or decrease in one hemisphere. Admittedly, previous fMRI studies indicated a higher increase in the hemisphere ipsilateral to the moving hand than decrease in the hemisphere contralateral to the moving hand due to the mirror illusion (Dohle et al., 2004; Wang et al., 2013). The fNIRS study directly comparing the signal strength in both hemispheres, however, revealed a significant interaction between the factors hemisphere and mirror due to the mirror illusion without differences between the hemispheres (Mehnert et al., 2013). Thus, the main effect of the mirror illusion is based on a simultaneous increase in one hemisphere accompanied by a decrease in the other one. Correspondingly, a so-called mirror index MI was calculated for both ROIs for quantification of activation change due to the mirror illusion (across mean beta values within a ROI of one hemisphere), asfollowing:
with:
Ipsi_MIR: activation in the ipsilesional hemisphere under mirrored visual feedback, Ipsi_NOR: activation in the ipsilesional hemisphere under normal visual feedback; Contra_NOR: and Contra_MIR: activations in the contralesional hemisphere under the respective condition.
Thus, the MI quantifies the sum of augmentation of activation in the ipsilesional hemisphere and decrease of activation in the contralesional hemisphere due to the mirror illusion. Higher values of the MI indicate a stronger change of inter-hemispheric activation balance due to the mirror illusion. The value MI-PC refers to the index obtained in the precuneus region, the value MI-M1 to the value in the primary motor area (M1). As the interaction between hemisphere and mirror was found to be significant for the oxygenated hemoglobin (HBO) only, the MI was calculated only for HBO (Mehnert et al., 2013).
2.4Application of MT
During MT, a mirror was placed in the mid sagittal plane on a table in front of the patients. The paretic limb was placed behind the mirror, the non-affected arm was in front of the mirror and the gaze was oriented towards the mirror. The MT protocol was a variant of “Bonn therapy protocol” used in a previous study (Dohle et al., 2009), requiring presentation of abstract limb positions in response to verbal commands (Bieniok, Govers, & Dohle, 2009). The Bonn therapy protocol is mainly based on proximal movements combined with distal variations, but since the clinical study (Dohle et al., 2009) indicated mainly effects on distal motor function, a “Berlin variant” of this protocol was defined, working from distal to proximal (Morkisch et al., 2012).
MT was conducted for 4 weeks, 5 days per week, for 30 minutes daily. Applying occupational therapists rotated across patients in order to exclude a therapist effect.
2.5Other rehabilitation services
The patients participating in the study received other rehabilitation services during the intervention time, especially physiotherapy (focused on upper or lower extremity), and occupational therapy (focused on ADL). For analysis, these different therapies were arranged in four groups:
1. ADL (occupational therapy).
2. Upper extremity (physiotherapy, fine motor tunning and EMG-triggered electronic stimulation).
3. Lower extremity (physiotherapy, treadmill).
4. Others (neuropsychology, logopedics, massage).
The therapy units (1 unit = 30 min) that were delivered during the four weeks of MT intervention of the study were counted after finishing the studyintervention.
2.6Statistical analysis
Statistical analysis was performed with the software packet SPSS (IBM SPSS Statistics, USA, version 21.0.0). The fNIRS measurements were analyzed comparing corresponding mean beta values of the ROIs in both hemispheres, resulting in a 2×2 study design with the two factors mirror (MIR/NOR) and hemisphere (ipsilesional/contralesional). For statistical group analysis, including evaluation of the treatment effect, a three-way repeated-measure ANOVA with the three factors time (pre-measurement/post-measurement), mirror (MIR/NOR) and hemisphere (ipsilesional/contralesional) was conducted for each ROI.
Previous studies indicated that the minimal detectable change of the entire FM scale is about 8% of the highest possible score (Lin et al., 2009). Transferred to the 14 point subscale for finger movements, this would imply a change of about 1 point on this scale. Thus, MT responders were defined as patients, whose improvement of active finger motor function in the FMA was >0.
The median values of demographic variables, delivery of therapies and all other variables in both groups were compared exploratory. To control the number of delivered therapy units for responders and non-responders, an univariate ANOVA for the number of therapy units with the factor group (responder/non-responder) was conducted for each of the four therapy groups, with an uncorrected significance level of p = 0.05.
Besides, the following factors were included in a discriminant analysis (DA) designed to classify patients as responders or non-responders: Demographic data (days since stroke, age of patient), initial motor performance (FMA-finger), initial neuropsychological performance (TMT) and initial fNIRS response (MI-PC, MI-M1). Note that dichotomous variables (e.g. affected hemisphere or sex) were not included in the DA. In order to reduce the number of potential discriminant factors, the DA was conducted using a backward stepwise procedure designed for the small sample size (Bortz, 2005). Maximum significance (p-value) for the F-ratio of a factor to enter was set at 0.05, and minimum significance (p-value) for the F-ratio of a factor to remove was set at 0.10.
3Results
3.1Patients sample
During the recruitment period, thirteen patients fulfilled the criterions and agreed to participate in the study. Two patients did not complete the measurements, as they were discharged from the hospital earlier: one patient for disciplinary reasons, the other patient due to medical complications (urosepsis). The other eleven patients (four female, seven male; mean age: 62; range: 49– 74) completed the full procedure of the study. Their characteristics are presented in Table 1, as well as the clinical improvements for BI, FMA-total, FMA-finger and TMT. All patients were right handed, as assessed with the German version of the Edinburgh Handedness Inventory (Oldfield, 1971) and had normal or corrected-to-normal vision. Due to technical reasons, recordings of MEPs and SSEPs were incomplete. Both MEPs and SSEPS were only recorded for 8 patients each. Median value of the TMT for patients performing with their dominant hand (n = 4) was 25.7 sec and 31.0 sec for patients performing with their non-dominant hand (n = 7). The univariate ANOVA revealed no significant difference in TMT performance between performance with the dominant and the non-dominant hand (F(1,9) = 1.44; p = 0.26).
3.2Pre- and post-measurement of fNIRS
The estimated marginal means for the mean beta values for PC-ROI and M1-ROI are shown in Table 2.
The repeated measures three-way ANOVA over the mean beta values of the PC-ROI revealed no significant effect. Especially, neither the two-way interaction between the factors hemisphere x mirror (F(1,10) = 0.67; p = 0.43, η 2 = 0.06, for HBO and F(1,10) = 0.65; p = 0.44, η 2 = 0.06, for HBR) nor the three-way interaction between the factors time x mirror x hemisphere (F(1,10) = 0.34; p = 0.57, η 2 = 0.03, for HBO and F(1,10) = 0.34; p = 0.57, η 2 = 0.03, for HBR) reached significance.
The repeated measures three-way ANOVA over the mean beta values of the M1-ROI revealed a significant main effect of the factor hemisphere (F(1,10) = 7.90; p < 0.05, η 2 = 0.44, for HBO. There was a similar trend for this main effect for HBR, which just did not reach significance (F(1,10) = 4.63; p = 0.057, η 2 = 0.32). The estimated marginal means indicate more activation in the contralesional compared to the ipsilesional hemisphere (ipsilesional: 0.25; contralesional: 0.35 for HBO; ipsilesional: −0.06; contralesional: −0.11 for HBR). No other effects reached significance in the M1-ROI.
3.3Comparison and description of responder versus non-responder group
Among the eleven patients, five had no improvement in finger motor function (FM difference 0). Two patients improved by 1 point, one patient by 4 points, one by 6 points, one by 7 points and one by 8 points. Applying the definition as stated above (Chapter 2.5. Statistical analysis), six out of eleven patients were classified as responders, and five were classified as non-responders. An overview of their characteristics is given in Tables 1, 3 and Fig. 2. In the responder group, there were more left-hemisphere lesions (5 out of 6) than in the non-responder group (2 out of 5). Responders and non-responders were comparable in sex (two females in both groups). Furthermore, as depicted in Fig. 2, there is much overlap between responders and non-responders range for the factors days since stroke, age, BI and TMT. This seems to be less pronounced for MI-M1. In contrast, only little overlap could be found in MI-PC: For the MI-PC all non-responders had negative values ranging from −0.49 to −0.03 (median: −0.11), while responders values ranged from −0.15 to 1.46 (median: +0.10). In detail, 3 out of 6 responders had positive values (0.22; 1.13; 1.46) and 3 had slightly negative values (−0.15; −0.07; −0.007). Finally, there is hardly any overlap of the initial FMA-finger and FMA-total: while responders’ FMA-finger score reached from 0 to 3, all non-responders had 0 points.
Participation in regular therapy (as potential confounder) was similar for both therapy groups. The univariate ANOVAs revealed no significant difference in the number of therapy units between responders and non-responders (Table 3).
3.4Stepwise discriminant analysis
Two variables were identified by the stepwise DA: FMA-finger base level and MI-PC. The overall Chi-square test was highly significant (Wilks λ= 0.224, χ 2 = 11.98, df = 2, Canonical correlation = 0.881, p = 0.002); the two variables extracted accounted for 77.6% of the variance in finger motor improvement. The standardized canonical discriminant function coefficients were 0.88 for MI-PC and 1.06 for FMA-finger base level (Table 4, upper row). Pooled within-groups correlations between discriminating variables and standardized canonical discriminant functions were 0.64 for FMA-finger base level and 0.37 for MI-PC (Table 4, lower row).
4Discussion
In the present pilot study, we were able to integrate functional imaging measurements into a clinical trial as a first step for identification of potential determinants of therapy success of MT.
Among several possible neurophysiological and clinical determinants, the stepwise DA selected two factors to classify patients as responders or non-responders: FMA-finger base level and the MI-PC as measured with fNIRS. With these two factors, 77.6% of variance among responders and non-responders could be explained. The prominent role of these factors was also confirmed by the direct comparison of the distribution of the variables in the two groups, revealing only little overlap between responder and non-responder group. Although the factor days since stroke had a higher pooled within-groups correlation with the standardized canonical discriminant function than MI-PC, it was not selected by the stepwise DA. This is due to the fact that in stepwise analysis – similar to the stepwise multiple regression – the factors are selected by their unique contribution (the semi-partial correlation) to the explained variation, and not by means of the direct correlation e.g. between dependent and independent variable. Thus, MI-PC is the only factor among all assessed variables that significantly explains variation additionally to the initialFMA-finger.
4.1Role of initial motor function
As the patients in this study received MT as an adjacent treatment additionally to conventional treatment procedure, which is in line with the German Practice Guideline (Platz & Roschka, 2009), it is difficult to separate the effect of general rehabilitation outcome from the MT specific outcome. Therefore, it is not surprising that the motor function base level is a significant discriminant of responders and non-responders. In their review on 56 studies, Chen and Winstein found the initial voluntary motor behavior (apart from integrity of corticospinal tract) to be the best predictor for motor function improvement in hemiparetic stroke patients (Chen & Winstein, 2009). Thus, the discrimination of responders and non-responders by means of the initial motor function level might be attributed to the general rehabilitation process effect. Meanwhile, it is tempting to attribute the variance explained by the MI-PC to the MT effect. Further studies with a control group are recommended to separate these effects moreprecisely.
4.2The role of precuneus
The repeated measures three-way ANOVA over the mean beta values of the fNIRS measurement revealed no significant main or interaction effects on PC-ROI. Thus, the interaction effect of hemisphere and mirror, as previously found in normal subjects (Mehnert et al., 2013), could not be replicated for the entire group of stroke patients on the basis of the data at hand. Obviously, this might be due to their inter-individual differences. Actually, the individually calculated MI reveals that only three out of eleven (27% ) patients in this study in total had a positive MI-PC. Comparison of responders and non-responders clarify that they differ concerning the distribution of the MI-PC: All patients classified as non-responders had a negative MI-PC, while 50% of responders had a positive MI-PC (3 out of 6 had strong positive, and 3 out of 6 had slightly negative values). The latter distribution of the MI-PC is similar to the normal subjects’ sample of Mehnert and colleagues: 50% of this normal subjects’ sample had a positive MI-PC, reaching from −0.36 to 4.53, Median: 0.001; IQR: [−0.09; 0.92], with bigger values for positive MI-PC and lower values for negative MI-PC (Mehnert et al., 2013; values not published). As described in the results section, this was similar for the distribution of MI-PC for the responders among the patient group (−0.15 to 1.46; IQR: [−0.09; 1.21]); but not for the non-responders (−0.49 to −0.03; IQR: [−0.46; −0.06]) (cf. Table 5). That means that the activation pattern on PC evoked by the mirror illusion (ipsilesional increase, contralesional decrease) of the responders is comparable to that of the normal subjects (Mehnert et al., 2013), while this is not the case for non-responders. Thus, activation shift in the area of both precunei might indeed play a crucial role for the efficacy of MT. This extends previous findings on the immediate role of PC for cerebral processing of the mirror illusion in normal subjects (Dohle et al., 2011; Wang et al., 2013a) and patients (Wang et al., 2013b). The PC plays a decisive role for self-related body representation (Cavanna & Trimble, 2006) and is involved especially for hand orientation during reach-to-grasp movements (Fattori et al., 2009). This prompts the idea that the mirror illusion activates the neural substrate for the visual representation of the paretic hand. To the best knowledge of the authors, the present study is the first one to correlate the cerebral activation due to the mirror illusion before intervention with the efficacy of MT.
Why should PC, situated in the occipito-parietal cortex, play a pivotal role for motor recovery of hemiparesis after stroke, if the function of PC is not primary motoric? PC is connected with the supplementary motor area (SMA) (Cavanna & Trimble, 2006). Furthermore, fMRI studies found V6A, a subarea of PC, to be directly connected with the dorsal premotor cortex (Galletti et al., 2001; Marconi et al., 2001). Thus, activation of PC could stimulate the lesioned parts of the motor cortex, boosting neuroplasticity for a motor functional recovery. This was recently shown by an fMRI study investigating brain connectivity with dynamic causal modelling (DCM) on stroke patients during the mirror illusion. Facilitatory connections between posterior parietal cortex, PC and the ipsilesional M1 were found due to mirror illusion (Saleh, Adamovich, & Tunik, 2013).
In our study, the activation pattern on PC seems to be stable over time, as there was no main effect of the factor time of the ANOVA. Thus, the cortical response to the mirror illusion seems to be a personal invariant characteristic, which is not affected by application of MT. It remains speculative whether this personal characteristic was already present before stroke or caused by the lesion. The fact that only the responder group’s MI was comparable to that of normal subjects, however, might suggest that the stroke lesion caused a change in response to the mirror illusion. Further studies are necessary to verify this hypothesis.
4.3The role of primary motor cortex
There are divergent results concerning the role of M1 during MT: While some researchers hypothesized that the mirror illusion might enhance activity on M1 directly (Fukumura et al., 2007; Funase et al., 2007; Tominaga et al., 2009), others could not replicate these findings (Praamstra et al., 2011). These heterogeneous results might be due to different study designs: Additional activation on M1 was only found when the mirror condition provided the visual image of two synchronously moving hands (Kang et al., 2011; Saleh et al., 2013), but not when only one hand was mirrored (Dohle et al., 2004; Fritzsch et al., 2013; Matthys et al., 2009; Michielsen et al., 2011). The ANOVA in the present study, revealed a significant main effect of the factor hemisphere on the M1-ROI with stronger activation on the hemisphere contralateral to the hand moved, just as it was expected. In line with the previous study on normal subjects, no interaction between hemisphere and mirror was found on M1 (Mehnert et al., 2013). Furthermore, the MI-M1 did not have a discriminative value for the motor recovery after MT in addition to the FMA-finger base level. This finding supports results from former fMRI studies that did not find an immediate effect of the mirror illusion on M1, but on other areas, such as PC (Dohle et al., 2011) or primary somatosensory cortex (Fritzsch et al., 2013).
Like PC, the activation pattern on M1 seems to be stable over time, as there was no main effect of the factor time of the ANOVA.
4.4The role of the lesioned hemisphere
There seemed to be somewhat more left hemisphere lesions in the responder group (5 out of 6) as compared with the non-responder group (2 out of 5). Due to the small sample size, conclusions must be drawn cautiously. However, this could lead to the speculation that patients with left hemispheric lesions might profit more from MT due to possible neglect pathology stroke patients suffer mainly after right hemispheric lesions. There is some evidence against this speculation: In a randomized controlled trial explicitly testing this hypothesis, there was no hemispheric advantage (Dohle et al., 2009). Another controlled randomized trial showed separate effects of MT on motoric and neglect improvements, thus they should be regarded as two different components that are affected differently by MT (Thieme et al., 2013). On the other hand, a recent imaging study reported different effects on sensory processing of the mirror illusion of a right or left hand (Fritzsch et al., 2013). As the total study sample in the present study was not balanced (7 out of 11 with left hemispheric lesions), further studies are required to test the hypothesis of a left hemisphere lesion advantage or a neglect pathology disadvantage for the effect of MT.
4.5Implications for application of MT
As stated above, the present study shows that the MI-PC correlates with therapy success: The higher this value (i.e. the more it was comparable to a normal subject’s sample), the higher was the patient’s chance to be classified as responder. Patients with an MI different to the normal subjects sample (i.e. no activation shift due to the mirror illusion) were rather classified as non-responders. Even though this finding is based on a study with certain limitations (cf. Chapter 4.6. Limitations of the study), it might open a way for the use of activation patterns for identification of therapy responders (prior to therapy): In the present study, all patients with a positive MI benefitted from MT, while patients with a negative MI have a lower probability to take benefit.
4.6Limitations of the study
A critical limitation of the study is the difficulty or even impossibility to separate the effect of the conventional rehabilitation procedure from that of MT. Further studies including a control group are necessary to separate these two effects and their corresponding determinants more precisely. This should also include a higher percentage of successfully recorded MEPs and SSEPs that might provide additional information about the integrity of the pyramidal and somatosensory pathways. However, as there was no difference between responders and non-responders regarding the amount of therapy units, we can conclude that at least in the context of our study, the difference between both groups could not be attributed to the deliverance of the other therapies.
Furthermore, the definition of the responders as patients with an improvement of active finger motor function in the FMA >0 was based on the minimal detectable change that is about 8% of the highest possible score (Lin et al., 2009). Transferred to the 14 points subscale for finger movements, this would imply a change of about 1 point on this scale. However, only two patients had an improvement of 1 point, no patient had 2 or 3 points improvement. Thus, one could argue that a definition of the responders as patients with an improvement in the FMA finger >1 that defines these patients as non-responders, instead of responders, would be more appropriate. Furthermore, the improvement of 1 point would not be clinical important according to Arya and colleagues (2011) who defined the minimal clinical important difference (MCID) at 9– 10 points out of 66 (13.6– 15.1% ), i.e. 1.9– 2.1 in the finger subtest of the FMA (Arya, Verma, & Garg, 2011).
Indeed, a change of the responder definition leads to a change in the results of the DA: The functional imaging parameter MI-PC is no longer selected, only the motor function base level is selected as significant determinant. It can be speculated if this change of the results is due to the small sample size or due to the change of the responder definition. Probably, the MI-PC rather discriminates the patients based on the minimal detectable change. This would also make sense, as MT is mainly regarded as a pre-forced use therapy in order to promote recovery in a densely hemiplegic limb. Furthermore, a measurement error in minor changes in the FMA seems to be unlikely, because this might be bi-directional and none of the patients worsened regarding the FMA-finger subscore.
Another eye-catching limitation is the small sample size. Due to time and limited resources, the recruitment and assessment period had to be stopped after one year. Although statistical analysis was accordingly adapted - using median and range to compare the groups on a descriptive way, or backward stepwise DA (Bortz, 2005), further studies with higher sample size, preferable in a multi-center study design should be conducted in order to verify the results of the present study. Nevertheless, the results and conclusions of our study can stimulate further research on the use of cerebral activation patterns for therapeutic decision regarding application of MT.
5Conclusion
In conclusion, the base level of finger motor function was confirmed to be a crucial determinant of upper distal limb motor recovery, being in line with former findings. Additionally, this study demonstrated that activation shift in the area of PC due to the mirror illusion might be considered as a determinant for efficacy of mirror therapy. I.e. a cerebral activation pattern due to the visual mirror illusion in the area of precuneus that is comparable to normal subjects might be an underlying mechanism for the efficacy of mirror therapy. This should be verified in further controlled studies.
Declaration of conflicting interests
The author(s) declare no potential conflicts of interest with respect to the authorship and/or publication of this article.
Acknowledgments
This study was supported by grants of the Center of Stroke Research Berlin (Flex Funds, CS-2009-10) to C. Fritzsch and M. Brunetti, as well as funding from the “Gesellschaft zur Förderung der Neurologischen Rehabilitation” (www.gfnr.org). We thank the “Berliner Sparkassenstiftung Medizin” and “NIRx Medizintechnik GmbH, Berlin” for provision of a NIRS system. We would like to thank L. Ferreira dos Santos, R. Lommack, L. Kadow, S. Keller, J. Wang and A. Schernick for assistance with conductingthe study.
REFERENCE
1 | Arya KN, Verma R, Garg RK(2011) Estimating the minimal clinically important difference of an upper extremity recovery measure in subacute stroke patients. (SupplTop Stroke Rehabil599610doi: 10.1310/tsr18s01-599 |
2 | Bieniok A, Govers J, Dohle C(2009) Spiegeltherapie in der Neurorehabilitation (Vol. 1)GermanySchulz-Kirchner Verlag |
3 | Bortz J(2005) Statistik für Sozialwissenschaftler6. edSpringer Medizin Verlag Heidelberg |
4 | Bowering KJ, O’Connell NE, Tabor A, Catley MJ, Leake HB, Moseley GL, Stanton TR(2013) The effects of graded motor imagery and its components on chronic pain: A systematic review and meta-analysisThe Journal of Pain14: (1)313 |
5 | Broeks JG, Lankhorst GJ, Rumping K, Prevo AJ(1999) The long-term outcome of arm function after stroke: Results of a follow-up studyDisabil Rehabil21: (8)357364 |
6 | Calautti C, Naccarato M, Jones PS, Sharma N, Day DD, Carpenter AT(2007) Therelationship between motor deficit and hemisphere activation balance after stroke: A T fMRI studyNeuroimage34: 1322331doi: 10.1016/j.neuroimage.2006.08.026 |
7 | Cavanna AE, Trimble MR(2006) The precuneus: A review of its functional anatomy and behavioural correlatesBrain129: 564583 |
8 | Chen S, Winstein C(2009) A systematic review of voluntary arm recovery in hemiparetic stroke: Critical predictors for meaningful outcomes using the international classification of functioning, disability, and healthJ Neurol Phys Ther33: (1)213 |
9 | Cope M, Delpy DT(1988) System for long-term measurement of cerebral blood and tissue oxygenation on newborn infants by near infra-red transilluminationMed Biol Eng Comput26: (3)289294 |
10 | Dohle C, Kleiser R, Seitz RJ, Freund H-J(2004) Body scheme gates visual processingJ Neurophysiol91: (5)23762379 |
11 | Dohle C, Pullen J, Nakaten A, Kust J, Rietz C, Karbe H(2009) Mirror therapy promotes recoveryfrom severe hemiparesis: A randomized controlled trialNeurorehabil Neural Repair23: (3)209217doi: 10.1177/1545968308324786 |
12 | Dohle C, Stephan KM, Valvoda JT, Hosseiny O, Tellmann L, Kuhlen T(2011) Representation of virtual arm movements in precuneusExp Brain Res208: (4)543555doi: 10.1007/s00221-010-2503-0 |
13 | Fattori P, Breveglieri R, Marzocchi F, Filippini D, Bosco A, Galletti C(2009) Hand orientation during reach-to-grasp movements modulates neuronal activity in the medial posterior parietal area V6AThe Journal of Neuroscience29: (6)19281936 |
14 | Fritzsch C, Wang J, Mauritz K-H, Ferreira DosSantosL, Brunetti M, Dohle C(2013) Different effects of mirror therapy on motor and sensory processingRestor Neurol Neurosci32: (2)269280doi: 10.3233/RNN-130343 |
15 | Fugl-Meyer AR, Jaasko L, Leyman I, Olsson S, Steglind S(1975) The post-stroke hemiplegic patient. 1. a method for evaluation of physical performanceScand J Rehabil Med7: (1)1331 |
16 | Fukumura K, Sugawara K, Tanabe S, Ushiba J, Tomita Y(2007) Influence of mirror therapy on human motor cortexInt J Neurosci1117: (7)10391048 |
17 | Funase K, Tabira T, Higashi T, Liang N, Kasai T(2007) Increased corticospinal excitability during direct observation of self-movement and indirect observation with a mirror boxNeurosci Lett419: (2)108112 |
18 | Galletti C, Gamberini M, Kutz DF, Fattori P, Luppino G, Matelli M(2001) The cortical connections of area V: An occipito-parietal network processing visual informationEur J Neurosci13: (8)15721588 |
19 | Hamzei F, Lappchen CH, Glauche V, Mader I, Rijntjes M, Weiller C(2012) Functional plasticity induced by mirror training: The mirror as the element connecting both hands to one hemisphereNeurorehabil Neural Repair26: (5)484496doi: 10.1177/1545968311427917 |
20 | Heller A, Wade DT, Wood VA, Sunderland A, Hewer RL, Ward E(1987) Arm function after stroke: Measurement and recovery over the first three monthsJournal of Neurology, Neurosurgery & Psychiatry50: (6)714719 |
21 | Hendricks HT, Hageman G, van LimbeekJ(1997) Prediction of recovery from upper extremity paralysis after stroke by measuring evoked potentialsScand J Rehabil Med29: (3)155159 |
22 | Johnston S, Mendis S, Mathers C(2009) Global variation in stroke burden and mortality: Estimates from monitoring, surveillance, and modelingLancet Neurol345354 |
23 | Jorgensen HS, Nakayama H, Raaschou HO, Vive-Larsen J, Stoier M, Olsen TS(1995) Outcome and time course of recovery in stroke. Part I: Outcome. The Copenhagen Stroke StudyArch Phys Med Rehabil76: (5)399405 |
24 | Kang YJ, Ku J, Kim HJ, Park HK(2011) Facilitation of corticospinal excitability according tomotor imagery and mirror therapy in healthy subjects and stroke patientsAnn Rehabil Med35: (6)747758doi: 10.5535/arm.2011.35.6.747 |
25 | Koch SP, Werner P, Steinbrink J, Fries P, Obrig H(2009) Stimulus-induced and state-dependent sustained gamma activity is tightly coupled to the hemodynamic response in humansJ Neurosci29: (44)1396213970doi: 10.1523/JNEUROSCI.1402-09.2009 |
26 | Lin JH, Hsu MJ, Sheu CF, Wu TS, Lin RT, Chen CH, Hsieh CL(2009) Psychometric comparisons of measures for assessing upper-extremity function in people with strokePhys Ther89: (8)840850doi: 10.2522/ptj.20080285 |
27 | Mahoney FI, Barthel DW(1965) Functional evaluation: The barthel indexMd State Med J14: 6165 |
28 | Marconi B, Genovesio A, Battaglia-Mayer A, Ferraina S, Squatrito S, Molinari M(2001) Eye-hand coordination during reaching. I. Anatomical relationships between parietal and frontal cortexCerebral Cortex11: 513527 |
29 | Matthys K, Smits M, Van derGeest JN, Van derLugt A, Seurinck R, Stam HJ, Selles RW(2009) Mirror-induced visual illusion of hand movements: A functional magnetic resonance imaging studyArch Phys Med Rehabil90: (4)c675c681 |
30 | Mehnert J, Brunetti M, Steinbrink J, Niedeggen M, Dohle C(2013) Effect of a mirror-like illusionon activation in the precuneus assessed with functional near-infrared spectroscopyJ Biomed Opt18: (6)066001doi: 10.1117/1.JBO.18.6.066001 |
31 | Michielsen ME, Smits M, Ribbers GM, Stam HJ, van derGeest JN, Bussmann JB, Selles RW(2011) The neuronal correlates of mirror therapy: An fMRI study on mirror induced visual illusions in patientswith strokeJ Neurol Neurosurg Psychiatry82: (4)393398doi: 10.1136/jnn2009.194134 |
32 | Morkisch N, Lommack R, Kadow L, Rietz C, Dohle C(2012) Paper presented at the. Jahrestagung der Deutschen Gesellschaft für Neurorehabilitation e.V. (DGNR), Fürth, GermanyEvaluation eines standardisiertenTherapieprotokolls zur Spiegeltherapie22 |
33 | Muehlschlegel S, Selb J, Patel M, Diamond SG, Franceschini MA, Sorensen AG(2009) Feasibility of NIRS in the neurointensive care unit: A pilot study in stroke using physiologicaloscillationsNeurocrit Care11: (2)288295 |
34 | Murray C(1996) The global burden of disease. A comprehensive assessment of mortality and disability from diseases, injuries, and risk factors in 1990 and projected to 2020CambridgeHarvard Univ. Press |
35 | Obrig H, Villringer A(2003) Beyond the visible–imaging the human brain with lightJ Cereb Blood Flow Metab23: (1)118 |
36 | Oldfield RC(1971) The assessment and analysis of handedness: The InventoryNeuropsychologia9: 97113Edinburgh |
37 | Oswald WD(1986) Der Zahlen-Verbindungs-Test im höheren Lebensalter. In K. Daumenlang & J. Saue (EdsAspekte psychologischer Forschung377388Göttingen, GermanyHogrefe |
38 | Platz T, Roschka S(2009) Rehabilitative Therapie bei Armparese nach SchlaganfallNeurol Rehabil15: (2)1742 |
39 | Praamstra P, Torney L, Rawle CJ, Miall RC(2011) Misconceptions about mirror-induced motor cortex activationCereb Cortex21: (8)19351940doi: 10.1093/cercor/bhq270 |
40 | Ramachandran VS(1994) Phantom limbs, neglect syndromes, repressed memories, and Freudian psychologyInt Rev Neurobiol37: 291333 |
41 | Rizzolatti G, Fabbri-Destro M, Cattaneo L(2009) Mirror neurons and their clinical relevanceNat Clin Pract Neurol5: (1)2434doi: 10.1038/ncpneuro0990 |
42 | Saleh S, Adamovich SV, Tunik E(2013) Visual Feedback Discordance Mediates Changes in Brain Activity and Effective Connectivity: A Stroke fMRI Dynamic Causal Modeling Study2nd International Conference on Advances in Biomedical Engineering |
43 | Singh AK, Okamoto M, Dan H, Jurcak V, Dan I(2005) Spatial registration of multichannel multi-subject fNIRS data to MNI space without MRINeuroimage27: (4)842851 |
44 | Strangman G, Goldstein R, Rauch S, Stein J(2006) Near-infrared spectroscopy and imaging for investigating stroke rehabilitation: Test-retest reliability and review of the literature. S-SArch Phys Med Rehabil87: (12 Suppl 2)19 |
45 | Taub E, Crago JE, Uswatte G(1998) Constraint-induced movement therapy: A new approach to treatment in physical medicineRehabil Psychol43: 152170 |
46 | Thieme H, Bayn M, Wurg M, Zange C, Pohl M, Behrens J(2013) Mirror therapy for patients with severe arm paresis after stroke– a randomized controlled trialClin Rehabil27: (4)314324doi: 10.1177/0269215512455651 |
47 | Thieme H, Mehrholz J, Pohl M, Behrens J, Dohle C(2012) Mirror therapy for improving motor function after stroke (ReviewThe Cochrane Library3 |
48 | Tominaga W, Matsubayashi J, Deguchi Y, Minami C, Kinai T, Nakamura M(2009) Amirror reflection of a hand modulates stimulus-induced -Hz activityNeuroimage46: (2)500504 |
49 | Wang J, Fritzsch C, arding J, Holtze S, Mauritz KH, Brunetti M, Dohle C(2013) A comparison of neuralmechanisms in mirror therapy and movement observation therapyJ Rehabil Med45: (4)410413doi: 10.2340/16501977-1127Bern |
50 | Wang J, Fritzsch C, arding J, Krause T, Mauritz KH, Brunetti M, Dohle C(2013) Cerebral activation evoked bythe mirror illusion of the hand in stroke patients compared tonormal subjectsNeuroRehabilitationdoi: 10.3233/NRE-130999Bern |
51 | Wohrle JC, Behrens S, Mielke O, Hennerici MG(2004) Early motor evoked potentials in acute stroke: Adjunctive measure to MRI for assessment of prognosis in acute stroke within hoursCerebrovasc Dis18: (2)130134doi: 10.1159/000079265 |
52 | Woodbury ML, Velozo CA, Richards LG, Duncan PW, Studenski S, Lai SM(2007) Dimensionality and construct validity of the Fugl-Meyer Assessment of the upper extremityArch Phys Med Rehabil88: (6)715723doi: 10.1016/j.apmr.2007.02.036 |
Figures and Tables
Fig.1
Schematic illustration of the channels measured with functional near-infrared spectroscopy. The three PC-ROI channels are marked green and the four M1-ROI channels are marked red.
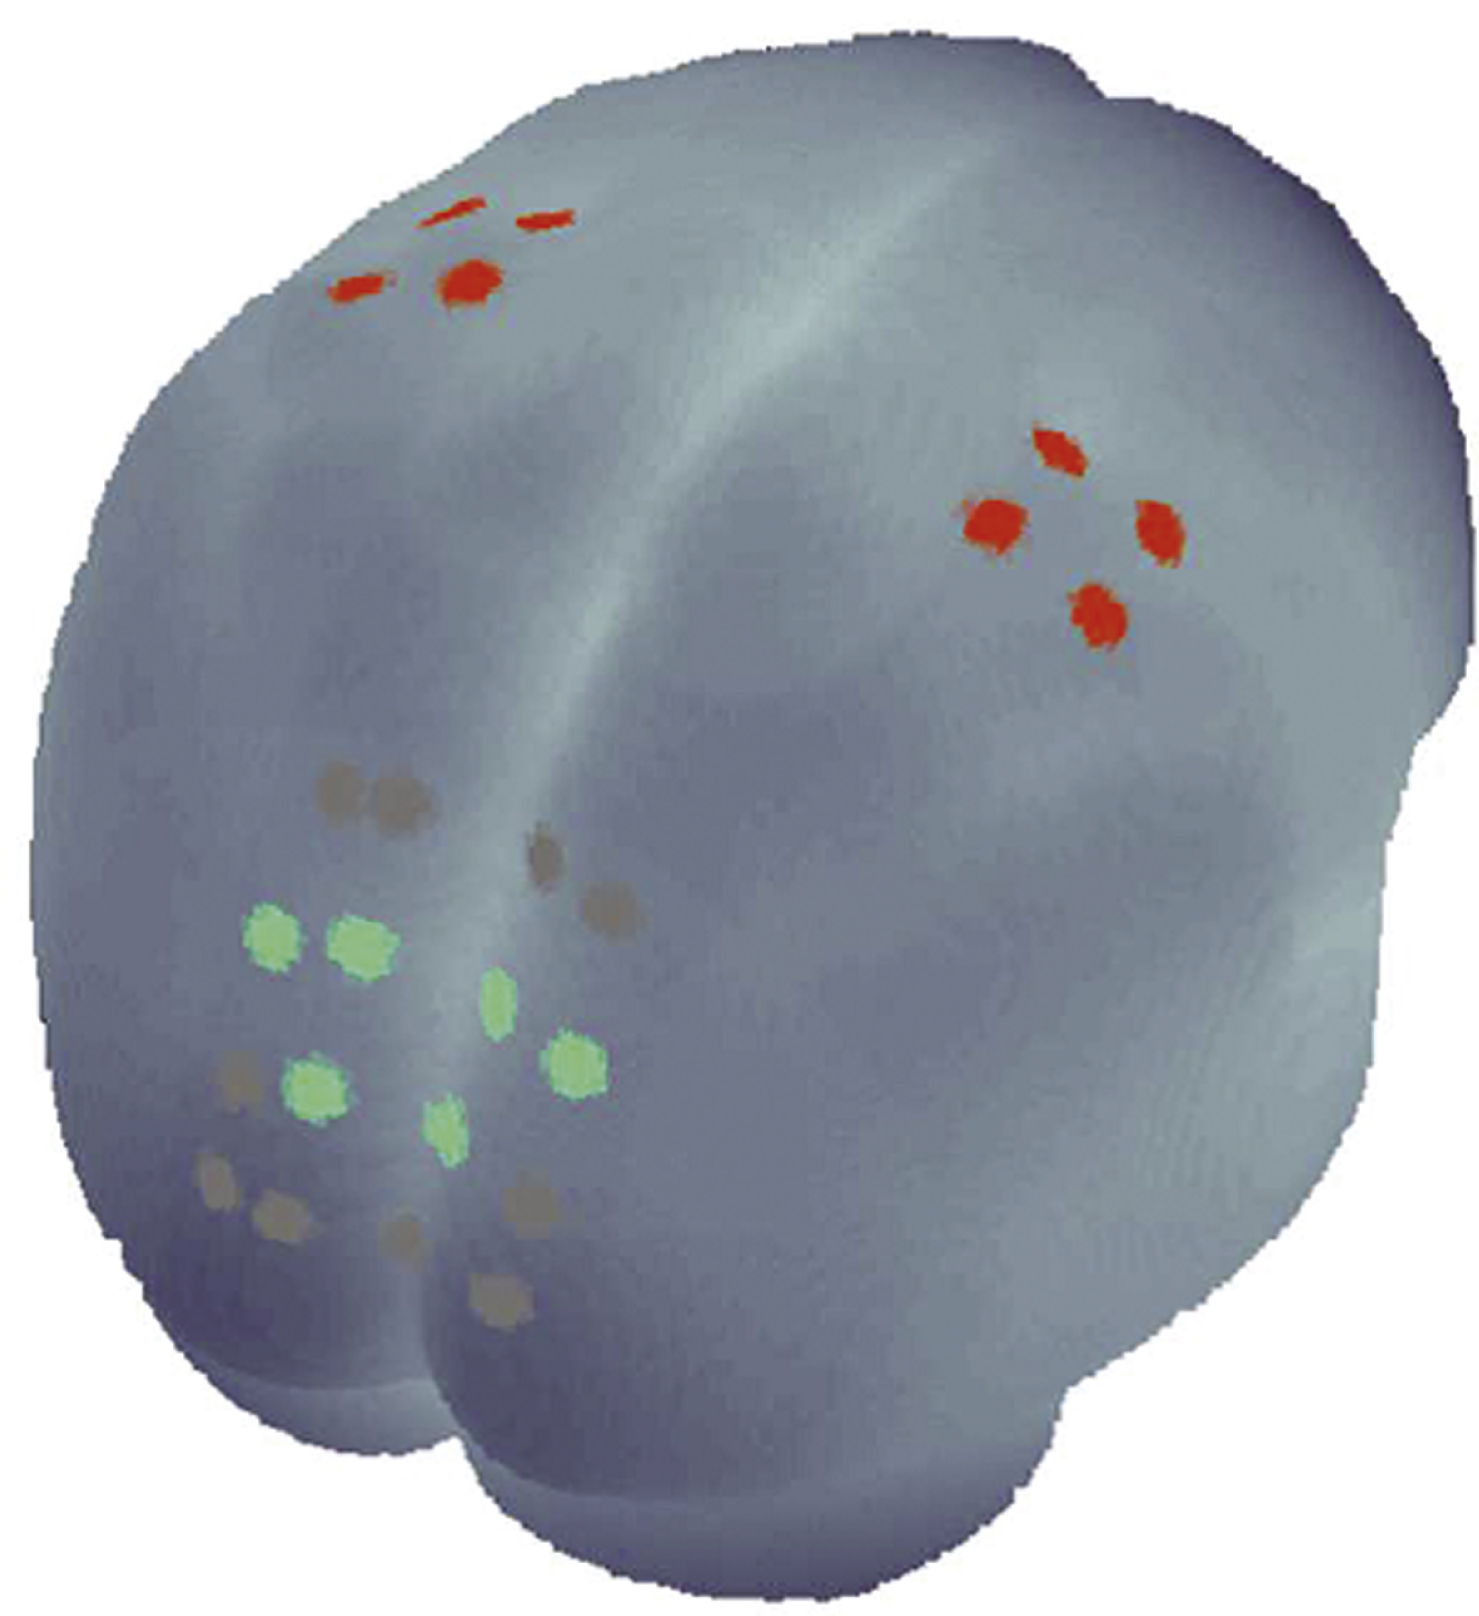
Fig.2
Box-plots with median values, interquartile range (IQR) and range of following factors: days since stroke, age, TMT, FMA-finger, MI-PC, MI-M1; for responders (cyan) and non-responders (grey). Note: For FMA-finger for non-responders there is no box, as they had all 0 points. The break on the x-axis is at 4.
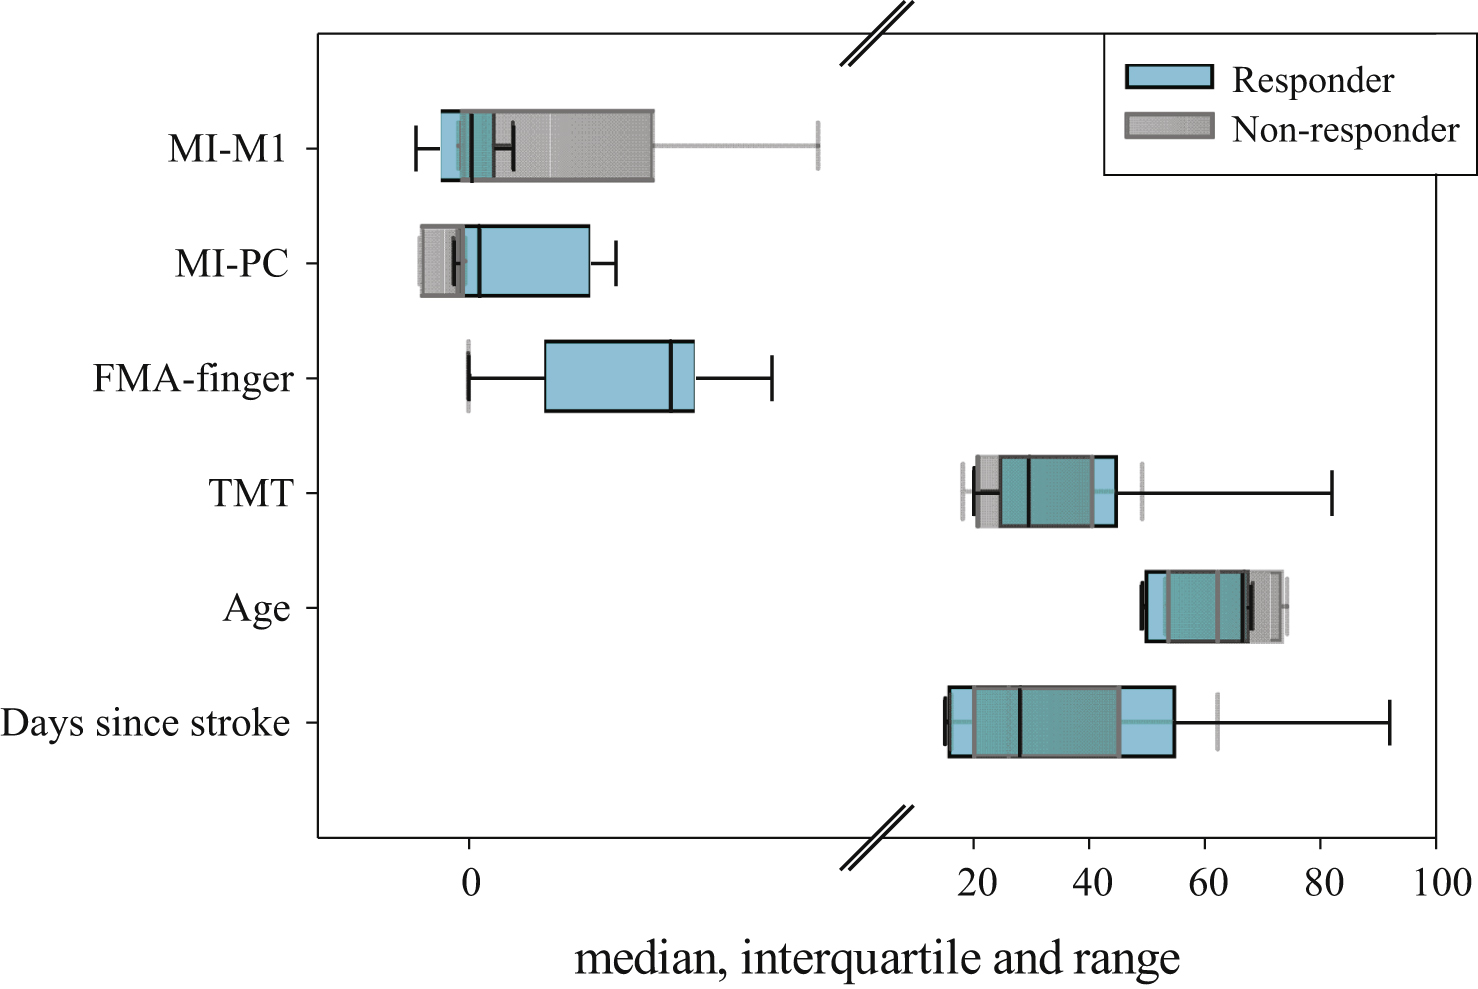
Table 1
Median values and range [in brackets] of the days since stroke at the time of the pre-FMA, age and pre-assessments of BI, FMA-finger, FMA-total, TMT, MI-PC and MI-M1 as well as the clinical improvements of BI, FMA-total, FMA-finger and TMT. Frequencies of females, left hemisphere lesion, present/not present and not recorded MEPs and SSEPs
| Total (n = 11) | Responders (n = 6) | Non-responders (n = 5) | |
| Days since stroke | 26 [15– 92] | 28 [15– 92] | 26 [16– 62] |
| Age | 66 [49– 74] | 66.5 [49– 68] | 62 [53– 74] |
| Female / Male | 4 / 7 | 2 / 4 | 2 / 3 |
| Left / Right hemishere lesion | 7 / 4 | 5 / 1 | 2 / 3 |
| BI | 50 [20– 75] | 52.5 [20– 65] | 40 [25– 75] |
| FMA-total | 5 [0– 13] | 10 [0– 13] | 1 [0– 5] |
| FMA-finger | 0 [0– 3] | 2 [0– 3] | 0 [0-0] |
| TMT (sec) | 29.5 [18– 82] | 29.5 [20– 82] | 29.5 [18– 49] |
| MEPs (present / not present / not recorded) | 2 / 6 / 3 | 1 / 4 / 1 | 1 / 2 / 2 |
| SSEPs (present / not present / not recorded) | 5 / 3 / 3 | 3 / 1 / 2 | 2 / 2 / 1 |
| MI-PC | −0.07 [−0.49– 1.46] | 0.10 [−0.15– 1.46] | −0.11 [−0.49– (−0.03)] |
| MI-M1 | 0.06 [−0.53– 3.46] | 0.03 [−0.53– 0.44] | 0.15 [−0.10– 3.46] |
| CI-BI | 25 [5– 40] | 30 [25– 40] | 15 [5– 20] |
| CI-FMA-total | 3 [−1– 26] | 11 [1– 26] | 0 [−1– 3] |
| CI-FMA-finger | 1 [0– 8] | 5 [1– 8] | 0 [0– 0] |
| CI-TMT (sec) | 2.4 [−6– 34.4] | 1.6 [−6– 34.4] | 2.6 [0.3– 6] |
| TMT (sec) | Dominant hand (n = 4) | Non-dominant hand (n = 7) | |
| 25.7 [18– 32] | 31.0 [20– 82] |
Abbreviations: TMT: trail making test; sec: seconds; FMA: Fugl-Meyer assessment; MEPs: motor evoked potentials; SSEPs: somatosensory evoked potentials; MI: mirror index; PC: precuneus; M1: primary motor cortex; CI: clinical improvements. Total sample: left column; Responders: middle column; Non-responders: right column. Bottom row: TMT values separated for dominant and non-dominant hand performance.
Table 2
Estimated marginal means of the beta values from fNIRS for the PC-ROI and the M1-ROI for HBO and HBR, respectively. Standard errors are depicted in brackets
| Time | Hemisphere | Condition | PC-ROI HBO | PC-ROI HBR | M1-ROI HBO | M1-ROI HBR |
| Pre-intervention | ipsi | MIR | 0.84 (0.40) | 0.11 (0.13) | 0.27 (0.22) | −0.09 (0.02) |
| NOR | 0.63 (0.42) | −0.07 (0.06) | 0.25 (0.16) | −0.06 (0.03) | ||
| contra | MIR | 0.61 (0.32) | 0.06 (0.06) | 0.30 (0.21) | −0.04 (0.06) | |
| NOR | 0.53 (0.28) | −0.02 (0.05) | 0.61 (0.28) | −0.26 (0.17) | ||
| Post-intervention | ipsi | MIR | 0.40 (0.21) | −0.02 (0.01) | 0.26 (0.16) | −0.04 (0.01) |
| NOR | 0.20 (0.20) | −0.07 (0.05) | 0.21 (0.15) | −0.06 (0.02) | ||
| contra | MIR | 0.55 (0.24) | 0.06 (0.06) | 0.35 (0.17) | −0.07 (0.02) | |
| NOR | 0.36 (0.16) | 0.03 (0.04) | 0.14 (0.15) | −0.09 (0.03) | ||
| Responder | ||||||
| Pre-intervention | ipsi | MIR | 0.76 (0.42) | 0.20 (0.23) | 0.16 (0.40) | −0.08 (0.04) |
| NOR | 0.20 (0.19) | −0.16 (0.08) | 0.13 (0.28) | −0.02 (0.04) | ||
| contra | MIR | 0.32 (0.38) | 0.07 (0.10) | 0.38 (0.36) | −0,12 (0.05) | |
| NOR | 0.19 (0.17) | −0.07 (0.08) | 0.34 (0.34) | −0.09 (0.08) | ||
| Post-intervention | ipsi | MIR | 0.35 (0.18) | −0.03 (0.02) | 0.32 (0.18) | −0.03 (0.02) |
| NOR | 0.29 (0.23) | −0.03 (0.02) | 0.33 (0.19) | −0.04 (0.02) | ||
| contra | MIR | 0.25 (0.14) | −0.01 (0.02) | 0.35 (0.13) | −0.05 (0.02) | |
| NOR | 0.19 (0.20) | −0.01 (0.03) | 0.25 (0.18) | −0.07 (0.04) | ||
| Non-Responder | ||||||
| Pre-intervention | ipsi | MIR | 0.94 (0.78) | −0.001 (0.07) | 0.40 (0.15) | −0.10 (0.03) |
| NOR | 1.15 (0.88) | 0.05 (0.07) | 0.38 (0.11) | −0.10 (0.03) | ||
| contra | MIR | 0.96 (0.53) | 0.04 (0.07) | 0.21 (0.19) | 0.06 (0.12) | |
| NOR | 0.93 (0.57) | 0.05 (0.06) | 0.93 (0.46) | −0.46 (0.37) | ||
| Post-intervention | ipsi | MIR | 0.45 (0.44) | −0.003 (0.02) | 0.19 (0.29) | −0.04 (0.01) |
| NOR | 0.09 (0.37) | −0.11 (0.12) | 0.07 (0.24) | −0.09 (0.04) | ||
| contra | MIR | 0.90 (0.47) | 0.15 (0.14) | 0.35 (0.37) | −0.09 (0.01) | |
| NOR | 0.56 (0.24) | 0.07 (0.06) | 0.01 (0.26) | −0.11 (0.04) |
Abbreviations: ipsi: ipsilesional, contra: contralesional hemisphere; MIR: mirrored visual feedback; NOR: normal visual feedback; PC: precuneus; M1: primary motor cortex; ROI: region of interest.
Table 3
Median values of the numbers of therapy units delivered additionally to the MT treatment and results of the univariate ANOVA for the number of therapy units with the factor group (responder/non-responder)
| Rehabilitation services | Responders (n = 6) | Non-responders (n = 5) | ANOVA results |
| Upper | 24 | 21 | F(1,9) = 0.07; |
| extremity | p = 0.79 | ||
| Lower | 52 | 41 | F(1,9) = 1.11; |
| extremity | p = 0.32 | ||
| ADL | 6 | 7 | F(1,9) = 0.34; |
| p = 0.58 | |||
| Others | 27 | 36 | F(1,9) = 1.07; |
| p = 0.33 |
Table 4
Results of the discriminant analysis in detail. Upper row: Standardized canonical discriminant function coefficients of FMA-finger and MI-PC. Lower row: Structure matrix with pooled within-groups correlations between discriminating variables and standardized canonical discriminant functions
| Standardized canonical discriminant function coefficients | |
| MI-PC | 0.88 |
| FMA-finger | 1.06 |
| Structure matrix | |
| FMA-finger | 0.64 |
| days since stroke | 0.45 |
| MI-PC | 0.37 |
| Age | 0.19 |
| MI-M1 | 0.04 |
| TMT | −0.003 |
Table 5
Distribution of the MI-PC (HBO) of the fNIRS pre-measurement in different samples: normal subjects of a former study (Mehnert et al., 2013; not published), patients of the present study in total, responders and non-responders. Sample size, 25th and 75th percentile and median of MI-PC (mirror index measured on precuneus)
| Sample | Sample size | 25th Percentile | Median | 75th Percentile |
| Normal subjects | 20 | −0.09 | 0.001 | 0.92 |
| Patients (Total) | 11 | −0.15 | −0.07 | 0.22 |
| Responders | 6 | −0.09 | 0.10 | 1.21 |
| Non-Responders | 5 | −0.46 | −0.11 | −0.06 |


