
Methodology for the generation of normative data for the U.S. adult Spanish-speaking population: A Bayesian approach
Abstract
BACKGROUND:
Hispanics are the largest growing ethnic minority group in the U.S. Despite significant progress in providing norms for this population, updated normative data are essential.
OBJECTIVE:
To present the methodology for a study generating normative neuropsychological test data for Spanish-speaking adults living in the U.S. using Bayesian inference as a novel approach.
METHODS:
The sample consisted of 253 healthy adults from eight U.S. regions, with individuals originating from a diverse array of Latin American countries. To participate, individuals must have met the following criteria: were between 18 and 80 years of age, had lived in the U.S. for at least 1 year, self-identified Spanish as their dominant language, had at least one year of formal education, were able to read and write in Spanish at the time of evaluation, scored≥23 on the Mini-Mental State Examination, <10 on the Patient Health Questionnaire– 9, and <10 on the Generalized Anxiety Disorder scale. Participants completed 12 neuropsychological tests. Reliability statistics and norms were calculated for all tests.
CONCLUSION:
This is the first normative study for Spanish-speaking adults in the U.S. that uses Bayesian linear or generalized linear regression models for generating norms in neuropsychology, implementing sociocultural measures as possible covariates.
1Introduction
For many years, Hispanics have been recognized as the largest and fastest growing ethnic minority group in the U.S. (Pew Research Center, 2017). Projections indicate that Hispanics will reach almost 111 million people, making up 28% of the total U.S. population, by 2060 (U.S. Census Bureau, 2018). Clinical neuropsychologists base their diagnoses in part on the interpretation of neuropsychological test results, so accurate and reliable neuropsychological assessments are crucial. In the U.S., a growing number of clinicians are able to provide neuropsychological services in Spanish, but nonetheless face significant challenges when working with Spanish-speaking patients. One of the challenges is considering the influence of diverse sociocultural influences (e.g., country of origin, bilingualism, acculturation level, socioeconomic status) on patient performance as these factors are known to impact neuropsychological testing (Bialystok et al., 2012; Boone et al., 2007; Flores et al., 2017). The second challenge is related to the limited availability of normative data for this population. According to Gasquoine et al. (2021), neuropsychologists in the U.S. often attempt to interpret results for Spanish speakers using norms generated in the continental U.S. When not available, they resort to norms from Latin American countries or Spain (Rivera et al., 2019, 2021).
The majority of available norms for Spanish speakers living in the U.S. were established before 2010 and focus on only a few neuropsychological measures (mostly Verbal Fluency, Mini Mental State Examination, Clock Drawing Test), or are applicable for middle-aged and older individuals (>40 years old) residing along the Mexico/U.S. border (California, Arizona, New Mexico, Florida, and Texas) and Northern Manhattan (see Morlett et al., 2021 for a review). Previous norms also vary concerning administration language (exclusively Spanish or both Spanish and English).
More recently, Cherner et al. (2020) finished “The Neuropsychological Norms for the U.S.-Mexico Border Region in Spanish (NP-NUMBRS)” project, which provided norms for 15 neuropsychological measures. This project focused on native Spanish speakers from the U.S. (California/Arizona)-Mexico border region aged 19 to 60, with a total sample of 254 healthy adults. Although not taken into consideration in their normative sample, they recognized the relevance and potential impact of sociocultural variables on cognitive performance and accordingly encouraged future studies to incorporate variables such as level of bilingualism, acculturation, or age of language acquisition.
Despite significant progress in providing norms for U.S. neuropsychologists offering services in Spanish, there remains a considerable gap. For example, the norms mentioned above should be applied with caution in Spanish-speaking populations living in unexamined regions, such as the Northern U.S. Moreover, very few studies have considered sociocultural factors known to impact cognitive performance. Finally, most available norms were generated before 2010. For example, data for some of the most recently published norms in the NP-NUMBRS project were collected in two cohorts (1998– 2000 and 2006– 2009).
There are several approaches to generate normative data for neuropsychological tests. The two most common approaches are traditional and regression-based (delCacho-Tena et al., 2024; Innocenti et al., 2023; van Breukelen et al., 2005), both of which have limitations. The traditional approach involves dividing the sample into subgroups based on relevant demographic variables such as age (in ranges), level of education, and sex. Within each subgroup, the mean
The regression-based approach uses linear regression parameters βk to adjust for demographic influences and create normative data. Examples of this approach can be found in the Mayo Clinic’s older Americans normative studies (MOANS; Ivnik et al., 1992), older African Americans (MOAANS; Lucas et al., 2005), the NEURONORMA project (Peña-Casanova et al., 2009) and NEURONORMA youth (Peña-Casanova et al., 2012). The procedure involves: a) creating age groups for generating normative data and evaluating the effect of age, sex, or education on neuropsychological scores using correlation coefficients (r) and determination (r2); b) creating age-adjusted normative tables (SSA). For each age-range a cumulative frequency distribution of raw scores is generated, and these raw scores are assigned percentile ranks. Then, percentile ranks are converted to scaled scores (SS, scale of 2 to 18), aiming for a distribution
Another more recent regression-based approach uses multiple regression models and residual standard deviation. Examples of this approach are normative studies conducted for Spanish-speaking countries in both adults and children/adolescents (Rivera et al., 2019, 2021; Rodrıguez-Lorenzana et al., 2020), as well as in other countries (van der Elst, et al., 2012; Vicente et al., 2022). This approach allows an evaluation of the influence of covariates in the presence of other covariates within the same model rather than separately. Additionally, age and education can be included as continuous variables, and their quadratic effects are evaluated to identify gradual changes in scores across age and education. This eliminates the problem of abrupt changes seen in the traditional method. Using this multiple linear regression method, normative data are generated through the cumulative distribution of standardized residuals.
In this method, the multiple linear regression model assumes that Yi = Xiβ + ɛi where Yi is the vector of responses, Xi is the design matrix (including covariates such as age, age2, education, sex, and interactions), β is the vector of regression parameters, and ɛi is the vector of residual components assumed to be normally distributed with mean 0 and variance
Using the final regression model that is obtained at the end of the stepwise procedure, normative data that are adjusted for demographic variables are established by means of a four-step procedure (Rivera et al., 2019; van der Elst et al., 2012; van Breukelen & Vlaeyen, 2005): a) the expected test score
A recent review highlighted other regression-based methodologies for generating normative data (delCacho-Tena et al., 2024), such as fractional polynomial equations, which consider both linear and nonlinear effects of demographic factors. This method was primarily used in the NP-NUMBRS project (Cherner et al., 2021; Marquine et al., 2021). Its limited use may be due to the lack of information regarding variable selection, final model selection, and the transformations needed to convert raw scores to other scales.
Finally, all the previously mentioned studies (using both traditional and regression-based approaches) rely on classical (frequentist) statistical inference. There are few studies that employ Bayesian inference (delCacho-Tena et al., 2024), with notable exceptions like the work of Crawford et al. (2009), which highlight the unavoidable uncertainty over percentile ranks. Bayesian inference offers several advantages over the aforementioned discussed methods, including the ability to incorporate prior information regarding a parameter, even indicating that no information is available (Berger, 2006), provide more intuitive probability statements, and offer more flexible tools to model complex situations better accounting for uncertainty and variability in the data (Clayton et al., 2021).
Given this neuropsychology landscape for Spanish speakers, it is evident that updated normative data for Spanish speakers in the U.S. are essential considering that norms are most precise in the year of their creation (Mitrushina et al., 2005). Therefore, the purpose of this study was to present the methodology to generate normative data for healthy Spanish-speaking adults (18– 80 years old) living in the U.S. using Bayesian inference as an improved approach to normative data estimation for neuropsychological tests.
2Methods
2.1Participants
The initial sample consisted of N = 253 Spanish-speaking healthy adults from eight U.S. regions: California (n = 42), Connecticut (n = 33), Florida (n = 54), Indiana (n = 9), New Jersey (n = 27), Oregon (n = 12), Virginia (n = 36), and Wisconsin (n = 40). A total of n = 8 participants were excluded from the analyses due to missing information regarding education (n = 5), bilingual dominance (Bilingual Dominance Scale [BDS]; n = 1), time in the U.S., or being over 80 years of age (n = 1), yielding a final sample of 245 participants. The majority of the sample were women (60.8%), with a mean age of 41.1 years (SD = 14.9; range = 18– 80), and a mean number of years of education of 15.1 (SD = 4.2; range = 2– 26). Average time lived in the U.S. was 236 months (SD = 158.4); 27.3% moved to the U.S. during childhood/adolescence, while 61.7% during adulthood. For measures of Spanish/ English dominance, the average score on the Bidimensional Acculturation Scale (BAS) was 3.40 (SD = 0.48), and the average score on the BDS was 10.33 (SD = 11.8). Additional demographic characteristics of the sample are shown in Table 1.
Table 1
Demographic characteristics of the sample (N = 245)
| Age | Education | Sex | |||
| Range | n | Mean (SD) | Mean (SD) | Male n (%) | Female n (%) |
| 18–25 | 46 | 21.4 (2.4) | 14.5 (2.2) | 19 (4.6) | 27 (6.5) |
| 26–33 | 36 | 28.7 (2.3) | 16.2 (3.9) | 13 (3.1) | 23 (5.5) |
| 34–41 | 48 | 37.2 (2.4) | 15.9 (4.9) | 17 (4.1) | 31 (7.5) |
| 42–49 | 36 | 45.6 (2.5) | 15.0 (4.5) | 12 (2.9) | 24 (5.8) |
| 50–57 | 42 | 53.2 (2.4) | 14.5 (4.8) | 18 (4.3) | 24 (5.8) |
| 58–65 | 24 | 61.4 (2.2) | 14.9 (4.0) | 11 (2.7) | 13 (3.1) |
| 66–80 | 13 | 71.3 (4.8) | 13.8 (4.5) | 6 (1.5) | 7 (1.7) |
In the current study, 83.9% of the sample had all neuropsychological scores, while 8.9%, 4.0%, and 1.6% had 1, 2, and 3 incomplete scores, respectively. Incomplete data are a common problem in data analysis, however approaches in statistical theory related to the analysis of incomplete data are available to address this issue. In the current study Multivariate Imputation by Chained Equations (MICE) system was implemented. This method is widely used across scientific fields, such as addiction, cardiovascular disease, epidemiology, genetics, pediatrics and child development, rehabilitation, and others. MICE creates multiple imputations, rather than a single imputation, to account for statistical uncertainty. Additionally, the chained equations approach is highly flexible and can manage variables of different types (e.g., continuous or binary) and complexities, such as bounds or survey skip patterns (Azur, 2011). In this study, Predictive Mean Matching MICE methodology was used with 10 iterations and five imputations. The missing data pattern was close to monotone, so convergence was expedited by visiting the columns in increasing order of the number of missing values.
To participate in this study, individuals met the following eligibility requirements: a) were between 18 to 80 years of age; b) had been living in the U.S. for at least 1 year (12 continuous months); c) self-identified Spanish as their “dominant language;” d) had at least one year of formal education; e) were able to read and write at the time of evaluation in Spanish; f) scored≥23 on the Mini-Mental State Examination (MMSE, Folstein et al., 1975; Villaseñor-Cabrera et al., 2010); g) scored < 10 on the Patient Health Questionnaire– 9 (PHQ-9, Kroenke et al., 2001); and h) scored < 10 on the generalized anxiety disorder (GAD-7; Spitzer et al., 2006).
Individuals were not eligible if any of the following were present: a) a history of neurodevelopmental disorder; b) a history of learning disorder; c) past or present neurologic condition; d) past or present chronic medical condition that may affect cognition (i.e., metabolic syndrome, chronic heart failure, sleep apnea); e) past or present use of psychotropic medications that may affect cognition; f) past or present history of substance abuse or dependence; or g) past or present history of psychiatric disorder.
2.2Measures
2.2.1Clinical and demographic interview for participants
A study-specific questionnaire was created to collect information about participants related to health status and clinical history. This information was used to identify participants who triggered the exclusion criteria. During the interview, the following information was obtained: demographic data; motor, language, visual, and auditory problems; treatment received by different professionals (e.g., neurologist, psychiatrist, medical rehabilitation professional, occupational therapist, speech therapist, psychologist); psychological disorders; and pharmacological treatment.
2.2.2Screening test
Mini-Mental State Examination (MMSE). The MMSE (Folstein et al., 1975) is well-known cognitive screening tool widely used in neuropsychological clinical practice (Patten & Fick, 1993). The MMSE has many benefits, particularly its rapid application and high sensitivity and specificity in relation to cognitive dysfunctions (Villaseñor-Cabrera et al., 2010).
Patient Health Questionnaire– 9 (PHQ-9). The PHQ (Kroenke et al., 2001) is a self-administered assessment tool used to identify the presence of various mental disorders. The PHQ-9 is a module of the broader PHQ, used to screen specifically for the presence depression. A study of the PHQ-9 concluded that it is a “useful clinical and research tool” and is a “reliable and valid measure of depression severity” (Kroenke et al., 2001). The questionnaire consists of nine items that reflect typical symptoms of depression and directs the respondent to indicate a response from 0– 3 (“not at all” to “nearly every day”), depending on how often they have been bothered by each problem over the past two weeks. The responses are totaled, and the total score ranges from 0 to 27 (Wulsin et al., 2002), with higher scores reflecting greater levels of depression symptoms [includes ranges 0– 4 “None”, 5– 9 “Mild depression”, 10– 14 “Moderate depression”, 15– 19 “Moderately severe depression” and 20– 27 “Severe depression”].
Generalized Anxiety Disorder 7-item (GAD-7). The GAD-7 (Spitzer et al., 2006) is a useful self-report measure with strong criterion validity for identifying probable cases of generalized anxiety disorder (GAD). Elevated scores on the scale are strongly associated with multiple domains of functional impairment and disability. Although many individuals have concurrent symptoms of depression and anxiety, factor analysis confirmed that the GAD-7 can accurately identify distinct dimensions for both GAD and depression (Spitzer et al., 2006). Individuals are asked to select the frequency of anxiety symptoms over a span of two weeks. Items are scored from 0 to 3 (0 “Not at all”, 1 “Several days”, 2 “More than half the days”, 3 “Nearly every day”), for a total score ranging from 0 to 21. Higher scores reflect greater symptom severity [0– 4 “=Minimal”, 5– 9 “Mild”, 10– 14 “Moderate” and 5– 21 “Severe”]. A score of 10 or greater on the GAD-7 is suggested by the scale developers as a reasonable cut point for identifying probable cases of GAD (Spitzer et al., 2006).
2.2.3Acculturation and Bilingual Dominance measures
Bidimensional Acculturation Scale (BAS). The BAS (Marin & Gamba, 1996) is a 24-item measure of an individual’s level of acculturation to Hispanic culture and to non-Hispanic culture (12 items for each subcultural domain). Items included load onto three distinct domains: language use (three items), linguistic proficiency (six items), and electronic media use (3 items). Scores for each subcultural domain are obtained by calculating the average responses of the 12 items assigned to that specific culture. The average derived scores for subdomains can range from 1 to 4. Acculturation scores below 2.5 indicate low acculturation for that domain. Scores above 2.5 in both domains can be interpreted as biculturalism. Unlike other acculturation scales, the BAS provides a continuum score for acculturation in both the dominant and non-dominant culture.
Bilingual Dominance Scale (BDS). The BDS (Dunn & Tree, 2009) is a 12-item self-report measure of the language dominance. Items reflect percent of language use in both English and Spanish, age of second language acquisition, age at which comfort was attained in both languages, and restructuring of language fluency due to changes in linguistic environments. Continuous scale scores are derived by applying a weighted point system to behavior in each language, providing separate dominance scores for both first and second languages. A composite score is created by subtracting one language use score from the other. A score close to zero indicates equally strong language dominance. Negative scores suggest primary English dominance.
2.2.4Neuropsychological tests
Participants who met the inclusion criteria were administered the following neuropsychological tests:
1. Phonological and Semantic Verbal Fluency Tests
2. Boston Naming Test (BNT) (Goodglass et al., 2005)
3. Symbol Digit Modalities Test (SDMT) (Smith, 1982)
4. Brief Test of Attention (BTA) (Schretlen, 1997)
5. World Health Organization-University of California Los Angeles Auditory Verbal Learning Test (AVLT) (Maj et al., 1993)
6. Rey-Osterrieth Complex Figure Test (ROCF) (Rey, 2009)
7. Modified Wisconsin Card Sorting Test (M-WCST) (Schretlen, 2010)
8. Stroop Color and Word Test (Golden, 2002)
9. Trail Making Test (TMT) (Reitan & Wolfson, 1985)
10. Word Accentuation Test (WAT-C) (Kreuger et al., 2006)
11. Clock Drawing Test (CDT) (Strauss et al., 2006)
12. Bells Test (Gauthier et al., 1989)
2.2.5Procedure
Ten institutions collaborated on this study and were responsible for collecting data. Each institution had their own institutional review board oversee the ethical conduct of the study at their site. Only de-identified data were deposited in a centralized and secure database. All site-PIs and research assistants who collected data underwent a formal and structured online training and qualification check for administration of the neuropsychological instruments used in the study. Each subject was paid $25 U.S. as compensation for their participation.
2.3Statistical analyses
2.3.1Bayesian approach
For the present study, Bayesian inference was used. Bayesian inference offers an alternative to the classical approach by treating parameters as random variables with probability distributions, rather than fixed but unknown quantities. The goal is to compute the posterior distribution of the parameters given the observed data [P (θ|D)], using Bayes’ theorem:
This means the posterior distribution can be determined by adjusting the product of the likelihood and the prior and using numerical or simulation strategies (Gómez-Rubio, 2021; Kruschke, 2015).
2.3.2Variable selection
A Bayesian approach was also adopted to determine which variables should be included as predictors. In this scenario, the different regression models are considered as the unknown parameters. A prior probability is then given to each of the models and combined with the information from the data. This combination is summarized in a posterior probability for each model. In this variable selection procedure, the number of models, or, equivalently, the number of possible combinations of variables, is 2p where p refers to the number of covariates. After the posterior probabilities for each model are obtained, researchers can develop a better idea of which models are more strongly related to the output (Li & Clyde, 2018). As an example, imagine we have 2 variables (x1, x2) to include in a linear predictor η. With these two variables, we can form a total of 22 = 4 different models with linear predictors:
M1: η = β0
M2: η = β0 + β1x1
M3: η = β0 + β2x2
M4: η = β0 + β1x1 + β2x2
Starting from a prior probability for each of these models P (Mi) for i = 1, 2, 3, 4, and using the Bayes theorem, we can give a posterior probability P (Mi|D) for each model given data
However, the posterior probability of a single model is not always the best summary, especially when the number of models is large, as the probabilities may be very low. Instead, researchers can use posterior inclusion probabilities (PIPs) for each variable. These PIPs are obtained by summing the probabilities of all the models that contain a given variable. For instance, in the example above, the PIP for x1 is obtained as the sum of the posterior probability of models M2 and M3, such that:
For this study, once the PIPs for each variable (xi) were obtained, an elbow plot (x-axis=each covariate, y-axis=PIP values) was created to examine substantial changes in PIPs. Variables with PIPs greater than.5 were selected for the regression model for each neuropsychological score. For a better understanding on how to perform Bayesian variable selection we recommend reading Bayarri et al. (2012).
2.3.3The effects of demographic variables
The effects of demographic variables on scores were evaluated by means of linear (LM) or generalized linear models (GLM). For each score, separate regression models were fitted to establish score-specific normative data. The full regression models included as predictors: age, age2, education (log transformed), sex, time living in U.S., BAS, BDS, and all two-way interactions between these variables. Age was centered (age in years –
2.3.4Probabilistic distributions
To implement the LM or GLM regression, different probability distributions were used depending on the type of neuropsychology test scores being studied. Therefore, for this study, regressions were implemented based on the following probabilistic distributions:
Binomial distribution. It is a discrete probability distribution that describes the number of successes in a fixed number of independent Bernoulli trials, where each trial can be classified as success or failure. This is Yi ∼ Bin (mi, πi), where mi is the total number of trials and πi is the probability of success on each trial for each individual i. BNT and BTA scores were modeled using a Binomial regression, and the probability can be expressed as follows:
Poisson distribution. The distribution most often used for modeling counts is the Poisson distribution Yi ∼ Po (μi), where μi > 0 are the expected counts for individual i and it can be expressed as follows:
Verbal fluency, Stroop test and SDMT scores were modeled using Poisson regression.
Beta distribution. This is a continuous probability distribution defined on the interval [0, 1], and it is commonly used to model random variables representing proportions or probabilities. A Beta distribution was assumed Yi ∼ B (μi, φi) for ROCFT immediate recall, delayed recall and WHO-UCLA AVLT test scores. These scores were scaled by dividing the participant’s score by the maximum possible score for each test, resulting in proportional scores, and it can be expressed as follows:
Gamma distribution. This is a continuous probability distribution when the variable of interest follows a skewed, positive distribution (i.e., asymmetric time). In this study, the TMT time scores were assumed following Yi ∼ Ga (αi, βi), where the expected value is
A particular case of the Gamma distribution is the exponential distribution, where αi = 1 for all observations. This is a continuous probability distribution that has a memoryless property, meaning that the probability of an event occurring in the next interval is independent of how much time has already elapsed. It is characterized by a single parameter, Yi ∼ Ex (λi), where λi represents the rate at which events occur and the expected time to an event is μi = 1/λi. ROCFT copy, the free-drawing and copy conditions of CDT, as well as Bells test scores were scaled using the calculation: [(maximum test score - participant score)/ maximum test score], and were modeled using Exponential regression.
2.3.5Priors distributions
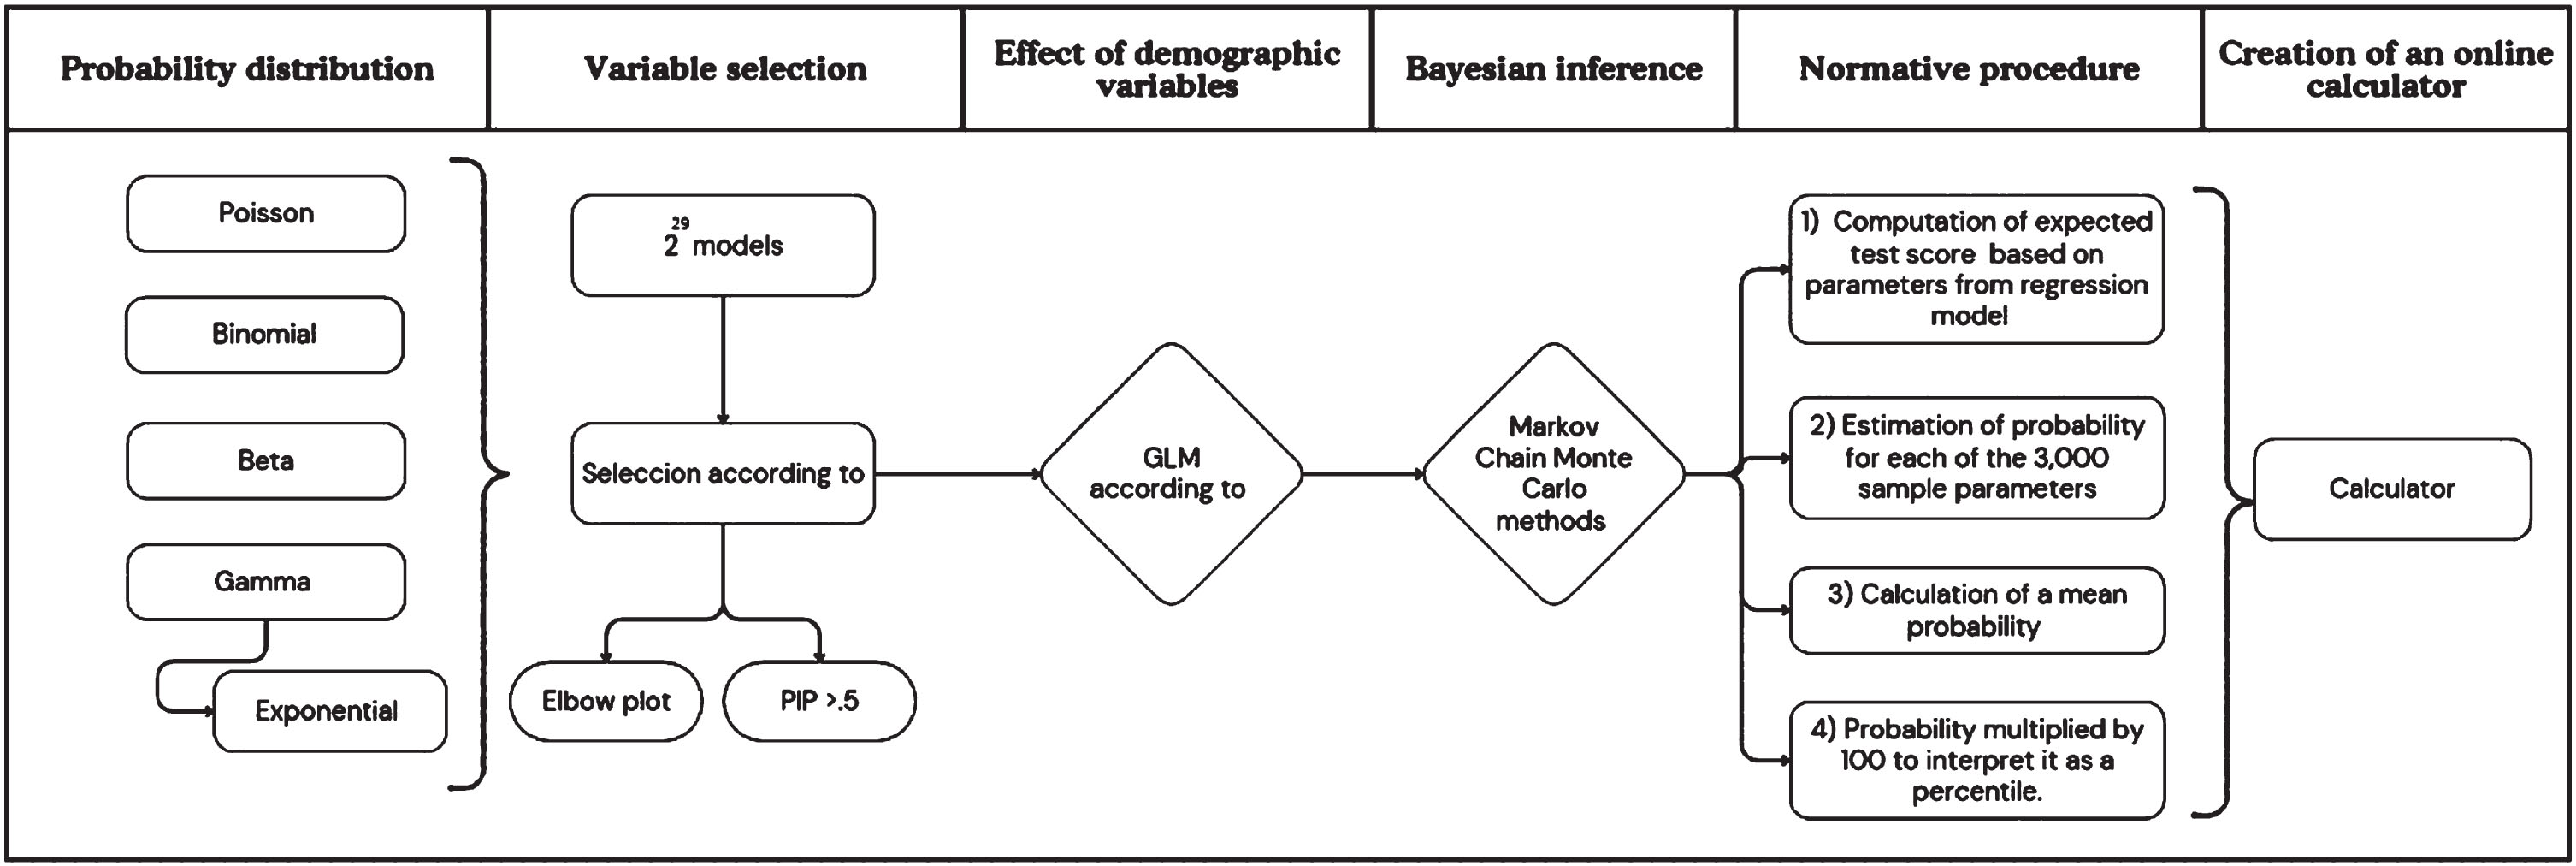
Once the probability distribution for each test score was identified, Bayesian regression models were conducted, where prior distributions for each of the unknown parameters (β0, β1, … βp) followed a normal distribution centered at 0, with large variance (i.e., σ2 = 104 and τ = 10–3) for Beta, Binomial, Gamma, and Poisson models. For the Exponential model, a Gamma distribution was used centered at 10–3 with large variance (σ2 = 104). Vague or non-informative prior distributions were assigned to the models. The Bayesian inference procedure was performed using Markov Chain Monte Carlo methods through the software JAGS (Just Another Gibbs Sampler) and its R interface rjags (Plummer, 2022). For the convergence of three chains for each parameter, a burning period was used. A total of 3,000 samples of each posterior distribution was left.
R 4.4.0 for Linux (R Development Core Team, 2024) was used to perform the analyses, and the mice package (Buuren & Groothuis-Oudshoorn, 2011) was used to conduct the MICE analysis. See supplemental material for illustration of the script of implementing the Bayesian generalized linear model (BGLM) for the generation of normative data in neuropsychological tests.
2.3.6Normative procedure
The norms (i.e., a percentile score) for the neuropsychological test scores were established using a four-step procedure: a) The expected test score
Fig. 1
Flowchart of the methodology.
2.3.7User-friendly normative data
To facilitate the understanding of the procedure to obtain the percentile associated with a given score on a neuropsychological test, an example will be given. Suppose you need to find the probability for a woman, who is 50 years old and has 15 years of education. She obtained a BDS score of 10 and a score of 9 on the /r/ phoneme.
Since the method explained above is complex and can be prone to human error due to the number of required computations, an online calculator based on https://www.rstudio.com/products/shiny/ was created. This will facilitate probability calculation as clinicians only need to enter basic patient information into the calculator (i.e., raw score for the specific test, age, education, and so on). This tool is available for all users at https://github.com/diegoriveraps/calculators. Using the calculator and introducing the information requested for the example above, this woman would obtain a mean probability score of.213, that is, at the 21.3th percentile (see Supplementary Material - point 4).
3Discussion
The purpose of this article was to describe the methodology and procedures utilized to generate normative data for 12 neuropsychological tests for healthy Spanish-speaking adults (18– 80 years old) living in the U.S. using Bayesian GLMs as a novel approach. The final sample size was comprised of 245 participants from eight U.S. states (California, Connecticut, Florida, Indiana, New Jersey, Oregon, Virginia, and Wisconsin) who immigrated or had ancestry from 17 different Latin American countries of origin (Argentina, Bolivia, Chile, Colombia, Cuba, Dominican Republic, Ecuador, El Salvador, Guatemala, Honduras, Mexico, Nicaragua, Panama, Peru, Puerto Rico, Uruguay, and Venezuela).
This study fills numerous gaps in the research to date, generating normative neuropsychological data for Spanish speakers living in the U.S. This study considers the impact of sociocultural factors including level of acculturation to Hispanic culture, bilingual language dominance, and time living in the U.S., in addition to the traditional sociodemographic variables such as age, education level, and sex (delCacho et al., 2024). Additionally, for the first time in neuropsychological normative data estimation, this study used probabilistic distributions other than the limited normal distribution (Poisson, Binomial, Exponential and Gamma), as well as Bayesian inference, to generate the most accurate neuropsychological norms possible.
Bayes’ theorem offers a robust methodology for statistical inference, enabling the incorporation of prior information and combining it with data to control uncertainty. Even without prior information, non-informative priors can be used to make neutral inferences (Berger, 2006). Results are presented as posterior probability distributions, overcoming the difficulties in interpreting p-values and confidence intervals (Trafimow & Marks, 2015). A key advantage of the Bayesian approach is the intuitive interpretation of results through direct probabilities. For example, it allows statements like, “a 95% probability that a parameter lies within a specific range,” which is more intuitive than frequentist confidence intervals (Kruschke, 2010).
Additionally, Bayesian methods provide flexibility and ensure convergence even as model complexity increases, where frequentist methods may fail. This is particularly useful in hierarchical modeling, capturing complex dependencies and variations at different levels (Ntzoufras, 2008; Sacchi & Swallow, 2021). The main criticism of using priors in Bayesian analysis is their subjectivity and influence on results. However, this can be mitigated by using non-informative priors, sensitivity analysis, and standardized priors (Berger, 2006; Congdon, 2006; Gelman et al., 2013). A good review of the advantages and performance of this methodology can be found in Steel (2020).
One key difference of this study compared to other normative data studies is the approach to selection of variables. The goal of variable selection is to identify a single ‘best’ model (Forte et al., 2018; James et al., 2021). The most common statistical methods used in neuropsychological normative data for this propose are linear regressions (49.5%), correlation and/or covariance coefficients (30.1%), analysis of variance (ANOVA), multivariate analysis of variance (MANOVA), analysis of covariance (ANCOVA; 22.1%), Student’s t and/or Mann– Whitney U (13.3%), and Chi-square (2.2%) (delCacho et al., 2024). However, while bivariate methods (i.e., Pearson’s, Spearman’s, bivariate correlation) are simple and useful for initial data exploration, they are inadequate for variable selection in a multivariate analysis. This is due to their inability to capture complex interactions, as they analyze each variable in isolation concerning the outcome (y). A variable might not show a strong correlation with the outcome on its own, but can be very informative when considered alongside other variables. In other words, bivariate methods do not evaluate how a variable contributes to the model when all other variables are considered, where the importance of a variable may change with the inclusion or exclusion of other variables in the model (James et al., 2021).
In terms of linear regression models, methods such as forward selection, backward elimination, and stepwise selection are commonly used. These methods are useful because they offer a balance between thoroughness and computational efficiency, but their sequential nature can lead to suboptimal solutions that may not consider all possible interactions. Therefore, it is important to combine them with cross-validation and complement them with more robust methods like regularization techniques (e.g., LASSO, Ridge; James et al., 2021; Miller, 2002).
Although it has a higher computational cost, this study used the 2pvariable selection methodology, which is an exhaustive approach that considers all possible combinations of p variables to determine the best-fitting set of variables for a model. This methodology compares the performance of all generated models and selects the one that optimizes the chosen evaluation criterion. In this study, a primary model consisting of 29 covariates (including two-level interactions) was proposed, resulting in a total of 2p models, or 536,870,912 models for each neuropsychological test score studied, to select the variables that should be considered in the creation of normative data. Unlike forward and backward selection, the 2p methodology evaluates all possible combinations of variables, ensuring that no potentially relevant interactions are omitted. This can be particularly important in cases where there are complex interactions between variables that are not easily detected with sequential methods, as is the case when there are varied demographic and cultural factors that may impact test performance.
Finally, according to delCacho et al. (2024), normative data studies in neuropsychology tend to rely on regression-based linear models, regardless of the nature of the outcome variable, leading to failure to meet required statistical assumptions. A review of GLM methodology by Innonceti et al. (2023) highlights that 52% of models do not satisfy normality or it is not reported, and 66% do not satisfy homoscedasticity or it is not reported. This failure can be due to various reasons, but the most common is that the probabilistic model used in the regression is not appropriate, for example, using models with an inappropriate normal distribution.
Currently, GLMs offer significant advantages over traditional linear models for discrete (count) and time variables. Their flexibility to handle different error distributions, model non-constant variance, and provide interpretations consistent with the nature of the data make them a tool increasingly used in applied statistics. Additionally, as in the current study, Bayesian GLMs offer further advantages over traditional GLMs (Dey et al., 2000). These advantages include the ability to incorporate prior information, better estimation of uncertainty, greater flexibility in modeling, and more robust methods for model evaluation and comparison. These features make Bayesian GLM a versatile tool for data analysis in a wide range of scientific fields.
3.1Limitations
One limitation of this study is that the use of Bayesian inference remains a novel aspect within the field of neuropsychology and entails high computational cost. Although the quadratic effect of age and the natural logarithm of education level were evaluated, the lack of previous studies prevented the assessment of other mathematical functions in other covariates, such as BDS and BAS scores. Consequently, assumptions of linear relationships with the neuropsychology test scores were used. Additionally, the quality of education of participants was not evaluated, which is a significant limitation given that participants came from different countries where the quality of education can vary dramatically. To estimate percentiles for a new participant, the process can be complex if it is computed manually. This limitation is addressed by having created a calculator that estimates the percentile for participants. Furthermore, as the estimation is based on probabilistic distributions, the normative data will be expressed in terms of percentiles.
4Conclusion
Prior to the current study, tools available to neuropsychologists evaluating the cognitive performance predominantly Spanish-speaking adults covered a limited scope of cognitive abilities when compared to neuropsychological measures available for assessing English-speaking adults. This study, however, generated new normative neuropsychological data for Spanish-speaking adults living in the U.S. for many of the most commonly employed neuropsychological tests and therefore has the potential to improve the practice of neuropsychological assessment in the U.S. for this group. Further, for the first time in the known neuropsychological research literature, this study deployed modern statistical methods including the use of alternative score distributions and Bayesian prior probabilities to develop the most comprehensive and accurate prediction models. As a result, this study represents an advance not only in clinical but research methodology that future normative studies may consider emulating.
The current study has the potential to help reduce healthcare disparities in U.S. Hispanic populations via improvement in the accuracy of test results which has direct implications for diagnosis and treatment of neurological conditions. For all these reasons, the current study helps fill a large the gap in the research literature and in the standard of care for the neuropsychological assessment of Spanish-Speakers living in the U.S.
Acknowledgments
We extend our sincere gratitude to the institutions and participants whose contributions made this research possible. We sincerely thank Frances Chiliquinga, M.A., Zara Belo, and Erika Mendez, Yanci Almonte Vargas, B.S for their assistance in participant recruitment and community engagement. Their contributions were vital to the study’s success.
Conflicts of interest
The authors have no conflicts of interest to declare.
Funding
This research was supported in part by grants awarded to Carmen I Carrión, Psy.D. from the National Institute of Health (grant number P30 AG066508). Its contents are solely the responsibility of the authors and do not necessarily represent the official view of NIH. This research was funded, in part by grant awarded to Miriam J Rodriguez to the National Institute of Heath/National Institute of Aging (grant number L60 AG069322).
Supplementary material
[1] The supplementary material is available in the electronic version of this article: https://github.com/orozcoae89/supplement_data/blob/main/supplementary.Rmd.
References
1 | Azur, M. J. , Stuart, E. A. , Frangakis, C. , Leaf, P. J. ((2011) ). Multiple imputation by chained equations: What is it and how does it work? International Journal of Methods in Psychiatric Research, 20: (1), 40–49. https://doi.org/10.1002/mpr.329 |
2 | Bayarri, M. J. , Berger, J. O. , Forte, A. , Garcıa-Donato, G. ((2012) ). Criteria for Bayesian model choice with application to variable selection. The Annals of Statistics, 40: (3), 1550–1577. https://doi.org/10.1214/12-AOS1013 |
3 | Berger, J. ((2006) ). The case for objective Bayesian analysis. Bayesian Analysis, 1: (3), 385–402. https://doi.org/10.1214/06-BA115 |
4 | Bialystok, E. , Craik, F. I. , Luk, G. ((2012) ). Bilingualism: consequences for mind and brain. Trends in Cognitive Sciences, 16: (4), 240–250. |
5 | Boone, K. B. , Victor, T. L. , Wen, J. , Razani, J. , Pontón, M. ((2007) ). The association between neuropsychological scores and ethnicity, language, and acculturation variables in a large patient population. Archives of Clinical Neuropsychology, 22: (3), 355–365. |
6 | Cherner, M. , Marquine, M. J. , Umlauf, A. , Morlett Paredes, A. , Rivera Mindt, M. , Suárez, P. , Yassai-Gonzalez, D. , Kamalyan, L. , Scott, T. , Heaton, A. , Diaz-Santos, M. , Gooding, A. , Artiola i Fortuny, L. , Heaton, R. K. ((2021) ). Neuropsychological Norms for the U.S.-Mexico Border Region in Spanish (NP-NUMBRS) Project: Methodology and sample characteristics. The Clinical Neuropsychologist, 35: (2), 253–268. https://doi.org/10.1080/13854046.2019.1709661 |
7 | Clayton, G. L. , Elliott, D. , Higgins, J. P. T. , Jones, H. E. ((2021) ). Use of external evidence for design and Bayesian analysis of clinical trials: A qualitative study of trialists’ views. Trials, 22: (1), Article 1. https://doi.org/10.1186/s13063-021-05759-8 |
8 | Congdon, P. ((2006) ). Bayesian statistical modelling. John Wiley & Sons. https://doi.org/10.1002/9780470035948 |
9 | Crawford, J. R. , Garthwaite, P. H. , Slick, D. J. ((2009) ). On percentile norms in neuropsychology: Proposed reporting standards and methods for quantifying the uncertainty over the percentile ranks of test scores. The Clinical Neuropsychologist, 23: (7), 1173–1195. https://doi.org/10.1080/13854040902795018 |
10 | delCacho-Tena, A. , Christ, B. R. , Arango-Lasprilla, J. C. , Perrin, P. B. , Rivera, D. , Olabarrieta-Landa, L. ((2024) ). Normative Data Estimation in Neuropsychological Tests: A Systematic Review. Archives of Clinical Neuropsychology, 39: (3), 383–398. https://doi.org/10.1093/arclin/acad084 |
11 | Dey, D. K. , Ghosh, S. K. , Mallick, B. K. (Eds.). ((2000) ). Dynamic Generalized Linear Models. In Generalized Linear Models. CRC Press. |
12 | Dunn, A. L. , Tree, J. E. F. ((2009) ). A quick, gradient bilingual dominance scale. Bilingualism: Language and Cognition, 12: (3), 273–289. |
13 | Flores, I. , Casaletto, K. B. , Marquine, M. J. , Umlauf, A. , Moore, D. J. , Mungas, D. , Gershon, R. C. , Beaumont, J. L. Heaton, R. K. ((2017) ). Performance of Hispanics and Non-Hispanic Whites on the NIH Toolbox Cognition Battery: The roles of ethnicity and language backgrounds. Clinical Neuropsychologist, 31: (4), 783–797. |
14 | Folstein, M. F. , Folstein, S. E. , McHugh, P. R. ((1975) ). “Minimental state”:Apractical method for grading the cognitive state of patients for the clinician. Journal of Psychiatric Research, 12: (3), 189–198. |
15 | Forte, A. , Garcia-Donato, G. , Steel, M. ((2018) ). Methods and Tools for Bayesian Variable Selection and Model Averaging in Normal Linear Regression. International Statistical Review, 86: (2), 237–258. https://doi.org/10.1111/insr.12249 |
16 | Gasquoine, P. G. , Weimer, A. A. , Estevis, E. , Perez, E. ((2021) ). Survey of Spanish language neuropsychological test use in the assessment of Hispanic Americans/Latino/as/x. Archives of Clinical Neuropsychology, 36: (7), 1350–1360. |
17 | Gauthier, L. , Dehaut, F. , Joanette, Y. ((1989) ). The bells test: a quantitative and qualitative test for visual neglect. International Journal of Clinical Neuropsychology, 11: (2), 49–54. |
18 | Gelman, A. , Carlin, J. B. , Stern, H. S. , Dunson, D. B. , Vehtari, A. , Rubin, D. B. ((2013) ). Bayesian data analysis. CRC press. |
19 | Golden, C. J. , Freshwater, S. M. ((2002) ). Stroop Color and Word Test: Revised examiner’s manual. Wood Dale, IL: Stoelting Co. |
20 | Gómez-Rubio, V. ((2021) ). Bayesian inference with INLA. Chapman & Hall/CRC Press. Boca Raton, FL. |
21 | Goodglass, H. , Kaplan, E. , Barresi, B. ((2005) ). Evaluación de la Afasia y de Trastornos Relacionados. Madrid: Editorial Médica Panamericana. |
22 | Innocenti, F. , Tan, F. E. S. , Candel, M. J. J. M. , van Breukelen, G. J. P. ((2023) ). Sample size calculation and optimal design for regression-based norming of tests and questionnaires. Psychological Methods, 28: (1), 89–106. https://doi.org/10.1037/met0000394 |
23 | Ivnik, R. J. , Malec, J. F. , Smith, G. E. , Tangalos, E. G. , Petersen, R. C. , Kokmen, E. , Kurland, L. T. ((1992) ). Mayo’s older americans normative studies: WAIS-R norms for ages 56 to 97. Clinical Neuropsychologist, 6: (sup001), 1–30. https://doi.org/10.1080/13854049208401877 |
24 | James, G. , Witten, D. , Hastie, T. , Tibshirani, R. ((2021) ). An Introduction to Statistical Learning: With Applications in R. Springer US. https://doi.org/10.1007/978-1-0716-1418-1 |
25 | Kroenke, K. , Spitzer, R.L. , Williams, J.B. ((2001) ). The PHQ-9. Journal of General Internal Medicine, 16: (9), 606–613. https://doi.org/10.1046/j.1525-1497.2001.016009606.x |
26 | Krueger, K. R. , Lam, C. S. , Wilson, R. S. ((2006) ). The Word Accentuation Test–Chicago. Journal of clinical and experimental neuropsychology, 28: (7), 1201–1207. |
27 | Kruschke, J. K. ((2010) ). Bayesian data analysis. WIREs Cognitive Science, 1: (5), 658–676. https://doi.org/10.1002/wcs.72 |
28 | Kruschke, J. K. ((2015) ). Chapter 5—Bayes’ Rule. In Kruschke J. K. (Ed.), Doing Bayesian Data Analysis (Second Edition) (pp. 99–120). Academic Press. https://doi.org/10.1016/B978-0-12-405888-0.00005-2 |
29 | Kutner, M. H. , Nachtsheim, C. J. , Neter, J. , Li, W. ((2005) ). Applied linear statistical models (5th ed.). McGraw Hill. |
30 | Li, Y. , Clyde, M. A. ((2018) ). Mixtures of g-Priors in Generalized Linear Models. Journal of the American Statistical Association, 113: (524), 1828–1845. https://doi.org/10.1080/01621459.2018.1469992 |
31 | Lucas, J. A. , Ivnik, R. J. , Willis, F. B. , Ferman, T. J. , Smith, G. E. , Parfitt, F. C. , Petersen, R. C. , Graff-Radford, N. R. ((2005) ). Mayo’s Older African Americans Normative Studies: Normative Data for Commonly Used Clinical Neuropsychological Measures. The Clinical Neuropsychologist, 19: (2), 162–183. https://doi.org/10.1080/13854040590945265 |
32 | Maj, M. , D’Elia, L. , Satz, P. , Janssen, R. , Zaudig, M. , Uchiyama, C. ,... Chervinsky, A. ((1993) ). Evaluation of two new neuropsychological tests designed to minimize cultural bias in the assessment of HIV-1 seropositive persons: A WHO study. Archives of Clinical Neuropsychology, 8: (2), 123–135. |
33 | Marin, G. , Gamba, R. J. ((1996) ). A new measurement of acculturation for Hispanics: The Bidimensional Acculturation Scale for Hispanics (BAS). Hispanic Journal of Behavioral Sciences, 18: (3), 297–316. |
34 | Marquine, M. J. , Morlett Paredes, A. , Madriaga, C. , Blumstein, Y. , Umlauf, A. , Kamalyan, L. , Rivera Mindt, M. , Suarez, P. , Artiola I. Fortuni, L. , Heaton, R. K. , Cherner, M. ((2021) ). Demographically-adjusted norms for selected tests of verbal fluency: Results from the Neuropsychological Norms for the US-Mexico Border Region in Spanish (NP-NUMBRS) project. The Clinical Neuropsychologist, 35: (2), 269–292. https://doi.org/10.1080/13854046.2020.1762931 |
35 | Miller, A. ((2002) ). Subset Selection in Regression (2nd ed.). Chapman and Hall/CRC. https://doi.org/10.1201/9781420035933 |
36 | Mitrushina, M. , Boone, K. B. , Razani, J. , D’Elia, L. F. ((2005) ). Handbook of normative data for neuropsychological assessment, Oxford University Press. |
37 | Morlett Paredes, A. , Gooding, A. , Artiola i Fortuny, L. , Rivera Mindt, M. , Suárez, P. , Scott, T. M. , Heaton, A. , Heaton, R. K. , Cherner, M. , Marquine, M. J. ((2021) ). The state of neuropsychological test norms for Spanish-speaking adults in the United States. The Clinical Neuropsychologist, 35: (2), 236–252. https://doi.org/10.1080/13854046.2020.1729866 |
38 | Ntzoufras, I. ((2008) ). Bayesian Hierarchical Models. In Bayesian Modeling Using WinBUGS (pp. 305–340). https://doi.org/10.1002/9780470434567.ch9 |
39 | Patten, S. B. , Fick, G. H. ((1993) ). Clinical interpretation of the mini-mental state. General hospital psychiatry, 15: (4), 254–259. |
40 | Peña-Casanova, J. , Blesa, R. , Aguilar, M. , Gramunt-Fombuena, N. , Gómez-Ansón, B. , Oliva, R. , Molinuevo, J. L. , Robles, A. , Barquero, M. S. , Antúnez, C. , Martınez-Parra, C. , Frank-Garcıa, A. , Fernández, M. , Alfonso, V. , Sol, for the N. S. T., Josep M. ((2009) ). Spanish Multicenter Normative Studies (NEURONORMA Project): Methods and Sample Characteristics. Archives of Clinical Neuropsychology, 24: (4), 307–319. https://doi.org/10.1093/arclin/acp027 |
41 | Peña-Casanova, J. , Quiñones-Úbeda, S. , Quintana-Aparicio, M. , Aguilar, M. , Badenes, D. , Molinuevo, J. L. , Torner, L. , Robles, A. , Barquero, M. S. , Villanueva, C. , Antúnez, C. , Martınez-Parra, C. , Frank-Garcıa, A. , Sanz, A. , Fernández, M. , Alfonso, V. , Sol, J. M. , Blesa, R. , Team, for the N. S. ((2009) ). Spanish Multicenter Normative Studies (NEURONORMA Project): Norms for Verbal Span, Visuospatial Span, Letter and Number Sequencing, Trail Making Test, and Symbol Digit Modalities Test. Archives of Clinical Neuropsychology, 24: (4), 321–341. https://doi.org/10.1093/arclin/acp038 |
42 | Plummer, M. ((2022) ). rjags: Bayesian Graphical Models using MCMC. https://CRAN.R-project.org/package=rjags |
43 | R Development Core Team. ((2024) ). R: A language and environment for statistical computing. R Foundation for Statistical Computing. https://www.R-project.org/ |
44 | Reitan, R. M. , Wolfson, D. ((1985) ). The Halstead–Reitan Neuropsycholgical Test Battery: Therapy and Clinical Interpretation. Tucson, AZ: Neuropsychological Press. |
45 | Rey, A. ((2009) ). REY: Test de copia y de reproducción de memoria de figuras geométricas complejas. Madrid: TEA ediciones. |
46 | Rivera, D. , Olabarrieta-Landa, L. , van der Elst, W. , Gonzalez, I. , Ferrer-Cascales, R. , Peñalver Guia, A. I. , Rodriguez-Lorenzana, A. , Galarza-del-Angel, J. , Irıas Escher, M. J. , Arango-Lasprilla, J. C. ((2021) ). Regression-Based Normative Data for Children From Latin America: Phonological Verbal Fluency Letters M, R, and P. Assessment, 28: (1), 264–276. https://doi.org/10.1177/1073191119897122 |
47 | Rivera, D. , Olabarrieta-Landa, L. , van der Elst, W. , Gonzalez, I. , Rodrıguez-Agudelo, Y. , Aguayo Arelis, A. , Rodriguez-Irizarry, W. , Garcıa de la Cadena, C. , Arango-Lasprilla, J. C. ((2019) ). Normative data for verbal fluency in healthy Latin American adults: Letter M, and fruits and occupations categories. Neuropsychology, 33: (3), 287–300. https://doi.org/10.1037/neu0000518 |
48 | Rodrıguez-Lorenzana, A. , Benito-Sánchez, I. , Adana-Dıaz, L. , Paz, C. P. , Yacelga Ponce, T. , Rivera, D. , Arango-Lasprilla, J. C. ((2020) ). Normative Data for Test of Verbal Fluency and Naming on Ecuadorian Adult Population. Frontiers in Psychology, 11: , 830. https://www.frontiersin.org/articles/10.3389/fpsyg.2020.00830 |
49 | Sacchi, G. , Swallow, B. ((2021) ). Toward Efficient Bayesian Approaches to Inference in Hierarchical Hidden Markov Models for Inferring Animal Behavior. Frontiers in Ecology and Evolution, 9: . https://www.frontiersin.org/articles/10.3389/fevo.2021.623731 |
50 | Schretlen D. ((1997) ). Brief test of attention professional manual, Psychological Assessment Resources, Odessa. FL. |
51 | Schretlen, D. J. ((2010) ). Modified Wisconsin Card Sorting Test: M-WCST; Professional Manual. Odessa, FL: Psychological Assessment Resources. |
52 | Smith, A. ((1982) ). Symbol digit modalities test (SDMT) manual (revised). Western Psychological Services. Los Angeles. |
53 | Spitzer, R. L. , Kroenke, K. , Williams, J. B. W. , Löwe, B. ((2006) ). A Brief Measure for Assessing Generalized Anxiety Disorder: The GAD-7. Archives of Internal Medicine, 166: (10), 1092–1097. https://doi.org/10.1001/archinte.166.10.1092 |
54 | Spitzer, R. L. , Kroenke, K. , Williams, J. B. , Löwe, B. ((2006) ). A brief measure for assessing generalized anxiety disorder: The GAD-7. Archives of Internal Medicine, 166: (10), 1092–1097. |
55 | Steel, M. F. J. ((2020) ). Model Averaging and Its Use in Economics. Journal of Economic Literature, 58: (3), 644–719. https://doi.org/10.1257/jel.20191385 |
56 | Strauss, E. , Sherman, E. M. S. , Spreen, O. ((2006) ). A compendium of neuropsychological tests. Administration, norms, and commentary. Oxford University. |
57 | Trafimow, D. , Marks, M. ((2015) ). Editorial. Basic and Applied Social Psychology, 37: (1), 1–2. https://doi.org/10.1080/01973533.2015.1012991 |
58 | U.S. Census Bureau. ((2018) ). Hispanic population to reach 111 million by 2060. Retrieved from www.census.gov/library/visualizations/2018/comm/hispanic-projected-pop.html |
59 | van Breukelen, G. J. P. , Vlaeyen, J. W. S. ((2005) ). Norming clinical questionnaires with multiple regression: The Pain Cognition List. Psychological Assessment, 17: (3), 336–344. https://doi.org/10.1037/1040-3590.17.3.336 |
60 | van Buuren, S. , Groothuis-Oudshoorn, K. ((2011) ). mice: Multivariate Imputation by Chained Equations in R. Journal of Statistical Software, 45: (3), 1–67. https://doi.org/10.18637/jss.v045.i03 |
61 | van der Elst, W. , Dekker, S. , Hurks, P. , Jolles, J. ((2012) ). The letter digit substitution test: Demographic influences and regression-based normative data for school-aged children. Archives of Clinical Neuropsychology: The Official Journal of the National Academy of Neuropsychologists, 27: (4), 433–439. https://doi.org/10.1093/arclin/acs045 |
62 | Villaseñor-Cabrera, T. , Guàrdia-Olmos, J. , Jiménez-Maldonado, M. , Rizo-Curiel, G. , Peró-Cebollero, M. ((2010) ). Sensitivity and specificity of the Mini-Mental State Examination in the Mexican population. Quality & Quantity, 44: (6), 1105–1112. https://doi.org/10.1007/s11135-009-9263-6 |
63 | Wulsin, L. , Somoza, E. , Heck, J. ((2002) ). The feasibility of using the Spanish PHQ-9 to screen for depression in primary care in Honduras. Primary Care Companion to the Journal of Clinical Psychiatry, 4: (5), 191. |


