
Distance-limited walk tests post-stroke: A systematic review of measurement properties1
Abstract
BACKGROUND:
Improving walking capacity is a key objective of post-stroke rehabilitation. Evidence describing the quality and protocols of standardized tools for assessing walking capacity can facilitate their implementation.
OBJECTIVE:
To synthesize existing literature describing test protocols and measurement properties of distance-limited walk tests in people post-stroke.
METHODS:
Electronic database searches were completed in 2017. Records were screened and appraised for quality.
RESULTS:
Data were extracted from 43 eligible articles. Among the 12 walk tests identified, the 10-metre walk test (10mWT) at a comfortable pace was most commonly evaluated. Sixty-three unique protocols at comfortable and fast paces were identified. Walking pace and walkway surface, but not walkway length, influenced walking speed. Intraclass correlation coefficients for test-retest reliability ranged from 0.80–0.99 across walk tests. Measurement error values ranged from 0.04–0.40 and 0.06 to 0.20 for the 10mWT at comfortable and fast and paces, respectively. Across walk tests, performance was most frequently correlated with measures of strength, balance, and physical activity (r = 0.26-0.8, p < 0.05).
CONCLUSIONS:
The 10mWT has the most evidence of reliability and validity. Findings indicate that studies that include people with severe walking deficits, in acute and subacute phases of recovery, with improved quality of reporting, are needed.
1Introduction
Use of standardized assessment tools is considered a best practice in stroke rehabilitation to evaluate the magnitude of gait deficit, monitor response to therapeutic intervention, educate, and set patient-centered goals (Moore et al., 2009; Otterman et al., 2017; Potter et al., 2011; Teasell et al., 2020). Distance-limited walk tests, such as the 10-metre walk test (Wade, 1992) (10mWT), have been recommended for assessing gait speed after stroke (Kwakkel et al., 2017; Otterman et al., 2017; Sullivan et al., 2013; Teasell et al., 2020). Gait speed is an important outcome of stroke rehabilitation as it is essential for community ambulation (Potter et al., 2011; Salbach et al., 2014), associated with motor function, balance (Ahmed et al., 2003; Kwong et al., 2016), walking function (Ahmed et al., 2003; Fulk et al., 2008), and health-related quality of life (Khanittanuphong & Tipchatyotin, 2017), and a predictor of survival (Studenski et al., 2011). Clinical use of measures of gait speed is inconsistent and variable across settings (Agyenkwa et al., 2020; Braun et al., 2018; Salbach et al., 2011; Van Peppen et al., 2008). Knowledge translation research, guided by models, theories and frameworks, is needed to overcome barriers to gait speed measurement in clinical practice.
The knowledge-to-action (KTA) framework (Graham et al., 2006) is a knowledge translation framework used to guide the process of translating research into practice. Specifically, the knowledge creation funnel in the KTA framework is used to describe the filtering process required to develop knowledge products or tools for end-users. At the base of the funnel, first-generation knowledge refers to the various individual sources of information on a topic, such as research articles and reports, that are of variable quality and time-consuming to acquire. Second-generation knowledge, or knowledge synthesis, is described as an essential precursor to the development of third-generation, user-friendly knowledge tools such as evidence-based algorithms, guides, and guidelines. PTs report that evidence supporting the measurement properties of standardized tools positively influences their decision to adopt them in clinical practice (Jette et al., 2009; McGlynn & Cott, 2007; Pattison et al., 2015). Therefore, the synthesis and critical appraisal of the measurement literature on distance-limited walk tests is necessary to inform the development of knowledge translation strategies designed to facilitate their use among PTs. Such a synthesis for time-limited walk tests has been reported (Salbach et al., 2017). The objective of this study was to synthesize research evidence of the reliability, measurement error, construct validity, and sensitivity to change for distance-limited walk tests in people with stroke. A secondary objective was to determine the influence of walk test protocol elements on test performance.
2Methods
2.1Overview
A systematic review was conducted in two phases guided by a review protocol developed by the research team. The PRISMA checklist (Liberati et al., 2009) was used to guide reporting. Title and abstract and full text screening forms, the critical appraisal form and data extraction form and guide were piloted and refined prior to use by reviewers. All reviewers involved with study selection and appraisal completed orientation and training with the study coordinator.
2.2Search methods
An initial search was conducted in July 2013 using methods previously described (Salbach et al., 2017) and updated in 2017 due to advancements in literature search methodology (Garner et al., 2016). In collaboration with an academic health sciences librarian, we designed a new Medline search strategy that was peer-reviewed by a second librarian (McGowan et al., 2016), before being translated for use with other databases. The updated search included Ovid MEDLINE: Epub Ahead of Print, In-Process & Other Non-Indexed Citations, Ovid MEDLINE® Daily and Ovid MEDLINE®, OVID Embase, EBSCO CINAHL, EBSCO SportDiscus, and The Cochrane Library from inception to August 16th, 2017. The new search strategy captured all articles that were included in the original unpublished review. See Supplemental Digital Content 1A for search strategies. A manual search of reference lists and authors’ personal libraries was also conducted.
Records identified in the updated search were imported into EndNote™ software (version X7.7) and duplicate citations were removed using the Bramer method (Bramer et al., 2016). All unique records from the updated search were compared to records found in the original unpublished search, and duplicates, previously screened for eligibility, were removed. The final set of records was uploaded to Covidence™ (https://www.covidence.org) for screening.
2.3Selection criteria
Studies were considered eligible if: (1) participants included adults (18 + years) post-stroke; (2) the study reported on reliability, measurement error, construct validity, and sensitivity to change, or the effect of a walk test protocol element (e.g., walkway length, practice trials, etc.) on performance of distance-limited walk tests (for construct validity, studies reporting associations between walk test performance and other variables, regardless of whether this was framed as validity testing, were included); (3) the study reported the timed, acceleration, and deceleration distance to enable test replication; (4) walk tests were performed separately and were not embedded within another test; and (5) the report was written in English, French or Spanish. Studies were excluded if: (1) the percentage of participants with stroke was below 80%; (2) the walk test was completed on a treadmill; (3) instrumented timing methods (e.g., GaitRite mat, footswitches) were used; or (4) the study was a conference proceeding, dissertation, case report/series or limited to abstract form.
To ensure the feasibility of the review, inclusion of studies examining construct validity was limited to those reporting unadjusted correlations and associated p-values or confidence intervals between walk test performance and measures of motor function, aerobic capacity, balance, balance self-efficacy, strength (including force, torque and power), walking, stairs, sit-to-stand, mobility, physical activity, participation, health-related quality of life, or discharge destination as these constructs are considered important rehabilitation outcomes (Lang et al., 2011; Otterman et al., 2017). Among studies examining predictive validity, only those reporting the ability of a distance-limited walk test to predict VO2peak or max, physical activity, discharge destination, or health-related quality of life were included. Among studies reporting reliability, only those reporting an intraclass correlation coefficient (ICC) were included. Among studies reporting measurement error, only those reporting minimal detectable change (MDC) and/or standard error of measurement (SEM) were included.
2.4Study selection
Three reviewers screened titles and abstracts independently and in duplicate, and classified studies as potentially relevant or not relevant to the review. Full-texts of potentially relevant records were uploaded to Covidence™ and screened by one of six reviewers to determine eligibility. A second reviewer was consulted to resolve uncertainty regarding the eligibility of a study.
2.5Data extraction
A single reviewer independently extracted data on general study information, study characteristics, participant characteristics, walk test protocol and results from included studies. To ensure data accuracy and completeness, another reviewer randomly selected and verified data from 30% of included articles. Discrepancies were resolved through discussion. Data on participant characteristics (i.e., age, time since stroke onset, sex, type of stroke, side of stroke, walking speed, use of walking aids/orthoses), walk test characteristics (i.e., name, walkway distances, pace, location, timing method, trials, rest interval, scoring, evaluator position/qualifications/training, instructions), and measurement properties, were collected.
2.6Method of quality assessment
The methodological quality of included studies was assessed using the COnsensus-based Standards for the selection of health Measurements INstruments (COSMIN) Risk of Bias Checklist (Mokkink et al., 2018). The tool classifies each measurement property as very good, adequate, doubtful, or inadequate based on the lowest score reported on the corresponding checklist. The research team adapted the checklists and developed a checklist for assessing sensitivity to change based on the format of the COSMIN checklists (see Supplemental Digital Content 1B). Additionally, operational definitions were developed to optimize scoring consistency. For example, for reliability and measurement error, we defined a retest time interval over which patient stability would be assumed for three recovery phases post-stroke as:≤1 day (acute),≤5 days (subacute) and≤3 weeks (chronic) based on results from longitudinal studies of walking (Jørgensen et al., 1995; Richards & Olney, 1996) and research team consensus (Salbach et al., 2017). A single author assessed the methodological quality of included studies, and a second author, not involved in the quality appraisal, was consulted to resolve uncertainty. COSMIN checklists were applied to studies reporting specific measurement properties, not for properties (i.e., MDC) computed using abstracted data.
2.7Data synthesis and analysis
ICC values and associated 95% confidence intervals (CIs) were extracted when reported. The 95% CI is interpreted as the interval that will capture the true ICC value of the population 95% of the time when repeated random samples are drawn from the population (Shrout & Fleiss, 1979). ICC values used to estimate reliability were interpreted as excellent (ICC≥0.75), acceptable (ICC > 0.40 to < 0.75) or poor (ICC≤0.40) (Andresen, 2000). MDC at the 90% confidence level (MDC90) was computed for studies reporting test-retest reliability estimates and standard deviation of baseline score using the following equations: 1 SEM = [SD x sqrt(1 - ICC)] (Beaton et al., 2001) and MDC90 = [1.645 x SEM x sqrt(2)] (Beaton et al., 2001). Constructs measured to evaluate validity were classified using the International Classification of Functioning, Disability and Health (World Health Organization, 2001) (ICF). We interpreted correlation coefficients as strong (≥0.70), moderate (0.50 to 0.69), weak (0.30 to 0.49) or negligible (< 0.30) (Landis & Koch, 1977). Effect size and standardized response mean values used to estimate sensitivity to change were interpreted as small (0.2), moderate (0.5), and large (≥0.8) (Cohen, 1977). For those studies evaluating torque at multiple points, only peak torque measured using isokinetic dynamometers was reported. Results for reliability, measurement error, validity, and sensitivity to change were presented by time post-stroke classified as acute (< 1 month), subacute (1–6 months), or chronic (> 6 months) (Hatem et al., 2016) using range/interquartile range (or mean/median values if range was not presented). To facilitate comparison between studies, frequency data were converted to percentages, results were converted to a common metric unit, and values were rounded to a consistent decimal place.
3Results
3.1Study selection
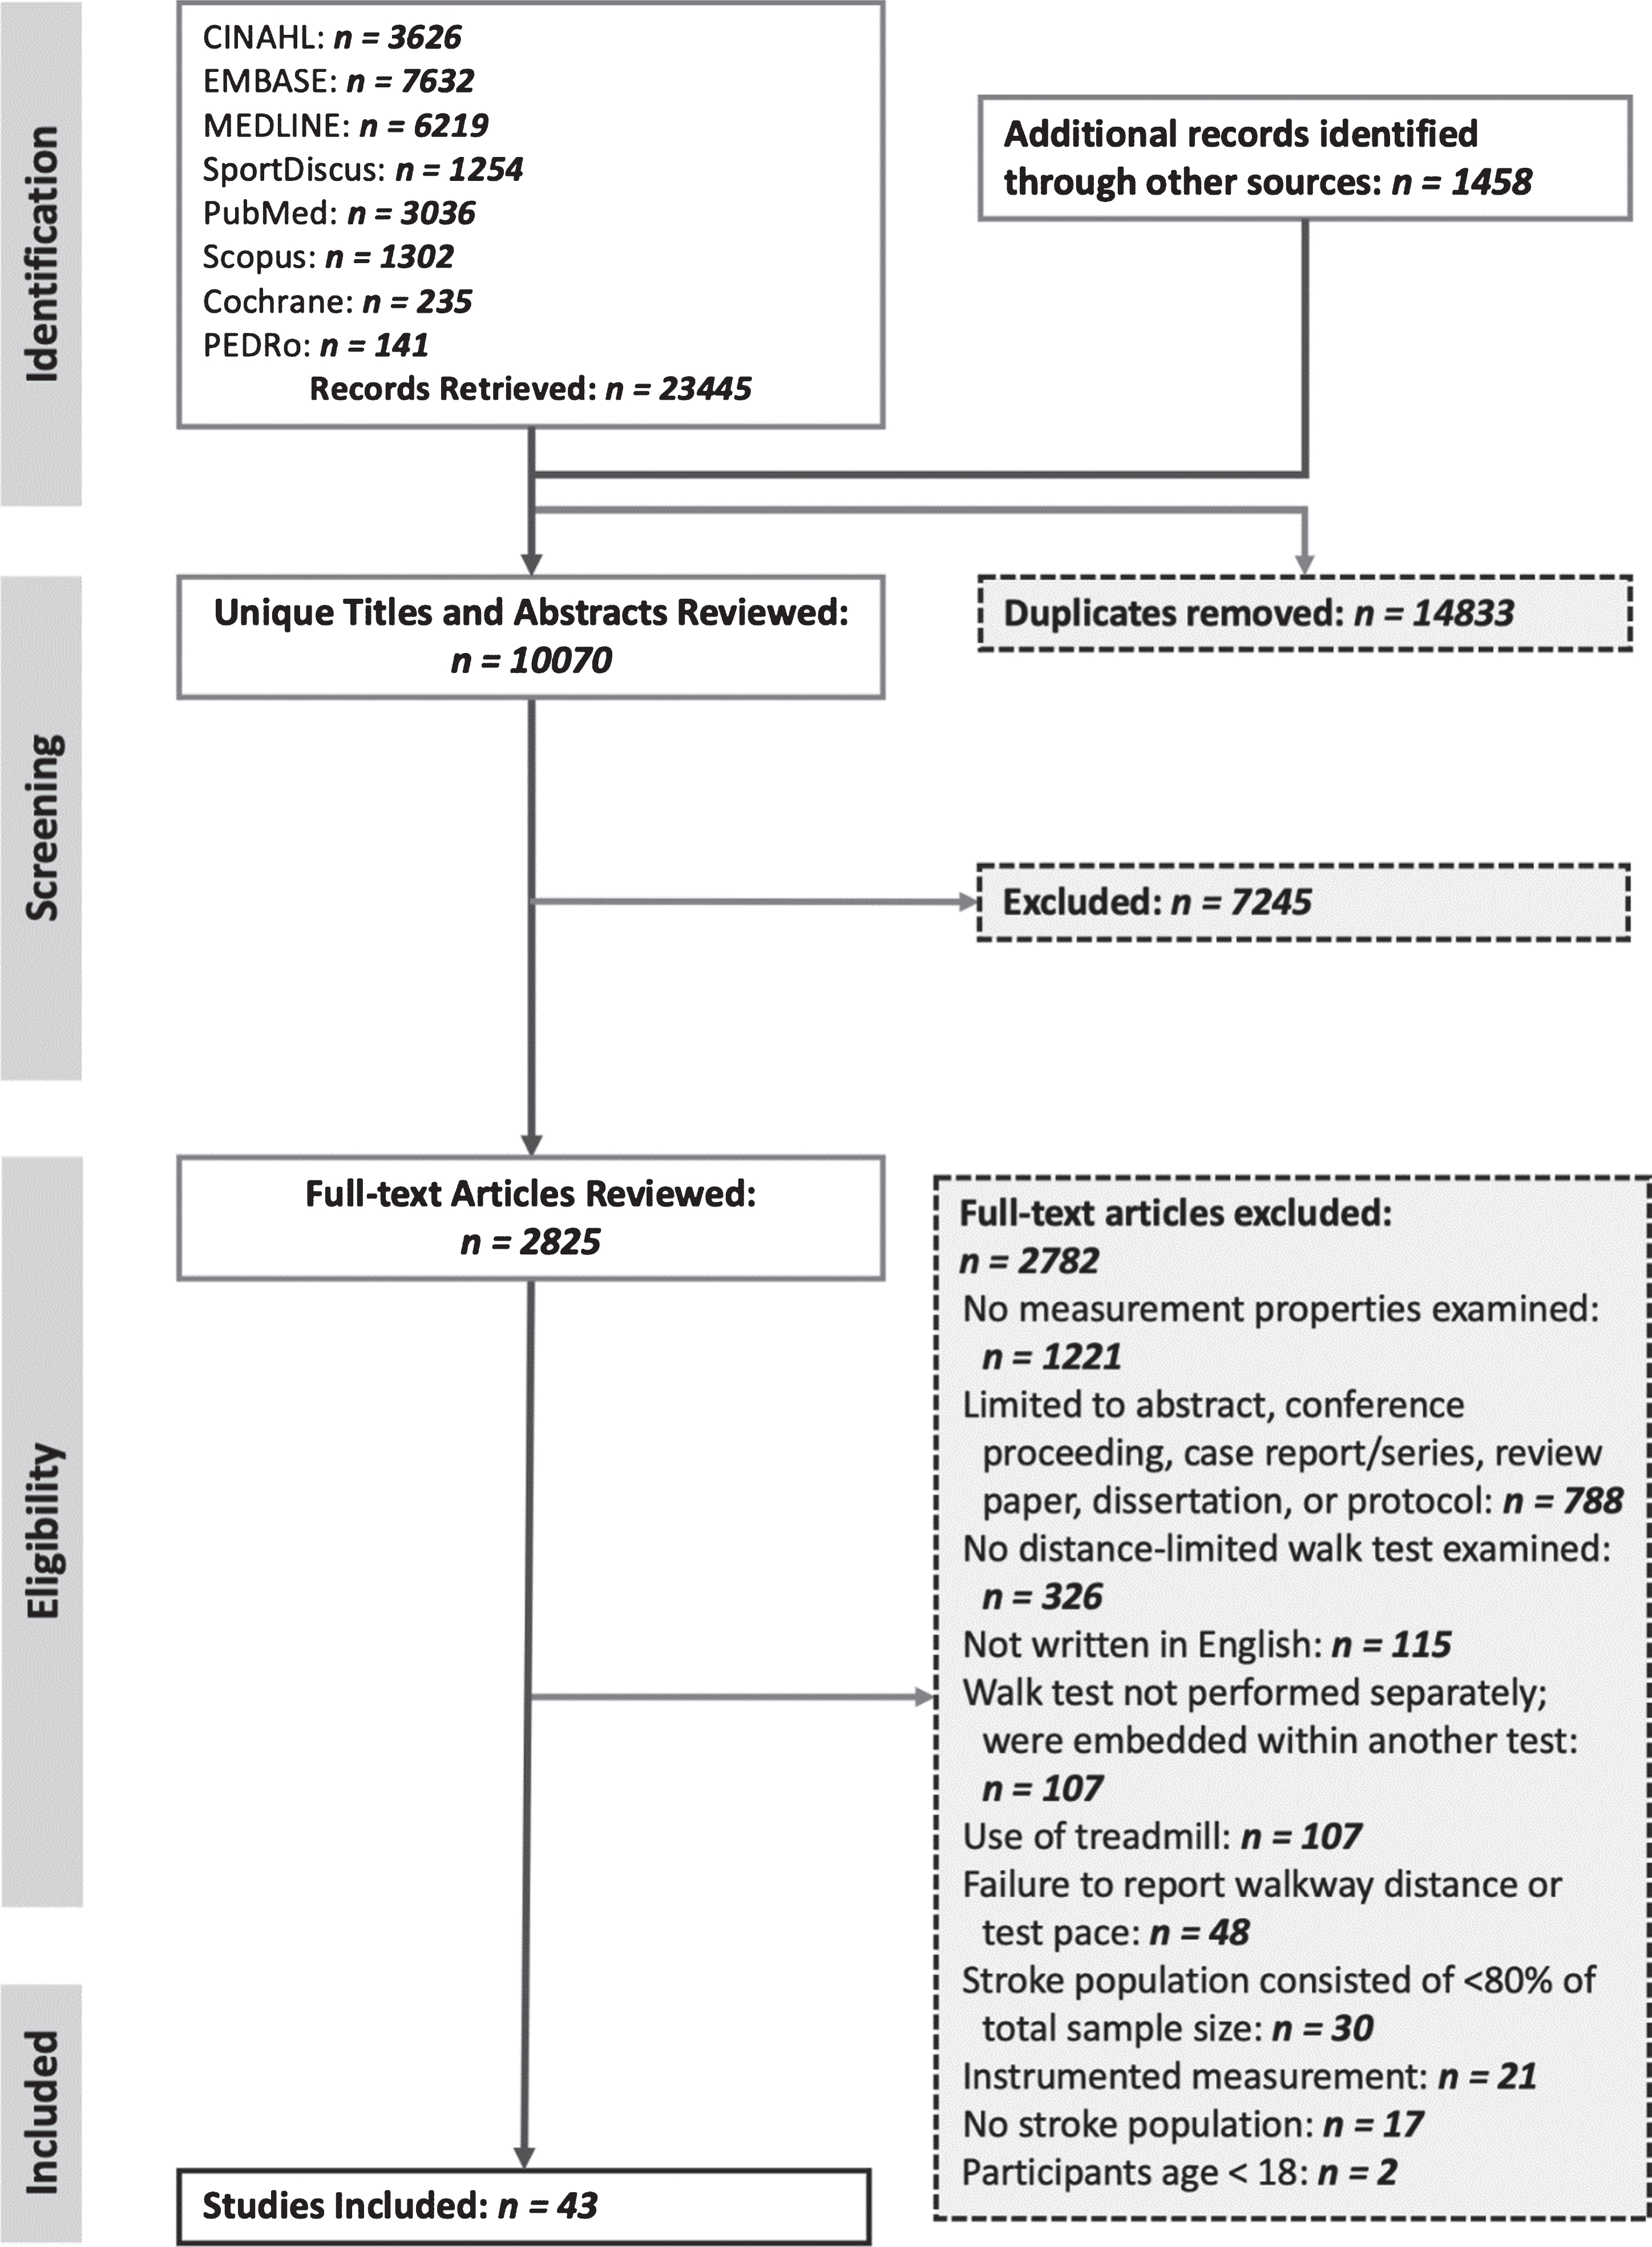
Figure 1 shows the results of the literature search and screening. Of the 24,903 records identified from the 2013 and 2017 searches combined, 10,069 unique records were identified for screening, and 43 articles (Ahmed et al., 2003; Alzahrani et al., 2009; Richard W. Bohannon, 1991; R. W. Bohannon, 1991; Bohannon, 1992; Bohannon & Puharic, 1992; Bohannon & Walsh, 1992; Cheng et al., 2020; Di Cesare et al., 2016; English et al., 2006; English et al., 2007; Ezeugwu & Manns, 2017; Faria et al., 2012; Flansbjer et al., 2006; Flansbjer et al., 2005; Frost et al., 2015; Fulk & Echternach, 2008; Fulk et al., 2008; Fulk et al., 2010; Hiengkaew et al., 2012; Høyer et al., 2014; Huo et al., 2009; Isho & Usuda, 2016; Khanittanuphong & Tipchatyotin, 2017; Kobayashi et al., 2015; Kwong et al., 2016; Lam et al., 2010; Lee et al., 2015; Liu-Ambrose et al., 2007; Mitsutake et al., 2017; Morone et al., 2014; Mudge & Stott, 2009; Nasciutti-Prudente et al., 2009; Ng et al., 2012; Ovando et al., 2011; Peters et al., 2014; Salbach et al., 2013; Salbach et al., 2001; Salbach et al., 2006; Severinsen et al., 2011; Stephens & Goldie, 1999; Taylor et al., 2006; Wang et al., 2014) were included in the review.
Fig. 1
PRISMA flow diagram.
3.2Study characteristics
All included articles were written in English. Twelve distance-limited walk tests (identified by walkway distance and pace) were found, including the 3-, 5-, 6-, 7-, 8-, 10-, and 12-metre walk test at a comfortable pace (3-, 5-, 6-, 7-, 8-, 10-, and 12 mCWT, respectively), and the 5-, 6-, 7-, 8-, and 10-metre walk test at a fast pace (5-, 6-, 7-, 8-, and 10 mFWT, respectively). The 10 mCWT was most commonly evaluated (23 articles, 53%). Table 1 presents the number of evaluations of each measurement property, and the effects of walk path length and walking surface on test performance by walk test.
Table 1
Frequency of Evaluations of Measurement Properties by Walk Test
| Measurement Property or Protocol Element Examined | Number of Evaluations | Number of Articles1 | ||||||||||||
| 3 mCWT | 5 mCWT | 5 mFWT | 6 mCWT | 6 mFWT | 7 mCWT | 7 mFWT | 8 mCWT | 8 mFWT | 10 mCWT | 10 mFWT | 12 mCWT | Total | ||
| Concurrent construct validity | – | 5 | 1 | 1 | – | 3 | 3 | 2 | – | 18 | 5 | 1 | 39 | 32 |
| Reliability | 1 | 2 | – | 2 | 1 | – | – | – | – | 5 | 4 | – | 15 | 11 |
| Measurement error | 1 | 1 | – | 2 | 1 | – | – | – | – | 4 | 4 | – | 13 | 9 |
| Sensitivity to change | – | 3 | 1 | – | – | – | – | – | – | 1 | 1 | – | 6 | 3 |
| Predictive validity | – | – | – | – | – | – | – | – | – | 2 | 1 | – | 3 | 2 |
| Effect of walkway length | – | 1 | 1 | – | – | – | – | 1 | 1 | 1 | 1 | – | 6 | 1 |
| Effect of walkway surface | – | – | – | 1 | 1 | – | – | – | – | – | – | – | 2 | 1 |
| Number of Articles1 | 1 | 10 | 3 | 2 | 1 | 3 | 3 | 3 | 1 | 23 | 12 | 1 | ||
Abbreviations: 10 mCWT, 10-metre comfortable walk test; 10 mFWT, 10-metre fast walk test; 12 mCWT, 12-metre comfortable walk test; 3 mCWT, 3-metre comfortable walk test; 5 mCWT, 5-metre comfortable walk test; 5 mFWT, 5-metre fast walk test; 6 mCWT, 6-metre comfortable walk test; 6 mFWT, 6-metre fast walk test; 7 mCWT, 7-metre comfortable walk test; 7 mFWT, 7-metre fast walk test; 8 mCWT, 8-metre comfortable walk test; 8 mFWT, 8-metre fast walk test. 1Select articles reported on more than one measurement property and/or more than one test.
3.3Appraisal of study methodology
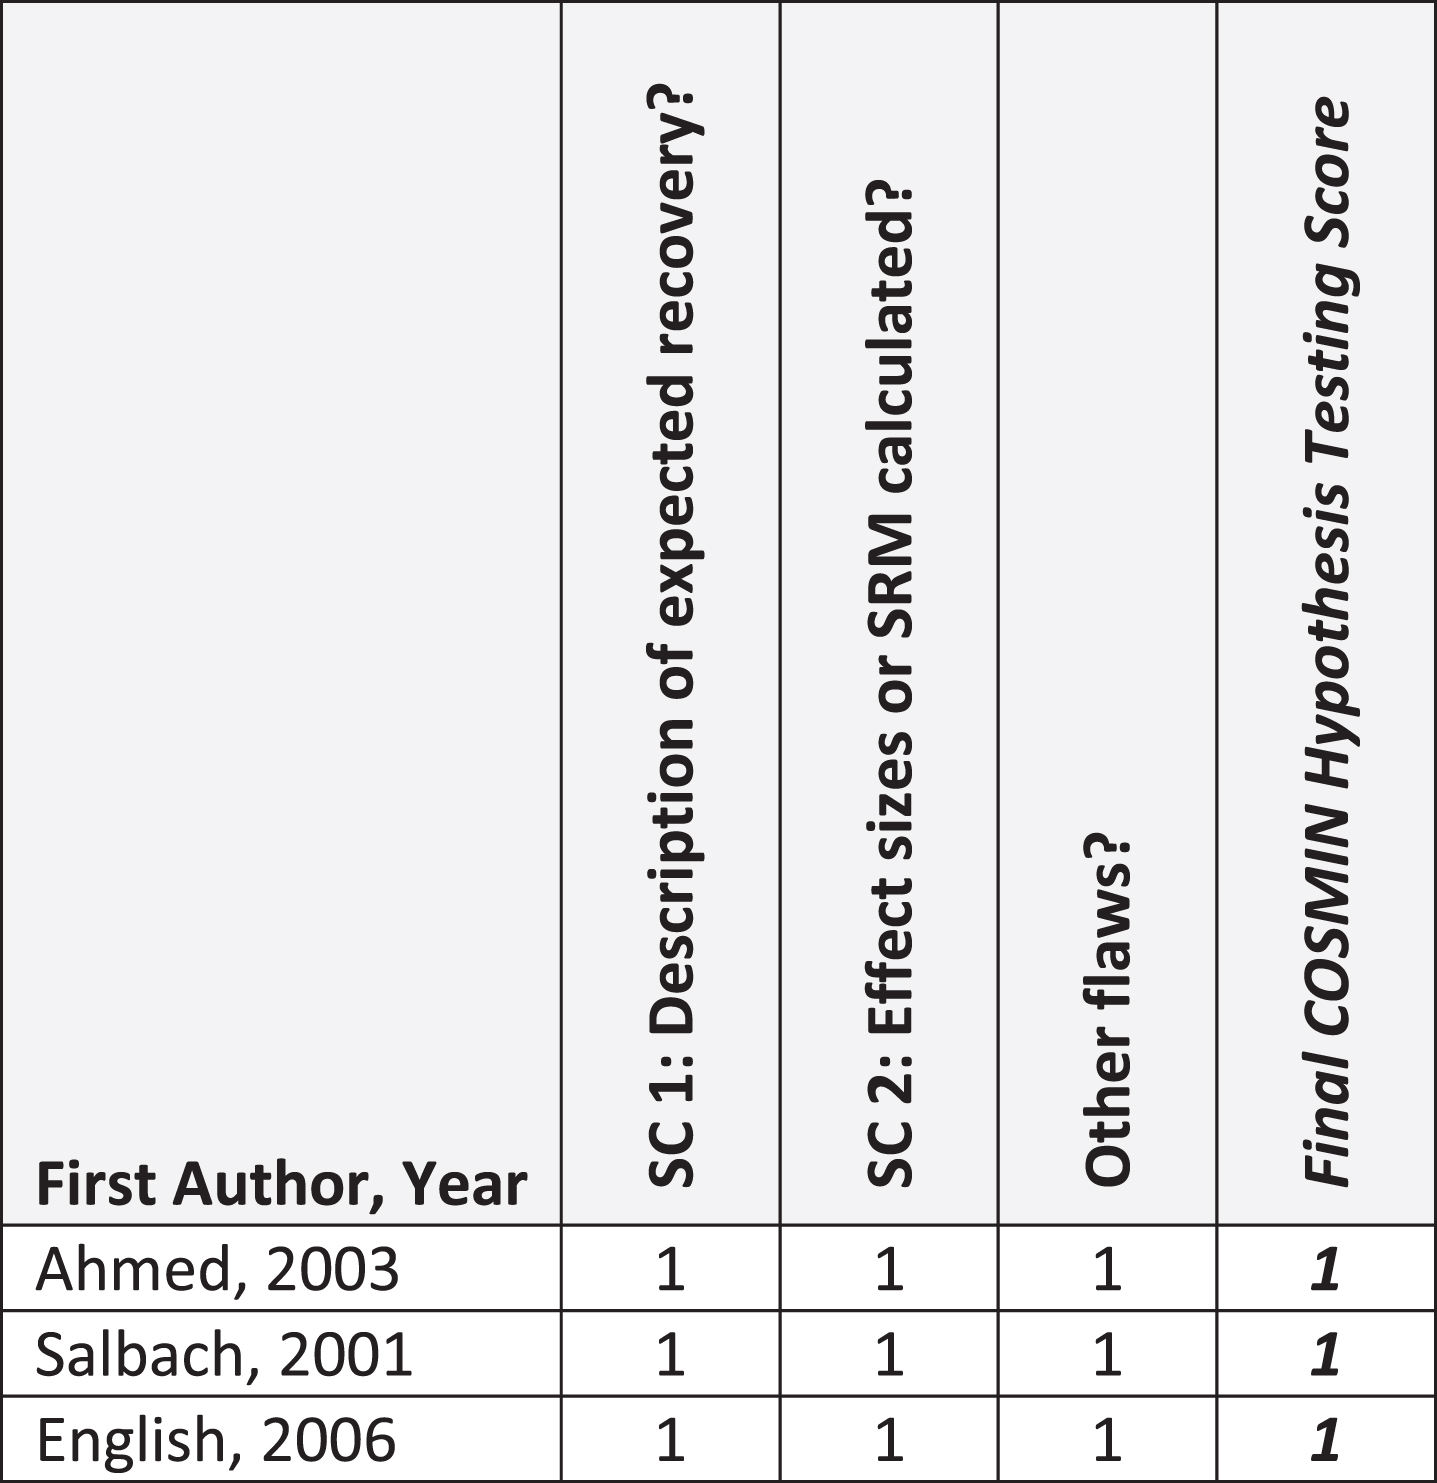
Figures 2, 3, and 4 summarize critical appraisal results for articles assessing reliability and measurement error, construct validity, and sensitivity to change, respectively. All 11 articles evaluating reliability were rated as very good or adequate. The most prevalent issue was sub-optimal reporting of statistical methods (n = 4; 36%). Of the seven articles reporting on measurement error, all were rated as very good or adequate. The most prevalent issue was sub-optimal reporting of similar testing conditions (n = 2, 29%). Of the 33 articles reporting on construct validity, the number rated as very good, adequate, doubtful, and inadequate was 13 (39%), 3 (9%), 13 (39%), and 4 (12%), respectively. The most prevalent issue was other methodological flaws (n = 15; 45%), including insufficient descriptions of walk test evaluator position, qualifications, or training received. All 3 articles that evaluated sensitivity to change were rated as very good.
Fig. 2
COSMIN Reliability (N = 11 articles) and Measurement Error (N = 7 articles). Abbreviations: ICC, Intraclass correlation coefficient; ME, measurement error; Rel, reliability. COSMIN Scoring: 1, very good; 2, adequate; 3, doubtful; 4, inadequate. 1Measurement error values were not reported in the article, but computed by study authors using published data; thus, COSMIN checklist was not completed.
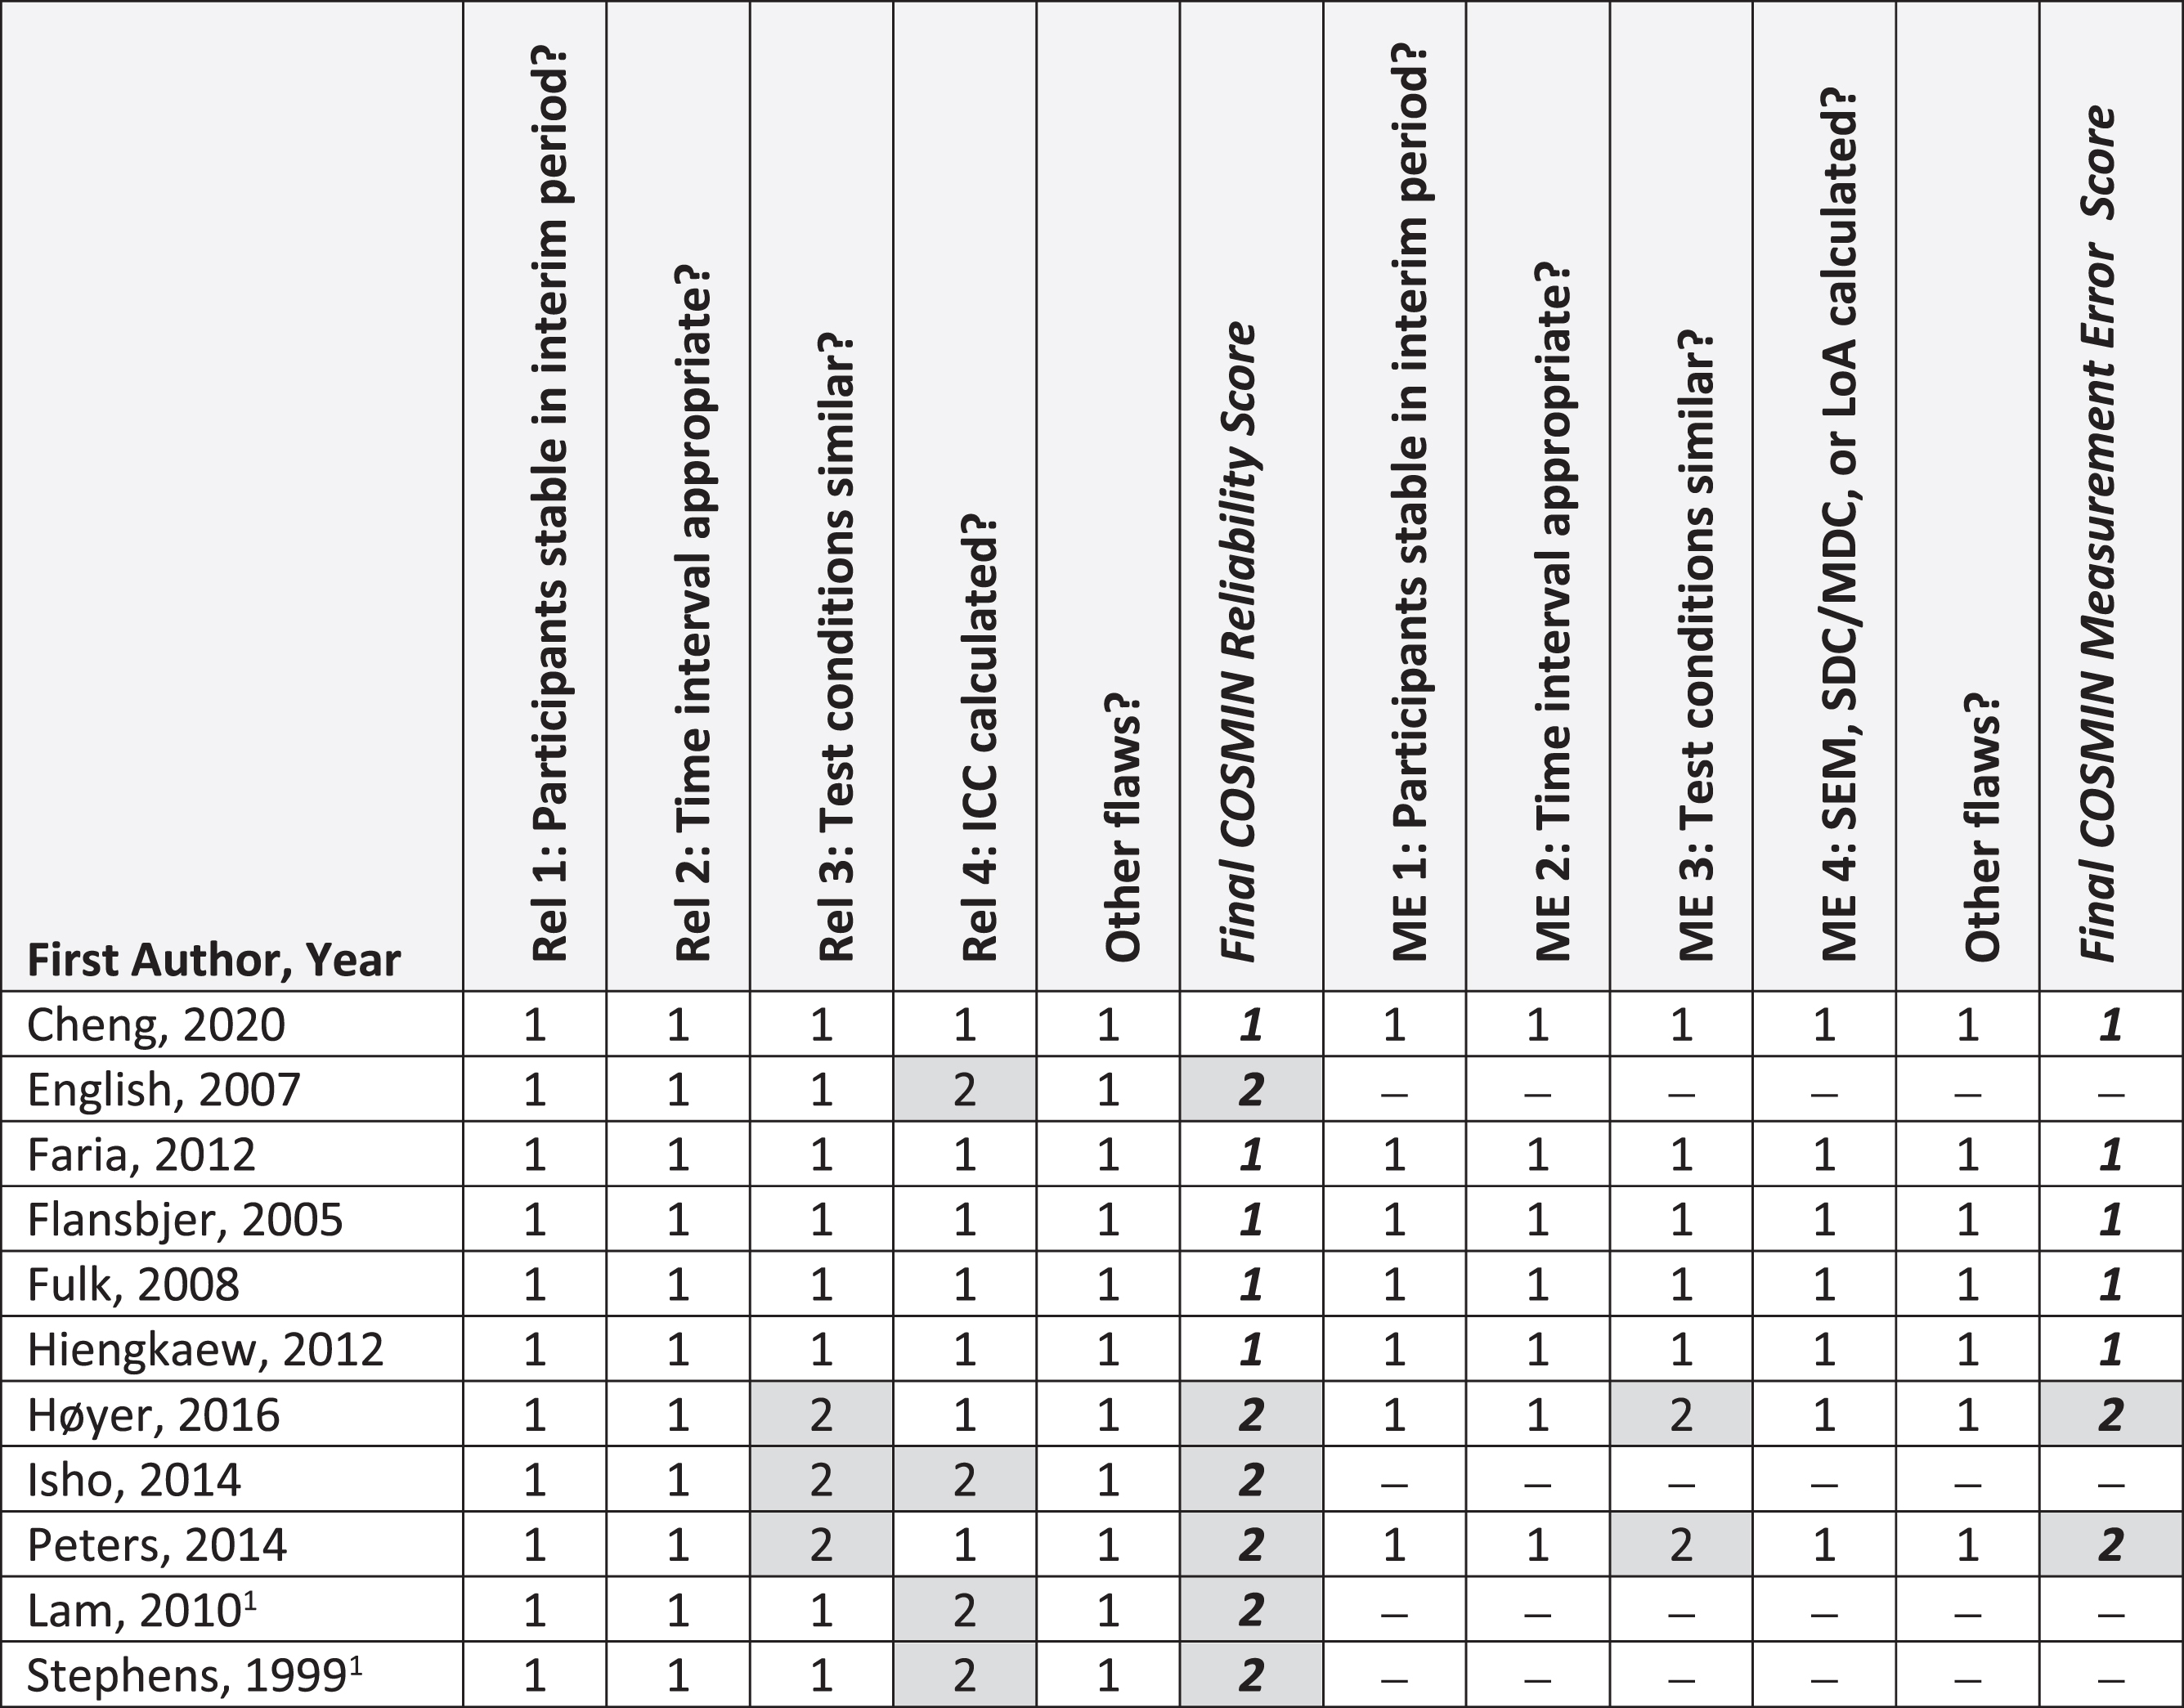
Fig. 3
COSMIN Construct Validity (N = 33 articles). Abbreviations: HT, hypothesis testing. COSMIN Scoring: 1, very good; 2, adequate; 3, doubtful; 4, inadequate. 1Evaluated predictive validity only. 2Evaluated predictive validity and concurrent construct validity.
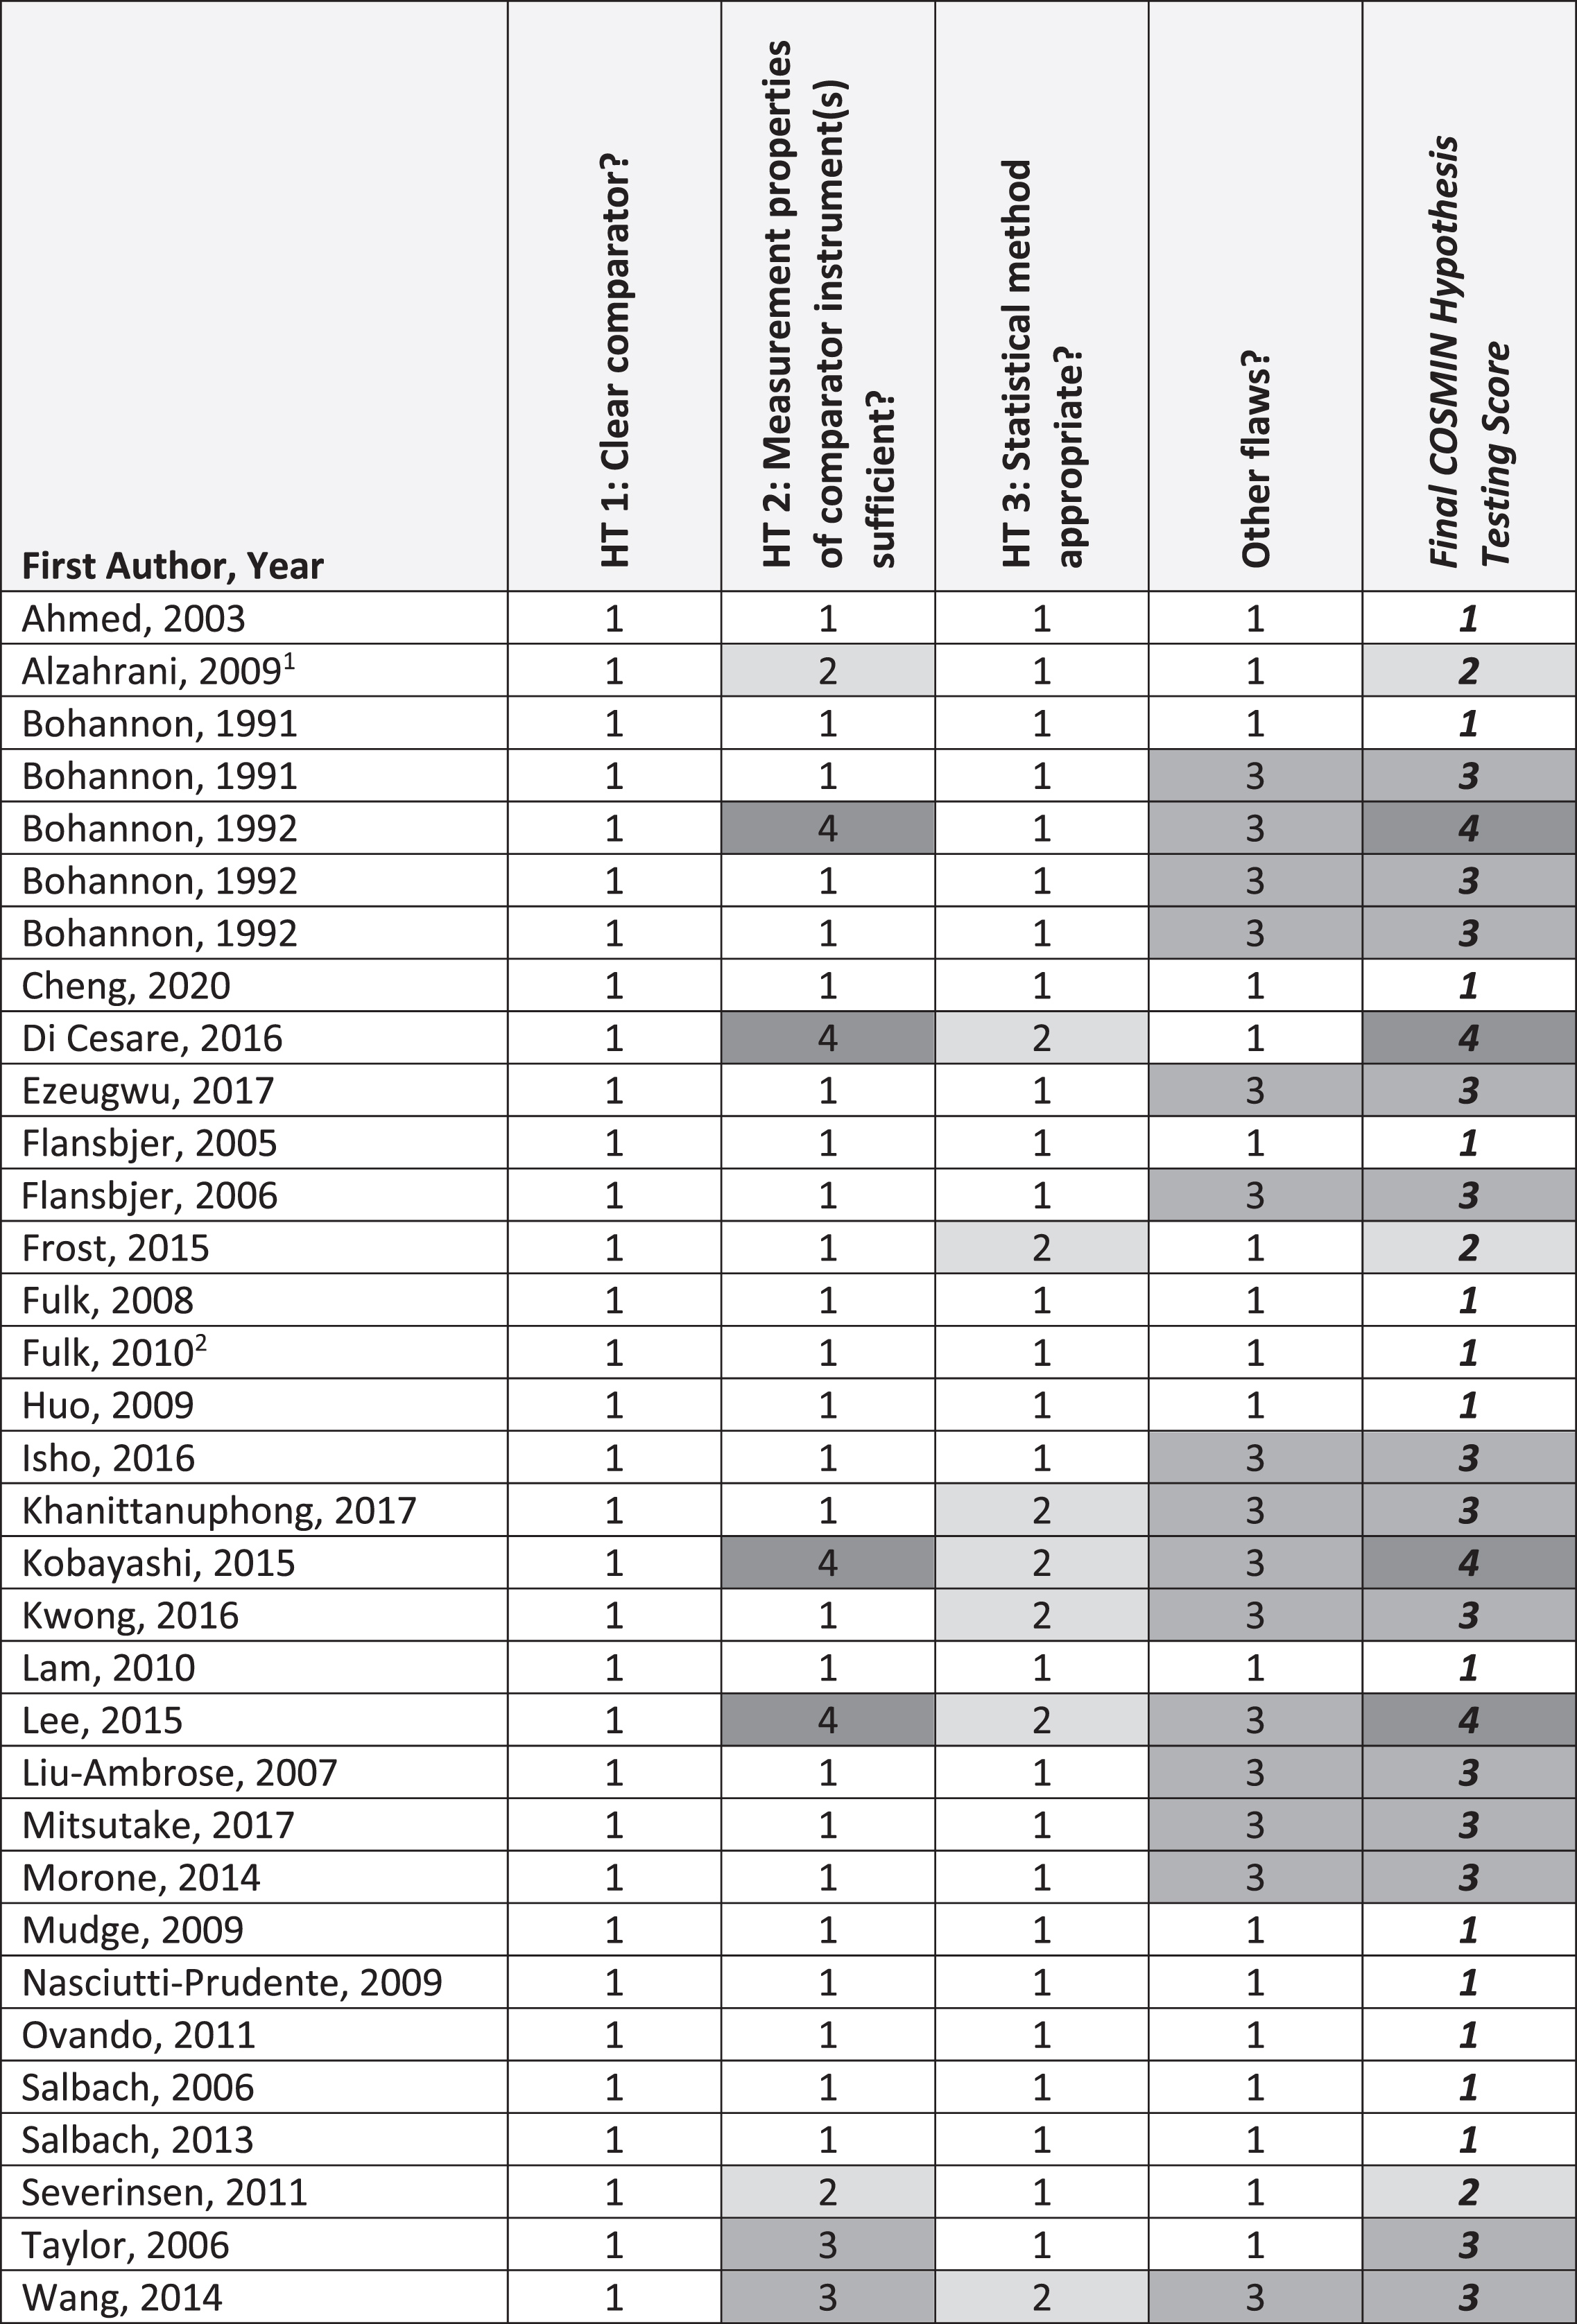
Fig. 4
COSMIN Sensitivity to Change (N = 3 articles). Abbreviations: SC, Sensitivity to Change; SRM, Standardized response mean. COSMIN Scoring: 1, very good; 2, adequate; 3, doubtful; 4, inadequate.
3.4Participant and walk test characteristics
The number of articles describing people with acute, subacute and chronic stroke was 2 (5%), 6 (14%) and 21 (49%), respectively. Fourteen studies (33%) included participants in different phases. There were 43 evaluations of walk tests at a comfortable pace and 20 at a fast pace. The position of the evaluator was reported for 15 walk test protocols (24%) as beside (9 protocols (Alzahrani et al., 2009; Cheng et al., 2020; Fulk et al., 2008; Mudge & Stott, 2009; Salbach et al., 2001; Stephens & Goldie, 1999)) behind (5 protocols (English et al., 2006; English et al., 2007; Høyer et al., 2014; Ng et al., 2012)), and beside or behind as needed (1 protocol (Salbach et al., 2013)). Use of assistive devices was reported in 28 articles (65%). Eight protocols (13%) allowed physical assistance to walk. In 25 of 30 articles (83%) that named the walk test administered, the convention was to name the walk test according to the timed distance (e.g., for the 10-metre walk test, time taken to walk 10m is documented). Supplemental Digital Content 2 includes summaries of participant characteristics across articles and details of the 63 unique protocols for 12 walk tests.
3.5Influence of walk test protocol elements on test performance
3.5.1Effect of walkway length and walking pace
One study (Ng et al., 2012) of 25 participants with chronic stroke did not find significant differences in performance on the 5 m, 8 m, or 10 m walk tests at comfortable or fast pace, indicating these walkway lengths yield similar speeds. Performance at a comfortable pace (mean 0.76–0.79 metres per second (m/s)) was significantly slower than performance at a fast pace (mean 0.97–1.00 m/s) for each walkway length.
3.5.1Effect of walkway surface
In one study, the effects of walkway surface on 6 mCWT and 6 mFWT performance among 24 people with subacute stroke was examined (Stephens & Goldie, 1999). Participants walked significantly faster on parquetry (hardwood) than on carpet with a mean difference of 0.05 m/s and 0.03 m/s for the 6 mCWT and 6 mFWT, respectively.
3.6Reliability and measurement error
Reliability and measurement error were reported in 11 and 7 articles, respectively, and reported study data were used to calculate measurement error for another 2 articles (Table 2). Intra-rater, inter-rater, and test-retest reliability was reported in 3, 2, and 8 articles, respectively. In 8 studies evaluating 3 mCWT, 6 mCWT, 6 mFWT, 10 mCWT and 10 mFWT protocols that did not allow physical assistance to walk (English et al., 2007; Faria et al., 2012; Flansbjer et al., 2005; Hiengkaew et al., 2012; Isho & Usuda, 2016; Lam et al., 2010; Peters et al., 2014; Stephens & Goldie, 1999), ICC point estimates and lower 95% confidence interval (CI) limits exceeded 0.75. In 3 studies evaluating 5 mCWT, 10 mCWT, and 10 mFWT protocols that allowed the evaluator to provide physical assistance (Cheng et al., 2020; Fulk & Echternach, 2008; Høyer et al., 2014), ICC point estimates exceeded 0.75; in two studies reporting CIs (Cheng et al., 2020; Fulk & Echternach, 2008), lower 95% CI limits were in the acceptable range. Table 2 presents the SEM, smallest real difference, and computed or reported MDC values for the 3 mCWT (n = 1), 5 mCWT (n = 1), 6 mCWT (n = 2), 6 mFWT (n = 1), 10 mCWT (n = 4), 10 mFWT (n = 4).
Table 2
Reliability and Measurement Error (n = 11 articles; 28 protocols)
| First Author, Year | Walk Test | Level of Gait Speed Deficit (m/s) | Walk Test Protocol | Re-test Time Interval | N | Test-Retest Reliability ICC (95% CI) Unless Otherwise Stated | Measurement Error | COSMIN Quality Score | ||
| TD, AD, DD | Practice Trials, Test Trials, Position of Rater, Timing Tool | Pace, Walking Aids Allowed, Assistance Allowed | ||||||||
| Acute (<1 mo) | ||||||||||
| Isho, 2016 | 10 mWT | CGS: median 0.79 (range 0.23–1.04) | 15 m, 2.5m, 2.5m | 0 practice, 1 test trial, NR, stopwatch | Comfortable (barefoot), yes, no | Within-session | 15 | 0.95 (0.86–0.98) | - | Adequate |
| Acute (<1 mo) and subacute (1–6 mo) | ||||||||||
| English, 2007 | 5 mWT | CGS: individual therapy 0.37±0.40; circuit class therapy 0.41±0.43 | 10 m, 3m, 2m | 0 practice,1 1 test trial, behind, stopwatch | Comfortable, yes, no | N/A, video-taped trials re-scored | 10 | Intra-R: 1.00 (NR) | - | Adequate |
| Fulk, 2008 | 5 mWT | CGS: 0.45±0.30 | 9 m, 2 m, 2 m | 0 practice, 1 test trial, | Comfortable, yes, yes4 | 1–3d | 35, All Subjects | 0.86 (0.68–0.94) | MDC90 = 0.30m/s MDC90 = 0.26m/s 2 | Very Good |
| CGS: 0.26±0.18 | NR, stopwatch | 13, Require physical assistance | 0.97 (0.91–0.99) | MDC90 = 0.07m/s MDC90 = 0.12m/s 2 | ||||||
| CGS: 0.56±0.30 | 22, no physical assistance | 0.80 (0.41–0.93) | MDC90 = 0.36m/s MDC90 = 0.31m/s 2 | |||||||
| CGS: 0.36±0.25 | 28, Require an assistive device | 0.91 (0.71–0.97) | MDC90 = 0.18m/s MDC90 = 0.17m/s 2 | |||||||
| Subacute (1–6 mo) | ||||||||||
| Lam, 2010 | 6 mWT | CGS: 0.46±0.29 | 10 m, 2 m, 2 m | 1 practice (day before), | Comfortable, yes, no | Within session (10 min) | 45 | Intra-R: 0.99 (p = 0.00) | - | Adequate |
| (0.06–1.14)2 first trial1 | 1 test trial, NR, stopwatch | 1d (same time) | 45 | Inter-R: 0.99 (p = 0.00) | MDC90 = 0.07m/s 2 | |||||
| Stephens, 1999 | 6 mWT | CGS: 0.75±0.242 | 10 m, 2 m, 2 m (carpet) | 1 practice, 1 test trial, | Comfortable, yes, no | 1d, same time Note: 5 min | 24 | 0.94 (NR) r = 0.95 (NR) | MDC90 = 0.14m/s2 | Adequate |
| CGS: 0.79±0.232 | (parquetry) | beside, stopwatch | Comfortable, yes, no | rest between 4 trials | 24 | 0.97 (NR) r = 0.97 (NR) | MDC90 = 0.09m/s2 | |||
| FGS: 1.08±0.372 | (carpet) | Maximum, yes, no | completed in random | 24 | 0.95 (NR) r = 0.95 (NR) | MDC90 = 0.19m/s2 | ||||
| FGS: 1.11±0.422 | (parquetry) | Maximum, yes, no | order | 24 | 0.94 (NR) r = 0.94 (NR) | MDC90 = 0.24m/s2 | ||||
| Høyer, 2014 | 10 mWT | FGS: 0.25±0.15 | trial 1 : 13 m, 3 m, 0 m trial 2 : 10, 0 m, 0 m | 0 practice, 1 test trial, behind, stopwatch | Maximum, no7, yes5 | Within session | 21, Baseline | 0.96 (NR) | MDC90 = 0.07m/s2 MDC95 = 0.09 m/s | Adequate |
| Subacute (1–6 mo) and chronic (>6 mo) | ||||||||||
| Høyer, 2014 | 10 mWT | FGS: 0.25±0.15 | trial 1 : 13 m, 3 m, 0 m trial 2 : 10, 0 m, 0 m | 0 practice, 1 test trial, behind, stopwatch | Maximum, no7, yes5 | Within session | 21, after 11 weeks of gait training | 0.99 (NR) | MDC90 = 0.07m/s2 MDC95 = 0.08 m/s | Adequate |
| Chronic (>6 mo) | ||||||||||
| Flansjber, 2005 | 10 mWT | CGS: 0.89±0.3 (0.4–1.4) FGS: 1.3±0.5 (0.5–2.2) | 14 m, 2 m, 2 m, | 0 practice, 3 test trials, NR, stopwatch | Comfortable, yes, no | 7d (same time) Mean of 3 trials | 50 | 0.94 (0.90–0.97) | MDC90 = 0.17m/s2 SEM (SEM%) = 0.07 m/s (7.9 m/s) SRD% (95% CI) = 22 m/s (–0.15 m/s–0.25 m/s) | Very Good |
| Maximum, yes, no | 7d (same time) Mean of 3 trials | 50 | 0.97 (0.95–0.98) | MDC90 = 0.20m/s2 SEM (SEM%) = 0.08m/s (5.7 m/s) SRD% (95% CI) = 16 m/s (–0.21 m/s–0.22 m/s) | ||||||
| Faria, 2012 | 10mWT | Not Baseline: CGS | 14 m, 2 m, 2 m, | 1 practice, 3 test trials, NR, stopwatch | Comfortable, yes, no | 1st trial: 1 min | 16 | Intra-R: 0.94 (p≤0.001) Inter-R: 0.96 (p≤0.001) | SEM (SEM%) = 0.05 m/s (5.01 m/s) | Very Good |
| Best of 3 trials: 1.1±0.26 | Mean of 2 trials: 1 min | 16 | Intra-R: 0.87 (p≤0.001) Inter-R: 0.97 (p≤0.001) | SEM (SEM%) = 0.07 m/s (6.40 m/s) | ||||||
| FGS, Best of 3 trials: 1.4±0.36 | Mean of 3 trials: 1 min | 16 | Intra-R: 0.95 (p≤0.001) Inter-R: 0.97 (p≤0.001) | SEM (SEM%) = 0.07 m/s (6.32 m/s) | ||||||
| Best of 3 trials: 1 min | 16 | Intra-R: 0.92 (p≤0.001) Inter-R: 0.93 (p≤0.001) | SEM (SEM%) = 0.06 m/s (5.63 m/s) | |||||||
| Worst of 3 trials:1 min | 16 | Intra-R: 0.88 (p≤0.001) Inter-R: 0.93 (p≤0.001) | SEM (SEM%) = 0.07 m/s (6.52 m/s) | |||||||
| Maximum, yes, no | 1st trial: 1 min | 16 | Intra-R: 0.86 (p≤0.001) Inter-R: 0.91 (p≤0.001) | SEM (SEM%) = 0.14 m/s (9.86 m/s) | ||||||
| Mean of 2 trials: 1 min | 16 | Intra-R: 0.92 (p≤0.001) Inter-R: 0.96 (p≤0.001) | SEM (SEM%) = 0.14 m/s (9.96 m/s) | (Continued) | ||||||
| Mean of 3 trials: 1 min | 16 | Intra-R: 0.92 (p≤0.001) Inter-R: 0.97 (p≤0.001) | SEM (SEM%) = 0.14 m/s (9.62 m/s) | |||||||
| Best of 3 trials: 1 min | 16 | Intra-R: 0.84 (p≤0.001) Inter-R: 0.92 (p≤0.001) | SEM (SEM%) = 0.14 m/s (9.87 m/s) | |||||||
| Worst of 3 trials: 1 min | 16 | Intra-R: 0.83 (p≤0.001) Inter-R: 0.91 (p≤0.001) | SEM (SEM%) = 0.15 m/s (10.68 m/s) | |||||||
| Hiengkaew, 2012 | 10mWT | CGS: 0.51±0.30 (0.11–1.32) | 14 m, 2 m, 2 m | NR, NR, NR, stopwatch | Comfortable, yes, no | 5 to 10d, same time | 61, All subjects | 0.96 (0.92–0.98) | MDC90 = 0.14 m/s2 SEM = 0.06 m/s | Very Good |
| CGS: 0.77±0.33 (0.33–0.77) | Note: 3–5 min rest between comfortable & | 123 PF tone: no ↑ | 0.96 (0.86–0.99) | MDC90 = 0.15 m/s2 SEM = 0.07 m/s | ||||||
| CGS: 0.47±0.29 (0.11–1.18) | maximum trials | 323 PF tone: slight ↑ | 0.95 (0.89–0.98) | MDC90 = 0.15 m/s2 SEM = 0.06 m/s | ||||||
| CGS: 0.39±0.19 (0.17–0.85) | 17, MAS≥23 PF tone: marked ↑ | 0.95 (0.81–0.99) | MDC90 = 0.10 m/s2 SEM = 0.03 m/s | |||||||
| FGS: 0.62±0.40 (0.09–1.40) | Maximum, yes, no | 61, All Subjects | 0.98 (0.97–0.99) | MDC90 = 0.13 m/s2 SEM = 0.06 m/s | ||||||
| FGS: 0.97±0.46 (0.46–0.97) | 123 PF tone: no ↑ | 0.99 (0.97–0.99) | MDC90 = 0.11 m/s2 SEM = 0.05 m/s | |||||||
| FGS: 0.56±0.37 (0.10–1.48) | 323 PF tone: slight ↑ | 0.98 (0.95–0.99) | MDC90 = 0.12 m/s2 SEM = 0.05 m/s | |||||||
| FGS: 0.47±0.27 (0.18–1.03) | 173 PF tone: marked ↑ | 0.99 (0.95–0.99) | MDC90 = 0.06 m/s2 SEM = 0.03 m/s | |||||||
| Peters, 2014 | 3 mWT | CGS: 0.27±0.11 | 3 m, 2 m, 2 m | 1 practice, 1 test trial, NR, stopwatch | Comfortable, yes, no | Within-session rest provided as needed | 12, household ambulators | 0.97 (0.94–0.99) | MDC90 = 0.042 MDC95 = 0.05 SEM = 0.04 | Adequate |
| CGS: 0.52±0.10 | 24, limited community ambulators | 0.91 (0.85–0.94) | MDC90 = 0.072 MDC95 = 0.08 SEM = 0.06 | |||||||
| CGS: 0.89±0.15 | 26, community ambulators | 0.85 (0.77–0.90) | MDC90 = 0.142 MDC95 = 0.16 SEM = 0.12 | |||||||
| Acute (<1 mo), subacute (1–6 mo) and chronic (>6 mo) | ||||||||||
| Cheng, 2020 | 10 mWT | CGS: 0.94±0.36 | 14 m, 2 m, 2 m | 0 practice, 1 test trial, beside and slightly behind, stopwatch | Comfortable, yes, yes6 | 1–3d (same time) | 20 | 0.83 (0.63–0.93) | MDC90 = 0.34 MDC95 = 0.40 | Very Good |
Abbreviations: 10 mWT, 10-metre walk test; 95% confidence interval; 3 mWT, 3-metre walk test; 5 mWT, 5-metre walk test; 6 mWT, 6-metre walk test; AD, acceleration distance; CGS, comfortable gait speed; COSMIN, COnsensus-based Standards for the selection of health Measurements Instruments; d, day(s); DD, Deceleration distance; FGS, fast gait speed; ICC, intraclass correlation coefficient; Inter-R, Inter-rater reliability; Intra-R, Intra-rater reliability; m, metres; m/s, metres per second; MDC, Minimal detectable change; min, minute(s); PF, ankle plantarflexors; mo, months; N/A, not applicable; NR, not reported; SEM, Standard error of measurement; SRD, Smallest real difference; TD, total distance. 1Data obtained from author. 2Computed from study data. 3Modified Ashworth Scale (MAS) was used to classify ankle plantar-flexor tone as: no increase (MAS = 0), slight increase (MAS = 1-1+), and marked increase (MAS≥2). 4Patient’s physical therapist determined the amount of physical assistance given. 5People dependent on 1 person to walk participated. A physical therapist secured the patient from behind by close manual support, holding the waistband, or by close presence and supervision, and only moved when the patient was in double support phase. 6Evaluator provided physical assistance at the waist to steady the person, if needed, but not to advance the foot. 7Orthoses were permitted if a prerequisite for safety.
3.7Construct validity
Table 3 presents construct validity findings from 33 articles, including 118 correlation coefficients for relationships between measures of targeted constructs and performance on the 5 mCWT (27 correlations), 5 mFWT (1 correlation), 6 mCWT (2 correlations), 7 mCWT (4 correlations), 7 mFWT (4 correlations), 8 mCWT (5 correlations), 10 mCWT (61 correlations), and 10 mFWT (11 correlations), and 12 mCWT (3 correlations). Across phases of stroke recovery, the majority of correlation coefficients were evaluated for the chronic phase post-stroke (56 correlations; 46%). Of the 118 correlations, 3 were predictive in nature, demonstrating the ability of the 10 mCWT to predict physical activity (r = 0.60–0.66) (Alzahrani et al., 2009; Fulk et al., 2010).
Table 3
Construct Validity (n = 33 articles; 41 protocols evaluated)
| Walk Test | ICF Classification | Construct | Measure | Results Pearson r (P-value, n) Spearman ρ (P-value, n) |
| Acute (< 1mo) | ||||
| 10 mCWT | Body Function | Balance | Trunk impairment scale (coordination) | ρ= 0.62 (P < 0.05, n = 15) (Isho &Usuda, 2016) |
| Trunk impairment scale (total) | ρ= 0.43 (NS, n = 15) (Isho &Usuda, 2016) | |||
| Trunk impairment scale (dynamic sitting balance) | ρ= 0.10 (NS, n = 15) (Isho &Usuda, 2016) | |||
| Strength: hand-grip1 | Dynamometer | r = 0.49 (P = 0.0002, n = 59) (Di Cesare et al., 2016) | ||
| Strength: hand-grip2 | Dynamometer | r = 0.24 (NS, n = 64) (Di Cesare et al., 2016) | ||
| Strength: knee extensor1 | Dynamometer | ρ= 0.26 (NS, n = 15) (Isho &Usuda, 2016) | ||
| Strength: knee extensor2 | Dynamometer | ρ= 0.16 (NS, n = 15) (Isho &Usuda, 2016) | ||
| Activity | Balance | Short-form Berg balance scale | ρ= 0.34 (NS, n = 15) (Isho &Usuda, 2016) | |
| Mobility | Modified Rankin scale (30 days) | r = –0.51 (P < 0.0001, n = 77) (Di Cesare et al., 2016) | ||
| Modified Rankin scale (90 days) | r = –0.50 (P < 0.0001, n = 75) (Di Cesare et al., 2016) | |||
| Modified Rankin scale (7 days) | r = –0.31 (P = 0.0134, n = 64) (Di Cesare et al., 2016) | |||
| Acute (<1 mo) and subacute (1–6 mo) | ||||
| 5 mCWT | Body Function | Motor function and basic | STREAM (initial assessment) | r = 0.74 (P < 0.0001, n = 63) (Ahmed et al., 2003) |
| &Activity | mobility | STREAM (3 months) | r = 0.73 (P < 0.0001, n = 63) (Ahmed et al., 2003) | |
| STREAM (5 weeks) | r = 0.62 (P < 0.0001, n = 63) (Ahmed et al., 2003) | |||
| Body Function | Motor function: | STREAM (3 months) | r = 0.64 (P < 0.001, n = 63) (Ahmed et al., 2003) | |
| upper extremity | STREAM (initial assessment) | r = 0.56 (P < 0.0001, n = 63) (Ahmed et al., 2003) | ||
| STREAM (5 weeks) | r = 0.53 (P < 0.0001, n = 63) (Ahmed et al., 2003) | |||
| Body Function | Motor function: lower extremity | STREAM (initial assessment) | r = 0.74 (P < 0.0001, n = 63) (Ahmed et al., 2003) | |
| STREAM (3 months) | r = 0.65 (P < 0.0001, n = 63) (Ahmed et al., 2003) | |||
| STREAM (5 weeks) | r = 0.55 (P < 0.0001, n = 63) (Ahmed et al., 2003) | |||
| Activity | Basic mobility | STREAM (initial assessment) | r = 0.83 (P < 0.0001, n = 63) (Ahmed et al., 2003) | |
| STREAM (3 months) | r = 0.76 (P < 0.0001, n = 63) (Ahmed et al., 2003) | |||
| STREAM (5 weeks) | r = 0.65 (P < 0.0001, n = 63) (Ahmed et al., 2003) | |||
| 6 mCWT | Body function | Strength: knee extensor | Dynamometer | ρ= 0.55 (P < 0.01, n = 45) (Lam et al., 2010) |
| Activity | Comfortable walk speed | 10 mWT | ρ= 0.99 (P < 0.01, n = 45) (Lam et al., 2010) | |
| 10 mCWT | Activity | Walk speed | 6 MWT speed | r = 0.385 (P = 0.022, n = 64) (Morone et al., 2014) |
| 10 mFWT | Body Function | Motor function: lower extremity | Fugl-Meyer assessment scale for the lower extremity (FMA-LE) | r = 0.62 (P < 0.001, n = 75) (Mitsutake et al., 2017) |
| Subacute (1–6 mo) | ||||
| 5 mCWT | Activity | Physical activity | ActivPAL3 Micro- # steps at medium rate (80–99 steps/min) | ρ= 0.79 (P < 0.01, n = 30) (Ezeugwu &Manns, 2017) |
| ActivPAL3 Micro- # steps at brisk rate (100–119 steps/min) | ρ= 0.74 (P < 0.01, n = 30) (Ezeugwu &Manns, 2017) | |||
| ActivPAL3 Micro- mean steps/d | ρ= 0.61 (P < 0.01, n = 30) (Ezeugwu &Manns, 2017) | |||
| ActivPAL3 Micro- stepping time (min) | ρ= 0.49 (P < 0.01, n = 30) (Ezeugwu &Manns, 2017) | |||
| ActivPAL3 Micro- # steps at fastest rate (> 120 steps/min) | ρ= 0.47 (P < 0.01, n = 30) (Ezeugwu &Manns, 2017) | |||
| ActivPAL3 Micro- # sit-to-stand transitions | ρ= 0.34 (NS, n = 30) (Ezeugwu &Manns, 2017) | |||
| ActivPAL3 Micro- standing time (min) | ρ= 0.32 (NS, n = 30) (Ezeugwu &Manns, 2017) | |||
| ActivPAL3 Micro- sedentary time (min) | ρ= –0.28 (NS, n = 30) (Ezeugwu &Manns, 2017) | |||
| ActivPAL3 Micro- # steps at slow rate (60–79 steps/min) | ρ= 0.25 (NS, n = 30) (Ezeugwu &Manns, 2017) | |||
| ActivPAL3 Micro- # steps at purposeful rate (40–59 steps/min) | ρ= 0.14 (NS, n = 30) (Ezeugwu &Manns, 2017) | |||
| ActivPAL3 Micro- # steps at sporadic rate (20–39 steps/min) | ρ= –0.02 (NS, n = 30) (Ezeugwu &Manns, 2017) | |||
| Walk distance | 6 MWT | r = 0.89 (P < 0.000, n = 37) (Fulk et al., 2008) | ||
| Subacute (1–6 mo) and chronic (≥6 mo) | ||||
| 5 mCWT | Body function | Balance self-efficacy | Activities-specific balance confidence scale | ρ= 0.46 (95% CI 0.28–0.61, n = 89) (Salbach et al., 2006) |
| 5 mFWT | Body function | Balance self-efficacy | Activities-specific balance confidence scale | ρ= 0.49 (95% CI 0.31–0.63, n = 89) (Salbach et al., 2006) |
| 10 mCWT | Body function | Strength: knee extensor | Dynamometer | r = 0.18 (NS, n = 48, absolute values) (Severinsen et al., 2011) |
| r = 0.31 (P < 0.05, n = 48, normalized values) (Severinsen et al., 2011) | ||||
| Chronic (≥6 mo) | ||||
| 5 mCWT | Activity | Physical activity | ActivPAL–mean standing time (mins/d) over 5 days | ρ= 0.50 (P = 0.043 n = 17) (Salbach et al., 2013) |
| Participation | Participation | Stroke impact scale - participation (%) | ρ= 0.48 (P = 0.049, n = 17) (Salbach et al., 2013) | |
| 10 mCWT | Body function | Aerobic capacity | VO2peak (cycle ergometer) | r = 0.33 (P < 0.05, n = 48, absolute values) (Severinsen et al., 2011) |
| r = 0.53 (P < 0.05, n = 48, normalized values) (Severinsen et al., 2011) | ||||
| VO2peak (treadmill) | ρ= NR (NS, n = 8) (Ovando et al., 2011) | |||
| Strength | Stroke impact scale-strength | r = 0.64 (P < 0.001, n = 92) (Khanittanuphong &Tipchatyotin, 2017) | ||
| Strength: lower limb | Motricity Index | NR = 0.62 (P < 0.01, n = 46) (Lee et al., 2015) | ||
| Strength: knee flexor | Dynamometer | r = 0.80 (P < 0.05, n = 12) (Nasciutti-Prudente et al., 2009) | ||
| Dynamometer | r = 0.61 (P < 0.01, n = 50) (Flansbjer et al., 2006) | |||
| Strength: knee extensor | Dynamometer | r = 0.61 (P < 0.01, n = 50) (Flansbjer et al., 2006) | ||
| Dynamometer | r = 0.34 (NS, n = 12) (Nasciutti-Prudente et al., 2009) | |||
| Strength: quadriceps | Dynamometer | r = 0.35 (P < 0.01, n = 63, normalized) (Liu-Ambrose et al., 2007) | ||
| Strength: hip flexor | Dynamometer | r = 0.75 (P < 0.05, n = 12) (Nasciutti-Prudente et al., 2009) | ||
| Strength: hip extensor | Dynamometer | r = 0.53 (NS, n = 12) (Nasciutti-Prudente et al., 2009) | ||
| Strength: ankle dorsiflexor | Dynamometer | r = 0.50 (NS, n = 12) (Nasciutti-Prudente et al., 2009) | ||
| Strength: ankle plantar-flexor | Dynamometer | r = 0.58 (P < 0.05, n = 12) (Nasciutti-Prudente et al., 2009) | ||
| Activity | Balance | 360-degree turn (turn time) | r = –0.76 (P < 0.01, n = 38) (Kobayashi et al., 2015) | |
| Berg balance scale (items 1–12 + item 13 (nonparetic leg in front)+item 14 (SLS on paretic leg)) | p = 0.72 (P = 0.001, n = 63) (Kwong et al., 2016) | |||
| Berg balance scale (items 1–12 + item 13 (paretic leg in front)+item 14 (SLS on paretic leg) | p = 0.70 (P = 0.001, n = 63) (Kwong et al., 2016) | |||
| Berg balance scale | NR = 0.69 (P < 0.01, n = 46) (Lee et al., 2015) | |||
| Stroke impact scale- mobility | r = 0.64 (P < 0.001, n = 92) (Khanittanuphong &Tipchatyotin, 2017) | |||
| 360-degree turn (steps in turn) | r = –0.59 (P < 0.01, n = 38) (Kobayashi et al., 2015) | |||
| Hand function | Stroke impact scale- hand function | r = 0.52 (P < 0.001, n = 92) (Khanittanuphong &Tipchatyotin, 2017) | ||
| Capacity for activities of | FIM | r = 0.63 (P < 0.01, n = 50) (Frost et al., 2015) | ||
| daily living | IADL Questionnaire | r = 0.50 (P < 0.01, n = 50) (Frost et al., 2015) | ||
| Physical activity | Activity counts (sum of number of steps walked, stairs, number of transitions) | r = 0.66 (P < 0.001, n = 42) predictive (Alzahrani et al., 2009) | ||
| SAM- mean steps/day | r = 0.65 (P = 0.003, n = 19) predictive (Fulk et al., 2010) | |||
| SAM- Peak Activity Index (steps/min) | r = 0.64 (P < 0.01, n = 49) (Mudge &Stott, 2009) | |||
| Time on feet (sum of minutes walking, stairs, standing, sit to stand) | r = 0.60 (P < 0.001, n = 42) predictive (Alzahrani et al., 2009) | |||
| SAM- means steps/day | ρ= 0.55 (P < 0.01, n = 49) (Mudge &Stott, 2009) | |||
| SAM- # steps at high rate4 | ρ= 0.54 (P < 0.01, n = 49) (Mudge &Stott, 2009) | |||
| SAM- # steps at low rate3 | r = 0.46 (P < 0.01, n = 49) (Mudge &Stott, 2009) | |||
| Physical activity scale for individuals with physical disabilities | r = 0.42 (P < 0.01, n = 50) (Frost et al., 2015) | |||
| Current PA level (PASIPD Score) in MET-h/day | r = 0.26 (P < 0.05, n = 63) (Liu-Ambrose et al., 2007) | |||
| Walk distance | 6 MWT | NR = 0.89 (P < 0.01, n = 46) (Lee et al., 2015) | ||
| Community walking capacity | Total time taken to walk 300m community route | ρ= –0.88 (P < 0.0001, n = 28) (Taylor et al., 2006) | ||
| Participation | Participation | Stroke impact scale- Participation (%) | r = 0.57 (P < 0.01, n = 50) (Flansbjer et al., 2006) | |
| Stroke impact scale- participation | r = 0.56 (P < 0.001, n = 92) (Khanittanuphong &Tipchatyotin, 2017) | |||
| 10 mCWT- | Activity | Mobility | Timed Up and Go (session 2) | r = –0.84 (P < 0.001, n = 50) (Flansbjer et al., 2005) |
| session 1 | Stair function | Stair climbing- ascend (session 2) | r = –0.81 (P < 0.001, n = 50) (Flansbjer et al., 2005) | |
| Stair climbing- descend (session 2) | r = –0.82 (P < 0.001, n = 50) (Flansbjer et al., 2005) | |||
| Fast walk speed | 10 mFWT (session 2) | r = 0.92 (P < 0.001, n = 50) (Flansbjer et al., 2005) | ||
| Walk distance | 6 MWT (session 2) | r = 0.89 (P < 0.001, n = 50) (Flansbjer et al., 2005) | ||
| 10 mFWT | Body function | Strength: knee flexor | Dynamometer | r = 0.65 (P < 0.01, n = 50) (Flansbjer et al., 2006) |
| Strength: knee extensor | Dynamometer | r = 0.67 (P < 0.01, n = 50) (Flansbjer et al., 2006) | ||
| Body function | Aerobic capacity | VO2peak (treadmill) | ρ= NR (NS, n = 8) (Ovando et al., 2011) | |
| Activity | Mobility | Timed Up and Go | r = 0.91 (P < 0.01, n = 27) (Huo et al., 2009) | |
| Participation | Participation | Stroke impact scale- Participation (%) | r = 0.57 (P < 0.01, n = 50) (Flansbjer et al., 2006) | |
| 10 mFWT- | Activity | Mobility | Timed Up and Go (session 2) | r = –0.91 (P < 0.001, n = 50) (Flansbjer et al., 2005) |
| session 1 | Stair function | Stair climbing- ascend (session 2) | r = –0.84 (P < 0.001, n = 50) (Flansbjer et al., 2005) | |
| Stair climbing- descend (session 2) | r = –0.87 (P < 0.001, n = 50) (Flansbjer et al., 2005) | |||
| Comfortable walk speed | 10 mCWT (session 2) | r = 0.88 (P < 0.001, n = 50) (Flansbjer et al., 2005) | ||
| Walk distance | 6 MWT (session 2) | r = 0.95 (P < 0.001, n = 50) (Flansbjer et al., 2005) | ||
| 12 mCWT | Body function | Aerobic capacity | VO2max | r = 0.47 (P < 0.05, n = 35) (Wang et al., 2014) |
| Strength: knee extensor (90-degree torque) | Dynamometer | r = 0.62 (P < 0.05, n = 35) (Wang et al., 2014) | ||
| Strength: knee extensor (60-degree torque) | Dynamometer | r = 0.62 (P < 0.05, n = 35) (Wang et al., 2014) | ||
| Acute (< 1 mo), subacute (1–6 mo), and Chronic (≥6 mo) | ||||
| 7 mCWT | Body function | Strength: knee extensor | Lido Active Rehabilitation System | r = 0.67 (P < 0.01, n = 14) (Bohannon &Walsh, 1992) |
| (peak torque) | Lido Active Rehabilitation System | r = 0.62 (P < 0.01, n = 18) (Bohannon &Puharic, 1992) | ||
| Strength: knee extensor (torque) | Lido Active Rehabilitation System | r = 0.75 (P = 0.000, n = 20) (Bohannon, 1992) | ||
| Strength: knee extensor (peak power) | Lido Active Rehabilitation System | r = 0.75 (P = 0.000, n = 20) (Bohannon, 1992) | ||
| 7 mFWT | Body function | Strength: knee extensor | Lido Active Rehabilitation System | r = 0.76 (P < 0.01, n = 14) (Bohannon &Walsh, 1992) |
| (peak torque) | Lido Active Rehabilitation System | r = 0.64 (P < 0.01, n = 18) (Bohannon &Puharic, 1992) | ||
| Strength: knee extensor (torque) | Lido Active Rehabilitation System | r = 0.74 (P = 0.000, n = 20) (Bohannon, 1992) | ||
| Strength: knee extensor (peak power) | Lido Active Rehabilitation System | r = 0.74 (P = 0.000, n = 20) (Bohannon, 1992) | ||
| 8 mCWT | Body function | Strength: knee extensor (force) | Dynamometer | r = 0.60 (P < 0.01, n = 26); (Bohannon, 1991) |
| r = 0.62 (P < 0.001, n = 26, normalized with body weight) (Bohannon, 1991) | ||||
| Strength: knee extensor (measured torque) | Isokinetic dynamometer | r = 0.65 (P < 0.001, n = 26); (Bohannon, 1991) | ||
| r = 0.68 (P < 0.001, n = 26, normalized with body weight) (Bohannon, 1991) | ||||
| Strength: knee extensor (percent of body weight) | Dynamometer | r = 0.67 (P < 0.01, n = 20) (Bohannon, 1991) | ||
| 10 mCWT | Body function | Strength (baseline and re-test) | Stroke impact scale-strength | r = 0.27 (P = 0.232, n = 21) (Cheng et al., 2020) |
| r = 0.29 (P = 0.232, n = 20) (Cheng et al., 2020) | ||||
| Activity | Walk distance (baseline and re-test) | 6 MWT (15 m walkway) | r = 0.80 (P = 0.000, n = 21) (Cheng et al., 2020) | |
| r = 0.94 (P = 0.000, n = 20) (Cheng et al., 2020) | ||||
| 6 MWT (30 m walkway) | r = 0.80 (P = 0.000, n = 21) (Cheng et al., 2020) | |||
| r = 0.91 (P = 0.000, n = 20) (Cheng et al., 2020) | ||||
Abbreviations: 10 mCWT, 10-metre comfortable walk test; 10 mFWT, 10-metre fast walk test; 10 mWT, 10-metre walk test; 12 mCWT, 12-metre comfortable walk test; 5 mCWT, 5-metre comfortable walk test; 5 mFWT, 5-metre fast walk test; 6 mCWT, 6-metre comfortable walk test; 6 MWT, 6-minute walk test; 7 mCWT, 7-metre comfortable walk test; 7 mFWT, 7-metre fast walk test; 8 mCWT, 8-metre comfortable walk test; d, day; FIM, functional independence measure; IADL, instrumental activities of daily living; m, metres; MET-h, metabolic equivalent hours; min, minute(s); mo, month(s); NR, not reported; NS, not significant; PA, physical activity; PASIPD, Physical Activity Scale for Individuals with Physical Disabilities; SAM, StepWatch Activity Monitor; STREAM, Stroke Rehabilitation Assessment of Movement. 1Paretic side. 2Non-paretic side. 3Number of steps at a low rate is defined as < 30 steps per minute.4Number of steps at a high rate is defined as > 60 steps per minute.
3.8Sensitivity to change
Table 4 presents estimates of sensitivity to change reported in 3 articles. Large ES/SRM were observed for the 5 mCWT, and medium ES and large SRM for the 5 mFWT, 10 mCWT, and 10 mFWT in people with acute and subacute stroke (Ahmed et al., 2003; English et al., 2006; Salbach et al., 2001).
Table 4
Sensitivity to Change (N = 3 articles)
| First Author, Year | Walk Test, Measurement Tool, Location | Distance (m) TD: AD: DD: | Pace | Time Interval between walk tests | N | Effect Size (ES) Standardized Response Mean (SRM) |
| Acute (< 1 mo) &Sub-Acute (1–6 mo) | ||||||
| Salbach, 2001 | 5 mWT | TD: 9 m | Comfortable | Time between 1 week and | 50 | ES = 0.83 |
| Stopwatch | AD: 2 m | 5 weeks post- acute stroke | SRM (95% CI) = 1.22 (0.93–1.50) | |||
| Indoor | DD: 2 m | Fast | ES = 0.66 | |||
| SRM (95% CI) = 1.00 (0.68–1.30) | ||||||
| 10 mWT | TD: 14m | Comfortable | ES = 0.74 | |||
| Stopwatch | AD: 2 m | SRM (95% CI) = 0.92 (0.64–1.18) | ||||
| Indoor | DD: 2 m | Fast | ES = 0.55 | |||
| SRM (95% CI) = 0.83 (0.52–1.12) | ||||||
| Ahmed, 2003 | 5 mWT | TD: 9 m | Comfortable | Time between 1 week and | 63 | SRM (95% CI) = 1.05 (0.79–1.24) |
| Stopwatch | AD: 2 m | 5 weeks post-acute stroke | ||||
| Indoor | DD: 2 m | |||||
| Time between 5 weeks and | SRM (95% CI) = –0.17 (–0.13–0.43) | |||||
| 3 months post-acute stroke | ||||||
| Time between 1 week and | SRM (95% CI) = 1.15 (0.80–1.43) | |||||
| 3 months post-acute stroke | ||||||
| English, 2006 | 5 mWT | TD: 10 m | Comfortable | Time between admission | 61 | ES = 0.81 |
| Stopwatch | AD: 3 m | and discharge from in-patient | ||||
| Indoors | DD: 2 m | rehabilitation (56±38 days) | ||||
Abbreviations: 10 mWT, 10-metre walk test; 95% CI, 95% confidence interval; 5 mWT, 5-metre walk test; m, metres; AD, acceleration distance; DD, deceleration distance; ES, effect size; mo, month(s); SRM, standardized response mean; TD, total distance.
Table 5 summarizes reliability, measurement error, sensitivity to change, and construct validity findings by walk test and recovery phase post-stroke.
Table 5
Reliability, Measurement Error, Sensitivity to Change, and Construct Validity Findings by Walk Test and Recovery Phase Post-stroke1
| Walk Test | Reliability Coefficient | MDC90, m/s and ES or SRM | Constructs Correlated with Walk Test Performance | ||||||
| (# Articles) | (# Articles) | (# Correlations with P < 0.05) | |||||||
| Acute | Subacute | Chronic | Acute | Subacute | Chronic | Acute | Subacute | Chronic | |
| 3 mCWT | 0.85–0.97 (1) | 0.04–0.14 (1) | |||||||
| 5 mCWT | 1.00 (1)2 | 1.00 (1)2 | MDC90: 0.07–0.36 (1) | MDC90: 0.07–0.36 (1) | Motor function and basic mobility (3) | Motor function and basic mobility (3) | Physical activity (1) | ||
| 0.80–0.97 (1) | 0.80–0.97 (1) | ES: 0.81–0.83 (2) | ES: 0.81–0.83 (2) | Motor function-U (3) | Motor function-U (3) | Participation (1) | |||
| SRM: 1.053–1.22 (2) | SRM: 1.053–1.22 (2) | Motor function-L (3) | Motor function-L (3) | ||||||
| Basic mobility (3) | Basic mobility (3) | ||||||||
| Physical activity (5) | |||||||||
| Walk distance (1) | |||||||||
| Balance self-efficacy (1) | |||||||||
| 5 mFWT | ES: 0.66 (1) | ES: 0.66 (1) | Balance self-efficacy (1) | Balance self- efficacy (1) | |||||
| SRM: 1.00 (1) | SRM: 1.00 (1) | ||||||||
| 6 mCWT | 0.99 (1)4 | MDC90: 0.07–0.14 (2) | Strength-L (1) | Strength-L (1) | |||||
| 0.94–0.99 (2) | Comfortable walk speed (1) | Comfortable walk speed (1) | |||||||
| 6 mFWT | 0.94–0.95 (1) | MDC90: 0.19–0.24 (1) | |||||||
| 7 mCWT | Strength-L (4) | Strength-L (4) | Strength-L (4) | ||||||
| 7 mFWT | Strength-L (4) | Strength-L (4) | Strength-L (4) | ||||||
| 8 mCWT | Strength-L (4) | Strength-L (4) | Strength-L (4) | ||||||
| 10 mCWT | 0.83–0.95 (2) | 0.83 (1) | 0.87–0.95 (1)2 | MDC90: 0.34 (1) | MDC90: 0.34 (1) | MDC90: 0.10–0.34 (3) | Balance (1) | 6-minute walk test walking speed (1) | Aerobic capacity (2) |
| 0.93–0.97 (1)4 | ES: 0.74 (1) | ES: 0.74 (1) | Strength-U (1) | Strength-L (1) | Strength (1) | ||||
| 0.83–0.96 (3) | SRM: 0.92 (1) | SRM: 0.92 (1) | Mobility (3) | Walk distance (2) | Strength-L (8) | ||||
| 6-minute walk test walking speed (1) | Balance (6) | ||||||||
| Walk distance (2) | Hand function (1) | ||||||||
| Capacity for activities of daily living (2) | |||||||||
| Physical activity (9) | |||||||||
| Walk distance (4) | |||||||||
| Community walking capacity (1) | |||||||||
| Participation (2) | |||||||||
| Mobility (1) | |||||||||
| Stair function (2) | |||||||||
| Fast walk speed (1) | |||||||||
| 10 mFWT | 0.96–0.99 (2) | 0.97–0.99 (3) | ES: 0.55 (1) | MDC90: 0.07 (2) | MDC90: 0.06–0.20 (3) | Motor function-L (1) | Motor function-L (1) | Strength-L (2) | |
| SRM: 0.83 (1) | ES: 0.55 (1) | Mobility (2) | |||||||
| SRM: 0.83 (1) | Participation (1) | ||||||||
| Stair function (2) | |||||||||
| Comfortable walk speed (1) | |||||||||
| Walk distance (1) | |||||||||
| 12 mCWT | Aerobic capacity (1) | ||||||||
| Strength-L (2) | |||||||||
Abbreviations: 3 mCWT, 3-metre comfortable walk test; 5 mCWT, 5-metre comfortable walk test; 5 mFWT, 5-metre fast walk test; 6 mCWT, 6-metre comfortable walk test; 6 mFWT, 6-metre fast walk test; 7 mCWT, 7-metre comfortable walk test; 7 mFWT, 7-metre fast walk test; 8 mCWT, 8-metre comfortable walk test; 10 mCWT, 10-metre comfortable walk test; 10 mFWT, 10-metre fast walk test; 12 mCWT, 12-metre comfortable walk test; ES, effect size; L, lower extremity; MDC90, minimal detectable change at the 90% confidence level; SRM, standardized response mean; U, upper extremity. 1Results from studies that included participants in multiple phases of stroke recovery were listed under all phases. 2Intra-rater reliability. 31–5 weeks post-stroke. 4Inter-rater reliability.
4Discussion
This novel review provides a comprehensive synthesis of existing literature on measurement properties for distance-limited walk tests in people with stroke. The results are extensive which makes it challenging to understand how they might inform the selection of a distance-limited walk test to measure gait speed post-stroke in clinical practice. We therefore offer the following framework to guide decision-making that integrates systematic review findings.
The extensive evidence presented in this review can help guide the selection of a distance-limited walk test for clinical use post-stroke based on principles of measurement and generalizability, the influence of protocol elements on performance, and available resources (e.g., space). The first measurement principle guiding selection is an understanding that reliability is a prerequisite of validity (Streiner DL et al., 2014). One must first choose a walk test protocol that has demonstrated excellent reliability indicated by not only the ICC value, but also the lower limit of the 95% CI, and, secondarily, evidence of construct validity in the ‘population of interest’. Walking speed is a temporal-distance parameter of gait, not an abstract concept. Validity evidence increases our understanding of how strongly gait speed relates to impairments, activity limitations and participation restrictions (World Health Organization, 2001), and helps us to appreciate its relevance to human functioning, rehabilitation outcomes, and patient-centered goals.
The second principle guiding the selection of a distance-limited walk test for clinical use post-stroke relates to the generalizability of evidence to a particular clinical population (also known as external validity). If one’s clinical practice involves communication and/or program evaluation of walk test performance across acute care, and inpatient and outpatient rehabilitation settings (i.e., the care continuum), then ideally one will choose a distance-limited walk test with evidence of excellent reliability and validity in people with acute, subacute, and chronic stroke. If clinical use of walk test performance is limited to a single practice setting, one could select a test that is reliable and valid among patients seen in that setting alone. For clinical practice along the care continuum post-stroke, review findings reveal that the 10 mCWT is the only test with evidence of excellent reliability and construct validity in people with acute, subacute, and chronic stroke. Comfortable gait speed measured using the 10 mCWT consistently relates to balance and strength impairments, and mobility/walking limitations across settings; and participation in activities of daily living, physical activity, and other meaningful activities relevant to the out-patient setting (Lang et al., 2011) in people with chronic stroke. If one’s clinical practice is limited to treating people within 6 months post-stroke (acute and subacute phases), then the 5 mCWT is an excellent alternative, particularly for settings that cannot accommodate the 10 mCWT walkway length, given the evidence from this review of excellent reliability of the 5 mCWT and associations between 5 mCWT performance and important physical rehabilitation outcomes, such as motor function and basic mobility. Once reliability and validity evidence in the population of interest, and available space have been considered, a tertiary measurement consideration is sensitivity to change defined as the ability of a measure to detect change in the construct of interest (Cohen, 1977). Effect size/SRM estimates of sensitivity to change were large for the 5 mCWT and medium-to-large for the 10 mCWT in people with acute and subacute stroke (Ahmed et al., 2003; English et al., 2006; Salbach et al., 2001), reflecting the ability of both tests to capture change in walking capacity when individuals are likely participating in rehabilitation (Hall RE et al., 2018).
Generally, the walk test protocol, including instructions, acceleration/deceleration and timed distances, timing method, allowance for evaluator assistance and use of mobility devices, that is selected for clinical practice, should be identical to the one used in the reliability study supporting its use. Interestingly, review findings support an excellent level of reliability based on the ICC point estimate and lower 95% CI limit of diverse walk test protocols that did not allow physical assistance to walk (English et al., 2007; Faria et al., 2012; Flansbjer et al., 2005; Hiengkaew et al., 2012; Isho & Usuda, 2016; Lam et al., 2010; Peters et al., 2014; Stephens & Goldie, 1999). These protocols included walkways of 3 m (Peters et al., 2014), 5 m (English et al., 2007), 6 m (Lam et al., 2010; Stephens & Goldie, 1999), and 10 m (Faria et al., 2012; Flansbjer et al., 2005; Hiengkaew et al., 2012; Isho & Usuda, 2016) traversed at a comfortable pace, and 6 m (Stephens & Goldie, 1999) and 10 m (Faria et al., 2012; Flansbjer et al., 2005; Hiengkaew et al., 2012) walked at a fast pace; acceleration/deceleration distances of 2.0 m (Faria et al., 2012; Flansbjer et al., 2005; Hiengkaew et al., 2012; Lam et al., 2010; Peters et al., 2014; Stephens & Goldie, 1999) or 2.5 m (English et al., 2007; Isho & Usuda, 2016); 0 or 1 practice trial and 1 test trial (English et al., 2007; Isho & Usuda, 2016; Lam et al., 2010; Stephens & Goldie, 1999), as well as the mean of 2 or 3 trials (Faria et al., 2012; Flansbjer et al., 2005) or the maximum of 3 trials (Faria et al., 2012); and individuals with variable levels of plantar flexor tone (Hiengkaew et al., 2012) and community ambulation (Peters et al., 2014). It appears that, regardless of the protocol, any standardized distance-limited test to evaluate walking speed in people with stroke not requiring assistance is highly reliable. However, it is important that selected walk tests be compared to tests with the same testing distance and protocol, as results from only one study of people chronic stroke (Lam et al., 2010) showed that walkway distance did not affect walking speed. One cannot assume that these results apply to people with acute and subacute stroke, populations that are often seen in rehabilitation settings with less stable walking capacity compared to people with chronic stroke (Christensen et al., 2008; Schepers et al., 2006).
Excellent reliability based on ICC magnitude alone was also observed for a small number of walk test protocols (i.e., 5 mCWT, 10 mCWT, and 10 mFWT) in studies of very good or adequate quality that allowed the evaluator to provide physical assistance (Cheng et al., 2020; Fulk & Echternach, 2008; Høyer et al., 2014), with lower 95% CI limits in the acceptable range (Cheng et al., 2020; Fulk & Echternach, 2008). These findings are extremely relevant to acute and inpatient rehabilitation settings in which a substantial proportion of people post-stroke require assistance to walk (Hall RE et al., 2018). Healthcare professionals in these settings should consider adopting a protocol that allows the evaluator to provide physical assistance at the waist (Cheng et al., 2020; Høyer et al., 2014), but not to advance the lower extremity (Cheng et al., 2020). In fact, in people with acute and subacute stroke walking at slow speeds (e.g., mean ∼0.25 m/s), the reliability of walk test protocols evaluated is excellent and MDC90 values are small (0.07 or 0.12 m/s) (Fulk & Echternach, 2008; Høyer et al., 2014).
This review revealed gaps in the literature. Evidence for the reliability of the 5 mF-, 7 mC-, 7 mF-, 8 mC-, and 12 mCWT, for measurement error of the 5 mF-, 6 mF-, 7 mC-, 7 mF-, 8 mC-, and 12 mCWT, and for the construct validity of the 3 mC-, 6 mF-, and 8 mFWT, ideally across the care continuum, was lacking. Despite recommendations for the use of the 10 mCWT in clinical (Otterman et al., 2017; Sullivan et al., 2013; Teasell et al., 2020) and research (Kwakkel et al., 2017) settings, and its popularity in research studies (Salbach et al., 2014), there was limited research evaluating test-retest reliability and measurement error of this test in people with acute or subacute stroke. Furthermore, while some guidelines promote the 6-metre walk test for neurologic populations (Moore et al., 2018), our review found that evidence for reliability of this test was limited to the subacute stage, and the precision of the estimates is unknown because CIs were not reported (Lam et al., 2010; Stephens & Goldie, 1999). The vast majority of studies included in this review had limited applicability to rehabilitation settings as they enrolled people who walked faster than 0.4 m/s. Studies targeting people who walk slowly and may require assistance to walk, deficits commonly seen in acute care and inpatient rehabilitation settings (Hall RE et al., 2018), are needed.
This review has some limitations. Due to the extensive literature in this area and finite resources, we were unable to include evidence of validity for all constructs, studies of minimal clinically important change, or a more current review. More recent publications may address some of the gaps we identified. Although only one reviewer completed full text screening, data extraction and critical appraisal, extensive training and verification of data were undertaken. The review was comprehensive given the large number of databases searched and inclusion of any study reporting associations with gait speed for evidence of validity.
5Conclusions
The 10 mCWT is the only measure demonstrating excellent reliability and construct validity across the care continuum post-stroke, and sensitivity to change in people with acute and subacute stroke. The 5 mCWT demonstrates excellent reliability, construct validity, and sensitivity to change in acute and subacute phases of stroke recovery. Despite wide variations, the majority of protocols for distance-limited tests have excellent reliability, and evidence of validity indicated by associations with important physical rehabilitation outcomes, even in people who require assistance to walk. Review findings provide guidance for future research and improved quality of reporting.
Acknowledgments
Authors acknowledge the assistance of Erica Nekolaichuk, Faculty Liaison and Instruction Librarian at the Gerstein Science Information Centre, University of Toronto, with developing the search strategy.
Conflict of interest
NMS is an author on 5 articles included in this review. DKC is an author on 1 article included in this review. PT is an author on 1 article included in this review. Otherwise, the authors declare no conflicts of interest. Funding for this project is provided by the Canadian Institutes of Health Research, Heart & Stroke Foundation, Canadian Partnership for Stroke Recovery, and Canadian Frailty Network. NMS holds the Toronto Rehabilitation Institute Chair at the University of Toronto.
References
1 | Agyenkwa, S. K. , Yarfi, C. , Banson, A. N. , Kofi-Bediako, W. A. , Abonie, U. S. , Angmorterh, S. K. , & Ofori, E. K. ((2020) ). Assessing the use of standardized outcome measures for stroke rehabilitation among physiotherapists in Ghana. Stroke Research and Treatment, https://doi.org/10.1155/2020/9259017 |
2 | Ahmed, S. , Mayo, N. E. , Higgins, J. , Salbach, N. M. , Finch, L. , & Wood-Dauphinée, S. L. ((2003) ). The Stroke Rehabilitation Assessment of Movement (STREAM): a comparison with other measures used to evaluate effects of stroke and rehabilitation. Physical Therapy 83: (7), 617–630. |
3 | Alzahrani, M. A. , Dean, C. M. , & Ada, L. ((2009) ). Ability to negotiate stairs predicts free-living physical activity in community-dwelling people with stroke: An observational study. Australian Journal of Physiotherapy 55: (4), 277–281. https://doi.org/10.1016/s0004-9514(09)70008-x |
4 | Andresen, E. M. ((2000) ). Criteria for assessing the tools of disability outcomes research. Archives of Physical Medicine and Rehabilitation 81: (12 Suppl 2), S15–20. https://doi.org/10.1053/apmr.2000.20619 |
5 | Beaton, D. E. , Bombardier, C. , Katz, J. N. , Wright, J. G. , Wells, G. , Boers, M. , Strand, V. , & Shea, B. ((2001) ). Looking for important change/differences in studies of responsiveness. The Journal of Rheumatology 28: (2), 400–405. |
6 | Bohannon, R. W. ((1991) ). Correlation of knee extension force and torque with gait speed in patients with stroke. Physiotherapy Theory and Practice 7: (3), 185–190. https://doi.org/10.3109/09593989109106970 |
7 | Bohannon, R. W. ((1991) ). Relationship among paretic knee extension strength, maximum weight-bearing, and gait speed in patients with stroke. Journal of Stroke & Cerebrovascular Diseases 1: (2), 65–69. https://doi.org/10.1016/s1052-3057(11)80003-0 |
8 | Bohannon, R. W. ((1992) ). Knee extension power, velocity and torque: relative deficits and relation to walking performance in stroke patients. Clinical Rehabilitation 6: (2), 125–131. https://doi.org/10.1177/026921559200600206 |
9 | Bohannon, R. W. , & Puharic, T. ((1992) ). Torque fluctuations during maximal voluntary knee extension efforts after stroke. Clinical Rehabilitation 6: (4), 305–310. https://doi.org/10.1177/026921559200600406 |
10 | Bohannon, R. W. , & Walsh, S. ((1992) ). Nature, reliability, and predictive value of muscle performance measures in patients with hemiparesis following stroke. Archives of Physical Medicine and Rehabilitation 73: (8), 721–725. |
11 | Bramer, W. M. , Giustini, D. , de Jonge, G. B. , Holland, L. , & Bekhuis, T. ((2016) ). De-duplication of database search results for systematic reviews in EndNote. Journal of the Medical Library Association 104: (3), 240–243. https://doi.org/10.3163/1536-5050.104.3.014 |
12 | Braun, T. , Rieckmann, A. , Weber, F. , & Grüneberg, C. ((2018) ). Current use of measurement instruments by physiotherapists working in Germany: a cross-sectional online survey. BMC Health Services Research 18: (1), 810. https://doi.org/10.1186/s12913-018-3563-2 |
13 | Cheng, D. K. , Nelson, M. , Brooks, D. , & Salbach, N. M. ((2020) ). Validation of stroke-specific protocols for the 10-meter walk test and 6-minute walk test conducted using 15-meter and 30-meter walkways. Topics in Stroke Rehabilitation 27: (4), 251–261. https://doi.org/10.1080/10749357.2019.1691815 |
14 | Christensen, D. , Johnsen, S. P. , Watt, T. , Harder, I. , Kirkevold, M. , & Andersen, G. ((2008) ). Dimensions of post-stroke fatigue: a two-year follow-up study. Cerebrovascular Diseases 26: (2), 134–141. https://www.karger.com/DOI/10.1159/000139660 |
15 | Cohen, J. ((1977) ). Statistical power analysis for the behavioral sciences (Vol. 8). Academic Press. |
16 | Di Cesare, F. , Mancuso, J. , Silver, B. , & Loudon, P. T. ((2016) ). Assessment of cognitive and neurologic recovery in ischemic stroke drug trials: results from a randomized, double-blind, placebo-controlled study. Innovations in Clinical Neuroscience 13: (9-10), 32–43. |
17 | English, C. K. , Hillier, S. L. , Stiller, K. , & Warden-Flood, A. ((2006) ). The sensitivity of three commonly used outcome measures to detect change amongst patients receiving inpatient rehabilitation following stroke. Clinical Rehabilitation 20: (1), 52–55. https://doi.org/10.1191/0269215506cr877oa |
18 | English, C. K. , Hillier, S. L. , Stiller, K. R. , & Warden-Flood, A. ((2007) ). Circuit class therapy versus individual physiotherapy sessions during inpatient stroke rehabilitation: a controlled trial. Archives of Physical Medicine and Rehabilitation 88: (8), 955–963. https://doi.org/10.1016/j.apmr.2007.04.010 |
19 | Ezeugwu, V. E. , & Manns, P. J. ((2017) ). Sleep duration, sedentary behavior, physical activity, and quality of life after inpatient stroke rehabilitation. Journal of Stroke & Cerebrovascular Diseases 26: (9), 2004–2012. https://doi.org/10.1016/j.jstrokecerebrovasdis.2017.06.009 |
20 | Faria, C. D. , Teixeira-Salmela, L. F. , Neto, M. G. , & Rodrigues-de-Paula, F. ((2012) ). Performance-based tests in subjects with stroke: outcome scores, reliability and measurement errors. Clinical Rehabilitation 26: (5), 460–469. https://doi.org/10.1177/0269215511423849 |
21 | Flansbjer, U. B. , Downham, D. , & Lexell, J. ((2006) ). Knee muscle strength, gait performance, and perceived participation after stroke. Archives of Physical Medicine and Rehabilitation 87: (7), 974–980. https://doi.org/10.1016/j.apmr.2006.03.008 |
22 | Flansbjer, U. B. , Holmbäck, A. M. , Downham, D. , Patten, C. , & Lexell, J. ((2005) ). Reliability of gait performance tests in men and women with hemiparesis after stroke. Journal of Rehabilitation Medicine 37: (2), 75–82. https://doi.org/10.1080/16501970410017215 |
23 | Frost, Y. , Weingarden, H. , Zeilig, G. , Nota, A. , & Rand, D. ((2015) ). Self-care self-efficacy correlates with independence in basic activities of daily living in individuals with chronic stroke. Journal of Stroke & Cerebrovascular Diseases 24: (7), 1649–1655. https://doi.org/10.1016/j.jstrokecerebrovasdis.2015.03.054 |
24 | Fulk, G. D. , & Echternach, J. L. ((2008) ). Test-retest reliability and minimal detectable change of gait speed in individuals undergoing rehabilitation after stroke. Journal of Neurologic Physical Therapy 32: (1), 8–13. https://doi.org/10.1097/NPT0b013e31816593c0 |
25 | Fulk, G. D. , Echternach, J. L. , Nof, L. , & O’Sullivan, S. ((2008) ). Clinometric properties of the six-minute walk test in individuals undergoing rehabilitation poststroke. Physiotherapy Theory and Practice 24: (3), 195–204. https://doi.org/10.1080/09593980701588284 |
26 | Fulk, G. D. , Reynolds, C. , Mondal, S. , & Deutsch, J. E. ((2010) ). Predicting home and community walking activity in people with stroke. Archives of Physical Medicine and Rehabilitation 91: (10), 1582–1586. https://doi.org/10.1016/j.apmr.2010.07.005 |
27 | Garner, P. , Hopewell, S. , Chandler, J. , MacLehose, H. , Akl, E. A. , Beyene, J. , Chang, S. , Churchill, R. , Dearness, K. , Guyatt, G. , Lefebvre, C. , Liles, B. , Marshall, R. , Martínez García, L. , Mavergames, C. , Nasser, M. , Qaseem, A. , Sampson, M. , Soares-Weiser, K. , Takwoingi, Y. , Thabane, L. , Trivella, M. , Tugwell, P. , Welsh, E. , Wilson, E. C. , & Schünemann, H. J. ((2016) ). When and how to update systematic reviews: consensus and checklist. British Medical Journal 354: , i3507. https://doi.org/10.1136/bmj.i3507 |
28 | Graham, I. D. , Logan, J. , Harrison, M. B. , Straus, S. E. , Tetroe, J. , Caswell, W. , & Robinson, N. ((2006) ). Lost in knowledge translation: time for a map? Journal of Continuing Education in the Health Professions 26: (1), 13–24. https://doi.org/10.1002/chp.47 |
29 | Hall,R. E., Tee,A., Khan,F., McCormack,D., Levi,J., Verrilli,S., Quant,S., Donnelly,B., Brown,G., Campbell,W., Brown,P., Cristofaro,K., & Bayley,M. T. ((2018) ). Ontario stroke evaluation report 2018: Stroke care and outcomes in complex continuing care and long-term care. https://www.ices.on.ca/Publications/Atlases-and-Reports/2018/Ontario-Stroke-Report-2018 |
30 | Hatem, S. M. , Saussez, G. , Della Faille, M. , Prist, V. , Zhang, X. , Dispa, D. , & Bleyenheuft, Y. ((2016) ). Rehabilitation of motor function after stroke: A multiple systematic review focused on techniques to stimulate upper extremity recovery. Frontiers in Human Neuroscience 10: , 442. https://doi.org/10.3389/fnhum.2016.00442 |
31 | Hiengkaew, V. , Jitaree, K. , & Chaiyawat, P. ((2012) ). Minimal detectable changes of the Berg Balance Scale, Fugl-Meyer Assessment Scale, Timed “Up & Go” Test, gait speeds, and 2-minute walk test in individuals with chronic stroke with different degrees of ankle plantarflexor tone. Archives of Physical Medicine and Rehabilitation 93: (7), 1201–1208. https://doi.org/10.1016/j.apmr.2012.01.014 |
32 | Høyer, E. , Opheim, A. , Strand, L. I. , & Moe-Nilssen, R. ((2014) ). Temporal and spatial gait parameters in patients dependent on walking assistance after stroke: reliability and agreement between simple and advanced methods of assessment. Gait & Posture 40: (1), 101–106. https://doi.org/10.1016/j.gaitpost.2014.03.001 |
33 | Huo, M. , Maruyama, H. , & Chen, L. ((2009) ). Relationship between probe reaction time during during walking and falls for patients with post-stroke hemiplegia. Journal of Physical Therapy Science 21: , 349–354. https://doi.org/10.1589/jpts.21.349 |
34 | Isho, T. , & Usuda, S. ((2016) ). Association of trunk control with mobility performance and accelerometry-based gait characteristics in hemiparetic patients with subacute stroke. Gait & Posture 44: , 89–93. https://doi.org/10.1016/j.gaitpost.2015.11.011 |
35 | Jette, D. U. , Halbert, J. , Iverson, C. , Miceli, E. , & Shah, P. ((2009) ). Use of standardized outcome measures in physical therapist practice: perceptions and applications. Physical Therapy 89: (2), 125–135. https://doi.org/10.2522/ptj.20080234 |
36 | Jørgensen, H. S. , Nakayama, H. , Raaschou, H. O. , & Olsen, T. S. ((1995) ). Recovery of walking function in stroke patients: The Copenhagen stroke study. Archives of Physical Medicine and Rehabilitation 76: (1), 27–32. https://doi.org/https://doi.org/10.1016/S0003-9993(95)80038-7 |
37 | Khanittanuphong, P. , & Tipchatyotin, S. ((2017) ). Correlation of the gait speed with the quality of life and the quality of life classified according to speed-based community ambulation in Thai stroke survivors. NeuroRehabilitation 41: (1), 135–141. https://doi.org/10.3233/nre-171465 |
38 | Kobayashi, M. , Takahashi, K. , Sato, M. , & Usuda, S. ((2015) ). Association of performance of standing turns with physical impairments and walking ability in patients with hemiparetic stroke. Journal of Physical Therapy Science 27: (1), 75–78. https://doi.org/10.1589/jpts.27.75 |
39 | Kwakkel, G. , Lannin, N. A. , Borschmann, K. , English, C. , Ali, M. , Churilov, L. , Saposnik, G. , Winstein, C. , van Wegen, E. E. , Wolf, S. L. , Krakauer, J. W. , & Bernhardt, J. ((2017) ). Standardized measurement of sensorimotor recovery in stroke trials: Consensus-based core recommendations from the Stroke Recovery and Rehabilitation Roundtable. International Journal of Stroke 12: (5), 451–461. https://doi.org/10.1177/1747493017711813 |
40 | Kwong, P. W. , Ng, S. S. , Liu, T. W. , Chung, R. C. , & Ng, G. Y. ((2016) ). Effect of leg selection on the Berg balance scale scores of hemiparetic stroke survivors: A cross-sectional study. Archives of Physical Medicine and Rehabilitation 97: (4), 545–551. https://doi.org/10.1016/j.apmr.2015.11.017 |
41 | Lam, H. S. , Lau, F. W. , Chan, G. K. , & Sykes, K. ((2010) ). The validity and reliability of a -metre timed walk for the functional assessment of patients with stroke. Physiotherapy Theory and Practice 26: (4), 251–255. https://doi.org/10.3109/09593980903015235 |
42 | Landis, J. R. , & Koch, G. G. ((1977) ). The measurement of observer agreement for categorical data. Biometrics 33: (1), 159–174. |
43 | Lang, C. E. , Bland, M. D. , Connor, L. T. , Fucetola, R. , Whitson, M. , Edmiaston, J. , Karr, C. , Sturmoski, A. , Baty, J. , & Corbetta, M. ((2011) ). The brain recovery core: Building a system of organized stroke rehabilitation and outcomes assessment across the continuum of care. Journal of Neurologic Physical Therapy 35: (4), 194–201. https://doi.org/10.1097/NPT.0b013e318235dc07 |
44 | Lee, K. B. , Lim, S. H. , Ko, E. H. , Kim, Y. S. , Lee, K. S. , & Hwang, B. Y. ((2015) ). Factors related to community ambulation in patients with chronic stroke. Topics in Stroke Rehabilitation 22: (1), 63–71. https://doi.org/10.1179/1074935714z.0000000001 |
45 | Liberati, A. , Altman, D. G. , Tetzlaff, J. , Mulrow, C. , Gøtzsche, P. C. , Ioannidis, J. P. , Clarke, M. , Devereaux, P. J. , Kleijnen, J. , & Moher, D. ((2009) ). The PRISMA statement for reporting systematic reviews and meta-analyses of studies that evaluate health care interventions: explanation and elaboration. PLOS Medicine 6: (7), e1000100. https://doi.org/10.1371/journal.pmed.1000100 |
46 | Liu-Ambrose, T. , Pang, M. Y. , & Eng, J. J. ((2007) ). Executive function is independently associated with performances of balance and mobility in community-dwelling older adults after mild stroke: implications for falls prevention. Cerebrovascular Diseases 23: (2-3), 203–210. https://doi.org/10.1159/000097642 |
47 | McGlynn, M. , & Cott, C. ((2007) ). Weighing the evidence: Clinical decision making in neurological physical therapy. Physiotherapy Canada 59: (4), 241–225. |
48 | McGowan, J. , Sampson, M. , Salzwedel, D. M. , Cogo, E. , Foerster, V. , & Lefebvre, C. ((2016) ). PRESS peer review of electronic search strategies: 2015 guideline statement. Journal of Clinical Epidemiology, 75: , 40–46. https://doi.org/10.1016/j.jclinepi.2016.01.021 |
49 | Mitsutake, T. , Sakamoto, M. , Ueta, K. , Oka, S. , & Horikawa, E. ((2017) ). Poor gait performance is influenced with decreased vestibulo-ocular reflex in poststroke patients. Neuroreport 28: (12), 745–748. https://doi.org/10.1097/wnr.0000000000000841 |
50 | Mokkink, L. B. , de Vet, H. C. W. , Prinsen, C. A. C. , Patrick, D. L. , Alonso, J. , Bouter, L. M. , & Terwee, C. B. ((2018) ). COSMIN risk of bias checklist for systematic reviews of patient-reported outcome measures. Quality of Life Research 27: (5), 1171–1179. https://doi.org/10.1007/s11136-017-1765-4 |
51 | Moore, D. E. Jr , Green, J. S. , & Gallis, H. A. ((2009) ). Achieving desired results and improved outcomes: integrating planning and assessment throughout learning activities. Journal of Continuing Education in the Health Professions 29: (1), 1–15. https://doi.org/10.1002/chp.20001 |
52 | Moore, J. L. , Potter, K. , Blankshain, K. , Kaplan, S. L. , O’Dwyer, L. C. , & Sullivan, J. E. ((2018) ). A core set of outcome measures for adults with neurologic conditions undergoing rehabilitation: A clinical practice guideline. Journal of Neurologic Physical Therapy 42: (3), 174–220. https://doi.org/10.1097/npt.0000000000000229 |
53 | Morone, G. , Iosa, M. , Pratesi, L. , & Paolucci, S. ((2014) ). Can overestimation of walking ability increase the risk of falls in people in the subacute stage after stroke on their return home?&. Posture 39: (3), 965–970. https://doi.org/10.1016/j.gaitpost.2013.12.022 |
54 | Mudge, S. , & Stott, N. S. ((2009) ). Timed walking tests correlate with daily step activity in persons with stroke. Archives of Physical Medicine and Rehabilitation 90: (2), 296–301. https://doi.org/10.1016/j.apmr.2008.07.025 |
55 | Nasciutti-Prudente, C. , Oliveira, F. G. , Houri, S. F. , de Paula Goulart, F. R. , Neto, M. H. , & Teixeira-Salmela, L. F. ((2009) ). Relationships between muscular torque and gait speed in chronic hemiparetic subjects. Disability and Rehabilitation 31: (2), 103–108. https://doi.org/10.1080/09638280701818055 |
56 | Ng, S. S. , Ng, P. C. , Lee, C. Y. , Ng, E. S. , & Tong, M. H. ((2012) ). Walkway lengths for measuring walking speed in stroke rehabilitation. Journal of Rehabilitation Medicine 44: (1), 43–46. https://doi.org/10.2340/16501977-0906 |
57 | Otterman, N. , Veerbeek, J. , Schiemanck, S. , van der Wees, P. , Nollet, F. , & Kwakkel, G. ((2017) ). Selecting relevant and feasible measurement instruments for the revised Dutch clinical practice guideline for physical therapy in patients after stroke. Disability and Rehabilitation 39: (14), 1449–1457. https://doi.org/10.1080/09638288.2016.1196399 |
58 | Ovando, A. C. , Michaelsen, S. M. , Carvalho, T. , & Herber, V. ((2011) ). Evaluation of cardiopulmonary fitness in individuals with hemiparesis after cerebrovascular accident. Arquivos Brasileiros de Cardiologia 96: (2), 140–147. https://doi.org/10.1590/s0066-782x2011005000001 |
59 | Pattison, K. M. , Brooks, D. , Cameron, J. I. , & Salbach, N. M. ((2015) ). Factors influencing physical therapists’ use of standardized measures of walking capacity poststroke across the care continuum. Physical Therapy, 95: , 1507–1517. https://doi.org/10.2522/ptj.20140267 |
60 | Peters, D. M. , Middleton, A. , Donley, J. W. , Blanck, E. L. , & Fritz, S. L. ((2014) ). Concurrent validity of walking speed values calculated via the GAITRite electronic walkway and 3 meter walk test in the chronic stroke population. Physiotherapy Theory and Practice 30: (3), 183–188. https://doi.org/10.3109/09593985.2013.845805 |
61 | Potter, K. , Fulk, G. D. , Salem, Y. , & Sullivan, J. ((2011) ). Outcome measures in neurological physical therapy practice: part I. Making sound decisions. Journal of Neurologic Physical Therapy, 35: (2), 57–64. doi: 10.1097/NPT.0b013e318219a51a |
62 | Richards, C. L. , & Olney, S. J. ((1996) ). Hemiparetic gait following stroke. Part II: Recovery and physical therapy. Gait & Posture 4: (2), 149–162. https://doi.org/https://doi.org/10.1016/0966-6362(96)01064-8 |
63 | Salbach, N. M. , Brooks, D. , Romano, J. , & Woon, L. J. ((2013) ). The relationship between clinical measures and daily physical activity and participation in ambulatory, community-dwelling people with stroke. Journal of Neurologic Physical Therapy 3: (6), 182. https://doi.org/10.4172/2165-7025.1000182 |
64 | Salbach, N. M. , Guilcher, S. J. , & Jaglal, S. B. ((2011) ). Physical therapists’ perceptions and use of standardized assessments of walking ability post-stroke. Journal of Rehabilitation Medicine 43: (6), 543–549. https://doi.org/10.2340/16501977-0820 |
65 | Salbach, N. M. , Mayo, N. E. , Higgins, J. , Ahmed, S. , Finch, L. E. , & Richards, C. L. ((2001) ). Responsiveness and predictability of gait speed and other disability measures in acute stroke. Archives of Physical Medicine and Rehabilitation 82: (9), 1204–1212. https://doi.org/10.1053/apmr.2001.24907 |
66 | Salbach, N. M. , Mayo, N. E. , Robichaud-Ekstrand, S. , Hanley, J. A. , Richards, C. L. , & Wood-Dauphinee, S. ((2006) ). Balance self-efficacy and its relevance to physical function and perceived health status after stroke. Archives of Physical Medicine and Rehabilitation 87: (3), 364–370. https://doi.org/10.1016/j.apmr.2005.11.017 |
67 | Salbach, N. M. , O’Brien, K. , Brooks, D. , Irvin, E. , Martino, R. , Takhar, P. , Chan, S. , & Howe, J. A. ((2014) ). Speed and distance requirements for community ambulation: a systematic review..e. Archives of Physical Medicine and Rehabilitation 95: (1), 111. https://doi.org/10.1016/j.apmr.2013.06.017 |
68 | Salbach, N. M. , O’Brien, K. K. , Brooks, D. , Irvin, E. , Martino, R. , Takhar, P. , Chan, S. , & Howe, J. A. ((2017) ). Considerations for the selection of time-limited walk tests poststroke: A systematic review of test protocols and measurement properties. Journal of Neurologic Physical Therapy 41: (1), 3–17. https://doi.org/10.1097/npt.0000000000000159 |
69 | Schepers, V. P. , Visser-Meily, A. M. , Ketelaar, M. , & Lindeman, E. ((2006) ). Poststroke fatigue: course and its relation to personal and stroke-related factors. Archives of Physical Medicine and Rehabilitation 87: (2), 184–188. https://doi.org/10.1016/j.apmr.2005.10.005 |
70 | Severinsen, K. , Jakobsen, J. K. , Overgaard, K. , & Andersen, H. ((2011) ). Normalized muscle strength, aerobic capacity, and walking performance in chronic stroke: a population-based study on the potential for endurance and resistance training. Archives of Physical Medicine and Rehabilitation 92: (10), 1663–1668. https://doi.org/10.1016/j.apmr.2011.04.022 |
71 | Shrout, P. E. , & Fleiss, J. L. ((1979) ). Intraclass correlations: uses in assessing rater reliability. Psychological Bulletin 86: (2), 420–428. https://doi.org/10.1037//0033-2909.86.2.420 |
72 | Stephens, J. M. , & Goldie, P. A. ((1999) ). Walking speed on parquetry and carpet after stroke: effect of surface and retest reliability. Clinical Rehabilitation 13: (2), 171–181. https://doi.org/10.1191/026921599668553798 |
73 | Streiner DL. , Norman GR. , J, C. ((2014) ). Health measurement scales: A practical guide to their development and use (5th ed.). Oxford University Press. |
74 | Studenski, S. , Perera, S. , Patel, K. , Rosano, C. , Faulkner, K. , Inzitari, M. , Brach, J. , Chandler, J. , Cawthon, P. , Connor, E. B. , Nevitt, M. , Visser, M. , Kritchevsky, S. , Badinelli, S. , Harris, T. , Newman, A. B. , Cauley, J. , Ferrucci, L. , & Guralnik, J. ((2011) ). Gait speed and survival in older adults. Journal of the American Medical Association 305: (1), 50–58. https://doi.org/10.1001/jama.2010.1923 |
75 | Sullivan, J. E. , Crowner, B. E. , Kluding, P. M. , Nichols, D. , Rose, D. K. , Yoshida, R. , & Pinto, Z. G. ((2013) ). Outcome measures for individuals with stroke: process and recommendations from the American Physical Therapy Association neurology section task force. Physical Therapy 93: (10), 1383–1396. https://doi.org/10.2522/ptj.20120492 |
76 | Taylor, D. , Stretton, C. M. , Mudge, S. , & Garrett, N. ((2006) ). Does clinic-measured gait speed differ from gait speed measured in the community in people with stroke? Clinical Rehabilitation 20: (5), 438–444. https://doi.org/10.1191/0269215506cr945oa |
77 | Teasell, R. , Salbach, N. M. , Foley, N. , Mountain, A. , Cameron, J. I. , Jong, A. , Acerra, N. E. , Bastasi, D. , Carter, S. L. , Fung, J. , Halabi, M. L. , Iruthayarajah, J. , Harris, J. , Kim, E. , Noland, A. , Pooyania, S. , Rochette, A. , Stack, B. D. , Symcox, E. , Timpson, D. , Varghese, S. , Verrilli, S. , Gubitz, G. , Casaubon, L. K. , Dowlatshahi, D. , & Lindsay, M. P. ((2020) ). Canadian stroke best practice recommendations: Rehabilitation, recovery, and community participation following stroke. Part one: Rehabilitation and recovery following stroke; 6th edition update 2019. International Journal of Stroke, 1747493019897843. https://doi.org/10.1177/1747493019897843 |
78 | Van Peppen, R. P. , Maissan, F. J. , Van Genderen, F. R. , Van Dolder, R. , & Van Meeteren, N. L. ((2008) ). Outcome measures in physiotherapy management of patients with stroke: a survey into self-reported use, and barriers to and facilitators for use. Physiotherapy Research International 13: (4), 255–270. https://doi.org/10.1002/pri.417 |
79 | Wade, D. T. ((1992) ). Measurements in neurological rehabilitation. Current Opinion in Neurology 5: (5), 682–686. |
80 | Wang, W. T. , Huang, L. T. , Chou, Y. H. , Wei, T. S. , & Lin, C. C. ((2014) ). Nonparetic knee extensor strength is the determinant of exercise capacity of community-dwelling stroke survivors. The Scientific World Journal 2014: , 769875. https://doi.org/10.1155/2014/769875 |
81 | World Health Organization. (2001). International Classification of Functioning, Disability and Health: ICF. |


