
Abnormal trunk control determines postural abnormalities in Amyotrophic Lateral Sclerosis
Abstract
BACKGROUND:
Postural instability in Amyotrophic Lateral Sclerosis (ALS) occurs at an early stage of the disease and often results in falls. As ALS is considered a multisystem neurodegenerative disorder, postural instability may result from motor, sensory and central processing deficits.
OBJECTIVE AND METHODS:
We analysed postural control of 12 ALS patients and 12 healthy age-matched control subjects. Postural control was characterised by spontaneous sway measures and measures of postural reactions to pseudorandom anterior-posterior platform tilts, which were then correlated with clinical test scores.
RESULTS:
Spontaneous sway amplitudes and velocities were significantly larger and sway frequencies higher in ALS patients than in control subjects. ALS patients’ body excursions following platform tilts were smaller, with relatively higher upper body excursions. We found high correlations between abnormal postural reactions and clinical tests representing motor or balance deficits.
CONCLUSIONS:
We conclude that ALS patients’ postural abnormalities are mainly determined by an abnormal axial control and abnormally small body excursions as a function of support surface tilts, seemingly indicating better postural stabilization than control subjects. The latter contradicts the hypothesis that muscle weakness is the main source for this deficit. Instead, we suggest an altered central control strategy.
1Introduction
Amyotrophic Lateral Sclerosis (ALS) is a well-known degenerative disorder of the upper and lower motor neurons in adults. Due to its relation to the frontotemporal lobar degeneration (FTLD) spectrum of disorders represented by the pathologic substrate TDP-43, it is often described as a multisystem neurodegenerative disease (Geser et al., 2008; Grossman et al., 2014). Patients’ motor symptoms include progressive spasticity and weakness of the limb-, trunk-, and bulbar muscles.
Postural instability in ALS occurs at an early stage of the disease and often results in falls (Montes et al., 2007; Pupillo et al., 2015), leading to premature immobility and loss of autonomy, and consequently to an impaired quality of life. It was frequently assumed that balance problems are mainly related to muscle weakness of the lower limbs (Jette, Slavin, Andres, & Munsat, 1999; Kloos et al., 2004). However, some authors explained postural instability by other impairments (Montes et al., 2007; Nardone, Galante, Lucas, & Schieppati, 2001), such as spasticity, contribution of the extrapyramidal system, a decreased ability to use the vestibular system, or a preferred use of visual cues (Pradat et al., 2009; D’Ascenzo et al., 2012; Sanjak et al., 2014). Other evidence for an impaired vestibular system stems from electronystagmographic findings in ALS patients (Steinmetz, Lebo, & Norris, 1974; Ohki et al., 1994). However, the contribution of the different sensorimotor systems and their central processing to postural instability has not been identifiedyet.
How can postural instability be quantified? The majority of the studies mentioned above are focused on clinical assessments or spontaneous body sway measures including the sensory organization test (SOT, (Nashner, Black, & Wall, 1982)). However, spontaneous sway measures are inferior to disturbance-related approaches concerning the identification of abnormalities in the sensory, motor, and central processing parts of postural control mechanisms (Welch & Ting, 2009; van der Kooij & Peterka, 2011; Engelhart et al., 2014). In fact, the influence of postural control abnormalities on spontaneous sway and on postural reactions to external perturbations in ALS patients is largely unknown.
In the current study, we assessed postural control of ALS patients with spontaneous sway measures and measures of postural reactions to pseudorandom anterior-posterior tilts of the support surface over a broad range of frequencies, and with eyes closed or open. Here, we aimed to identify the major components of ALS patients’ impaired postural control and their correlation with known clinical tests of disease severity.
2Subjects and methods
2.1Subjects
Twelve patients with a mean age of 66 ± 9.3 years (± SD, seven female, five male) and a possible or probable diagnosis of ALS according to the revised El Escorial Criteria (Brooks, Miller, Swash, Munsat, & World Federation of Neurology Research Group on Motor Neuron Diseases, 2000) were recruited. All patients underwent standardized clinical assessments: ALS Functional Rating Scale (ALSFRS) including subscores for bulbar, fine motor, gross motor and respiratory symptoms, Timed-Up and Go Test (TUG), Chair-Rising Test (CRT), 10 Meter Walk Test (10MWT), Functional Ambulation Categories (FAC), Performance oriented Mobility Assessment (POMA), Berg Balance Scale (BBS), Functional Reach Test (FRT) and Short Form Health Survey (SF36).
The control group consisted of 12 healthy subjects with a mean age of 66 ± 8.8 years (± SD, seven female, five male) matched to patients’ age, sex, and height. Table 1 summarizes demographic and anthropometric data of ALS patients and healthy control subjects.
Table 1
Demographic and anthropometric data of the ALS and control group (CS)
| Group | ALS | CS |
| Age (years) | 65.9±9.3 (range 48-76) | 65.8±8.8 (range 49-75) |
| Weight (kg) | 73.5±16.5 | 77.3±12.4 |
| Height (cm) | 170.5±8.6 | 169.8±10.2 |
| BMI (kg/m²) | 25±4 | 26.7±2.6 |
Shown are mean values±standard deviations. BMI, body mass index.
The study was approved by the local Ethics Committee. All subjects gave written informed consent to the experimental procedures in accordance with the Declaration of Helsinki.
2.2Procedures
Postural control was measured on a custom-built motion platform (Fig. 1A). Subjects were told to stand on the platform in an upright (and natural) position with their feet within a marked area. To prevent falls, they held on to handles attached to ropes loosely hanging from the ceiling. The handles did not allow for any spatial reference (see Buettner, Dalin, Wiesmeier, & Maurer, 2017). Two trials of spontaneous sway and eight trials of perturbed stance were measured first with eyes open and second with eyes closed, respectively. Each trial took one minute.
Fig.1
(A) Schematic representation of the experimental setting. B-D show an averaged time course of ALS patients’ and control subjects’ (CS) upper (B) and lower body (C) during platform tilts with the stimulus profile presented in D.
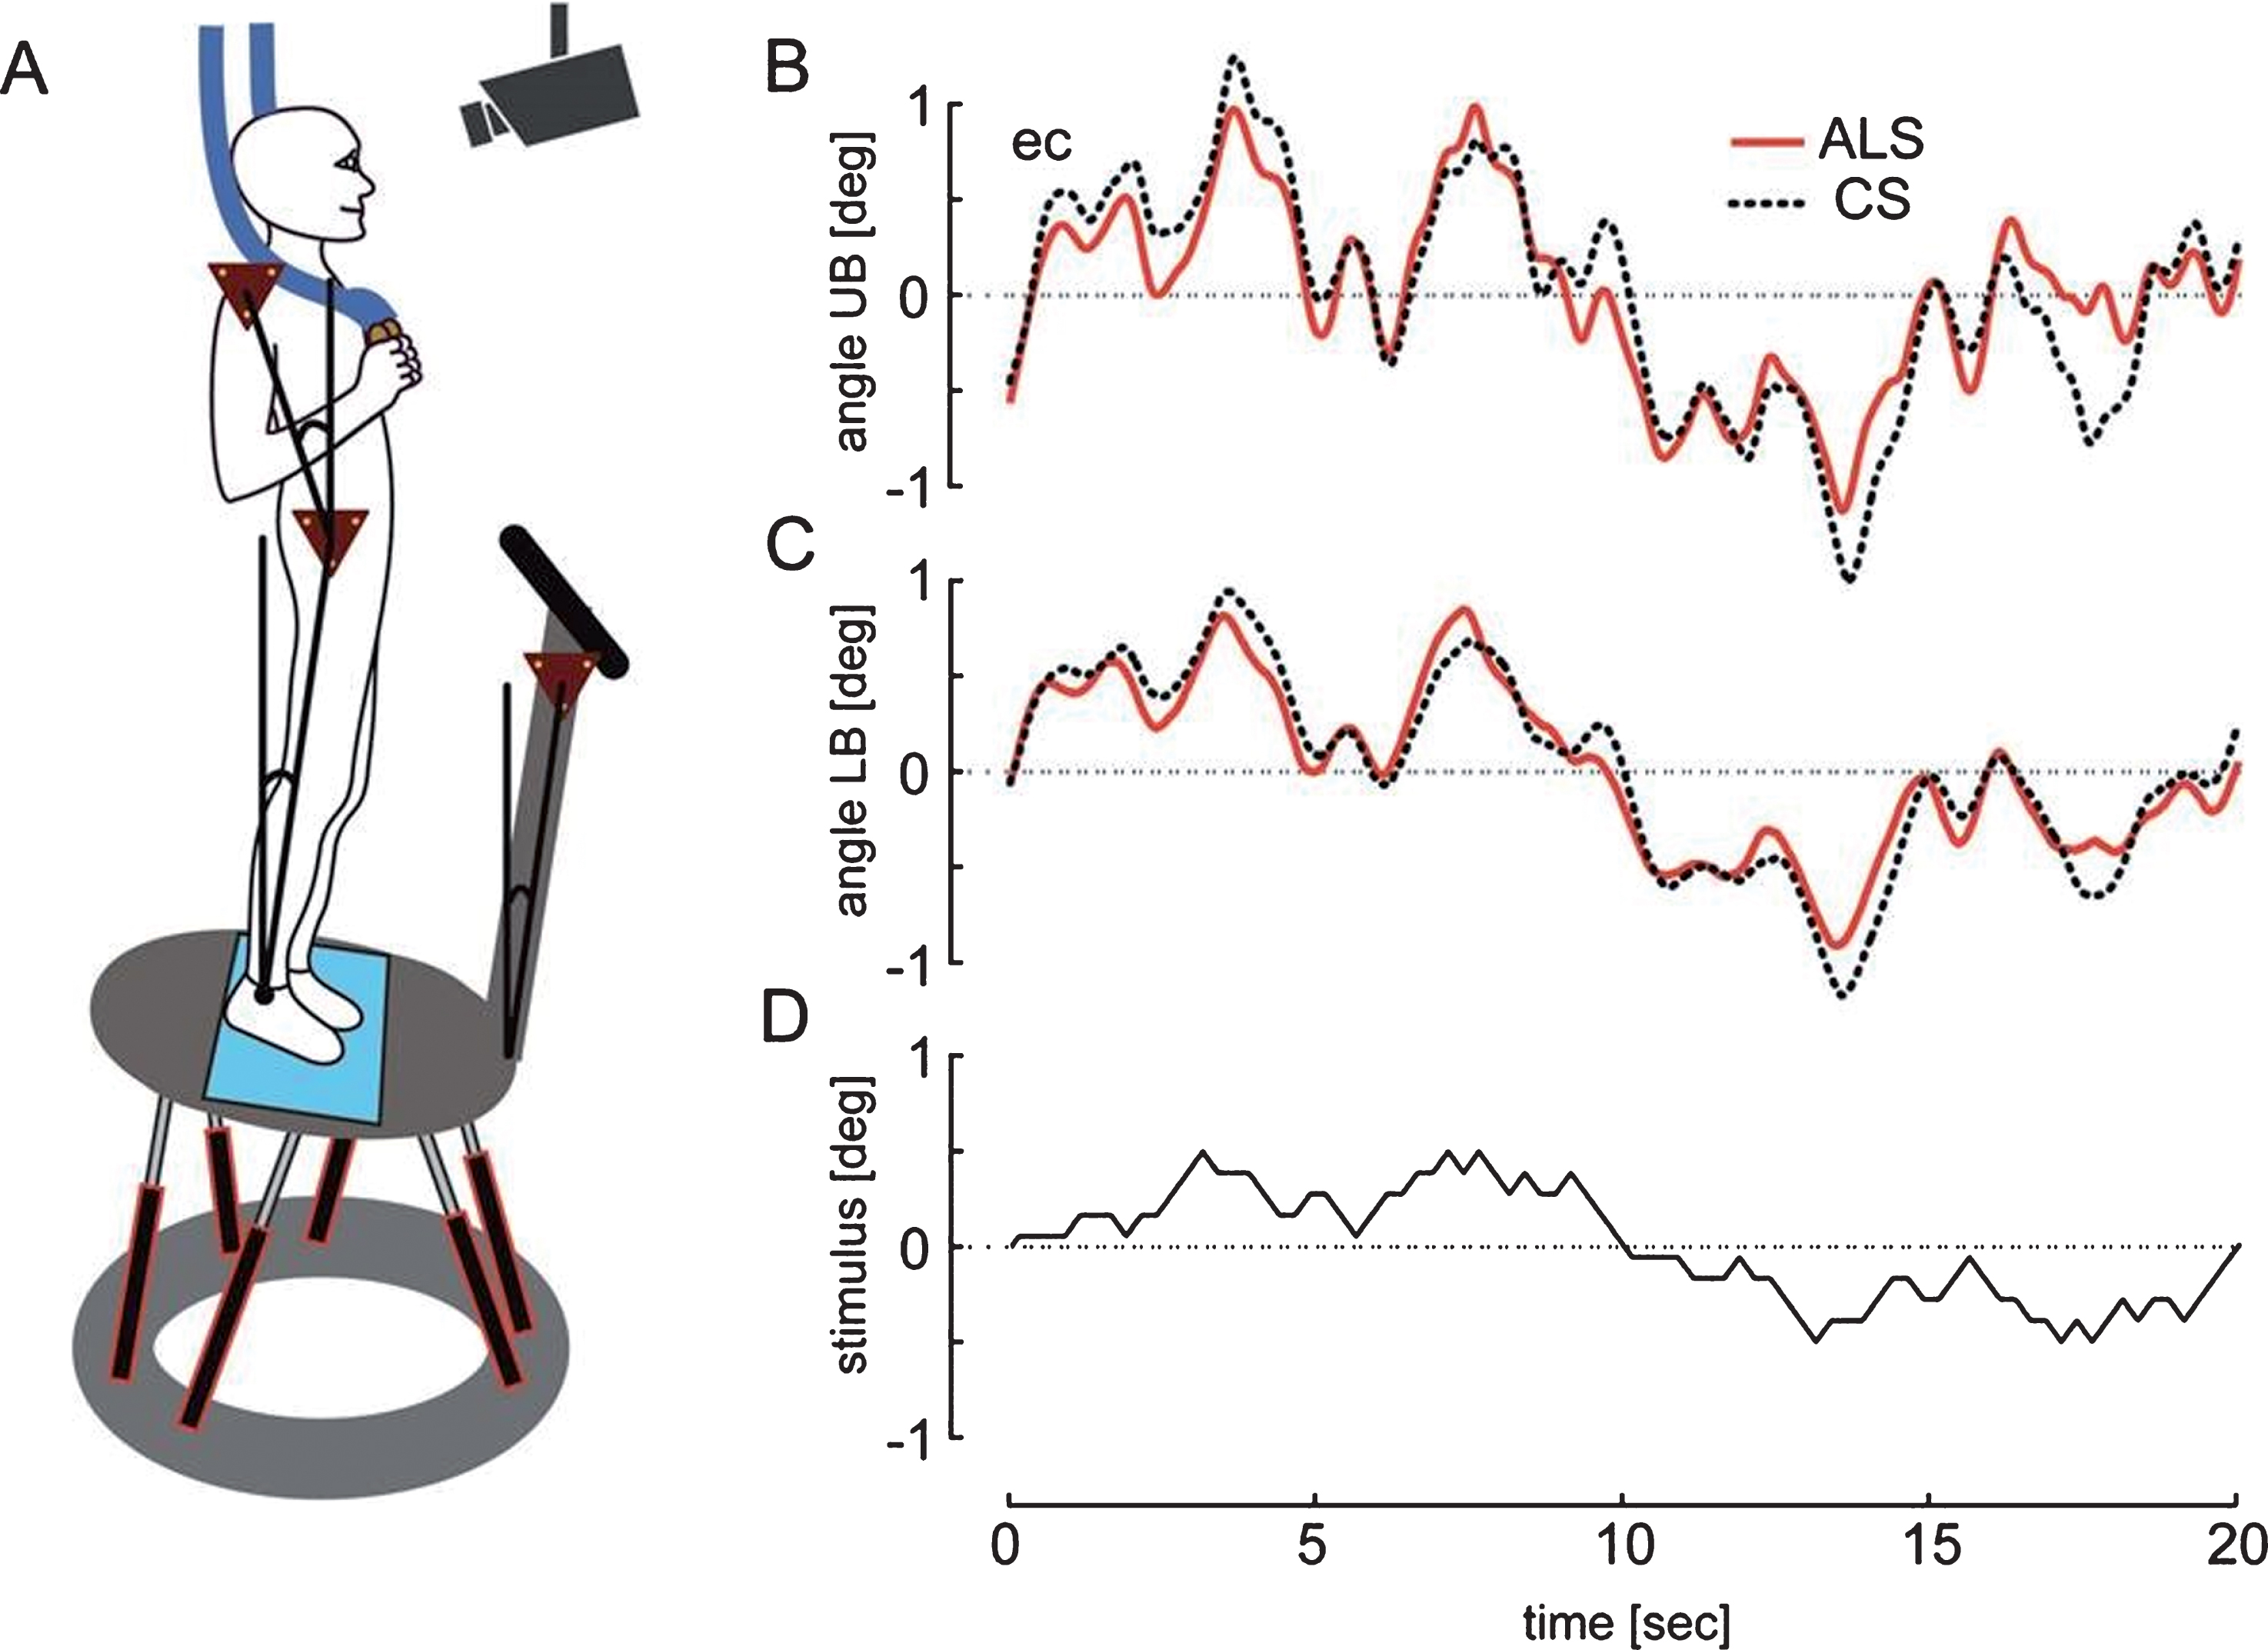
Stance was perturbed by rotational tilts of the moving platform in the sagittal plane with the axis passing through the subject’s ankle joints. Tilts followed a pseudorandom ternary sequence (PRTS, Fig. 1D). Two different stimulus amplitudes were used (peak-to-peak angular displacements of 0.5° and 1°).
For spontaneous sway, a force-transducing platform (Kistler platform type 9286, Winterthur, Switzerland) identified the center-of-pressure (COP) sway path. For spontaneous sway and perturbed stance, an optoelectronic device (Optotrak 3020, Waterloo, Canada), based on LED triangles attached to hip, shoulder and the platform, measured angular excursions of the upper and lower body (see Fig. 1B+C). The stimulus trajectories as well as Optotrak® and Kistler® output signals were recorded with software programmed in LabView® (National Instruments, Austin, Texas, USA).
2.3Data analyses
Data were analysed off-line with custom-made software programmed in MATLAB® (The MathWorks Inc., Natick, MA, USA). From the COP time course we calculated power spectra for sway amplitude and velocity and quantified Root Mean Square (RMS, sway amplitude), Mean Velocity (MV, sway velocity), and F95, the frequency below which 95% of the total power is found (see Prieto, Myklebust, Hoffmann, Lovett, & Myklebust, 1996).
For perturbed stance we calculated transfer functions between lower and upper body angular excursions and the platform angle using a discrete Fourier transform (Peterka, 2002). Gain and Phase curves were extracted from this stimulus-response data for a frequency range of 0.05–2.2 Hz. Gain shows the relationship between the external perturbation (platform angle) and the postural reaction (upper and lower body angle). For example, a gain value of one (unity) indicates that the body is perfectly following the platform excursion. Phase is the relative delay between the stimulus and the reaction of the body. Phase lag is indicated by negative Phase values representing delays.
To visualize differences between Gain curves of ALS patients and healthy subjects, we normalized Gain by dividing ALS patients’ Gain values by control subjects’ Gain values. Thus we obtained relative Gain values referred to as Gainfactor, GF (Fig. 3F). In addition, we added up the absolute values of the Gain differences between ALS patients and control subjects, irrespective of the sign of the difference, which yielded the sum of differences (Mean absolute error).
Moreover, we calculated the differences in the transfer functions between upper body (UB) and lower body (LB) represented by their respective Fourier transforms, again in terms of Gain and Phase (UB-LBdiff).
Statistical analyses were performed with Microsoft Excel, JMP® (SAS Institute Inc., Cary, NC, USA), and Statview (SAS Institute Inc., Cary, NC, USA). Normal distribution and homogeneity of variances were tested with the Kolmogorov-Smirnov test. The statistical significance was calculated with an analysis of variance (ANOVA) because we expected the outcome measures and experimental conditions to depend on each other. As within-subject factors for spontaneous sway we implemented sway direction, body segment and visual condition. The within-subject factors for perturbed stance were stimulus frequency, stimulus amplitude, body segment and visual condition. In addition, we tested the interaction between the above mentioned factors and the patient and control group. The relationship between the clinical assessments and spontaneous sway and perturbed stance measures was analysed with a Pearson Correlation Test. The level of statistical significance was set at p = 0.05.
3Results
3.1Spontaneous sway
ALS patients’ Root Mean Square (RMS) was significantly larger than control subjects’ RMS (F = 4.9, p = 0.030, Fig. 2A). Across both groups, RMS in anterior-posterior (ap) direction was significantly larger than in medio-lateral (ml) direction (F = 21; p < 0.0001). There were no significant interactions between group, visual condition, and body segments.
Fig.2
Measures of spontaneous sway in ALS patients and control subjects (CS). The figure shows patterns for the eyes open (eo) and eyes closed (ec) condition in anterior-posterior (ap) and medio-lateral (ml) direction for Root Mean Square, RMS (A), Mean Velocity, MV (B) and the frequency below which 95% of the total power is found, F95 (C). Given are mean values and inter-subject standard deviation values.
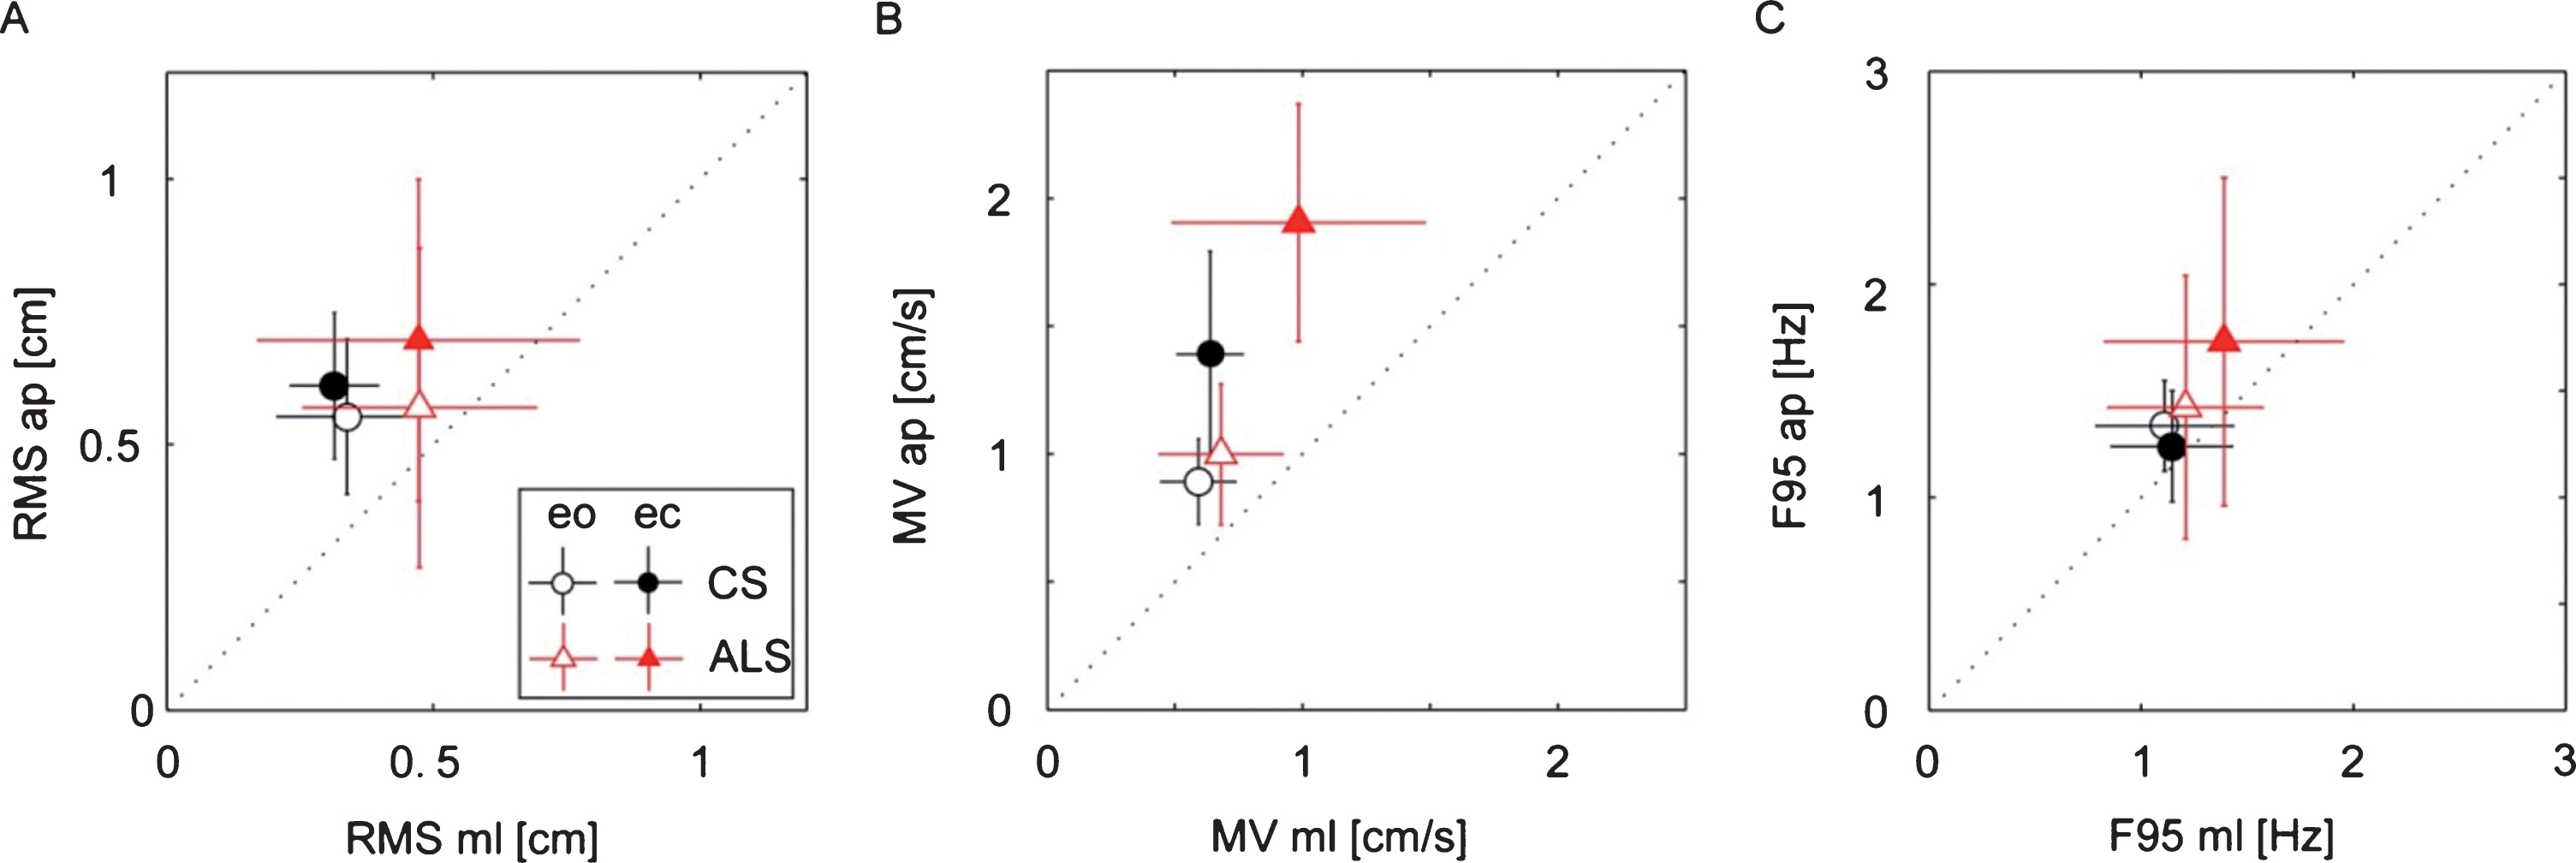
As with RMS, ALS patients’ Mean Velocity (MV) was significantly larger than control subjects’ MV (F = 13.9; p = 0.0003, see Fig. 2B). Again, the MV of both groups was larger in the ap direction than in the ml direction (F = 38.37, p < 0.0001). In addition, MV was significantly larger with eyes closed (ec) than with eyes open (eo; F = 38.37, p < 0.0001). Moreover, group and visual condition displayed a significant interaction, representing the fact that closing the eyes induced a larger increase of MV in ALS patients compared to the control subjects. (F = 5.5; p = 0.021).
The upper frequency limit of ALS patients’ sway spectrum, represented by the 95% cut-off frequency value (F95, indicating that 95% of the power was below this value), was significantly larger compared to the F95 of the control subjects (F = 6.03; p = 0.0160, Fig. 2C). Again, F95 was in both groups larger in the ap than in the ml direction (F = 5.44, p < 0.0219). There were no significant interactions between group, sway direction and visual condition.
3.2Perturbed stance
Gain was significantly smaller in ALS patients than in control subjects (F = 18.4, p = 0.0001), meaning that the perturbation-induced body sway is less pronounced in patients than in control subjects. In general, Gain significantly depended on stimulus frequencies (F = 399, p < 0.0001), stimulus amplitudes (0.5°>1°; F = 103, p = 0.0001), visual conditions (eo < ec; F = 316, p = 0.0001), and body segments (UB > LB; F = 645; p = 0.0001). We observed a significant interaction between group designation and visual condition (F = 7.13; p = 0.0076, Fig. 3C) representing the almost similar Gain values in ALS patients and control subjects with eyes open as opposed to the larger Gain differences with eyes closed (larger increase of Gain in control subjects). Moreover, group designation significantly interacted with stimulus frequency (see Fig. 3A; F = 7.47; p = 0.0001), based mainly on the larger Gain difference between groups with low frequencies. There was no significant interaction between group designation and stimulus amplitude (Fig. 3D).
Fig.3
(A) Gain and (B) Phase of ALS patients’ and control subjects’ (CS) transfer functions plotted against stimulus frequency. (C) Mean Gain values for both visual conditions: eyes open (eo) and eyes closed (ec). (D) Mean Gain values for both stimulus amplitudes: 0.5° and 1°. (E) Upper-lower body difference (UB-LBdiff) Gain of the ALS patients and control subjects. (F) GF, Gainfactor (= ALS patients’ Gain with respect to control subjects’ Gain) as a function of stimulus frequency. Note that Mean absolute error is the sum of the absolute values of the Gain differences between ALS patients and control subjects. The error bars represent 95% confidence intervals.
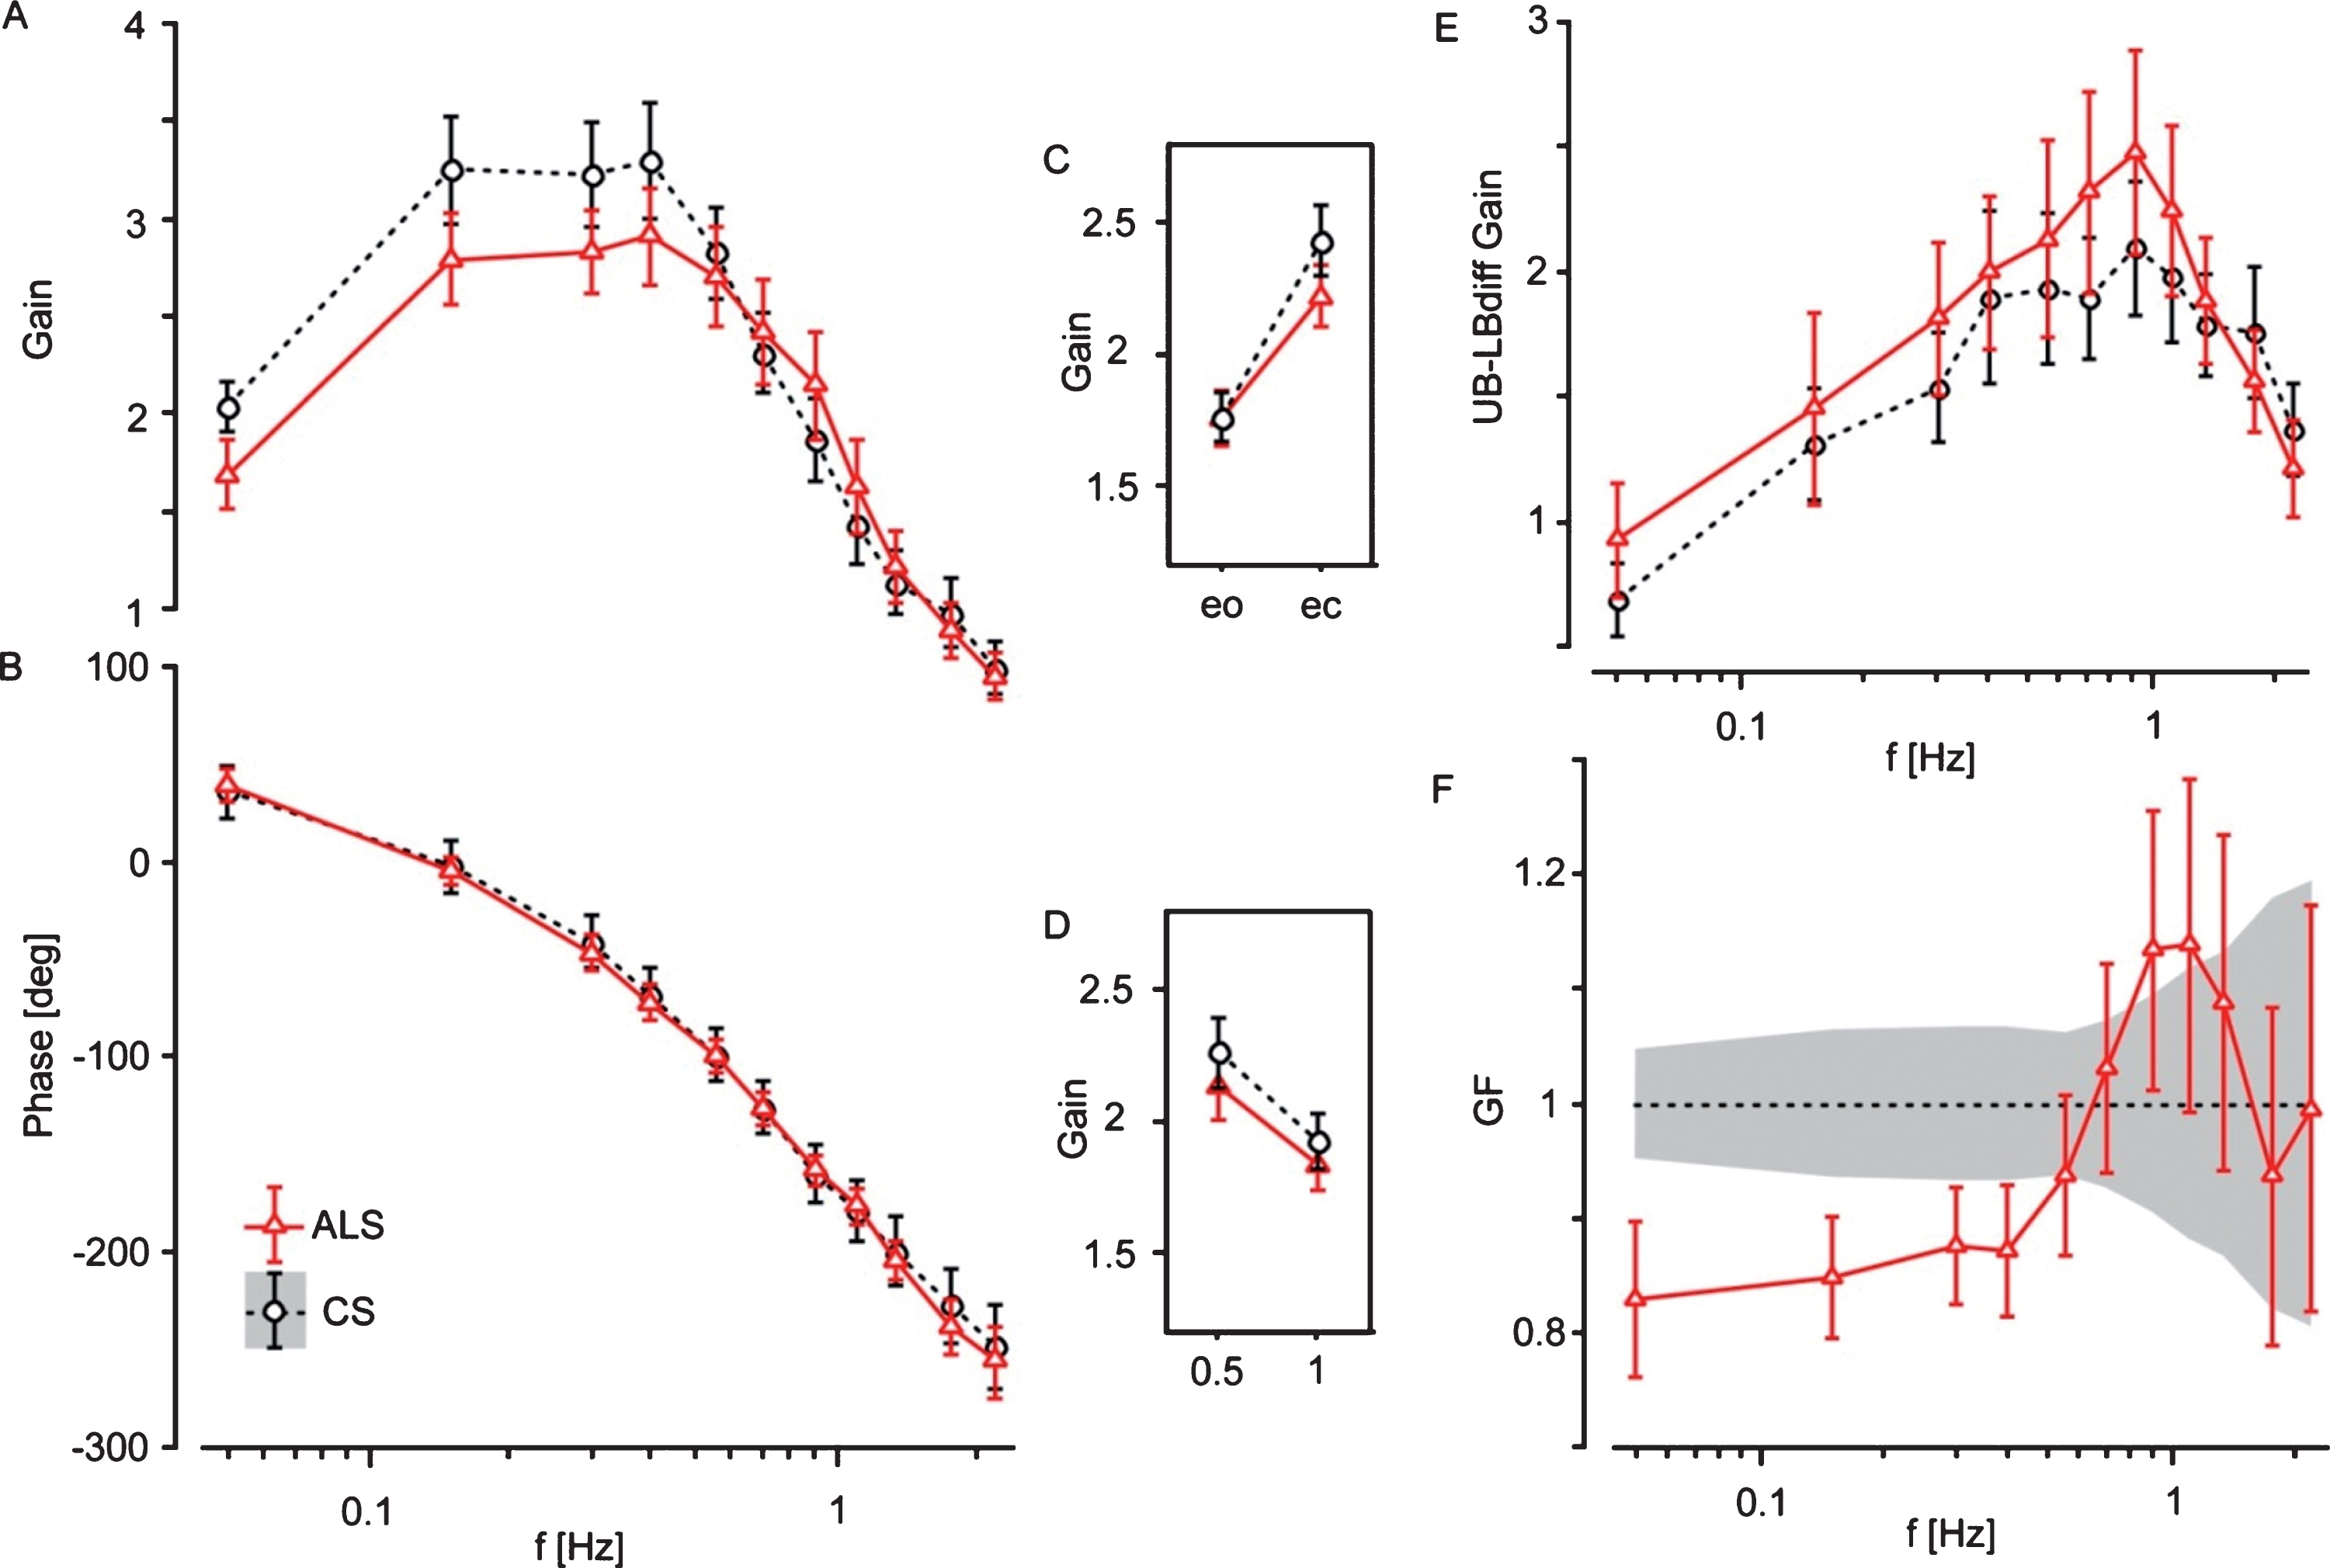
There was no significant difference in Phase between ALS patients and control subjects (Fig. 3B). Across both groups, Phase lag was significantly larger with larger frequencies (F = 661; p < 0.0001), eyes open as compared to eyes closed (F = 5.1; p = 0.024), and upper as compared to lower body (F = 210; p < 0.0001).
ALS patients’ Gain distortion with respect to control subjects is shown in Fig. 3F (Gainfactor, GF). The sum of the absolute values of the Gain differences (Mean absolute error) between ALS patients and the control subjects’ mean was clearly larger in the ALS patients (F = 79.63, p = 0.0001), and more pronounced than the raw Gain difference (F = 18.4).
The difference between Gain values of the upper and lower body (UB-LBdiff Gain, Fig. 3E) was significantly larger in ALS patients than in control subjects (F = 7.56, p = 0.0061), based on the fact that the motion of the upper body with respect to the lower body was more pronounced in ALS patients compared to control subjects. As with Gain, UB-LBdiff Gain significantly depended on stimulus frequencies (F = 20.2; p = 0.0001), stimulus amplitudes (F = 13.7, p = 0.0002) and visual conditions (F = 49.3; p = 0.0001). Group designation significantly interacted with visual condition (F = 6.70; p = 0.0068). This represents the fact that the increase in UB-LBdiff Gain by closing the eyes was significantly lower in ALS patients (eo 1.69; ec 1.94) than in control subjects (eo 1.37; ec 1.94). UB-LBdiff Phase did not significantly differ between ALS patients and control subjects.
3.3Clinical tests
Whereas some clinical assessments were abnormal in most ALS patients (ALSFRS: mean 29.6, healthy 40; 10 MWT: mean 7.3 s, healthy < 5.4 s; CRT: mean 18.4 s, healthy < 15 s; FAC: mean 4.6, healthy 5), others were basically in the normal range (TUG: mean 9.1 s, healthy < 14 s; POMA: mean 25.6, healthy > 20; BBS: mean 51.8, healthy > 45; FRT: mean 27 cm, healthy > 15 cm). Given are mean values of our ALS patients and values of healthy subjects from the literature (see Table 2).
Table 2
Clinical assessments of ALS patients
| Patient | ALSFRS | Bulb | FM | GM | Resp | TUG | CRT | 10MWT | FAC | POMA | BBS | FRT | SF36 |
| (=40) | (=12) | (=12.8) | (=9.6) | (=3.6) | (<14 s) | (<15 s) | (<5.4 s) | (=5) | (>20) | (>45) | (>15 cm) | ||
| P01 | 32 | 9.3 | 10.5 | 7.2 | 3.6 | 7.4 | 15.0 | 6.11 | 4 | 25 | 53 | 33.7 | 56.9 |
| P02 | 26 | 8.4 | 8.7 | 7.2 | 0.9 | 11.0 | 17.0 | 5.69 | 4 | 25 | 50 | 31.7 | 34.8 |
| P03 | 27 | 11.7 | 7.4 | 4.8 | 2.7 | 12.3 | 27.6 | 10.68 | 4 | 22 | 48 | 27.3 | 31.6 |
| P04 | 36 | 12.0 | 9.4 | 9.6 | 3.6 | 6.3 | 16.8 | 5.87 | 5 | 28 | 56 | 36.3 | 65.8 |
| P05 | 26 | 4.5 | 8.8 | 9.0 | 2.7 | 6.3 | 10.0 | 7.10 | 5 | 28 | 56 | 28.3 | 59.1 |
| P06 | 26 | 9.0 | 7.9 | 5.4 | 2.7 | 18.6 | 53.0 | 12.70 | 4 | 24 | 47 | 4.0 | 23.9 |
| P07 | 32 | 10.8 | 10.5 | 7.2 | 2.7 | 8.1 | 11.9 | 5.61 | 4 | 26 | 52 | 44.0 | 47.8 |
| P08 | 31 | 12.0 | 8.7 | 5.4 | 3.6 | 9.8 | 18.4 | 9.52 | 5 | 23 | 48 | 13.3 | 49.2 |
| P09 | 30 | 9.3 | 11.0 | 7.8 | 0.9 | 6.8 | 11.0 | 6.76 | 5 | 25 | 50 | 35.3 | 40.4 |
| P10 | 30 | 11.7 | 7.0 | 7.2 | 2.7 | 5.5 | 9.6 | 4.47 | 5 | 27 | 55 | 20.0 | 39.4 |
| P11 | 28 | 6.0 | 10.4 | 7.2 | 1.8 | 10.2 | 20.8 | 7.64 | 5 | 26 | 52 | 20.3 | 40.7 |
| P12 | 31 | 12.0 | 4.9 | 9.6 | 3.6 | 6.5 | 9.7 | 5.53 | 5 | 28 | 55 | 29.3 | 70.6 |
| Mean | 29.6 | 9.7 | 8.8 | 7.3 | 2.6 | 9.1 | 18.4 | 7.31 | 4.6 | 25.6 | 51.8 | 27.0 | 46.7 |
| SD | 3.1 | 2.5 | 1.8 | 1.6 | 1.0 | 3.7 | 12.1 | 2.45 | 0.5 | 2.0 | 3.2 | 11.0 | 14.2 |
Shown are mean values (Mean) and standard deviations (SD). Values of healthy subjects are given in brackets for the ALS Functional Rating Scale (ALSFRS) including subscores (Cedarbaum & Stambler, 1997) as well as cutoff values for the Timed-Up and Go test (TUG; (Montes et al., 2007)), the Chair-Rising Test (CRT; (Buatois et al., 2010)), the 10 Meter Walk Test (10MWT; (Bohannon, 1997)), the Functional Ambulation Categories (FAC; (Mehrholz, Wagner, Rutte, Meiβner, & Pohl, 2007)), the Performance oriented Mobility Assessment (POMA; (Köpke & Meyer, 2006)), the Berg Balance Scale (BBS; (Berg, Wood-Dauphinee, Williams, & Maki, 1992)), and the Functional Reach Test (FRT; (Duncan, Weiner, Chandler, & Studenski, 1990)). Bulb, ALSFRS subscore Bulbar; FM, ALSFRS subscore Fine Motor; GM, ALSFRS subscore Gross Motor; Resp, ALSFRS subscore Respiratory; SF36, Short Form Health Survey.
3.4Correlation with clinical assessments
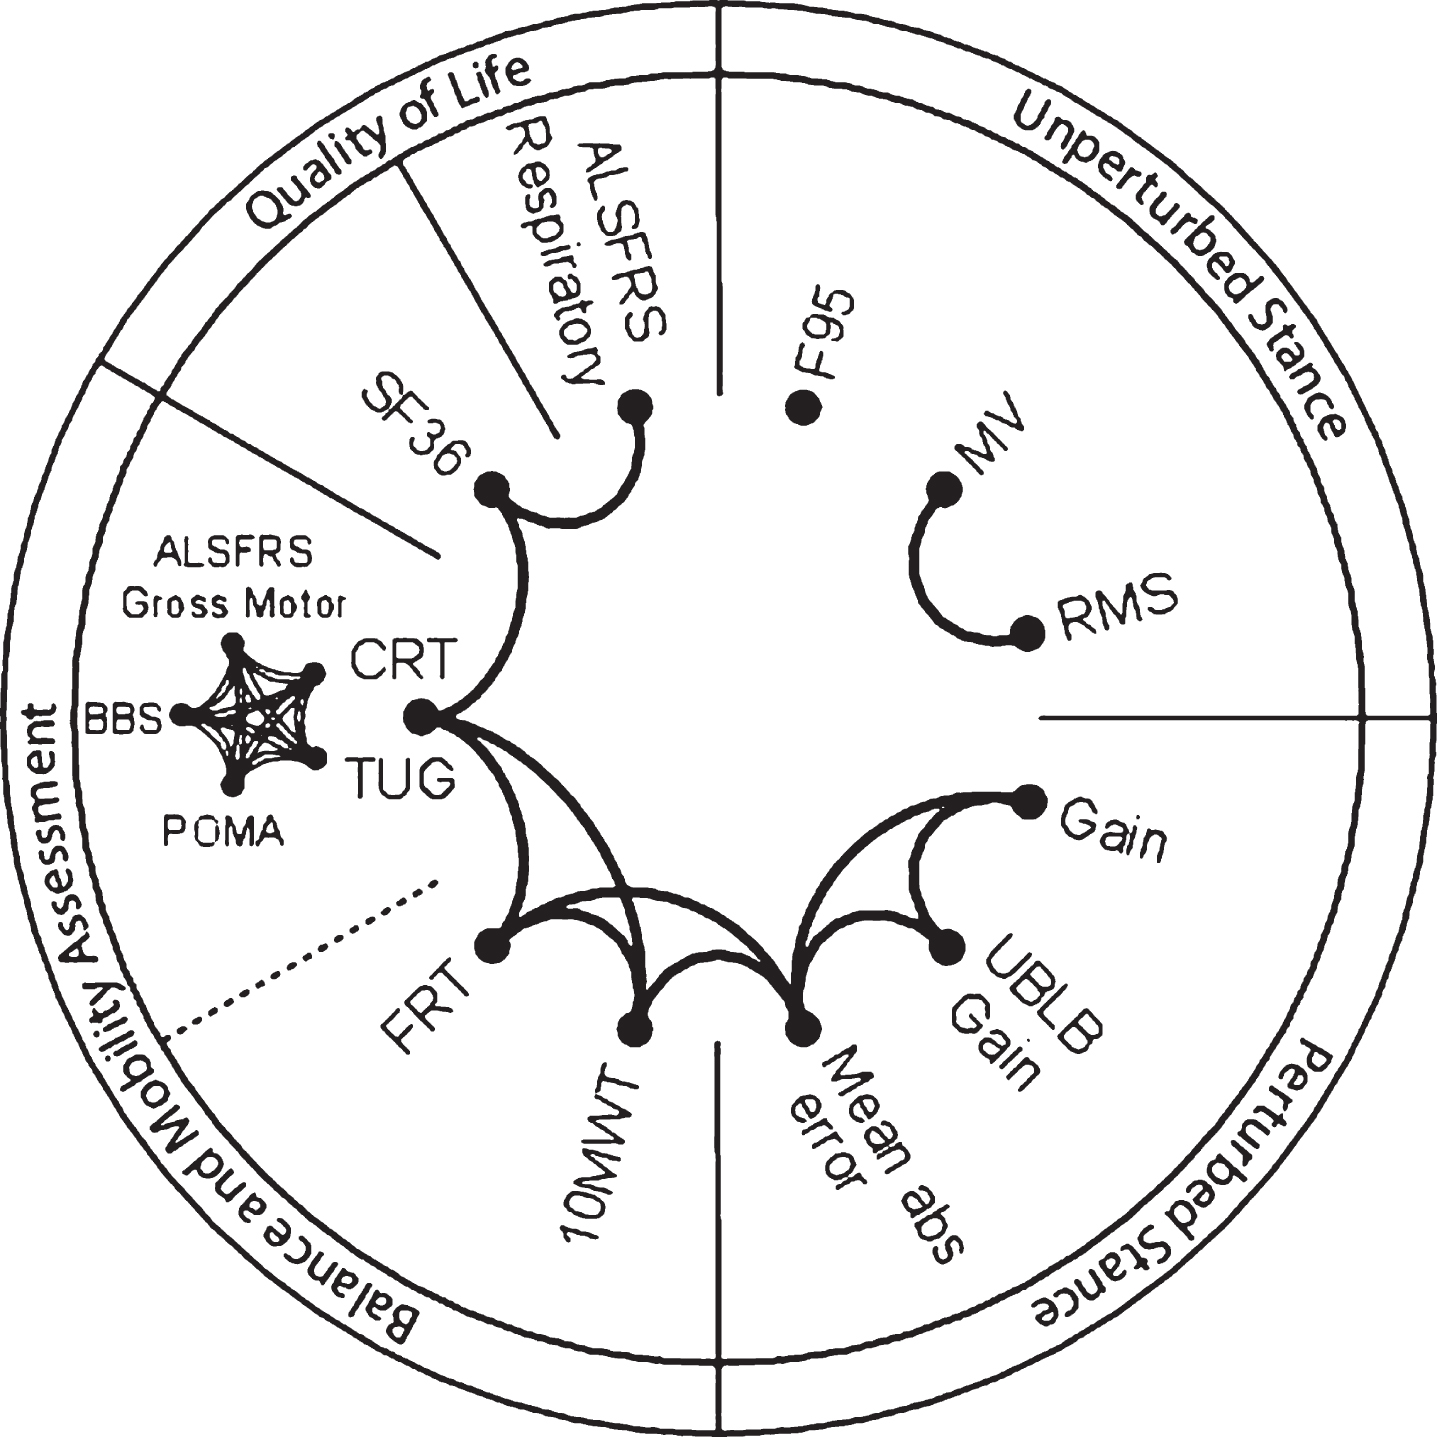
We correlated the measures of postural control with clinical test scores in order to show the relationship between postural control and other parameters of motor behaviour. The correlation analysis of the results of clinical assessments and spontaneous sway and perturbed stance measures revealed different groups of parameters that all correlated significantly with each other (p < 0.05, Fig. 4). We found high correlations between clinical tests representing motor deficits (ALSFRS Gross Motor, TUG, CRT, POMA, BBS). Moreover, that group of clinical tests correlated significantly with the FRT, 10MWT, SF36, and ALSFRS Respiratory. Interestingly, measures of spontaneous sway (RMS and MV) strongly correlated with each other, but revealed no correlation with clinical assessment scales or measures of perturbed stance. However, Mean absolute error, which serves as a measure of Gain distortion in ALS, correlated significantly with the balance scales 10 MWT and FRT. Moreover, Mean absolute error correlated with the upper versus lower body strategy represented by UB-LBdiff Gain.
Fig.4
Drawing of inter-relationships among sway measures and clinical parameters. Lines connecting different parameters indicate a significant correlation (p < 0.0001 to p = 0,049). Divided labels represent aggregated groups of parameters. F95, the frequency below which 95% of the total power is found; MV, Mean Velocity; RMS, Root Mean Square; UB-LBdiff Gain, differences in Gain between upper body (UB) and lower body (LB); Mean abs error, Mean absolute error; 10MWT, 10 Meter Walk Test; FRT, Functional Reach Test; TUG, Timed-Up and Go; CRT, Chair-Rising Test; BBS, Berg Balance Scale; POMA, Performance oriented Mobility Assessment; ALSFRS, ALS Functional Rating Scale; SF36, Short Form Health Survey.
4Discussion
Displacement-related (RMS) as well as velocity-related (MV), and frequency-related (F95) measures of spontaneous sway were significantly larger in ALS patients than healthy control subjects. So far, only two studies dealt with spontaneous sway in ALS patients (Nardone et al., 2001; Sanjak et al., 2014). Both studies focused on displacement-related parameters and did not observe any differences between ALS patients and healthy subjects with eyes open or closed. This is most likely due to different patient samples. Our patients were more severely affected, scored lower in clinical balance scales, and were older than the patients in the other studies.
In previous work of our group (Maurer & Peterka, 2005) and others (Prieto et al., 1996; Maki, Holliday, & Fernie, 1990; Ruhe, Fejer, & Walker, 2010; Delignières, Torre, & Bernard, 2011; Moghadam et al., 2011), higher MV, as found here, was interpreted as a greater regulatory balancing activity. In addition, the higher upper cut-off value of the frequency range (F95 = frequency below which 95% of the total power is found) of ALS patients compared to control subjects might additionally explain a larger MV in ALS. Mean Velocity differed from other spontaneous sway parameters as the group effect interacted significantly with the visual conditions. Mean Velocity rose abnormally in ALS patients to about 72% when closing the eyes, whereas this increase amounted to only 27% in control subjects, well within the standard range (e.g. Prieto et al., 1996; Accornero, Capozza, Rinalduzzi, & Manfredi, 1997). The abnormal increase may point to the impairment of central sensory weighting mechanisms.
Measures of spontaneous sway (RMS and MV) did not correlate well with clinical assessments. Interestingly, the group of Nardone et al., (2001) observed no correlation between spontaneous body sway and clinical findings, either (muscle tone and strength, tendon reflexes, disease duration etc.). The fact that clinical assessments don’t correlate with measures of spontaneous sway suggests that measures of spontaneous sway (unlike measures of perturbed stance) represent more general features of postural control (e.g. fear of falling, training state, etc. (Adkin, Frank, Carpenter, & Peysar, 2000)). In contrast to the former studies that focused on spontaneous sway measures (Nardoneet al., 2001; Sanjak et al., 2014), we generated transfer functions of ALS patients’ postural reactions to external perturbations, i.e. pseudorandom platform tilts. These transfer functions served as a basis for more refined postural control parameters (Mean absolute error, UB-LBdiff). There is increasing evidence that transfer functions yield the most reliable information on the postural control system (van der Kooij & Peterka, 2011; Engelhart et al., 2014; Pasma et al., 2014).
ALS patients’ Gain distortion was formalized as the sum of the absolute differences between respective ALS patients and control subjects’ Gain values (Mean absolute error). Mean absolute error turned out to be the most sensitive measurement to distinguish ALS patients’ and control subjects’ postural control behaviour. To date, we have not observed this specific Gain distortion in any other condition associated with aging, muscle weakness, spasticity, extrapyramidal disorder, or afferent deficits involving the vestibular or the proprioceptive system (see e.g. Wiesmeier et al., 2017; Kammermeier et al., 2018). Further studies are needed to determine whether Mean absolute error can serve as sensitive and specific measure of ALS-type deficits in the future.
Measures derived from perturbed stance (Gain, Mean absolute error, UB-LBdiff Gain), directly or indirectly correlated with clinical parameters that represent ALS patients’ motor deficits (ALSFRS, TUG, CRT, POMA, BBS, FRT, 10MWT) indicating that they more accurately reflect ALS patients’ primary deficit. Specifically, the FRT and 10MWT correlated closely with Mean absolute error which, in turn, best represents postural abnormalities of platform measurements in ALS patients. Interestingly, some of the clinical parameters (TUG, POMA, BBS, FRT) of ALS patients were clearly within the normal range. This shows that the usefulness of these parameters as indicators for the disease severity is not limited to certain threshold values.
The Gain distortion seen in ALS patients reflects a frequency shift towards higher frequencies. This occurs if the upper body contributes to a relatively larger degree to overall body excursion. Upper body excursions with respect to the lower body (UB-LBdiff Gain) were in fact significantly larger in ALS patients than in control subjects. Moreover, mean absolute error significantly correlated with UB-LBdiff Gain, reproducing the notion that ALS patients’ abnormal upper body behaviour is closely related to the Gain distortion. This indicates a different axial body control in ALS, as has already been examined in ALS patients with neck weakness (Gourie-Devi, Nalini, & Sandhya, 2003; Nakamura et al., 2013). However, we deem it unlikely that this abnormal axial control is solely attributable to muscle weakness since it vanishes with open eyes. Instead, we suggest that ALS patients display a different central control strategy.
This seems to be in contradiction to findings reported by the group of Sanjak et al., (2014), who tested body sway amplitudes using the Sensory Organization Test (SOT (Nashner et al., 1982)). They found larger body sway in ALS patients compared to healthy control subjects when applying a proprioceptive disturbance via platform sway referencing with eyes closed. The group of Sanjak et al., (2014) interpreted their results in terms of a vestibular deficit in ALS patients. In our opinion, their findings are also in line with our interpretation of impaired axial motor control in ALS. In contrast to the vestibular deficit suggested by Sanjak et al., (2014) and other authors (Steinmetz et al., 1974; Ohki et al., 1994), we found a lower Gain in ALS with eyes closed as compared to healthy control subjects indicating a pronounced use of vestibular information (Engelhart et al., 2014; Peterka, 2002). In addition, larger and faster spontaneous body sway (RMS, MV, see above) support the hypothesis of more prominent vestibular information due to a higher internal sensory noise (Mergner, Nasios, Maurer, & Becker, 2001). Gain values were lower at a stimulus amplitude of 1° than of 0.5° in both ALS patients and control subjects, pointing to an unimpaired sensory re-weighting process as a function of stimulus amplitude in ALS patients.
We conclude that ALS patients’ postural abnormalities are best explained by altered central control mechanisms resulting in too small body excursions as a function of platform tilts and a different axial control. These postural abnormalities closely correlate with clinical parameters and, therefore, may function as a sensitive indicator for ALS disease severity. As a therapeutic consequence, therapy for ALS patients should incorporate postural training with a focus on axial control.
5Limitations
Limitations of this study could be the small sample size of 12 patients and 12 healthy control subjects which might influence the statistical power. In addition, the healthy control subjects were matched according to patients’ age, sex, and height, which might bias the data. However, we hold that the aim of this study was to analyse the underlying mechanisms of postural impairments compared to healthy people, rather than to test an intervention.
Conflict of interest
The authors declare that there is no conflict of interest.
Acknowledgments
This work was supported by the European Union FP7, project EMBALANCE (grant number 610454); the Brainlinks-Braintools Cluster of Excellence funded by the German Research foundation (DFG; grant number ADV139), and the German Research foundation (DFG; grant number MA 2543/3-1.1).
References
1 | Accornero N. , Capozza M. , Rinalduzzi S. , & Manfredi G.W. ((1997) ). Clinical multisegmental posturography: Age-related changes in stance control. Electroencephalography and Clinical Neurophysiology, 105: (3), 213–219. |
2 | Adkin A.L. , Frank J.S. , Carpenter M.G. , & Peysar G.W. ((2000) ). Postural control is scaled to level of postural threat. Gait & Posture, 12: (2), 87–93. |
3 | Berg K.O. , Wood-Dauphinee S.L. , Williams J.I. , & Maki B. ((1992) ). Measuring balance in the elderly: Validation of an instrument. Canadian Journal of Public Health=Revue Canadienne De Santé Publique, 83: (Suppl 2), S7–11. |
4 | Bohannon R.W. ((1997) ). Comfortable and maximum walking speed of adults aged 20-79 years: Reference values and determinants. Age and Ageing, 26: (1), 15–19. |
5 | Brooks B.R. , Miller R.G. , Swash M. , Munsat T.L. , & World Federation of Neurology Research Group on Motor Neuron Diseases. ((2000) ). El Escorial revisited: Revised criteria for the diagnosis of amyotrophic lateral sclerosis. Amyotrophic Lateral Sclerosis and Other Motor Neuron Disorders: Official Publication of the World Federation of Neurology, Research Group on Motor Neuron Diseases, 1: (5), 293–299. |
6 | Buatois S. , Perret-Guillaume C. , Gueguen R. , Miget P. , Vançon G. , Perrin P. , & Benetos A. ((2010) ). A simple clinical scale to stratify risk of recurrent falls in community-dwelling adults aged 65 years and older. Physical Therapy, 90: (4), 550–560. https://doi.org/10.2522/ptj.20090158 |
7 | Buettner D. , Dalin D. , Wiesmeier I.K. , & Maurer C. ((2017) ). Virtual Balancing for Studying and Training Postural Control. Frontiers in Neuroscience, 11: , 531. https://doi.org/10.3389/fnins.2017.00531 |
8 | Cedarbaum J.M. , & Stambler N. ((1997) ). Performance of the Amyotrophic Lateral Sclerosis Functional Rating Scale (ALSFRS) in multicenter clinical trials. Journal of the Neurological Sciences, 152: (Suppl 1), S1–9. |
9 | D’Ascenzo C. , Cecchin D. , Santelli L. , Palmieri A. , Gaiani A. , Querin G. ,... Sorarù G. ((2012) ). Parkinson-like features in ALS with predominant upper motor neuron involvement. Amyotrophic Lateral Sclerosis: Official Publication of the World Federation of Neurology Research Group on Motor Neuron Diseases, 13: (1), 137–143. https://doi.org/10.3109/17482968.2011.603732 |
10 | Delignières D. , Torre K. , & Bernard P.-L. ((2011) ). Transition from persistent to anti-persistent correlations in postural sway indicates velocity-based control. PLoS Computational Biology, 7: (2), e1001089. https://doi.org/10.1371/journal.pcbi.1001089 |
11 | Duncan P.W. , Weiner D.K. , Chandler J. , & Studenski S. ((1990) ). Functional reach: A new clinical measure of balance. Journal of Gerontology, 45: (6), M192–197. |
12 | Engelhart D. , Pasma J.H. , Schouten A.C. , Meskers C.G. M. , Maier A.B. , Mergner T. , & van der Kooij H. ((2014) ). Impaired standing balance in elderly: A new engineering method helps to unravel causes and effects. Journal of the American Medical Directors Association, 15: (3), 227.e1–6. https://doi.org/10.1016/j.jamda.2013.09.009 |
13 | Geser F. , Brandmeir N.J. , Kwong L.K. , Martinez-Lage M. , Elman L. , McCluskey L. ,... Trojanowski J.Q. ((2008) ). Evidence of multisystem disorder in whole-brain map of pathological TDP-43 in amyotrophic lateral sclerosis. Archives of Neurology, 65: (5), 636–641. https://doi.org/10.1001/archneur.65.5.636 |
14 | Gourie-Devi M. , Nalini A. , & Sandhya S. ((2003) ). Early or late appearance of “dropped head syndrome” in amyotrophic lateral sclerosis. Journal of Neurology, Neurosurgery, and Psychiatry, 74: (5), 683–686. |
15 | Grossman M. , Elman L. , McCluskey L. , McMillan C.T. , Boller A. , Powers J. , Trojanowski J.Q. ((2014) ). Phosphorylated tau as a candidate biomarker for amyotrophic lateral sclerosis. JAMA Neurology, 71: (4), 442–448. https://doi.org/10.1001/jamaneurol.2013.6064 |
16 | Jette D.U. , Slavin M.D. , Andres P.L. , & Munsat T.L. ((1999) ). The relationship of lower-limb muscle force to walking ability in patients with amyotrophic lateral sclerosis. Physical Therapy, 79: (7), 672–681. |
17 | Kammermeier S. , Maierbeck K. , Dietrich L. , Plate A. , Lorenzl S. , Singh A. ,... Maurer C. ((2018) ). Qualitative postural control differences in Idiopathic Parkinson’s Disease vs. Progressive Supranuclear Palsy with dynamic-on-static platform tilt. Clinical Neurophysiology. https://doi.org/10.1016/j.clinph.2018.03.002 |
18 | Kloos A.D. , Bello-Haas V.D. , Thome R. , Cassidy J. , Lewis L. , Cusma T. , & Mitsumoto H. ((2004) ). Interrater and Intrarater Reliability of the Tinetti Balance Test for Individuals with Amyotrophic Lateral Sclerosis:. Journal of Neurologic Physical Therapy, 28: (1), 12–19. https://doi.org/10.1097/01.NPT.0000284773.87060.c8 |
19 | Köpke S. , & Meyer G. ((2006) ). The Tinetti test: Babylon in geriatric assessment. Zeitschrift Für Gerontologie Und Geriatrie, 39: (4), 288–291. https://doi.org/10.1007/s00391-006-0398-y |
20 | Maki B.E. , Holliday P.J. , & Fernie G.R. ((1990) ). Aging and postural control. A comparison of spontaneous- and induced-sway balance tests. Journal of the American Geriatrics Society, 38: (1), 1–9. |
21 | Maurer C. , & Peterka R.J. ((2005) ). A new interpretation of spontaneous sway measures based on a simple model of human postural control. Journal of Neurophysiology, 93: (1), 189–200. https://doi.org/10.1152/jn.00221.2004 |
22 | Mehrholz J. , Wagner K. , Rutte K. , Meiβner D. , & Pohl M. ((2007) ). Predictive Validity and Responsiveness of the Functional Ambulation Category in Hemiparetic Patients After Stroke. Archives of Physical Medicine and Rehabilitation, 88: (10), 1314–1319. https://doi.org/10.1016/j.apmr.2007.06.764 |
23 | Mergner T. , Nasios G. , Maurer C. , & Becker W. ((2001) ). Visual object localisation in space, Interaction of retinal, eye position, vestibular and neck proprioceptive information, 33–51. |
24 | Moghadam M. , Ashayeri H. , Salavati M. , Sarafzadeh J. , Taghipoor K.D. , Saeedi A. , & Salehi R. ((2011) ). Reliability of center of pressure measures of postural stability in healthy older adults: Effects of postural task difficulty and cognitive load. Gait & Posture, 33: (4), 651–655. https://doi.org/10.1016/j.gaitpost.2011.02.016 |
25 | Montes J. , Cheng B. , Diamond B. , Doorish C. , Mitsumoto H. , & Gordon P.H. ((2007) ). The Timed Up and Go test: Predicting falls in ALS. Amyotrophic Lateral Sclerosis:Official Publication of the World Federation of Neurology Research Group on Motor Neuron Diseases, 8: (5), 292–295. https://doi.org/10.1080/17482960701435931 |
26 | Nakamura R. , Atsuta N. , Watanabe H. , Hirakawa A. , Watanabe H. , Ito M. ,... Sobue G. ((2013) ). Neck weakness is a potent prognostic factor in sporadic amyotrophic lateral sclerosis patients. Journal of Neurology, Neurosurgery, and Psychiatry, 84: (12), 1365–1371. https://doi.org/10.1136/jnnp-2013-306020 |
27 | Nardone A. , Galante M. , Lucas B. , & Schieppati M. ((2001) ). Stance control is not affected by paresis and reflex hyperexcitability: The case of spastic patients. Journal of Neurology, Neurosurgery, and Psychiatry, 70: (5), 635–643. |
28 | Nashner L.M. , Black F.O. , & Wall C. ((1982) ). Adaptation to altered support and visual conditions during stance: Patients with vestibular deficits. The Journal of Neuroscience: The Official Journal of the Society for Neuroscience, 2: (5), 536–544. |
29 | Ohki M. , Kanayama R. , Nakamura T. , Okuyama T. , Kimura Y. , & Koike Y. ((1994) ). Ocular abnormalities in amyotrophic lateral sclerosis. Acta Oto-Laryngologica Supplementum, 511: , 138–142. |
30 | Pasma J.H. , Engelhart D. , Schouten A.C. , van der Kooij H. , Maier A.B. , & Meskers C.G. M. ((2014) ). Impaired standing balance: The clinical need for closing the loop. Neuroscience, 267: , 157–165. https://doi.org/10.1016/j.neuroscience.2014.02.030 |
31 | Peterka R.J. ((2002) ). Sensorimotor integration in human postural control. Journal of Neurophysiology, 88: (3), 1097–1118. |
32 | Pradat P.-F. , Bruneteau G. , Munerati E. , Salachas F. , Le Forestier N. , Lacomblez L. ,... Meininger V. ((2009) ). Extrapyramidal stiffness in patients with amyotrophic lateral sclerosis. Movement Disorders: Official Journal of the Movement Disorder Society, 24: (14), 2143–2148. https://doi.org/10.1002/mds.22762 |
33 | Prieto T.E. , Myklebust J.B. , Hoffmann R.G. , Lovett E.G. , & Myklebust B.M. ((1996) ). Measures of postural steadiness: Differences between healthy young and elderly adults. IEEE Transactions on Bio-Medical Engineering, 43: (9), 956–966. https://doi.org/10.1109/10.532130 |
34 | Pupillo E. , Bianchi E. , Messina P. , Chiveri L. , Lunetta C. , Corbo M. ,... Eurals Consortium. ((2015) ). Extrapyramidal and cognitive signs in amyotrophic lateral sclerosis: A population based cross-sectional study. Amyotrophic Lateral Sclerosis & Frontotemporal Degeneration, 16: (5-6), 324–330. https://doi.org/10.3109/21678421.2015.1040028 |
35 | Ruhe A. , Fejer R. , & Walker B. ((2010) ). The test-retest reliability of centre of pressure measures in bipedal static task conditions–a systematic review of the literature. Gait & Posture, 32: (4), 436–445. https://doi.org/10.1016/j.gaitpost.2010.09.012 |
36 | Sanjak M. , Hirsch M.A. , Bravver E.K. , Bockenek W.L. , Norton H.J. , & Brooks B.R. ((2014) ). Vestibular deficits leading to disequilibrium and falls in ambulatory amyotrophic lateral sclerosis. Archives of Physical Medicine and Rehabilitation, 95: (10), 1933–1939. https://doi.org/10.1016/j.apmr.2014.05.024 |
37 | Steinmetz E.F. , Lebo C.P. , & Norris F.H. ((1974) ). Electronystagmographic findings in motor neuron disease. The Laryngoscope, 84: (2), 281–289. https://doi.org/10.1288/00005537-197402000-00010 |
38 | van der Kooij H. , & Peterka R.J. ((2011) ). Non-linear stimulus-response behavior of the human stance control system is predicted by optimization of a system with sensory and motor noise. Journal of Computational Neuroscience, 30: (3), 759–778. https://doi.org/10.1007/s10827-010-0291-y |
39 | Welch T.D. J. , & Ting L.H. ((2009) ). A feedback model explains the differential scaling of human postural responses to perturbation acceleration and velocity. Journal of Neurophysiology, 101: (6), 3294–3309. https://doi.org/10.1152/jn.90775.2008 |
40 | Wiesmeier I.K. , Dalin D. , Wehrle A. , Granacher U. , Muehlbauer T. , Dietterle J. ,... Maurer C. ((2017) ). Balance Training Enhances Vestibular Function and Reduces Overactive Proprioceptive Feedback in Elderly. Frontiers in Aging Neuroscience, 9: , 273. https://doi.org/10.3389/fnagi.2017.00273 |


