
Elevating the employment outcomes of transition-age youth with disabilities: Four decades of intervention research
Abstract
BACKGROUND:
Preparing students with disabilities for future employment is a primary purpose of special education and secondary transition services.
OBJECTIVE:
Knowing which interventions lead to subsequent employment is essential for establishing a strong evidence base that can guide the field.
METHODS:
We systematically reviewed available experimental and quasi-experimental studies that evaluated interventions addressing employment outcomes for transition-age youth with disabilities (ages 14–22).
RESULTS:
These 25 studies were of varied methodological quality, and most interventions improved employment status for youth. Collectively, these findings emphasize the importance and impact of connecting youth with disabilities to career development experiences while they are still receiving transition supports.
CONCLUSION:
We offer recommendations for future research focused on unpacking the key features of these multi-component interventions as well as guidance on assessing meaningful employment outcomes for youth with disabilities.
1Introduction
Like anyone else, adults with disabilities want a job that aligns with their skills, earns a salary, and offers personal satisfaction. In a national U.S. survey, Ali et al. (2011) found that the desire for paid work was nearly equivalent among adults with and without disabilities (i.e., 78% versus 80%, respectively). Moreover, most youth with disabilities have postschool goals focused on employment. For example, Lipscomb et al. (2017) found that more than 95% of transition-age youth with disabilities (i.e., age 14–22 years old) in the U.S. expect to have a paid job following graduation. Unfortunately, adults with disabilities continue to experience low rates of employment (e.g., Erickson et al., 2021; Wehman et al., 2015), and for those with intellectual and developmental disabilities (IDD)— employment rates have long persisted below 20% (Bouck & Park, 2018; National Core Indicators Project, 2018).
Preparing youth with disabilities for employment is a primary purpose of special education and transition services. The Individuals with Disabilities Education Improvement Act (IDEA) of 2004 requires schools to provide every student with disabilities a coordinated set of transition activities that facilitates their movement from school to postschool activities, including employment. Dozens of correlational and predictor studies have demonstrated that equipping students with certain skills, knowledge, and experiences during high school is likely to shape their employment pathways after graduation (e.g., Haber et al., 2016; Mazzotti et al., 2021; Test et al., 2009). For example, Carter et al. (2012) identified several skills (e.g., social, self-care) and experiences (e.g., accessing community-based jobs, having household responsibilities) during high school that predicted postschool employment success for youth with severe disabilities. Likewise, Wehman et al. (2015) also found that students’ skills (e.g., communication, ability to get places) and experiences (e.g., involvement in IEP meetings, accessing community-based jobs) were predictive of later employment success across disability categories. One key finding emerging from numerous predictor studies is the strong association between having a paid work experience during high school and obtaining employment in the early years after graduation.
Unfortunately, the pathway from the classroom to the workplace can be difficult for youth with disabilities to navigate successfully. Only 25.5% of individuals with disabilities aged 16–20 are employed, compared to 39.3% of peers without disabilities (Erickson et al., 2021). Workforce participation is even lower (i.e., 16.2%) for youth with severe disabilities (Carter et al., 2010). Secondary schools need guidance on the transition services and supports that are likely to promote access to employment for their students. However, descriptive studies involving special educators, agency providers, family members, and other stakeholders document an array of challenges associated with the employment preparation of youth with disabilities (Carter et al., 2021; Snell-Rood et al., 2020; Trainor et al., 2008). Educators and their partners have reported struggles with determining how best to provide the planning, instruction, experiences, and linkages youth with disabilities need to succeed in the workplace. Identifying approaches that have been used to create pathways to work for youth and young adults could provide these stakeholders with the direction they need in this area.
The study of employment interventions –or those evaluated through subsequent work outcomes –among youth with disabilities has a long history. Since Madeleine Will initially described a conceptual framework of school-to-work transition (1984), transition policy and practice have evolved substantially, as have the types of jobs young people pursue and the ways they find them. Yet, the charge to prepare youth for the world of work has endured (Harvey et al., 2020). Over the past 40 years, dozens of studies have examined the impact of various interventions on the employment outcomes of youth with disabilities. Surprisingly, a systematic review that exclusively focuses on intervention studies with transition-age youth that evaluate subsequent employment outcomes has yet to be undertaken. Educators— as well as their state and community partners— would benefit from having a menu of effective intervention options to draw upon for use with youth with disabilities.
In a previous scoping review (Schutz & Carter, 2022), we described the intervention components and stakeholders involved in 42 single-group, quasi-experimental, or experimental studies conducted with transition-age youth with disabilities in which subsequent employment outcomes were examined. Nonetheless, two additional dimensions of employment interventions are important to capture. First, the overall quality of these studies warrants close consideration. Establishing practices as evidence-based is conditioned on the availability of methodologically rigorous studies. Yet, the complexities of employment-focused interventions— including their multiple components (e.g., instruction, supports, linkages), settings (e.g., classrooms, businesses), partners (e.g., families, schools, agencies, employers), and the nature of their individualization— make them challenging to evaluate. Knowing the strengths and limitations of this body of research could provide context with which to interpret confidence in its findings as well as inform and strengthen the design of future studies focused on the transition to employment. Second, the degree to which these interventions accomplish their stated goal of improving the employment outcomes of transition-age youth with disabilities is critical to document. The persistence of poor employment outcomes among youth has been a longstanding concern in special education (e.g., Wehman et al., 2015; Will, 1984). Determining which interventions are (and are not) successful at bending the employment trajectories of youth with disabilities in positive directions would provide schools with much-needed information about what really works. Establishing the efficacy of employment interventions could help accomplish this goal.
The purpose of the current review was to examine the methodological quality and efficacy of employment intervention studies that used a comparison group to evaluate outcomes for transition-age youth with disabilities. We addressed two research questions:
RQ1: To what extent do employment interventions conducted with transition-age youth with disabilities meet quality indicators for methodological rigor?
RQ2: What is the efficacy of these interventions for improving employment outcomes for transition age youth?
2Method
2.1Inclusion criteria
The transition-to-employment literature is comprised of published and unpublished reports. We included studies based on five criteria. First, we included any study published in English prior to June 2020. We incorporated peer-reviewed journals and gray literature (e.g., dissertations, government agency reports). Second, all studies had at least 50% of participants aged 14 to 22 with a disability. Third, studies prospectively evaluated the impact of an intervention on employment, excluding correlational studies on predictors of postschool outcomes. Fourth, studies tracked the employment status of participants (i.e., employed or not employed) as a dependent variable following intervention. All studies that met these four inclusion criteria were included in our broader scoping review of intervention components and stakeholder involvement with respect to these interventions (Schutz & Carter, 2022). Additionally, to be included in the present review, studies included a treatment and comparison group and assessed employment status in each of these groups. When multiple publications (e.g., journal articles, project reports) described a single study, we coded these publications together as one study. Given our aim to characterize the overall rigor of the full landscape of this research over several decades for readers to interpret findings given its methodological strengths and limitations, we did not exclude older studies or those published in gray literature a priori based on more recently established quality standards in vocational rehabilitation (Leahy et al., 2014) and special education (Cook & Odom, 2013).
2.2Search and screening procedures
We employed a comprehensive search of the full multidisciplinary ProQuest system to identify all studies meeting our criteria. We used a combination of search terms addressing our focus on disabilities, interventions, transition-age youth, and group design (see Fig. 1). We hand searched two journals focused on employment literature and youth with disabilities: Career Development and Transition for Exceptional Individuals and Journal of Vocational Rehabilitation. We also screened all studies referenced in reviews of vocational practices. The search resulted in 3,821 publications. Initial screening of titles and abstracts using the inclusion criteria resulted in 97 publications. We also screened 29 additional studies identified through forward and backward searches. Secondary screening of the full text of each publication resulted in a total of 25 studies.
Fig. 1
PRISMA Diagram.
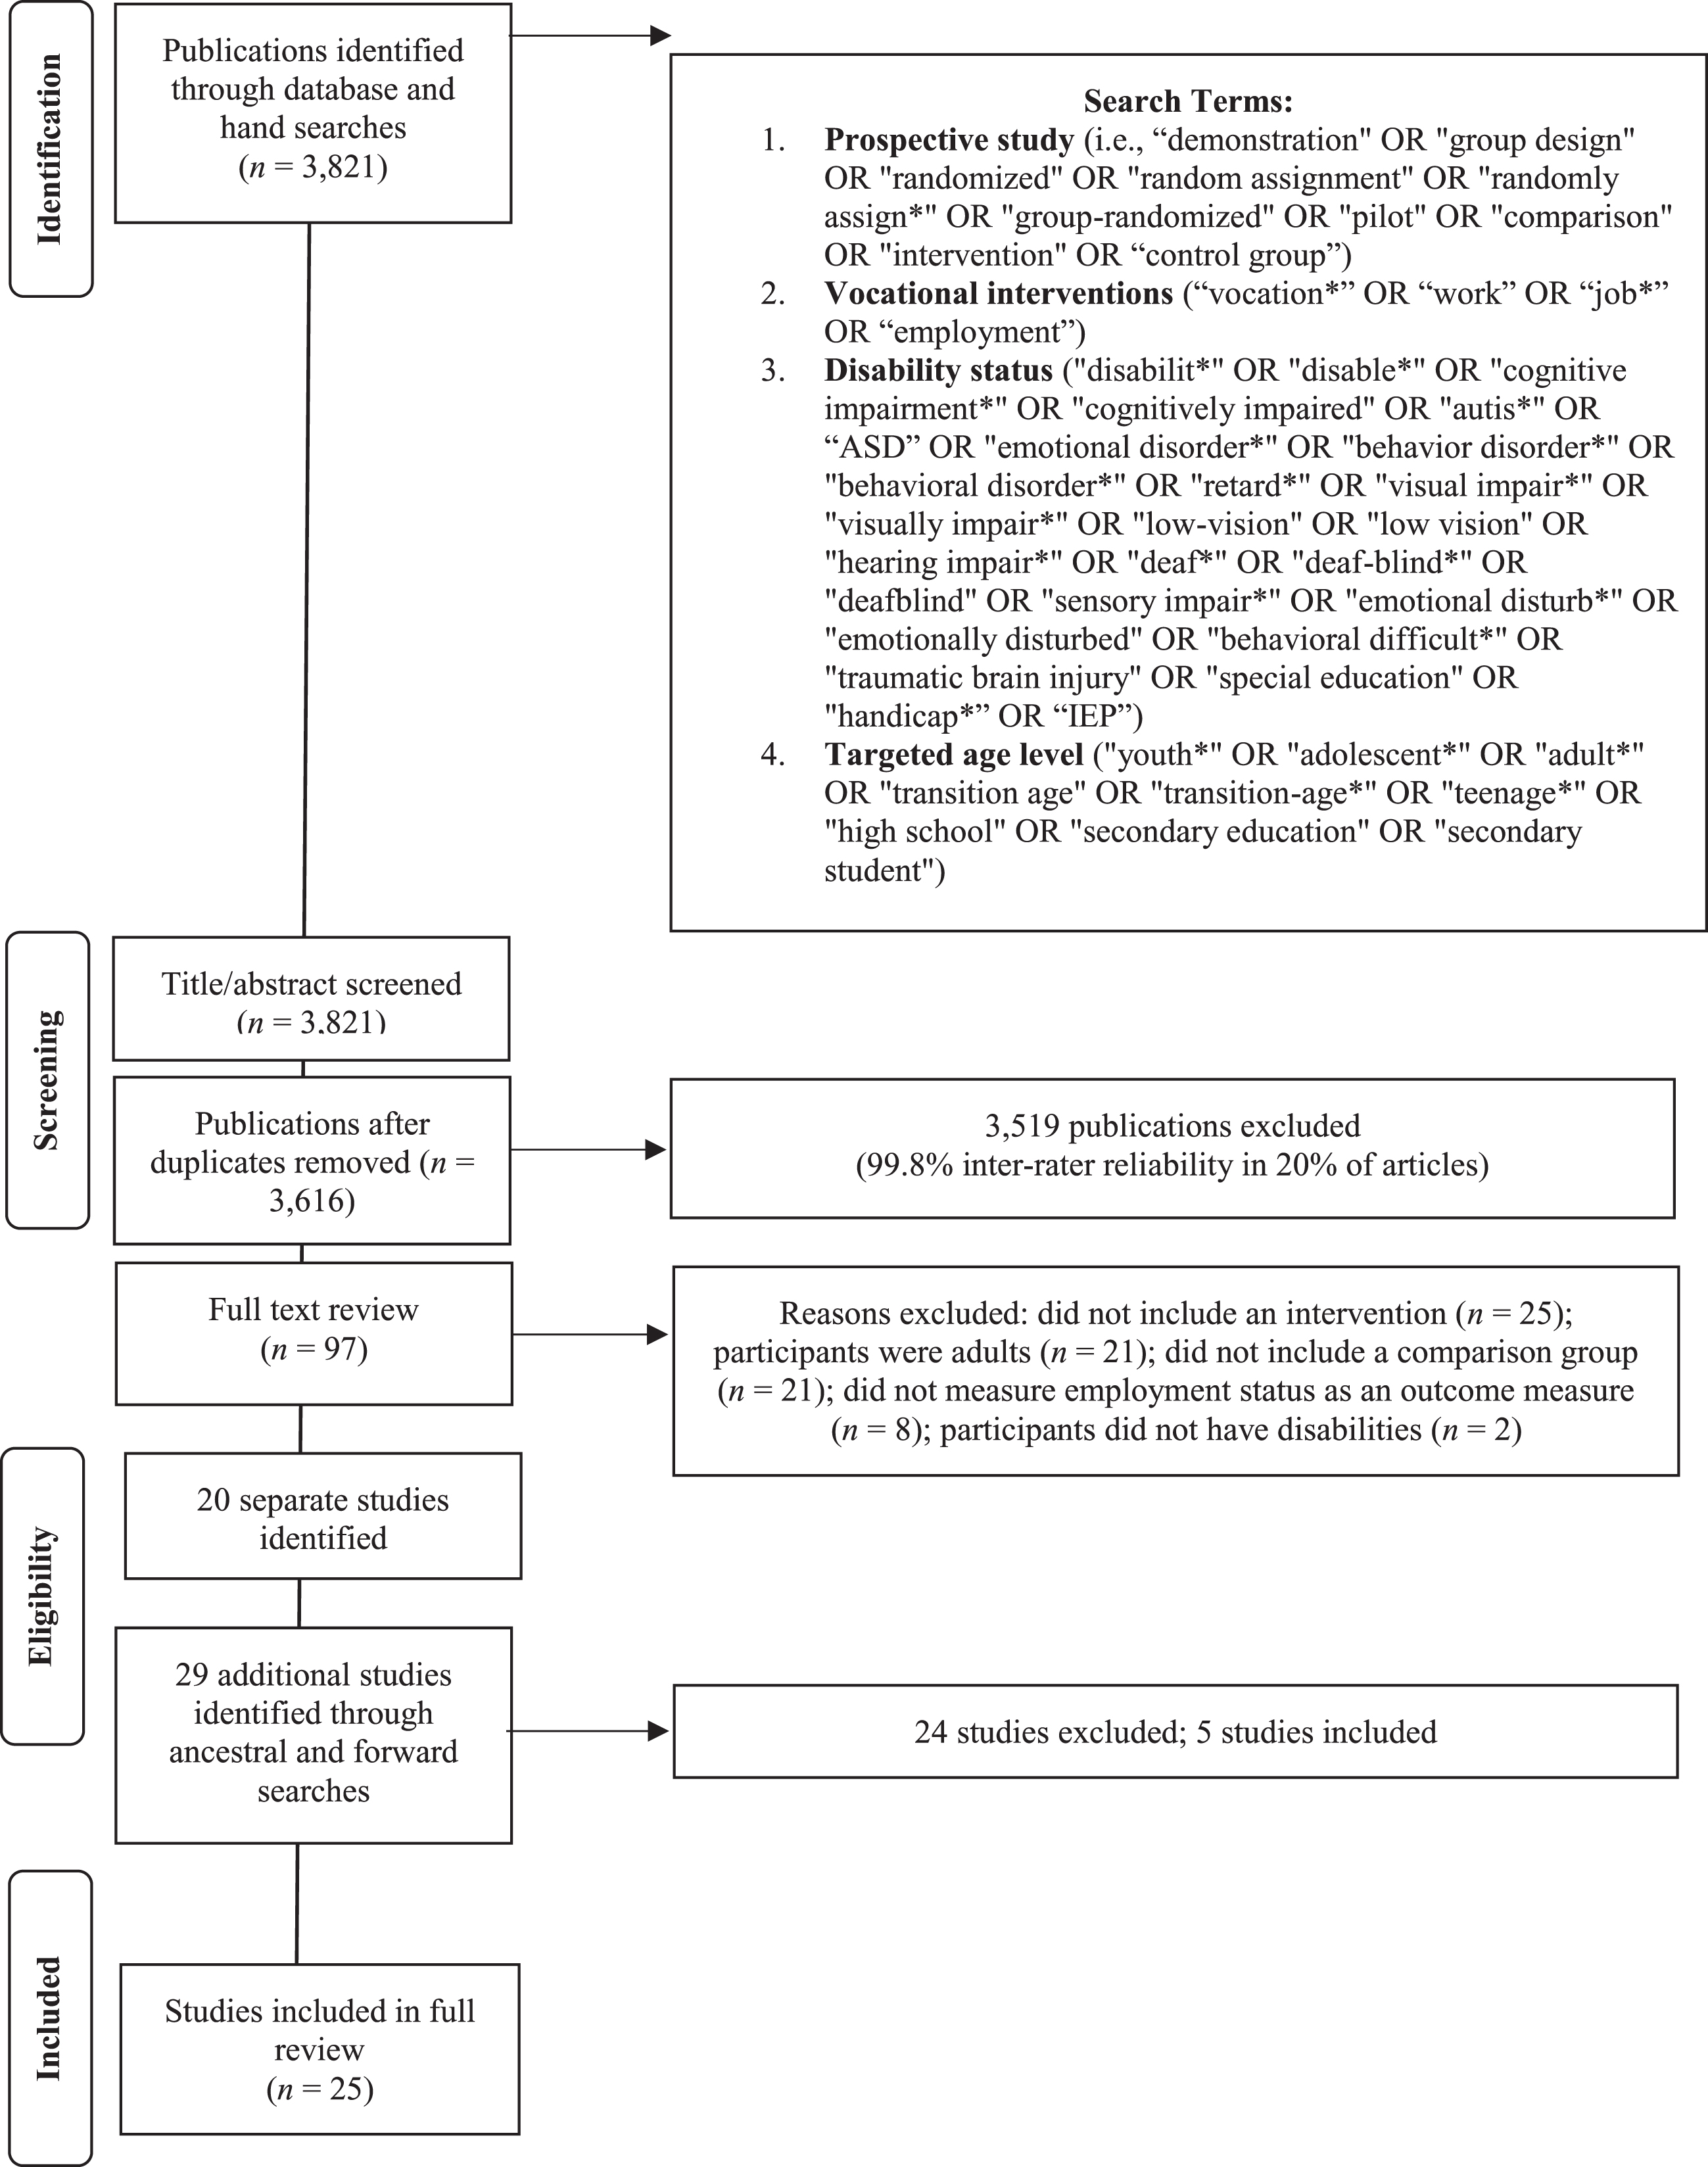
To assess interrater reliability, a special education doctoral student served as a second coder. We calculated interrater reliability by dividing the number of agreements by the number of agreements plus disagreements. During the first round of screening, the second coder reviewed a random sample of 763 reports (20.0%); interrater reliability was 99.8%. During the second round, the second coder reviewed the full text of 26 reports (20.6%). Interrater reliability was 100%. Given that reliability was exceptionally high during each round, we did not increase the sample of reports double-coded beyond 20%.
2.3Coding of studies
The 25 studies included in this review consisted of peer-reviewed journal articles, private or government reports, dissertations or theses, and conference papers. We provide a summary of each study and its employment intervention in Table 1. General study characteristics included study design, participant characteristics, and settings. Participant characteristics included mean age, sex/gender, race/ethnicity, disability (i.e., IDD, learning disability, emotional/behavioral disability, physical/visual/hearing disability), and pre-treatment variables (e.g., education status). Setting characteristics included locale (i.e., urban, suburban, rural), geographic location, and environments (e.g., K-12 school, workplace) in which intervention was delivered.
Table 1
Summary of Included Studies
| Study | Intervention summary | Research design | Youtha (n; dis-abilities; race/ethnicity; mean age; % female) | Setting (U.S. region; locale; environments) |
| Extended transition services | ||||
| Izzo (1998); Izzo et al. (2002) | Extended transition services were provided post-graduation, including vocational assessment, agency contacts, IEP meetings, vocational training, employability counseling, job clubs, job interview preparation, job development, and job coaching. | RCT with BAU condition and pre-posttest | 98; IDD, LD; White; NR; 36% | Midwest; NR; K-12 school, workplace |
| Project SEARCH + ASD supports | ||||
| Wehman et al. (2014); Wehman (2017) | Youth completed traditional Project SEARCH internships supported by interagency collaboration; additional ASD supports included ABA instruction, support and consultation from a behavior/autism specialist, and intensive staff training. | RCT with BAU condition and pre-posttest | 49b; IDD; White, Black; 19.5; 29% | South; urban; workplace |
| Wehman et al. (2020) | Youth completed internships supported by interagency collaboration through the model with additional ASD supports; replicated Wehman et al. (2014) with different sample. | RCT with BAU condition and pre-posttest | 102; IDD; White; 19.7; 25% | South; NR; workplace |
| PROMISE | ||||
| Mamun et al. (2019, Arkansas) | Arkansas PROMISE components included case management, vocational assessments, employment skills training, paid summer work experiences with job coaching, and benefits counseling through coordinated services. | RCT with BAU condition and pre-posttest | 1469; MI, IDD; Other; 15.4; 34% | South; urban, rural; K-12 school, workplace, youth’s home, postsecondary education facility, community settings |
| Mamun et al. (2019, ASPIRE); Ipsen et al. (2019a); Ipsen et al. (2019b) | ASPIRE consortium PROMISE components included self-determination training, parent engagement in post-secondary planning, job development, and referrals to work experiences during high school through coordinated services. | RCT with BAU condition and pre-posttest | 1560; IDD, MI; White, Hispanic; 15.4; 33% | Midwest, West; urban, suburban, rural; K-12 school, agency facility, youth’s home, postsecondary education facility, virtual setting |
| Mamun et al. (2019, California) | California PROMISE components included benefits counseling, career exploration and work-based learning experiences, parent training and information, postsecondary education supports, and employment skills training through coordinated services. | RCT with BAU condition and pre-posttest | 1634; IDD, MI; Other; 15.4; 33% | West; urban; K-12 school, workplace, youth’s home, postsecondary education facility |
| Mamun et al. (2019, Maryland) | Maryland PROMISE components included case management, benefits counseling, career exploration and work-based learning experiences, parent training and information, and postsecondary education supports through coordinated services. | RCT with BAU condition and pre-posttest | 1501; MI, IDD; Other; 15.8; 36% | South; urban, rural; workplace, youth’s home, postsecondary education facility, virtual setting |
| Mamun et al. (2019, New York State) | New York State PROMISE components included case management, benefits counseling, career planning, job development, work experiences, and family coaching and training on transition planning and self-determination. | RCT with BAU condition and pre-posttest | 1691; IDD, MI; Black, Hispanic; 15.4; 32% | Northeast; urban; K-12 school, agency facility, workplace, youth’s home, community settings |
| Mamun et al. (2019, Wisconsin) | Wisconsin PROMISE components included early vocational rehabilitation services, case management, benefits counseling, parent training on expectations and services, and employment skills training through coordinated services. | RCT with BAU condition and pre-posttest | 1475; MI, IDD; Other; 15.4; 34% | Midwest; urban, suburban, rural; agency facility, workplace, youth’s home, virtual setting |
| STETS | ||||
| Riccio &Price (1984) | STETS youth received sheltered paid employment with training and support, followed by paid work in community settings and ongoing individualized job support as needed. | RCT with BAU condition and pre-posttest | 529; IDD, MD; White, Black; NR; 40% | Northeast, Midwest, West; urban; workplace |
| Bangser (1985) | See Riccio &Price (1984) | |||
| Kerachsky et al. (1985) | See Riccio &Price (1984) | |||
| Kerachsky &Thornton (1987) | See Riccio &Price (1984) | |||
| Summer work intervention package | ||||
| Carter et al. (2009) | The intervention package included school-wide supports (community conversation event, resource mapping) and youth supports (summer-focused planning, access to community connector and employer liaison) for youth with IDD. | RCT with BAU condition and posttest | 67; IDD; White; 18.1; 57% | Midwest; urban, suburban, rural; K-12 school, workplace, community settings |
| Carter et al. (2011) | The intervention package included school-wide supports (community conversation event, resource mapping) and youth supports (summer-focused planning, access to community connector and employer liaison) for youth with EBD. | RCT with BAU condition and posttest | 57; EBD; White; 17.0; 30% | NR; NR; K-12 school, workplace, community settings |
| TAKE CHARGE | ||||
| Powers et al. (2012) | Treatment youth received coaching on self-determination skills to achieve goals and mentoring workshops with peer foster care alumni; comparison youth participated in a foster care independent living program. | RCT with comparison condition and pre-posttest | 61; EBD, LD, OD; White, Other; 16.8; 41% | West; NR; K-12 school |
| Geenan et al. (2013) | Youth received individualized coaching to apply self-determination skills toward goals and educational planning meetings, as well as mentorship from foster care alumni. | RCT with BAU condition and posttest | 123; EBD, LD, OD; White, Black; 15.5; 46% | NR; urban, NR |
| YTDP | ||||
| Fraker et al. (2014; Erie County) | Transition WORKS YTDP in Erie County, NY included self-determination workshops, supports for enrolling in postsecondary or vocational school, job development, benefits counseling, and work experiences from interdisciplinary teams. | RCT with BAU condition and pre-posttest | 843; IDD; White, Black; 19.9; 38% | Northeast; urban; agency facility, workplace |
| Fraker et al. (2014; Bronx County) | City University of New York YTDP in Bronx County, NY included benefits counseling, links to services in the community, and other supports for families from interdisciplinary teams. | RCT with BAU condition and pre-posttest | 889; IDD; Hispanic, Black, White; 16.2; 32% | Northeast; urban; postsecondary education facility |
| Fraker et al. (2014; Colorado) | Colorado WINS YTDP youth received benefits counseling, coordinated access to employment services, individualized career planning, work experiences, and postsecondary education supports from interdisciplinary teams. | RCT with BAU condition and pre-posttest | 855; IDD; White; 19.9; 43% | West; urban, suburban; K-12 school, agency facility, workplace, community settings |
| Fraker et al. (2014; West Virginia) | West Virginia Youth Works YTDP components included person-centered planning, benefits counseling, job development and placement, on-the-job supports, and coordinated services from interdisciplinary teams. | RCT with BAU condition and pre-posttest | 852; IDD; White; 20.5; 48% | South; rural; workplace, youth’s home; community settings; virtual setting |
| Fraker et al. (2014; Miami-Dade County); Fraker et al. (2018) | Broadened Horizons, Brighter Futures YTDP in Miami-Date County included benefits counseling, employment skills training, individualized assessment, job development, work experiences, and postsecondary education supports from interdisciplinary teams. | RCT with BAU condition and pre-posttest | 859; IDD, EBD; Black, Hispanic, White; 19.2; 40% | South; urban; agency facility, workplace, youth’s home |
| Fraker et al. (2014; Montgomery County) | Career Transition Program YTDP in Montgomery County, MD included case management, benefits counseling, work-based learning and work experiences, and job coaching from an interdisciplinary team. | RCT with BAU condition and pre-posttest | 805; EBD; Black, White; 17.7; 33% | South; urban, suburban; workplace, residential center, community settings |
| Other | ||||
| La Greca et al. (1983) | One treatment group received skills-training (modeling, coaching, and behavioral rehearsal on responding to difficult work-related interpersonal situations); second group received coaching only. | RCT with two treatment groups, BAU condition, and posttest | 35; IDD; NR; 21.6; 26% | South; urban; residential facility |
| Bernacchio &Fortinsky (1988) | Youth received model program of transition services, including a comprehensive assessment, developing a plan for secondary and postsecondary services, and assistance with placement in postsecondary education and employment settings. | Quasi-experi-mental between-groups study with posttest | 64; LD; NR; NR; NR | Northeast; suburban; K-12 school |
| Edwards et al. (1988) | Youth received instruction on searching for leisure activities and conducting a job search. | Quasi-experi-mental between-groups study with posttest | NR; IDD, LD; NR; NR; NR | West; urban, suburban, rural; K-12 school |
| Balcazar et al. (2012) | College Connection Program facilitated interagency collaboration amongst agencies, employers, and schools to provide postsecondary education support, job development, and on-the-job supports. | Quasi-experi-mental between-groups study with pre-posttest | 190; LD; Black, Hispanic; 19.1; 48% | Midwest; urban; NR |
| Duersch (2013) | Treatment group participated in a job club and received support using social media to post employment goals and qualifications, as well as connect with businesses. Comparison group received traditional job search supports without social media. | RCT with matched pairs with comparison condition and posttest | 37; IDD, LD; White, Hispanic; 20.4; 54% | West; urban; postsecondary education facility |
Note: ASD = Autism Spectrum Disorder; PROMISE = Promoting the Readiness of Minors in Supplemental Security Income; STETS =Structured Training and Employment Transitional Services; YTDP = Youth Transition Demonstration Project; BAU = business-as-usual; EBD = emotional or behavioral disability; IDD = intellectual or developmental disability; LD = learning disability; OD = other disabilities; MI = mental illness; NR = not reported; White = White/Caucasian; Black = Black/African American; Hispanic = Hispanic/Latinx; Other = Other race/multiple races. RCT = randomized control trial. aPertains to total sample; includes disability categories describing > 25% of total youth in descending order; includes race/ethnicity categories describing > 25% of total youth in descending order; age (M) in yrs; % female. bData reflect the nine additional youth added in Wehman et al. (2017).
2.3.1Methodological quality
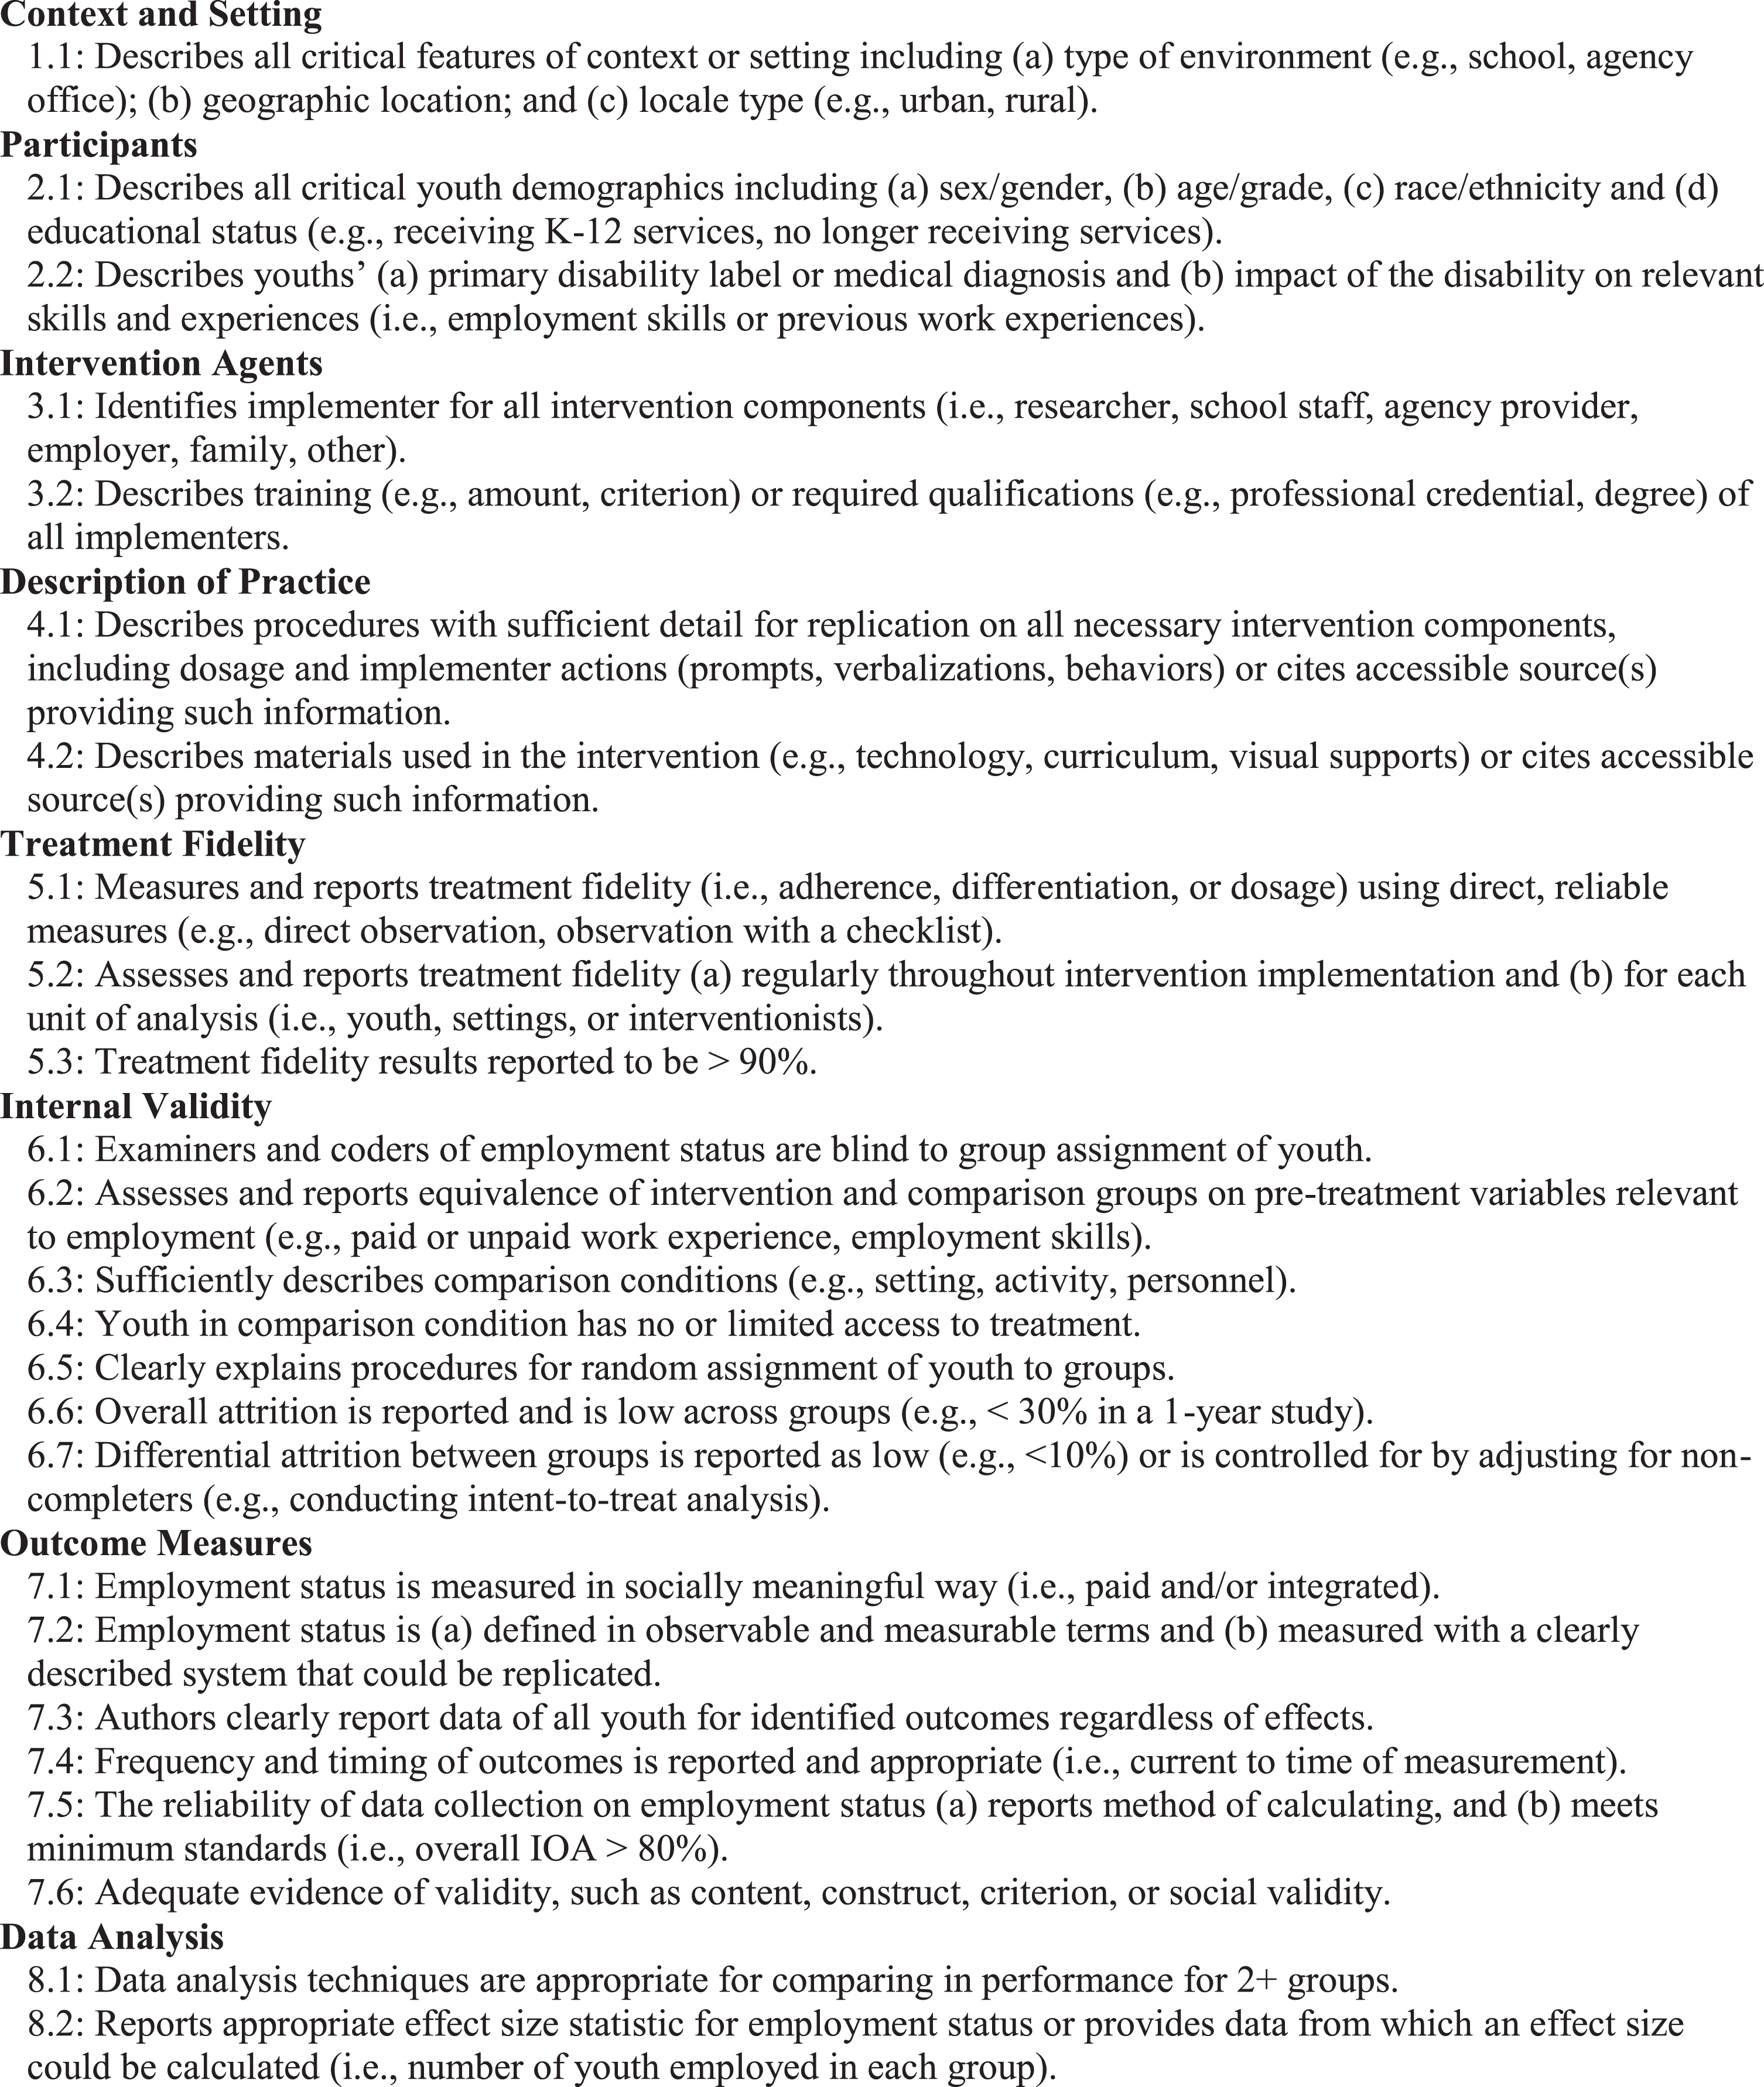
We coded the extent to which studies addressed quality indicators of methodological quality in the areas of (a) participants and setting, (b) intervention agents and description of practice, (c) treatment fidelity, (d) internal validity, (e) outcome measures, and (f) data analysis. These indicators were adapted from the quality indicators for group design in the Council for Exceptional Children’s Standards for Evidence-Based Practices in Special Education (2014). See Fig. 2 for a description of each quality indicator. Studies were described as meeting an indicator if all components of the indicator were present and not meeting if one or more components within that indicator were missing.
Fig. 2
Quality Indicators Definitions.
2.3.2Efficacy of interventions
We also examined the extent to which interventions led to employment. Employment status (i.e., whether or not youth obtained employment) was our primary outcome of interest. As studies defined this outcome in differing ways, we coded whether each outcome excluded (a) unpaid employment, (b) segregated employment (i.e., youth were separated from peers without disabilities), or (c) employment not current to time of measurement. We documented the timepoint(s) at which employment status was measured in relation to the end of the intervention. We coded one study (Edwards et al., 1988) that did not specify a timepoint as time not reported.
We characterized the effects of interventions on employment status as an odds ratio interpreted as: the odds of treatment youth obtaining employment after the intervention compared to the odds of comparison youth obtaining employment. This reflected an appropriate effect size (i.e., effect of interventions on employment status), given that group status and employment were dichotomous variables (Cooper, 2017). We used MedCalc for Windows, version 19.4 (Schoonjans, 2008) to calculate the odds ratios, 95% confidence intervals, and p-values. We adopted guidelines from Haddock et al., (1998) to interpret odds ratios as large (greater than 9.0), medium (between 3.5 and 9.0), small (between 1.5 and 3.5), or marginal (between 1.0 and 1.5). One study (Edwards et al., 1988) reported the percentages of each group who became employed, rather than the number of youth in each group (n). Therefore, we hand calculated the odds ratio for this study but could not determine the confidence intervals or p-value without values for n. As measures of employment status were decidedly different across studies (e.g., some excluded unpaid work, segregated employment, or noncurrent employment), we did not calculate an effect size across studies (Cooper, 2017).
When reported, we coded the effects of interventions on the following employment characteristics: (a) type of employment, (b) income, (c) duration of work, (d) frequency of work, (e) receipt of benefits or advancement, (f) reason for unemployment, (g) youth job satisfaction, (h) job alignment, (i) work performance, (j) employer satisfaction, (k) career development goals, and/or (l) integration at work. For each measure reported, we described the measure (e.g., average hourly income) and reported results (e.g., $7.25).
We calculated interrater reliability for eight studies (32%) by using data from two independent coders (i.e., total number of agreements divided by agreements plus disagreements x 100%). Reliability averaged 93.6% (range 80.0–100.0%) across studies. We addressed disagreements by reviewing the original study to come to consensus on final coding.
3Results
Table 1 presents a summary of each of the 25 employment interventions, their research designs, participating youth, and settings. Although studies varied widely in their approaches, they commonly included components related to (a) employment preparation; (b) job placement and on-the-job support; (c) other supports addressing the tangential needs of youth, such as transportation and health; (d) supports for other stakeholders (i.e., families, educators, agency providers, employers); and (e) collaborative or organizational strategies. See Schutz and Carter (2022) for additional details on specific components addressed within each intervention and the roles different stakeholders played in these interventions.
Of the 25 studies, six studies were field-based evaluations in varying geographic locations of multiple intervention components from the Promoting the Readiness of Minors in Supplemental Security Income (PROMISE) model, incorporating interagency collaboration and family-centered approaches to case management and employment service delivery (see Table 1 for differing components by evaluation). Similarly, six other studies classified as Youth Transition Demonstration Projects (YTDP) were field-based evaluations of multiple intervention components that included various services and extended financial assistance from the Social Security Administration (see Table 1). Two studies examined the Project SEARCH + ASD Supports model using strategies for supporting youth with autism spectrum disorder within internships at local businesses. Two studies used a multi-component intervention package that supported youth with IDD and emotional and behavioral disorders in obtaining summer jobs. Two studies used the TAKE CHARGE self-determination model to support youth with disabilities in foster care in setting and achieving future goals. One study used the Structured Training and Employment Transitional Services (STETS) model to provide youth with sheltered paid work, followed by integrated work in the community. Finally, the remaining studies used unnamed interventions that included person-centered planning, self-determination training, placement in paid jobs, and extended transition services (e.g., IEP meetings, job coaching) following high school graduation. In the sections that follow, we first present overall study characteristics to provide general context. We then address our research questions by reviewing the methodological quality of studies (RQ1) and the effects of interventions on employment outcomes across studies (RQ2).
3.1General study characteristics
In this section, we describe study design, participants, and setting. Of the 25 studies, 22 (88.0%) used a randomized control trial and three (12.0%) used a quasi-experimental design. Twenty-two studies used a business-as-usual group, two (Duersch 2013; Powers et al., 2012) used a comparison group receiving alternate treatment, and La Greca et al. (1983) used two treatment groups and one business-as-usual group. The sum of participants reported across studies was 15,845. Among studies reporting age, the mean youth age was 17.8 years. For those reporting education status, 76.5% of youth were receiving K-12 school services, while the others had graduated or dropped out. Among studies reporting youth gender, 64.9% were male and 35.1% were female. For those reporting race/ethnicity, 32.4% of youth were African-American/Black, 30.0% were White, and 27.7% were Hispanic/Latinx. In studies reporting disability type, 46.2% had IDD; 11.6% had emotional or behavioral disabilities or mental illness; 10.7% had learning disabilities; and 7.5% had physical, visual, or hearing disabilities.
Most studies (72.0%) took place in at least one urban locale, 28.0% in suburban locales, 28.0% in rural locales, and 32.0% in more than one locale. Studies occurred across the U.S., including the South (32.0%), West (28.0%), Midwest (24.0%), Northeast (20.0%), and multiple regions (4.0%). Intervention components were implemented across different environments, such as work settings (64.0%), K-12 schools (44.0%), remote meetings (40.0%), youths’ homes (32.0%), colleges (24.0%), agency offices (24.0%), and residential or medical facilities (8.0%).
3.2Methodological quality
Given the information reported, the methodological quality was mixed across studies. Generally, studies utilizing the YTDP field-based evaluations, PROMISE field-based evaluations, TAKE CHARGE, and Project SEARCH + ASD Supports intervention models met the largest number of quality indicators. In the following sections, we address our first research question by summarizing the methodological quality of reviewed studies by each area of quality indicators (see Table 2). Each number in parentheses (e.g., 1.1) refers to a specific quality indicator of methodological quality. Each indicator is listed with its corresponding number and definition in Fig. 2.
Table 2
Methodological Quality Indicators by Study
| Participants and settings | Intervention agents and description of practice | Treatment fidelity | Internal validity | Outcome measures | Data analysis | ||||||||||||||||||||
| Study | 1.1 | 2.1 | 2.2 | 3.1 | 3.2 | 4.1 | 4.2 | 5.1 | 5.2 | 5.3 | 6.1 | 6.2 | 6.3 | 6.4 | 6.5 | 6.6 | 6.7 | 7.1 | 7.2 | 7.3 | 7.4 | 7.5 | 7.6 | 8.1 | 8.2 |
| Extended transition services | |||||||||||||||||||||||||
| Izzo (1998); Izzo et al. (2002) | X | X | X | X | X | X | X | X | X | X | X | X | X | ||||||||||||
| Project SEARCH + ASD supports | |||||||||||||||||||||||||
| Wehman et al. (2014); Wehman et al. (2017) | X | X | X | X | X | X | X | X | X | X | X | X | X | X | X | ||||||||||
| Wehman et al. (2020) | X | X | X | X | X | X | X | X | X | X | X | X | X | X | X | ||||||||||
| PROMISE | |||||||||||||||||||||||||
| Mamun et al. (2019, Arkansas) | X | X | X | X | X | X | X | X | X | X | X | X | X | X | X | X | X | X | X | ||||||
| Mamun et al. (2019, ASPIRE); Ipsen et al. (2019a); Ipsen et al. (2019b) | X | X | X | X | X | X | X | X | X | X | X | X | X | X | X | X | X | X | X | ||||||
| Mamun et al. (2019, California) | X | X | X | X | X | X | X | X | X | X | X | X | X | X | X | X | X | X | X | ||||||
| Mamun et al. (2019, Maryland) | X | X | X | X | X | X | X | X | X | X | X | X | X | X | X | X | X | X | X | ||||||
| Mamun et al. (2019, New York State) | X | X | X | X | X | X | X | X | X | X | X | X | X | X | X | X | X | X | X | ||||||
| Mamun et al. (2019, Wisconsin) | X | X | X | X | X | X | X | X | X | X | X | X | X | X | X | X | X | X | X | ||||||
| STETS | |||||||||||||||||||||||||
| Riccio &Price (1984); Bangser (1985); Kerachsky et al. (1985); Kerachsky &Thornton (1987) | X | X | X | X | X | X | X | X | X | ||||||||||||||||
| Summer work intervention package | |||||||||||||||||||||||||
| Carter et al. (2009) | X | X | X | X | X | X | X | X | X | X | X | X | X | X | X | ||||||||||
| Carter et al. (2011) | X | X | X | X | X | X | X | X | X | X | X | X | X | X | |||||||||||
| TAKE CHARGE | |||||||||||||||||||||||||
| Powers et al. (2012) | X | X | X | X | X | X | X | X | X | X | X | X | X | X | X | X | X | ||||||||
| Geenan et al. (2013) | X | X | X | X | X | X | X | X | X | X | X | X | X | X | X | X | |||||||||
| YTDP | |||||||||||||||||||||||||
| Fraker et al. (2014; Erie County) | X | X | X | X | X | X | X | X | X | X | X | X | X | X | X | X | X | X | X | X | |||||
| Fraker et al. (2014; Bronx County) | X | X | X | X | X | X | X | X | X | X | X | X | X | X | X | X | X | X | X | X | |||||
| Fraker et al. (2014; Colorado) | X | X | X | X | X | X | X | X | X | X | X | X | X | X | X | X | X | X | X | X | |||||
| Fraker et al. (2014; West Virginia) | X | X | X | X | X | X | X | X | X | X | X | X | X | X | X | X | X | X | X | X | |||||
| Fraker et al. (2014; Miami-Dade County); Fraker et al. (2018) | X | X | X | X | X | X | X | X | X | X | X | X | X | X | X | X | X | X | X | X | |||||
| Fraker et al. (2014; Montgomery County) | X | X | X | X | X | X | X | X | X | X | X | X | X | X | X | X | X | X | X | X | |||||
| Other | |||||||||||||||||||||||||
| La Greca et al. (1983) | X | X | X | X | X | X | X | X | X | ||||||||||||||||
| Bernacchio &Fortinsky (1988) | X | X | |||||||||||||||||||||||
| Edwards et al. (1988) | X | X | X | X | |||||||||||||||||||||
| Balcazar et al. (2012) | X | X | X | X | X | X | X | X | X | ||||||||||||||||
| Duersch (2013) | X | X | X | X | X | X | X | X | X | X | X | X | X | X | |||||||||||
| % of Studies that Met Indicator | 52 | 88 | 88 | 88 | 72 | 92 | 80 | 4 | 64 | 13 | 0 | 72 | 72 | 56 | 44 | 68 | 60 | 80 | 72 | 80 | 52 | 0 | 72 | 80 | 96 |
Note: X indicates that quality indicator was met. ASD = Autism Spectrum Disorder; PROMISE = Promoting the Readiness of Minors in Supplemental Security Income; STETS = Structured Training and Employment Transitional Services; YTDP = Youth Transition Demonstration Project.
3.2.1Participants and settings (1.1–2.2)
Just over half (52.0%) of studies met the indicator for context and setting (1.1). Although 84.0% described the type of environment and geographic location of interventions, only 68.0% reported type of locale. Furthermore, most studies provided adequate descriptions of critical participant demographics (2.1; 88.0%) and disability information (2.2; 88.0%). The most common omission involved not reporting the race/ethnicity of youth. For studies that lacked adequate descriptions of participants and settings, it was difficult to discern for whom and in what environments the intervention was effective. However, all YTDP evaluations met all indicators in this area.
3.2.2Intervention agents and description of practice (3.1–4.2)
Most studies (88.0%) identified implementers for all intervention components (3.1). Fewer (72.0%) included sufficient information on the training or qualifications of the implementers (3.2), making it difficult to discern the support implementers received to deliver interventions. Nonetheless, 92.0% of studies described the procedures for intervention components with sufficient detail for replication (4.1), and 80.0% included adequate descriptions of the materials they used or included citations for where this information could be found (4.2). YTDP evaluations, PROMISE evaluations, and Project SEARCH + ASD Supports studies met all indicators in this area, increasing the ease with which their interventions can be replicated.
3.2.3Treatment fidelity (5.1–5.3)
More than half of studies (64.0%) reported to measure treatment fidelity; most were PROMISE evaluations, YTD evaluations, and summer work intervention packages. However, several studies did not meet quality indicators in this area. Duersch (2013) was the only study to describe use of direct, reliable measures of treatment fidelity (5.1), and all others did so through implementer self-report. In addition to this study, only two others – both TAKE CHARGE interventions – described treatment fidelity results as greater than 90% (5.3). Edwards et al. (1988) noted the number of youth who received specific intervention components without providing an overall fidelity percentage.
3.2.4Internal validity (6.1–6.7)
The extent to which studies established trustworthiness in their intervention serving as a cause of employment was highly varied across different indicators of internal validity. YTDP evaluations, PROMISE evaluations, TAKE CHARGE studies, and Project SEARCH + ASD Supports intervention studies met the most quality indicators in this area. Overall, more than half of studies described equivalence of groups (6.2; 72.0%) and low attrition (6.6; 68.0%). Although most studies used a randomized control trial, only 44.0% clearly explained procedures for random assignment (6.5). Although 72.0% of studies sufficiently described comparison conditions (6.3), fewer (56.0%) demonstrated that the comparison group had no or limited access to treatment (6.4). In all but two studies, the comparison group received “business as usual” transition services. Three studies described the services available to the comparison group and addressed the degree to which this group could access the intervention. Yet, two studies reported that the comparison group accessed some aspects of the intervention, and the remaining majority of studies did not describe any efforts to address this aspect of internal validity. Finally, no studies stated that examiners and coders of employment status were blind to group assignment of participants (6.1), making it difficult to discern if examiner bias or inaccurate participant self-reporting could have impacted the data.
3.2.5Outcome measures (7.1–7.6)
The area of outcome measures was a strength for most studies, particularly those using the YTDP components and summer work intervention packages. More than 70% of studies reported measuring employment status in a defined, socially meaningful way (7.1, 7.2), described valid measures (7.6), and reported data for all participants (7.3). Yet, fewer reported the frequency and timing of measurement (7.4). As studies primarily collected employment data through self-report measures from youth and families, none of the studies described interrater reliability of data collection for employment status (7.5). Nonetheless, YTD and PROMISE evaluations reported using reports provided by agency providers (e.g., vocational rehabilitation data reports, Social Security data summaries) to confirm participant data and increase reliability, with some mentioning that participant self-reporting had been inaccurate in some cases
3.2.6Data analysis (8.1–8.2)
Data analysis tended to be an area of strength across studies, as 80% used data analysis techniques appropriate for comparing change in performance for two or more groups (8.1). The four studies that did not meet this indicator instead compared change in employment status within groups or reported general conclusions in the absence of statistical analysis. All but one study included appropriate effect size statistics for employment status or presented data with which an effect size could be calculated (8.2). Edwards et al. (1988) failed to meet this indicator because authors provided percentages of youth in each group who became employed without including the number in each group (i.e., n).
3.3Efficacy of interventions for improving employment outcomes
In the next sections, we address our second re-search question by summarizing the effects of re-viewed interventions on employment status and the characteristics of employment obtained.
3.3.1Employment status
The effect size of the relationship between each intervention and employment status varied widely across the 25 studies. Yet, nearly every intervention had a positive impact on youth employment status (see Table 3). The odds ratios in these studies ranged from marginal to large across timepoints and studies. Odds ratios were large and positive (i.e., odds of employment were higher for treatment youth than comparison youth) for at least one timepoint in four studies; all of these odds ratios were statistically significant. Four studies (16.0%) had a medium, positive odds ratio; three were statistically significant. Thirteen studies (52.0%) had a small, positive odds ratio; eight were statistically significant. Eight studies (32.0%) had marginal odds ratios indicating a positive, but weak, association; three of these odds ratios were statistically significant. Only four studies had at least one odds ratio that was less than 1.0, meaning the odds of employment for treatment youth were lower than odds of employment for comparison youth. Of the 14 studies that measured employment status across multiple timepoints, five reported increases in odds of employment over time, eight reported decreases over time, and one study reported an increase in odds, followed by a subsequent decrease.
Table 3
Summary of Effects on Employment by Study
| Employment status | |||||
| Study | Time of measurement | Odds ratioa | 95% CI | p | Employment characteristics |
| Extended transition services | |||||
| Izzo (1998); Izzo et al. (2002) | Immediately after intervention | 0.04 | 0.01–0.13 | <0.001* | Two yr after intervention, treatment group had a mean earned income of $13,393 and had worked for a mean of 30.8 mo; comparison group earned $7,550 and worked for 16.9 mo. |
| 4–6 yrs after intervention | 5.83 | 0.99–34.38 | 0.05 | ||
| Project SEARCH + ASD supports | |||||
| Wehman et al. (2014); Wehman et al. (2017) | Immediately after intervention | 48.88 | 5.57–428.64 | <0.001* | Treatment group had significantly lower support intensity needs than comparison group immediately after intervention and 12 mo later*. |
| 3 mo after intervention | 158.67 | 15.25–1650.58 | <0.001* | ||
| 12 mo after intervention | 54.00 | 8.87–328.82 | <0.001* | ||
| Wehman et al. (2020) | Immediately after intervention | 9.26 | 2.07–41.38 | 0.003* | One yr following intervention, treatment group earned a mean hourly wage of $9.60 and worked 21.2 hr per wk, while the comparison group earned $8.68 and worked 16.88 hr per wk. |
| 12 mo after intervention | 13.81 | 4.23–45.12 | <0.001* | ||
| PROMISE | |||||
| Mamun et al. (2019, Arkansas) | 18 mo after random assignment | 5.13 | 4.06–6.49 | <0.001* | Treatment group had significantly more youth who worked for pay (+30.6% ), higher mean total earnings (+$1,213)*, and weekly hr (+2.7)* in the yr before the 18-mo survey. |
| Mamun et al. (2019, ASPIRE); Ipsen et al. (2019a); Ipsen et al. (2019b) | 12 mo after random assignment | 1.63b | – | – | No significant between-group differences in expectations to work for pay 12 mo after enrollment in the study. |
| 18 mo after random assignment | 1.34 | 1.05–1.71 | 0.02* | Treatment group had significantly more youth who worked for pay (+4.8% )* in the yr before the 18-mo survey. | |
| 24 mo after random assignment | 1.30b | – | – | No significant between-group differences in expectations to work for pay 24 mo after enrollment in the study. | |
| 36 mo after random assignment | 1.06b | – | – | Treatment group had significantly higher expectations to work for pay than comparison group 36 mo after enrollment in the study*. | |
| Mamun et al. (2019, California) | 18 mo after random assignment | 2.97 | 2.34–3.78 | <0.001* | Treatment group had significantly more youth who worked for pay (+21.0% )*, higher mean total earnings (+$343)*, and weekly hr (+0.7)* in the yr before the 18-mo survey. |
| Mamun et al. (2019, Maryland) | 18 mo after random assignment | 2.43 | 1.93–3.04 | <0.001* | Treatment group had significantly more youth who worked for pay (+16.8% )*, higher mean total earnings (+$531)*, and weekly hr (+1.3)* in the yr before the 18-mo survey. |
| Mamun et al. (2019, New York State) | 18 mo after random assignment | 1.35 | 1.08–1.67 | 0.008* | Treatment group had significantly more youth who worked for pay (+4.5% )* in the yr before the 18-mo survey. |
| Mamun et al. (2019, Wisconsin) | 18 mo after random assignment | 1.63 | 1.32–2.02 | <0.001* | Treatment group had significantly more youth who worked for pay (+13.6% )*, higher mean total earnings (+$394)*, and weekly hr (+0.9)* in the yr before the 18-mo survey. |
| STETS | |||||
| Riccio &Price (1984); Bangser (1985); Kerachsky et al. (1985); Kerachsky et al. (1987)b | 6 mo after intervention | 1.12 | 0.53–2.33 | 0.77 | Treatment group had significantly higher weekly wages ($41) than comparison group ($29) 22 mo following intervention*. No significant group differences in youth participating in unpaid training. |
| 15 mo after intervention | 1.76 | 1.09–2.32 | 0.02* | ||
| 22 mo after intervention | 1.92 | 1.21–3.04 | 0.006* | ||
| Summer work intervention package | |||||
| Carter et al. (2009) | Immediately after intervention | 6.48 | 1.66–25.23 | 0.007* | Youth in both groups worked in a variety of jobs, including cleaning, childcare, food services, and clerical work. |
| Carter et al. (2011) | Immediately after intervention | 2.82 | 0.90–8.91 | 0.08 | After the intervention, 87% of treatment group reported they were satisfied or very satisfied with how they spent the summer, 63% felt their summer activities helped prepare them for life after high school, and 75% were satisfied with their community involvement. |
| TAKE CHARGE | |||||
| Powers et al. (2012) | Immediately after intervention | 2.74 | 0.80–9.32 | 0.11 | The treatment group had accessed significantly more transition services (e.g., Vocational Rehabilitation) than the comparison group immediately after intervention* and 1 yr later*. |
| 12 mo after intervention | 2.08 | 0.72–6.01 | 0.18 | ||
| Geenan et al. (2013) | Immediately after intervention | 0.80 | 0.39–1.65 | 0.55 | The treatment group had participated in significantly more career preparation activities (e.g., talked with family about career interests; job shadowed) than the comparison group immediately after intervention*. This difference was not significant 9 mo later. |
| 9 mo after intervention | 2.61 | 1.26–5.40 | 0.01* | ||
| YTDP | |||||
| Fraker et al. (2014; Erie County) | 12 mo after random assignment | 1.13 | 0.84–1.51 | 0.43 | At 12 mo after random assignment, treatment group had higher mean total earnings (+$35); smaller percentage of treatment group youth employed than comparison group at time of 36-mo survey (–3.4% ); treatment group had worked more mean total hr (+37) at 36 mo. |
| 18 mo after random assignment | 1.29 | 0.93–1.79 | 0.13 | ||
| Fraker et al. (2014; Bronx County) | 12 mo after random assignment | 1.60 | 1.16–2.22 | 0.005* | At 12 mo after random assignment, treatment group had higher mean total earnings (+$14); greater percentage of treatment group youth employed at time of 36-mo survey (+5.3% ); treatment group had worked less mean total hr than control (–6) at 36 mo. |
| 18 mo after random assignment | 0.73 | 0.48–1.09 | 0.13 | ||
| Fraker et al. (2014; Colorado) | 12 months after random assignment | 1.05 | 0.78–1.43 | 0.74 | At 12 mo after random assignment, treatment group had lower mean total earnings (–$274); smaller percentage of treatment group youth employed at time of 36-mo survey (–2.1% ); treatment group had worked less mean total hr (–29) at 36 mo. |
| 18 months after random assignment | 0.90 | 0.64–1.26 | 0.53 | ||
| Fraker et al. (2014; West Virginia) | 12 months after random assignment | 2.42 | 1.76–3.33 | <0.001* | At 12 mo after random assignment, treatment group had significantly higher mean total earnings (+$524)*; greater percentage of treatment group youth employed than comparison group at time of 36-mo survey (+3.6% ). |
| 18 months after random assignment | 1.25 | 0.86–1.81 | 0.02* | ||
| Fraker et al. (2014; Miami-Dade County); Fraker et al. (2018) | 12 months after random assignment | 1.94 | 1.31–2.88 | 0.001* | At 12 mo after random assignment, treatment group had higher mean total earnings (+$306); greater percentage of treatment group youth employed than comparison group at time of 36-mo survey (+1.6% ); treatment group had worked more mean total hr (+66) at 36 mo. |
| 18 months after random assignment | 1.12 | 0.74–1.68 | 0.59 | ||
| Fraker et al. (2014; Montgomery County) | 12 months after random assignment | 1.22 | 0.88–1.70 | 0.24 | At 12 mo after random assignment, treatment group had lower mean total earnings (–$346); more treatment group youth were employed at time of 36-mo survey (+1.3% ); treatment group had worked more mean total hr (+110) at 36 mo. |
| 18 months after random assignment | 1.05 | 0.76–1.44 | 0.79 | ||
| Other | |||||
| La Greca et al. (1983)b | 5 weeks after intervention | 30.00 | 2.63–342.75 | 0.006* | Skills-training group worked significantly more mean total days (31.27)* than coaching group (23.00) and comparison group (13.67).* Significant differences in employment between coaching group and comparison group at 5 wk* but not 7 wk. |
| 7 weeks after intervention | 50.00 | 3.88–643.90 | 0.003* | ||
| Bernacchio & Fortinsky (1988)b | 12 months after intervention | 2.08 | 0.32–13.78 | 0.45 | At a mean time point of 12 mo after intervention, 84% of treatment group and 68% of comparison group reported feeling satisfied or very satisfied with current employment. |
| Edwards et al. (1988)b | Not reported | 3.09c | – | – | Treatment group obtained jobs in seven occupational areas; comparison group obtained jobs in five areas. |
| Balcazar et al. (2012)b | Immediately after intervention | 9.38 | 3.53–24.90 | <0.001* | Treatment group had higher mean wages (+$1.17)* following intervention and worked a mean of 28 hr per week. |
| Duersch (2013) | Not reported | 5.41 | 0.94–30.97 | 0.06 | Treatment group averaged $8.79 per hr and 22.86 hr per week; comparison group earned $7.25 and averaged 21 hr. |
Note: *=p < 0.05. ASD = Autism Spectrum Disorder; PROMISE = Promoting the Readiness of Minors in Supplemental Security Income; STETS = Structured Training and Employment Transitional Services; YTDP = Youth Transition Demonstration Project; CI = confidence intervals; hr = hours; mo = months; wk = weeks; yr = years. aOdds of employment after receiving the intervention compared to odds of employment after not receiving the intervention; measure may have included unpaid employment, segregated work, or non-current employment. bStudy met less than 50% of methodological quality indicators (see Table 2). cInsufficient information provided to determine confidence intervals and p-value.
Overall, studies using the Project SEARCH + ASD Supports model yielded particularly large positive odds ratios that maintained for 12 months after the intervention concluded due to minimal or no comparison group youth ever gaining employment in these studies. Although all studies applying intervention components from the PROMISE model maintained positive odds ratios, they ranged in size across studies. Similarly, YTDP evaluations ranged in odds ratios, with some being negative. Each of these studies were identified to have met a majority of quality indicators; nonetheless, La Greca et al. (1983) and Balcazar et al. (2012) yielded particularly large odds ratios but had met less than 50% of quality indicators. See the specific note in Table 3 designating those studies with minimal methodological quality.
3.3.2Employment characteristics
Table 3 also summarizes findings regarding emp-loyment characteristics. Eleven studies (44.0%) examined group differences in frequency of work; of these, five (45.0%) reported a significant positive effect. Twelve studies (48.0%) examined income differences; seven (58.3%) reported a significant positive effect. Studies reporting type of employment usually did so descriptively, and jobs obtained across groups tended to involve entry-level positions in various industries (e.g., retail, clerical, cleaning, food services, childcare). Carter et al. (2011) found that youth in the treatment group obtained widely varied jobs, while comparison youth primarily obtained food service jobs. Similarly, Edwards et al. (1988) found that youth in the treatment group obtained work in more occupational areas than comparison youth.
A handful of studies measured group differences in other employment characteristics. La Greca et al. (1983) reported that youth who received a skills-training intervention worked significantly more mean total days than youth in either comparison groups. The six YTDP studies reported group differences in insurance benefits and paid time off. Yet, results were mixed across each of these six studies, and some youth in the treatment group actually received less benefits than comparison youth. Some PROMISE studies reported no significant differences in expectations for work following intervention, while others found a significant positive effect in follow-up expectations for work.
Many other employment characteristics were reported descriptively. Some outcomes were reported through categorical measures (e.g., youth unemployed for various reasons). Others used ordinal measures (e.g., youth satisfaction with job, employer satisfaction with youths’ work performance, extent to which youth were integrated at work). Finally, some outcomes were reported anecdotally (e.g., work performance). Although some of these outcomes tended to be measured before and after intervention (e.g., career development goals), others tended to be measured only after intervention (e.g., job alignment, work performance, employer satisfaction).
4Discussion
Identifying transition interventions that lead to paid work for youth with disabilities is crucial for reducing the persistent and pervasive employment gaps that exist nationally (Erickson et al., 2021). In our previous scoping review, we provided a detailed synthesis of patterns and trends with respect to the intervention components used within this body of research, such as employment preparation, job placement and support, other supports for youth, supports for other stakeholders, and collaborative and organizational strategies (Schutz & Carter, 2022). In the current review, we have (a) captured the methodological quality of employment interventions conducted with transition-age youth with disabilities and (b) examined the efficacy of these interventions for leading to subsequent employment. Our findings yield important implications for interpreting the results of previous interventions that have connected youth with disabilities to employment, shed light on areas of methodological quality that should be addressed by future research, and highlight interventions that have led to subsequent work experiences for youth with disabilities.
The studies in this review were of varied methodological quality. Of the 25 studies, 20 met more than half of quality indicators, but some met very few indicators and possessed issues in multiple areas of quality. Recent studies tended to address more indicators than older studies, suggesting improvements over time. Although quality is important to consider for all studies, several studies in this review were conducted prior to the establishment of methodological standards or published within gray literature without requirements for reporting the information needed to evaluate these quality indicators. Future research should address the limitations of these studies, particularly with attention to treatment fidelity. In line with other areas of special education (e.g., Sanetti & Luh, 2019; Swanson et al., 2013), many studies in this review lacked measures of treatment fidelity or offered only thin depictions. As employment interventions tend to be highly individualized and conducted by many stakeholders across multiple settings (see Schutz & Carter, 2022), assessing fidelity can be particularly challenging but takes on heightened importance for understanding how stakeholders can improve employment gaps that have persisted for decades (Trainor et al., 2020). Future studies should incorporate more direct and detailed fidelity measures when possible, rather than relying so heavily on self-report or blunt categorizations. For example, an observer could use a checklist to document fidelity for addressing relevant discussion points at employment planning meetings (e.g., transportation to a potential job, family scheduling needs) or for verifying that all areas of support at a potential workplace have been addressed. Similar procedures have been used in the literature for planning employment for transition-age youth with disabilities (e.g., Hagner et al., 2012).
Several studies also lacked key quality indicators of internal validity. Understanding what differentiates the experiences of youth by their study condition is the only way to ascertain how one set of experiences is more advantageous than another. Yet, multiple studies never described the comparison condition beyond naming it as business-as-usual transition services. Transition services vary widely across districts and agencies (Lipscomb et al., 2017); thus, detailed information on the experiences of comparison youth must be provided to understand what really leads to work. In addition, nearly half of studies lacked procedures for limiting intervention carryover. Thus, comparison youth in schools or classrooms marked by high-quality transition programming might have accessed some of the same experiences as youth participating in interventions (e.g., work experiences), particularly in studies in which educators supported both intervention and comparison youth or interventions addressed school or community factors. Future studies should clearly describe comparison conditions and explain procedures for limiting carryover, as done so in all reviewed PROMISE and YTD evaluations. Finally, although no studies reported use of blind examiners or coders given that employment status was typically self-reported by participants or their families members, future studies could increase the accuracy of their measures using supplemental sources of employment information (e.g., Social Security or Vocational Rehabilitation reporting), as done so in PROMISE and YTD evaluations.
Regarding efficacy, most interventions were associated with increased odds for employment for transition-age youth. Specifically, 80.0% of studies reported higher employment odds for the treatment group than the comparison group, as demonstrated by a positive odds ratio at some timepoint following intervention. In most of these studies, the findings were statistically significant. These findings highlight several interventions that stakeholders charged with preparing youth for work can draw upon to increase access to employment experiences during and after high school. Nonetheless, it is important to recognize that five studies (i.e., Balcazar et al., 2012; Bernacchio & Fortinsky; Edwards et al., 1988; La Greca et al., 1983; and those publications reporting on the STETS intervention) yielded positive odds ratios but met less than half of quality indicators due to a lack of reporting on methodological information; therefore, the results of these studies should be interpreted with caution.
Nonetheless, questions remain regarding the lon-ger-term impact of these interventions on employment status as youth enter adulthood. Collectively, these studies measured employment at several different timepoints, and most studies addressed multiple timepoints. Although the odds of employment for treatment youth increased over time in nearly half of these studies, odds decreased in others (although they often remained higher in treatment than comparison group). As recommended by Trainor and colleagues (2020) in their framework for future transition research, the reasons for these variations should be examined in future studies that account for both (a) proximal measures of work during or shortly after high school as well as (b) distal measures of employment captured in later adulthood. It may be that some youth— such as those with cognitive impairments or behavioral challenges— will need ongoing support to maintain their initial employment status (Awsumb et al., 2022). Likewise, it is possible that youth who exit the education system end up losing services critical to sustaining work over time (Ishler et al., 2022). Changing the employment trajectories of youth with disabilities requires tracking their work pathways and outcomes over time to ensure ongoing engagement in the workforce.
Much less can be said definitively about how these employment interventions impact income, frequency of work, and other job features for transition-age youth. Few studies examined the characteristics of employment obtained as a result of interventions, and of those that did, few assessed between-group differences in these features. Securing meaningful work requires consideration of a host of quality factors, including total number of hours and work schedule, availability of benefits, alignment with interests, opportunities for advancement, integration in the workplace, and overall job satisfaction. Increasing involvement in work is a central goal of transition education, but it is equally important to connect youth with disabilities to jobs that meet their needs, provide a steppingstone to a future career, or can be maintained long-term. Although many of these studies provided some description of the nature of jobs that youth obtained, it is difficult to gauge which interventions are likely to lead to jobs aligned with youth interests and goals or brought them satisfaction and increased quality of life. Future studies should provide a fuller portrait of these work experiences and address their alignment with the preferences and priorities of participating youth using measures of employment characteristics that represent “successful” employment (Trainor et al., 2020).
4.1Limitations and implications for research
Several limitations should be considered when interpreting the findings of this review. First, although this review highlights general patterns regarding the types of interventions that tended to be effective, it could not examine the discrete effectiveness of each individual component included (e.g., job placement). The reviewed employment interventions used with transition-age youth were highly complex, incorporating multiple components, several stakeholders, and many settings, and they were individualized by student and family needs. Future studies should incorporate component analyses to determine components that most effectively and efficiently increase employment outcomes. For example, Schlegelmich et al. (2019) examined the relationships among various components of a PROMISE evaluation and employment outcomes. Additional research that identifies the most effective and efficient components to include in employment interventions could further guide practitioners.
Second, we were unable to aggregate findings across studies to provide an overall effect size for this literature or examine how effectiveness may have varied based on factors like disability type, age, settings, and intervention implementers. Each of the studies operationalized employment status in divergent ways regarding the pay, setting, and timing of work. Future studies should limit employment measures to paid, competitive employment in the community at the time of measurement, as aligned with current policy and legislation (U.S. Department of Labor, 2019). Additionally, research is needed to elucidate the pathways through which youth work experiences shape longer-term employment prospects and well-being. Although most youth who received these interventions obtained work, less is known about how these work experiences translated into future success. For example: Did youth perform their job tasks well enough to advance to higher positions or obtain better jobs down the road? Did having a paid job enhance their quality of life in other ways (e.g., community involvement, better health)? Did integrated work experiences contribute to the development of new friendships? Longitudinal evaluations of transition interventions are needed to determine the extent to which initial employment outcomes contribute to career pathways, financial self-sufficiency, and other indicators of thriving long after the intervention has ended, such as 5, 10, or 15 years later.
Third, this review only addressed information included in available publications. We did not contact authors to gather additional information on implementation, outcomes, or methods. This task would have been difficult to do so consistently for a collection of studies spanning four decades. Conclusions should be made with caution whenever information was not reported, and future studies should comprehensively report information that speaks to all quality indicators.
4.2Implications for practice
Our findings have implications for educators, agency providers, and other stakeholders who support youth with disabilities in connecting to employment. This review identified an array of interventions that can increase the odds of employment for transition-age youth with disabilities. For stakeholders committed to preparing youth for further education, employment, and independent living (italics added; IDEA, 2004), this collection of interventions warrants close consideration. Schools have historically struggled to connect students with disabilities to meaningful career development experiences (e.g., Bouck & Park, 2018; Wehman et al., 2015). Adopting interventions described in this review may provide an avenue for districts to address prevailing employment gaps for graduates with disabilities.
More specifically, it is important to note that, of those features shared amongst studies in this review that (a) met the greatest number of methodological quality indicators and (b) with large, positive odds ratios for employment, the most common practice involved placing youth directly into work experiences to increase their likelihood for subsequent employment. This pattern aligns with previous studies suggesting that paid work during adolescence is predictive of postschool employment for youth with disabilities, as described by Mazzotti and colleagues (2021); yet, youth with IDD rarely experience paid jobs during the transition period (Lipscomb et al., 2017). Practitioners ought to prioritize work experiences for youth with the most significant disabilities as a part of their high school services to develop pathways to postsecondary employment.
5Conclusion
Interventions addressing employment for transi-tion-age youth encompass a spectrum of approaches. The reviewed interventions were generally effective for improving employment status and, in some studies, employment characteristics for youth with disabilities. Although some areas of methodological quality were consistently strong, increased attention is warranted with respect to treatment fidelity and some aspects of internal validity. Future research should highlight the most salient intervention components for impacting employment and identify the extent to which employment outcomes predict future success.
Acknowledgments
The authors do not have an acknowledgment statement for this paper.
Conflict of interest
The authors declare no conflicts of interest.
Ethical approval
This study, as a review, did not require institutional review board approval.
Informed consent
This study did not require informed consent.
Funding
Partial support for this research was provided by a doctoral leadership grant from the U.S. Department of Education, through Grant H325D170004 to Vanderbilt University. Additionally, the content of this manuscript was developed with partial support from a grant from the National Institute on Disability, Independent Living, and Rehabilitation Research (#90RTEM0002) and does not necessarily reflect the views of the funding agency.
References
*Indicates articles referenced in systematic review.
1 | Ali, M , Schur, L , Blanck, P. ((2011) ) What types of jobs do people with disabilities want? Journal of Occupational Rehabilitation 21: (2), 199–210. https://doi.org/10.1007/s10926-010-9266-0 |
2 | Awsumb, J. M , Schutz, M. A , Carter, E. W , Schwartzman, B , Burgess, L , Taylor, J. L. ((2022) ) Pursuing paid employment for youth with severe disabilities: Multiple perspectives on pressing challenges. Research and Practice for Persons with Severe Disabilities 47: (1), 22–39. https://doi.org/10.1177/15407969221075629 |
3 | *Balcazar, F. E , Taylor-Ritzler, T , Dimpfl, S , Portillo-Peña, N , Guzman, A , Schiff, R , Murvay, M. ((2012) ) Improving the transition outcomes of low-income minority youth with disabilities. Exceptionality 20: (2), 114–132. https://doi.org/10.1080/09362835.2012.670599 |
4 | *Bangser, M. R. (1985). Lessons on transitional employment: The STETS demonstration for mentally retarded workers. Man-power Demonstration Research Corporation. |
5 | *Bernacchio, C. , Fortinsky, R. (1988). Improving the post-secondary education and employability of learning disabled students [Paper presentation]. 66th Annual Convention of the Council for Exceptional Children, Washington, DC. https://files.eric.ed.gov/fulltext/ED296543.pdf |
6 | Bouck, E. C , Park, J. ((2018) ) Exploring post-school outcomes across time out of school for students with autism spectrum disorder. Education and Training in Autism and Developmental Disabilities 53: (3), 253–263. |
7 | Carter, E. W , Austin, D , Trainor, A. A. ((2012) ) Predictors of postschool employment outcomes for young adults with severe disabilities. Journal of Disability Policy Studies 23: (1), 50–63. https://doi.org/10.1177/1044207311414680 |
8 | Carter, E. W , Awsumb, J. M , Schutz, M. A , McMillan, E. D. ((2021) ) Preparing youth for the world of work: Educator perspectives on pre-employment transition services. Career Development and Transition for Exceptional Individuals 44: (3), 161–173. https://doi.org/10.1177/2165143420938663 |
9 | *Carter, E. W , Trainor, A. A , Ditchman, N , Owens, L. A. ((2011) ) A pilot study connecting youth with emotional and behavioral difficulties to summer work experiences. Career Development for Exceptional Individuals 34: (2), 95–106. https://doi.org/10.1177/0885728810395745 |
10 | *Carter, E. W , Trainor, A. A , Ditchman, N , Swedeen, B , Owens, L. ((2009) ) Evaluation of a multi-component intervention package to increase summer work experiences for transition-age youth with severe disabilities. Research and Practice for Persons with Severe Disabilities 34: (2), 1–12. https://doi.org/10.2511/rpsd.34.2.1 |
11 | Cook, B. G , Odom, S. L. ((2013) ) Evidence-based practices and implementation science in special education. Exceptional Children 79: (3), 135–144. https://doi.org/10.1177/001440291307900201 |
12 | Cooper, H. (2016). Research synthesis and meta-analysis. SAGE.. |
13 | Council for Exceptional Children. ((2014) ) Council for exceptional children standards for evidence-based practices in special education. Exceptional Children 80: (4), 504–511. https://doi.org/10.1177%2F0040059914531389 |
14 | *Duersch, J.A. (2013). A comparison of social media job search versus traditional job search methods on employment of students with moderate to severe disabilities. (Master’s thesis). ProQuest Dissertations and Theses database. (UMI No. 1550145). |
15 | *Edwards, J.P , Kinneldorf, M , Bradley, C. (1988). Final report of the Portland State University secondary school to work transition projects emphasizing transition to work and leisure roles. Portland State University. |
16 | Erickson, W , Lee, C , Von Schrader, S. (2021). Disability statistics from the 2018 American Community Survey. Cornell University Yang-Tan Institute (YTI). https://www.disabilitystatistics.org/StatusReports/2018-PDF/2018-StatusReport_US.pdf |
17 | *Fraker, T. M , Crane, K. T , Honeycutt, T. C , Luecking, R. G , Mamun, A. A , O’Day, B. L. ((2018) ) The youth transition demonstration project in Miami, Florida: Design, implementation, and three-year impacts. Journal of Vocational Rehabilitation 48: (1), 79–91. https://doi.org/10.3233/JVR-170917 |
18 | *Fraker, T. M , Mamun, A. A , Honeycutt, T. C , Thompkins, A , Valentine, E. J. (2014). Final report on the youth transition demonstration evaluation. https://www.mathematica.org/our-publications-and-findings/publications/final-report-on-the-youth-transition-demonstration-evaluation |
19 | *Geenen, S.J , Powers, L , Powers, J , Cunningham, M , McMahon, L , Nelson, M , Dalton, L.D , Swank, P , Fullerton, A. ((2013) ) Experimental study of a self-determination intervention for youth in foster care. Career Development for Exceptional Individuals 36: (2), 84–95. https://doi.org/10.1177%2F2165143412455431 |
20 | Gilson, C. B , Carter, E. W , Biggs, E. E. ((2017) ) Systematic review of instructional methods to teach employment skills to secondary students with intellectual and developmental disabilities. Research and Practice for Persons with Severe Disabilities 42: (2), 89–107. https://doi.org/10.1177/1540796917698831 |
21 | Haber, M. G , Mazzotti, V. L , Mustian, A. L , Rowe, D. A , Bartholomew, A. L , Test, D. W , Fowler, C. H. ((2016) ) What works, when, for whom, and with whom: A meta-analytic review of predictors of postsecondary success for students with disabilities. Review of Educational Research 86: (1), 123–162. https://doi.org/10.3102/0034654315583135 |
22 | Haddock, C. K , Rindskopf, D , Shadish, W. R. ((1998) ) Using odds ratios as effect sizes for meta-analysis of dichotomous data: A primer on methods and issues. Psychological Methods 3: (3), 339–353. https://doi.org/10.1037/1082-989X.3.3.339 |
23 | Hagner, D , Kurtz, A , Cloutier, H , Arakelian, C , Brucker, D. L , May, J. ((2012) ) Outcomes of a family-centered transition process for students with Autism Spectrum Disorders. Focus on Autism and Other Developmental Disabilities 27: (1), 42–50. https://doi.org/10.1177/1088357611430841 |
24 | Harvey, M. W , Rowe, D. A , Test, D. W , Imperatore, C , Lombardi, A , Conrad, M , Szymanski, A , Barnett, K. ((2020) ) Partnering to improve career and technical education for students with disabilities: A position paper of the Division on Career Development and Transition. Career Development and Transition for Exceptional Individuals 43: (2), 67–77. https://doi.org/10.1177/2165143419887839 |
25 | Individuals with Disabilities Education Improvement Act of 2004. 20 U.S.C. 1400 et seq. (2004). |
26 | *Ipsen, C. , Kurth, N. , McCormick, S. , Hall, J. , Chambless, C. ((2019) a) Exploring the PROMISE of transition services for youth with disabilities receiving SSI. Journal of Vocational Rehabilitation 50: (1), 95–108. https://doi.org/10.3233/JVR-180991 |
27 | *Ipsen, C. , Kurth, N. , McCormick, S. , Hall, J. , Chambless, C. ((2019) b) Engaging SSI youth and families with ASPIRE services. Journal of Vocational Rehabilitation 51: (1), 1–14. https://doi.org/10.3233/JVR-191039 |
28 | Ishler, K , Biegel, D , Wang, F , Olgac, T , Lytle, S , Miner, S , Edguer, M , Kaplan, R. ((2022) ) Service use among transition-age youth with Autism Spectrum Disorder. Journal of Autism and Developmental Disorders 52: (1)). https://doi.org/10.1007/s10803-021-04999-6 |
29 | *Izzo, M. (1999). The effects of transition services on outcome measures of employment for vocational students with disabilities. (Doctoral dissertation). ProQuest Dissertations and Theses database. (UMI No. 9900850). |
30 | *Izzo, M. V , Cartledge, G , Miller, L , Growicki, B , Rutkowski, S. ((2000) ) Increasing employment earnings: Extended transition services that make a difference. Career Development for Exceptional Individuals 23: (2), 139–156. https://doi.org/10.1177/088572880002300203 |
31 | *Kerachsky, S , Thornton, C. ((1987) ) Findings from the STETS transitional employment demonstration. Exceptional Children 53: (6), 515–521. https://doi.org/10.1177/001440298705300605 |
32 | *Kerachsky, S , Thornton, C , Bloomenthal, A , Maynard, R , Stephens, S. (1985). Impacts of transitional employment on mentally retarded young adults: Results of the STETS demonstration. Mathematica Policy Research. |
33 | *La Greca, A. M , Stone, W. L , Bell, C. R. ((1983) ) Facilitating the vocational-interpersonal skills of mentally retarded individuals. American Journal of Mental Deficiency 88: (3), 270–278. https://pubmed.ncbi.nlm.nih.gov/6650578/ |
34 | Leahy, M , Chan, F , Lui, J , Rosenthal, D , Tansey, T , Wehman, P , Kundu, M , Dutta, A , Anderson, C , Valle, R , Sherman, S , Menz, F. ((2014) ) An analysis of evidence-based best practices in the public vocational rehabilitation program: Gaps, future directions, and recommended steps to move forward. Journal of Vocational Rehabilitation 41: (2), 147–163. https://doi.org/10.3233/JVR-140707 |
35 | Lipscomb, S , Haimson, J , Liu, A. Y , Burghardt, J , Johnson, D. R , Thurlow, M. L. (2017). Preparing for life after high school: The characteristics and experiences of youth in special education (Vol. 2). U.S. Department of Education. |
36 | *Mamun, A , Patnaik, A , Levere, M , Livermore, G , Honeycutt, T , Kauff, J , Katz, K , McCutcheon, A , Mastrianni, J , Gionfriddo, B. (2019) Promoting readiness of minors in SSI (PROMISE) evaluation: Interim services and impact report. Mathematica. |
37 | Mazzotti, V. L , Rowe, D. A , Kwiatek, S , Voggt, A , Chang, W.-H , Fowler, C. H , Poppen, M , Sinclair, J , Test, D. W. ((2021) ) Secondary transition predictors of postschool success: An update to the research base. Career Development and Transition for Exceptional Individuals 44: (1), 47–64. https://doi.org/10.1177/2165143420959793 |
38 | National Core Indicators. ((2018) ). NCI charts. Available: https://www.nationalcoreindicators.org |
39 | *Powers, L. E , Geenen, S , Powers, J , Pommier-Satya, S , Turner, A , Dalton, L. D , Drummond, D , Swank, P. ((2012) ) My life: Effects of a longitudinal, randomized study of self-determination enhancement on the transition outcomes of youth in foster care and special education. Children and Youth Services Review 34: (11), 2179–2187. https://doi.org/10.1016/j.childyouth.2012.07.018 |
40 | *Riccio, J , Price, M. (1984). A transitional employment strategy for the mentally retarded: The final STETS implementation report. https://files.eric.ed.gov/fulltext/ED261506.pdf |
41 | Sanetti, L. M. H , Luh, H. J. ((2019) ) Fidelity of implementation in the field of learning disabilities. Learning Disability Quarterly 42: (4), 204–216. https://doi.org/10.1177/0731948719851514 |
42 | Schlegelmilch, A , Roskowski, M , Anderson, C , Hartman, E , Decker-Maurer, H. ((2019) ) The impact of work incentives benefits counseling on employment outcomes of transition-age youth receiving Supplemental Security Income (SSI) benefits. Journal of Vocational Rehabilitation 51: (2), 127–136. https://doi.org/10.3233/JVR-191032 |
43 | Schoonjans, F. (2008). MedCalc Statistical Software (Version 9.5.2.0) [Computer software]. 3D2F.COM Software Directory: http://3d2f.com/programs/13-638-medcalc-statisticalsoftware-download.shtml |
44 | Schutz, M. A , Carter, E. W. (2022). Employment interventions for youth with disabilities: A review of transition practices and partners. Career Development and Transition for Exceptional Individuals. Advanced online publication. https://doi.org/10.1177/21651434221075810 |
45 | Shogren, K. A , Wehmeyer, M. L , Palmer, S. B , Rifenbark, G. G , Little, T. D. ((2015) ) Relationships between self-determination and postschool outcomes for youth with disabilities. The Journal of Special Education 48: (4), 256–267. https://doi.org/10.1177/0022466913489733 |
46 | Snell-Rood, C , Ruble, L , Kleinert, H , McGrew, J. H , Adams, M , Rodgers, A , Odom, J , Wong, W. H , Yu, Y. ((2020) ) Stakeholder perspectives on transition planning, implementation, and outcomes for students with autism spectrum disorder. Autism 24: (5), 1164–1176. https://doi.org/10.1177/1362361319894827 |
47 | Swanson, E , Wanzek, J , Haring, C , Ciullo, S , McCulley, L. ((2013) ) Intervention fidelity in special and general education research journals. The Journal of Special Education 47: (1), 3–13. https://doi.org/10.1177/0022466911419516 |
48 | Test, D. W , Mazzotti, V. L , Mustian, A. L , Fowler, C. H , Kortering, L , Kohler, P. ((2009) ) Evidence-based secondary transition predictors for improving postschool outcomes for students with disabilities. Career Development for Exceptional Individuals 32: (3), 160–181. https://doi.org/10.1177/0885728809346960 |
49 | Trainor, A. A , Carter, E. W , Karpur, A , Martin, J. E , Mazzotti, V. L , Morningstar, M. E , Newman, L , Rojewski, J. W. ((2020) ) A framework for research in transition: Identifying important areas and intersections for future study. Career Development and Transition for Exceptional Individuals 43: (1), 5–17. https://doi.org/10.1177/2165143419864551 |
50 | Trainor, A. A , Carter, E. W , Owens, L. A , Swedeen, B. ((2008) ) Special educators’ perceptions of summer employment and community participation opportunities for youth with disabilities. Career Development for Exceptional Individuals 31: (3), 144–153. https://doi.org/10.1177/0885728808323717 |
51 | U.S. Department of Labor Office of Disability Employment Policy (2019). Employment First. Retrieved from: https://www.dol.gov/odep/topics/employmentfirst.htm |
52 | *Wehman, P , Schall, C. M , McDonough, J , Graham, C , Brooke, V , Riehle, J. E , Brooke, A , Ham, W , Lau, S , Allen, J , Avellone, L. ((2017) ) Effects of an employer-based intervention on employment outcomes for youth with significant support needs due to autism. Autism, 21: (3), 276–290. https://doi.org/10.1177/1362361316635826 |
53 | *Wehman, P. H , Schall, C. M , McDonough, J , Kregel, J , Brooke, V , Molinelli, A , Ham, W , Graham, C. W , Riehle, E , Collins, H. T , Thiss, W. ((2014) ) Competitive employment for youth with autism spectrum disorders: Early results from a randomized clinical trial. Journal of Autism and Developmental Disorders 44: (3), 487–500. https://doi.org/10.1007/s10803-013-1892-x |
54 | *Wehman, P , Schall, C , McDonough, J , Sima, A , Brooke, A , Ham, W , Whittenburg, H , Brooke, V , Avellone, L , Riehle, E. ((2020) ) Competitive employment for transition-aged youth with significant impact from Autism: A multi-site randomized clinical trial. Journal of Autism and Developmental Disorders 50: (6), 1882–1897. https://doi.org/10.1007/s10803-019-03940-2 |
55 | Wehman, P , Sima, A. P , Ketchum, J , West, M. D , Chan, F , Luecking, R. ((2015) ) Predictors of successful transition from school to employment for youth with disabilities. Journal of Occupational Rehabilitation 25: (2), 323–334. https://doi.org/10.1007/s10926-014-9541-6 |
56 | Will, M. (1984). OSERS programming for the transition of youth with disabilities: Bridges from school to working life. Office of Special Education and Rehabilitative Services. https://files.eric.ed.gov/fulltext/ED256132.pdf |


