
The development and validation of the workplace acceptance scale: Evidence from a sample of workers with disabilities
Abstract
BACKGROUND:
Recent trends in demographics and the labor market, such as an aging workforce, bring forth a significant societal transformation and force organizations to conform to new circumstances. Diversity management strategies may help to counteract negative outcomes of these developments. However, organizational diversity triggers various reactions among the established workforce, evoking positive as well as negative social dynamics.
OBJECTIVE:
In order to better understand the dynamics that arise from workplace diversity, specifically from workplace disability, the present paper outlines the development of an eleven-item measure of perceived workplace acceptance.
METHODS:
Three independent samples of employees with disabilities (including multisource data) were used to demonstrate the reliability and validity of the scale.
RESULTS:
The scale shows good psychometric properties and exploratory as well as confirmatory factor analyses indicate that workplace acceptance is a unidimensional construct. The study shows that the scale is significantly related to constructs such as health and productivity, self-esteem, intent to leave, motivation, organizational commitment, and attitudes of colleagues, providing evidence for criterion-related validity.
CONCLUSIONS:
Overall, the present study provides evidence for the validity of the Workplace Acceptance Scale and suggests that the workplace acceptance construct has important implications for both individuals with disabilities and groups of colleagues.
1Introduction
Recent trends in demographics and the labor market, such as an aging workforce, automation and digitalization, bring forth a significant societal transformation (European Commission, 2008; Rotman, 2017) and force organizations to conform to new cir-cumstances. One strategy to counteract negative outcomes of these developments is to re-think diversity management strategies. However, organizational diversity triggers various reactions among the established workforce, evoking positive as well as negative social dynamics (Stuart, 2006). In order to better understand the dynamics that arise from workplace diversity, the present paper introduces a newly developed scale to measure workplace acceptance.
Organizational diversity is a broad concept that embraces age, ethnicity, gender, sexual orientation, cultural differences, and disability (Shore et al., 2009). In this paper we exclusively focus on work disability as one dimension of diversity and investigate how it affects the social dynamics in organizations. While in psychological research the negative dynamics that derive from organizational diversity such as stereotyping, prejudice, discrimination, social exclusion or ostracism are very well understood (Shore et al., 2009), we understand to a far lesser extent the positive outcomes of workplace diversity and what is necessary to generate those outcomes (Konrad, Yang, & Maurer, 2016). One reason is that there are few established concepts describing the positive dynamics of workplace inclusion in general, and those that exist are widely understudied in psychological science (Shore et al., 2009). We want to contribute to the existing literature by introducing the concept of workplace acceptance. To be accepted in a group of people is a basic human need and research on this topic can be traced back to social theories developed in the early nineties (Baron, Branscombe, & Byrne, 2009; Baumeister & Leary, 1995). The need to belong is described as a powerful, fundamental, and extremely pervasive motivation that underlies the desire to form and maintain social bonds (Baumeister & Leary, 1995). Work and the social affiliation with a group of colleagues is one opportunity to fulfill this need (Lysaght, Cobigo, & Hamilton, 2012; Stuart, 2006). Acceptance can therefore be understood as an important element of the social dynamics that evolve from workplace diversity.
We directed the present research effort toward the development and initial validation of a measure of workplace acceptance, thereby focusing on the individual perception of acceptance. More specifically, we developed a scale that records the individually perceived level of acceptance of a worker with disability within a group of colleagues. In doing so, we aim to provide a convenient and versatile standard measure for workplace acceptance. We hope that such a measure will better empower researchers to analyze the effects of workplace acceptance in relation to other constructs of workplace diversity. Validation of the scale occurred in two phases: (1) the generation of the items and the assessment of the psychometric properties, and (2) the assessment of the criterion-related validity of the scale. Finally, we discuss relevant outcomes and pitfalls discovered during the process. The development of a scale to assess the concept of acceptance is a first step to foster research into the positive dynamics of inclusive work teams.
1.1Theoretical background
For most of us the affiliation with a group of colleagues goes without saying and satisfies our need to belong to some extent. However, there are groups of people who are seriously underemployed and lack opportunities of being associated with groups of acquaintances. Among those who have only limited access to this opportunity of belonging are people with disabilities (Vornholt et al., 2018). Not only do they have limited access to the labor market, they are also still afflicted with extremely high de-grees of employment discrimination (Bjelland et al., 2010; Stuart, 2006) such as stereotyping, harassment, marginalization, as well as discrimination aga-inst hiring, promotion, and job retention (Durand, Corbière, Coutu, Reinharz, & Albert, 2014; Scheid, 2005; Williams, Fossey, Corbière, Paluch, & Harvey, 2016).
About 14% of the European population of working age (15– 59 years) experience a moderate to severe work disability (WHO, 2004). Disability is a broad concept and varies from minor difficulties in functioning to major impacts on a person’s life. Disability is interpreted in relation to what is considered normal functioning. However, the common social norm can differ based on the context, age group, or other environmental factors (Muschalla, Vilain, Lawall, Lewerenz, & Linden, 2012). According to the International Classification of Functioning (ICF; WHO, 2001), a disability exists when the degree and type of impairment causes difficulties in a certain environment with particular activity demands, such as the work environment. In terms of this model, disability is used as an umbrella term for all possible deficits in body functions, structures, activities and participation (Linden, Baron, & Muschalla, 2010).
The workplace integration of people with disabilities has become an important new topic in work and organizational psychology and research has increased especially since the passage of the Americans with Disabilities Act (ADA, 1990) in the United States (Shore et al., 2009). The concepts “participation” and “integration” are frequently defined in terms of the prevalence of activities or contact with others rather than in terms of social outcomes, such as meaningful relationships. Social inclusion, however, also contains the personal experience of inclusion, embracing perceptions of being accepted and recognized as an individual beyond the disability (Lysaght et al., 2012). Similarly, workplace inclusion is considered to be the extent to which people with disabilities are accepted, helped, and treated as others by their cowo-rkers (Stone & Colella, 1996). Acceptance can thus be seen as an important aspect of inclusion into the social network and dynamics at work. The definition of acceptance we use for the present study is based on the Theory of Reasoned Action (Fishbein & Ajzen, 1975), which suggests that a person’s behavior is pre-dicted by the attitudes toward this behavior as well as the person’s expectations regarding reactions of others when performing the behavior in question. Acceptance can then be understood as an outcome or consequence of attitudes toward people with disa-bilities; an evaluative response on multiple dimensions (Vornholt, Uitdewilligen, & Nijhuis, 2013). Ev-aluative responses to attitudes contain a cognitive, affective, and behavioral dimension, sometimes ref-erred to as the three components of attitudes in tr-aditional social psychological research (Eagly & Chaiken, 1993). The cognitive component includes thoughts and beliefs, the affective component refers to feelings and emotions, and the behavioral component includes reactions and behaviors (see Fig. 1 for a graphical display).
Fig. 1
Relationship of the theory of reasoned action and the concept of workplace acceptance.
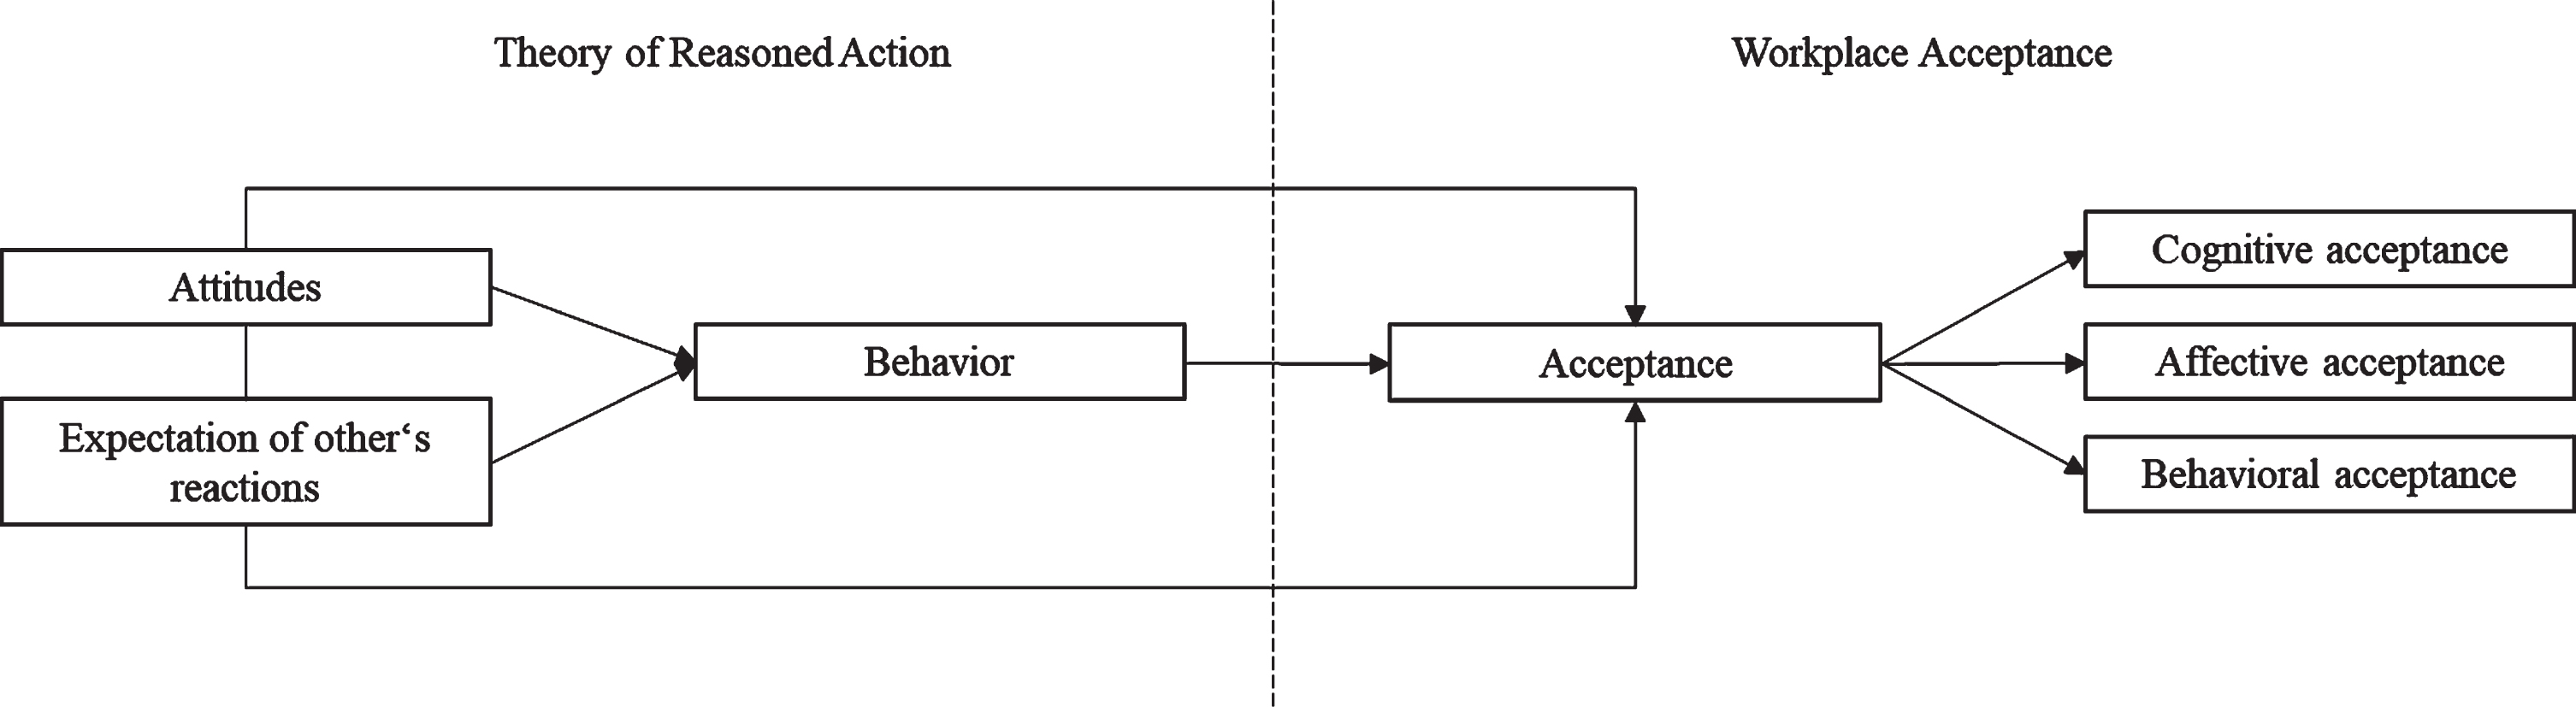
In this study, we operationalize the concept of acceptance from the individual perception of an employee with disability regarding displayed behavior, affect, and cognitions of the direct colleagues. We outline the concept of perceived acceptance as acknowledging oneself as an important member of a group of colleagues, experiencing support, feeling comfortable and appreciating being part of the group, having access to all common areas and events, and being integrated in professional and social activities.
It should be noted that, although we validate the present scale in a very specific sample, the scale is not particularly developed for certain types of disabilities or other minorities. It can be used for a large range of groups at risk of experiencing rejection.
2Overview of the studies
In order to create a reliable and valid measure of workplace acceptance, we followed the recommended steps by Hinkin (1998), that include an initial generation of potential items and their refinement, followed by confirmatory factor analysis and the examination of criterion related validity. Below, we present the results of these studies in two phases. In phase 1 we describe the development of potential items and the refinement of those into an 11-item scale. Additionally, we provide details on the psychometric properties of the scale such as reliability estimates and factor structure. Phase 2 details the criterion-related validity of the scale. We collected three independent samples consisting of in total 495 participants.
Because part of the study (sample 2 and sample 3) was conducted in a Dutch- and German-speaking context, all measures were translated from English to Dutch and German by a professional translator and then back-translated by a second translator. Discrepancies observed between the versions were resolved by presenting the Dutch and German version to a native speaker who reassessed the version on readability. Unless otherwise noted, all ratings in this article were anchored with a 5-point Likert scale ranging from 1 = strongly disagree to 5 = strongly agree.
3Phase 1: Item generation and psychometric properties
3.1Development of the scale
The items of the questionnaire were generated using a deductive item-generation approach. The theoretical foundation of the item generation is based on relevant studies identified in a literature review (Vornholt et al., 2013) and according to the theory of acceptance described above. We thus generated items that are in accordance with the definition of acceptance and specific to the workplace setting. Consist-ent with recommendations by Hinkin (1998), we developed items that were concise, short and easy to understand. In addition, we made sure that the items were clearly differentiating between the three dimensions of cognitive, affective, and behavioral acceptance. All items were positively worded and were created in simple language, making the scale accessible for people with mental and intellectual disorders. We supplemented these items with items from several well-established questionnaires that measure (a part of) acceptance (e.g., Burge, Ouellette-Kuntz, & Lysaght, 2007; Chadsey, Shelden, Horn, & Cimera, 1999; Cramm, Tebra, & Finkenflügel, 2008). Although these scales were not meant to measure acceptance per se, the scales contained items that were consistent with the definition of acceptance developed earlier (Vornholt et al., 2013). Using these two techniques, we obtained 14 items. More specifically, in this initial version of the questionnaire we had four items for the cognitive dimension (e.g. I think that I am an important member of my team at work), five items for the behavior dimension (e.g. My colleagues treat me no different than other colleagues), and five items for the affect dimension (e.g. I like to work with my colleagues). We consider the three dimensions as latent factors, which are not directly observable, but measurable by specific items.
3.2Participants and procedure
In two separate studies, the items developed were presented to employees with disabilities for further refinement and examination of the underlying factor structure. We chose this specific group of employees for validating the scale because this is a population that in particular experiences stigmatization, discrimination, and low levels of acceptance (Bos, Kanner, Muris, Janssen, & Mayer, 2009). In study 1 we conducted an exploratory factor analysis using sample 1, and in study 2 we applied a confirmatory factor analysis using sample 2.
3.2.1Sample 1
Participants were recruited using an online questionnaire published on Amazon Mechanical Turk, which is a platform provided by Amazon that gives access to a diverse, on-demand, scalable workfor-ce. Requirements for participation were (1) being employed in an organization other than Amazon and (2) having a mental or physical disability or both. Initially, we received 326 filled in questionnaires. We rigorously excluded participants that did not meet the criteria mentioned. More specifically, we excluded all unfinished cases (8), all participants who indicated not having a disability (5), and all cases of people who indicated not being employed (2). Furthermore, we excluded cases of people who did not correctly answer the “reliability-check” (90), which were two simple questions constructed to prevent that people randomly fill in the questionnaire (e.g. In the same week, Tuesday comes after Monday). Finally, there were 118 (53.4%) females and 103 (46.6%) males (N = 221) included in the study. Participants ranged in age from 21 years to 71 years (Mean age = 35, SD = 10.33). Fifty-eight percent reported being physically disabled, 35% having a mental disability, and 6% having both, a mental and physical disability. The majority of participants worked full-time (79%, Mean working hours = 36.67) at the time of data collection, and reported being employed in their current organization for on average five years. All participants were citizens of the United States of America.
Participants were informed about the content and purpose of the study and needed to indicate that they had read and understood the instructions prior to filling in the questionnaire. Participants had the opportunity to provide feedback and to contact the responsible researchers if desired.
3.2.2Sample 2
Participants (N = 159) were recruited at several schools in the Netherlands offering vocational rehabilitation to mostly young adults with disabilities. In the period when they were participating in the study, they were working in regular organizations following an internship next to their educational activities at the school. Participants worked in different types of organizations, such as in the care sector (23%), production (17%), service (6%), and construction (5%). Participants ranged in age from 14 years to 58 years (Mean age = 25, SD = 9.74); 34.1% of the participants were female.
The participants filled in an online questionnaire. All schools received detailed instructions on how to use the data collection program (Qualtrics software, version 2017) and teachers or mentors supported the students in filling in the questionnaire. Content and purpose of the project were explained before the participants could access the actual questionnaire. They had to indicate that they had read and understood the instructions. For participants younger than 18 years their caregiver had to give permission to participate.
3.3Statistical analysis
The underlying structure (cognitive, affective, and behavioral acceptance) of the Workplace Acceptance Scale was explored using both exploratory factor analysis and confirmatory factor analysis. Expl-oratory factor analysis was performed on the first sample. The number of participants exceeds the recommended ratio of 10 to 1 (e.g. ten cases for each item; Field, 2009). A first inspection confirmed that the data was suitable for factor analysis. Principal component analysis (PCA) was conducted with oblique rotation (oblimin). The number of factors to be retained was guided by Kaiser’s criterion (eigenvalues above 1), inspection of the Scree plot, and by using Horn’s parallel analysis (Horn, 1965). We only retained factors with eigenvalues obtained in PCA that exceeded the values attained from a randomly generated data set of the same size using the software MonteCarlo (Watkins, 2006). In the next step we conducted confirmatory factor analysis (CFA) on the second sample using Mplus version 7 to evaluate model fit and to replicate the factorial structure.
3.4Results
3.4.1Exploratory factor analysis
The data set was first screened in order to select those items that correlate relatively low (less than.3) or relatively high (higher than.9) with other items. None of the items attracted attention because of extremely high or low intercorrelations. Following, a principal component analysis (PCA) was conducted with oblique rotation (oblimin). The Kaiser-Meyer-Olkin measure (KMO) verified the sampling ade-quacy for the analysis, KMO = 0.95, and all KMO values for individual items were >0.92, which is well above the acceptable limit of 0.5 (Field, 2009). Bartlett’s test of sphericity (p < 0.001) indicated that correlations between items were sufficiently large for PCA. We ran an initial analysis to obtain eigenvalues for each component in the data. Only one eigenvalue exceeded 1, explaining 60.7% of the variance. The inspection of the Scree plot and Parallel Analysis supported the one factor solution. Two items (10 and 12; i.e. “My colleagues discuss their private/non-work-related topics with me” and “I attend most of the company’s social events”) showed rather low values in communalities (0.276 and 0.319 respectively) indicating that the items may not fit well with the other items of the scale. The items were thereupon removed from the scale. PCA with oblimin rotation was repeated without these items, which enhanced the overall variance explained to 66.3%. This result supports the one-dimensionality of the scale. All items loaded above 0.71 on the single factor.
To be complete, we also performed EFA with a forced three-factor structure, which we expected based on our theory. Only one item each loaded on component two (item 10) and component three (item 12), explaining less than 6% of the variance.
3.4.2Confirmatory factor analysis
We conducted confirmatory factor analysis (CFA) using maximum likelihood estimation on the second independent sample with 159 cases. As identified in the exploratory factor analysis, we investigated a one-factor model with twelve items and evaluated model fit by using several fit indices, including Chi-square, Comparative Fit index (CFI), Tucker-Lewis Fit Index (TLI), Root Mean Square Error of Approximation (RMSEA), and Standardized Root Mean square Residual (SRMR).
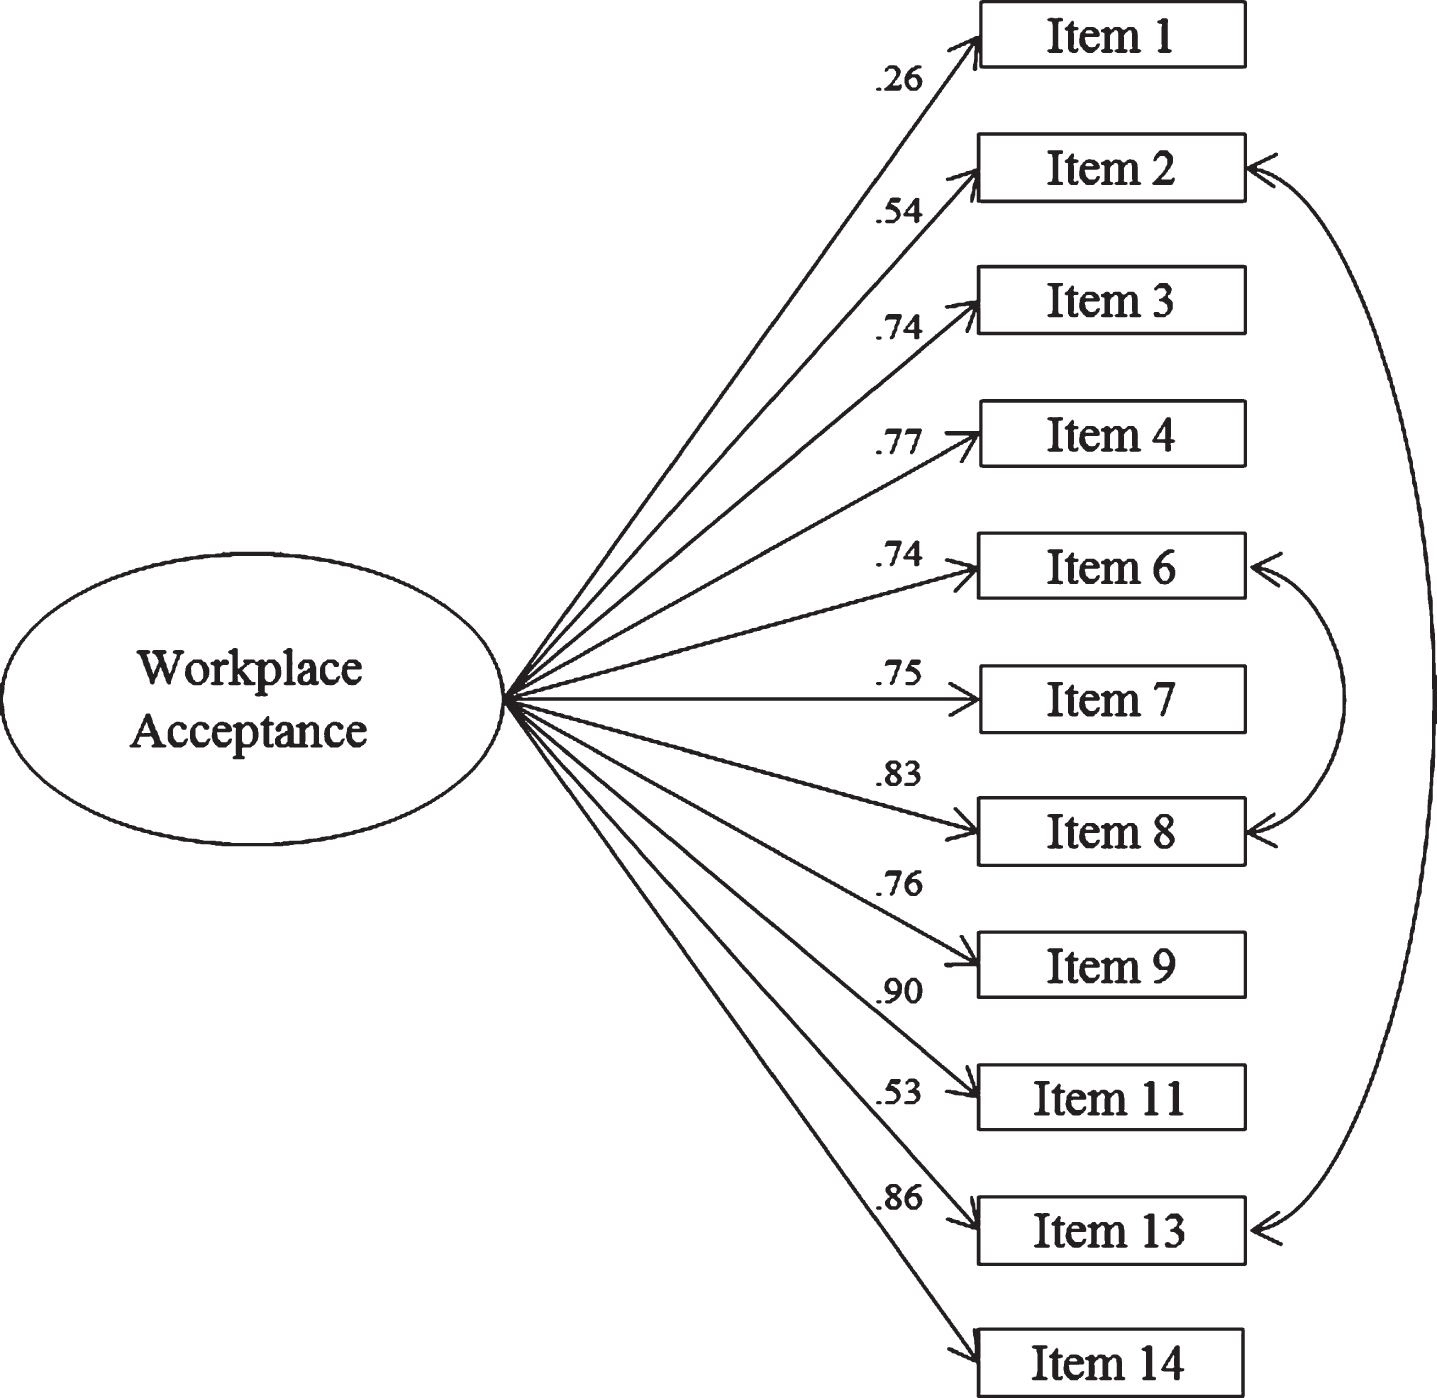
In a first analysis, we found a moderate model fit, with Chi-square test χ² = 156.33, p = 0.000, incremental indices of fit CFI = 0.915 and TLI = 0.896, and absolute indices of fit RMSEA (90% CI)=0.109 (0.089 – 0.129) and SRMR = 0.051. Model modification indices indicated that item 5 (i.e. My colleagues offer their help when I need it) prevented a better model fit, due to covariance with other items without clear conceptual rational. We decided to remove the item. Modification indices furthermore recomme-nded to allow two residual covariance’s to the model (item 8 and item 6, item 13 and item 2), which we accepted based on their conceptual relationship. Item 8 (i.e. I feel comfortable around my colleagues at work) and item 6 (i.e. I like to work with my colleagues”) both originate from the items developed for the affect dimension and describe a person’s feelings about the group of colleagues. Item 13 (i.e. My colleagues involve me in their daily conversations) and item 2 (i.e. My colleagues regularly talk to me about work-related topics) both originate from the items developed for the behavior dimension and thus investigate how a worker with disability experiences the interaction with colleagues. The model fit indi-ces improved considerably and presented a good fit (χ2= 74.930, p = 0.001, CFI = 0.968, TLI = 0.958, RMSEA [90% CI] = 0.070 [0.043 – 0.096] and SRMR = 0.040). Figure 2 visualizes the modified me-asurement model with parameter estimates. It is not-iceable that item 1, item 2, and item 13 show rather low standardized loadings (>0.60). We decided to keep these items regardless of low magnitudes, as they may be based on response patterns unique to the sample of respondents. The eleven-item scale ex-hibited a high internal consistency reliability (Cron-bach’s α= 0.91).
Fig. 2
Modified model and parameter estimates for the Workplace Acceptance Scale.
4Phase 2: Criterion-related validity
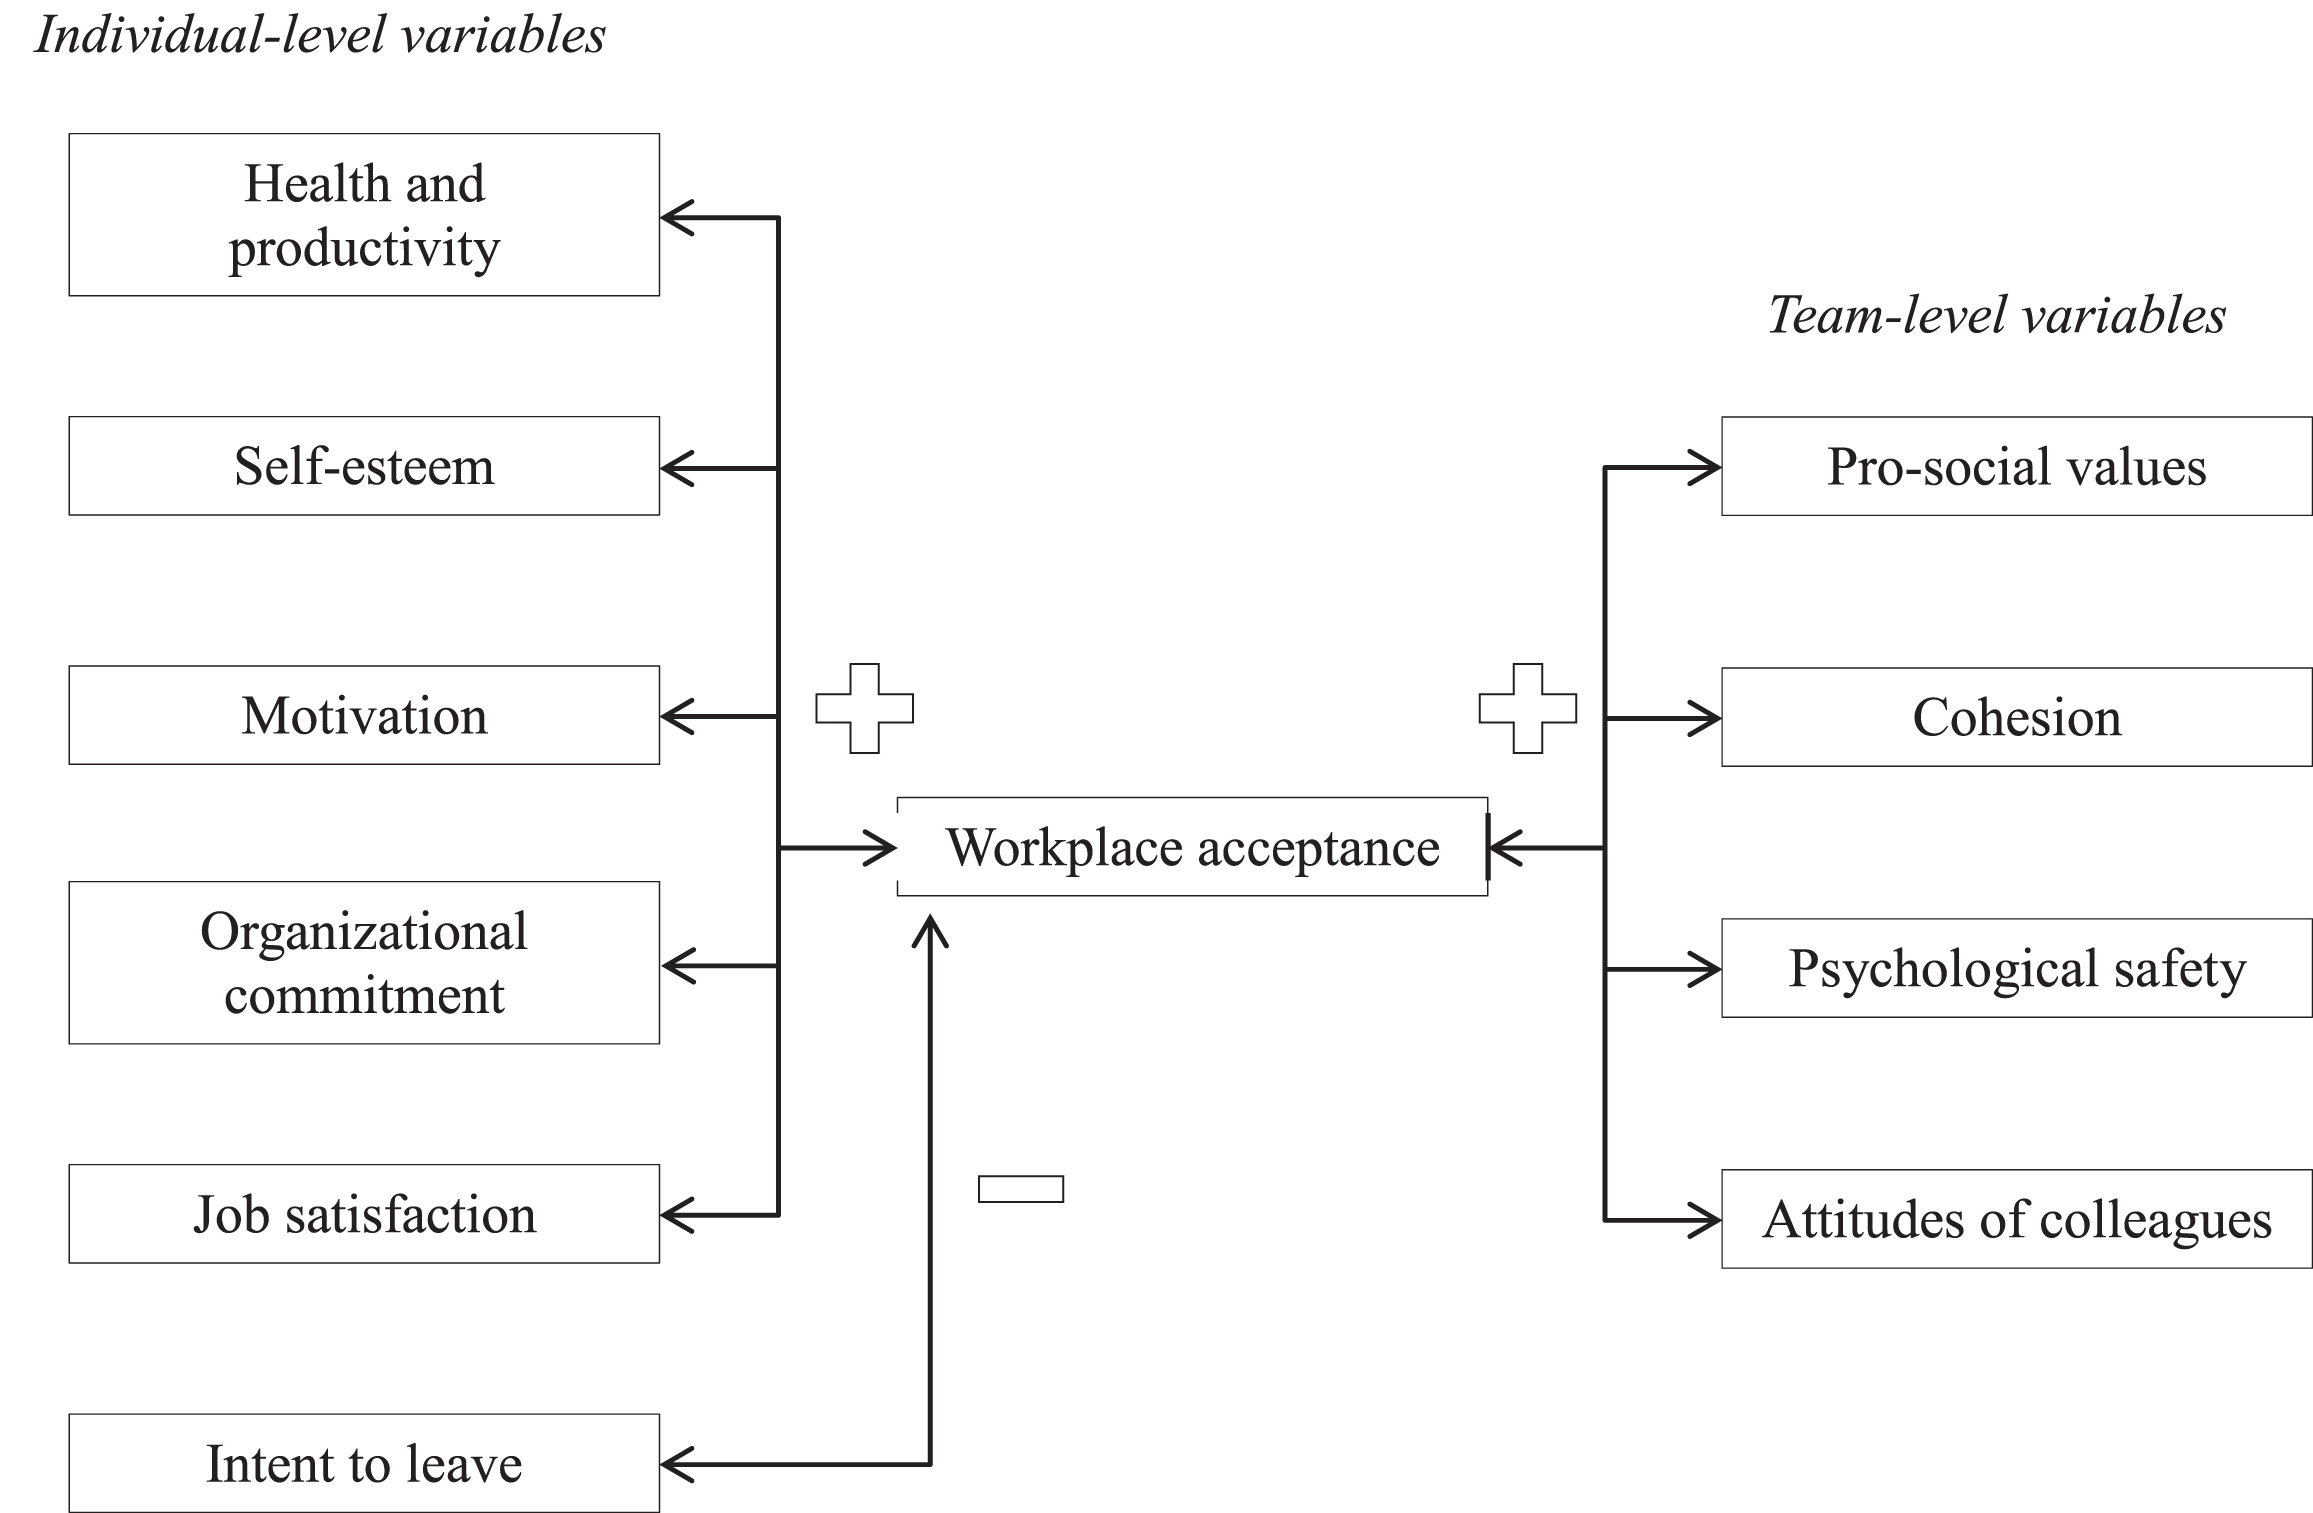
In a final step of this process, we assessed the criterion-related validity of the scale. Criterion-re-lated validity describes the extent to which a construct is related to variables derived from theory and is an important aspect of construct validity (Hinkin, 1998). We established a nomological network (see Fig. 3) to further validate our measure of workplace acceptance. We examined the relationships between workplace acceptance and two clusters of variables, (1) variables related to the focal employee (health and productivity, self-esteem, intent to leave, motivation, organizational commitment, and job satisfaction) and, (2) variables concerning the team of the focal employee (pro-social values, cohesion, average group-level attitudes, and psychological safety), using multiple regression and multilevel analysis. Because the team-level sample size in this study was too small for structural equation modeling techniques, we used regression analysis to test team-level relations. All scores were averaged to the team-level.
Fig. 3
Summary of hypothesized nomological network relationships of workplace acceptance to other constructs.
4.1Individual-level variables
Acceptance is thought to be an essential component of social integration at work and refers to positive relationships with others (Vornholt et al., 2013). While long-term exposure to negative interpersonal reactions causes poor psychological and physical health, positive reactions of others stimulate psychological and physical well-being (Baumeister & Leary, 1995; Richman & Leary, 2009). We assume that being accepted in a group of colleagues has a positive influence on several aspects related to the work context, such as health, motivation, and satisfaction. Being accepted by colleagues is furthermore likely to be important for the sustainability of employment, which implies that employees are able to function on the long term considering achievement and maintenance of participation and health (van der Klink et al., 2011). More specifically, we hypothesize that acceptance is related to health and productivity, in a way that it reduces absence from work and counteracts ‘presenteeism’, which is the condition of being present at work without being productive (Koopman et al., 2002). Furthermore, we expect that acceptance is positively related to the worker’s organization-based self-esteem (Pierce, Gardner, Cummings, & Dunham, 1989), in that being accepted positively influences the self-perceived value within one’s organizational context.
Motivation and commitment are essential components of sustainable employability and are closely related to well-being, health and productivity (Ka-nste, 2011; Meyer, Allen, & Smith, 1993; Warr, Cook, & Wall, 1979). We therefore hypothesize that both motivation and organizational commitment are positively linked with workplace acceptance. Ultimately, we expect a positive relationship between the feeling of being accepted and job satisfaction; and a negative link between workplace acceptance and the intent to leave. Both factors depend on positive relationships with colleagues (Bentein, Vandenberg, Vandenberghe, & Stinglhamber, 2005; Judge, Locke, Durham, & Kluger, 1998; Wolgast & Fischer, 2017) and we expect that the positive effects can only be achieved by being accepted (Vornholt et al., 2013). Also, acceptance can potentially be considered being a part of the concept of job satisfaction. A closer look at scales measuring job satisfaction (e.g., The Job Satisfaction of Persons with Disabilities Scale; Smedema et al., 2016) reveals compliances in some items. To summarize, we hypothesize that acceptance is positively related to health and productivity, self-esteem, motivation, organizational commitment, and job satisfaction, and negatively related to the intent to leave the organization.
4.2Team-level variables
Besides the person with a disability, also a number of colleagues filled in a questionnaire, representing the work team as a whole. Since many European countries adopted a disability quota system that forces companies to employ people with disabilities (Wuellrich, 2010), diversity is more and more turning into the lived reality in organizations. Moreover, teamwork is one of the core elements of new organizations (Eurofound, 2007) and it can be assumed that future work increasingly asks for cooperation between workers with and without disabilities. As mentioned above, acceptance is intimately bound to the need to belong to a group of acquaintances (Baron et al., 2009; Baumeister & Leary, 1995). A group of colleagues is an important social group most people in some way or another belong to. Therefore, we argue that workplace acceptance is also a team-level variable, capturing part of the social dynamics in groups.
In order to test the nomological network of acceptance on the team-level, we included a number of relevant team-level variables. Primarily, we expect a positive relationship between workplace acceptance and pro-social team values. Pro-social values are part of organizational citizenship behavior and describe motives which are strongly associated with behavior directed at individuals, such as being helpful or the desire to build positive relationships with others (Rioux & Penner, 2001). Similar to pro-social values, also the concept of workplace acceptance incorporates interactions between individuals and behavior toward others. The concept cohesion includes interpersonal and task cohesion and describes the commitment to a common task as well as the forces that act on a group to remain together (Carless & De Paola, 2000). For that reason we hypothesize that in a cohesive group, members tend to form stronger ties and will therefore be more likely to include and accept other group members. Similarly, psychological safety refers to a shared belief that the team is safe for interpersonal risk taking, which means that mutual respect and trust exist among team members (Edmondson, 1999). We argue that in an environment where people feel safe to take interpersonal risks, they are less likely to exclude others. Finally, the attitudes of colleagues toward people with disabilities play a major role for the perceived acceptance of the employee with a disability (Vornholt et al., 2013). We expect a positive relationship between both variables. Summing up, we hypothesize that acceptance is positively related to pro-social values, cohesion, psychological safety, and the attitudes of colleagues.
4.3Participants and procedure
4.3.1Sample 3
The third sample consisted of 115 employees, 51 employees with disabilities and 64 colleagues, working in 33 different teams. There were 43 (37.4%) females, 69 males (60%), and three participants (2.6%) who did not indicate their gender. Participant’s age ranged from 19 years to 61 years (Mean age = 40.94, SD = 12.09). Participants worked on average nine years in their current occupation, with 32.69 working hours per week (SD = 9.7). The average team size was ten members (SD = 11.52). The organizations were diverse, although all were located in the service sector (e.g. 32% housekeeping and cleaning, 20% catering and kitchen).
The participants filled in a pen-and-paper version of the questionnaire. A cover letter explaining the content and purpose of the project and inviting participation was attached to the questionnaire. Further, the participants signed an informed consent, which informed them about their rights, the purpose and the procedure of the study (e.g. that their participation in the study is voluntary, data will be kept anonymously, and that resigning from the study is possible at any time). All participants were able to understand the information given and for this reason capable to decide whether they want to participate. Furthermore, all participants were mature (none of the participants had a legal custodian).
4.4Measures
We included several measures in this study of which some were filled in by all participants (wor-kplace acceptance, intent to leave, intrinsic job mo-tivation, affective organizational commitment, job satisfaction), some only by the participants with dis-abilities (health status and employee productivity, organization-based self-esteem), and others were filled in by colleagues only (attitudes, pro-social values, cohesion, psychological safety).
4.4.1Workplace acceptance
We measured workplace acceptance with the 11-item scale (Workplace Acceptance Scale, α= 0.91) developed during this research project (see App-endix). Employees with disabilities filled in this scale, while colleagues answered nine similar questions (α= 0.79) that were translated to the team con-text (e.g. “Colleagues in this team do not make a difference between colleagues with and without disabilities”). The measure is thus based on the scale developed for the individual perception of acceptance, but translated to the group level.
4.4.2Intent to leave
We adopted two items used by Bentein et al. (2005) to measure the intention to leave the current organization. The alpha coefficient was 0.82. The items read: “I often think about quitting this organization” and “I intend to search for a position with another employer within the next year”.
4.4.3Intrinsic job motivation
In order to measure motivation to work, we used a subscale of the Work and Life Attitudes Survey developed by Warr et al. (1979). The scale contains six items and had an alpha coefficient of 0.72. Participants responded to items such as “I feel a sense of personal satisfaction when I do this job well”.
4.4.4Affective organizational commitment
We used a subscale of a broader measure of organizational commitment developed by Meyer et al. (1993). The subscale we used reflects affective commitment to the organization and contains six items (e.g. “This organization has a great deal of personal meaning for me”). The alpha coefficient was 0.73.
4.4.5Job satisfaction
We used a single item (“I am satisfied with the work I am doing”) to measure overall job satisfaction.
4.4.6Health status and employee productivity
We used the Stanford Presenteeism Scale (SPS-6): Health Status and Employees Productivity developed by Koopman et al. (2002). The scale (α= 0.66) contains six items, asking the participants to indicate the degree in which their health problem had influenced their work behavior and performance during the past month. We re-worded the term health problem to disability in order to fit the scale to our target group (e.g. “Despite having a disability, I was able to finish hard tasks in my work”).
4.4.7Organization-based self-esteem
We used the 10-item Organization-Based Self-Esteem scale (OBSE) developed by Pierce et al. (1989) to measure the extent to which employees feel valuable, worthwhile and effectual within their work team. The alpha coefficient was 0.95. Participants responded to items such as “I count around here” or “I am taken seriously”.
4.4.8Attitudes
We measured the attitudes of colleagues toward people with disabilities using the 30-item Attitudes Toward Disabled Persons scale (ATDP-A), developed by Yuker, Block, and Younng (1970). The scale measures attitudes toward people with disabilities in general. The scale had an alpha coefficient of 0.71. Participants responded to items such as “We should expect just as much from persons with disabilities as from persons without disabilities” or “It would be best if persons with and without disabilities would live and work together”.
4.4.9Pro-social values
To measure pro-social values we used the corres-ponding 10-item subscale (α= 0.90) of the Citizenship Motives Scale developed by Rioux and Penner (2001). We slightly changed the wording of the items in order to adapt them to the organizational context. An example of an original item is “I feel it is important to help those in need”. This item has been changed to “Colleagues in my team at work feel that it is important to help those in need”.
4.4.10Cohesion
Cohesion in work teams was measured using the 10-item scale (α= 0.74) developed by Carless and De Paola (2000). Participants responded to items such as “For me this team is one of the most important social groups to which I belong”.
4.4.11Psychological safety
To measure psychological safety in work teams we used a 7-item subscale of Edmondson (1999). Ot-her than specified by the author, we used a 5-point Likert scale ranging from 1 = strongly disagree to 5 = strongly agree. The alpha coefficient was 0.70. Participants responded to items such as “People on this team sometimes reject others for being different”.
4.5Results
The correlations and partial correlations between acceptance and the variables of interest are presented in Table 2. With all of the variables examined, it is evident that acceptance as perceived by the employee with a disability is more strongly related to variables measured on the individual-level than to those measures on the team-level. Our first hypothesis predicted that acceptance is positively related to health and productivity, self-esteem, motivation, organizational commitment, and job satisfaction, and negatively related to the intent to leave the organization. This hypothesis was fully supported. All constructs correlated with acceptance as predicted: health and productivity (r = 0.48, p < 0.01), self-esteem (r = 0.60, p < 0.01), motivation (r = 0.45, p < 0.01), organizational commitment (r = 0.30, p < 0.05), job satisfaction (r = 0.52, p < 0.01), and the intent to leave (r = – 0.42, p < 0.01).
Table 1
Component matrix for PCA, one-factor solution
| Items Workplace Acceptance Scale | Based on 14 items | Based on 12 items | |
| Item 14 | I feel supported by my colleagues at work | 0.874 | 0.876 |
| Item 4 | I feel accepted by my colleagues at work | 0.869 | 0.874 |
| Item 6 | I like to work with my colleagues | 0.862 | 0.860 |
| Item 8 | I feel comfortable around my colleagues at work | 0.857 | 0.859 |
| Item 13 | My colleagues involve me in their daily conversations | 0.852 | 0.851 |
| Item 7 | My colleagues take me seriously | 0.810 | 0.820 |
| Item 3 | My colleagues show their appreciation for my performance at work | 0.791 | 0.794 |
| Item 11 | I think that I am an important member of my team at work | 0.786 | 0.790 |
| Item 9 | I like to be part of the team of colleagues | 0.771 | 0.777 |
| Item 5 | My colleagues offer their help when I need it | 0.770 | 0.773 |
| Item 2 | My colleagues regularly talk to me about work-related topics | 0.769 | 0.772 |
| Item 1 | My colleagues treat me no different than other colleagues | 0.706 | 0.707 |
| Item 12 | My colleagues discuss their private/non-work-related topics with me | 0.565 | - |
| Item 10 | I attend most of the company’s social events | 0.525 | - |
Table 2
Summary of intercorrelations, means, and standard deviations of the nomological network
| Variable | M | SD | 1 | 2 | 3 | 4 | 5 | 6 | 7 | ||||||
| Individual-level variables | |||||||||||||||
| 1. Workplace acceptance | 4.18 | 0.57 | |||||||||||||
| 2. Health and productivity | 3.71 | 0.64 | 0.48 | ** | |||||||||||
| 3. Self-esteem | 4.10 | 0.75 | 0.60 | ** | 0.61 | ** | |||||||||
| 4. Intent to leave | 1.94 | 1.02 | – 0.42 | ** | – 0.29 | * | – 0.26 | ||||||||
| 5. Motivation | 4.07 | 0.60 | 0.45 | ** | 0.44 | ** | 0.67 | ** | – 0.36 | ** | |||||
| 6. Organizational commitment | 3.65 | 0.75 | 0.30 | * | 0.42 | ** | 0.42 | ** | – 0.58 | ** | 0.42 | ** | |||
| 7. Job satisfaction | 4.32 | 0.74 | 0.52 | ** | 0.45 | ** | 0.37 | ** | – 0.33 | ** | 0.18 | 0.37 | ** | ||
| Team-level variables | |||||||||||||||
| 8. Pro-social values | 4.08 | 0.41 | 0.09 | 0.12 | 0.06 | 0.08 | 0.01 | – 0.01 | 0.03 | ||||||
| 9. Cohesion | 3.20 | 0.38 | 0.18 | – 0.20 | 0.07 | – 0.06 | 0.06 | – 0.21 | – 0.10 | ||||||
| 10. Attitudes | 3.40 | 0.27 | 0.36 | * | 0.11 | 0.07 | – 0.14 | 0.10 | – 0.05 | 0.03 | |||||
| 11. Psychological safety | 3.84 | 0.45 | 0.26 | 0.08 | 0.12 | – 0.16 | 0.14 | 0.18 | 0.02 | ||||||
| 12. Acceptance by colleagues | 4.15 | 0.41 | 0.37 | * | 0.38 | ** | 0.24 | – 0.05 | 0.22 | 0.13 | 0.27 |
** Correlation is significant at the 0.01 level (2-tailed). *Correlation is significant at the 0.05 level (2-tailed). Note: correlations with team-level variables are calculated based on standardized estimates of multilevel analyses with n = 51, groups = 33.
The second hypothesis concerns the team-level variables. Because the sample consisted of individuals embedded in teams, we applied multilevel analyses, using Random Coefficient Modeling in R (Pinheiro & Bates, 1996), with individuals nested in teams to assess the relationship between acceptance and pro-social values, cohesion, psychological safety, and the attitudes of colleagues. We found a significant positive relation between attitudes of colleagues and acceptance (r = 0.36, p < 0.05) and a marginally significant (two-tailed) positive relation between psychological safety and acceptance (r = 0.26, p < 0.08). No other concept measured predicted perceived acceptance by people with disabilities. Additional to the above-mentioned constructs, we measured acceptance as indicated by the colleagues. Important to mention is that this scale is not validated, but closely follows the structure and content of the items developed earlier. We found acceptance measured on the individual-level and on the team-level significantly correlated (r = 0.37, p < 0.05).
5Discussion
The Workplace Acceptance Scale was developed in order to enhance our understanding of the social dynamics in inclusive work teams. To the best of our knowledge, there exists no other scale that measures perceived acceptance at work. Yet, the construct appears to be important, not only in terms of the psychological health of employees, but also in the context of the economic necessity to integrate people with disabilities into the primary labor market (European Commission, 2008). Organizations become more and more diverse and need to handle differences among employees (Stuart, 2006), making research on the social dynamics at work and a profound understa-nding of what happens when work teams become diverse even more fundamental. With the implementation of quota systems in many European countries (Shima, Zólyomi, & Zaidi, 2008) and the development toward more teamwork in organizations (Eurofound, 2007), the appearance of inclusive work teams becomes lived reality. Therefore, we aimed to develop a convenient and versatile scale to measure workplace acceptance and assist researchers who are seeking to examine this scarcely researched area.
Our study included three independent samples, in total 495 participants, and multisource data. The results obtained across the different samples provide initial evidence that the theoretically driven Workplace Acceptance Scale is a conceptually and statistically valid measure. The item parameters have been improved during the process and the factorial structure could be solidified. The scale demonstrates good internal reliability. Contrary to the expected three-dimensionality, both the exploratory and confirmatory factor analysis supported a one-dimensional solution. A possible explanation is that the measure explicitly refers to the perception of acceptance by an individual group member. Previous research has often shown a distinction between cognitive, behavioral and affective dimensions of attitudes toward a target (Eagly & Chaiken, 1993). However, for the target of acceptance itself, it may not be possible to distinguish between the nuances of these cognitive, behavioral and affective aspects.
In addition, we provided a nomological network, confirming the relationship between the construct acceptance and other well-established measures. Convergent and discriminant validity were demonstrated through the relation of the scale with the concepts health and productivity, self-esteem, intent to leave, motivation, job satisfaction, and organizational commitment. All our hypotheses concerning those variables measured on the individual-level were supported. On the team-level we found two relationships with important constructs. The perceived acceptance of the employee with disability was related to the attitudes of colleagues and to acceptance as evaluated by the colleagues. This provides initial evidence that acceptance is an important variable on the team-level and is clearly related to a person’s well-being within a group.
A possible reason why we did not find significant relationships with the constructs pro-social values and cohesion is twofold. On the one hand, a theoretical explanation might be that cohesive and safe workplaces do not necessarily incorporate that group members are different. On the other hand, a technical explanation might likely be responsible for the non-significant results. The items of traditional scales are often complex in terms of language and grammar in that they contain double negatives and other grammatical difficulties. Especially people with mental and intellectual disorders reported to have difficulties understanding and filling in the questionnaires. More research in different populations could clarify this issue. In this study, our goal was to develop, besides a statistically valid scale, a scale feasible for the use in different employment settings and applicable for all different types of disabilities. By formulating the items in such a way that they are universally valid in employment settings where employees with and without disabilities work together, and by paying attention to the use of simple language to avoid the above-mentioned difficulties, we expect to have achieved this goal.
In this study we purposely defined disability broadly. We decided against collecting data in a restricted sample, but agreed to include all employees with any type of a work disability. We are aware that there might be differences in the level of acceptance especially between people with physical and people with mental disabilities. Earlier research showed that particularly people with mental disorders experience exclusion at work (Lau & Cheung, 1999). We therefore assume that for them the concept acceptance is of greater importance compared to people with physical disabilities in terms of being an integrated member of a group of colleagues. For the average (non-disabled) employee it might be self-evident to be accepted by colleagues. However, the person with a mental disorder might generally experience lower levels of acceptance. Yet, this is the first study that exploratively examines the concept acceptance in the work setting, and we therefore resigned to differentiate among types of disabilities. The samples collected represent a good profile of the overall population of people with disabilities.
Our study has implications for both theory and practice. By introducing the Workplace Acceptance Scale, we hope to stimulate research on the social dynamics in inclusive teams, thereby emphasizing the perspective of minorities in general and people with disabilities in particular. As the workforce ages, dealing with disability at the workplace becomes more of an issue than it is today. Intensifying the efforts to make organizations more diverse is one way to counteract the negative consequences of the expected demographic changes (Konrad et al., 2016). Here it is not only important to pay attention to the more obviously necessary efforts such as granting people essential workplace accommodations, but also to the social dynamics that arise when work teams become increasingly diverse. Although there is no doubt that accommodations are key to a successful integration at work (Corbière, Villotti, Toth, & Waghorn, 2014), social dynamics are often overlooked and attract attention only when problems such as bullying at work or workplace discrimination come up (Bond & Haynes, 2014). Bullying at work describes that individual employees are systematically excluded and victimized by their colleagues, while it threatens the need for recognition, safety and performance-related activity (Einarsen & Skogstad, 1996). Organizations need to create support structures in order to manage diverse teams successfully. The Workplace Acceptance Scale can therefore not only help researchers to learn more about the social dynamics at work, but can also support practitioners, supervisors and employers in developing an understanding of what is going on in their work teams. Possible negative consequences of diversity can be prevented and steps toward a positive experience of workplace inclusion of all involved players can be taken.
5.1Limitations and future research directions
Despite the promising results, our study is not without limitations and those should be addressed in future research and validity testing. Although we consider acceptance as a common factor relevant for all types of impairments, it still remains to be tested whether our results are universally valid among all possible samples. As mentioned above, we purposely did not differentiate between types of disabilities in this study, but we realize that variation might exist especially between mental and physical disorders. In future research, the study population should be selected carefully so that more nuanced conclusions can be drawn about differences in the level of acceptance considering types of disabilities.
Another limitation concerns particularly study three. The number of teams in this study is rather small, making strong inferences about acceptance as a team variable difficult. More research is needed that assesses acceptance in larger and more diverse samples. Besides that, the items of some scales appeared to be difficult to understand for the target group. More instruments in easy language are required for high quality research in samples of people with mental disorders.
Future research should work out further details of the positive dynamics that arise when work teams become more diverse. While for employers organizational diversity still often takes on a negative connotation (Erickson, von Schrader, Bruyère, & VanLooy, 2014), it is the challenge for psychologists and others involved to emphasize the attractive potential that diversity actually offers. This includes the basic discussion on the role of employer attitudes, how these attitudes translate into the actual hiring of people with disabilities and what role workplace acceptance plays in this dynamic decision-making process. Besides the focus on the group of employers, also people with disabilities themselves should actively claim their entitlement on sustainable work (United Nations, 2006) on the primary labor market as possible. Research in work and organizational psychology needs to deliver convincing arguments for both, the employer to hire a person with a disability, and for the person with a disability to have the courage to compete on the primary labor market. Although work is no panacea for societal inclusion, it represents a major part of people’s lives (Jahoda, 1981) and its influence on inclusion should not be underestimated. If (the access to) work becomes barrier-free, then soon other parts of social life will follow. Research can do its bit by making relevant findings accessible for practice.
6Conclusion
Although much more research is necessary, the Workplace Acceptance Scale presented here is a first step toward understanding how researchers can examine the social dynamics in inclusive employment settings and toward the conceptualization of acceptance as part of these dynamics. With our study we would like to draw the attention of researchers on the social interactions between employees with and without disabilities, especially accentuating the positive aspects of workplace inclusion.
Conflict of interest
The authors declare that they have no conflict of interest.
Appendices
Appendix: Workplace Acceptance Scale
My colleagues treat me no different than other colleagues.
My colleagues regularly talk to me about work-related topics.
My colleagues show their appreciation for my performance at work.
I feel accepted by my colleagues at work.
I like to work with my colleagues.
My colleagues take me seriously.
I feel comfortable around my colleagues at work.
I like to be part of the team of colleagues.
I think that I am an important member of my team at work.
My colleagues involve me in their daily conversations.
I feel supported by my colleagues at work.
Acknowledgments
This study was supported by the Centre for Inclusive Organizations (http://www.inclusievearbeidsorganisatie.org).
References
1 | The Americans with Disabilities Act, 42 U.S.C. 12101 et seq. Stat. (1990). |
2 | Baron, R. A. , Branscombe, N. R. , & Byrne, D. ((2009) ). Interpersonal attraction and close relationships. In S. Hartman (Ed.), Social psychology (Vol. 12, pp. 224 - 269). Pearson. |
3 | Baumeister, R. F. , & Leary, M. R. ((1995) ). The need to be-long: Desire for interpersonal attachments as a fundamental human motivation, Psychological Bulletin 117: (3), 497–529. https://doi.org/10.1037/0033-2909.117.3.497 |
4 | Bentein, K. , Vandenberg, R. , Vandenberghe, C. , & Stinglhamber, F. ((2005) ). The role of change in the relationship between commitment and turnover: A latent growth modeling approach, Journal of Applied Psychology 90: (3), 468–482. https://doi.org/10.1037/0021-9010.90.3.468 |
5 | Bjelland, M. J. , Bruyère, S. M. , von Schrader, S. , Houtenville, A. J. , Ruiz-Quintanilla, A. , & Webber, D. A. ((2010) ). Age and disability employment discrimination: occupational rehabilitation implications, Journal of Occupational Rehabilitation 20: (4), 456–471. https://doi.org/10.1007/s10926-009-9194-z |
6 | Bond, M. A. , & Haynes, M. C. ((2014) ). Workplace diversity: A social-ecological framework and policy implications, Social Issues and Policy Review 8: (1), 167–201. https://doi.org/10.1111/sipr.12005 |
7 | Bos, A. E. R. , Kanner, D. , Muris, P. , Janssen, B. , & Mayer, B. ((2009) ). Mental illness stigma and disclosure: consequences of coming out of the closet, Issues in Mental Health Nursing 30: (8), 509–513. https://doi.org/10.1080/01612840802601382 |
8 | Burge, P. , Ouellette-Kuntz, H. , & Lysaght, R. ((2007) ). Public views on employment of people with intellectual disabilities, Journal of Vocational Rehabilitation 26: (1), 29–37. https://doi.org/1052-2263/07 |
9 | Carless, S. A. , & De Paola, C. ((2000) ). The measurement of cohesion in work teams, Small Group Research 31: (1), 71–88. https://doi.org/10.1177/104649640003100104 |
10 | Chadsey, J. G. , Shelden, D. L. , Horn, J. R. , & Cimera, R. E. ((1999) ). Description of variables impacting successful and unsuccessful cases of social integration involving co-workers, Journal of Vocational Rehabilitation 12: (2), 103–111. |
11 | Corbière, M. , Villotti, P. , Toth, K. , & Waghorn, G. ((2014) ). Disclosure of a mental disorder in the workplace and work accommodations: Two factors associated with job tenure of people with severe mental disorders, Encephale-Revue De Psychiatrie Clinique Biologique Et Therapeutique 40: , S91–S102. https://doi.org/10.1016/j.encep.2014.04.006 |
12 | Cramm, J. M. , Tebra, N. , & Finkenflügel, H. ((2008) ). Colleagues’ Perception of Supported Employee Performance, Journal of Policy and Practice in intellectual Disabilities 5: (4), 269–275. https://doi.org/10.1111/j.1741-1130.2008.00188.x |
13 | Durand, M. J. , Corbière, M. , Coutu, M. F. , Reinharz, D. , & Albert, V. ((2014) ). A review of best work-absence management and return-to-work practices for workers with musculoskeletal or common mental disorders, Work-a Journal of Prevention Assessment & Rehabilitation, 48: (4), 579–589. https://doi.org/10.3233/wor-141914 |
14 | Eagly, A. H. , & Chaiken, S. ((1993) ). The psychology of attitudes. Harcourt Brace Jovanovich College Publishers. |
15 | Edmondson, A. ((1999) ). Psychological safety and learning behavior in work teams, Administrative Science Quarterly 44: (2), 350–383. https://doi.org/10.2307/2666999 |
16 | Einarsen, S. , & Skogstad, A. ((1996) ). Bullying at work: Epidemiological findings in public and private organisations, European Journal of Work and Organizational Psychology 5: , 185–201. https://doi.org/10.1080/13594329608414854 |
17 | Erickson, W. A. , von Schrader, S. , Bruyère, S. M. , & VanLooy, S. A. ((2014) ). The employment environment: employer perspectives, policies, and practices regarding the employment of persons with disabilities, Rehabilitation Counseling Bulletin 57: (4), 195–208. https://doi.org/10.1177/0034355213509841 |
18 | European Commission. (2008). The 2009 Ageing Report: Underlying Assumptions and Projection Methodologies European Economy (Vol. 7). Brussels, Belgium. |
19 | European Foundation for the Improvement of Living and Working Conditions (Eurofound). (2007). Teamwork and high performance work organisation. Dublin, Ireland: Publications Office of the European Union. |
20 | Field, A. ((2009) ). Discovering statistics using SPSS (Vol. 3). SAGE Publications Ltd. |
21 | Fishbein, M. , & Ajzen, I. ((1975) ). Belief, attitude, intention, and behavior: An introduction to theory and research. Addison-Wesley. |
22 | Hinkin, T. R. ((1998) ). A brief tutorial on the development of measures for use in survey questionnaires, Organizational Research Methods 1: (1), 104–121. https://doi.org/10.1177/109442819800100106 |
23 | Horn, J. L. ((1965) ). A rationale and test for the number of factors in factor analysis, Psychometrika 30: (2), 179–185. |
24 | Jahoda, M. ((1981) ). Work, employment, and unemployment: Values, theories, and approaches in social research, American Psychologist 36: (2), 184–191. |
25 | Judge, T. A. , Locke, E. A. , Durham, C. C. , & Kluger, A. N. ((1998) ). Dispositional effects on job and life satisfaction: The role of core evaluations, Journal of Applied Psychology 83: (1), 17–34. https://doi.org/10.1037/0021-9010.83.1.17 |
26 | Kanste, O. ((2011) ). Work engagement, work commitment and their association with well-being in health care, Scandinavian Journal of Caring Sciences 25: (4), 754–761. https://doi.org/10.1111/j.1471-6712.2011.00888.x |
27 | Konrad, A. M. , Yang, Y. , & Maurer, C. C. ((2016) ). Antecedents and outcomes of diversity and equality management systems: an integrated institutional agency and strategic human resource management approach, Human Resource Management 55: (1), 83–107. https://doi.org/10.1002/hrm.21713 |
28 | Koopman, C. , Pelletier, K. R. , Murray, J. F. , Sharda, C. E. , Berger, M. L. , Turpin, R. S. , Hackleman, P. , Gibson, P. , Holmes, D. M. , & Bendel, T. ((2002) ). Stanford presenteeism scale: Health status and employee productivity, Journal of Occupational and Environmental Medicine 44: (1), 14–20. https://doi.org/10.1097/00043764-200201000-00004 |
29 | Lau, J. T. F. , & Cheung, C. K. ((1999) ). Discriminatory attitudes to people with intellectual disability or mental health difficulty, International Social Work 42: (4), 431–444. |
30 | Linden, M. , Baron, S. , & Muschalla, B. ((2010) ). Capacity according to ICF in relation to work related attitudes and performance in psychosomatic patients, Psychopathology 43: , 262–267. |
31 | Lysaght, R. , Cobigo, V. , & Hamilton, K. ((2012) ). Inclusion as a focus of employment-related research in intellectual disability from 2000 to 2010: A scoping review, Disability and Rehabilitation 34: (16), 1339–1350. https://doi.org/10.3109/09638288.2011.644023 |
32 | Meyer, J. P. , Allen, N. J. , & Smith, C. A. ((1993) ). Commitment to organizations and occupations: Extension and test of a three-component conceptualization, Journal of Applied Psychology 78: (4), 538–551. https://doi.org/10.1037/0021-9010.78.4.538 |
33 | Muschalla, B. , Vilain, M. , Lawall, C. , Lewerenz, M. , & Linden, M. ((2012) ). Participation restrictions at work indicate participation restrictions in other domains of life, Psychology Health & Medicine 17: (1), 95–104. https://doi.org/10.1080/13548506.2011.592840 |
34 | Pierce, J. L. , Gardner, D. G. , Cummings, L. L. , & Dunham, R. B. ((1989) ). Organization-based self-esteem: construct definition, measurement, and validation, Academy of Management Journal 32: (3), 622–648. https://doi.org/10.2307/256437 |
35 | Pinheiro, J. C. , & Bates, D. M. ((1996) ). Unconstrained parametrizations for variance-covariance matrices, Statistics and Computing 6: (3), 289–296. https://doi.org/10.1007/bf00140873 |
36 | Qualtrics. (2005). Qualtrics software (Version 2017). http://www.qualtrics.com |
37 | Richman, L. S. , & Leary, M. R. ((2009) ). Reactions to discrimination, stigmatization, ostracism, and other forms of interpersonal rejection: A multimotive model, Psychological Review 116: (2), 365–383. https://doi.org/10.1037/a0015250 |
38 | Rioux, S. M. , & Penner, L. A. ((2001) ). The causes of organizational citizenship behavior: A motivational analysis, Journal of Applied Psychology 86: (6), 1306–1314. https://doi.org/10.1037/0021-9010.86.6.1306 |
39 | Rotman, D. ((2017) ). The relentless pace of automation. Business Impact. Retrieved May 24th, 2017 from https://www.technologyreview.com/s/603465/the-relentless-pace-of-automation/ |
40 | Scheid, T. L. ((2005) ). Stigma as a barrier to employment: Mental disability and the Americans with Disabilities Act, International Journal of Law and Psychiatry 28: (6), 670–690. https://doi.org/10.1016/j.ijlp.2005.04.003 |
41 | Shima, I. , Zólyomi, E. , & Zaidi, A. ((2008) ). The labour market situation of people with disabilities in EU25. European Centre for Social Welfare Policy and Research. |
42 | Shore, L. M. , Chung-Herrera, B. G. , Dean, M. A. , Ehrhart, K. H. , Jung, D. I. , Randel, A. E. , & Singh, G. ((2009) ). Diversity in organizations: Where are we now and where are we going? Human Resource Management Review 19: (2), 117–133. https://doi.org/10.1016/j.hrmr.2008.10.004 |
43 | Smedema, S. M. , Chan, F. , Wang, M. H. , Umucu, E. , Yasui, N. Y. , Tu, W.-M. , Ditchman, N. , & Wang, C.-C. ((2016) ). Psychometric Validation of the Taiwanese Version of the Job Satisfaction of Persons with Disabilities Scale in a Sample of Individuals with Poliomyelitis, The Australian Journal of Rehabilitation Counselling 22: (1), 27–39. https://doi.org/10.1017/jrc.2016.1 |
44 | Stone, D. L. , & Colella, A. ((1996) ). A model of factors affecting the treatment of disabled individuals in organizations, Academy of Management Review 21: (2), 352–401. |
45 | Stuart, H. ((2006) ). Mental illness and employment discrimination, Current Opinion in Psychiatry 19: (5), 522–526. https://doi.org/10.1097/01.yco.0000238482.27270.5d |
46 | United Nations. (2006). Convention on the rights of persons with disabilities. |
47 | van der Klink, J. J. L. , Bültmann, U. , Brouwer, S. , Burdorf, A. , Schaufeli, W. B. , Zijlstra, F. R. H. , & van der Wilt, G. J. ((2011) ). Duurzame inzetbaarheid bij oudere werknemers, werk als waarde, Gedrag en Organisatie 24: (4), 342–356. |
48 | Vornholt, K. , Uitdewilligen, S. , & Nijhuis, F. J. N. ((2013) ). Factors affecting the acceptance of people with disabilities at work: A literature review, Journal of Occupational Rehabilitation 23: (4), 463–475. https://doi.org/10.1007/s10926-013-9426-0 |
49 | Vornholt, K. , Villotti, P. , Muschalla, B. , Bauer, J. , Colella, A. , Zijlstra, F. , Van Ruitenbeek, G. , Uitdewilligen, S. , & Cor-bière, M. ((2018) ). Disability and employment– overview and highlights, European Journal of work and Organizational Psychology 27: (1), 40–55. https://doi.org/10.1080/1359432X.2017.1387536 |
50 | Warr, P. , Cook, J. , & Wall, T. ((1979) ). Scales for themeasurement of some work attitudes and aspects of psychological well-being. Journal of Occupational Psychology (52), 129-148. |
51 | Watkins, M. W. ((2006) ). Determining Parallel Analysis criteria, Journal of Modern Applied Statistical Methods 5: (2), 344–346. |
52 | Williams, A. E. , Fossey, E. , Corbière, M. , Paluch, T. , & Harvey, C. ((2016) ). Work participation for people with severe mental illnesses: An integrative review of factors impacting job tenure, Australian Occupational Therapy Journal 63: (2), 65–85. https://doi.org/10.1111/1440-1630.12237 |
53 | Wolgast, A. , & Fischer, N. ((2017) ). You are not alone: colleague support and goal-oriented cooperation as resources to reduce teachers’ stress, Social Psychology of Education, 20: (1), 97–114. https://doi.org/10.1007/s11218-017-9366-1 |
54 | World Health Organization. (2001). International Classification of Functioning, Disability and Health (ICF). Geneva. |
55 | World Health Organization. (2004). The global burden of disease: 2004 update. Geneva, Switzerland. |
56 | Wuellrich, J. P. ((2010) ). The effects of increasing financial incentives for firms to promote employment of disabled workers, Economics Letters 107: (2), 173–176. https://doi.org/10.1016/j.econlet.2010.01.016 |
57 | Yuker, H. E. , Block, J. R. , & Younng, J. H. ((1970) ). The measurement of attitudes toward disabled persons Rehabilitation Series (3 ed.). INA MEND Institute at Human Resources Center. |


