
Evaluation of vocal changes after vestibular rehabilitation in patients with balance disorders
Abstract
BACKGROUND:
Although there are articles and studies that associate postural changes with changes in vocal quality, to the best of our knowledge, this was the first study investigating the association between balance disorders and voice.
OBJECTIVE:
This study aimed to determine whether patients with balance disorders present any clinical, acoustic, or endoscopic vocal changes, and if the correction of balance impairments, such as through vestibular rehabilitation, lead to improvement in vocal quality.
METHODS:
This was a prospective cohort study that analyzed vocal differences (clinical, videoendostroboscopic, audio-perceptual, and acoustic vocal parameters) in a sample of 43 patients with vestibular dysfunction at three different time points (pre-treatment, post-treatment, and 3 months’ post-treatment) diagnosed by videonystagmography with changes in computerized dynamic posturography who were treated with vestibular rehabilitation.
RESULTS:
In pre-treatment, all of the patients presented supraglottic hyperfunction during videoendoscopic examination and abnormal values in the audio-perceptual scale. After treatment for balance disorders, there was a statistically significant improvement in some parameters of the videoendoscopic and audio-perceptual measures. These improvements were detected immediately after treatment and remained present until at least three months after treatment.
CONCLUSIONS:
The results suggested that the treatment for balance disorders results in changes in posture and consequently in voice quality.
1Introduction
The need for good postural alignment in order to have good vocal production is consensual in the scientific literature [22, 39, 40, 50]. Excellent vocal production depends on good function of the respiratory system, the abdominal muscles, and pelvis, adequate functioning of the larynx, and a good vocal resonating capacity [39, 40]. Coordinated function of all of these components is necessary to achieve good vocal production, and all of these factors are significantly influenced by the relative position of the thoracic cage, larynx, and resonating apparatus.
Book chapters and studies have suggested that exercises and postural techniques achieve improvement in vocal quality in those who use their voices professionally [9, 26, 27, 30, 39, 44, 45, 50, 52]. The methods used in these studies are fundamentally observations and alterations of bodily posture during vocalization of the spoken or sung voice, in some cases with objective verification of vocal quality improvement using acoustic parameters [45]. These reports have been valuable in confirming an anatomical-functional relationship between postural alignment and phonation. However, they have limitations such as lack of standardized measurements of posture, different diagnostic methods, misunderstanding of postural alteration classifications, and lack of control of voluntary body movements associated with speech and singing.
The need for objective results led a group of researchers [13, 14, 17, 28] to conduct several studies of normal, healthy individuals during vocal effort, defining quantitative postural parameters. They used a static posturography platform that enabled them to objectively describe postural head and trunk changes of normal subjects during vocal effort [28].
To adopt and sustain a normal body posture, it is necessary to gather sensorial information from the visual and proprioceptive systems and the vestibular apparatus; the integration of that information by the central nervous system and its specific response is directly dependent on an adequate musculoskeletal response [15].
In 2010, a study was published evaluating patients with vocal pathology using for the first time computerized dynamic posturography (CDP) [30]. This technique not only allows for a biomechanical perspective but also for a broader vision, and takes into account vestibular, visual, and proprioceptive sensorial inputs. The authors concluded that after vocal rehabilitation, patients demonstrated significant gains in the vestibular component of balance. It is apparent that alterations in the technique used for the vocal production of sound are associated with specific postural changes, not only in the cervical region and larynx but also in global posture [9, 30, 32, 42].
The goal of this study is to verify whether patients with balance disorders present any clinical, audio-perceptive, acoustic, or endoscopic vocal changes (even if asymptomatic or unperceived) and if better balance improves vocal quality.
2Materials and methods
This prospective cohort study recruited 50 patients and was carried out between 2014 and 2017. It took place at the ear, nose and, throat department of Hospital CUF Infante Santo, Lisbon, Portugal.
Patients older than 18 years who had changes compatible with unilateral or bilateral vestibular dysfunction on caloric tests during videonystagmography (VNG Ulmer Synapsys), who had somatosensory, visual, or vestibular changes on CDP (SMART EquiTest; Neurocom, Clackamas, OR, USA), and had been treated with vestibular rehabilitation were recruited consecutively.
Patients with acute ear, nose, and throat pathologies (rhinosinusitis, pharyngitis, and/or laryngitis) or who underwent vocal rehabilitation at any time (speech therapy) were excluded. Subjects with diagnosed or suspected M
Patients with CDP values for postural control after treatment equal to or worse than before treatment (without improvement after vestibular rehabilitation) were also excluded.
This study was approved by the Ethics Research Committee of Hospital Cuf Infante Santo and Nova Medical School/Faculty of Medical Sciences, and written informed consent was obtained from all of the participants before study enrollment. All of the procedures were performed in accordance with the 1964 Declaration of Helsinki.
2.1Vestibular rehabilitation
This treatment consisted of rehabilitating maneuvers, optokinetic stimulation, and postural treatment with CDP. The treatment was always performed by the same otolaryngologist in the hospital. The patients did not take any medication to treat balance during treatment and did no exercises at home. A unilateral or bilateral rehabilitating maneuver was performed for the patients who presented a positive Dix-Hallpike test on videonystagmography. If the patients had a bilateral positive Dix-Hallpike test, the two rehabilitating maneuvers were performed one week apart. Treatment with optokinetic stimulation took place one week after the maneuver, after confirmation of a negative Dix-Hallpike test.
Treatment with optokinetic stimulation consisted of five sessions over five consecutive days.
Postural treatment with CDP consisted of five sessions every other day starting three weeks after the end of the optokinetic stimulation treatment. Postural treatment with CDP was administered to patients with severe equilibrium deficits.
Three weeks after the end of the treatment, all of the patients underwent CDP for postural control.
The performance of the treatment was evaluated through the assessment of the composite equilibrium score of the CDP sensory organization test.
The sensory organization test (SOT) was conducted on a CDP platform. During the SOT, the patients were instructed to maintain an upright stance and look straight ahead during three trials of 20 seconds each under six different conditions (1: eyes open and stationary platform; 2: eyes closed and stationary platform; 3: eyes open with visual surround moving and stationary platform; 4: eyes open and moving platform; 5: eyes closed and moving platform; and 6: eyes open with visual surround moving and moving platform). The equilibrium score was calculated by comparing the patient’s antero-posterior sway during each trial to the maximal theoretical sway limits of stability (based on the individual’s height and the size of the support base) [34].
The somatosensory contribution to postural control (SOM) was calculated using the ratio of condition 2 to condition 1, the visual contribution (VIS) was represented by the ratio of condition 4 to condition 1, and the vestibular contribution (VEST) was represented by the ratio of condition 5 to condition 1. The ability to rely on visual orientation cues for postural control, or visual preference (PREF), was evaluated by the ratio of the sum of conditions 3 and 6 to the sum of conditions 2 and 5.
The composite equilibrium score was automatically calculated by independently averaging the three scores for conditions 1 and 2, adding these two mean scores to the three equilibrium scores from each trial of sensory conditions 3, 4, 5, and 6, and dividing the sum by 14 (the total number of trials) [34].
2.2Voice assessment
A multidimensional clinical voice analysis (videoendostroboscopic, audio-perceptual, acoustic, and patient reported outcome measure of voice handicap parameters) was conducted at three different time points: before treatment (Pre), on the same day as the postural control by CDP three weeks after the end of the treatment (Short term), and three months after treatment (Long term).
A detailed history and physical ear, nose, and throat examination were obtained for each subject. All of the patients were asked about vocal complaints, vocal habits (hydration, smoking, and vocal effort), presence of nasal pathology related to the resonance apparatus, presence of laryngopharyngeal reflux, gastroesophageal reflux, or gastric pathology, and presence of osteoarticular pathology or any limb mobility limitation.
All of the participants received the Voice Handicap Index 30 (VHI) form translated and validated into Portuguese [18].
Videoendostroboscopic exams (Kay-Pentax 9100B, Kay-Pentax 70° SN-2576 rigid laryngoscopy, and Pentax VNL-1170K nasopharyngolaryngoscopy) before and after the vestibular rehabilitation were performed by the same physician using the same diagnostic protocol. This protocol included a videoendoscopic/neurolaryngeal evaluation (assessment of vocal fold mobility and coordination, false vocal fold constriction and use of accessory muscles of phonation) performed in all patients with a flexible laryngoscope to ensure that mobility dysfunction was diagnosed in the physiological laryngeal position. The examination included an observation of the larynx at rest and during inspiration and expiration and a set of repetitive phonatory tasks that allowed the assessment of anatomical and motion asymmetries. All of the images were recorded and analyzed by three ear, nose, and throat professionals with experience in videoendostroboscopic evaluation. The videos were presented in a random order. The physicians were blinded about who the exam belonged to and were unaware if the exams had been performed before or after treatment. During the evaluation, at least two of the physicians had to agree on all of the videoendostroboscopic parameters. To decrease inter-subject and intra-subject variability, the use of the rating scales was discussed and practiced before the beginning of the study. At the end, the three physicians used the scales in the same way. The evaluated parameters were antero-posterior supraglottic hyperfunction and medial false vocal fold constriction, vocal fold mobility (abduction, adduction, and longitudinal tension), vocal fold lesions and reflux finding score [5]. The vibratory parameters judged were amplitude of vibration, phase asymmetry and vocal fold closure. (see the Appendix for details).
Vocal samples of all of the patients were recorded in a silent room by speech therapists with experience in voice assessment. A microphone (Electret Condenser CM-903) was attached to a computer to collect the voice samples and was placed 15 cm from the subject’s lips. The participants were required to speak at a comfortable volume and pitch during the sustained emission of vowels /a/, /e/, and /i/ for five seconds and in a spontaneous speech for 60 seconds (the patients were invited to speak freely about “What did you do yesterday?”). Dr. Speech software (Version 4; Tiger Electronics; Seattle, WA, USA) was used for computerized acoustic vocal assessments. The vocal parameters analyzed were the fundamental frequency (F0) average, F0 maximum, F0 minimum, F0 standard deviation, F0 tremor, jitter, shimmer, normalized noise energy, and harmonic-to-noise ratio.
The audio-perceptual assessment was conducted using the same voice samples using the grade (G), roughness (R), breathiness (B), asthenia (A), strain (S), and GRBAS scale [32]. All of the parameters were quantified through a 0– 3 severity score (0: absent, 1: mild, 2: moderate, and 3: severe) by three professionals with experience in voice assessment. The samples were presented in a random order. The professionals were blinded about who the exam belonged to and were unaware if the exams had been performed before or after treatment. During the evaluation, at least two of the professionals had to agree on all of the evaluated parameters.
2.3Statistical analysis
An exploratory analysis was performed for age (demographic variable), vestibular evaluation, each GRBAS (G, R, B, A, S) parameter, acoustic assessment, VHI, and videoendostroboscopic evaluation. Categorical data were presented by median and range [min and max] and continuous variables were presented by median and interquartile range (P25 and P75). An evaluation of the intra-observer and inter-observer variability was performed for each stroboscopic variable using the percentage of agreement. Intra-observer variability resulted from the analysis of the videoendostroboscopic exams of 10 patients at three different time points at least 24 hours apart. To estimate the inter-observer variability, the videoendostroboscopic exams of 10 patients were observed at three different time points at least 24 hours apart by two different observers.
For the variables measured three times, pairwise comparisons between Pre and Short term, Pre and Long term, and Short term and Long term were performed using the exact Wilcoxon matched-pair signed-rank test or the sign test, as appropriate, with a Bonferroni corrected significance level (α= 0.017). For the remaining variables measured at only two time points (Pre and Short term), the same test was conducted considering a level of significance α= 0.05. All of the statistical analyses were performed using SPSS 23 [21].
3Results
3.1Sample characterization
From the 50 recruited patients, two did not attend the post-treatment evaluation and five did not improve with vestibular rehabilitation. The remaining 43 patients concluded the evaluation pre-treatment and immediately post-treatment, and 36 patients were evaluated three months after the end of the treatment. The patients were between 37 and 89 years old, with a mean of 63.3 (2.1) years, and 36 (83.7%) were women.
3.2Vestibular evaluation
In the initial VNG evaluation, 29 (67.4%) had unilateral hyporeflexia and 14 (32.5%) had bilateral hyporeflexia. A positive Dix-Hallpike test was found in 62.7% (n = 27) of the sample.
In the CDP evaluation, the SOT revealed abnormal results in 32.6% (n = 14) in the SOM, 86.0% (n = 37) in the VEST, 55.8% (n = 24) with low scores in the VIS, and 30.2% (n = 13) with low scores in the PREF.
Eight patients (18.6%) had abnormal center of gravity alignment (COG).
Patients with a positive Dix-Hallpike test (n = 27) did the Epley maneuver [15] in all cases. All of the patients were treated with optokinetic stimulations and performed CDP for postural control three weeks after the end of the treatment (n = 43). Postural treatment with CDP was performed in 14 patients.
All of the study participants improved their composite scores after treatment (median Pre = 47.0 [37.0, 60.0] and median Short term = 78.0 [68.0, 81.0]; p < 0.001). Five patients had no improvements in their composite scores and were excluded from the study.
Of the 43 patients who had improved balance with the rehabilitation treatment, the most significant improvement was in the VEST (n = 29, 78.4%, p < 0.001). In the SOM, 78.6% of the patients improved (n = 11, p = 0.001), and in the VIS, 91.7% improved (n = 22, p < 0.001). None of the patients had lower VEST, VIS, or SOM scores after treatment. Of the 30.2% with low PREF scores, 92.3% (n = 12, p = 0.077) had improved scores; however, four patients with initial normal PREF scores had lower scores after treatment, which represents a clinical improvement as these patients had null vestibular components before treatment.
No differences were found in the COG evaluation with 18.6% (n = 8) and 14.0% (n = 6) with abnormal results before and after treatment, respectively (p = 0.791).
3.3Voice assessment
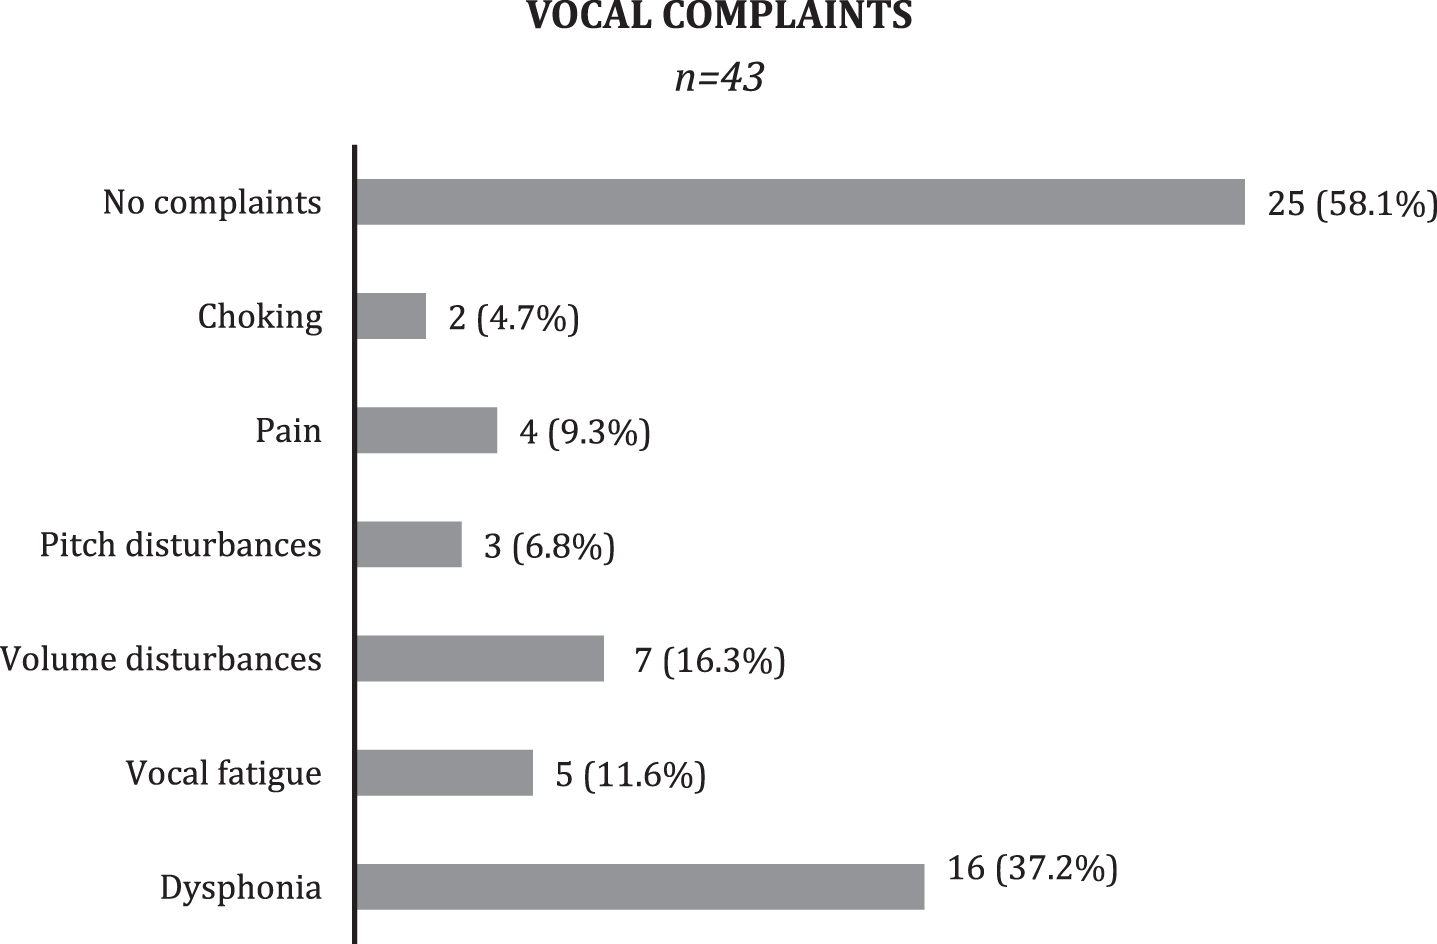
Patient clinical history revealed vocal complains such as dysphonia, vocal fatigue, or difficulty in increasing voice intensity in 41.8 % of the patients (n = 18) (Fig. 1).
Data concerning the patients’ lifestyles (smoking, hydration habits, and chronic medication) were collected and the patients confirmed that these habits remained unchanged during the whole study period.
Nineteen patients (44.2%) presented known gastric pathology diagnosis with no clinical symptoms, and 12 (28.0%) patients presented known osteoarticular pathology; none had any kind of mobility limitation.
Fig.1
Clinical voice assessment. Pitch disturbance: complains of achieving low or high pitch during phonation. Volume disturbance: difficulty in increasing intensity/loudness of voice.
3.3.1Voice handicap index evaluation
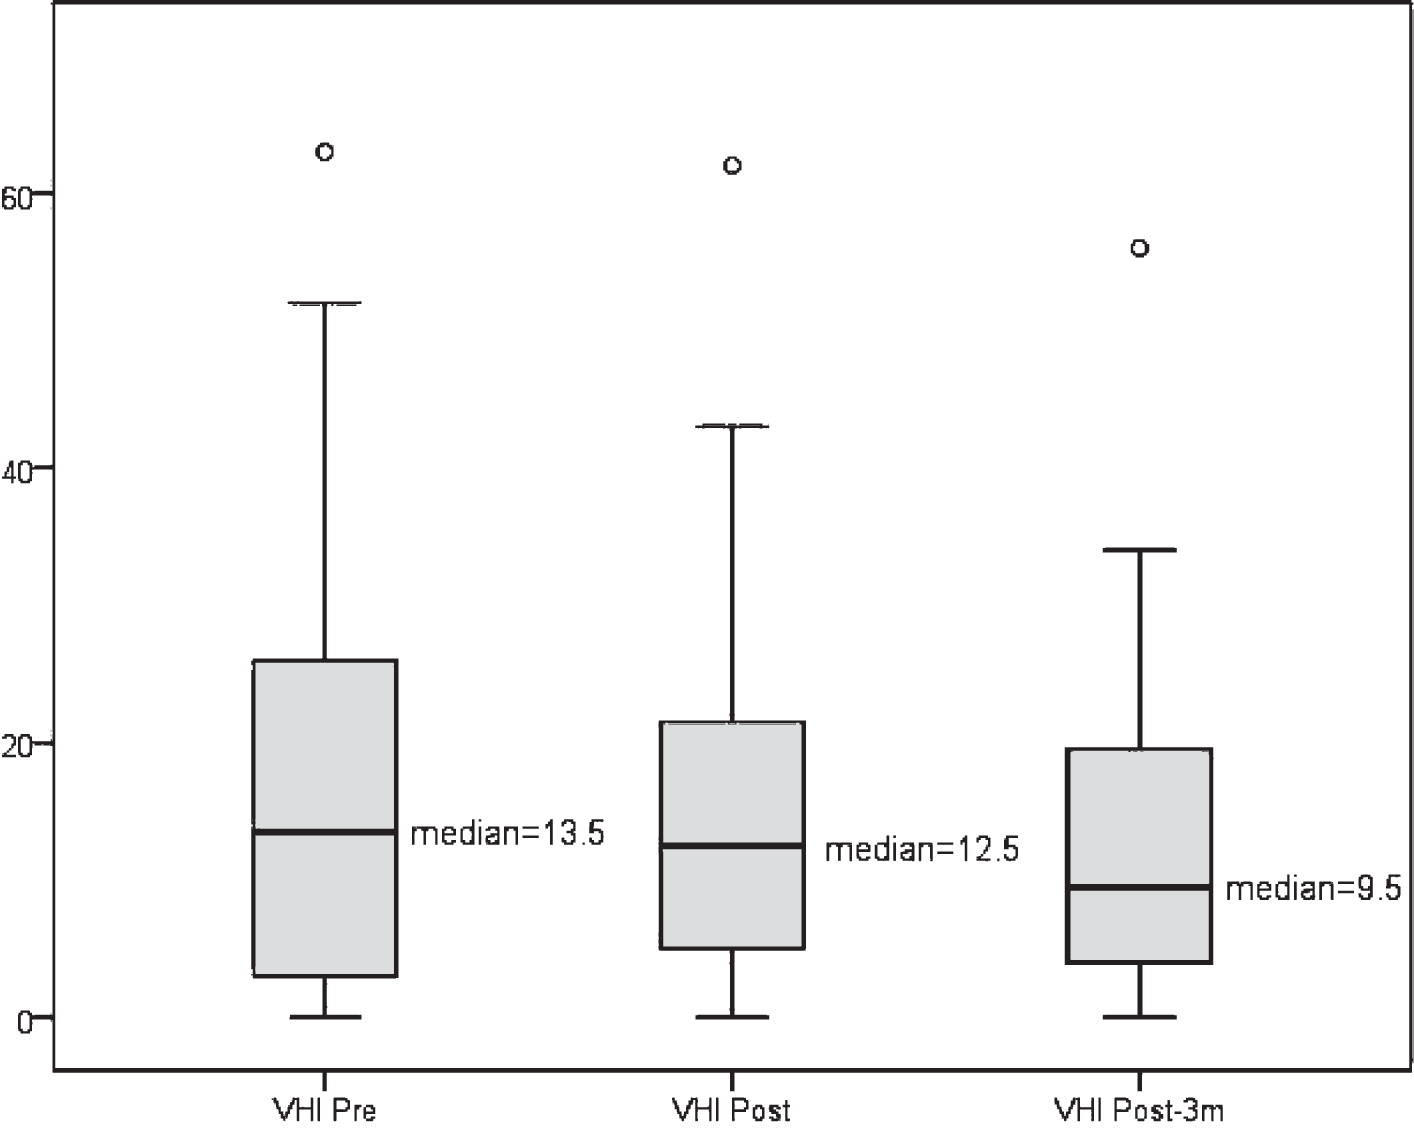
Although no statistically significant differences were found in the VHI evaluation (Pre vs Short term: p = 0.843; Pre vs Long term: p = 0.103; and Short term vs Long term: p = 0.071), a slight decrease in this index was observed as shown in Fig. 2.
3.3.2Audio-perceptual measures
Fig.2
VHI distribution at the study time points.
Intra-observer reliability for audio-perceptual variables ranged from 70% to 100% (G-70% – 100%; R- 70% – 90%; B- 70% – 80%; A- 70% – 90%; S- 70% – 80%) and inter-observer reliability ranged from 70% to 100% (G-70% – 100%; R- 70% – 90%; B- 70% – 100%; A- 70% – 80%; S- 70% – 80%).
The results of the audio-perceptual measures are shown in Table 1. The scores of each GRBAS parameter were considered independently for each vowel and in spontaneous speech.
Table 1
Comparison of GRBAS parameters between all of the study time points
| GRBAS | Median | p-value | ||||
| Pre [min, max] | Short term [min, max] | Long term [min, max] | Pre-Short term interval | Pre-Long term interval | Short term-Long term Interval | |
| Ga | 2.0 [0.0, 3.0] | 1.0 [0.0, 2.0] | 1.0 [0.0, 3.0] | <0.001 | <0.001 | 0.077 |
| Ge | 2.0 [0.0, 3.0] | 1.0 [0.0, 2.0] | 1.0 [0.0, 3.0] | <0.001 | <0.001 | 1.000 |
| Gi | 1.0 [0.0, 3.0] | 1.0 [0.0, 2.0] | 1.0 [0.0, 2.0] | 0.003 | 0.006 | 0.337 |
| Gss | 1.0 [0.0, 2.0] | 1.0 [0.0, 2.0] | 1.0 [0.0, 2.0] | <0.001 | <0.001 | 0.791 |
| Ra | 2.0 [0.0, 3.0] | 1.0 [0.0, 2.0] | 1.0 [0.0, 3.0] | 0.001 | 0.001 | 0.108 |
| Re | 1.0 [0.0, 3.0] | 1.0 [0.0, 2.0] | 1.0 [0.0, 3.0] | <0.001 | <0.001 | 1.000 |
| Ri | 1.0 [0.0, 3.0] | 1.0 [0.0, 2.0] | 1.0 [0.0, 2.0] | <0.001 | <0.001 | 0.629 |
| Rss | 1.0 [0.0, 2.0] | 1.0 [0.0, 2.0] | 1.0 [0.0, 2.0] | <0.001 | <0.001 | 0.754 |
| Ba | 2.0 [0.0, 3.0] | 1.0 [0.0, 2.0] | 1.0 [0.0, 2.0] | <0.001 | <0.001 | 0.072 |
| Be | 1.0 [0.0, 3.0] | 1.0 [0.0, 2.0] | 1.0 [0.0, 2.0] | <0.001 | <0.001 | 0.581 |
| Bi | 2.0 [0.0, 3.0] | 1.0 [0.0, 2.0] | 1.0 [0.0, 2.0] | 0.001 | <0.001 | 0.337 |
| Bss | 1.0 [0.0, 2.0] | 0.0 [0.0, 2.0] | 0.0 [0.0, 2.0] | 0.004 | 0.001 | 0.065 |
| Aa | 1.0 [0.0, 3.0] | 1.0 [0.0, 2.0] | 0.0 [0.0, 2.0] | 0.133 | 0.004 | 0.044 |
| Ae | 1.0 [0.0, 3.0] | 1.0 [0.0, 2.0] | 0.0 [0.0, 2.0] | 0.012 | 0.002 | 0.359 |
| Ai | 1.0 [0.0, 3.0] | 0.0 [0.0, 2.0] | 0.0 [0.0, 2.0] | 0.021 | <0.001 | 0.273 |
| Ass | 1.0 [0.0, 2.0] | 0.0 [0.0, 1.0] | 0.0 [0.0, 1.0] | <0.001 | <0.001 | 0.688 |
| Sa | 2.0 [0.0, 3.0] | 1.0 [0.0, 2.0] | 1.0 [0.0, 2.0] | <0.001 | <0.001 | <0.001 |
| Se | 2.0 [0.0, 3.0] | 1.0 [0.0, 2.0] | 1.0 [0.0, 2.0] | <0.001 | <0.001 | 0.388 |
| Si | 2.0 [1.0, 3.0] | 1.0 [0.0, 2.0] | 1.0 [0.0, 2.0] | <0.001 | <0.001 | 0.180 |
| Sss | 1.0 [0.0, 2.0] | 1.0 [0.0, 2.0] | 1.0 [0.0, 2.0] | 0.019 | 0.001 | 0.213 |
Results are expressed as p-values obtained by the exact Wilcoxon test or sign test. GRBAS scale. G: grade. R: roughness. B: breathiness. A: asthenia. S: strain. a: vowel /a/. e: vowel /e/. i: vowel /i/. ss: spontaneous speech.
In the G, R, and B parameters, significant differences were found in all of the vowels (/a/, /e/, and /i/), in spontaneous speech between pre-treatment and short term evaluations, and between pre-treatment and long term evaluations. No differences were found between short term and long term period.
The results of the A parameter showed significant differences between pre-treatment and three months after treatment evaluation in the vowels /a/, /e/, and /i/ and spontaneous speech and between pre-treatment and short term in the vowel /e/ and spontaneous speech.
In the S parameter, significant differences were found in all of the intervals in the vowel /a/, in the “pre- Short term” interval, and in the “pre-Long term” interval for the vowels /e/ and /i/. In spontaneous speech, significant differences were found only in the “pre-three months after treatment” interval.
3.3.3Videoendostroboscopy evaluation
The intra-observer reliability for the stroboscopic variables ranged from 80% to 100%, and the inter-observer reliability ranged from 70% to 100% (Table 2).
Table 2
Intra- and inter-observer reliability for stroboscopic variables
| Stroboscopy | Intra | Inter |
| SHAP | 90 | 90 |
| SHL | 100 | 100 |
| RVFabd | 90 | 90 |
| RVFadd | 100 | 100 |
| RVFtension | 80 | 80 |
| LVFabd | 100 | 100 |
| LVFadd | 90 | 90 |
| LVFtension | 90 | 90 |
| RArymov | 100 | 100 |
| LArymov | 100 | 100 |
| RFS | 100 | 90 |
| RVFcolor | 90 | 90 |
| LVFcolor | 90 | 90 |
| VFmasses | 100 | 100 |
| Amplitude | 100 | 80 |
| Phase | 100 | 100 |
| Periodicity | 100 | 100 |
| Glottic closure | 80 | 80 |
| Vibratory functionRight | 80 | 70 |
| Vibratory functionLeft | 80 | 70 |
Results are expressed as percentages. SHAP: anteroposterior supraglottic hyperfunction. SHL: medial false vocal fold constriction. RVFabd: right vocal fold abduction. RVFadd: right vocal fold adduction. RVFtension: right vocal fold longitudinal tension. LVFabd: left vocal fold abduction. LVFadd: left vocal fold adduction. LVFtension: left vocal fold longitudinal tension. RArymov: right arytenoid joint movement. LArymov: left arytenoid joint movement. RFS: reflux finding score. RVFcolor: right vocal fold color. LVFcolor: left vocal fold color. VFmasses: vocal fold masses. Amplitude: amplitude symmetry. Phase: phase symmetry.
In the videoendoscopic evaluation, statistically significant differences were found in anteroposterior supraglottic hyperfunction (SHAP) and in medial false vocal fold constriction (SHL), with improvements in these two parameters. In SHAP, differences were found between the baseline and short term time points (p < 0.001), between the baseline and three months after treatment (p < 0.001), and between the short term and long term evaluation (p = 0.004) (Table 3).
Table 3
Comparison of stroboscopic parameters between all of the study time points
| Stroboscopy | Median | p-value | ||||
| Pre [min, max] | Short term [min, max] | Long term [min, max] | Pre-Short term interval | Pre-Long term interval | Short term-Long term Interval | |
| SHAP | 1.0 [0.0, 2.0] | 1.0 [0.0, 2.0] | 0.0 [0.0, 2.0] | <0.001 | <0.001 | 0.004 |
| SHL | 1.0 [0.0, 3.0] | 0.0 [0.0, 2.0] | 0.0 [0.0, 2.0] | <0.001 | <0.001 | 0.021 |
| RVFabd | 1.0 [1.0, 2.0] | 1.0 [1.0, 2.0] | 1.0 [1.0, 1.0] | 1.000 | 1.000 | 1.000 |
| RVFadd | 1.0 [1.0, 2.0] | 1.0 [1.0, 2.0] | 1.0 [1.0, 1.0] | 1.000 | 1.000 | 1.000 |
| RVFtension | 1.0 [1.0, 2.0] | 1.0 [1.0, 2.0] | 1.0 [1.0, 2.0] | 0.125 | 0.250 | 1.000 |
| LVFabd | 1.0 [1.0, 2.0] | 1.0 [1.0, 1.0] | 1.0 [1.0, 1.0] | 1.000 | 1.000 | 1.000 |
| LVFadd | 1.0 [1.0, 2.0] | 1.0 [1.0, 1.0] | 1.0 [1.0, 1.0] | 1.000 | 1.000 | 1.000 |
| LVFtension | 1.0 [1.0, 2.0] | 1.0 [1.0, 2.0] | 1.0 [1.0, 2.0] | 0.375 | 0.500 | 1.000 |
| RArymov | 1.0 [1.0, 2.0] | 1.0 [1.0, 2.0] | 1.0 [1.0, 1.0] | 1.000 | 1.000 | 1.000 |
| LArymov | 1.0 [1.0, 1.0] | 1.0 [1.0, 1.0] | 1.0 [1.0, 1.0] | 1.000 | 1.000 | 1.000 |
| RFS | 0.0 [0.0, 1.0] | 0.0 [0.0, 1.0] | 0.0 [0.0, 1.0] | 0.250 | 0.250 | 1.000 |
| RVFcolor | 1.0 [1.0, 2.0] | 1.0 [1.0, 2.0] | 1.0 [1.0, 2.0] | 0.250 | 0.625 | 1.000 |
| LVFcolor | 1.0 [1.0, 2.0] | 1.0 [1.0, 2.0] | 1.0 [1.0, 2.0] | 0.250 | 0.625 | 1.000 |
| VFmasses | 1.0 [1.0, 2.0] | 1.0 [1.0, 2.0] | 1.0 [1.0, 2.0] | 1.000 | 1.000 | 1.000 |
| Amplitude | 1.0 [1.0, 1.0] | 1.0 [1.0, 1.0] | 1.0 [1.0, 1.0] | 1.000 | 1.000 | 1.000 |
| Phase | 1.0 [1.0, 1.0] | 1.0 [1.0, 1.0] | 1.0 [1.0, 1.0] | 1.000 | 1.000 | 1.000 |
| Periodicity | 1.0 [1.0, 1.0] | 1.0 [1.0, 1.0] | 1.0 [1.0, 1.0] | 1.000 | 1.000 | 1.000 |
| Glottic closure | 1.0 [1.0, 2.0] | 1.0 [1.0, 2.0] | 1.0 [1.0, 2.0] | 0.625 | 1.000 | 1.000 |
| Vibratory functionRight | 1.0 [1.0, 2.0] | 1.0 [1.0, 2.0] | 1.0 [1.0, 2.0] | 1.000 | 1.000 | 1.000 |
| Vibratory functionLeft | 1.0 [1.0, 2.0] | 1.0 [1.0, 2.0] | 1.0 [1.0, 2.0] | 1.000 | 1.000 | 1.000 |
Results are expressed as p-values obtained by the exact Wilcoxon test or sign test. SHAP: anteroposterior supraglottic hyperfunction. SHL: medial false vocal fold constriction. RVFabd: right vocal fold abduction. RVFadd: right vocal fold adduction. RVFtension: right vocal fold longitudinal tension. LVFabd: left vocal fold abduction. LVFadd: left vocal fold adduction. LVFtension: left vocal fold longitudinal tension. RArymov: right arytenoid joint movement. LArymov: left arytenoid joint movement. RFS: reflux finding score. RVFcolor: right vocal fold color. LVFcolor: left vocal fold color. VFmasses: vocal fold masses. Amplitude: amplitude symmetry. Phase: phase symmetry.
As in SHAP, in SHL, significant differences were also found between all of the time points (p < 0.001, p < 0.001, and p = 0.021, respectively) (Table 3).
The RFS did not show significant differences between all of the time points (p = 0.250, p = 0.250, and p = 1.000, respectively).
No other differences were identified regarding the remaining videoendostroboscopy parameters (Table 3).
3.3.4Acoustic analysis
In the acoustic analysis, no significant differences were found for any of the tested variables (Tables 4 and 5).
Table 4
Comparison of acoustic analysis parameters between all of the study time points
| Acoustic analysis | Median | p-value | ||||
| Pre [P25, P75] | Short term [P25, P75] | Long term [P25, P75] | Pre-Short term interval | Pre-Long term interval | Short term-Long term interval | |
| F0a | 178.6 [156.2, 195.1] | 176.8 [141.8, 200.4] | 186.3 [171.4, 205.4] | 0.848 | 0.228 | 0.334 |
| F0e | 184.3 [161.3, 206.7] | 178.1 [161.6, 213.2] | 186.8 [162.6, 203.2] | 0.683 | 0.787 | 0.523 |
| F0i | 200.5 [163.9, 229.3] | 185.7 [168.1, 223.0] | 203.3 [172.4, 225.2] | 0.544 | 0.181 | 0.109 |
| F0Maxa | 187.7 [162.1, 215.1] | 186.1 [151.0, 221.1] | 198.2 [178.4, 213.9] | 0.314 | 0.510 | 0.307 |
| F0Maxe | 197.3 [170.7, 215.1] | 188.5 [172.1, 219.1] | 193.8 [167.5, 217.0] | 0.503 | 1.000 | 0.774 |
| F0Maxi | 208.0 [172.8, 236.1] | 197.8 [176.6, 233.0] | 212.0 [179.3, 237.1] | 0.476 | 0.178 | 0.196 |
| F0Mina | 162.7 [135.3, 184.5] | 170.9 [133.6, 187.7] | 174.3 [153.8, 192.4] | 0.464 | 0.105 | 0.367 |
| F0Mine | 178.2 [146.0, 200.0] | 171.0 [147.9, 198.0] | 180.0 [154.6, 193.6] | 0.949 | 0.426 | 0.774 |
| F0Mini | 189.4 [154.6, 219.1] | 172.6 [160.0, 217.8] | 190.1 [165.8, 217.2] | 0.577 | 0.196 | 0.081 |
| F0SDa | 3.2 [2.0, 4.3] | 2.6 [1.8, 3.8] | 2.8 [2.3, 3.9] | 0.126 | 0.521 | 0.856 |
| F0SDe | 2.6 [2.0, 3.8] | 2.5 [1.7, 3.5] | 2.8 [2.0, 3.8] | 0.636 | 0.606 | 0.961 |
| F0SDi | 2.5 [1.7, 3.9] | 2.6 [2.1, 3.4] | 2.6 [2.1, 4.1] | 0.815 | 0.863 | 0.603 |
| F0Ta | 1.5 [1.1, 2.7] | 1.4 [1.0, 2.3] | 1.4 [1.1, 3.2] | 0.518 | 0.739 | 0.784 |
| F0Te | 1.5 [1.1, 2.6] | 1.4 [1.1, 2.3] | 1.3 [1.0, 2.1] | 0.639 | 0.204 | 0.357 |
| F0Ti | 1.2 [1.0, 1.9] | 1.5 [1.1, 2.4] | 1.3 [1.1, 1.9] | 0.256 | 0.774 | 0.310 |
Results are expressed as p-values obtained by the exact Wilcoxon test or sign test. F0: fundamental frequency average. F0Max: fundamental frequency maximum. F0Min: fundamental frequency minimum. F0SD: fundamental frequency standard deviation. F0T: fundamental frequency tremor. a: vowel /a/. e: vowel /e/. i: vowel /i/.
Table 5
Comparison of acoustic analysis parameters between all of the study time points (continuation)
| Acoustic analysis | Median | p-value | ||||
| Pre [P25, P75] | Short term [P25, P75] | Long term [P25, P75] | Pre-Short term interval | Pre-Long term interval | Short term-Long term interval | |
| Ja | 0.39 [0.24, 0.64] | 0.29 [0.22, 0.44] | 0.31 [0.18, 0.56] | 0.109 | 0.656 | 0.748 |
| Je | 0.29 [0.18, 0.48] | 0.25 [0.20, 0.37] | 0.26 [0.20, 0.41] | 0.070 | 0.585 | 0.117 |
| Ji | 0.19 [0.15, 0.29] | 0.20 [0.15, 0.33] | 0.24 [0.15, 0.41] | 0.780 | 0.413 | 0.963 |
| Sha | 2.89 [2.10, 4.49] | 2.71 [1.93, 3.71] | 2.93 [1.58, 4.66] | 0.439 | 0.574 | 0.332 |
| She | 2.01 [1.29, 2.98] | 2.28 [1.25, 2.83] | 2.04 [1.34, 2.39] | 0.654 | 0.836 | 0.956 |
| Shi | 1.25 [0.74, 1.79] | 1.26 [0.9, 1.73] | 1.27 [0.99, 1.48] | 0.523 | 0.307 | 0.664 |
| NNEa | – 8.67 [– 12.75, – 3.90] | – 8.67 [– 13.05, – 4.59] | – 10.42 [– 16.29, – 4.56] | 0.997 | 0.447 | 0.097 |
| NNEe | – 6.90 [– 12.31, – 2.82] | – 7.51 [– 12.08, – 4.76] | – 8.75 [– 13.21, – 3.30] | 0.164 | 0.092 | 0.876 |
| NNEi | – 8.06 [– 13.59, – 4.49] | – 8.45 [– 11.99, – 4.28] | – 8.44 [– 13.01, – 4.50] | 0.824 | 0.532 | 0.836 |
| HNRa | 20.85 [17.12, 24.67] | 21.38 [19.35, 25.01] | 20.96 [18.31, 24.56] | 0.583 | 0.554 | 0.235 |
| HNRe | 24.74 [19.94, 28.25] | 24.35 [21.52, 27.15] | 25.18 [22.97, 26.06] | 0.731 | 0.612 | 0.116 |
| HNRi | 29.07 [26.37, 32.49] | 27.66 [27.73, 30.75] | 28.46 [25.18, 30.04] | 0.139 | 0.055 | 0.546 |
Results are expressed as p-values obtained by the exact Wilcoxon test or sign test. J: jitter. Sh: shimmer. NNE: normalized noise energy. HNR: harmonic-to-noise ratio. a: vowel /a/. e: vowel /e/. i: vowel /i/.
4Discussion
The association between body posture and voice is consensual across the scientific literature and seems to be established both ways.
Several published studies showed that using several types of techniques and exercises to modify bodily and cervical posture leads to an improvement of vocal production, confirming that changes in posture lead to vocal changes [39, 40, 44, 45, 50].
However, vocal changes seem to lead to either global or segmental postural changes [9, 30, 32].
Studies performed in healthy, normal subjects showed that, during vocal effort, there are changes in the head posture and in the cervical region, which lead to a deviation from the center of gravity, henceforth causing changes in the bodily posture and balance of the subjects [13, 14, 17, 28].
Studies conducted on static platforms of patients with vocal changes or dysphonia also showed a set of segmental (cervical and extra-laryngeal regions) and global changes in posture (scapular and pelvic region and ankles), with resulting unbalance of the subjects. When these patients underwent vocal rehabilitation, there was an improvement in their postural performance [32].
Nacci et al. [32] stressed the role of the proprioceptive system. In this process, the proprioceptive laryngeal and extra-laryngeal inputs are integrated at the level of the central nervous system and lead to a compensatory motor response that can be responsible for changes in posture and voice quality.
However, for the sustenance of correct balance and posture, the central nervous system receives sensorial information not only from the proprioceptive system but also from the visual and vestibular systems [15].
In the scientific literature, there is only one study, published in 2010, that uses dynamic posturography, a technique that allows the evaluation of these components [15]. In this study, patients with dysphonia were evaluated before and after vocal rehabilitation. After vocal therapy, the subjects adopted better vocal projection strategies with a more efficient body alignment and improved visual and vestibular components of balance.
The present investigation studied patients with vestibular and proprioceptive alterations and evaluated if there were measurable vocal changes after vestibular rehabilitation. This group of patients sought treatment at the hospital for balance disorders only.
The results obtained after treatment proved the efficacy of vestibular rehabilitation in this group of patients. Regarding personalized balance treatments, the success rate in the literature was between 50% and 80%, lower than that found in the present study (89.6%) [8, 11, 12, 15, 25, 37, 38, 43, 47– 49].
During the initial assessment, the highest rate of change occurred in the vestibular component of the balance and, therefore, it was not a surprise to verify that this was the component that mostly improved as a result of treatment.
The apparent worsening of PREF effectively represents a clinical improvement, as the patients in question had a null vestibular component before treatment.
The clinical evaluation confirmed that the patients’ vocal health habits did not change throughout the study, ensuring that these factors did not interfere neither with vocal quality or the interpretation of the results. Likewise, specific pathologies that could have interfered with the interpretation of the study results, such as gastric or osteoarticular pathology, were excluded.
Approximately 42% of the patients stated vocal symptoms in their clinical history, although not perceived as a vocal handicap, which may explain the lack of significant results in VHI.
During the pre-treatment evaluation, it was ascertained that the patients had different degrees of supraglottic hyperfunction following videoendoscopic examination and presented changes in the audio-perceptual scale analysis.
After vestibular rehabilitation, there was a statistically significant improvement in some parameters of the videoendoscopic evaluation and audio-perceptive measures. These improvements were detected immediately after treatment and remained at least until three months after treatment.
Although subjective and considered by some authors highly unreliable [26, 27], audio-perceptual measures are accepted as a method of vocal evaluation [2, 10, 33, 52].The GRBAS scale is widely used for audio-perceptual measures of voice quality with good intra-rater and inter-rater reliability for phonation dimension grade (G) and breathiness (B) [2, 7].
Several authors [23, 30, 41, 44, 51] argued that the presence of some isolated videoendoscopy changes, outside clinical contexts, do not necessarily indicate vocal pathology. In the specific case of SHAP and SHL, this report is in agreement with some studies [4, 23, 36, 41, 46] that showed that the presence of supraglottic laryngeal hyperfunction does not indicate the presence of muscular tension dysphonia. However, it represents an effortful phonation technique that, if persistent or prolonged in time, may cause vocal complaints [41].
Reflux disease is recognized as a cause of laryngeal alterations and vocal pathology [24]. Some studies specifically mention that esophageal stimulation by acid may cause a reflex contraction of the larynx and that pharyngeal globus sensation in reflux patients arises from the contraction/tension of the pharyngolaryngeal muscle [1]. None of the patients in this study complained of pharyngolaryngeal reflux at baseline or over the subsequent three months, although 15 reported earlier gastroesophageal reflux. Nevertheless, it was important to exclude reflux when interpreting the findings. Thus, the RFS scores before and after treatment were compared, and no statistically significant differences were identified. This demonstrated that vocal improvement after vestibular rehabilitation was not due to the improvement of pharyngolaryngeal reflux disease.
The intra- and inter-observer variability was quite high, which may be explained by the experience of the observers in the evaluation of these types of exams, as well as by the exhaustive discussion of the videoendostroboscopic scales and criteria before the assessments.
The lack of statistically significant results in acoustic evaluation may be explained by the isolated analysis of each acoustic parameter [3, 31].
Effectively, vocal changes seem to be related to balance changes, which can be corrected with vestibular rehabilitation.
Most likely, together with vestibular and proprioceptive changes connected to balance disorders, compensatory mechanisms of balance are set in motion, leading to the global tension of the body. Pelvic, abdominal, thoracic, and cervical tension change vocal production through interference, both in laryngeal and extra-laryngeal mechanisms.
Thus, vestibular pathology leads to compensatory global postural changes that appear to cause cervical and laryngeal tension and a consequent change in vocal quality. In treating vestibular disorders, correction of body posture is related to improvement in cervical tension and vocal quality.
Moreover, as vertigo and nauseous symptoms are very stressing for the patients it is possible that, as a consequence, a supraglottic constriction arise, naturally solved after the disappearance of the symptoms.
The patients in this study were submitted to balance/posture treatment with vestibular rehabilitation techniques (OPT and PDCT) that induce reprogramming at the central nervous system level, improving the overall posture stability.
The reduction of anteroposterior supraglottic tension and medial false vocal fold constriction after this treatment is in accordance with Nacci et al. [32], who argued that global changes in posture lead to localized changes, particularly in the laryngeal musculature.
Gould [16] attempted to explain this phenomenon by referring to neuromuscular receptors in the abdominal, intercostal, diaphragm, and intrinsic muscles of the larynx, suggesting a direct relationship between vocal production and proprioceptive control of balance. Postural alterations at the thoracic or abdominal level lead to proprioceptive reflexes related to breathing and the position of the vocal folds, which in turn affect vocal production [16].
It is important to emphasize that the effects of optokinetic stimulations are still not fully understood [29], since their therapeutic effect is known to result from the creation of a sensory conflict between the vestibular ocular reflex and the vestibular spinal reflex with a key role for the cerebellum and Purkinje cells. The functions of the cerebellum are also not yet fully understood, and this organ seems to have many significant functions [6, 19, 35].
This pilot study is entirely original as it assessed, for the first time, vocal quality in patients with vestibular alterations, before and after balance/posture treatment.
The main limitations of this study are the absence of a control group and the sample size decrease due to the loss to follow-up of some patients. Further research is necessary to confirm the results of this report.
5Conclusions
Computerized dynamic posturography is unique in balance evaluation as it attempts to assess vestibular, visual, and somatosensory systems both together and independently.
Although reports have associated postural alterations with changes in vocal quality, this study investigated, for the first time, the association between balance disorders (vestibular, visual, or proprioceptive alterations) and voice using CDP.
Balance disorders lead to compensatory postural changes. These postural changes seem to cause some alterations in cervical and laryngeal tension, which lead to changes in vocal quality.
By treating balance disorders, there is a correction in body posture, and there seems to be a consequent improvement in cervical tension accompanied by improvements in vocal quality.
Type of article: Original contribution
This prospective cohort study considers, for the first time, patients with vestibular and proprioceptive alterations (identified by videonystagmography and computerized dynamic posturography) and evaluates if there are measurable vocal changes after vestibular rehabilitation.
Declaration of interest
None.
This research did not receive any specific grant funding agencies in the public, commercial, or not-for-profit sectors.
Appendices
Appendix
Laryngostroboscopic rating form: explanation of scales
Antero-posterior supraglottic hyperfunction (3-point scale): 0: anterior and posterior commissure clearly visible; 1: anterior commissure and/or posterior commissure not visible; 2: anterior commissure, posterior commissure, and vocal process not visible.
Medial false vocal fold constriction (4-point scale): 0: ventricular fold clearly visible; 1: vocal fold visible; 2: inner vocal fold edge visible; 3: vocal fold not visible at all.
Vocal fold movement: adduction, abduction, and vocal fold tension (right/left) (3-point scale): 1: normal; 2: paresis; 3: paralysis.
Amplitude: 1: symmetrical; 2: asymmetrical.
Phase: 1: symmetrical; 2: asymmetrical.
Vocal fold closure: 1: complete; 2: incomplete.
Reflux finding score (16): 1: normal; 2: abnormal.
Vocal fold masses (right/left): 1: absent; 2: present.
Acknowledgments
The authors gratefully acknowledge Prof. Robert Sataloff for his invaluable support and helpful comments.
References
[1] | Angsuwarangsee T. and Morrison M. , Extrinsic laryngeal muscular tension in patients with voice disorders, J Voice 16: ((2002) ), 333–43. |
[2] | Baravieira P.B. , Brasolotto A.G. , Montagnoli A.N. , Silvério K.C. , Yamasaki R. and Behlau M. , Auditory-perceptual evaluation of rough and breathy voices: correspondence between analogical visual and numerical scale, Codas 28: ((2016) ), 163–7. |
[3] | Barsties B. and De Bodt M. , Assessment of voice quality: Current state-of-the-art, Auris Nasus Larynx 42: ((2015) ), 183–8. |
[4] | Behrman A. , Dahl L.D. , Abramson A.L. and Schutte H. , Anterior-posterior and medial compression of the supraglottis: sign of nonorganic dysphonia or normal postures? J Voice 17: ((2003) ), 403–10. |
[5] | Belafsky R.C. , Postma G.N. and Koufman J.A. , The validity and reliability of reflux finding score, Laryngoscope 111: ((2001) ), 1313–7. |
[6] | Bower J.M. and Parsons L.M. , Rethinking the “lesser brain”, SciAm 289: ((2003) ), 50–7. |
[7] | Brinca L. , Batista A.P. , Tavares A.I. , Pinto P.N. and Araújo L. , The effect of anchors and training on the reliability of voice quality ratings for different types of speech stimuli, J Voice 29: ((2015) ), 776.e7–14. |
[8] | Brown K.E. , Whitney S.L. , Wrisley D.M. and Furman J.M. , Physical therapy outcomes for persons with bilateral vestibular loss, Laryngoscope 111: ((2001) ), 1812–17. |
[9] | Bruno E. , Padova A. , Napolitano B. , Marroni P. , Batelli R. , Ottaviani F. , and et al, Voice disorders and posturography: variables to define the success of rehabilitative treatment, J Voice 1: ((2009) ), 71–5. |
[10] | Carding P. , Carlson E. , Epstein R. , Mathieson L. and Shewell C. , Formal perceptual evaluation of voice quality in the United Kingdom, Logoped Phoniatr Vocol 25: ((2000) ), 133–8. |
[11] | Cass S.P. , Borello-France D. and Furman J.M. , Functional outcome of vestibular rehabilitation in patients with abnormal sensory-organization testing, Am J Otol 17: ((1996) ), 581–94. |
[12] | Eleftheriadou A. , Skalidi N. and Velegrakis G.A. , Vestibular rehabilitation strategies and facts that affect the outcome, Eur Arch Otorhinolaryngol 269: ((2012) ), 2309–16. |
[13] | Giovanni A. , Akl L. and Ouaknine M. , Postural dynamics and vocal effort: preliminary experimental analysis, Folia Phoniatr Logop 2: ((2008) ), 80–5. |
[14] | Giovanni A. , Assaiante Ch. , Galmiche A. , Vaugoyeau M. , Ouaknine M. and Le Huche F. , Vocal forcing and posture: experimental studies on normal subject, Rev Laryngol Otol Rhinol 5: ((2006) ), 285–91. |
[15] | Goebel J.A. , Pratical management of the dizzy patient, Philadelphia: Lippincott Williams & Wilkins, (2001) . |
[16] | Gould W.J. , Effect of respiratory and postural mechanisms upon action of the vocal cords, Folia Phoniat 23: ((1971) ), 211–24. |
[17] | Grini-Grandval M.N. , Ouaknine M. and Giovanni A. , Forcing the voice and variance of speed: correlation between the speed of displacement of the center of gravity and the work of the postural muscles, Rev Laryngol Otol Rhinol 5: ((2000) ), 319–23. |
[18] | Guimarães I. and Abberton E. , An investigation of the Voice Handicap Index with speakers of portuguese: preliminary data, J Voice 4: ((2004) ), 592–606. |
[19] | Highstein S.M. , Fay R.R. , The vestibular system, 1st ed, New York: Springer- Verlag, (2004) . |
[20] | Hirano M. , Clinical Examination of the Voice, First Edition, New York: Springer-Verlag, (1981) . |
[21] | IBM Corp. Released 2015, IBM SPSS Statistics for Windows, Version 23.0. Armonk, NY: IBM Corp. |
[22] | Kendall K.A. , Leonard R.J. , Laryngeal Evaluation- Indirect Laryngoscopy to High-Speed Digital Imaging, 1st ed, New York: Thieme Medical Publishers, Inc, (2010) . |
[23] | Khoddami S.M. , Ansari N.N. , Izadi F. and Moghadam S.T. , The assessment methods of laryngeal muscle activity in muscle tension dysphonia: A review, Sci World J (2013), 507397. |
[24] | Koufman J.A. , The otolaryngologic manifestations of gastric-esophageal reflux disease (GERD): A clinical investigation of 225 patients using ambulatory 24-hour pH monitoring and an experimental investigation of the role of acid and pepsin in the development of laryngeal injury, Laryngoscope 101: ((1991) ), 1–78. |
[25] | Krebs D.E. , Gill-Body K.M. , Parker S.W. , Ramirez J.V. and Wernick-Robinson M. , Vestibular rehabilitation: useful but not universally so, Otolaryngol Head Neck Surg 128: ((2003) ), 240–50. |
[26] | Kreiman J. and Gerratt B.R. , Validity of rating scale measures of voice quality, J Acoust Soc Am 104: ((1998) ), 1598–608. |
[27] | Kreiman J. , Gerratt B.R. , Precoda K. and Berke G.S. , Individual differences in voice quality perception, J Speech Hear Res 35: ((1992) ), 512–20. |
[28] | Lagier A. , Vaugoyeau M. , Bouché C. , Ghio A. , Legou T. , Assaiante C. , and et al, Postural study on healthy subjects during experimental vocal effort, Rev Laryngol Otol Rhinol 1: ((2009) ), 11–6. |
[29] | Leigh R.J. , Zee D.S. , Neurology of EyeMovements, 5th ed, Oxford: Oxford University Press, (2015) . |
[30] | Lobryeau-Desnus C. , Girard P. , Daguenant C. , Constant O. , Rallo M. and Jamet S. , Rehabilitation strategies of dysfunctional dysphonia in relation to posture, Rev Laryngol Otol Rhinol 1: ((2010) ), 69–72. |
[31] | Lopes L.W. , Batista Simões L. , Delfino da Silva J. , da Silva Evangelista D. , da Nóbrega Ugulino A.C. , Oliveira Costa Silva P. , and et al, Accuracy of acoustic analysis measurements in the evaluation of patients with different learyngeal diagnoses,382e, J Voice 31: ((2017) ), 15–26. |
[32] | Nacci A. , Fattori B. , Mancini V. , Panicucci E. , Matteucci J. , Ursino F. , and et al, Posturographic analysis in patients with dysfunctional dysphonia before and after speech therapy/rehabilitation treatment, Acta Otorhinolaryngol Ital 2: ((2012) ), 115–21. |
[33] | Nemr K. , Simões-Zenari M. , Cordeiro G.F. , Tsuji D. , Ogawa A.I. , Ubrig M.T. and Menezes M.H. , GRBAS and Cape-V scales: high reliability and consensus when applied at different times, J Voice 26: ((2012) ), 812.e17–22. |
[34] | NeuroCom International Inc, EquiTest system operator’s manual version 8.5, Clackamas: NeuroCom International Inc, 2004. |
[35] | Paço J. , Doença de Ménière, do diagnóstico à terapêutica, 1st ed, Amplifon Portugal, S.A., 2016. |
[36] | Paoletti O.A. , Fraire M.E. , Sanchez-Vallecillo M.V. , Zernotti M. , Olmos M.E. and Zernotti M.E. , The use of fibrolaryngoscopy in muscle tension dysphonia in telemarketers, Acta Otorrinolaringol Esp 63: ((2012) ), 200–5. |
[37] | Rossi-Izquierdo M. , Santos-Pérez S. and Soto-Varela A. , What is the most effective vestibular rehabilitation technique in patients with unilateral peripheral vestibular disorders? Eur Arch Otorhinolaryngol 268: ((2011) ), 1569–74. |
[38] | Rossi-Izquierdo M. , Soto-Varela A. , Santos-Pérez S. , Sesar-Ignacio A. and Labella-Caballero T. , Vestibular rehabilitation with computerized dynamic posturography in patients with Parkinson’s disease: Improving balance impairment, Disabil Rehabil 31: ((2009) ), 1907–16. |
[39] | Rubin J. , Blake E. and Mathieson L. , The effects of posture on voice, in: Professional Voice The Science and Art of Clinical Care, SataloffRT, ed., Plural Publishing, San Diego, 2005, pp. 1079-85. |
[40] | Rubin J. , Blake E. and Mathieson L. , The effects of posture on voice, in: Diagnosis and treatment of voice disorders, Rubin JS, Sataloff RT, Korovin GS, editors., Plural Publishing, San Diego, 2006, pp. 627–35. |
[41] | Sama A. , Carding P.N. , Price S. , Kelly P. and Wilson J.A. , The clinical features of functional dysphonia, Laryngoscope 111: ((2001) ), 458–63. |
[42] | Sataloff R.T. , Professional voice: The Science and Art of Clinical Care, 3rd ed, San Diego: Plural Publications, (2005) . |
[43] | Shepard N.T. and Telian S.A. , Programmatic vestibular rehabilitation, Otolaryngol Head Neck Surg 112: ((1995) ), 173–82. |
[44] | Schneider C.M. , Dennehy C.A. and Saxon K.G. , Exercise physiology principles applied to vocal performance: the improvement of postural alignment, J Voice 3: ((1997) ), 332–7. |
[45] | Staes F.F. , Jasen L. , Vilette A. , Ghio A. , Legou T. , Assaiante C. , and et al, Physical therapy as a means to optimize posture and voice parameters in student classical singers: a case report, J Voice 3: ((2011) ), 91–101. |
[46] | Stager S.V. , Bielamowicz S.A. , Regnell J.R. , Gupta A. and Barkmeier J.M. , Supraglottic activity: evidence of vocal hyperfunction or laryngeal articulation? J Speech Lang Hear Res 43: ((2000) ), 229–38. |
[47] | Topuz O. , Topuz B. , Ardic F.N. , Sarhus M. , Ogmen G. and Ardic F. , Efficacy of vestibular rehabilitation on chronic unilateral vestibular dysfunction, Clin Rehabil 18: ((2004) ), 76–83. |
[48] | Venosa A.R. and Bittar R.S. , Vestibular rehabilitation exercises in acute vertigo, Laryngoscope 117: ((2007) ), 1482–7. |
[49] | Whitney S.L. , Wrisley D.M. , Marchetti G.F. and Furman J.M. , The effect of age on vestibular rehabilitation outcomes, Laryngoscope 112: ((2002) ), 1785–90. |
[50] | Wilson Arboleda B.M. and Frederick A. , Considerations for maintenance of postural alignment for voice production, J Voice 1: ((2008) ), 90–9. |
[51] | Woo P. , P, Stroboscopy, 1st ed, San Diego: Plural Publishing, Inc., (2010) . |
[52] | Yamaguchi H. , Shrivastav R. , Andrews M.L. and Niimi S. , A comparison of voice quality ratings made by Japanese and American listeners using the GRBAS scale, Folia Phoniatr Logop 55: ((2003) ), 147–57. |

