
Estimating loss of canal function in the video head impulse test (vHIT)
Abstract
BACKGROUND:
The vestibulo-ocular reflex (VOR) gain is the primary parameter for quantifying and interpreting the video head impulse test (vHIT). Yet, the relationship between the VOR gain and the extent of canal function is not clear.
OBJECTIVE:
The goal of this paper was to determine if the loss of canal function in vHIT can be estimated from the VOR gain.
METHODS:
A model of the VOR was developed that included linear components for the cupula and the velocity storage mechanism as well as nonlinear components for the vestibular nerve and the vestibular nuclei. Multiple simulations were carried out as the level of function for the right and left VOR pathways was varied systematically over their entire range.
RESULTS:
Simulation results were similar to the typical findings in normal individuals as well as in patients with unilateral and bilateral loss of canal function. Based on these simulations, a relationship between the canal function and the VOR gains was established. This relationship was surprisingly independent of most model parameters.
CONCLUSIONS:
The sum of right and left VOR gains (or 2 times the mean of VOR gains) at a given head velocity is an estimate of the total function of the involved canals. This simple formula can estimate the loss of canal function in purely unilateral lesions. For bilateral lesions, the same formula can estimate the total loss of bilateral function but contributions from individual canals cannot be determined without additional information.
1Introduction
The head impulse test (HIT) was introduced as a bedside test of the vestibulo-ocular reflex (VOR) function in 1988 [12]. In the bedside test, presence of visible catch-up saccades, now referred to as overt saccades, is a cardinal sign of abnormality in the ipsilateral semicircular canal or its afferent neural pathways. The instrumented HIT was developed in the 1990 s using the scleral search coil [1]. A decade later, video head impulse test (vHIT) was introduced and is now used with increasing frequency in many clinics [16]. The primary parameter for identifying abnormalities in vHIT has been the VOR gain, which is defined as the ratio of eye to head movements [2]. Although reports for quantification of catch-up saccade parameters are emerging, the VOR gain remains the most common measure for the interpretation of vHIT [15, 30].
The VOR gain is a complicated parameter for many reasons. First, there is disagreement about what measures of head and eye movements should be used to calculate the VOR gain [11]. Instantaneous velocities at different time intervals, peak accelerations, and positions for head and eye movements have been suggested for quantifying the VOR gain [4]. However, there is no consensus at this time about the preferred method. Second, VOR gains are presented in an audiogram-like form to represent responses for rightward and leftward responses. Unlike audiograms however, the gain parameter does not reflect the function of a single canal and instead, represents the function of both involved canals. The reason is that the excitatory and inhibitory responses from the right and left paired semicircular canals work in a push-pull manner to generate compensatory eye movements. Although the inhibitory responses saturate at high head velocities, the saturation is limited to a fraction of the impulse duration. This can be easily verified by the vHIT results from patients who have complete loss of unilateral function. For head impulses toward the damaged side, the VOR gain is usually not zero because of the contribution for the contralateral semicircular canal.
As expected, there has been a great deal of interest in comparing vHIT with the more traditional vestibular tests such as the caloric test [5, 22, 24, 25]. Although normative values have been reported for the VOR gain, it is unclear how the VOR gain is related to the loss of canal function [21].
The purpose of this paper was to investigate how different levels of unilateral and bilateral vestibular loss affect the VOR gain. To achieve this goal the following steps were taken:
– A customizable model of the VOR was developed that included nonlinearities of both the vestibular nerve and the vestibular nuclei. Computer simulations were carried out to validate the model by comparing its predictions with typical clinical findings in normal individuals and patient groups such as those with unilateral and bilateral loss of canal function.
– Different methods for gain calculation were compared to determine if one method was more appropriate for estimating the canal function.
– Simulation results were used to determine if the loss of canal function can be estimated from the VOR gains.
2Methods
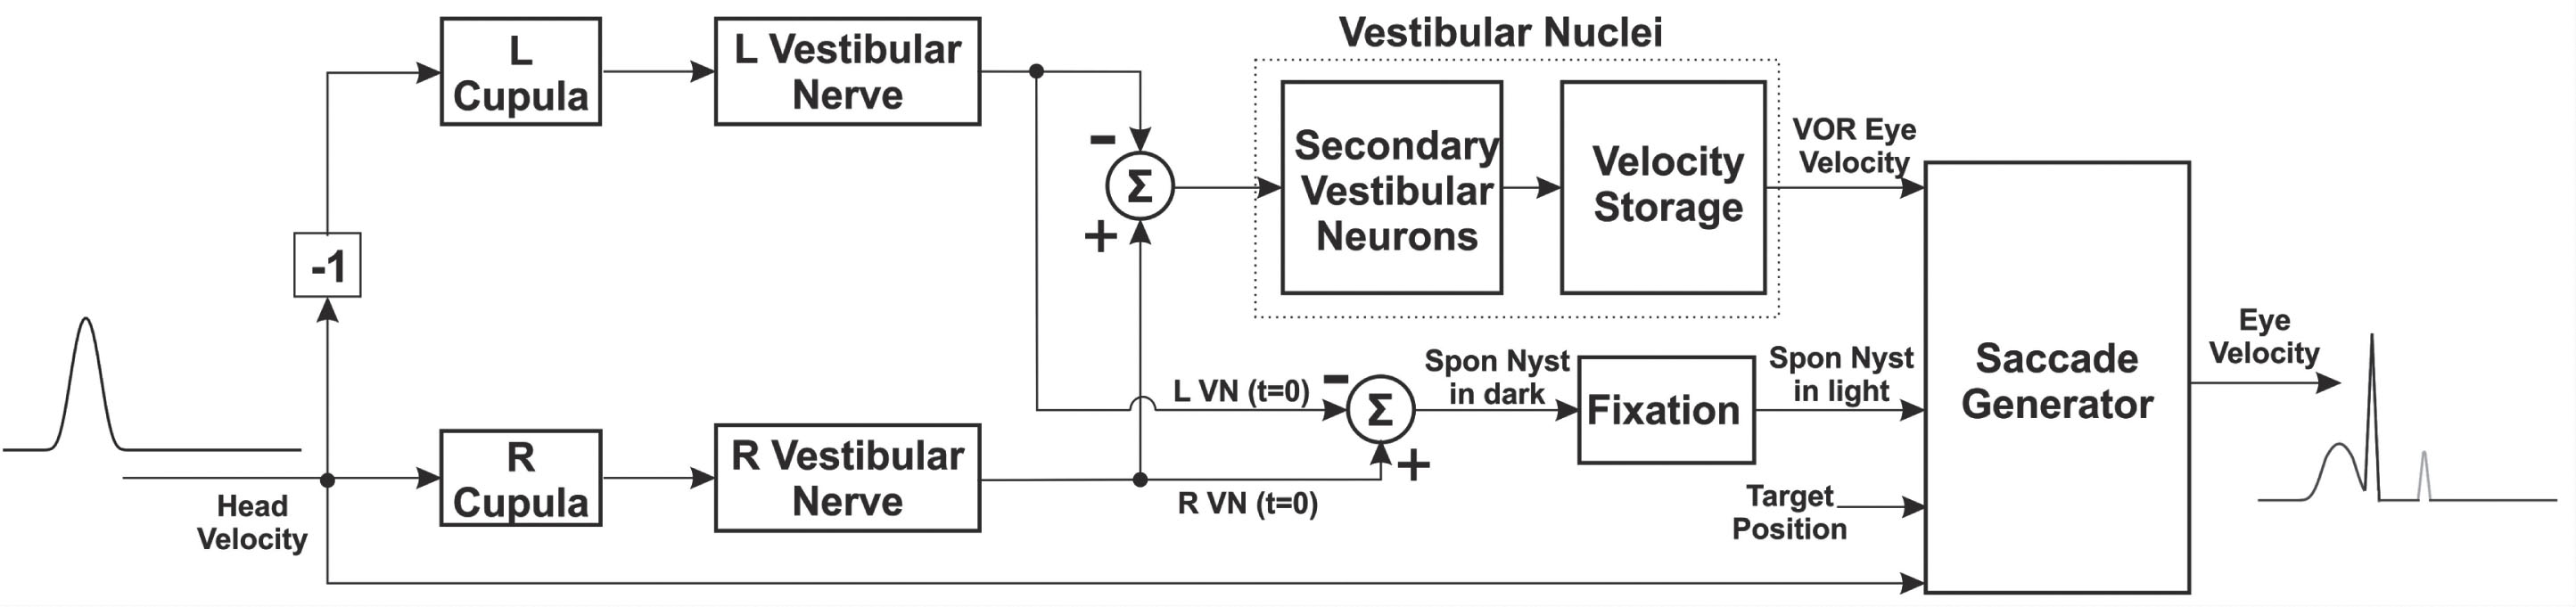
A model of the VOR was developed to explore the relationship between the VOR gain and the extent of canal function loss. The model is based on the previous work, namely those by Hain and colleagues [9] and by Galiana and colleagues [6, 7], but it was modified to better represent the HIT. Figure 1 shows a schematic diagram of the model. A computer simulation of the model was implemented on MATLAB (The MathWorks, Inc., MA, USA).
Fig. 1
Schematic diagram of the VOR pathways.
The model consists of fully-customizable parameters. These parameters, grouped together based on their role, are listed in Table 1 and described in detail below. The default parameters are optimized for lateral head impulses but can be modified for testing the vertical canals.
Table 1
List of Model Parameters, Their Default Values, and Descriptions
| Parameter(s)1 | Default | Unit | Random?2 | Description | |
| Stimulus | VmR, VmL | 100 | °/s | – | Minimum peak velocity of impulses |
| VxR, VxL | 100 | °/s | – | Maximum peak velocity of impulses | |
| NiR, NiL | 9 | – | – | Number of impulses | |
| Tb | 0.1 | s | – | Pre-stimulus time before onset of impulse | |
| Ti | 0.12 | s | – | Duration of impulse | |
| To | 0.7 | s | – | Total observation time | |
| Tv | 0 | s | – | Duration of overshoot | |
| Gv | 0% | – | – | Percent overshoot (0% means no overshoot) | |
| Rt | vHIT | – | – | Test type (vHIT/SHIMP) | |
| VOR Model | TdR, TdL | 0 | s | – | VOR latency |
| TcR, TcL | 7 | s | – | Cupula time constant | |
| GnR, GnL | 0.5 | – | – | Velocity to neural firing conversion rate | |
| NtR, NtL | 80 | – | – | Tonic neural firing | |
| NxR, NxL | 400 | – | – | Maximum neural firing | |
| Ts | 17 | s | – | Velocity storage mechanism time constant | |
| Ge | 3 | – | – | Ratio of excitatory vs inhibitory response | |
| Saccade | Gr | 2.3 | – | – | Slope of saccade duration-amplitude function |
| Tr | 28 | s | – | Intercept of saccade duration-amplitude function | |
| Vs | 524 | s | – | Maximum saccade velocity | |
| Tl | 80 | s | 10% | Saccade latency | |
| Rp | Enabled | – | – | Position-based saccades (enabled/disabled) | |
| Ap | 1.5 | ° | 10% | Position difference to trigger a saccade | |
| Rv | Enabled | – | – | Velocity-based saccades (enabled/disabled) | |
| Vv | 80 | °/s | 10% | velocity difference to trigger a saccade | |
| Lesion | GfR, GfL | 100% | – | – | Level of canal function |
| Gs | 100% | – | – | Percent static compensation | |
| Gc | 0% | – | – | Percent cerebellar clamping | |
| Gx | 25% | – | – | Percent fixation suppression |
1For some parameters, the values for the right and left pathways can be defined independently. These parameters are identified with subscripts that end either in R or L. 2Some parameters are randomized to provide more realistic simulations. For those parameters, the default percent of randomization is listed in this column.
2.1Stimulus parameters
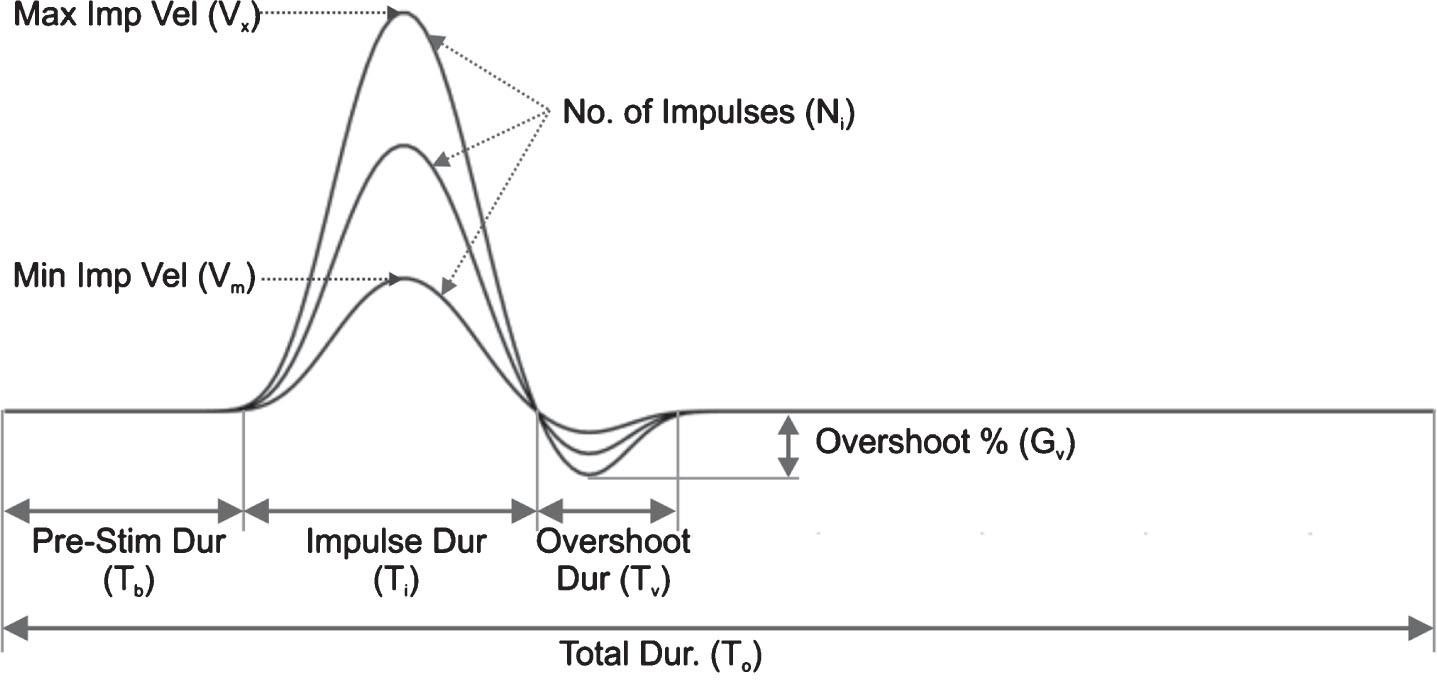
The stimulus parameters define the head velocity signals used in the simulations. The base signal is generated by low-pass filtering of a pulse. The pre- and post-impulse signals are added to the base signal to generate a realistic head velocity stimulus. The user can specify the number of impulses, the range of velocities, and whether or not to include an overshoot. The stimulus parameters can be selected for rightward and leftward impulses independently. Figure 2 shows the head velocity and its selectable parameters.
Fig. 2
Head velocity profile and its selectable parameters. See Table 1 for the description of the parameters.
2.2VOR parameters
Figure 3 shows the model of the cupulae and their afferent neural pathways. The cupula dynamics is represented by a first order system preceded by a delay unit to account for the VOR latency. The delay unit represents the overall latency of both peripheral and central vestibular pathways. A more realistic model should perhaps have independent representation for these two pathways. Regardless, the delay was not used in this study. The output of the first order system is converted to the neural firing and the tonic neural activity is added to the resulting signal. The signal then goes through a saturation block with a lower limit of zero and a selectable upper limit. This represents the first non-linearity in the VOR pathway. Finally, the simulated neural signal undergoes a reverse conversion to represent an estimate of the head velocity before it is sent to the vestibular nuclei. The role of this latter conversion is to assure that the VOR gain will be approximately equal to 1 for normal subjects.
Fig. 3
Detailed model of the cupula, vestibular nerve, and velocity storage mechanism dynamics. It is assumed that there is an asymmetry with reduced function for the right side. Therefore, static compensation is applied to the right pathways while cerebellar clamping is applied to the left pathways. The model depicts a rightward head impulse where the gain for the excitatory side can be higher than the gain for the inhibitory side.
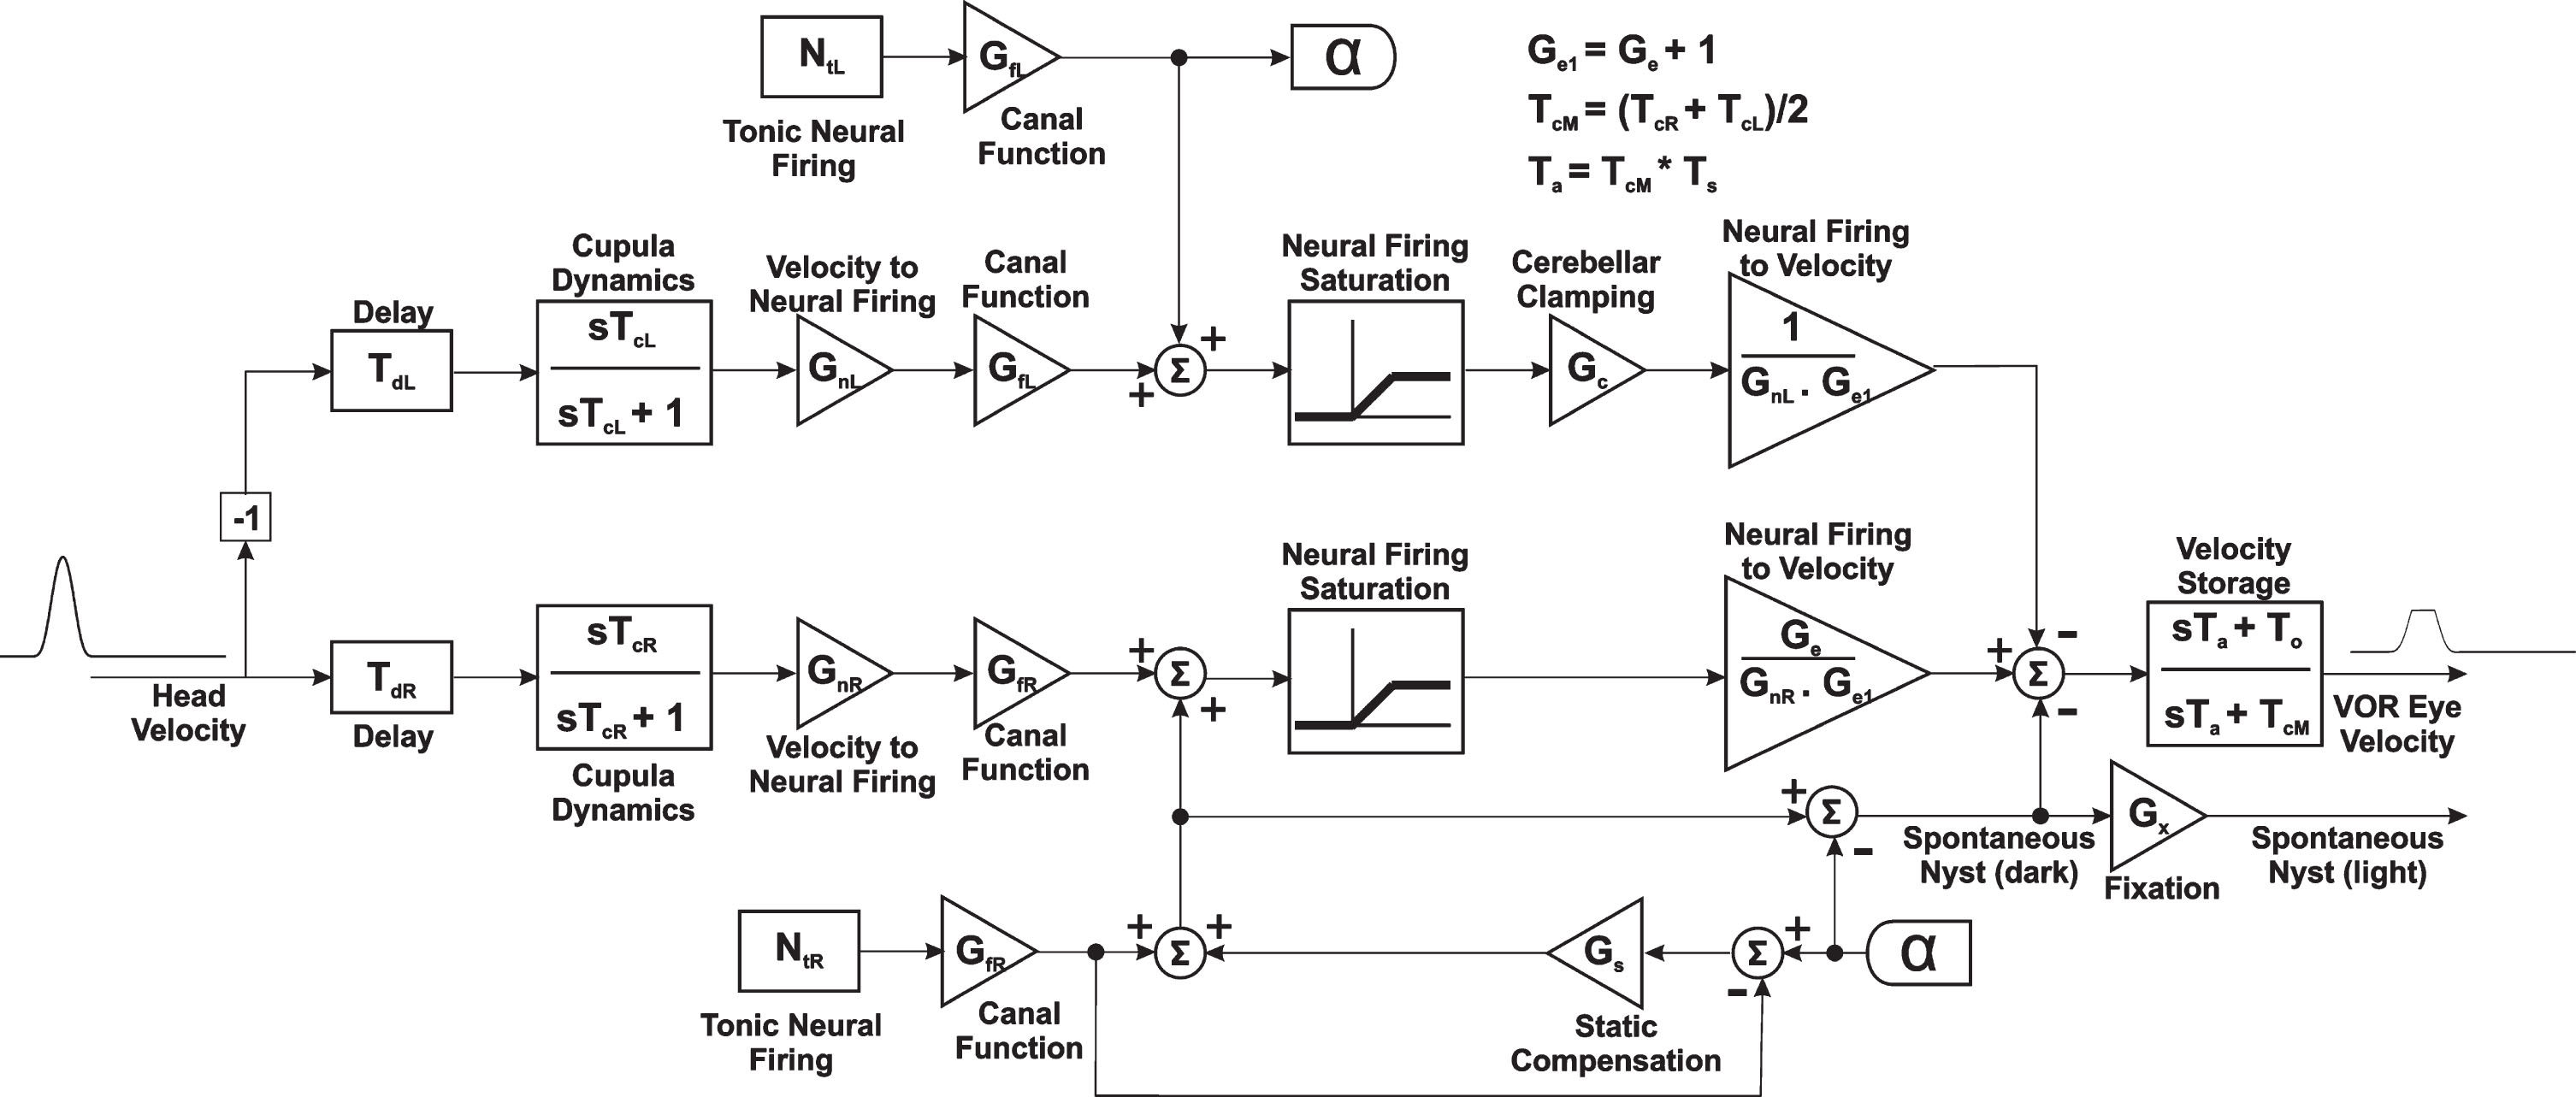
The model for the vestibular nuclei includes a nonlinear gain block that has a higher value for excitatory responses and a lower value for inhibitory responses. This is a variation of the Ewald’s second and third laws and has been discussed in detail in [7]. The sum of the gain for excitatory and inhibitory responses should be equal to 1 in order for the VOR gain to be of approximately 1 for normal subjects. The responses from right and left pathways are added before passing through the velocity storage mechanism (VSM), which is represented by another first order system [10]. The output of the VSM represents the VOR eye velocity.
2.3Lesion parameters
The lesion parameters allow simulation of various common abnormalities including unilateral and bilateral lesions. For asymmetric lesions, one can specify the level of static compensation, which determines the existence and level of spontaneous nystagmus. When there is spontaneous nystagmus, a gain block specifies the level of fixation suppression and the resulting spontaneous nystagmus level in the light. It is also possible to specify the level of cerebellar clamping for acute lesions but that parameter is not used in these simulations.
The function of each VOR pathway is represented by a simple gain block (Fig. 3). This representation assumes that any loss of function affects all head velocities/frequencies equally. It is possible to replace the gain block with a more complex representation that behaves differently for different velocities. Such a representation is more appropriate for simulating a broad range of vestibular tests including the caloric, rotation chair, and head impulse test. However, assuming a constant value for the function of VOR seems to be appropriate for head velocities that are in the range of HIT velocities (∼100–300 deg/sec for lateral canal impulses and ∼50–250 deg/sec for vertical canal impulses).
By assigning appropriate values to the various gain blocks, one can simulate different types of peripheral vestibular lesions. For example, GfR = 0.5, GfL = 1.0, and Gs = 1.0 will simulate a statically-compensated partial right-sided lesion (no spontaneous nystagmus). Or GfR = 0.0, GfL = 1.0, and Gs = 0.0 will simulate a complete right-sided lesion during the acute phase with no static compensation (spontaneous nystagmus is present).
2.4Saccade parameters
The saccade parameters allow one to simulate overt and covert saccades during the HIT. The focus of this paper is on the VOR gain. Under ideal conditions, catch-up saccades have no effect on the VOR gain. However, a brief description of these parameters is included here because validation of the model requires comparing its predictions with the actual clinical cases.
Two types of saccades are simulated in this model. The first type is the overt saccade that occurs after the head motion and is visible to the naked eye. To simulate overt saccades, the difference between the gaze and target position at the end of a head impulse is used to trigger the saccade. Once the amplitude of the saccade is determined, well-known properties of the saccades can be used to estimate the peak velocity and duration of the saccade [3]. This part of the simulation will generate long-latency saccades typically occurring more than ∼250 msec after the onset of the head movement.
The second type is the covert saccade that occurs during the head motion and can be detected only with instrumented HIT [28]. This type of saccade requires some level of prediction and must be based on learned behavior [18]. To simulate covert saccades, the difference between the head and eye velocities is used to trigger the saccade. Other triggering strategies such as the difference between the head and eye positions can be used but the velocity strategy seems more consistent with other oculomotor control mechanisms (e.g., the smooth pursuit system). The saccade amplitude at the end of the head movement is estimated from the velocity difference. The peak velocity and duration of the covert saccade is calculated as before from the estimated saccade amplitude. This part of the simulation will generate short-latency saccades typically occurring less than ∼200 msec after the onset of the head movement. Some of these saccades occur during the head movement as expected for covert saccades. However, even those that occur shortly after the head movement have to be generated by a different strategy than the strategy used for overt saccades. Therefore, it is best to refer to these saccades as short-latency saccades regardless of whether they are covert or overt.
The user can selectively activate either or both the position-based and velocity-based saccades. Other parameters of the saccades that can be customized include the latency, duration, and maximum velocity [27].
2.5Display parameters
The display parameters allow one to define how the results are presented including the color of tracings, the duration of observation, and whether or not the head and eye movements should be inverted. The user can also choose to display other information such as the head and eye positions or 3D displays of the results. To make the results comparable to the commercial devices, the user can apply a low-pass filter to the eye movements.
2.6Gain calculation options
One of the most relevant options for this study is to allow the user to choose the method for calculating the VOR gain. Three main methods are available:
• Instantaneous velocity gain
• Position gain (area under the velocity curves)
• Regression gain
In the instantaneous velocity method, the eye and head velocities are determined at a specific time after the onset of the head movement and their ratio is used to calculate the VOR gain. The most common time intervals include:
– At the peak head velocity
– At the peak head acceleration
– 60 msec after the onset of the head movement
– 80 msec after the onset of the head movement
– 100 msec after the onset of the head movement
Notice that time intervals listed for the latter three intervals differ by about 20 msec from those reported by some of the commercial vHIT devices. For example, the VOR gain reported at 60 msec for those devices corresponds to the VOR gain at 80 msec here. The reason is that in commercial devices, the head velocity must exceed a threshold before the onset of the impulse is determined [15]. In the simulations here, the onset of the head impulse is known precisely.
The advantage of using the instantaneous velocity method is that the eye velocities are usually not contaminated by the potential covert saccades. However, there are two disadvantages for this method. First, there is an assumption of linearity for the VOR pathways. This assumption is clearly not valid. Also, the instantaneous velocity gain is more susceptible to certain artifacts such as slippage of the goggles.
For the position gain, the areas under the eye and head velocity curves are calculated after removing the saccades that may occur during the head movement. This process converts the velocity to position. The ratio of eye to head position is then used to define the VOR gain.
The advantage of the position gain is that it is directly related to what causes the catch-up saccades in vHIT, that is, the position difference between the eye and head movements. Another advantage of the position gain is that it is not affected as severely by the goggle slippage. The main disadvantage of using the position gain is that one has to first remove the covert saccades. It is well-known from analyzing other types of nystagmus that the desaccading process is not always perfect. Other artifacts such as bumping the goggles or pupil detection errors that occur during the impulse may also affect the accuracy of the position gain [19].
In the regression method, the first 100 msecs of eye versus head velocities are tabulated and the slope of the best-fitting line is used to calculate the VOR gain. The advantages and disadvantages of this method are similar to the instantaneous velocity method with the added benefit that the regression gain is more robust and less sensitive to the non-linearity of the VOR pathways.
3Results
3.1Validation of the model
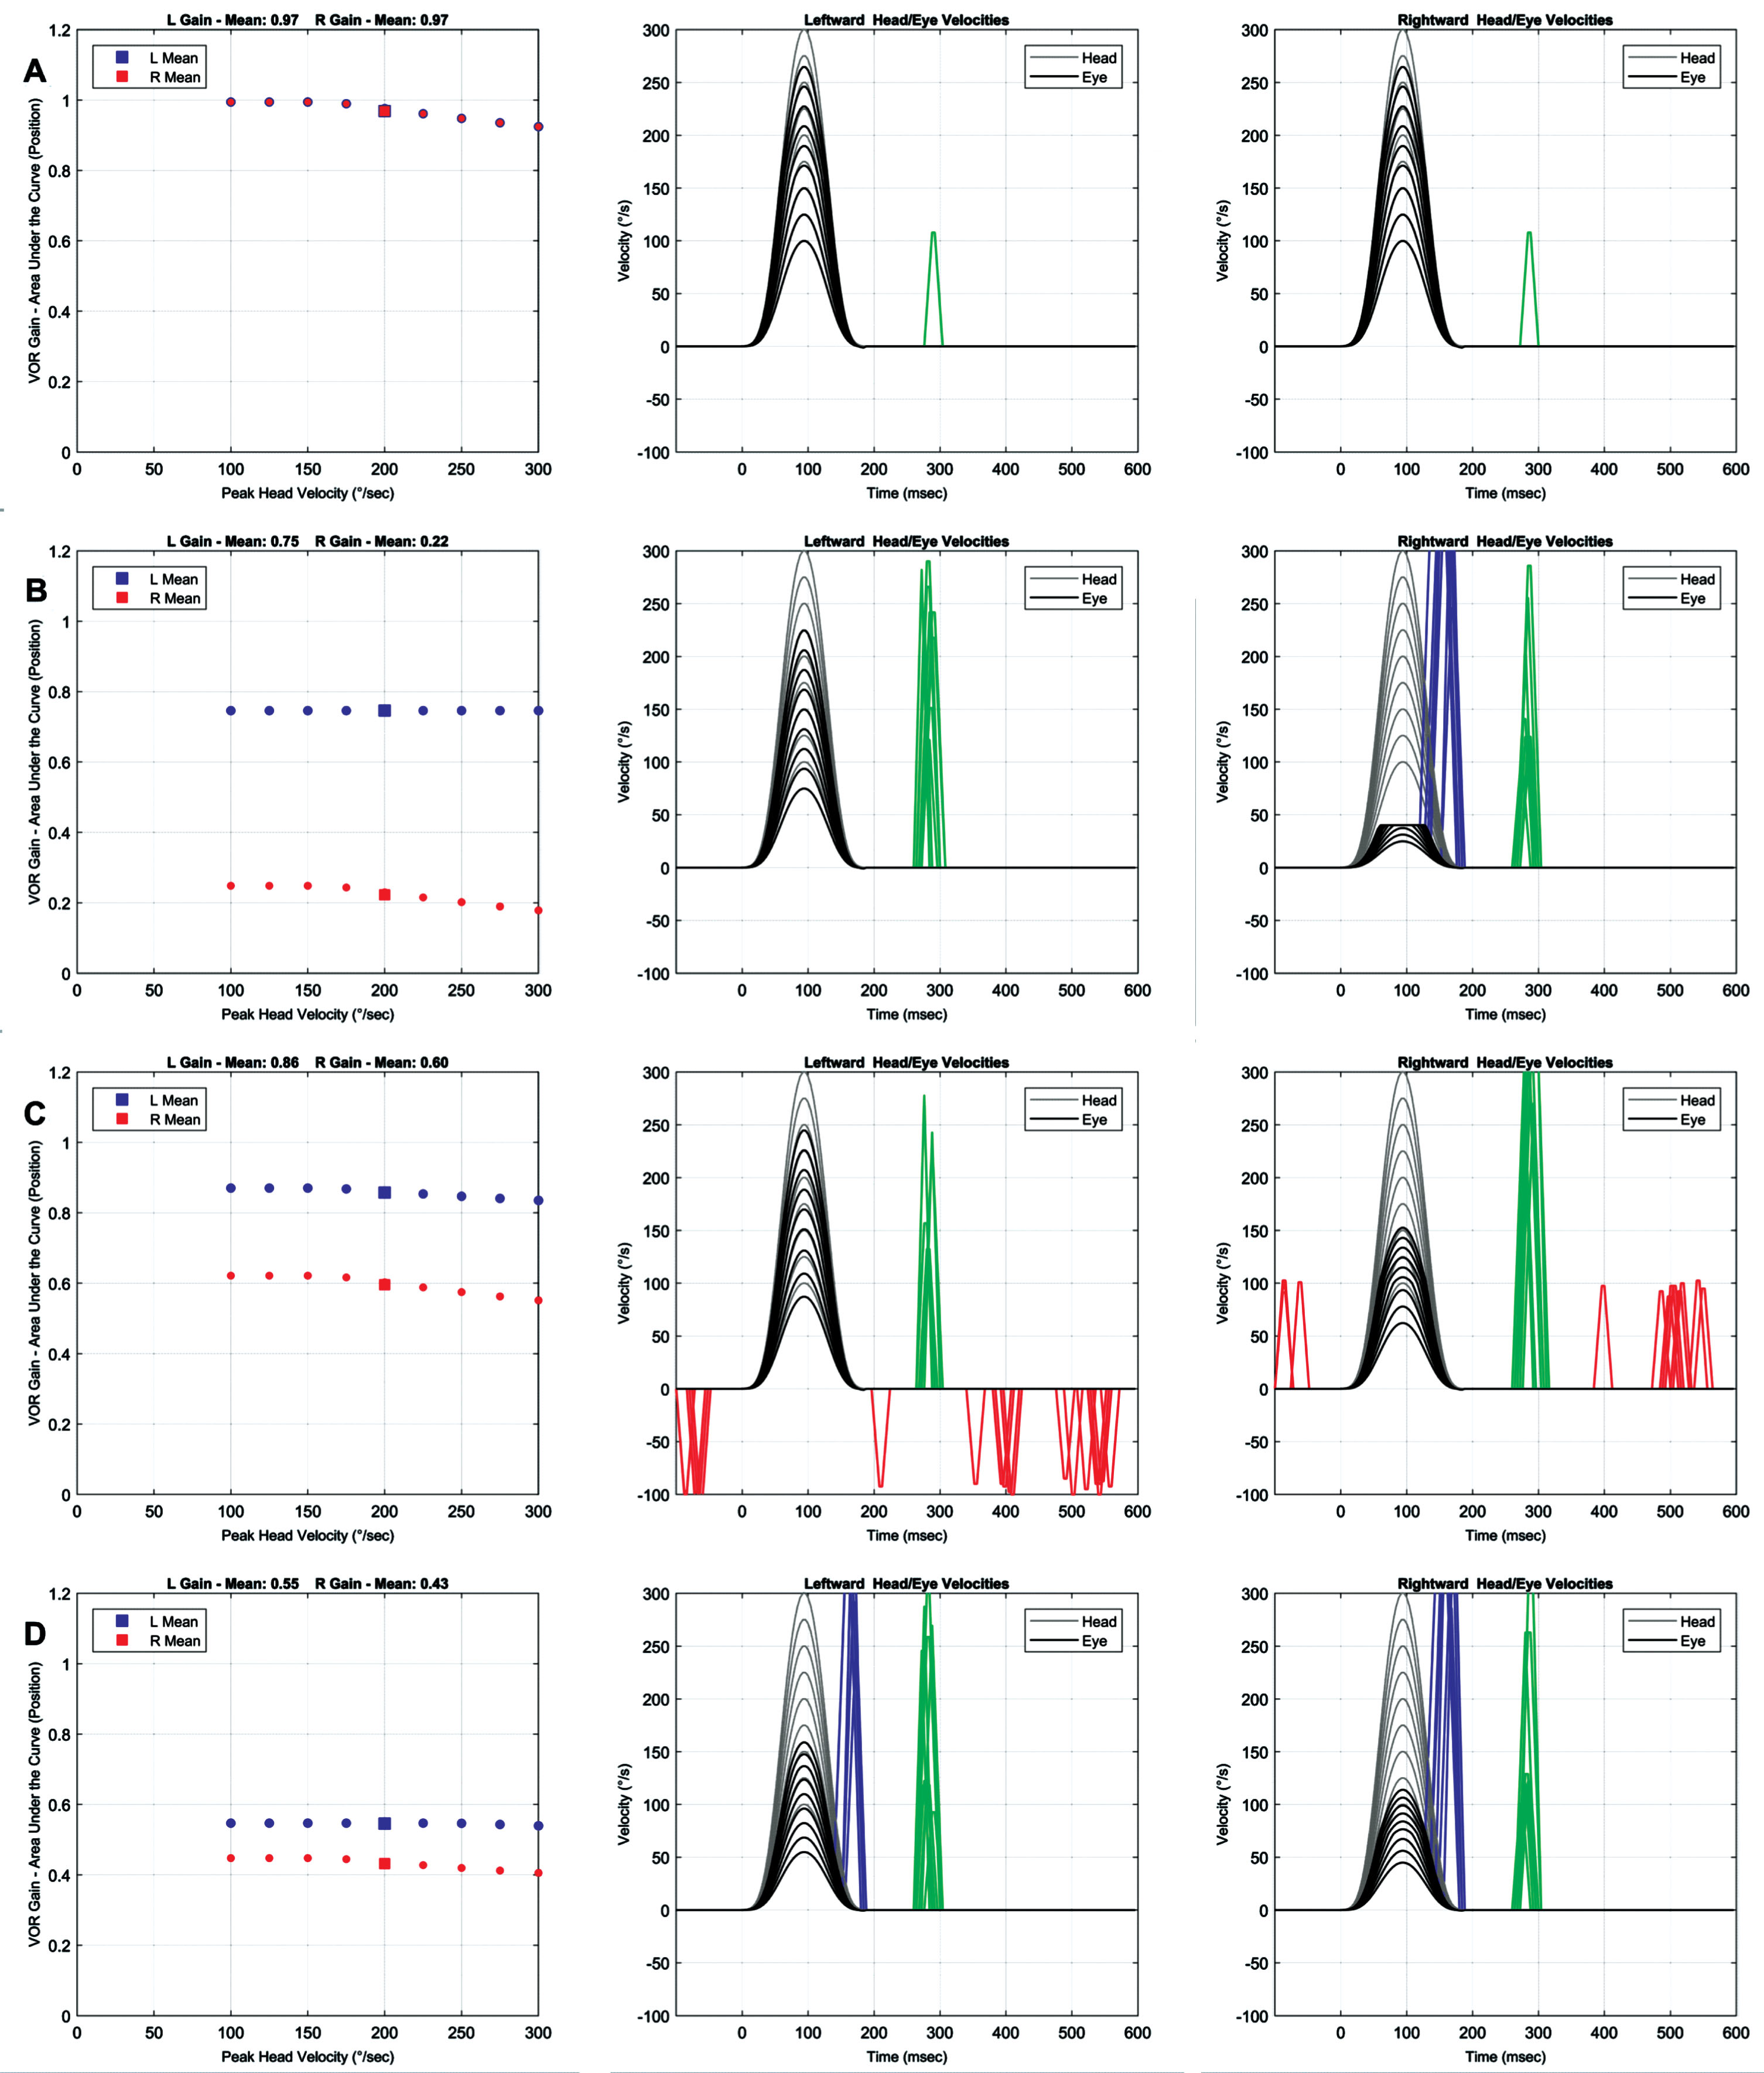
A number of common clinical conditions were simulated to validate the model. Figure 4A shows the simulation results for when the right and left VOR pathways are operating normally. The gain is approximately equal to 1 for low impulse velocities and begins to decline slightly for higher impulse velocities. The gain decline at higher head velocities is related to the saturation of the inhibitory response that occurs even in normal individuals. As a result, catch-up saccades can be seen in normal individuals if the head velocity is high enough.
Fig. 4
Simulation results for different clinical scenarios. Right and left VOR gains are shown in red and blue, respectively. Head and eye velocities are shown in gray and black, respectively. Position-based saccades, velocity-based saccades, and fast phase of spontaneous nystagmus are shown in green, blue, and red, respectively. The default model parameters in Table 1 are used unless noted below. A Right and left functions = 100%, position and velocity-based saccades = on. B Right function = 0%, left function = 100%, static compensation = 100%, position and velocity-based saccades = on. C Right function = 50%, left function = 100%, static compensation = 50%, position-based saccades = on, velocity- based saccades = off. D Right function = 40%, left function = 60%, static compensation = 100%, position and velocity-based saccades = on.
The minimum head velocity beyond which the VOR responses become nonlinear is directly related to the level of tonic neural activity and the conversion rate of the vestibular nerve. For the default parameters in this simulation, this head velocity (Vlinear) is:
(1)
The VOR gain begins to decline beyond this point and its slope is inversely related to the ratio of excitatory versus inhibitory responses within the vestibular nuclei.
Figure 4B shows the simulation results for complete loss of right canal function with full static compensation (no spontaneous nystagmus). The results are similar to clinical findings in chronic lesions showing both covert and overt catch-up saccades for head impulses toward the side of lesion and smaller overt saccades for head impulses toward the intact side. Accordingly, the VOR gain is reduced for both sides but more significantly for the impulses toward the side of lesion.
Figure 4C shows the simulation results for partial loss of right canal function with no static compensation (spontaneous nystagmus is present). Velocity-triggered saccades are deactivated. The results are similar to clinical findings in acute lesions showing fast phases of spontaneous nystagmus intermixed with overt catch-up saccades for head impulses toward the side of lesion. The fast phases of spontaneous nystagmus are in the opposite direction of the expected catch-up saccades for head impulses away from the side of lesion. Again, the VOR gain is reduced for both sides but more significantly for the impulses toward the side of lesion.
Figure 4D shows the simulation results for partial bilateral loss with the right canal pathways exhibiting a larger loss compared to the left canal pathways. Full static compensation is assumed. Both overt and covert saccades are present for both rightward and leftward head impulses. The VOR gain is reduced bilaterally but more so for the rightward impulse. This type of scenario is difficult to identify in traditional vestibular tests such as the caloric test. However, as will be shown later, vHIT can provide a method for distinguishing some types of bilateral lesions from purely unilateral lesions.
3.2Comparing different methods for calculating the VOR gain
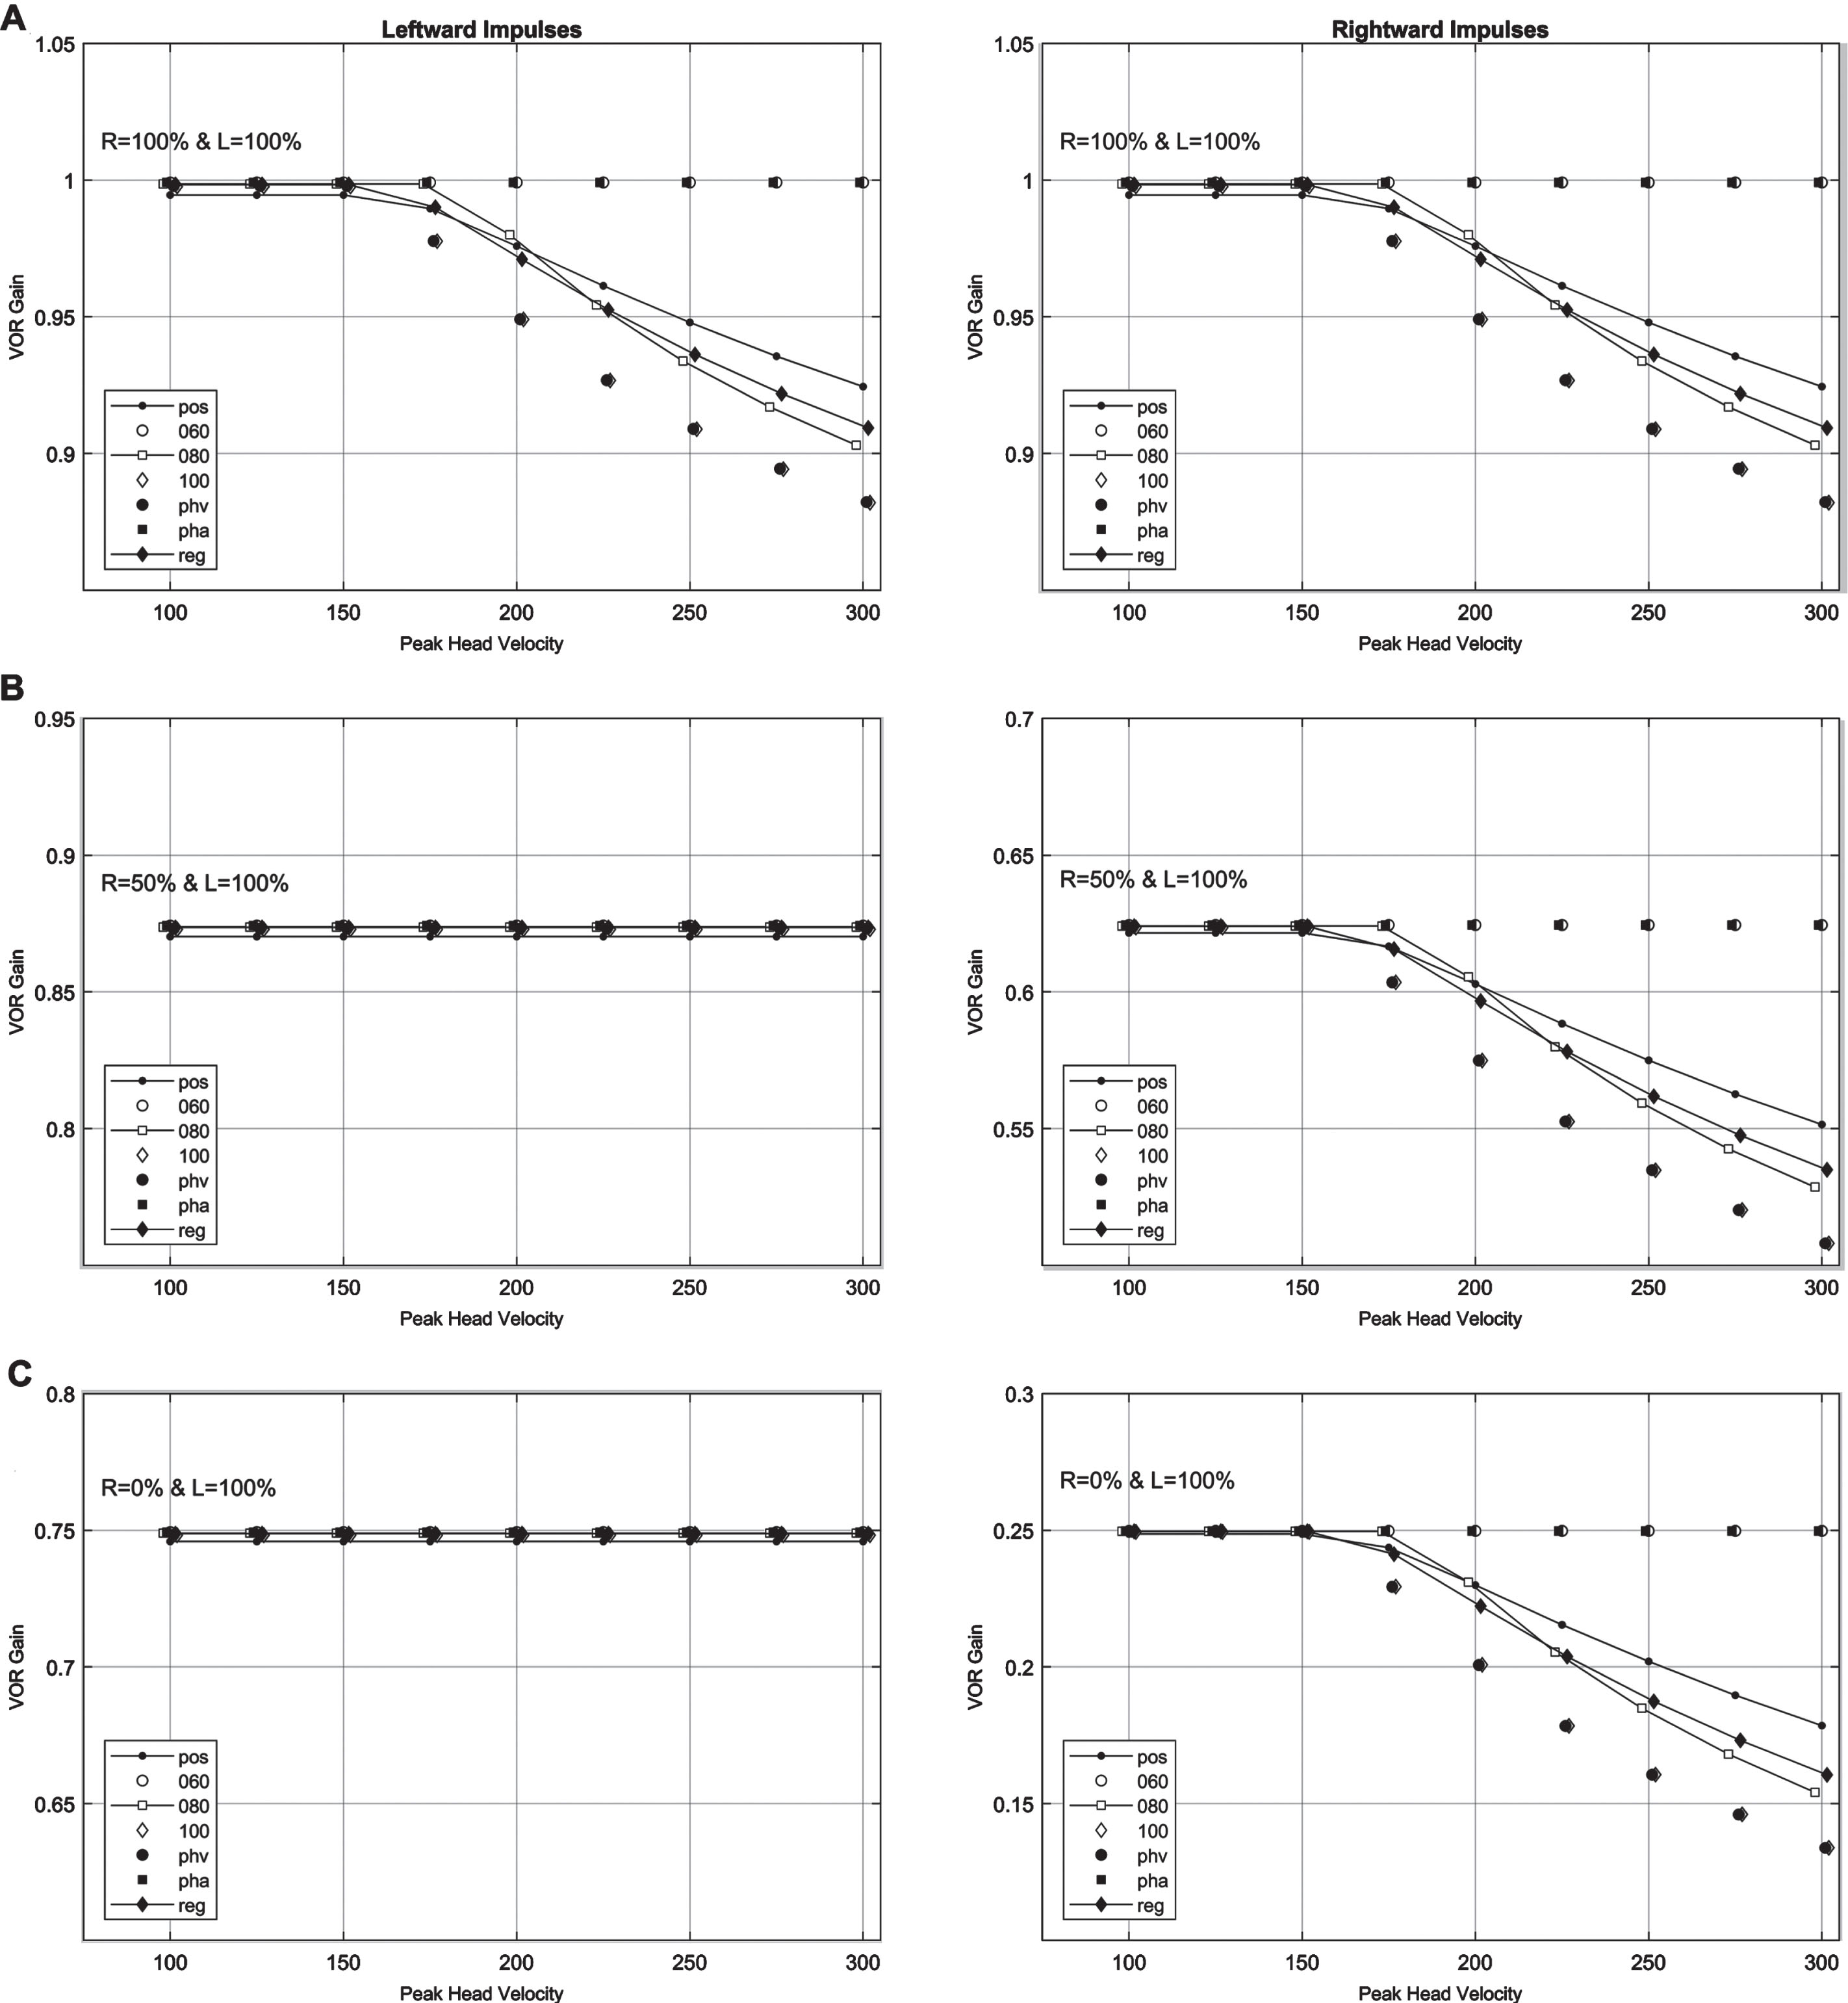
The simulation results establish the validity of the model for common clinical scenarios and allow one to pursue the main objective of this paper that is estimating the loss of canal function from the VOR gains. But first one needs to determine which method or methods of calculating the VOR gain are more appropriate. Figure 5 shows the VOR gains calculated using all of the different methods listed in the Methods section. Three different clinical scenarios were considered: both canal pathways functioning (Fig. 5A), right canal pathways functioning at 50% (Fig. 5B), and right canal pathways functioning at 0% (Fig. 5C). The results demonstrate that for head velocities below the saturation level of vestibular nerve (160 deg/sec for the default parameters), all of the methods for gain calculation yield approximately the same values. For head velocities beyond the saturation level, the discrepancies among different methods begin to emerge. The differences increase with increasing head velocities but even at the highest head velocity, the difference between any two calculation methods remains relatively low (<0.12). More importantly, three most common methods of gain calculation, position, instantaneous velocity at 80 msec, and regression (identified by line plots in Fig. 5), all yield similar results (maximum difference <0.025).
Fig. 5
Differences in the calculation methods for the VOR gains for different clinical scenarios. Abbreviations are as follows: pos - position gain (area under the velocity curves), 060, 080, 100, phv, pha - instantaneous velocity gain at 60 msec, 80 msec, 100 msec, peak head velocity, and peak head acceleration, respectively, reg –regression gain. A Right and left functions = 100%. B Right function = 50%, left function = 100%. C Right function = 0%, left function = 100%.
3.3Estimating the loss of canal function from the VOR gains
The next objective is to determine if one can estimate the loss of canal function from the VOR gains. An inspection of the right-left VOR gain profiles in Fig. 4 suggests that independent assessment of the gain for head impulses toward or away from the side of lesion does not provide direct measure of the canal function. An alternative approach is to find a measure that combines the VOR gains for rightward and leftward impulses because both labyrinths contribute to both. One such measure is the mean of right and left VOR gains. This measure has been used in other studies for comparing the caloric and vHIT results [26] and for quantifying vHIT in bilateral vestibular loss patients [14]. In this study, the mean VOR gain (GVORM) was obtained from:
(2)
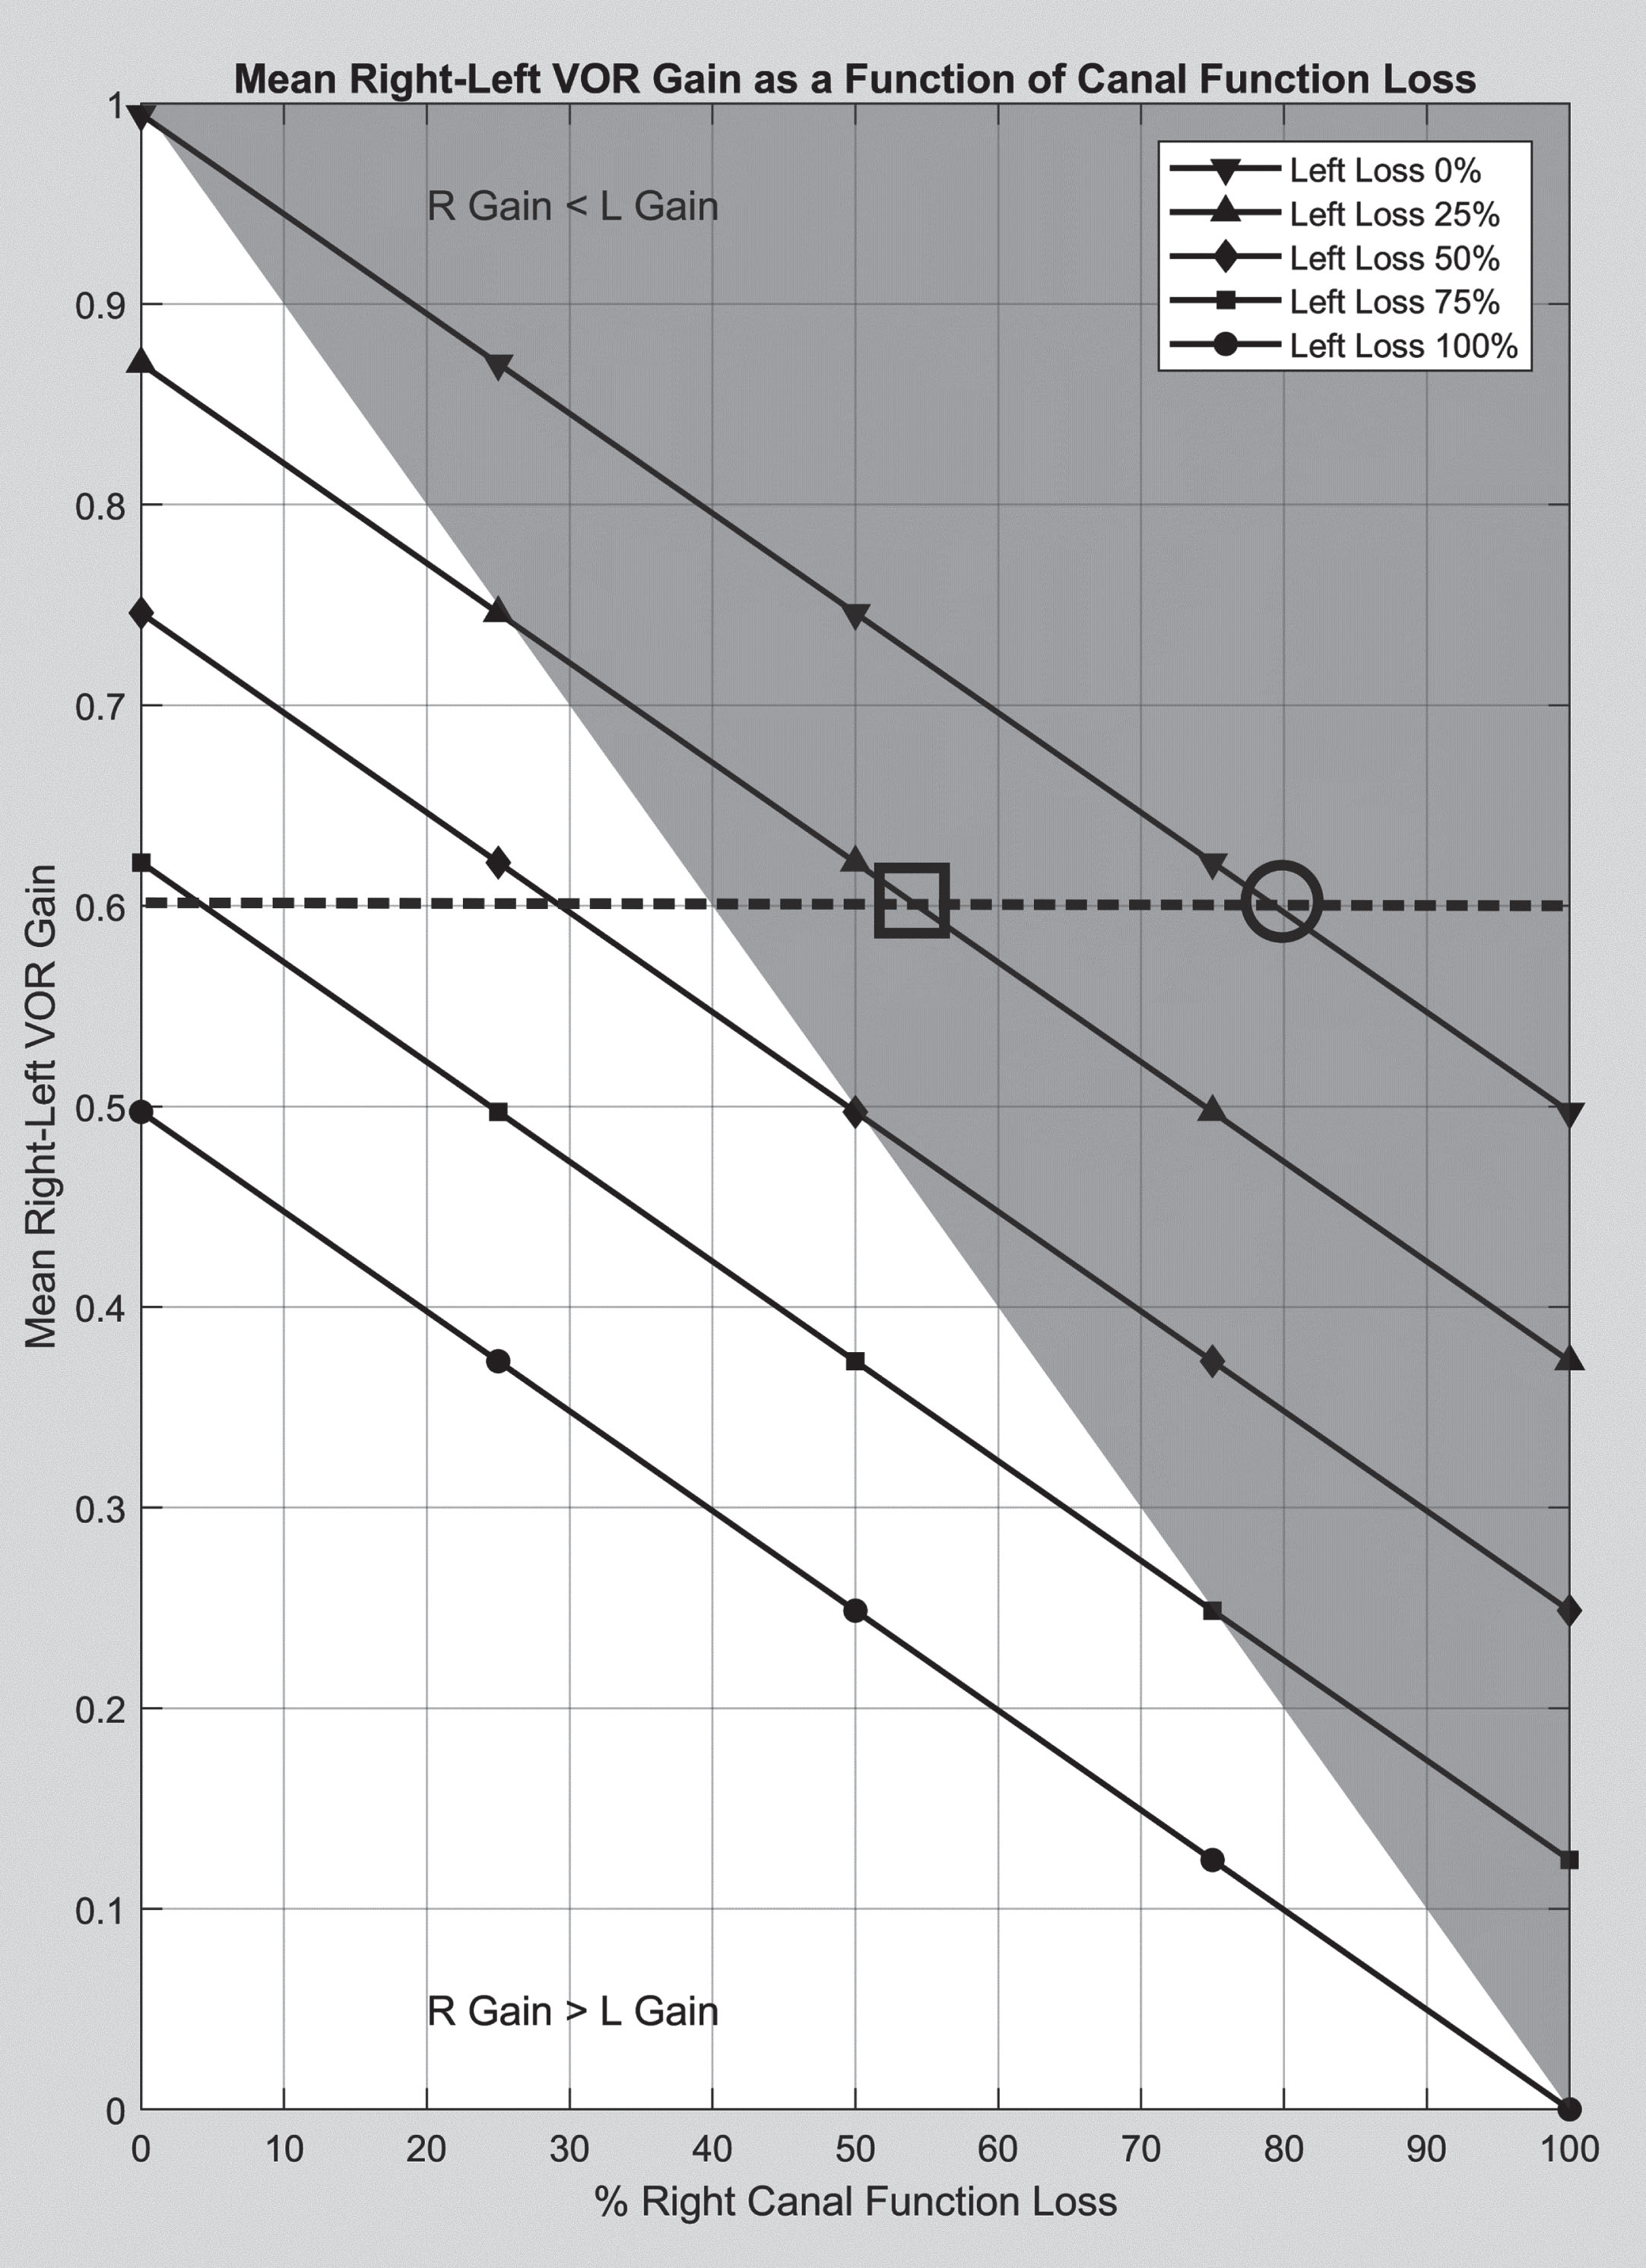
Figure 6 shows the mean right-left VOR gain (GVORM) as the functions of right and left canal pathways are changed systematically across their entire range. For this figure, the position gains at 150 deg/sec are displayed to avoid the non-linearity of the pathways for higher head velocities. The results suggest a linear relationship between the total right-left canal function and the GVORM. The intersections of a horizontal line from the GVORM with the gain line graphs provide all of the possible right-left canal function patterns. An example for the GVORM = 0.6 is shown in Fig. 6. If one could assume a purely unilateral loss, the loss of function on the side of lesion can be estimated as 80%. For bilateral losses, the total function can be estimated but additional information is required to determine the function of each side.
Fig. 6
Mean right-left VOR gain (GVORM) as a function of canal loss. The gray shaded area is for when the right VOR gain is less than the left VOR gain. The dashed line represents an example of how the graph can be used to estimate the loss of canal function. For GVORM = 0.6 and assuming a purely unilateral loss, the loss of canal function can be estimated as 80% (hollow circle). For bilateral losses, the cross section of the dotted line with line graphs can provide loss of function on each side (for example, hollow square shows right and left loss of function at 55% and 25% respectively).
The linear relation depicted in Fig. 6 should not come as surprise. For the frequency content of head impulses, the cupula and velocity storage mechanism blocks in Fig. 1 operate as pass-through elements with minimal modification of the input stimulus. The eye velocities for head impulses that are below the saturation level of the canal pathways can be derived from:
(3)
(4)
(5)
(6)
Equations 5 and 6 demonstrate that the right and left VOR gains depend on both canal function levels and only on the ratio of excitatory versus inhibitory responses as long as the head velocities are below the non-linearity limit. Surprisingly, the effect of other parameters is minimal.
(7)
(8)
Equations 7 and 8 suggest that the sum of VOR gains (or 2 times the mean of VOR gains) represents total function of the right and left canals. For purely unilateral losses (GfR or GfL = 1),
(9)
If one is interested in the loss of canal function, the equations can be rewritten considering that:
(10)
As a result, for bilateral lesions:
(11)
And for unilateral loss:
(12)
As the mean of VOR gains provides an insight about the loss of canal function, one may hypothesize that the difference between right-left VOR gains can provide information about the extent of canal function asymmetry. To investigate that hypothesis, one can calculate the difference between the VOR gains:
(13)
Equation 13 shows that the difference between the right-left VOR gains not only depends on the difference between the right-left canal functions, it also depends on the ratio of excitatory and inhibitory responses. In fact, when the gains for excitatory and inhibitory responses are equal (Ge = 1), the right-left VOR gains will not exhibit any asymmetry. It is also clear that for the same level of canal function asymmetry, the VOR gains can show different levels of asymmetry depending on the gains for excitatory and inhibitory responses. Furthermore, because the asymmetry of gains for excitatory and inhibitory responses is not known, the difference between right-left VOR gains does not provide definitive information about the canal function asymmetry.
4Discussion
Some investigators have suggested that vHIT cannot determine the total vestibular output [8]. This study shows that one can estimate the remaining function or total loss of function using the mean right-left VOR gains. Furthermore, if a purely unilateral lesion is assumed, one can estimate the loss or remaining function of the damaged side.
4.1Comparing the caloric test parameters with the VOR gains
It is true that the estimates of the canal function are specific to the frequencies of the head impulse test and should not be compared with caloric or rotation chair findings that examine other frequency ranges of the vestibular system. Nonetheless, several studies have attempted to compare the caloric and vHIT findings in different patient groups [5, 17, 20, 22, 24–26, 31]. The motivation for such a comparison is understandable but the differences in the frequency ranges of the two tests pose a practical limitation in reaching meaningful conclusions. The solution is to treat these tests as if they were audiogram frequencies in the hearing test where collectively, they represent the dynamic response of the canals and their pathways. Given such a limitation, it is not advisable to compare the VOR gain and the unilateral weakness (UW) in the caloric test. However, since such a comparison is made routinely in the literature, it is worthwhile to establish the mathematical relationship between these parameters. Substituting for the caloric responses in the Jongkee’s formula:
(14)
(15)
Note that for simplicity, the absolute value of UW% is represented in the above equation. Also, the equation is valid only for GVORM > 0.5 because it is not possible to have a purely unilateral loss for GVORM < 0.5. For UW = 25%, which is usually used as the normative limit for the caloric asymmetry, GvorM = 0.8. This value is also close to the normative limits used for the VOR gain in vHIT. Interestingly, van Esch et al (2016) used the value of 0.8 as a cut-off for the mean VOR gain. They concluded that when the mean VOR gain was below 0.8, UW% in the caloric test was usually above the cut-off value of 22% [26]. McCaslin et al (2014) used a cut-off value of 0.7 for the vHIT VOR gain on the side of lesion and determined that UW% > 39.5 produced the best correspondence between the two tests [20]. Although they did not use the mean VOR gain, the values seem to support the relationship stated in Equation 15. It should be emphasized again that this type of comparison assumes the same level of functional loss in both caloric frequencies and vHIT frequencies. Several studies suggest that this assumption is usually not true and limited to rare clinical scenarios such as those with vestibular nerve sections.
4.2Effect of different gain calculation methods on vHIT results
Figure 5 suggests that any of the common methods for gain calculation can yield a reasonable estimate for the VOR gain under ideal conditions. However, differences in gain algorithms have been noted in clinical settings [13]. That means each method may be more sensitive to different types of artifact and may perform better under certain conditions [4]. For example, it is expected that slippage of the goggles will result in inaccuracies of the instantaneous velocity and regression gains. The position gain will not be affected as severely because the effect of such artifacts in the eye velocity are symmetrical [11]. Those effects are expected to be canceled when taking the area under the eye velocity curve. On the other hand, the position gain is more susceptible to incomplete removal of covert saccades and pupil detection artifacts during head impulses. The prudent approach is to calculate all three gains. When all three methods yield similar gain values, the user can be confident that the effect of artifacts is minimal. Alternatively, significant discrepancies can alert the user to the potential contamination of the results by artifacts.
This study shows that the VOR gains in the head impulse test can provide more accurate estimates of loss of canal function in vHIT as long as the head velocities are below the saturation level of the inhibitory responses. The higher impulse velocities will slightly overestimate the extent of the loss but the effect is small and one could apply a corrective factor. Moreover, that does not mean that higher velocity impulses are not as useful because catch-up saccades are more prevalent in higher head velocities. For mild lesions, the VOR gains may not be significantly different from the normative values. In such cases, the presence and characteristics of catch-up saccades may provide a method to differentiate abnormal responses. The current model can be used to determine the characteristics of abnormal saccades. However, that is beyond the scope of this paper and will be discussed in future publications.
Some researchers and commercial devices often provide other variations to the standard VOR gains for interpretation purposes. The mean and standard deviation of VOR gains for all impulses on each side are examples of such measures. The mean value often includes head velocities both below and above the vestibular nerve saturation levels. The usefulness of the mean values depends on the distribution of the impulse velocities. If there is a significant difference between the right-left head velocity distributions, the mean values may provide misleading information. Instead, it may be better if these values are presented for smaller ranges of head velocities (e.g., head velocities in the range of 100–150, 150–200 deg/sec, etc.). That way, one could use Equation 11 to plot the loss of canal function for each of these velocity ranges. The standard deviations indicate the variability of VOR gains and high variability usually indicates presence of artifacts. Clinicians can use the standard deviation to determine the robustness of their test results.
Another parameter provided by some commercial devices and used in some studies is the relative asymmetry. Relative asymmetry is calculated as the difference between the right-left VOR gains divided by the higher of the two values [23]. This type of measuring relative asymmetry is common in the caloric and VEMP tests because of the high variability of individual responses. However, applying the same method to VOR gains that are ratios themselves and not as variable as caloric or VEMP responses is questionable. More importantly, as Equation 13 shows, the difference between the right and left VOR gains does not entirely reflect the asymmetry of the right-left canal pathways and it is heavily influenced by the ratio of excitatory to inhibitory responses. In other words, for the same level of asymmetry in the canal pathways, the asymmetry of VOR gains can vary significantly depending on the ratio of excitatory to inhibitory responses. It is unclear at this time if and how this ratio changes over time and if it reflects any clinical phenomenon such as compensation. Therefore, the relative asymmetry should either not be used or it should be interpreted cautiously.
It has been shown that there is an asymmetry between the adduction and abduction of VOR eye movements in the head impulse testing [13]. This finding is not limited to vHIT and has been demonstrated in eye movement measurements with the scleral search coil [29]. This difference has a systematic effect on the right-left VOR gains and may affect the mean VOR gain when recordings are made from one eye only. The difference is usually small (∼0.07) and should not significantly affect the estimate of canal function.
Finally, this study suggests that establishing normative values for different direction of head impulses and comparing individual VOR gains with those values may not be the best approach. Instead, normative values and gain comparisons will be more meaningful for the mean or the sum of right-left VOR gains.
5Conclusions
It has been shown that the mean of right and left VOR gains can estimate the loss of canal function in purely unilateral lesions (Equation 12). For bilateral lesions, the same parameter can estimate the total loss of bilateral function but contributions from different canals cannot be determined without additional information.
Disclosure
Kamran Barin is currently a consultant to Interacoustics, Denmark and Bertec Corp., Ohio. He was a consultant to Otometrics, Denmark until July 2017. This manuscript was prepared independently with no input from the above entities.
References
[1] | Aw S.T. , Halmagyi G.M. , Haslwanter T. , Curthoys I.S. , Yavor R.A. , Todd M.J. , Three-dimensional vector analysis of the human vestibuloocular reflex in response to high-acceleration head rotations. II. responses in subjects with unilateral vestibular loss and selective semicircular canal occlusion, J Neurophysiol 76: ((1996) ), 4021–4030. |
[2] | Aw S.T. , Haslwanter T. , Halmagyi G.M. , Curthoys I.S. , Yavor R.A. , Todd M.J. , Three-dimensional vector analysis of the human vestibuloocular reflex in response to high-acceleration head rotations. I. Responses in normal subjects, J Neurophysiol 76: ((1996) ), 4009–4020. |
[3] | Bahill A.T. , Stark L. , The trajectories of saccadic eye movements, Sci Am 240: ((1979) ), 108–117. |
[4] | Cleworth T.W. , Carpenter M.G. , Honegger F. , Allum J.H.J. , Differences in head impulse test results due to analysis techniques, J Vestib Res 27: ((2017) ), 163–172. |
[5] | Cordero-Yanza J.A. , Arrieta Vazquez E.V. , Hernaiz Leonardo J.C. , Mancera Sanchez J. , Hernandez Palestina M.S. , Perez-Fernandez N. , Comparative study between the caloric vestibular and the video-head impulse tests in unilateral Meniere’s disease, Acta Otolaryngol 137: ((2017) ), 1178–1182. |
[6] | Galiana H.L. , Outerbridge J.S. , A bilateral model for central neural pathways in vestibuloocular reflex, J Neurophysiol 51: ((1984) ), 210–241. |
[7] | Galiana H.L. , Smith H.L. , Katsarkas A. , Modelling non-linearities in the vestibulo-ocular reflex (VOR) after unilateral or bilateral loss of peripheral vestibular function, Exp Brain Res 137: ((2001) ), 369–386. |
[8] | Hain T.C. , Cherchi M. , Perez-Fernandez N. , The Gain-Time Constant Product Quantifies Total Vestibular Output in Bilateral Vestibular Loss, Front Neurol 9: ((2018) ), 396. |
[9] | Hain T.C. , Fetter M. , Zee D.S. , Head-shaking nystagmus in patients with unilateral peripheral vestibular lesions, Am J Otolaryngol 8: ((1987) ), 36–47. |
[10] | Hain T.C. , Zee D.S. , Velocity storage in labyrinthine disorders, Ann N Y Acad Sci 656: ((1992) ), 297–304. |
[11] | Halmagyi G.M. , Chen L. , MacDougall H.G. , Weber K.P. , McGarvie L.A. , Curthoys I.S. , The Video Head Impulse Test, Front Neurol 8: ((2017) ), 258. |
[12] | Halmagyi G.M. , Curthoys I.S. , A clinical sign of canal paresis, Arch Neurol 45: ((1988) ), 737–739. |
[13] | Janky K.L. , Patterson J.N. , Shepard N.T. , Thomas M.L.A. , Honaker J.A. , Effects of Device on Video Head Impulse Test (vHIT) Gain, J Am Acad Audiol 28: ((2017) ), 778–785. |
[14] | Judge P.D. , Janky K.L. , Barin K. , Can the Video Head Impulse Test Define Severity of Bilateral Vestibular Hypofunction?, Otol Neurotol 38: ((2017) ), 730–736. |
[15] | Luis L. , Costa J. , Munoz E. , de Carvalho M. , Carmona S. , Schneider E. , Gordon C.R. , Valls-Sole J. , Vestibulo-ocular reflex dynamics with head-impulses discriminates spinocerebellar ataxias types 1, 2 and 3 and Friedreich ataxia, J Vestib Res 26: ((2016) ), 327–334. |
[16] | MacDougall H.G. , Weber K.P. , McGarvie L.A. , Halmagyi G.M. , Curthoys I.S. , The video head impulse test: diagnostic accuracy in peripheral vestibulopathy, Neurology 73: ((2009) ), 1134–1141. |
[17] | Mahringer A. , Rambold H.A. , Caloric test and video-head-impulse: A study of vertigo/dizziness patients in a community hospital, Eur Arch Otorhinolaryngol 271: ((2014) ), 463–472. |
[18] | Mantokoudis G. , Agrawal Y. , Newman-Toker D.E. , Xie L. , Saber Tehrani A.S. , Wong A. , Schubert M.C. , Compensatory saccades benefit from prediction during head impulse testing in early recovery from vestibular deafferentation, Eur Arch Otorhinolaryngol 273: ((2016) ), 1379–1385. |
[19] | Mantokoudis G. , Saber Tehrani A.S. , Kattah J.C. , Eibenberger K. , Guede C.I. , Zee D.S. , Newman-Toker D.E. , Quantifying the vestibulo-ocular reflex with video-oculography: Nature and frequency of artifacts, Audiol Neurootol 20: ((2015) ), 39–50. |
[20] | McCaslin D.L. , Jacobson G.P. , Bennett M.L. , Gruenwald J.M. , Green A.P. , Predictive properties of the video head impulse test: Measures of caloric symmetry and self-report dizziness handicap, Ear Hear 35: ((2014) ), e185–191. |
[21] | McGarvie L.A. , MacDougall H.G. , Halmagyi G.M. , Burgess A.M. , Weber K.P. , Curthoys I.S. , The Video Head Impulse Test (vHIT) of Semicircular Canal Function - Age-Dependent Normative Values of VOR Gain in Healthy Subjects, Front Neurol 6: ((2015) ), 154. |
[22] | Mezzalira R. , Bittar R.S.M. , do Carmo Bilecki-Stipsky M.M. , Brugnera C. , Grasel S.S. , Sensitivity of caloric test and video head impulse as screening test for chronic vestibular complaints, Clinics (Sao Paulo) 72: ((2017) ), 469–473. |
[23] | Newman-Toker D.E. , Saber Tehrani A.S. , Mantokoudis G. , Pula J.H. , Guede C.I. , Kerber K.A. , Blitz A. , Ying S.H. , Hsieh Y.H. , Rothman R.E. , Hanley D.F. , Zee D.S. , Kattah J.C. , Quantitative video-oculography to help diagnose stroke in acute vertigo and dizziness: Toward an ECG for the eyes, Stroke 44: ((2013) ), 1158–1161. |
[24] | Redondo-Martinez J. , Becares-Martinez C. , Orts-Alborch M. , Garcia-Callejo F.J. , Perez-Carbonell T. , Marco-Algarra J. , Relationship between video head impulse test (vHIT) and caloric test in patients with vestibular neuritis, Acta Otorrinolaringol Esp 67: ((2016) ), 156–161. |
[25] | Tranter-Entwistle I. , Dawes P. , Darlington C.L. , Smith P.F. , Cutfield N. , Video head impulse in comparison to caloric testing in unilateral vestibular schwannoma, Acta Otolaryngol 136: ((2016) ), 1110–1114. |
[26] | van Esch B.F. , Nobel-Hoff G.E. , van Benthem P.P. , van der Zaag-Loonen H.J. , Bruintjes T.D. , Determining vestibular hypofunction: Start with the video-head impulse test, Eur Arch Otorhinolaryngol 273: ((2016) ), 3733–3739. |
[27] | Versino M. , Castelnovo G. , Bergamaschi R. , Romani A. , Beltrami G. , Zambarbieri D. , Cosi V. , Quantitative evaluation of saccadic and smooth pursuit eye movements. Is it reliable?, Invest Ophthalmol Vis Sci 34: ((1993) ), 1702–1709. |
[28] | Weber K.P. , Aw S.T. , Todd M.J. , McGarvie L.A. , Curthoys I.S. , Halmagyi G.M. , Head impulse test in unilateral vestibular loss: Vestibulo-ocular reflex and catch-up saccades, Neurology 70: ((2008) ), 454–463. |
[29] | Weber K.P. , Aw S.T. , Todd M.J. , McGarvie L.A. , Pratap S. , Curthoys I.S. , Halmagyi G.M. , Inter-ocular differences of the horizontal vestibulo-ocular reflex during impulsive testing, Prog Brain Res 171: ((2008) ), 195–198. |
[30] | Yang C.J. , Cha E.H. , Park J.W. , Kang B.C. , Yoo M.H. , Kang W.S. , Ahn J.H. , Chung J.W. , Park H.J. , Diagnostic Value of Gains and Corrective Saccades in Video Head Impulse Test in Vestibular Neuritis, Otolaryngol Head Neck Surg 159: ((2018) ), 347–353. |
[31] | Zellhuber S. , Mahringer A. , Rambold H.A. , Relation of video-head-impulse test and caloric irrigation: A study on the recovery in unilateral vestibular neuritis, Eur Arch Otorhinolaryngol 271: ((2014) ), 2375–2383. |


