
Video-head impulse test results in patients with Menière’s disease related to duration and stage of disease
Abstract
BACKGROUND:
The video-head impulse test employs the vestibulo-ocular reflex (VOR) to assess vestibular function. To this day, no consensus has been reached among scientists in terms of whether or not vHIT results change in MD patients as the disease progresses.
OBJECTIVE:
To assess whether the vHIT is more often abnormal in later stages of MD compared to earlier stages.
METHODS:
We retrospectively analyzed patients with ‘definite’ MD who had undergone a vHIT and caloric test between 2012 and 2015. Patients were evaluated based on duration of disease in years (≤1, >1≤5, >5≤10, >10) and stage of disease (stage I and II versus III and IV). For the vHIT, an abnormal vestibulo-ocular reflex was defined as a gain cut-off value of≤0.8 and presence of correction saccades including subanalyses using a cut-off value of≤0.9.
RESULTS:
In 89 definite MD patients (42 (47%) male, mean age 55±5 (SD)), data on both the caloric test and the vHIT were available. The risk of an abnormal vHIT was 25% in patients with a duration of disease over 10 years compared to 22% in the patients with a disease duration of 10 years or less (risk difference 3%, 95% CI:– 28% to 35%), p = 0.82). The risk for an abnormal vHIT in the Stage I and Stage II was 17% compared to 26% in Stage III and IV (risk difference 9%, 95% CI:– 30% to 11%). When using a cut-off value of 0.9 we also did not demonstrate a relationship between the duration of disease and the proportion of abnormal vHIT test results.
CONCLUSIONS:
There is no relationship between the proportion of abnormal vHIT test results in patients with MD in either duration or stage of disease.
1.Introduction
Menière’s disease (MD) lacks a diagnostic reference standard to objectify the diagnosis. The diagnosis of MD is based upon its clinical characteristics accompanied by documented hearing loss [7] rather than the use of vestibular tests. Although the caloric test may be considered as the reference standard for assessing vestibular function, great variability in the results is found in MD, making the test unsuitable to serve as a reference standard [1, 2, 28].
In the pursuit of objectifying MD, scientific studies combined results of vestibular tests such as the caloric test and the recently developed video-head impulse test (vHIT) [3, 20].
Although both the caloric test and the vHIT measure vestibular function, they capture distinct phenomena [24, 25]. While the caloric test uses a non-physiological low-frequency stimulus, the vHIT measures head and eye movements during physiological high-velocity rotatory head thrusts [14, 19, 23].
Based on previous research in patients with MD we know that caloric test responses decrease most profoundly in the first decade after which responses stabilize at a fixed level of hypofunction of approximately 50% [8, 9,15]. Similarly to that of caloric testing, one would expect that abnormal VHIT results are more common in MD in the chronic stage. Maire and van Melle [21] found that in the chronic phase of the disease (>12 months), the VOR gain decreased, resulting in an abnormal vHIT result. One may argue whether the chronic stage begins after one year of vertigo symptoms since the total duration of disease is estimated to last 20 years [27]. On the other hand, Cerchiai et al. [5] found that the proportion of abnormal vHIT results was similar in patients with ‘early’ MD (5 years or less) compared to those with ‘late’ MD (more than 5 years).
Based on the disagreement between pervious study results, we aim to evaluate whether the vHIT is more often abnormal in patient with a later stage of disease than in those with an early stage, related to either duration of vertigo attacks in years or level of hearing loss. In case progression of disease is consistently related to an increase of abnormal vHIT results, this may serve as a diagnostic hallmark in the course of the disease.
2.Materials and methods
In this study, we retrospectively evaluated patients diagnosed with MD who visited a tertiary dizziness clinic from 2012 to 2015 (n = 343). Patients were included if they met the criteria for ‘definite’ MD as defined by the AAO-HNS in 1995 [7] (n = 250). No patients with ‘certain’ MD were included as we did not seek histopathological confirmation in patients with ‘definite’ MD. A single attack of vertigo accompanied by unilateral hearing loss was regarded to be clinically more compatible with (viral) labyrinthitis, therefore patients matching the criteria of ‘probable’ MD were not included in this analysis either. We excluded ‘possible’ MD as it represents a less well defined clinical entity and this population may contain vertigo related diseases as well (e.g. vestibular migraine) [18]. We categorized patients according to the duration of disease based on the duration of symptoms in years. In addition, the stage of the disease was based on the four tone average of the pure-tone thresholds at the frequency of 0.5, 1, 2 and 3 kHz of the worst audiogram in accordance with the AAO-HNS 1995 guideline [7]. Stage I was defined as a four tone average (rounded to the nearest whole number) of 25 decibel (dB) or less. Stage II represented an average hearing loss of 26 to 40 whereas patients with a Stage III suffer from an average hearing loss between 41 to 70 dB. Stage IV included patients with an average hearing loss of more than 70 dB. All data were analyzed anonymously and procedures were performed in accordance with the ethical standards of the institutional research committee and the 1964 Helsinki declaration and its later amendments.
2.1.vHIT testing
The vHIT was measured by means of a commercially available mono-ocular video oculography system (ICS Impulse System, version 1.20, OTOsuite Vestibular software; Otometrics, Taastrup, Denmark). The system consists of light-weight goggles with an integrated video oculography camera with sensors. An elastic band ensures fixation and minimises motion of the goggles. In a well-lit room, subjects were instructed to maintain fixation at a dot from 1 m distance. An experienced laboratory technician delivered at least 20 head impulses per side (10–20° angle, duration 150–200 ms, peak velocity of >150°/s) in the horizontal plane with unpredictable timing and direction [30]. The VOR gain was defined as the ratio of the eye velocity (°/s) over the head velocity (°/s). The presence of refixation (catch-up) saccades, either overt or covert, was evaluated by the laboratory technician. In line with previous literature, vHIT testing was considered to be abnormal if VOR gain was <0.8 in the presence of refixation saccades [3]. The standard ICS Impulse system was used to calculate gain values, which computed the area gain over the whole interval. In other words, gain values were calculated on the area of the head and eye velocity sample resulting from the head impulse, which was then divided to produce the gain value (position gain). This in contrast to systems in which the gain is based on a fixed interval length in milliseconds in which at a local point the gain is calculated (velocity gain). Based on previous research, higher gain values where found in the ICS Impulse system, as a result of which it is suggested to use a higher cut-off point. Therefore, an additional analysis was performed using a cut-off value of 0.9 [6, 11].
2.2.Caloric testing
Bithermal caloric testing was performed using an open loop water irrigation system. Similar to the vHIT methods, details have been described earlier [30]. Asymmetry of the vestibular function, expressed as the vestibular preponderance (VP) and the directional preponderance (DP), was calculated by means of the Jongkees’ formula [13]. Based on the values used in previous research [4, 26] and on our own experience, caloric tests were considered abnormal if the vestibular preponderance was 22% or more or the directional preponderance was 28% or more. Caloric testing was also considered abnormal if the irrigation response had a Vmax below 15°/s (bilateral vestibular hypofunction) per vestibular organ for both ears.
2.3.Statistical analysis
The Statistical Package for the Social Sciences (SPSS) (Version 18) was utilized for statistical evaluation in this study. We calculated frequencies for sex and type of MD, uni-or bilateral involvement, vestibular hypofunction and the duration and stage of the disease in our population. Means and standard deviation were calculated for age and the vHIT gain for both the left and right vestibular system. Moreover, we compared the vHIT gain per ear for the side of the reduced caloric response versus the side of the normal caloric response. Differences between acute versus chronic and stage I and II versus III and IV with respect to normal and abnormal vHIT result were assessed by means of cross-tabulation and analyzed using the Chi-square test. A p-value of less than 0.05 was considered significant.
3.Results
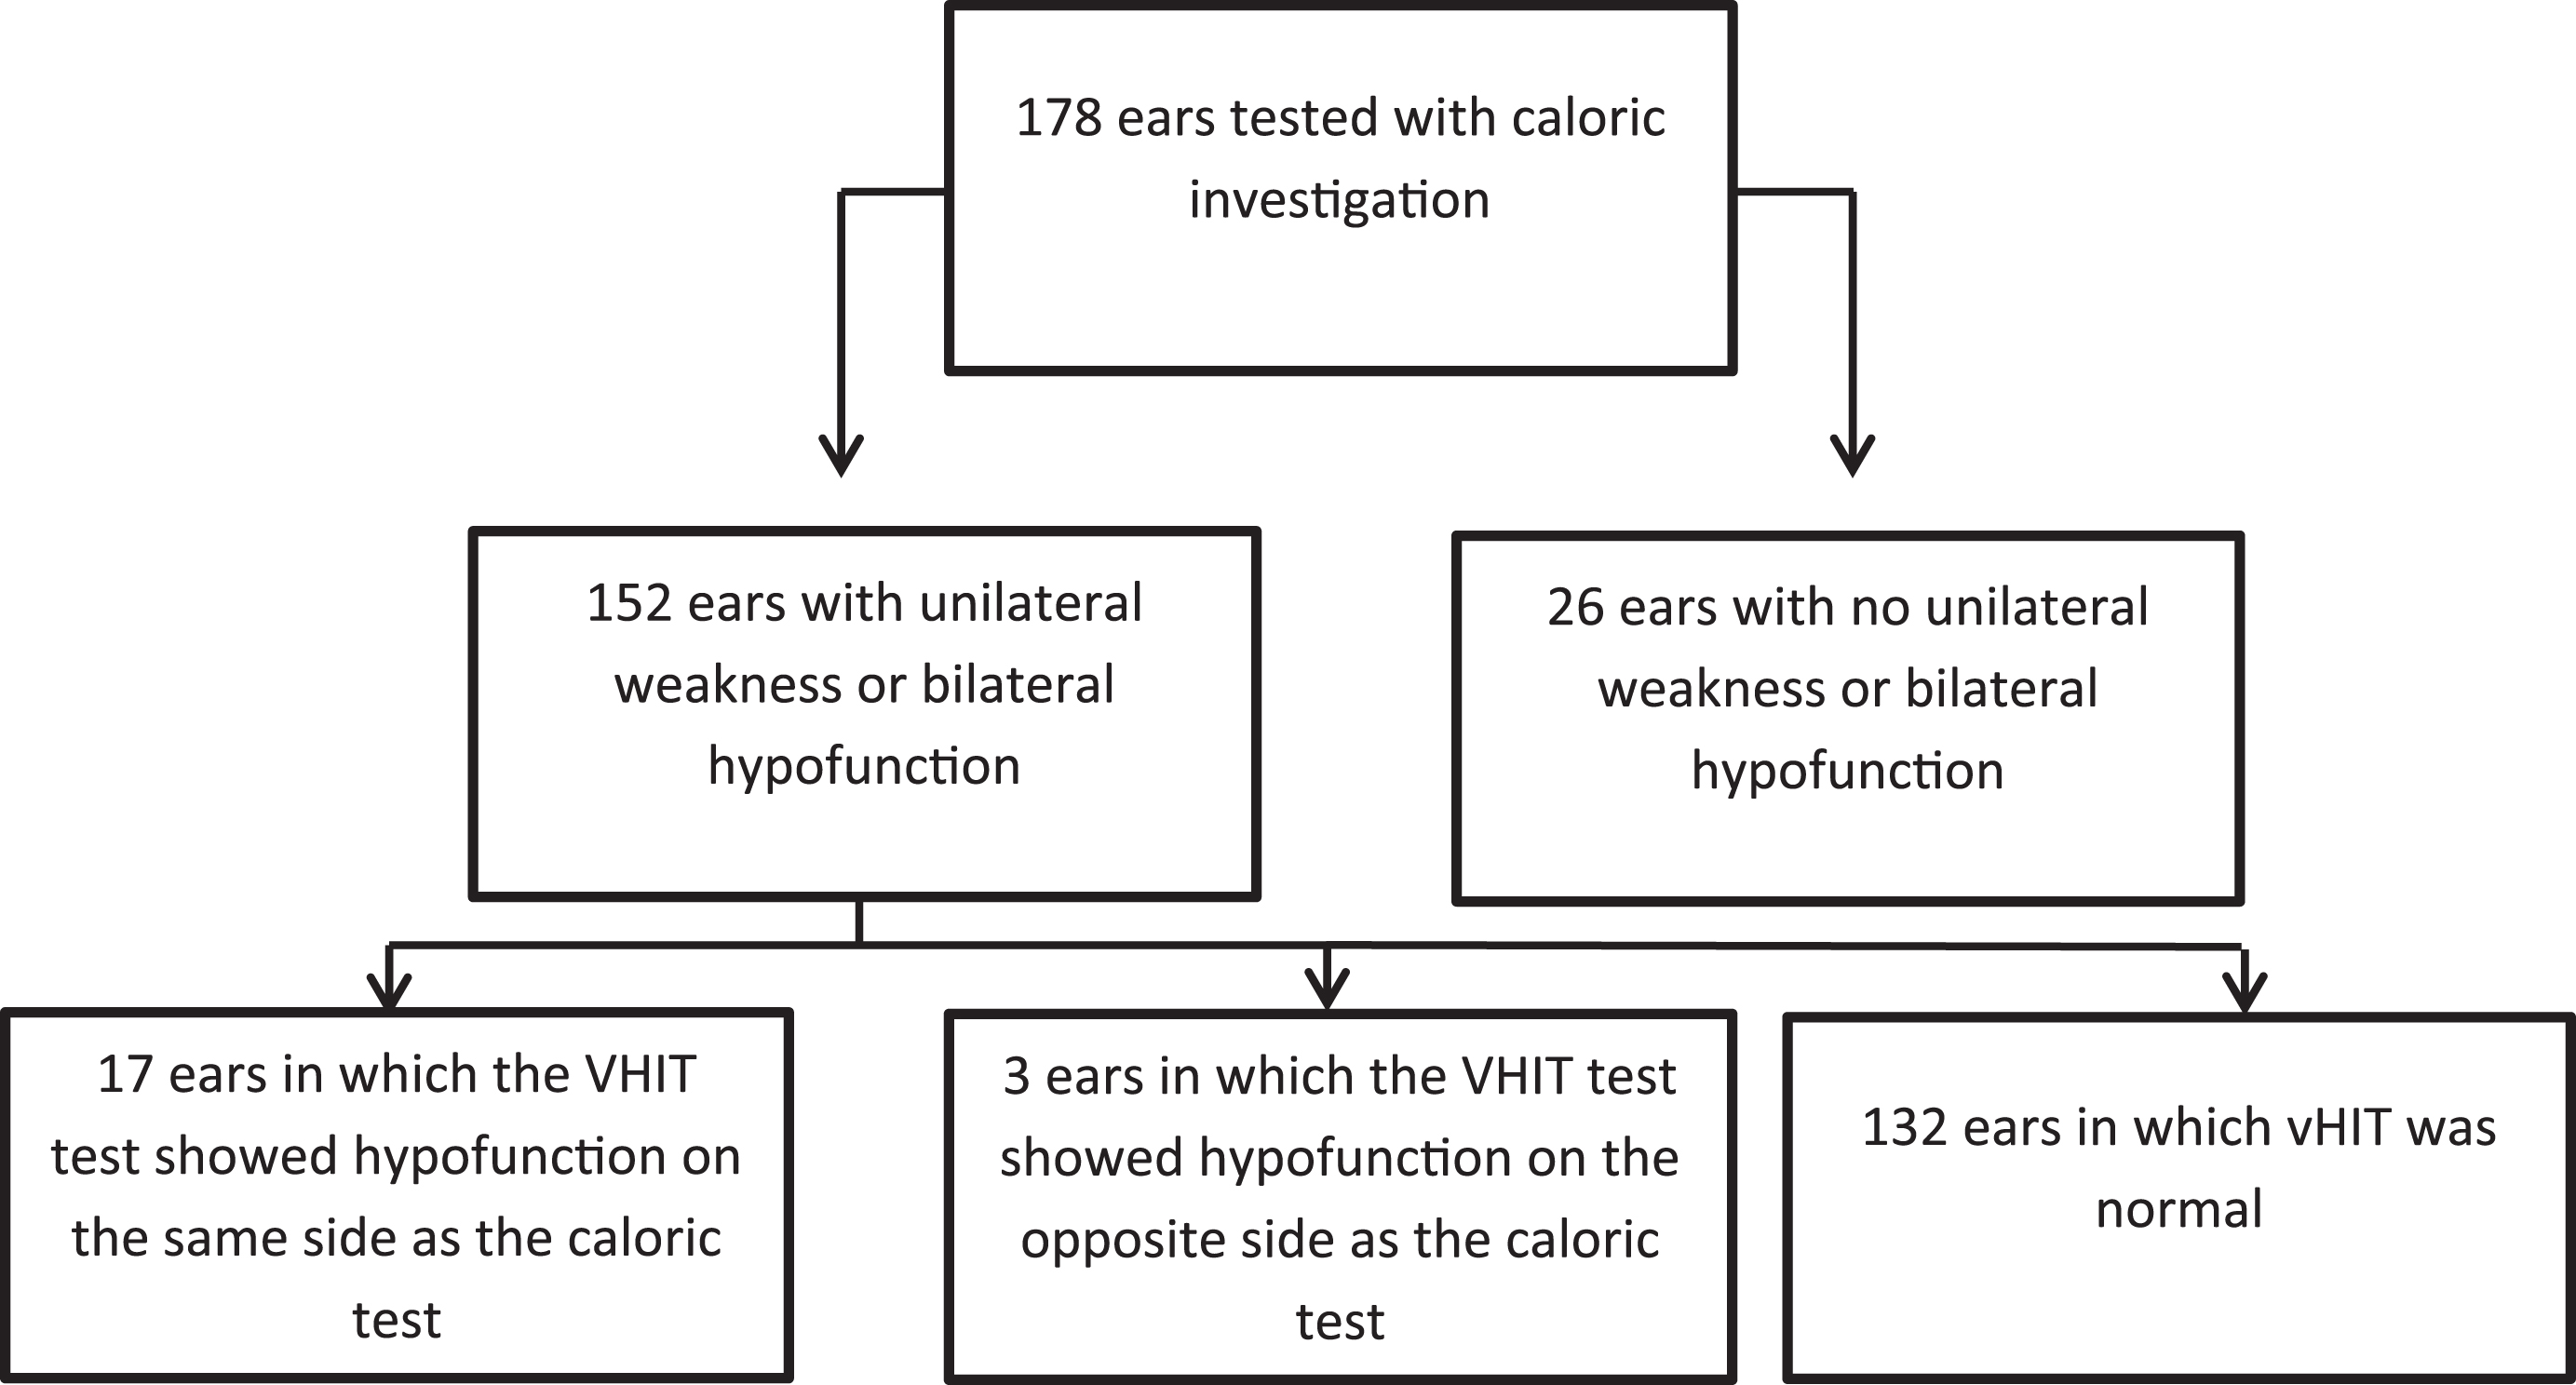
Within the MD population, data with regards to the vHIT and the caloric test was available in 89 (36%) patients. Patients had a mean age of 55±5 years and 42 (47%) were male. We found that 84 (94%) suffered from symptoms of unilateral MD and 5 (6%) had symptoms of bilateral MD. The mean duration of disease was 5±6.2 years. The mean vHIT gain on the left side was 0.91±0.14 and 0.99±0.2 on the right side. Based on the level of hearing loss, 3 (3%) patients met the criteria for Stage I. Fifteen (17%) patients could be classified as stage II, whereas Stage III and Stage IV comprised 56 (63%) and 13 (15%) of the patients respectively. In two patients no information on the amount of hearing loss was available. Table 1 shows the percentage of abnormal caloric tests and VHIT test results related to stage of disease. A progressive increase in the number of patients with an abnormal caloric test was seen when results were related to stage of the disease. Results of the per ear analyses are shown in Fig. 1. In 85% of the ears an unilateral vestibular hypofunction or bilateral hypofunction was identified by the caloric test. We found that in 10% of the ears, both the vHIT test and the caloric test identified an ipsilesional vestibular hypofunction.
Table 1
Results in MD patients who underwent both the caloric and vHIT test (n = 89) with a cut-off value of 0.8 related to stage of disease
| Percentage (number/total) | ||||
| Stage I | Stage II | Stage III | Stage IV | |
| Abnormal caloric test results | 33 (1/3) | 47 (7/15) | 79 (44/56) | 92 (12/13) |
| Abnormal vHIT results | 0 (0/3) | 20 (3/15) | 23 (13/56) | 38 (5/13) |
Fig.1
Results per ear regarding ipsilesional and contralesion vHIT test results based on a unilateral caloric weakness or bilateral hypofunction.
3.1.vHIT test results related to the duration and stage of disease
Table 2a illustrates the proportion of abnormal vHIT test results in MD related to the duration of disease in years (less than 1 year, from 1 year to 5 years, less than 5 years, from 5 years to 10 years, more than 10 years) and stage of disease (stage I to IV). The absolute risk for an abnormal vHIT was 22% in the group with a disease duration of less than one year compared to 22% in the group with a disease duration over one year (risk difference 0.4%, 95% CI:– 19% to 20%), p = 0.96). The absolute risk for an abnormal vHIT was 22% for patients with a duration of disease of >1 year to 5 years and >5 years to 10 years. This risk was comparable (21–23%) to patients with a disease duration in the remaining time interval. The absolute risk was 25% in patients with a duration of disease over 10 years compared to 22% in the patients with a disease duration of 10 years or less (risk difference 3%, 95% CI:– 28% to 35%), p = 0.82).
Table 2a
| Abnormal vHIT n (%) | Total | |
| ≤1 year | 6 (22) | 27 |
| >1≤5 years | 5 (21) | 24 |
| >5≤10 years | 5 (22) | 23 |
| >10 years | 2 (25) | 8 |
| Stage I | 0 (0) | 3 |
| Stage II | 3 (20) | 15 |
| Stage III | 13 (23) | 56 |
| Stage IV | 5 (38) | 13 |
No significant difference in the proportion of patients with an abnormal vHIT was found when MD patients with a duration of disease of≤1 year were compared to MD patients with a duration of disease of >1 years (chi-square p = 0.9). This was similar after comparing patients with disease duration of≤10 years to patients with a disease duration >10 years (chi-square p = 0.8). No significant difference on the proportion of patients with an abnormal vHIT was found when MD patients with a Stage I or II were compared to patients with a Stage III or IV (chi-square Stage I,II versus Stage III/IV p = 0.41).
The absolute risk for an abnormal vHIT in the Stage I and Stage II was 17% compared to 26% in Stage III and IV (risk difference 9%, 95% CI:– 30% to 11%), p = 0.41). The absolute risk for an abnormal vHIT was 0% for Stage I compared to Stage III and IV 6% (risk difference 6%, 95% CI: – 12% to 1%, Fischer Exact test p = 0.8). Based on the per ear analyses of the proportion of abnormal vHIT test results we did not find significant differences between groups based on the duration of disease.
3.2.vHIT test results related to the duration and stage of disease using a cut-off value of 0.9
Similar to the previous analyses, the proportion of abnormal vHIT test results were calculated based on the duration and stage of the disease as shown in Table 2b. The absolute risk for an abnormal vHIT was 63% in the group with a disease duration of less than one year compared to 56% in the group with a disease duration over one year (risk difference 7%, 95% CI:– 16% to 29%), p = 0.29). Absolute risks for an abnormal vHIT for patients with a duration of disease of >1 year to 5 years and >5 years to years were 67% and 48 % respectively. Risks in patients in the remaining time intervals were 55% and 62% resulting in risk differences of 11% (95% CI:– 11.3% – 34.3%, p = 0.17) and – 15% (95% CI:– 39% – 9%, p = 0.1). The absolute risk was 50% in patients with a duration of disease over 10 years compared to 60% in the patients with a disease duration of 10 years or less (risk difference – 9.5%, 95% CI:– 46% to 27%), p = 0.3). The absolute risk for an abnormal vHIT in the Stage I and Stage II was 67% compared to 55% in Stage III and IV (risk difference 12%, 95% CI:– 13% to 36%), Fischer Exact test p = 0.27). The absolute risk for an abnormal vHIT was 33% for Stage I compared to Stage III and IV 58% (risk difference – 25%, 95% CI: – 79% to 29%, Fischer Exact test p = 0.39).
Table 2b
Results of the vHIT related to the duration and stage of disease using a cut-off value of 0.9
| Abnormal vHIT n (%) | Total n | |
| ≤1 year | 17 (63) | 27 |
| >1≤5 years | 16 (67) | 24 |
| >5≤10 years | 11 (48) | 23 |
| >10 years | 4 (50) | 8 |
| Stage I | 1 (33) | 3 |
| Stage II | 11 (73) | 15 |
| Stage III | 29 (52) | 56 |
| Stage IV | 9 (69) | 13 |
No significant difference in the proportion of patients with an abnormal vHIT was found when MD patients with a duration of disease of ≤1 year were compared to MD patients with a duration of disease of >1 years (chi-square p = 0.3). This was similar after comparing patients with disease duration of ≤10 years to patients with a disease duration >10 years (chi-square p = 0.3). No significant difference on the proportion of patients with an abnormal vHIT was found when MD patients with a Stage I or II were compared to patients with a Stage III or IV (chi-square Stage I,II versus Stage III/IV p = 0.38).
4.Discussion
Previous research has shown that caloric test responses in patients with MD tend to decrease in the first decade of disease [8, 9, 23]. Similar to that of the caloric test, one would expect abnormal vHIT results to be more common in MD patients who are in a later stage of the disease. We evaluated whether vHIT abnormality is more common in patients who are in a later stage of the disease as opposed to those in an earlier stage.
The vHIT was related to the duration of symptoms in years and the stage of disease. No changes in the proportion of abnormal vHIT results were found when related to progression of disease.
A recent retrospective chart review by Cerchiai et al. [27], evaluated vHIT findings of ‘definite’ MD patients who were treated with either intratympanic gentamicin or conservatively (dietary modifications combined with acetazolamide, hydrochlorothiazide or betahistine) and related results to duration of disease. In line with our study findings, no relation was found between the VOR gain results and the duration of disease.
Zulueta-Santos et al. [31] evaluated the distribution of normal and abnormal vHIT results in all planes (i.e. evaluation of horizontal, superior and posterior canals) in 36 patients with definite unilateral MD. A rather diverse set of results was found for the affected and unaffected ear. They did not find a relation between the degree of canal function loss expressed by the vHIT and the duration of disease or hearing loss.
However, Maire et al. [15] concluded that the stage of the disease could affect the vHIT test result. They stated that in early Menière’s disease, the VOR gain is higher towards the affected side as opposed to the intact side, while the opposite is seen in patients in a later stage of the disease. Funabiki et al. [10] used the direction of nystagmus attempting to explain this dynamic change in the peripheral vestibular system. They stated that VOR gain was higher towards the affected side when an ipsilateral nystagmus was present and decreased when there was a contralateral nystagmus. Subsequently, Hozawa et al. [12] found that just prior to vertiginous periods the VOR gain was higher in the direction of the ear with MD versus the contralateral unaffected ear.
The dissociation between the vHIT and the caloric test may be explained by damage primarily to the low-frequency spectrum in the vestibular apparatus in Meniere’s disease. The caloric response represents a low frequency (0.002–0.004 Hz) rotation, whereas the vHIT response involves a more physiological, high frequency rotation, representing a frequency up to 5 Hz [14, 19].
Moreover, various studies on the vHIT have used different techniques to calculate the gain. One common method is the local sample point to point gain in which the velocity gain is calculated from a fixed interval length 60 milliseconds after the head impulses is started [3]. In our study the gain was calculated from the area of the head and eye velocity over the responses after which it was divided to yield the gain. Based on previous research on this matter, standard higher gains were found using this method from which it was recommended to use higher cut-off values [6, 30].
With respect to caloric test responses and vestibular hypofunction, previous studies showed variability in cut-off values. A recent consensus document published by Strupp et al. [29] used Vmax cut-off values of less than 6 degrees per second to define vestibular hypofunction whereas a cut-off value of 35 degrees per second is used by the University Medical Centre in Maastricht. We used a relatively low cut-off value of 15 degrees per second to identify patients with a vestibular hypofunction, when comparing it to the cut-off values defined by the University Medical Centre Maastricht. A lower cut-off value results in a larger group of patients with a false positive result. In clinical practice we prefer to include patients with false positive results to minimize the proportion of false negative results, as a smaller group of patients will be deprived of further diagnostic evaluation [22].
It is proposed that different nerve fibers in the crista ampullaris are stimulated depending on the velocity of the head-movement [22]. Caloric testing would stimulate the regular afferent from the peripheral zones whereas high-velocity head movements during the vHIT are believed to stimulate irregular centrally located afferents [19]. Based on histopathological research it is suggested that MD mainly affects the peripheral zones and therefore leads to abnormality of the caloric test [25]. As the disease progresses, central damage to the crista will then cause abnormality of the VOR responses. Although the theory seems plausible, our study demonstrated various responses of normal and abnormal vHIT results in patients with both recent onset of symptoms and those with progressed disease.
To date, this is the largest study analyzing vHIT characteristics in patients with MD. Moreover, this is the first study quantifying normal and abnormal vHIT test results related to the duration and the stage of disease. Another strength of this study was the use of AAO-HNS 1995 guidelines by which our MD population was defined and staged in a standardized way.
However, there are some limitations which need to be considered when interpreting our study findings.
First, analysis could only be performed in 89 out of 250 patients (36%) due to the absence of information on both the caloric test results and the vHIT results for the remainder of the population. Therefore, selection bias may have influenced the results.
Mainly, the reduction of the sample size is based on a practical limitation. While two caloric systems were available for caloric testing, only one test system was accessible at the department for the vHIT. The reduced number in vHIT results can be considered as random missing information as no pre-selection criteria on patients were applied before performing the diagnostic tests. Therefore, it is unlikely that the results of our study are clinically not applicable.
Secondly, both tests have been evaluated in a retrospective way, between vertigo spells and without serial evaluation. A recent retrospective case series by Lee et al. [17] analyzed results of both tests during vertigo attacks in patients with MD at various stages of the disease. They concluded that vHIT results tend to fluctuate when tested during the irritative (vertigo) phase compared to the paretic phase. To fortify information on the canal function based on vHIT test results in MD, serial evaluation of individuals may provide relevant information with respect to changes of results over time.
Thirdly, only vHIT results for the horizontal canal were analyzed whereas the vertical and lateral semicircular canals may also be of importance as the whole membranous labyrinth is believed to be affected in MD. It is possible that vertical and lateral semicircular canals are differently affected by the disease and may be able to show a consistent change in vHIT results when related to disease progression.
Lastly, eight patients were treated with intratympanic injections whereas the remaining received conservative treatment (medication, Prisma® glasses). Due to the vestibulotoxic effect of gentamicin, abnormality of the vHIT is expected in all these patients. In six of these patients, information on the age of onset was available. Subanalysis revealed that these patients had varying disease duration and both normal and abnormal vHIT results were found. However, the small sample size of patients analyzed in the intratympanic group should be taken into account when interpreting these findings.
We retrospectively analyzed vHIT test results related to the stage and duration of disease, and found no relation between the two. Future, prospective, serial evaluation of individuals analyzing all semicircular canals may be able to provide information on consistent changes of the vHIT and may serve as an objective finding in the diagnostic process in MD.
Funding
This work was supported solely from institutional and/or departmental sources from the Apeldoorn Dizziness Centre, Gelre Hospital, Albert Schweitzerlaan 31, 7334 DZ Apeldoorn, The Netherlands.
Compliance with ethical standards
Disclosure of potential conflicts of interest
All authors declare that they have no conflict of interest to disclose.
Ethical approval
All procedures performed in studies involving human participants were in accordance with the ethical standards of the institutional and/or national research committee and with the 1964 Helsinki declaration and its later amendments or comparable ethical standards.
Acknowledgments
We would like to thank the laboratory technicians for their technical assistance and Carla Colijn for her support in the development of the dataset.
References
1. | R.W. Baloh , V. Honrubia , R.D. Yee and K. Hess , Changes in the human vestibulo-ocular reflex after loss of peripheral sensitivity, Ann Neurol 16: ((1984) ),222–228. |
2. | F.O. Black and R. Kitch , A review of vestibular test results in Ménière’s disease, Acta Otolaryngol (Stockh) 485: ((1991) ),108–109. |
3. | A. Blodow , S. Pannasch and L. Walther , Detection of isolated covert saccades with the video head impulse test in peripheral vestibular disorders, Auris Nasus Larynx 40: ((2013) ),348–351. |
4. | J.P. Carey , L.B. Minor , G.C. Peng , C.C. Della Santina , P.D. Cremer and T. Halswanter , Changes in three-dimensional angular vestibulo-ocular reflex following intratympanic gentamicin for Ménière’s disease, J Assoc Res Otolaryngol 3: ((2002) ),430–443. |
5. | N. Cerchiai , E. Navari , I. Dallan , S. Sellari-Franceschini and A.P. Casani , Assessment of Vestibulo-oculomotor reflex in Méniére’s disease: Defining an instrumental profile, Otol & Neurotology 37: ((2016) ),380–384. |
6. | T.W. Cleworth , M.G. Carpenter , F. Honegger and J.H.J. Allum , Differences in head impulse test results due to analysis techniques, J Vest Research 27: ((2017) ), 163–172 .L.R. |
7. | Committee on Hearing and Equilibrium, Guidelines for the diagnosis and evaluation of therapy in Ménière’s disease, Otolaryngology Head Neck Surgery 113: ((1995) ),181–185. |
8. | U. Friberg and J. Stahle , The epidemiology of Ménière’s disease. In: Harris JP (ed) Ménière’s disease, Kugler Publications, The Hague, The Netherlands. ((1999) ), pp. 17–28. |
9. | U. Friberg , J. Stahle and A. Svedberg , The natural course of Ménière’s disease, Acta Otolaryngol (Stockh) Suppl 406: ((1984) ),75–77. |
10. | K. Funabiki , Y. Naito and I. Honjo , Vestibulo-Ocular reflex in patients with Ménière’s disease between attacks, Acta Otolaryngol (Stockh) 119: ((1999) ),886–891. |
11. | G.M. Halmagyi , L. Chen , H.G. MacDougall , K.P. Weber , L.A. McGarvie and I.S. Curthoys , The video head impulse test, Frontiers in Neurology 8: ((2017) ) 10.3389/fneru.2017.00258.H.J |
12. | J. Hozawa , I. Mori and K. Fukuoka , Experimental and clinical studies of the behaviour of nystagmus reflecting vestibular pathology in Ménière’s disease. Nadol JB ed. Second International Symposium on Ménière’s disease. Amsterdam: Kugler & Ghedini Publications, ((1989) ), 299–303. |
13. | L.B.W. Jongkees , J.P.M. Maas and A.J. Philipszoon , Clinical nystagmography, Pract Otolaryngol 24: ((1962) ),65–93. |
14. | M. Jorn-Hderli , D. Straumann and A. Palla , Accurary of the bedside head impulse test in detecting vestibular hypofunc-tion, J Neurol Neurosurg Psychiatry 78: ((2007) ) 1113–1118. |
15. | A. Katsarkas , Hearing loss and vestibular dysfunction in Ménière’s disease, Acta Otolaryngol (Stockh) 116: ((1996) ),185–188. |
16. | R.G. Knapp and M.C. Miller , In Clinical Epidemiology and Statistics, Lippinocott Williams and Wilkins Publication, Philadelphia, United Stated. ((1995) ), pp. 53. |
17. | S.U. Lee , H.J. Kim , J.W. Koo and J.S Kim , Comparison of caloric and head-impulse tests during the attacks of Menière’s disease, The Laryngoscope 3: ((2016) ),702–708. |
18. | J.A. Lopez-Escamez , J. Dlugaiczyk , J. Jacobs , T. Lempert , R. Teggi and M. von Brevern , Accompanying symptoms overlap during attacks in Menière’s disease and vestibular migraine, Front Neurol 5: ((2014) ), 265. |
19. | H.G. MacDougall , K.P. Weber and L.A. McGarvie , The video head impulse test: Diagnostic accuracy in peripheral vestibulopathy, Neurology 73: ((2009) ),1134–1141. |
20. | M. Magnusson , K. Karlberg , M. Halmagyi and A. Hafstrom , The video-impulse test enhances the possibility of detecting vestibular lesions, J Vestib Res 11: ((2002) ), 231. |
21. | R. Maire and G. van Melle , Vestibulo-ocular reflex characteristics in patients with unilateral Mèniére’s disease, Otology & Neurology 29: ((2008) ),693–698. |
22. | A.A. McCall , G.P. Ishiyama , I.A. Lopez , S. Bhuta , S. Vetter and A. Ishiyama , Histopathological and ultrastructural analysis of vestibular endorgans in Ménière’s disease reveals basement membrane pathology, BMC Ear Note Throat Dis-ord 9: ((2009) ), 4. |
23. | D.L. McCaslin and G.P. Jacobson , Current role of the videonystagmography examination in the context of the multi-dimensional balance function test batter, Seminars in Hearing 30: ((2009) ),242–253. |
24. | L. McGarvie , I.A. Curthoys , H. MacDougall and G. Halmagyi , What does the head impulse test versus caloric dissociation reveal about vestibular dysfunction in Mèniére’s disease, Ann N Y Acad Sci 1343: ((2015) ),1–5. |
25. | H.J. Park , A.A. Migliaccio , C.C. Della Santina , L.B. Minor and J.P. Carey , Search-coil head-thrust and caloric tests in Mèniére’s disease, Acta Otolaryngol 125: ((2005) ),852–885. |
26. | N. Perez and J. Rama-Lopez , Head impulse and caloric test in patients with dizziness, Otol Neurotol 24: ((2003) ),913–917. |
27. | H. Perez-Garrigues , J.A. Lopez-Escamez , P. Perez , R. Sanz , M. Orts , J. Marco , R. Barona , M.C. Tapia , I. Aran , C. Cenjor , N. Perez , C. Morera and R. Ramirez , Time course of episodes of definite vertigo in Ménière’s disease, Arch Otolaryngol Head Neck Surg 134: ((2008) ),1149–1153. |
28. | Proctor, Results of serial vestibular testing in unilateral Ménière’s disease, Am J Otol 21: ((2000) ),552–558. |
29. | M. Strupp , J.S. Kim , T. Murofushi , D. Straumann , J.C. Jen , S.M. Rosengren , C.C. Della Santina and H. Kingma , Bilateral vestibulopathy: Diagnostic criteria consensus document of the classification committee of the Barâny Society, J Vestib Res 27: ((2017) ),177–189. |
30. | B.F. van Esch , P.P. van Benthem , H.J. van der Zaag-Loonen and Tj. D. Bruintjes , Determining vestibular hypofunction: Start with the vHIT test, Eur Arch Otorhinolaryngol 273: ((2016) ),3733–3739. |
31. | C. Zulueta-Santos , B. Lujan , R. Manrique-Huarte and N. Perez-Fernandez , The vestibulo-ocular reflex assessment in patients with Ménière’s disease: Examining all semicircular canals, Acta Oto-Laryngologica 134: ((2014) ),1128–1133. |


